the Creative Commons Attribution 4.0 License.
the Creative Commons Attribution 4.0 License.
 | 06 Dec 2022
Explaining changes in rainfall–runoff relationships during and after Australia's Millennium Drought: a community perspective
Murray Peel
Margarita Saft
Tim J. Peterson
Andrew Western
Lawrence Band
Cuan Petheram
Sandra Dharmadi
Kim Seong Tan
Lu Zhang
Patrick Lane
Anthony Kiem
Lucy Marshall
Anne Griebel
Belinda E. Medlyn
Dongryeol Ryu
Giancarlo Bonotto
Conrad Wasko
Anna Ukkola
Clare Stephens
Andrew Frost
Hansini Gardiya Weligamage
Patricia Saco
Hongxing Zheng
Francis Chiew
Edoardo Daly
Glen Walker
R. Willem Vervoort
Justin Hughes
Luca Trotter
Brad Neal
Ian Cartwright
Rory Nathan
The Millennium Drought lasted more than a decade and is notable for causing persistent shifts in the relationship between rainfall and runoff in many southeastern Australian catchments. Research to date has successfully characterised where and when shifts occurred and explored relationships with potential drivers, but a convincing physical explanation for observed changes in catchment behaviour is still lacking. Originating from a large multi-disciplinary workshop, this paper presents and evaluates a range of hypothesised process explanations of flow response to the Millennium Drought. The hypotheses consider climatic forcing, vegetation, soil moisture dynamics, groundwater, and anthropogenic influence. The hypotheses are assessed against evidence both temporally (e.g. why was the Millennium Drought different to previous droughts?) and spatially (e.g. why did rainfall–runoff relationships shift in some catchments but not in others?). Thus, the strength of this work is a large-scale assessment of hydrologic changes and potential drivers. Of 24 hypotheses, 3 are considered plausible, 10 are considered inconsistent with evidence, and 11 are in a category in between, whereby they are plausible yet with reservations (e.g. applicable in some catchments but not others). The results point to the unprecedented length of the drought as the primary climatic driver, paired with interrelated groundwater processes, including declines in groundwater storage, altered recharge associated with vadose zone expansion, and reduced connection between subsurface and surface water processes. Other causes include increased evaporative demand and harvesting of runoff by small private dams. Finally, we discuss the need for long-term field monitoring, particularly targeting internal catchment processes and subsurface dynamics. We recommend continued investment in the understanding of hydrological shifts, particularly given their relevance to water planning under climate variability and change.
- Article
(18924 KB) - Full-text XML
- BibTeX
- EndNote


1.1 Importance of understanding hydrological response to multi-year drought
Change and variability are ubiquitous in environmental and human systems (e.g. Milly et al., 2008; Wagener et al., 2010; Montanari et al., 2013). In recent times, much effort has been spent on understanding and modelling dynamic behaviour, notably under the change in hydrology and society decade of the International Association of Hydrological Sciences for 2013–2022 (Montanari et al., 2013). While many short-term hydrological phenomena (e.g. flooding and seasonal transitions) are relatively well studied, long-term (multi-year) hydrological dynamics have been receiving increased attention over the last decade or so (e.g. Jaramillo and Destouni, 2014; Van der Velde et al., 2014). This paper is concerned with hydrological response to multi-annual droughts, a topic recently explored on multiple continents, including North America, South America, Europe, Asia, and Australia (e.g. Avanzi et al., 2020; Fowler et al., 2020a; Peterson et al., 2021; Alvarez-Garreton et al., 2021; Roodari et al., 2021; Massari et al., 2022).
With climate change, many parts of the world will experience long-term drying with more frequent and severe droughts (e.g. Cook et al., 2018). Therefore, it is particularly important to study historic multi-year droughts as the best available analogue for such conditions. However, few informative examples of multi-year drought are available because of short streamflow records which do not include historic droughts (e.g. Verdon-Kidd and Kiem, 2009) and often are affected by lengthy gaps in monitoring data. Lack of concurrent observations of different components of the catchment water balance (e.g. shallow and deep groundwater heads, soil moisture, and actual evapotranspiration) also limits our ability to explore and test alternative explanations for observed behaviour. Likewise, these issues impede studies on drought recovery (e.g. Peterson et al., 2021) and limits distinguishing long-term changes from shorter-term variability, particularly in highly variable climates (Morin, 2011).
For hydrologic modellers, it is difficult to be confident that modelling techniques are robust without past examples of sustained changes in climate to test them on. There are many aspects of catchment behaviour that are not explicitly simulated but which may prove salient to determine the hydrologic response, such as transient ecosystem dynamics related to water stress and regrowth, in addition to anthropogenic factors (e.g. Van Loon et al., 2016; Speich et al., 2020; Stephens et al., 2021; Bouaziz et al., 2022). Non-linear behaviour and/or tipping points may be part of the response of a system to climate change (Rodriguez-Iturbe et al., 1999; Peterson et al., 2009, 2021; Tauro, 2021). In acknowledging these issues, the ability for models to extrapolate to changing conditions was recognised as one of 23 key challenges (unsolved problems) in hydrology by Blöschl et al. (2019). Even models successfully tested against past hydroclimate data may still be unable to extrapolate predictions under enhanced atmospheric CO2 concentrations, higher temperatures, and potentially more frequent, severe, and longer dry spells (Saft et al., 2016a; Fowler et al., 2018; Stephens et al., 2020). Nonetheless, testing against a range of historic conditions remains an important first step towards robust modelling.
Thus, examples of multi-year drought are valuable to hydrology, and Australia's Millennium Drought is one such example (Van Dijk et al., 2013; Chiew et al., 2014). This paper focuses on the Millennium Drought as a case study, and it is hoped that lessons learnt from this example are transferable and useful for understanding long-term hydrologic change in other places around the world. As explained in Sect. 1.2, this drought was notable for causing persistent shifts in the relationship between rainfall and runoff in many catchments (Saft et al., 2015), and globally, other locations have since seen similar behaviour, such as the United States (California; Avanzi et al., 2020), Chile (Garreaud et al., 2017; Alvarez-Garreton et al., 2021), China (Tian et al., 2020), Europe (Massari et al., 2022), and central Asia (Roodari et al., 2021). Future research should examine the underlying causes for all such cases, seeking lessons that are transferable in time and space to other regions that are yet to experience such shifts. With many regions of the world likely to see long-term drying, more frequent droughts, and water scarcity (Schewe et al., 2014; Cook et al., 2018; Kirono et al., 2020), it is critical to understand the causes of apparent hydrological non-stationarity and, ideally, incorporate this into operational models used by water planners (Fowler et al., 2022).
1.2 The Millennium Drought
The Millennium Drought occurred in southeastern Australia, affecting an area of more than 500 000 km2. The drought commenced in the mid-to-late 1990s (1997 is taken as the start date for this paper) and is assumed to have ended with widespread flooding in 2010–2011 (starting in September 2010). It was primarily a rainfall deficit drought (Van Loon and Van Lanen, 2012), although it is noted that, in some places, average rainfall years occurred mid-way. Post-2011, climatic conditions have been similar to pre-drought averages in some places and below average in others (Argent, 2017; Pepler et al., 2021).
In many affected areas, the Millennium Drought was the longest drought on record (with records typically going back 100–150 years), and it caused significant social and economic impacts. The severe hydrological drought was estimated to have a return period exceeding 300 years (Potter et al., 2010; Freund et al., 2017). Water shortages induced low water use allocations for irrigators, water restrictions in urban areas, and significant investment in infrastructure such as desalination plants and pipelines (Van Dijk et al., 2013). The economic costs of the drought have been estimated to be as much as 1.6 % of Australia's gross domestic product (GDP; Horridge et al., 2005). Concern for environmental degradation led to significant water reforms, notably the Water Act (Connell and Grafton, 2011; Skinner and Langford, 2013), including a cap-and-trade-type system to restrict total water use in the Murray–Darling basin. This drought, and possibly projections of a drier future, accelerated major water reforms, such as the return of almost 20 % of irrigation water entitlements to the environment to be managed by new agencies called Environmental Water Holders (Skinner and Langford, 2013; Connell, 2011; Gawne et al., 2020).
Many catchments showed unexpected hydrological behaviour during the Millennium Drought, with streamflow being surprisingly low even when the low rainfall was taken into account. This behaviour, referred to as a shift (Saft et al., 2015), or a change in rainfall–runoff relationship (Petheram et al., 2011), occurred in some catchments but not others (see Sect. 2), and many streams also became more intermittent and/or less saline as part of the transition. Despite the end of the meteorological drought in 2010, many catchments have not recovered, meaning that they have not shifted back to pre-drought behaviour and appear to be persisting within a lower rainfall–runoff relationship (rather than simply being slow to recover; Peterson et al., 2021). In shifted catchments that have not recovered, an average rainfall year produces less streamflow today than it did pre-drought.
The physical mechanisms underlying these shifts are not well understood. As discussed in Sect. 2, research to date has successfully characterised where and when shifts occurred (Petheram et al., 2011; Saft et al., 2015; Peterson et al., 2021) and explored statistical relationships with potential drivers (Saft et al., 2016b; Peterson et al., 2021). However, the scientific and management communities still lack a convincing and widely accepted physical explanation for observed changes in catchment behaviour, which is the subject of this paper.
1.3 Context and aims of this article
This article arose out of a virtual workshop in late 2020, where a multi-disciplinary group of scientists gathered to discuss the hydrological consequences of the Millennium Drought. Integrating perspectives from hydrogeology, plant ecophysiology, remote sensing, hydroclimatology, experimental hydrology, and hydrological modelling, the workshop aimed to share and discuss hypotheses about catchment behaviour and associated flow response that could explain the Millennium Drought streamflow observations, considering both the spatial and temporal patterns of hydrological shifts.
Synthesising and building upon the discussions in the workshop, this article aims to achieve the following:
-
discuss relevant processes and how they could be responsible for observed shifts,
-
review available evidence and discuss the strengths and limitations of that evidence,
-
consider whether a single holistic perceptual model of catchment response can be formulated by integrating the process explanations which are consistent with evidence, and
-
recommend future research and/or monitoring activities which may confirm, distinguish between, and/or improve the process explanations.
Figure 1 shows the structure of the remainder of this article. Section 2 describes the hydrological shifts in greater detail, including a summary of key research to date. Section 3 considers a variety of processes relevant to streamflow generation, reviews the current state of knowledge in each case, and hypothesises process explanations based on this knowledge. Section 4 presents diagnostic evidence, tests the hypotheses against the evidence, and seeks to harmonise them into an integrated description of hydrologic response. Section 5 discusses future monitoring and research priorities required to further develop and/or distinguish between the plausible process explanations.

Underlying this structure is the implicit assumption that all considered processes and hypotheses are potentially relevant to the scientific community, even in cases which turn out to be inconsistent with empirical data. An alternative would be to only present the final set of process explanations along with associated evidence, but we feel this would remove much of the richness of the process of discovery and evaluation. Recent articles by Beven and Chappell (2021) and Wagener et al. (2021) affirm the value of documenting changes in the qualitative understanding of catchment behaviour and the perceptual (mental) models we use to describe catchments (see also McGlynn et al., 2002). Sharing perceptual information (and opening it to wider evaluation) is particularly important when pushing the limits of hydrological knowledge (Wagener et al., 2021) and working in multidisciplinary contexts (e.g. Staudinger et al., 2019). In any case, process explanations inconsistent with empirical data may correctly explain the hydrology of drought events in other locations or at other times. Thus, we feel there is value in providing a full account of the hypotheses considered.
The purpose of this section is to describe the current understanding of the Millennium-Drought-induced hydrological shifts. To provide a concise summary, we focus on two papers which most directly examine the issue (namely Saft et al., 2015, and Peterson et al., 2021), while acknowledging that other papers exploring related themes exist (e.g. Petheram et al., 2011; Westra et al., 2014; Saft et al., 2016a, b; Fowler et al., 2016, 2020a; Ajami et al., 2017; Deb et al., 2019), including elsewhere in Australia (Petrone et al., 2010; Hughes et al., 2012) and globally (see introduction). Both papers examine the rainfall–runoff relationships using the annual time step, which reduces the impact of seasonal storage differences and smooths out within-year extremes. For this section only, we focus on the annual time step as a way of introducing the shifts in rainfall–runoff relationships, including the temporal and spatial scale of the changes. However, as seasonal and event dynamics may be a crucial element of process explanations, they are considered at length in Sect. 3, and plots of the seasonal precipitation, streamflow, and runoff coefficient are provided in Appendix B.
The most important observation is that the hydrological response during the drought was out of proportion with the change in rainfall over the same period – in other words, the streamflow during the Millennium Drought was lower than expected, even after the lower rainfall is taken into account (Fig. 2a–b). For example, Saft et al. (2015) demonstrated shifts in the annual rainfall–runoff relationship when considered separately over the Millennium Drought period and the pre-drought period. The degree of change necessary to be considered a shift varied by catchment, since the key criterion was a statistical test designed to identify statistically significant differences in relationships (α= 0.05), and the results of this test are sensitive to background temporal variability. For catchments showing shifts, the implication is that a given annual rainfall led to a smaller annual streamflow during the drought than before. Approximately half of the studied catchments shifted (Fig. 2c), especially drier and flatter catchments with low forest cover. The shifts were often associated with increases in the number of zero-flow days.
The shifted behaviour has continued post-drought. Using more recent data, Peterson et al. (2021) showed that more than half of the shifted catchments had not yet recovered by 2017 (Fig. 2d), despite a return to wetter conditions particularly in 2010, 2011, and 2016. In shifted catchments that have not yet recovered, years with average rainfall produce less streamflow today than they did pre-1997. Peterson et al. (2021) found that the catchments appear to be persisting within lower rainfall–runoff relationships, and that non-recovery is not explained by changes in seasonal rainfall, land cover change, or the rating curve or gauge method. While this study was over a smaller extent (state of Victoria; Fig. 2c–d), Peterson et al. (2021) suggested the non-recovery was best explained by increased actual evapotranspiration per unit of precipitation, rather than alternatives such as increased recharge.
The shifted catchments had experienced drought previously during the period of streamflow record, as reflected by the low pre-1997 rainfall years in Fig. 2b. However, there was something different about the Millennium Drought that caused streamflow response to diminish relative to previous droughts. Having experienced prior years of low rainfall, this set up an expectation of how much streamflow could be expected in a dry year of given severity (measured by rainfall), and this expectation was subsequently broken during (and after) the Millennium Drought.
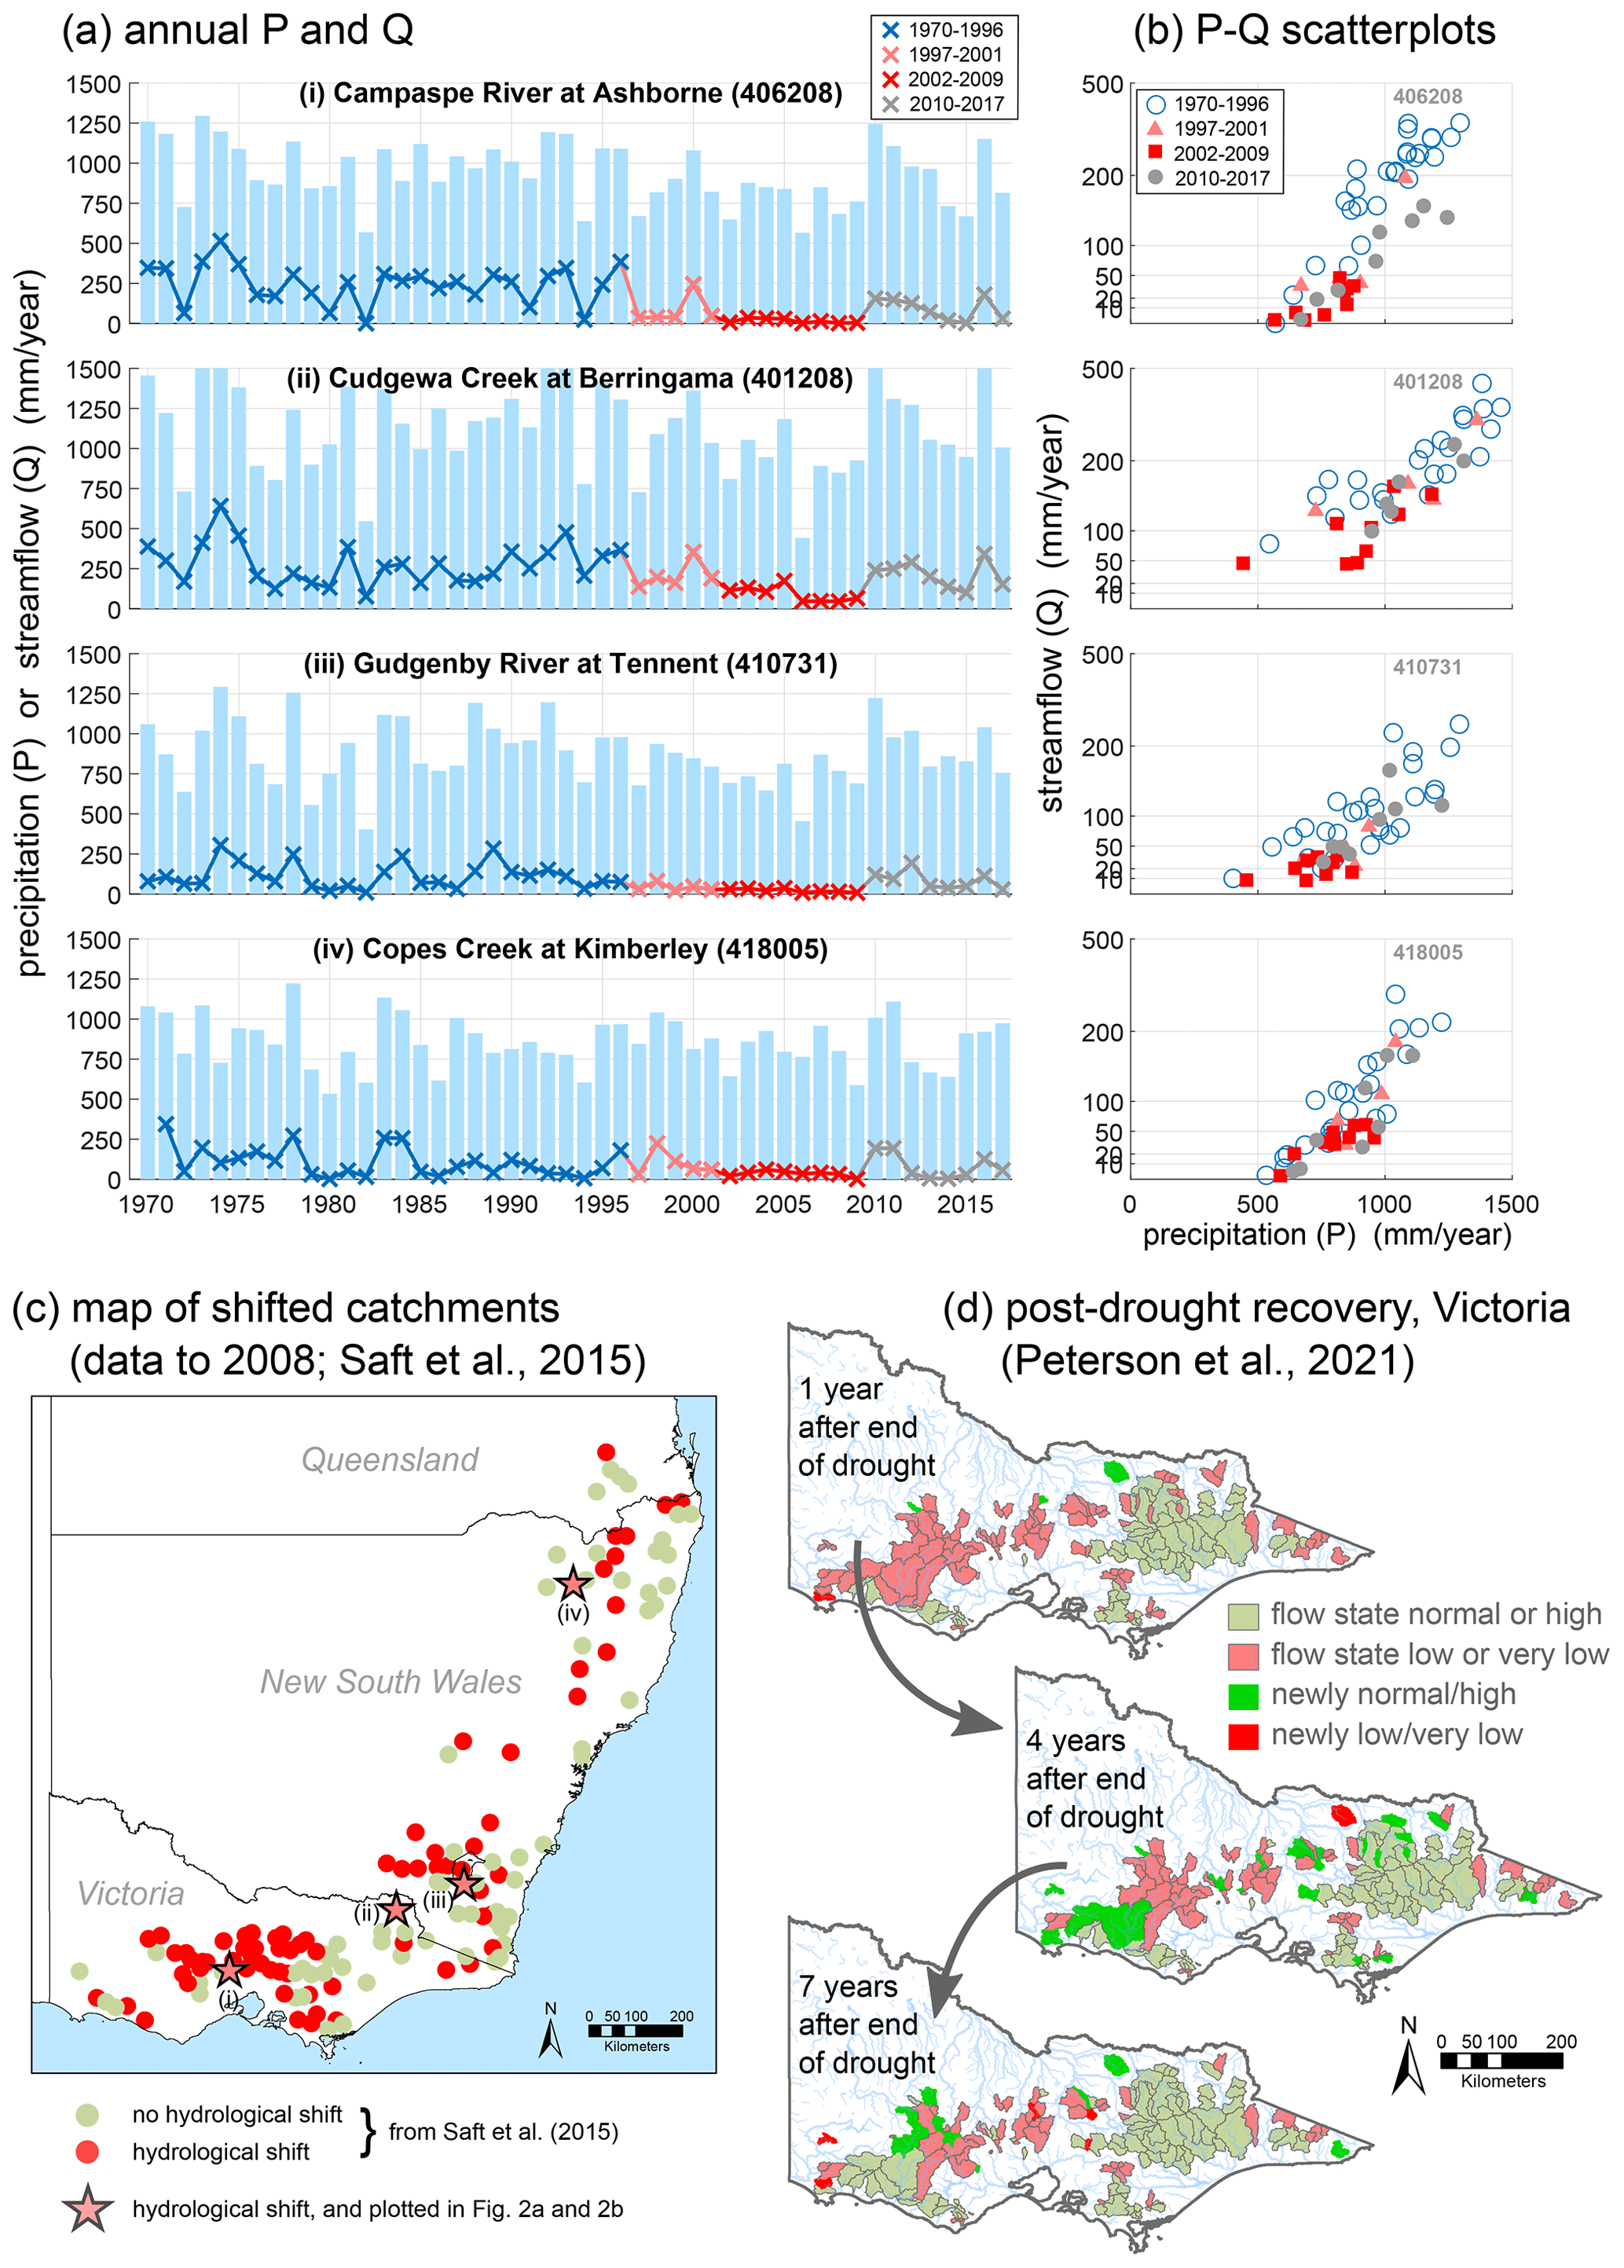
Figure 2Hydrological behaviour prior to and during the Millennium Drought (a–c) and post-drought recovery (d), based on prior studies. (a) annual time series of precipitation (P; bars) and streamflow (Q; lines and crosses) for four selected catchments which exhibited hydrological shifts. (b) Scatterplots corresponding to panel (a). (c) Location map of shifted catchments from Saft et al. (2015). (d) Drought recovery with time and mapped across the state of Victoria for selected time slices from Peterson et al. (2021). Elapsed time is measured from the end of the meteorological drought.
In this presentation of process explanations, several categories of processes are considered, each in a separate subsection, and explanations involving more than one category are marked accordingly and grouped with the most important category for the mechanism in focus. For clarity, hypothesised process explanations are labelled with the acronym HPE, followed by an identification number and a one-sentence summary, starting with “streamflow was lower than expected because …”. Table 1 summarises all the HPEs.
3.1 Changes in meteorological conditions
The problem framing in Sect. 2 already accounts for changes in precipitation, but this includes considered annual values only and not within-year changes, such as sequencing and seasonality, or changes in variables other than precipitation. These changes are the focus below. For reference, the maps in Appendix B show annual and seasonal precipitation, streamflow and runoff coefficient over the pre-drought, drought, and post-drought periods.
3.1.1 Changes in rainfall seasonality
Earlier studies such as Potter and Chiew (2011) suggested the seasonality of rainfall as being one causative factor for lower Millennium Drought streamflows. As seen in Fig. 3a, precipitation reduced across the seasons, and to different degrees in different areas, but reductions in autumn (March–May) were the most severe in many areas. There were also reductions in winter rainfall (see also Pepler et al., 2021), although the percentage of reductions was not as great as those in autumn.
In this study area, autumn is the time when many catchments wet up ahead of the main flow-generating period in winter (June–August) and early spring. In terms of hydrological processes, tightly bound soil water, once seasonally depleted, likely receives priority in the seasonal re-wetting process (e.g. Brooks et al., 2010), since the mobility of water moving to the stream is restricted until after the soil pores have been replenished and the soil reaches field capacity. During the Millennium Drought, lower autumn rainfall may have extended the soil-pore-filling period later into the year, diminishing the period of flow generation, a concept supported by Wasko et al. (2020). The hypothesised process explanation (HPE) is thus summarised as follows: HPE01: streamflow was lower than expected because lower autumn rainfall led to delayed wetting up and muted flow response during winter (when runoff coefficients are usually highest).
Table 1Summary table of the hypothesised process explanations (HPEs). Note that HPEs marked with an asterisk (*) also assume declines in recharge, e.g. due to lower precipitation, and/or HPEs 6–7, 9, or 13–15.
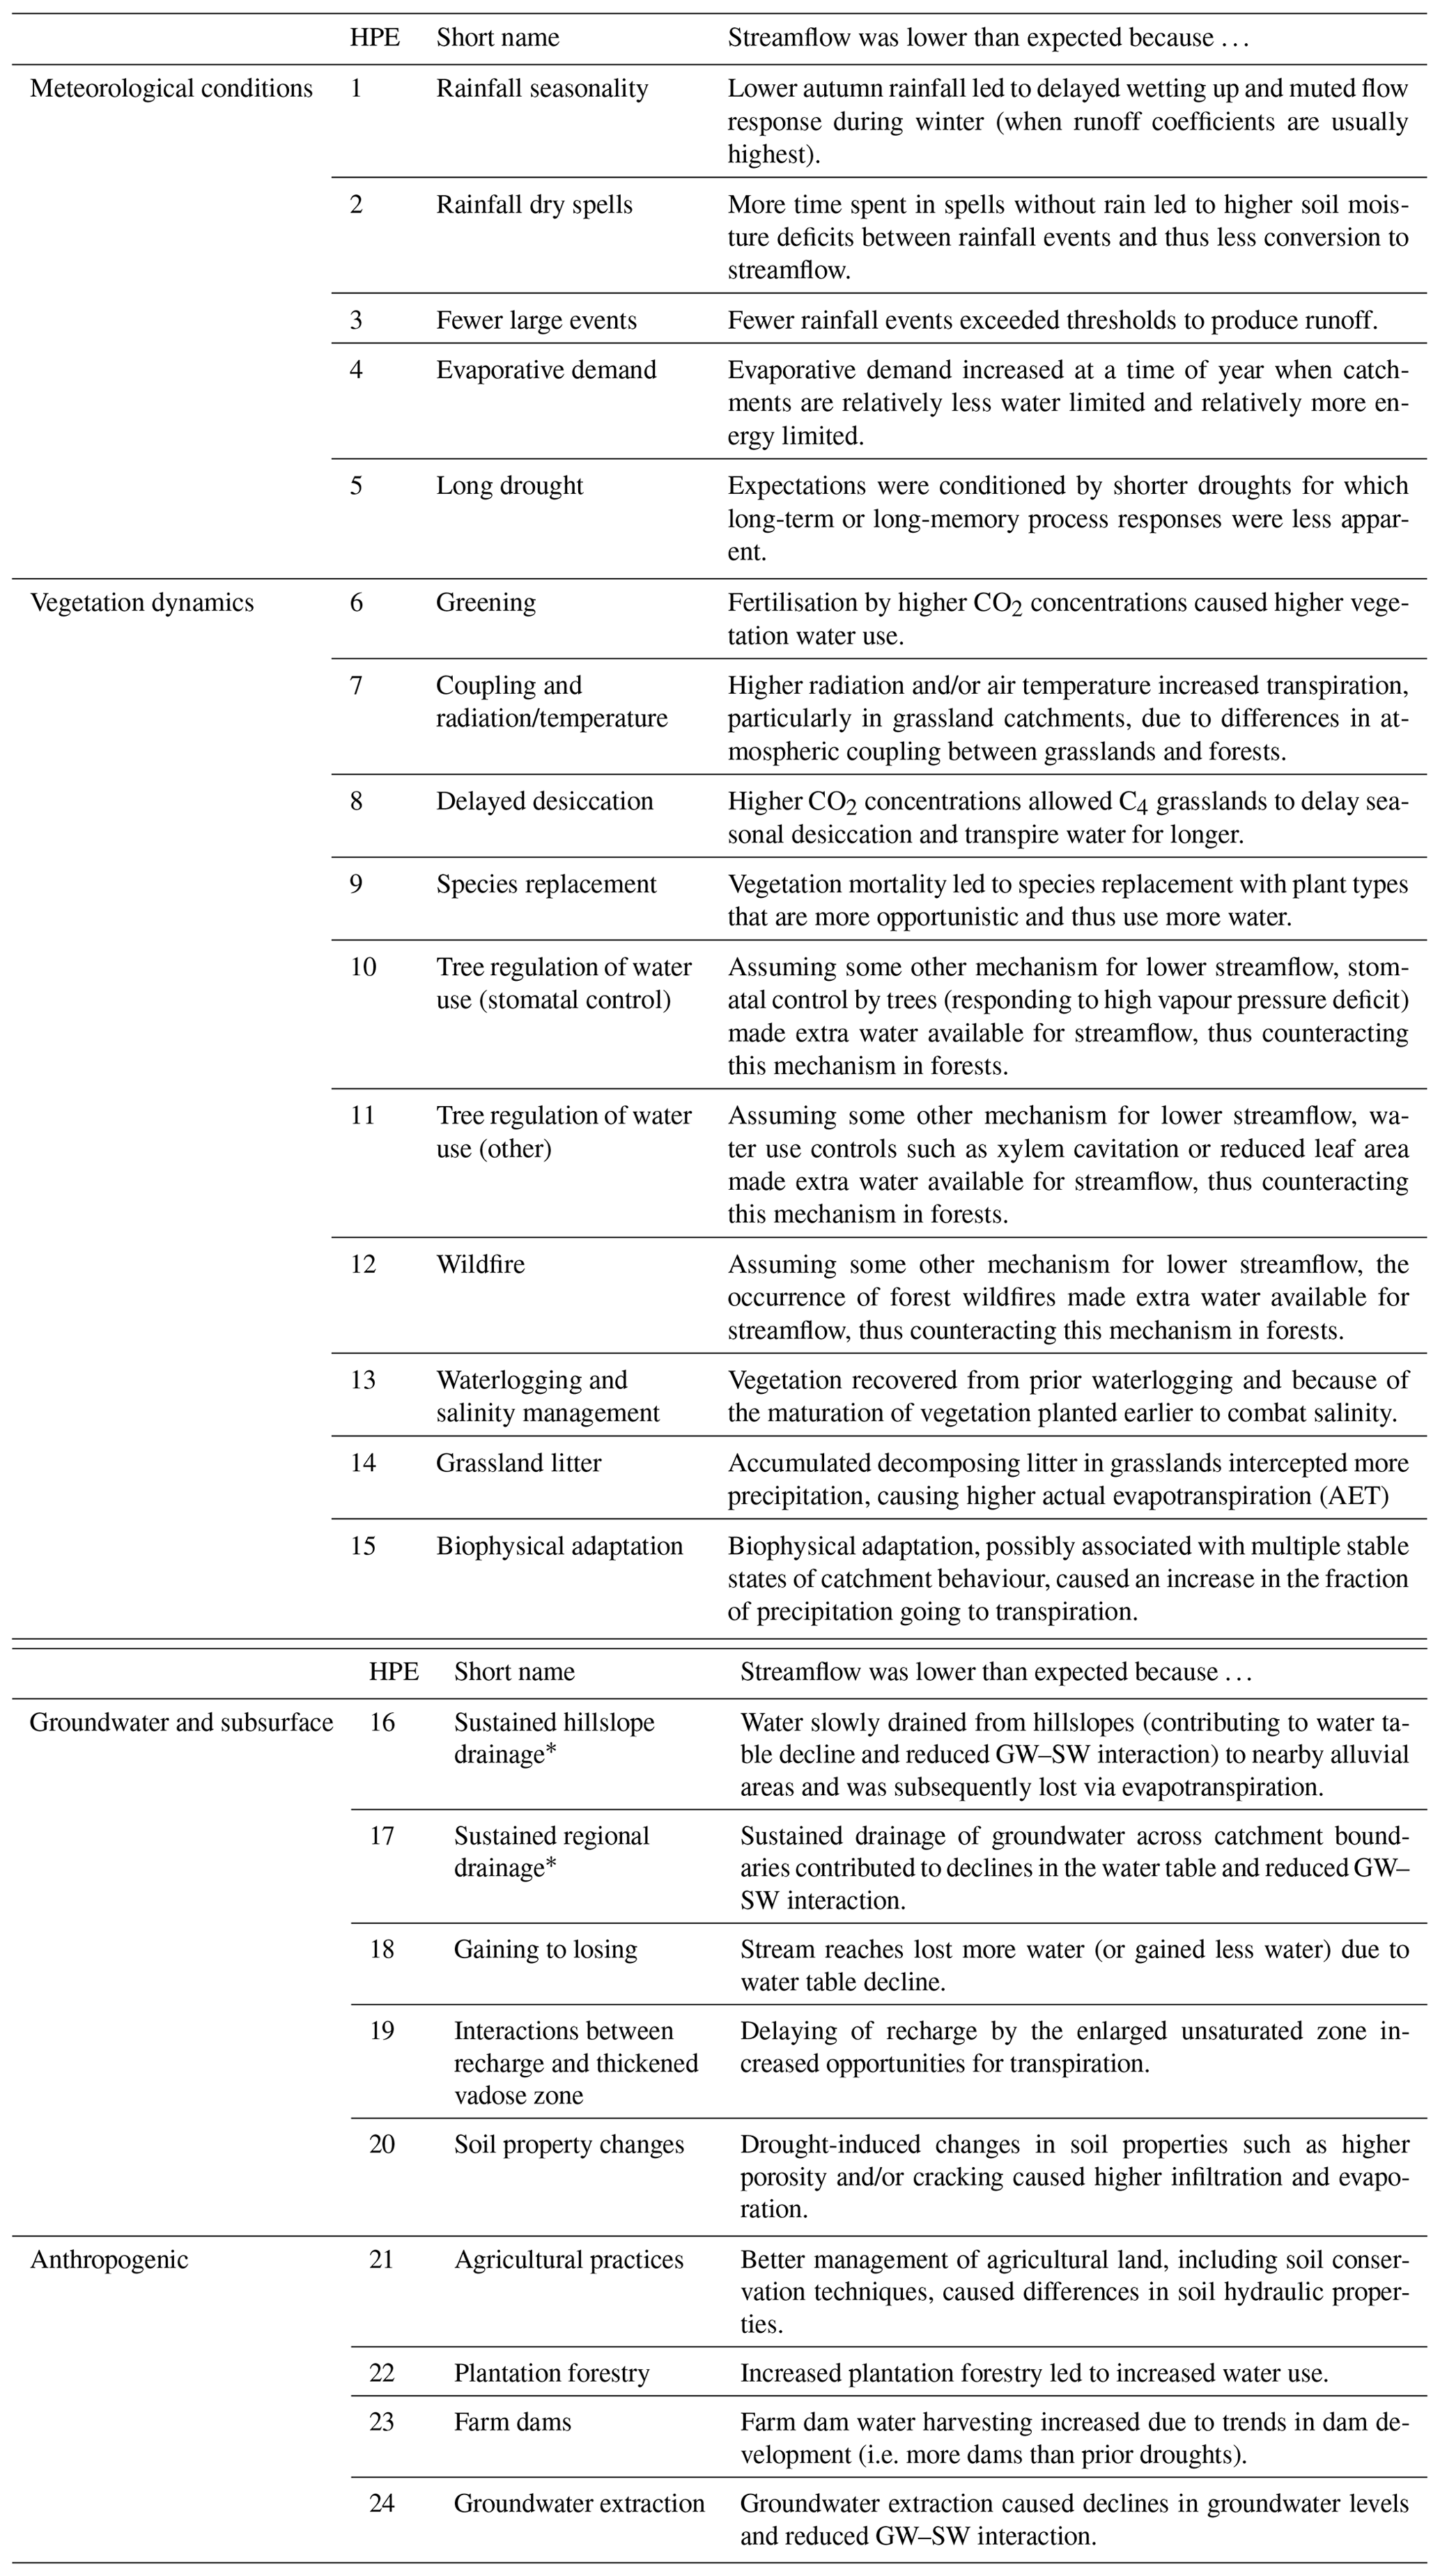
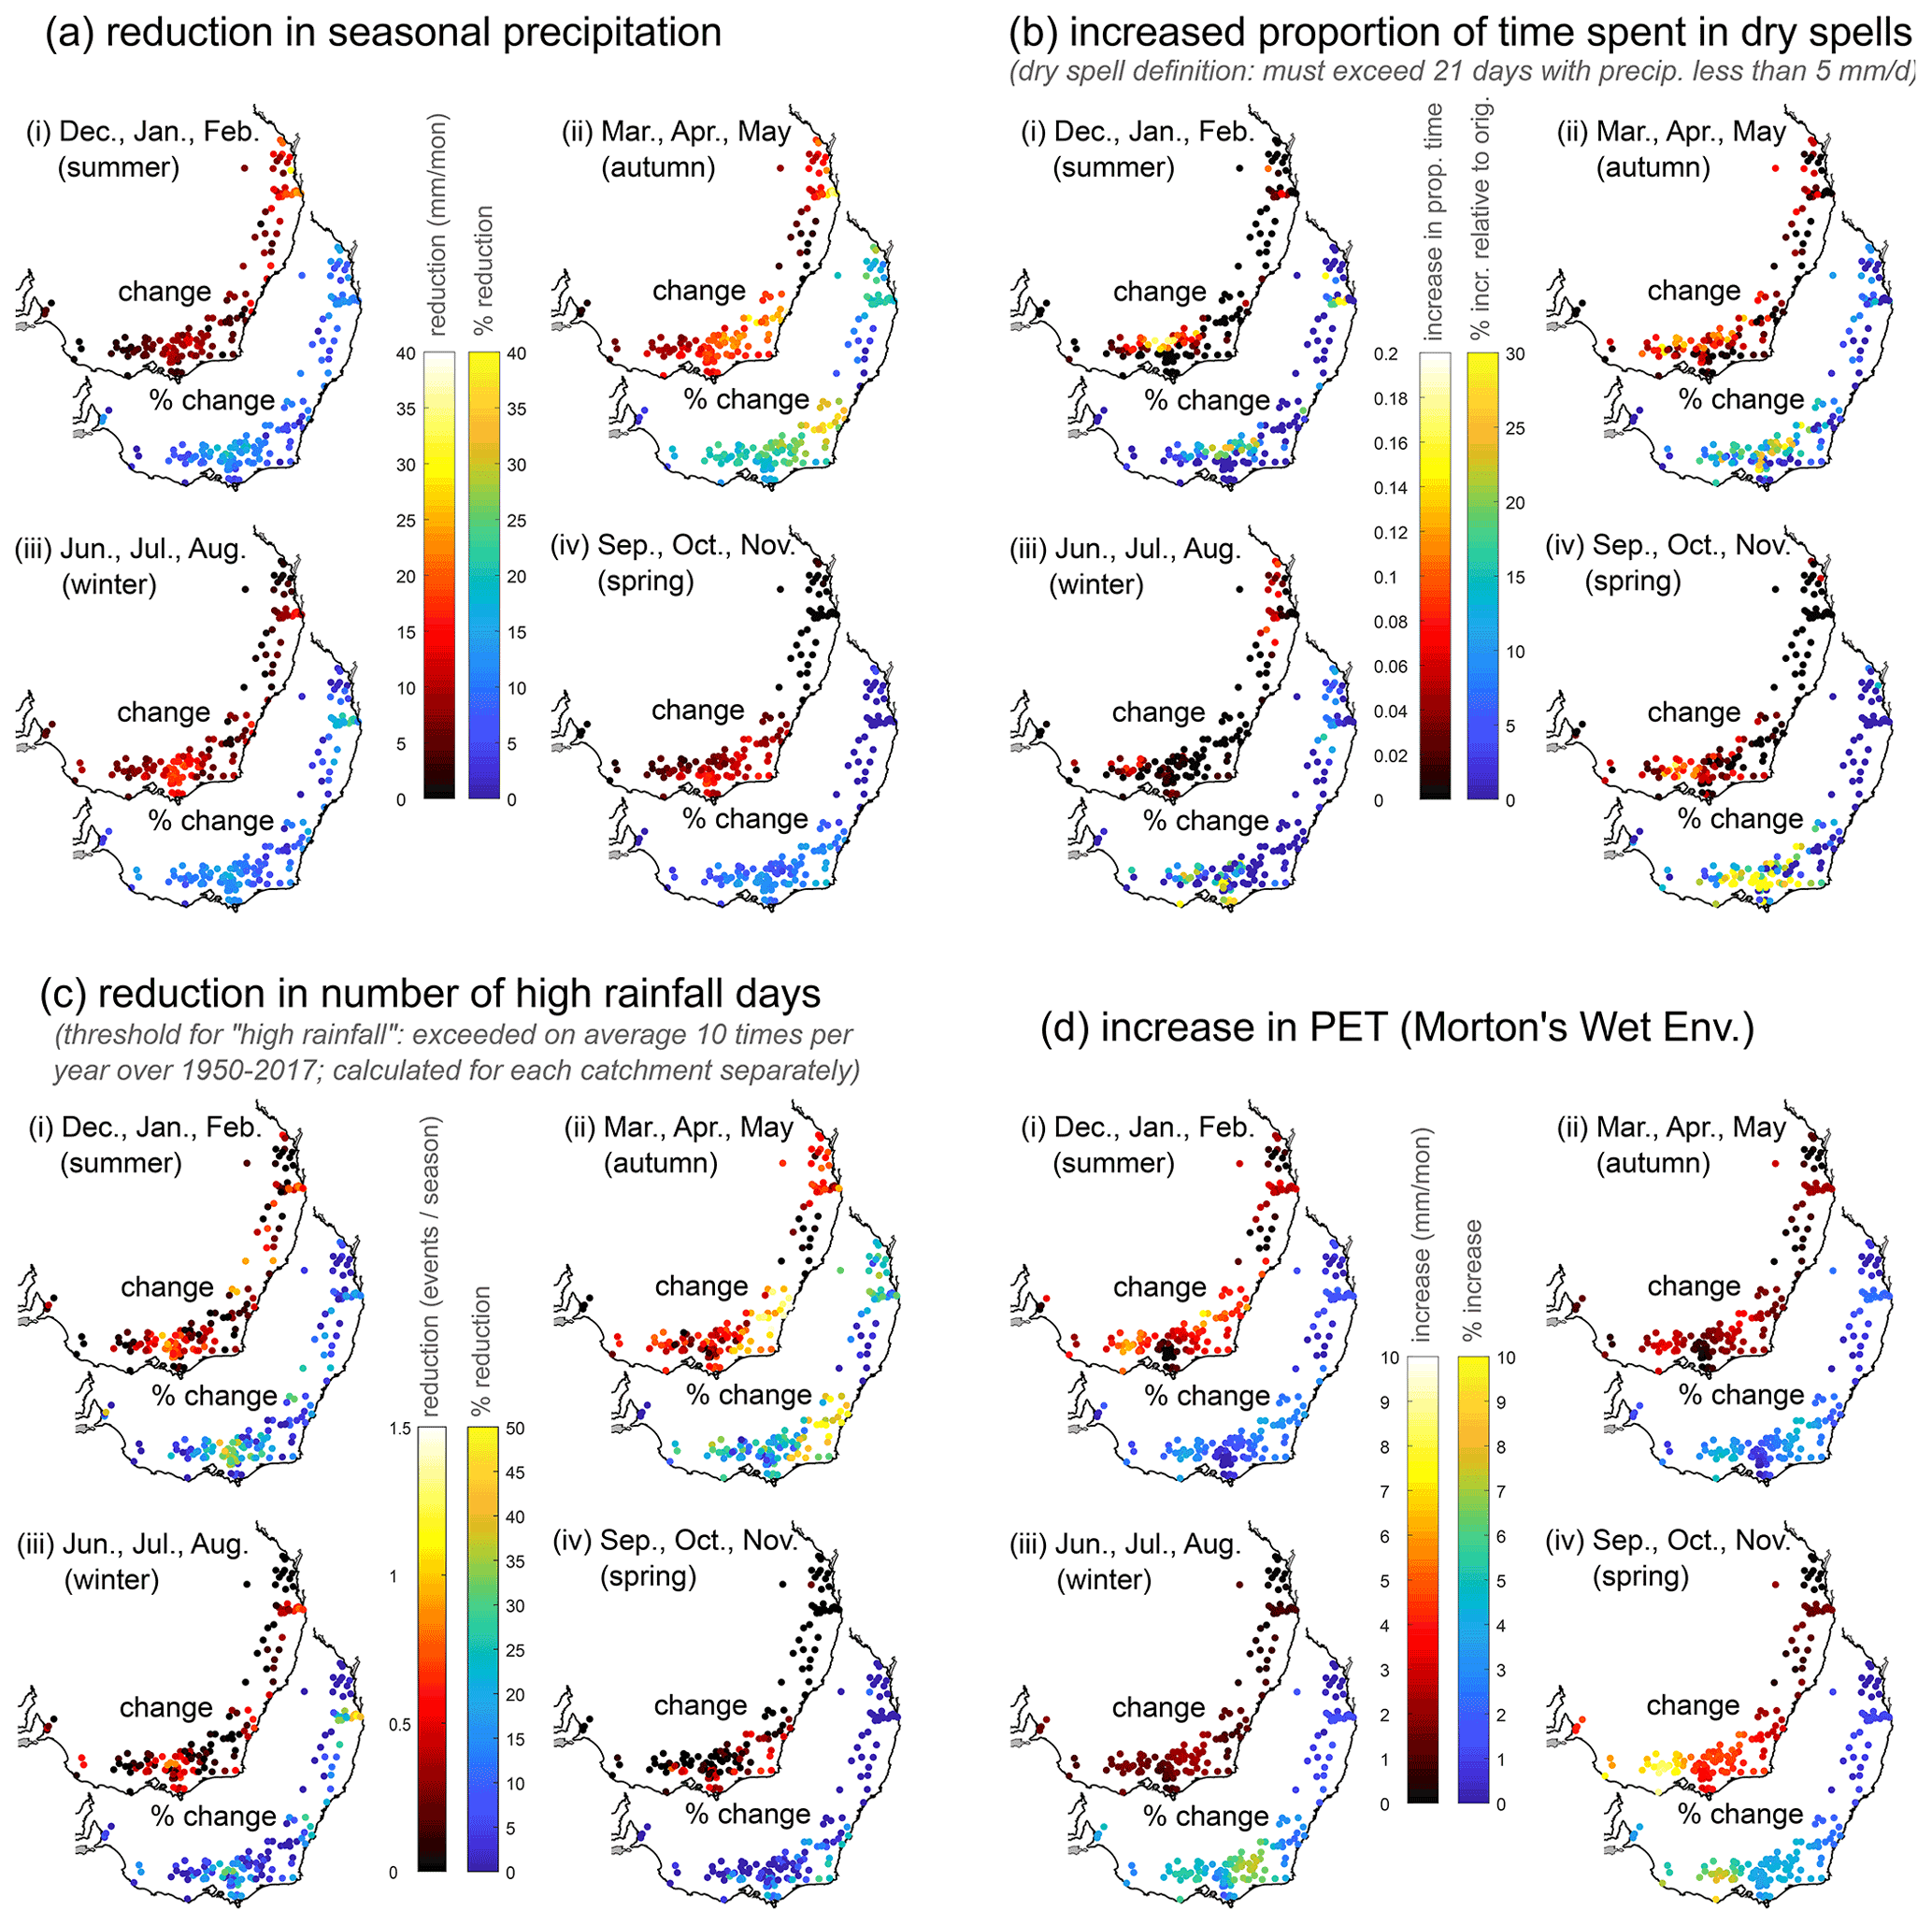
Figure 3Change in selected climatic statistics during the Millennium Drought (taken as April 1997 to August 2010, inclusive) compared to the long-term average (taken as calendar years 1950 through 2017, inclusive) for each season. Each dot corresponds to a single catchment; values plotted are areal averages sourced from Fowler et al. (2021).
3.1.2 Increased time spent in spells of little or no rainfall
As shown in Fig. 3b, during the Millennium Drought there was an increased proportion of time spent in spells with little or no rainfall in many locations. Although HPE01 and HPE02 are similar, HPE01 is focussed on the seasonal dynamics of refilling the soil moisture deficit accrued over the entire dry season, whereas HPE02 is concerned with shorter timescales and occurred in all seasons, albeit to different degrees (Fig. 3b). With longer periods between significant rainfall events, soil moisture deficits likely arose from continued evaporation and/or transpiration, which then needed to be filled prior to the resumption of streamflow (similar to HPE01). Because of this, a greater proportion of event rainfall would be used to fill this deficit rather than converted to streamflow. Although Verdon-Kidd and Kiem (2009) note that the increase in dry spells was not as high as during two other protracted droughts pre-1950, it is retained as a hypothesis for now as HPE02: streamflow was lower than expected because more time spent in spells without rain led to higher soil moisture deficits between rainfall events and thus less conversion to streamflow.
3.1.3 Decreases in frequency of high-rainfall events
Generally, a small number of large rainfall events each year contribute disproportionately to annual flow volumes, and there is recent evidence for a reduction in the frequency of large rainfall events in many parts of Australia (Wasko et al., 2019; Dey et al., 2020). Heavier rainfall events are more conducive to preferential flow, but smaller or less intense events may be more readily absorbed by the soil and thus available to plants (e.g. Elliott et al., 2015). A reduction in the frequency (Fig. 3c) of high rainfall events (i.e. those above thresholds that produce runoff1; Saffarpour et al., 2016) could produce a downward shift in streamflow generation, even if annual reductions in precipitation are relatively moderate. Furthermore, we might expect that flatter catchments require higher rainfall thresholds to produce runoff than steep catchments; it is thus possible that we might see differences in response even within a homogenous rainfall region. Supporting this hypothesis, Verdon-Kidd and Kiem (2009) reported that the Millennium Drought had less intense rainfall, on average, than two other protracted droughts pre-1950. Thus, HPE03: streamflow was lower than expected because fewer rainfall events exceeded thresholds to produce runoff.
3.1.4 Increases in evaporative demand
Stephens et al. (2018) reported recent increases in pan evaporation within the area affected by the Millennium Drought (despite earlier declines), while Potter and Chiew (2011) cited higher evaporative demand as a potential driver of hydrological behaviour. Although southeastern Australia is typically water limited rather than energy limited, anomalies in evaporative demand may still be important seasonally and in wetter parts of the landscape. Increases in potential evapotranspiration (PET) when water is available (e.g. winter and spring are the wettest times in the southern part of the affected area) are more likely to impact the water balance. Figure 3d shows that evaporative demand – here quantified as Morton's (1986) wet environment evaporation – increased significantly at precisely this time of year and more so in the drier south and south west of the study area (in central and western Victoria; cf. Fig. 2). Conspicuously, this is also an area where almost all catchments exhibit hydrological shifts (Fig. 2c–d). The question of which environmental variable drives this increase is held over to Sect. 4 (see also HPE07). In summary, HPE04: streamflow was lower than expected because evaporative demand increased at a time of year when catchments are relatively less water limited and relatively more energy limited.
3.1.5 Length of drought
The Millennium Drought lasted 10, 13, or 16 years, depending on the location and choice of definition. By comparison, many earlier droughts, such as those in 1965–1968 and 1982–1983, were shorter. It is possible that the unexpectedly severe streamflow reductions during the Millennium Drought were caused by the activation of long-term or long-memory processes that were absent from these earlier droughts. The pre-1950 period included relatively longer droughts such as the Federation Drought (1895–1903) and the World War II Drought (1939–1945), and while comparison of meteorological conditions among these droughts is insightful (e.g. Verdon-Kidd and Kiem, 2009), few streamflow gauges were active during these periods (see also Sect. 4.1), which makes intercomparison of flow difficult. Thus HPE05: streamflow was lower than expected because expectations were conditioned by shorter droughts for which long-term or long-memory process responses were less apparent. This broad, overarching HPE is incomplete without further detail about which processes are in view, but this is held off to later HPEs (specifically HPEs 9, 15, 16, 17, and 18).
3.1.6 Comments on climatic drivers
The climate drivers presented above – namely PET, rainfall seasonality, dry spells, and intensity – all relate to the Millennium Drought period and not post-drought. As many catchments did not recover post-drought, a test of these HPEs is whether the stated climatic driver continued post-drought or went back to pre-drought conditions. For example, did the changes in seasonality cease with the drought or continue post-drought? We leave such questions to Sect. 4 as part of the evaluation of the HPEs.
3.2 Vegetation dynamics
In southeastern Australia, high evaporative demand relative to rainfall means that evapotranspiration dominates the water balance, and rainfall–runoff ratios are low (typically < 10 %). Therefore, vegetation behaviour has the potential to significantly impact streamflow, as a small percentage change in plant water availability or actual evapotranspiration (AET) may translate into a large percentage change in streamflow. Recent findings suggesting an increase in AET per unit of precipitation (Peterson et al., 2021; see also Sawada and Koike, 2016) underscore the need for investigation.
3.2.1 Greening induced by increased atmospheric CO2
Atmospheric CO2 concentrations have been increasing over the instrumental period (IPCC, 2021), with their effect on vegetation water use and impact on catchment or regional water resources being the subject of considerable research (e.g. Peel et al., 2009; Cheng et al., 2017). Higher atmospheric CO2 concentrations generally increase plant water use efficiency (e.g. Ainsworth and Long, 2005; Gedney et al., 2006; Liu et al., 2020), which may manifest as a reduction in transpiration (e.g. Warren et al., 2011). However, the increase in water use efficiency can also manifest as increased growth, and in some cases, this can lead to increased transpiration (e.g. Piao et al., 2007; Uddling et al., 2008; Jaramillo et al., 2018). Observational studies from eastern Australia supporting the latter view include Ukkola et al. (2016), Ajami et al. (2017), and Trancoso et al. (2017). This suggests a potential cause for the reduced streamflow, but it is noted that responses may depend on land cover, e.g. forests and grasslands (Morgan et al., 2004, 2011; see next subsection), and may also vary under drought conditions (Yang et al., 2016). It should also be noted that, because CO2 fertilisation typically leads to a reduction in transpiration per unit leaf area, increased growth can often occur without any increase in transpiration (De Kauwe et al., 2021; Rifai et al., 2022). HPE06: streamflow was lower than expected because fertilisation by higher CO2 concentrations caused higher vegetation water use (relative to previous droughts).
3.2.2 Atmospheric coupling, vapour pressure deficit, and evaporative demand
This HPE spans vegetation behaviour, climatic forcing (HPE04), and atmospheric physics but is listed under vegetation because it is the characteristics of the vegetation itself which are key to the process and lead to spatial differences in this effect. Atmospheric coupling refers to the degree of mixing of the air between the canopy and the atmosphere above, which is related to the turbulent flow over and within the canopy (McNaughton and Jarvis, 1991). Small-stature canopies (e.g. grasslands) are more decoupled due to lower turbulence associated with homogeneous canopies (e.g. De Kauwe et al., 2017). This lower turbulence in grasslands allows a near-surface boundary layer to build up, which decouples the vapour pressure deficit (VPD) experienced by plants from the atmospheric VPD. Thus, transpiration in grasslands is relatively less responsive to atmospheric VPD and relatively more responsive to other factors such as solar radiation and temperature. Thus HPE07: streamflow was lower than expected because higher radiation and/or air temperature increased transpiration, particularly in grassland catchments, due to differences in atmospheric coupling between grasslands and forests. Discussion of whether increases in radiation actually occurred (and with a spatial distribution supporting this hypothesis) is held over to Sect. 4. Note that, in contrast to grasslands, transpiration from forests in southeastern Australia can be very sensitive to atmospheric VPD, and this is discussed further in the next subsection.
3.2.3 Moisture stress, delayed desiccation, and vegetation replacement
Under low moisture, plants may become water stressed, and leaves (or, more rarely, the whole plant) may die. In grasslands with pronounced dry seasons, loss of leaves due to desiccation may occur seasonally, leading to reduced water use, but the root system typically remains alive despite loss of foliage. Higher CO2 allows more efficient use of available water in grasslands (e.g. Hovenden et al., 2019) and may delay seasonal desiccation in C4 grasses under warmer conditions (Morgan et al., 2004; see also Morgan et al., 2011). Paradoxically, grasses that retain foliage for longer may transpire rainfall from mid-to-late summer storms (and/or cause greater evaporation via interception), thereby using more water than grass where leaves are already dead. This is a paradox because the higher water use efficiency, which enables the longevity of the C4 grass leaves, could actually result in greater annual water use. HPE08: streamflow was lower than expected because higher CO2 concentrations allowed C4 grasslands to delay seasonal desiccation and transpire water for longer (relative to previous droughts).
If vegetation dies entirely (e.g. Allen and Breshears, 1998; Fensham et al., 2005; Semple et al., 2010), then this could increase water use if the vegetation is replaced by species that are more opportunistic in their water use. HPE09: streamflow was lower than expected because vegetation mortality led to species replacement with plant types that are more opportunistic and thus use more water.
The next HPE is one of three (namely HPEs 10, 11, and 12) which are phrased differently. As noted earlier, forested catchments rarely shifted, whereas grasslands commonly shifted. The most straightforward way to explain this spatial pattern is to posit a hypothesis or hypotheses that act in grasslands catchments and not forested catchments. A less straightforward, but still possible, explanation is to posit that the mechanism causing the shifts acted on all catchments regardless of land cover, and then a second mechanism, specific to forested catchments, counteracted the first to produce the observed spatial pattern. HPEs 10, 11, and 12 are in this latter category, and this is why the HPE wording is preceded by the words “assuming some other mechanism for lower streamflow …”.
As noted, transpiration from forests can be very sensitive to atmospheric VPD (e.g. Gharun et al., 2013), with plants exercising strong stomatal control to limit moisture loss during periods of high VPD and low soil moisture (e.g. Renchon et al., 2018; Grossiord et al., 2020). Thus, if some other mechanism was acting to cause hydrological shifts across grasslands and forests alike, then stomatal control in forests may have counteracted this mechanism (in which case forest catchments would appear less shifted than grasslands). HPE10: assuming some other mechanism for lower streamflow, stomatal control by trees (responding to high VPD) made extra water available for streamflow, counteracting this mechanism in forests. Discussion of whether increases in VPD actually occurred (and with a spatial distribution supporting this hypothesis) is held over to Sect. 4.
Trees demonstrate additional water-saving strategies (e.g. McDowell et al., 2008) not related to stomatal control, with eucalypts being able to reduce leaf area (Nolan et al., 2021) or undergo xylem cavitation (sometimes temporarily), thus impairing water use (Blackman et al., 2019; Nolan et al., 2021). These are listed separately to the previous HPE because they may persist for longer than rapid stomatal dynamics and be less dependent on VPD. HPE11: assuming some other mechanism for lower streamflow, water use controls such as xylem cavitation or reduced leaf area made extra water available for streamflow, counteracting this mechanism in forests.
3.2.4 Wildfire
Wildfire recovery is known to affect water use, with impacts subject to competing factors. Tree mortality and morbidity reduce water use, whereas re-growth increases it, and this is species specific (Heath et al., 2014). Due to this combination of factors, yield impacts reported by Australian studies vary widely and include significant increases (Lane et al., 2006; Guo et al., 2021), decreases in the short–medium term (Nolan et al., 2015) and longer term (Kuczera, 1987), and negligible change in catchment yield (Feikema et al., 2013; Heath et al., 2014). Many eucalypts have post-fire resprouting mechanisms (e.g. epicormic buds and lignotubers) which can be activated, provided the fire does not kill the tree (e.g. Nolan et al., 2014). Thus, fire severity is an important factor, as is species mix (Nolan et al., 2015). A further consideration is changes to soil hydraulic properties and water repellency following fire (e.g. Nyman et al., 2010). Southeastern Australia was subject to multiple fire events during the Millennium Drought. For example, the 2003 bushfires were the first widespread fire events since the early 1980s, and subsequent major fires occurred in the summers of 2006–2007 and 2008–2009 and over different areas in each case. In general, the areas affected by wildfire were those that did not shift. The hypothesis is as follows: assuming a dip in vegetation water use after the wildfire (e.g. Lane et al., 2006; Guo et al., 2021), possibly coupled with runoff-induced changes in soil properties (e.g. Nyman et al., 2010), the wildfire caused an increase in streamflow that masked the underlying shift in behaviour. In other words, if not for wildfire, more catchments would have appeared to have shifted. HPE12: assuming some other mechanism for lower streamflow, the occurrence of forest wildfires made extra water available for streamflow, counteracting this mechanism in forests.
3.2.5 Vegetation recovery from waterlogging and salinity
This HPE spans vegetation and groundwater processes. Prior to the Millennium Drought, multi-decadal wet conditions combined with historic deforestation led to high water tables and waterlogging in many areas, with naturally occurring soil salt brought to the surface (e.g. Cartwright et al., 2004). The waterlogged and saline topsoil reduced the health, and thus water use, of vegetation (Lambers, 2003). Waterlogged and salt-affected areas were planted with tolerant grasses or shrubs, while trees were added to the landscape in groundwater recharge areas or upslope of discharge areas (Schofield, 1992; Marcar, 2016). These revegetation efforts were focussed on the late 1980s and 1990s, and thus the timing of maturation of much of this vegetation would have coincided with the onset of the Millennium Drought (commencing in the late 1990s). Furthermore, the drought onset lowered water tables, removing waterlogging as a stressor of vegetation (although it is noted that legacy salinity may persist for many years and even intensify during drought due to evapoconcentration; see, e.g., Hrachowitz et al., 2015). HPE13: streamflow was lower than expected because vegetation recovered from prior waterlogging and because of the maturation of vegetation planted earlier to combat salinity.
3.2.6 Increased interception due to decomposing material
The drier conditions during the Millennium Drought, together with potential greening, may have led to a greater accumulated dead plant matter in grasslands. Litter in grasslands has been shown to increase interception of precipitation (e.g. Naeth et al., 1991). HPE14: streamflow was lower than expected because accumulated decomposing litter in grasslands intercepted more precipitation, causing higher AET.
3.2.7 Biophysical adaptation to climatic disturbance associated with multiple stable states of catchment behaviour
Peterson et al. (2021) suggest vegetation behaviour may explain the apparent appearance of hydrological shifts. Furthermore, they suggest that their findings (as summarised in Sect. 2) are “consistent with … watersheds having multiple stable states [of behaviour] and a finite resilience” (Peterson et al., 2021). In this view, the hydrological shift towards a lower rainfall–runoff relationship corresponds to a transition from one stable state to another (see Peterson et al., 2009). It is noted that the word “state” here has a different meaning to its common hydrological usage (e.g. state variable), as it refers to the behaviour of a system being organised into discrete preferential states (e.g. the wet and dry states of D'Odorico and Porporato, 2004), with intermediate conditions having low probability of occurrence. The Millennium Drought was an extreme disturbance that might have pushed several catchments from a wetter to a drier state, with the drier state otherwise seldom being apparent in a catchment's behaviour. Regarding vegetation, Peterson et al. (2021) say that “Evidence suggests that the vegetation responded to the drought by increasing the fraction of precipitation going to transpiration. … Like other natural systems with multiple stable states, this persistence may be caused by a biophysical adaptation to disturbances … that results in a positive feedback” (Peterson et al., 2021:4–5). The exact nature of this biophysical adaptation is yet to be determined and could be related to one or more of the preceding HPEs. However, it should be noted that none of the preceding HPEs inherently gives rise to multiple stable states, and thus such a hypothesis must be stated separately, which is why it is given its own HPE here. In any case, given that AET is the largest element (after rainfall) of the water balance in southeastern Australia, it seems reasonable to explain the hydrological shifts by hypothesising a direct change to the dynamics of AET by some cause. If it is accepted that the vegetation is the primary cause, then this explains both the streamflow shifts (since less water is available for runoff) and the water table decline described in the next subsection (since a higher fraction of drought rainfall is transpired, which dries out the soil, reducing recharge). HPE15: streamflow was lower than expected because biophysical adaptation, possibly associated with multiple stable states of catchment behaviour, caused an increase in the fraction of precipitation going to transpiration.
3.3 Groundwater and subsurface processes
As discussed above (HPE05), it has been hypothesised that the long duration of the Millennium Drought increased the role of long-term (long-memory) processes in determining hydrological behaviour. Given that groundwater is a relatively large store of water that can exhibit multi-year trends and long memory, it seems reasonable to assume that some of the streamflow declines were related to changes to groundwater inflows – a hypothesis strengthened by the observed regional-scale decline in the water table in southeastern Australia throughout the Millennium Drought (Fig. 4; LeBlanc et al., 2009; Van Dijk et al., 2013; Fowler et al., 2020a). For this hypothesis to work, it is first necessary to establish that groundwater influences streamflow generation, as briefly summarised here. In headwater catchments, inflows of both shallow and deep groundwater contribute to streamflow and may have different response times to disturbance. For example, streamflow may arise from relatively shallow interactions such as perched saturation along hydraulic gradient fronts (e.g. at the transition from A to B horizons) – behaviour which is relatively transient, with short (sub-annual; days–weeks) response times (e.g. Hughes et al., 2007). Interactions with unconfined aquifers include groundwater discharge directly into streams or via springs (e.g. O'Grady et al., 2010; Cartwright and Gilfedder, 2015; Zhu et al., 2021). Also, partial saturated areas and areas with shallow water table are primed for event runoff (e.g. Dunne and Black, 1970).
These varied processes – referred to hereafter as groundwater–surface water (GW–SW) interaction – mean that unconfined aquifers can interact and contribute to short timescale (event-to-seasonal) hydrological processes in headwater catchments. However, unconfined aquifers also exhibit slower dynamics such as multi-year trends. These dynamics depend on conditions. For high rainfall headwater catchments with steep slopes, lag times will be less than a few years, while for medium rainfall lower slope catchments the timescale can be decades, depending on geology (Cook, 2003). The observed drought-induced multi-year water table decline (Fig. 4a) likely caused discharge areas to dry up and seasonal wet areas to contract, thus reducing flow in headwater streams. In addition, groundwater-induced contractions in stream network length and extent increased subsurface flow path lengths to the nearest stream, potentially increasing the probability of water being diverted to transpiration (Jensen et al., 2017, 2018) rather than contributing to streamflow. Together, the above points establish the connection between groundwater and streamflow generation in headwater streams, leaving HPEs 16, 17, 19, and 20 to focus on the cause of the groundwater decline.
Note that some of the vegetation-themed HPEs presented above (specifically HPEs 6–9 and 13–15) could also reduce recharge and are thus also possible causes or contributors to groundwater decline. Even in the absence of these HPEs, it is reasonable to assume reduced recharge during the Millennium Drought since it is highly correlated with rainfall (e.g. Ferdowsian et al., 2001; Peterson and Western, 2014). Furthermore, note that the effect of groundwater on streamflow can involve extensive groundwater systems (Sect. 3.3.2) and is not limited to the headwater streams in focus here, since the fall in the water table also impacts middle and lower reaches of rivers in catchments where the SW and GW boundaries coincide (see also Sect. 3.3.3).
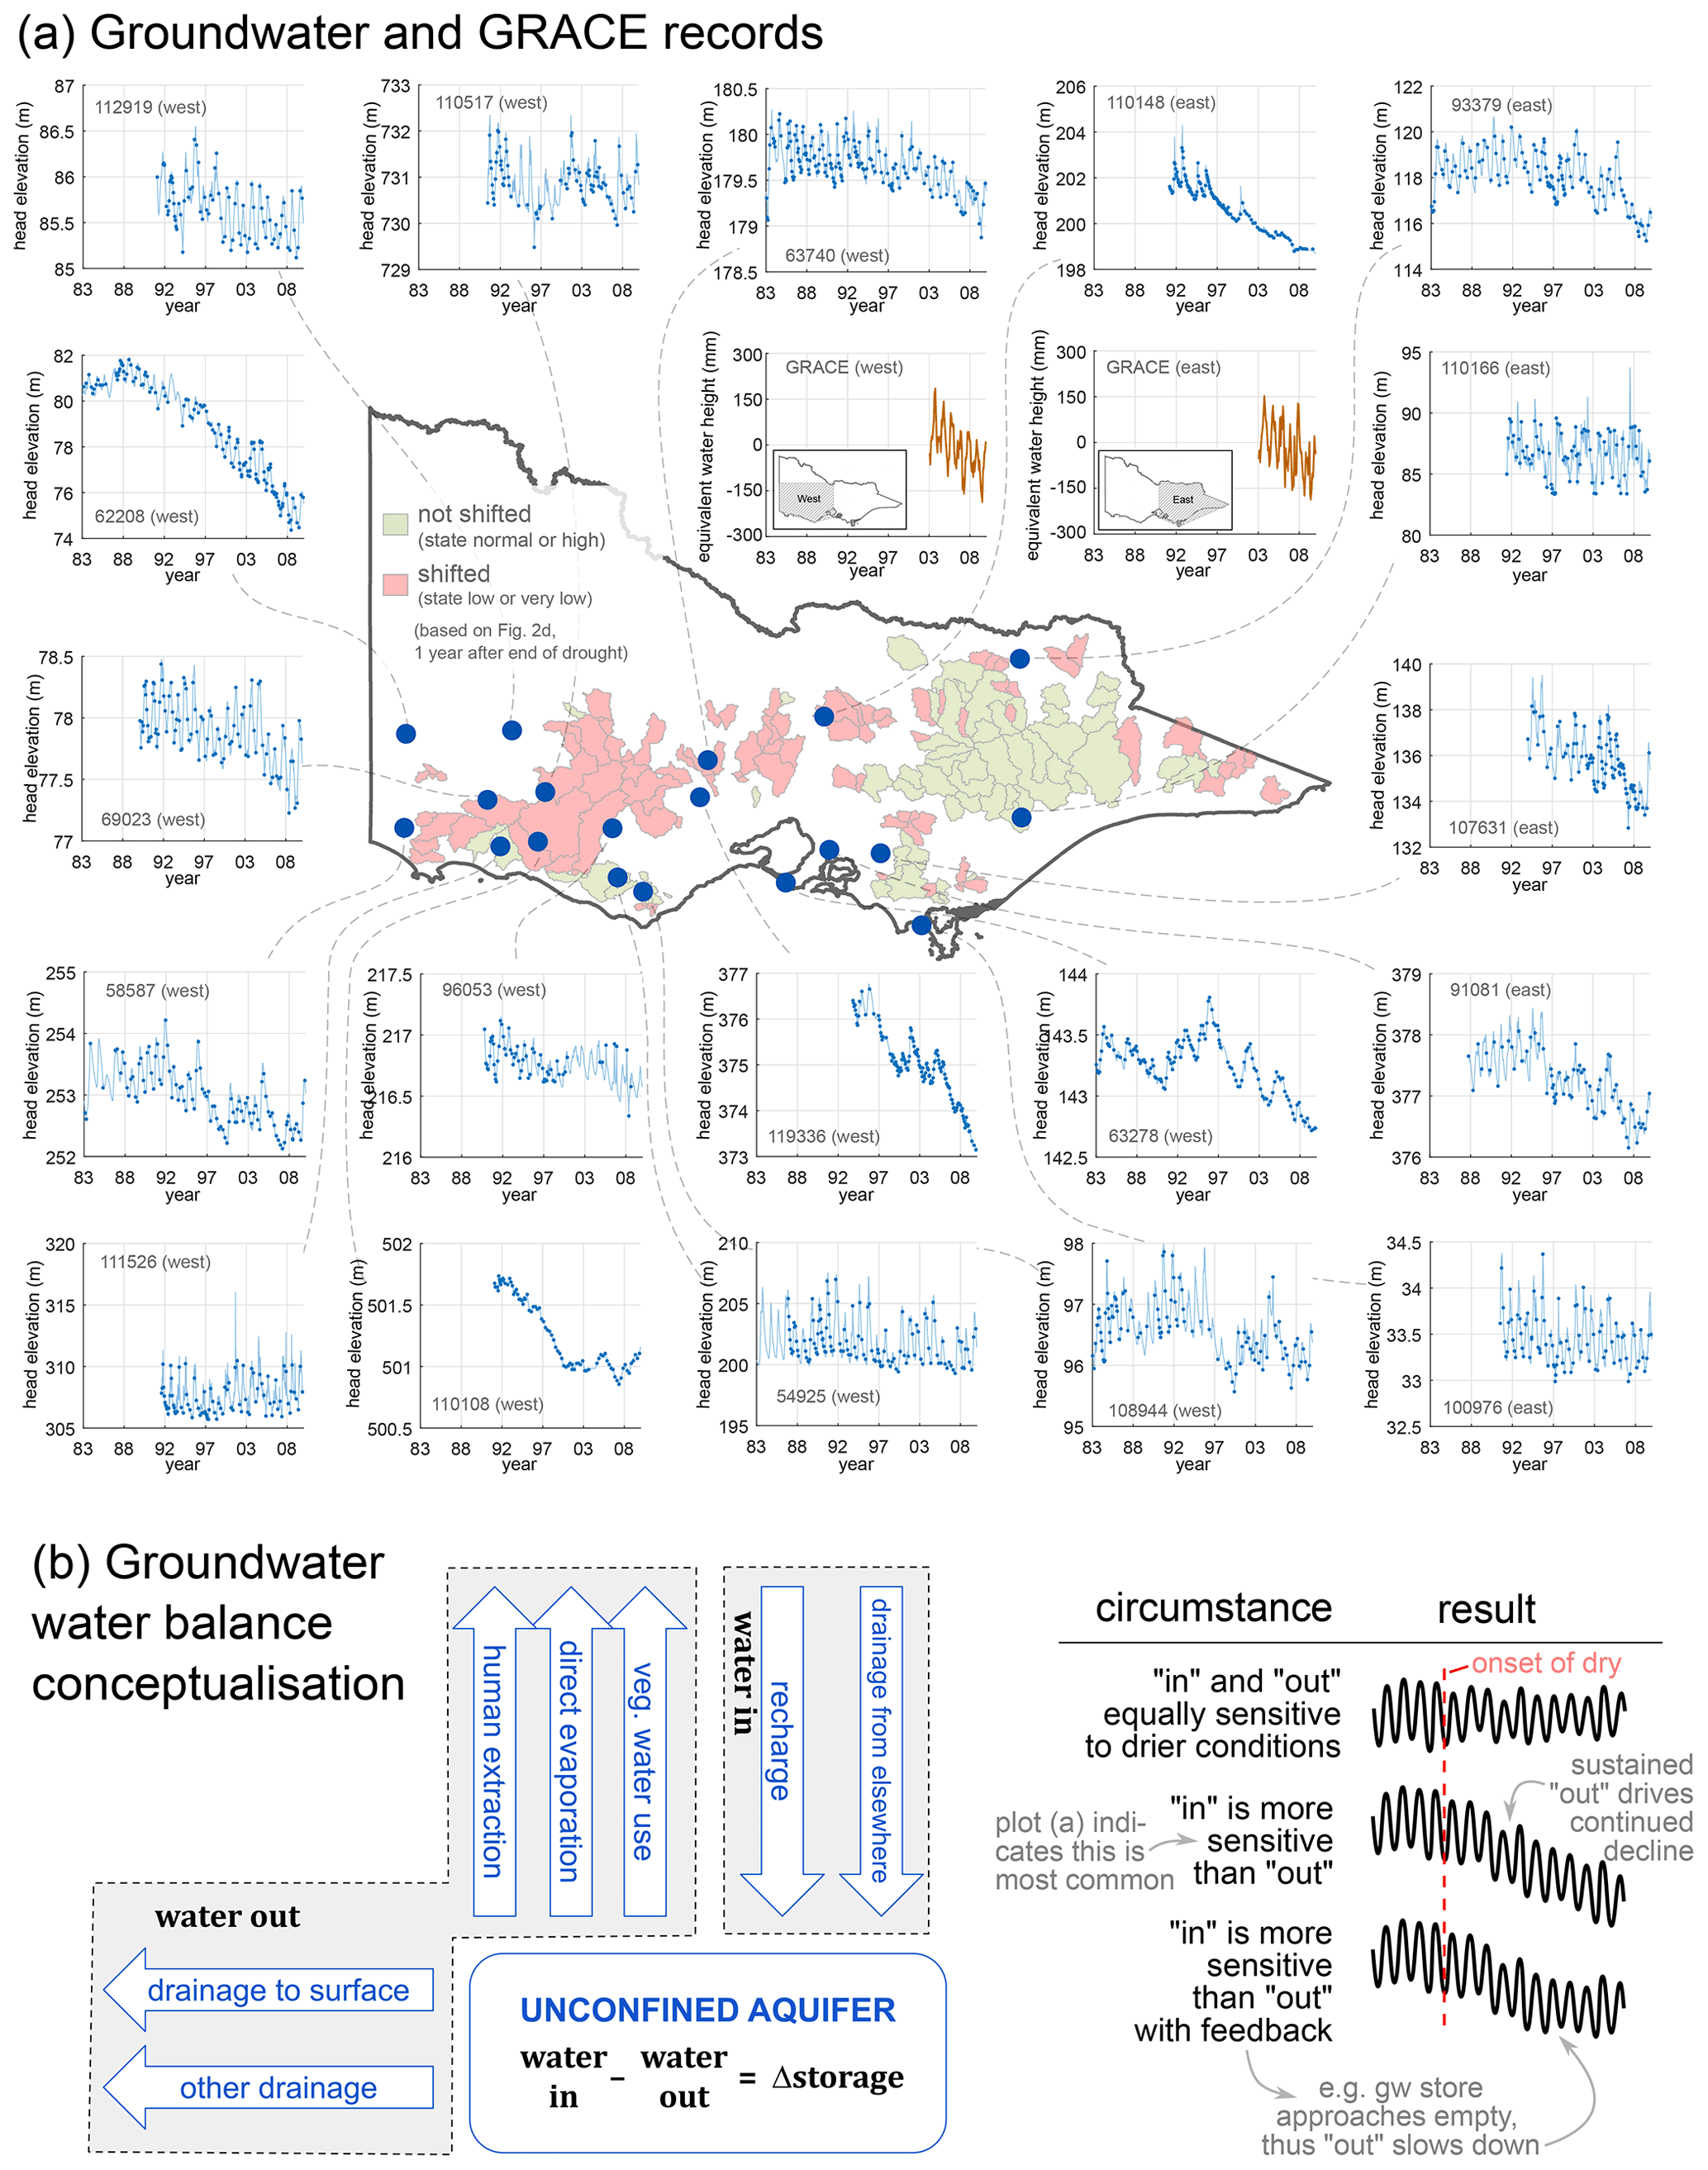
Figure 4(a) Groundwater hydrographs for 19 bores and GRACE data in the state of Victoria, after Fowler et al. (2020a). (b) Water balance conceptualisation for unconfined aquifers in headwater catchments.
3.3.1 Sustained local groundwater drainage from hillslopes
Multi-year water table declines in response to the Millennium Drought imply that the depleting fluxes of the groundwater water balance (see Fig. 4b) are less sensitive to the multi-year dry conditions than additive fluxes. This HPE explains the depletion of groundwater by sustained underground drainage from hillslopes to local low points in the landscape (e.g. base of slope and valley bottoms). These low points often contain deposits of alluvium (river deposits) and/or colluvium (unconsolidated sediments deposited at the base of hillslopes by gravity). Separate treatment of hillslope and alluvial aquifers has precedent in local groundwater–surface water studies such as the salinity-focussed rainfall–runoff modelling by Stenson et al. (2011), in addition to modelling in Africa undertaken by Hulsman et al. (2021a), albeit at a larger scale. According to this HPE, the alluvial/colluvial deposits receive the drained water, and then evaporation and transpiration within these deposits keep the water table below the surface and ensure that much of this drainage does not contribute to streamflow. This drainage is hypothesised to occur continuously throughout the pre-drought, drought, and post-drought periods. During pre-drought, the drainage was balanced by higher recharge, meaning that the water table in hillslopes was closer to the surface. This earlier shallow groundwater facilitated runoff processes in hillslopes that were subsequently diminished when the water table dropped, contributing to the hydrological shifts. During the drought, recharge declined, while, according to this HPE, the drainage was assumed to be more sustained, resulting in lower groundwater heads particularly in hillslopes. The plausibility of this HPE assumes that lateral aquifer transmissivity does not decline so much with lower head as to shut off the lateral drainage from the hillslopes. Thus, this HPE depends on the presence of (i) geological strata that support the sustained drainage (e.g. deeply fractured rock; Rempe and Dietrich, 2018) and (ii) colluvial/alluvial deposits (flat valley bottoms; not erosional/v-shaped). HPE16: streamflow was lower than expected because water slowly drained from hillslopes (contributing to water table decline and reduced GW–SW interaction) to nearby alluvial areas and was subsequently lost via evapotranspiration.
3.3.2 Groundwater export across catchment boundaries
Whereas the previous HPE assumed drainage within a catchment, we can also hypothesise drainage crossing boundaries of surface water catchments as part of a regional flow system (e.g. Bouaziz et al., 2018; Condon et al., 2020; Hulsman et al., 2021b; Fowler et al., 2020a) and flowing inland or, alternatively, discharging to the ocean. Such regional systems are also known as mountain block recharge but in this case are associated with hills rather than mountains. Where such systems exist, it is likely that shallower and deeper groundwater flow paths co-exist together (e.g. Frisbee et al., 2012; Condon et al., 2020), associated with local and intermediate/regional groundwater systems, respectively. According to this HPE, regional drainage is hypothesised to occur continuously throughout the pre-drought, drought, and post-drought periods, with the drought bringing changes in the balance with other elements of the water balance in Fig. 4b. HPE17: streamflow was lower than expected because sustained drainage of groundwater across catchment boundaries contributed to declines in the water table and reduced GW–SW interaction. We note that, in the context of headwater catchments, the distinction between local and regional drainage is important because (i) regional discharge cannot support within-catchment wetting up, which would otherwise amplify event runoff, and (ii) at the point of discharge, groundwater discharge may be an important control on AET, so the distinction affects the appearance of a headwater catchment in remotely sensed data. Both (i) and (ii) affect how the catchment might be represented in simulation models.
A further distinction is that groundwater systems vary in their response times to disturbance. In southeastern Australia, groundwater systems which cover larger areas tend to have longer response times (Walker et al., 2003). Locations that are influenced by a combination of two or more systems may be subject to a mixture of dominant timescales – say, a 1–5-year timescale associated with a local system mixed with a 10–30-year timescale associated with a larger system. Likewise, drought recovery may be a question of the relative influence of shorter and longer timescale groundwater systems.
3.3.3 Gaining and losing streams
Even if rainfall–runoff relationships remained unchanged (i.e. no shift) within lower-order catchments, flow within higher-order stream reaches can be lost as it travels downstream, via seepage into the surrounding substrate. This is called a losing stream reach, in contrast to a gaining reach in which the stream receives water. The losing/gaining dynamic is driven by the stream level relative to the groundwater level in the surrounding substrate. This dynamic may be important in cases where the river flows over extensive alluvial deposits, since (i) these deposits can store significant amounts of water, and (ii) they commonly have relatively high hydraulic conductivity, which may assist in dispersing the water horizontally over the extent of the deposit, creating opportunities for transpiration or evaporation (e.g. Salama et al., 1993). Reaches can change from gaining to losing state, and vice versa (often associated with seasonal cycles), and they experience a net gain or loss while in a given state – a key point of difference with bank storage, which functions as a delaying process (instead of a source/sink term) as water flows into and then back out of stream banks as gradients switch back and forth episodically. Losing/gaining dynamics could have contributed to the observed shifts at stream gauges. The regional groundwater declines could have affected the spatiotemporal extent of losing reaches (i.e. greater total length losing; greater time spent losing rather than gaining), amplified water loss rates from streams, and increased the number of zero flow days. HPE18: streamflow was lower than expected because stream reaches lost more water (or gained less water) due to water table decline. Note that, while losses are sensitive to the water table, the reverse is also true, with losses from the stream causing the water table to decline less slowly than it would otherwise (subject to other fluxes such as evaporation and transpiration from the alluvium). The strength of this feedback/coupling increases for smaller alluvial stores.
3.3.4 Thickened vadose zone: effect on recharge dynamics and transpiration
Regardless of the cause of the water table decline, the result was a thicker vadose (unsaturated) zone as the groundwater subsided, leaving behind newly unsaturated layers. This HPE is concerned with the rate at which these layers drain from saturation to field capacity. Well-drained near-surface soils are generally considered to drain quickly, of the order of days (e.g. Cassel and Nielsen, 1986). However, drainage may be slower for deeper layers (particularly those composed primarily of bedrock), possibly associated with spatially discontinuous preferential flow mechanisms including funnelled flow (e.g. Nimmo, 2021) and unstable flow (e.g. Jury et al., 2003). These deeper unsaturated layers might temporarily absorb some recharge, delaying its passage downwards to saturated zones and spreading the recharge signal over time. Whereas a rapid recharge event might trigger rapid groundwater discharge to the stream, the dampening of the recharge signal might increase the probability of water being diverted to transpiration (particularly by vegetation close to water courses and drainage lines) that would have otherwise contributed to streamflow, thus increasing transpiration per unit precipitation. HPE19: streamflow was lower than expected because delaying of recharge by the enlarged unsaturated zone increased opportunities for transpiration.
3.3.5 Changes in soil properties and/or structure with time
Soils may change properties with time, and some drought-related changes may decrease streamflow. While many soil properties and temporal changes are driven by humans (discussed below in HPE21), there are other mechanisms that are not explicitly human-driven, although they may interact with land management. For example, soil cracking may lead to increased infiltration, more evaporation, and less surface runoff (e.g. Arnold et al., 2005), provided the infiltrated water remains in the soil rather than recharging groundwater. There is also evidence that soil porosity may increase, as the climate becomes drier, on relatively short timescales of years to decades (Hirmas et al., 2018; Caplan et al., 2019). HPE20: streamflow was lower than expected because drought-induced changes in soil properties such as higher porosity and/or cracking led to higher infiltration and evaporation. On the other hand, soil water repellency can build up during dry periods (e.g. Filipović, 2018), which would tend to increase streamflow, which is counter to observations; likewise, soil cracking may provide an avenue for preferential flow, thus increasing runoff (e.g. Beven and Germann, 1982).
3.4 Anthropogenic factors
3.4.1 Changes in agricultural practices
The last 50 years have seen changes in land management practices, and the hydrological impacts of these changes may be important. Soil loss around Australia in the 1960s and 1970s prompted a nationwide evaluation of land degradation and soil conservation strategies in the 1970s, in addition to a National Soil Conservation Program, established in 1983 (Hannam, 2003). As a result, soil conservation measures such as no-till farming (e.g. Cornish et al., 2020) were more prevalent by the 1990s than in previous decades, which may have caused hydrological differences (see e.g. Huang and Zhang, 2004) between the Millennium Drought and previous droughts. In general, poor management practices lead to degraded soils that may amplify event runoff, with partial soil recovery (towards, e.g., higher soil carbon) possibly causing trends towards higher infiltration. Techniques such as contour banks may also retain water in the landscape. Last, soil properties were impacted by trends in livestock stocking rates driven by both market forces and government policy. HPE21: streamflow was lower than expected because better management of agricultural land, including soil conservation techniques, caused differences in soil hydraulic properties (compared to previous droughts).
3.4.2 Land use change and plantation forestry
Land use change is commonly reported to alter hydrology (e.g. Zhang et al., 2001; Brown et al., 2005; Zhang and Schilling, 2006; Farley et al., 2005). In southeastern Australia, a key example is new plantation forestry, with the higher water demand of plantation trees impacting groundwater (Benyon and Doody, 2004; Lane et al., 2005; Webb and Kathuria, 2012; Brown et al., 2015; Dresel et al., 2018) and presumably streamflow. Plantation data (Legg et al., 2021) show a peak in nationwide plantations in the late 1990s, with approximately 100 000 ha yr−1 added for 1998–2000 and much of it within the area impacted by the Millennium Drought (Legg et al., 2021; Table 1). HPE22: streamflow was lower than expected because increased plantation forestry led to increased water use. The 1970s–1990s also saw planting for salinity mitigation (see HPE13).
3.4.3 Farm dams
Farm dams, also known as farm ponds, are small private dams located on hillsides, drainage lines, or small streams. Individual dams typically harvest only small volumes, but collectively, the impact can be large (Habets et al., 2018; Morden et al., 2021). Thus, the total water storage capacity of all dams in a watershed may be an important index, particularly when relativised by precipitation or streamflow to account for aridity; that is, a given storage size may have a higher relative impact in drier areas (e.g. Liu et al., 2014). Volumetrically, water harvesting by farm dams is greatest during moderate and high flows, but if expressed in relative terms, impacts are greatest during the dry season and during dry years (Morden et al., 2021). Flow impacts occur due to both extracted water (for stock, domestic, or irrigation use) and evaporated water being unavailable to flow downstream. Farm dam development has increased with time (with a higher rate of increase before 2000; Malerba et al., 2021), so there were more dams during the Millennium Drought than previous droughts. HPE23: streamflow was lower than expected because farm dam harvesting of water increased due to trends in farm dam development (i.e. more dams than prior droughts).
3.4.4 Extractions
Regionally, the bulk of agricultural water use occurs in broad, flat plains using water captured in large reservoirs. This activity occurs downstream of the headwater catchments in focus here. However, minor modes of extraction are relevant in the headwater catchments, including extractions from groundwater and diversions from streams by individual landholders. For the set of catchments used by Peterson et al. (2021) and shown in Fig. 2, individual diversions from streams are uncommon because they were considered to be a criterion in catchment selection, and where they do exist, they are strictly controlled. Extractions from groundwater can be relatively larger than those from streams within some of these catchments and are of interest, given the strong groundwater trends reported above. Most extraction bores are for stock and domestic use. However, licenses for irrigation, while rarer, typically correspond to larger volumes and thus may be significant. HPE24: streamflow was lower than expected because groundwater extraction caused declines in groundwater levels and reduced GW–SW interaction.
3.5 Interaction between process explanations
The set of HPEs are mostly complementary, meaning there is no inherent reason precluding co-occurrence of multiple HPEs simultaneously in the same catchment. Some HPEs exhibit dependence, such as HPE15 (gaining to losing), which assumes a regional groundwater decline a priori and thus is dependent on a separate explanation for the decline via one of the other HPEs. Likewise, HPE19 amplifies effects of other mechanisms. HPEs 10 and 11 (relating to tree regulation of water use) and 12 (relating to wildfire) are in a unique category; they posit mechanisms that may have masked underlying shifts, rather than mechanisms of the shifts themselves. Such HPEs may be important to explain spatial patterns in hydrological shifts. Overall, assuming that the evidence tests in the next section do not eliminate too many HPEs, the complementary nature of the HPEs seems to indicate that we should expect a combination of process explanations, rather than a single smoking gun.
As per Fig. 1, the purpose of this section is to decide which hypothesised process explanations are plausible or more likely, based on consideration of diagnostic evidence. This section is subdivided as follows: Sect. 4.1 explains the logic of evaluation, Sect. 4.2 presents the diagnostic evidence, assesses the implications for HPEs, and compares findings with previous literature, Sect. 4.3 attempts to harmonise the plausible HPEs to provide an integrated picture of catchment behaviour, and Sect. 4.4 discusses the limitations of the deductive method used.
4.1 Logic of evaluation
There are four ways in which HPEs are assessed for consistency with the evidence, and these are denoted with symbols (∇; △; ♢; □), as indicated below. While in principle it would be preferable that any HPE declared plausible would be assessed in all of these ways, in practice it is often impossible to do so due to lack of data, particularly when going back in time.
-
Temporal consistency (∇). The focus is on comparing droughts across time, focussing on the Millennium Drought and prior droughts. Since prior droughts set our expectations for what flow to expect in a dry year, there must be something different about the Millennium Drought that caused the streamflow to be lower than expected (in those catchments that shifted). Those droughts that occurred before streamflow gauging commenced have not contributed to our expectations of what flow is normal in a drought year. Thus, the prior droughts under consideration are those that occurred after a subjectively selected date (1 January 1950) that nominally represents the start of streamflow gauging. The year 1950 is chosen because less than 20 % of streamflow gauges were operational at that time (Fig. 6); hence, results from studies such as Saft et al. (2015) and Peterson et al. (2021) were dominated by post-1950 data.
-
Spatial consistency (Δ). The focus is on the spatial distribution of the hypothesised driving factor(s). To support the hypothesis, the spatial distribution of the driving factor should be consistent with the spatial distribution of shifted versus unshifted catchments. For example, the spatial distribution of radiation increases during the Millennium Drought (Fig. C1) across the southern state of Victoria broadly matches the spatial distribution of shifted catchments, lending credence to HPE07.
-
Water balance considerations (♢). The focus is on whether the hypothesised driving factor is sufficient to reduce flow volumes by the observed amount. This criterion is less critical because the observed flow reductions may have been the combined result of multiple HPEs (in which case no single HPE would cause sufficient reductions on its own).
-
Drought recovery (□). The focus is on whether the hypothesis can explain the lack of post-drought recovery in most of the catchments that shifted (Fig. 2d). As per Peterson et al. (2021),
Across all 161 watersheds, we found that 8 years into the drought, 51 % of watersheds switched into a low (or very low) runoff state. When the drought ended in 2010, predominantly only the eastern watersheds shifted back to a normal-runoff state. Notably, 7 years after the drought, 37 % (n= 55) of watersheds remained within a low-runoff state.
Two different spatial scales are considered in the following section. When assessing changes in climatic variables, we consider the entire area affected by the Millennium Drought, consistent with earlier consideration of climatic variables (Fig. 3). However, for all other assessments, we concentrate on the southern state of Victoria (2.3×10⁵ km2; Fig. 2d), for the following three reasons:
-
Existing analyses of hydrological shifts. At the scale of Victoria, there are two recent studies (Peterson et al., 2021; Saft et al., 2019) that examine hydrological shifts using every suitable streamflow gauge and using data up to 2017. In contrast, at the wider scale, the only available study (Saft et al., 2015) examined a dataset with a lower density of spatial coverage and using data only up to 2008, which is sufficient to assess impacts during the drought but not afterwards.
-
Data availability. Certain datasets, for example, farm dams (Fig. 8d), are available in a homogenous dataset across Victoria, but such data were not available in New South Wales and Queensland at the time of analysis.
-
Spatial patterns of impact. As shown in Fig. 2, Victoria has the clearest spatial groupings of shifted versus non-shifted catchments, with the latter dominating in the east and the former dominating in the west. These groupings arise despite considerable similarities between east and west. For example, the streamflow regime is winter dominant in both cases. Starting the process of explaining the shift in Victoria, where we at least see some spatial organisation of shifted/non-shifted catchments, makes sense. Later work needs to extend this to the other states.
4.2 Evaluation of diagnostic evidence
The evaluation of individual HPEs is undertaken in Table 2, based on the variety of diagnostic evidence presented in Figs. 5–8. Of the 24 HPEs, 3 are considered plausible, 10 are considered inconsistent with evidence, and 11 are in a category in-between, denoting HPEs that may be important, but their widespread plausibility or applicability is questioned by factors such as (i) limited spatial extent, (ii) limited water balance impact, and (iii) limited ability to explain post-drought non-recovery in rainfall–runoff relationship.
The three plausible HPEs (green in Table 2) are as follows:
-
HPE05 – long drought
-
HPE16 – sustained hillslope drainage
-
HPE19 – interactions between recharge and thickened vadose zone.
The 11 HPEs in the in-between category (amber in Table 2), along with the factors comprising their widespread plausibility or applicability, are listed below.
-
HPE04 – evaporative demand (factors are limited spatial extent and lack of continuity post-drought)
-
HPE06 – greening (factors are uncertainty regarding direction/magnitude of greening impact on transpiration)
-
HPE07 – coupling and radiation/temperature (factors are limited spatial extent and lack of continuity post-drought)
-
HPE10 – tree regulation of water use (stomatal control; factors are drought VPD anomalies that are not exceptional)
-
HPE11 – tree regulation of water use (other; factors are uncertainty regarding persistence of effects post-drought)
-
HPE13 – salinity recovery (factors are spatial extent not sufficient within study catchments)
-
HPE15 – biophysical adaptation (factors are only evidence that is hydrological; ecophysiological evidence is lacking)
-
HPE17 – sustained regional drainage (factors are spatial mismatch between groundwater systems and shifted catchments)
-
HPE18 – gaining to losing (factors are spatial mismatch between groundwater systems and shifted catchments and uncertainty regarding persistence of effects post-drought)
-
HPE20 – soil property changes (factors are lack of local evidence)
-
HPE21 – agricultural practices (factors are little or no data available regarding hydrological impacts)
-
HPE23 – farm dams (factors are dams are not sufficiently numerous or voluminous to cause observed hydrological impacts).
Table 2Assessment of hypothesised process explanations (HPEs), evaluating consistency with evidence.


Figure 5Changes compared to the long-term average (1950–2017) for (i) the Millennium Drought and (ii) prior droughts (selected from the period 1950–1996, inclusive), allowing HPEs to be assessed by temporal consistency. Variables and definitions are the same as in Fig. 3. Prior droughts refer to a set of years chosen separately for each catchment from the period 1950–1996. Years are selected if their rainfall was less than the average over the Millennium Drought (1997–2009). If this selects more than one-quarter of years in the period 1950–1996, then the selection is limited to the driest quartile (12 years). This selection process chooses a different number of years for each catchment, as shown in Fig. E1. Line α-α' is mentioned in Table 2.
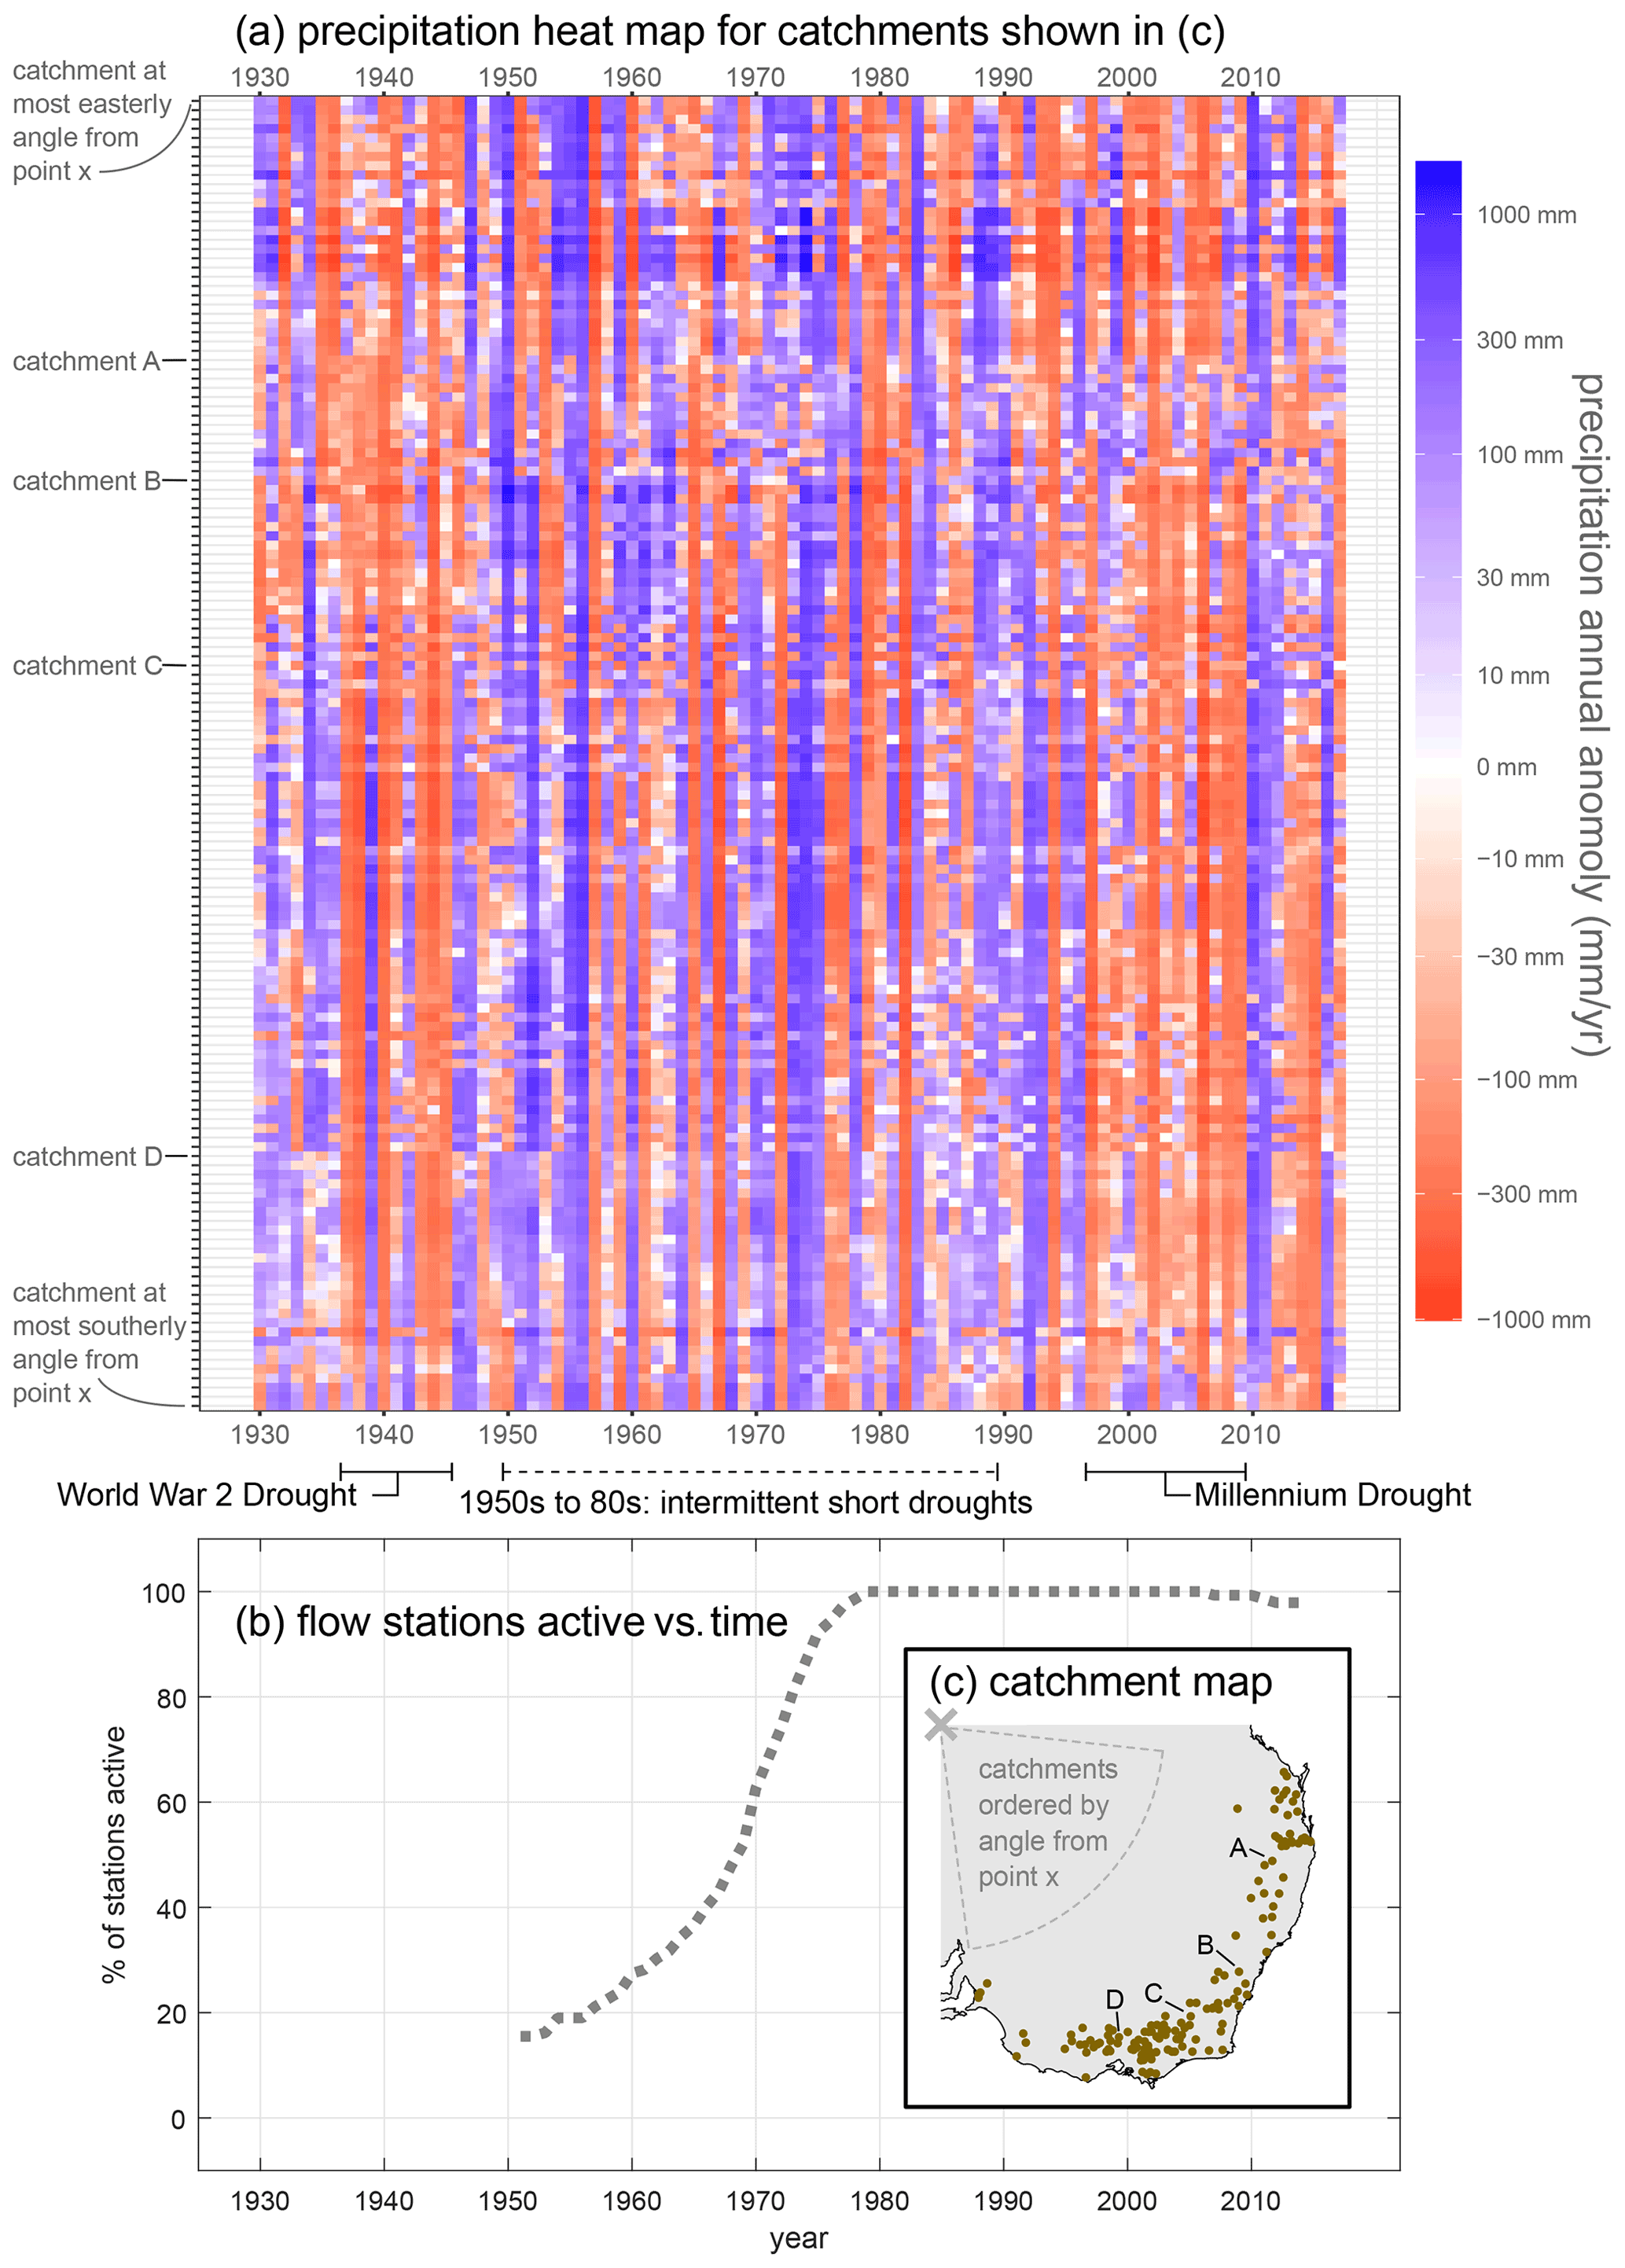
Figure 6(a, c) Visualisation of the longer duration of the Millennium Drought and World War II Drought, compared to other droughts in the 1950s–1980s, by showing anomalies in annual precipitation. (b) Flow gauging coverage through time. Precipitation and flow data are sourced from Fowler et al. (2020a).

Figure 7Maps of the state of Victoria, showing various attributes used to assess HPEs by their spatial consistency. Each map is shown with 156 catchments categorised by Saft et al. (2019). Note that a given location in space can be marked with more than one Saft et al. (2019) category due to nestedness (i.e. if it is upstream of two gauges in different categories). Data sources are listed in Table A1.
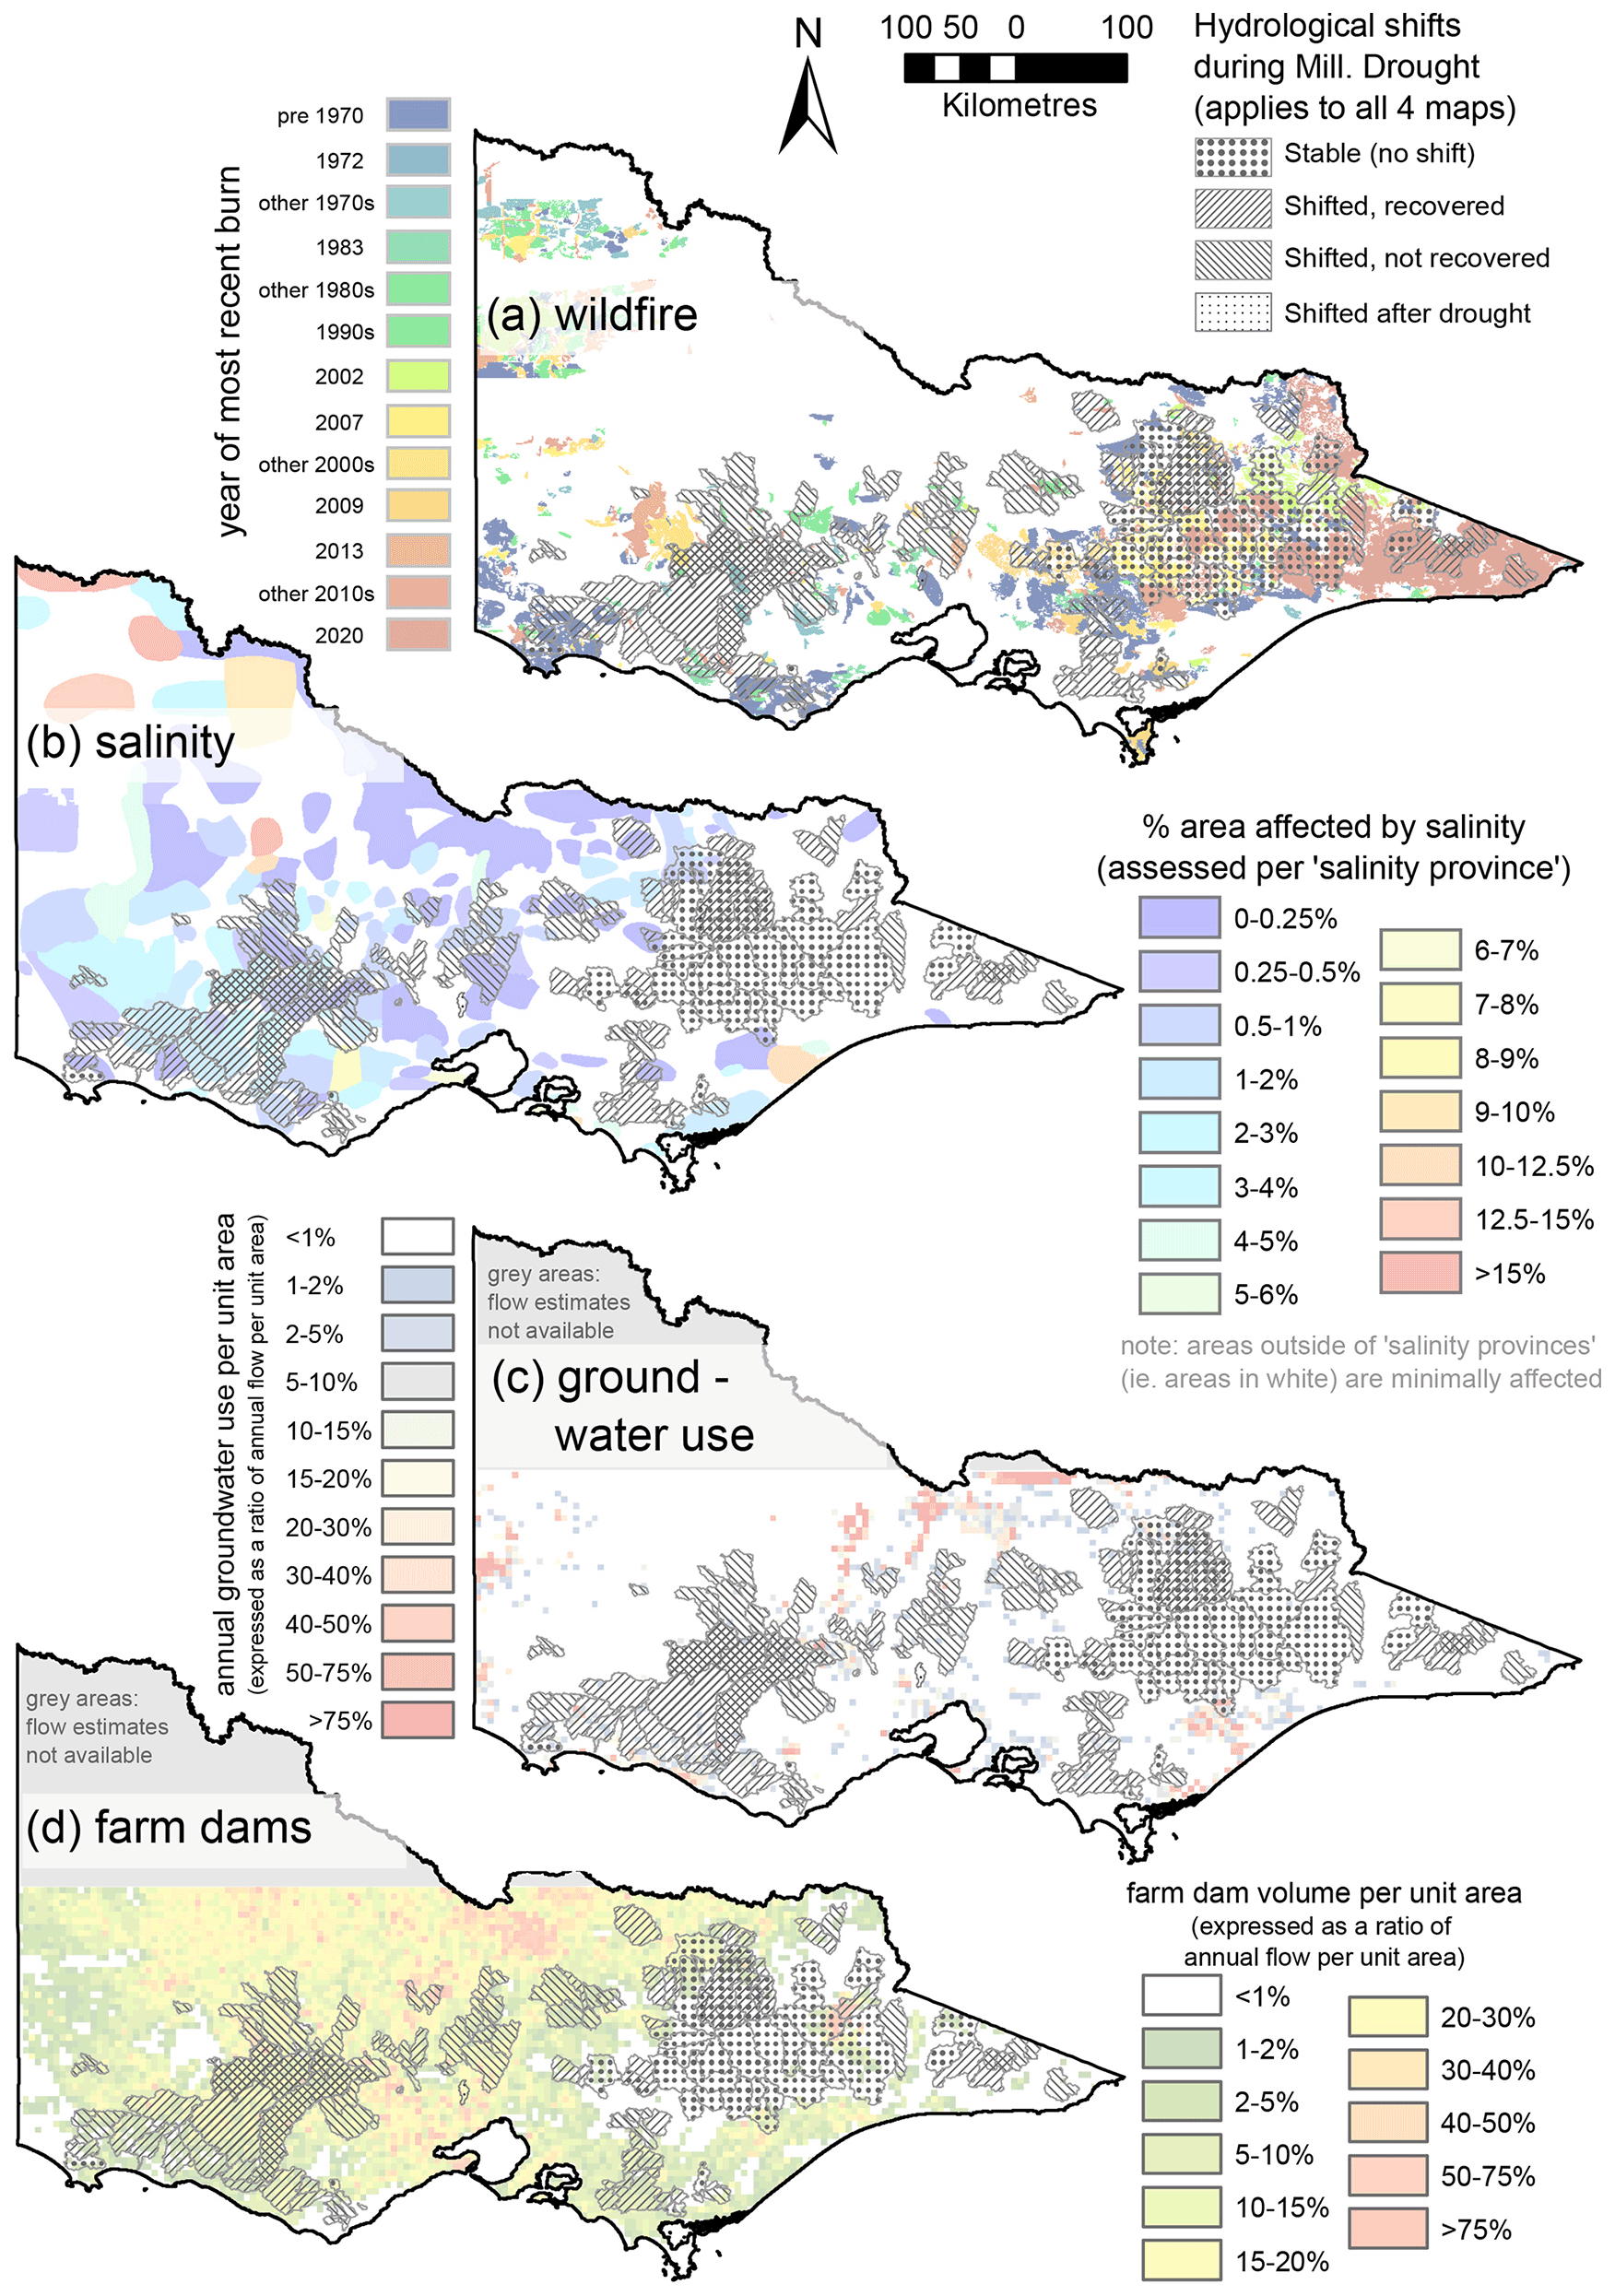
Figure 8Similar to Fig. 7 but mapping different variables. Relativisation by annual flow for panels (c) and (d) uses areal flow estimates from Weligamage et al. (2021). Other data sources are listed in Table A1.
4.3 Harmonising plausible process explanations
This subsection seeks to combine the plausible process explanations into an integrated picture of landscape-scale hydrological response. The following description, depicted visually in Figs. 9 and 10, incorporates process explanations marked with green or yellow in Table 2. Given the focus of Sect. 4.2 on evidence from the southern state of Victoria, the following applies to the same area, although many elements may apply to other affected areas.
Concerning climatic conditions, the following two things distinguish the Millennium Drought from prior droughts post-1950:
-
Longer drought. The drought lasted more than 10 years (Fig. 6; HPE05), allowing long-memory aspects of catchment behaviour to become important, as discussed below.
-
Evaporative demand increases. Over a significant area in central-west Victoria, the evaporative demand increased, particularly during spring (Fig. 5c; HPE04). This increase was higher than increases seen in prior droughts (post-1950) and was driven by higher radiation. The affected area matches very closely with regional patterns of shifting versus not shifting. Given that the area is majority pasture, the nature of the increase contributed to its hydrologic impact, since grasslands are relatively less sensitive to atmospheric VPD and relatively more sensitive to radiation (see HPE07). Last, the time of year (spring, when soils are wettest) likely maximised the impact on the water balance.
Other aspects of climatic conditions, such as autumn rainfall reductions, fewer large rainfall events, and longer dry spells (HPEs 1, 2, and 3, respectively), likely contributed to the lower streamflow but are considered less explanatory of the shifting behaviour. This is because these aspects were no worse, and in some cases considerably less severe, than other drought years post-1950. However, the effect of these aspects may have been amplified due to (i) the unusual duration of the drought and (ii) the fact they were happening in concert with (and contributing to) an interannual drop in water storage (negative water balance). Thus, while none of HPE1-3 are marked as explanatory in their own right, they may still be important pieces of the water balance puzzle.
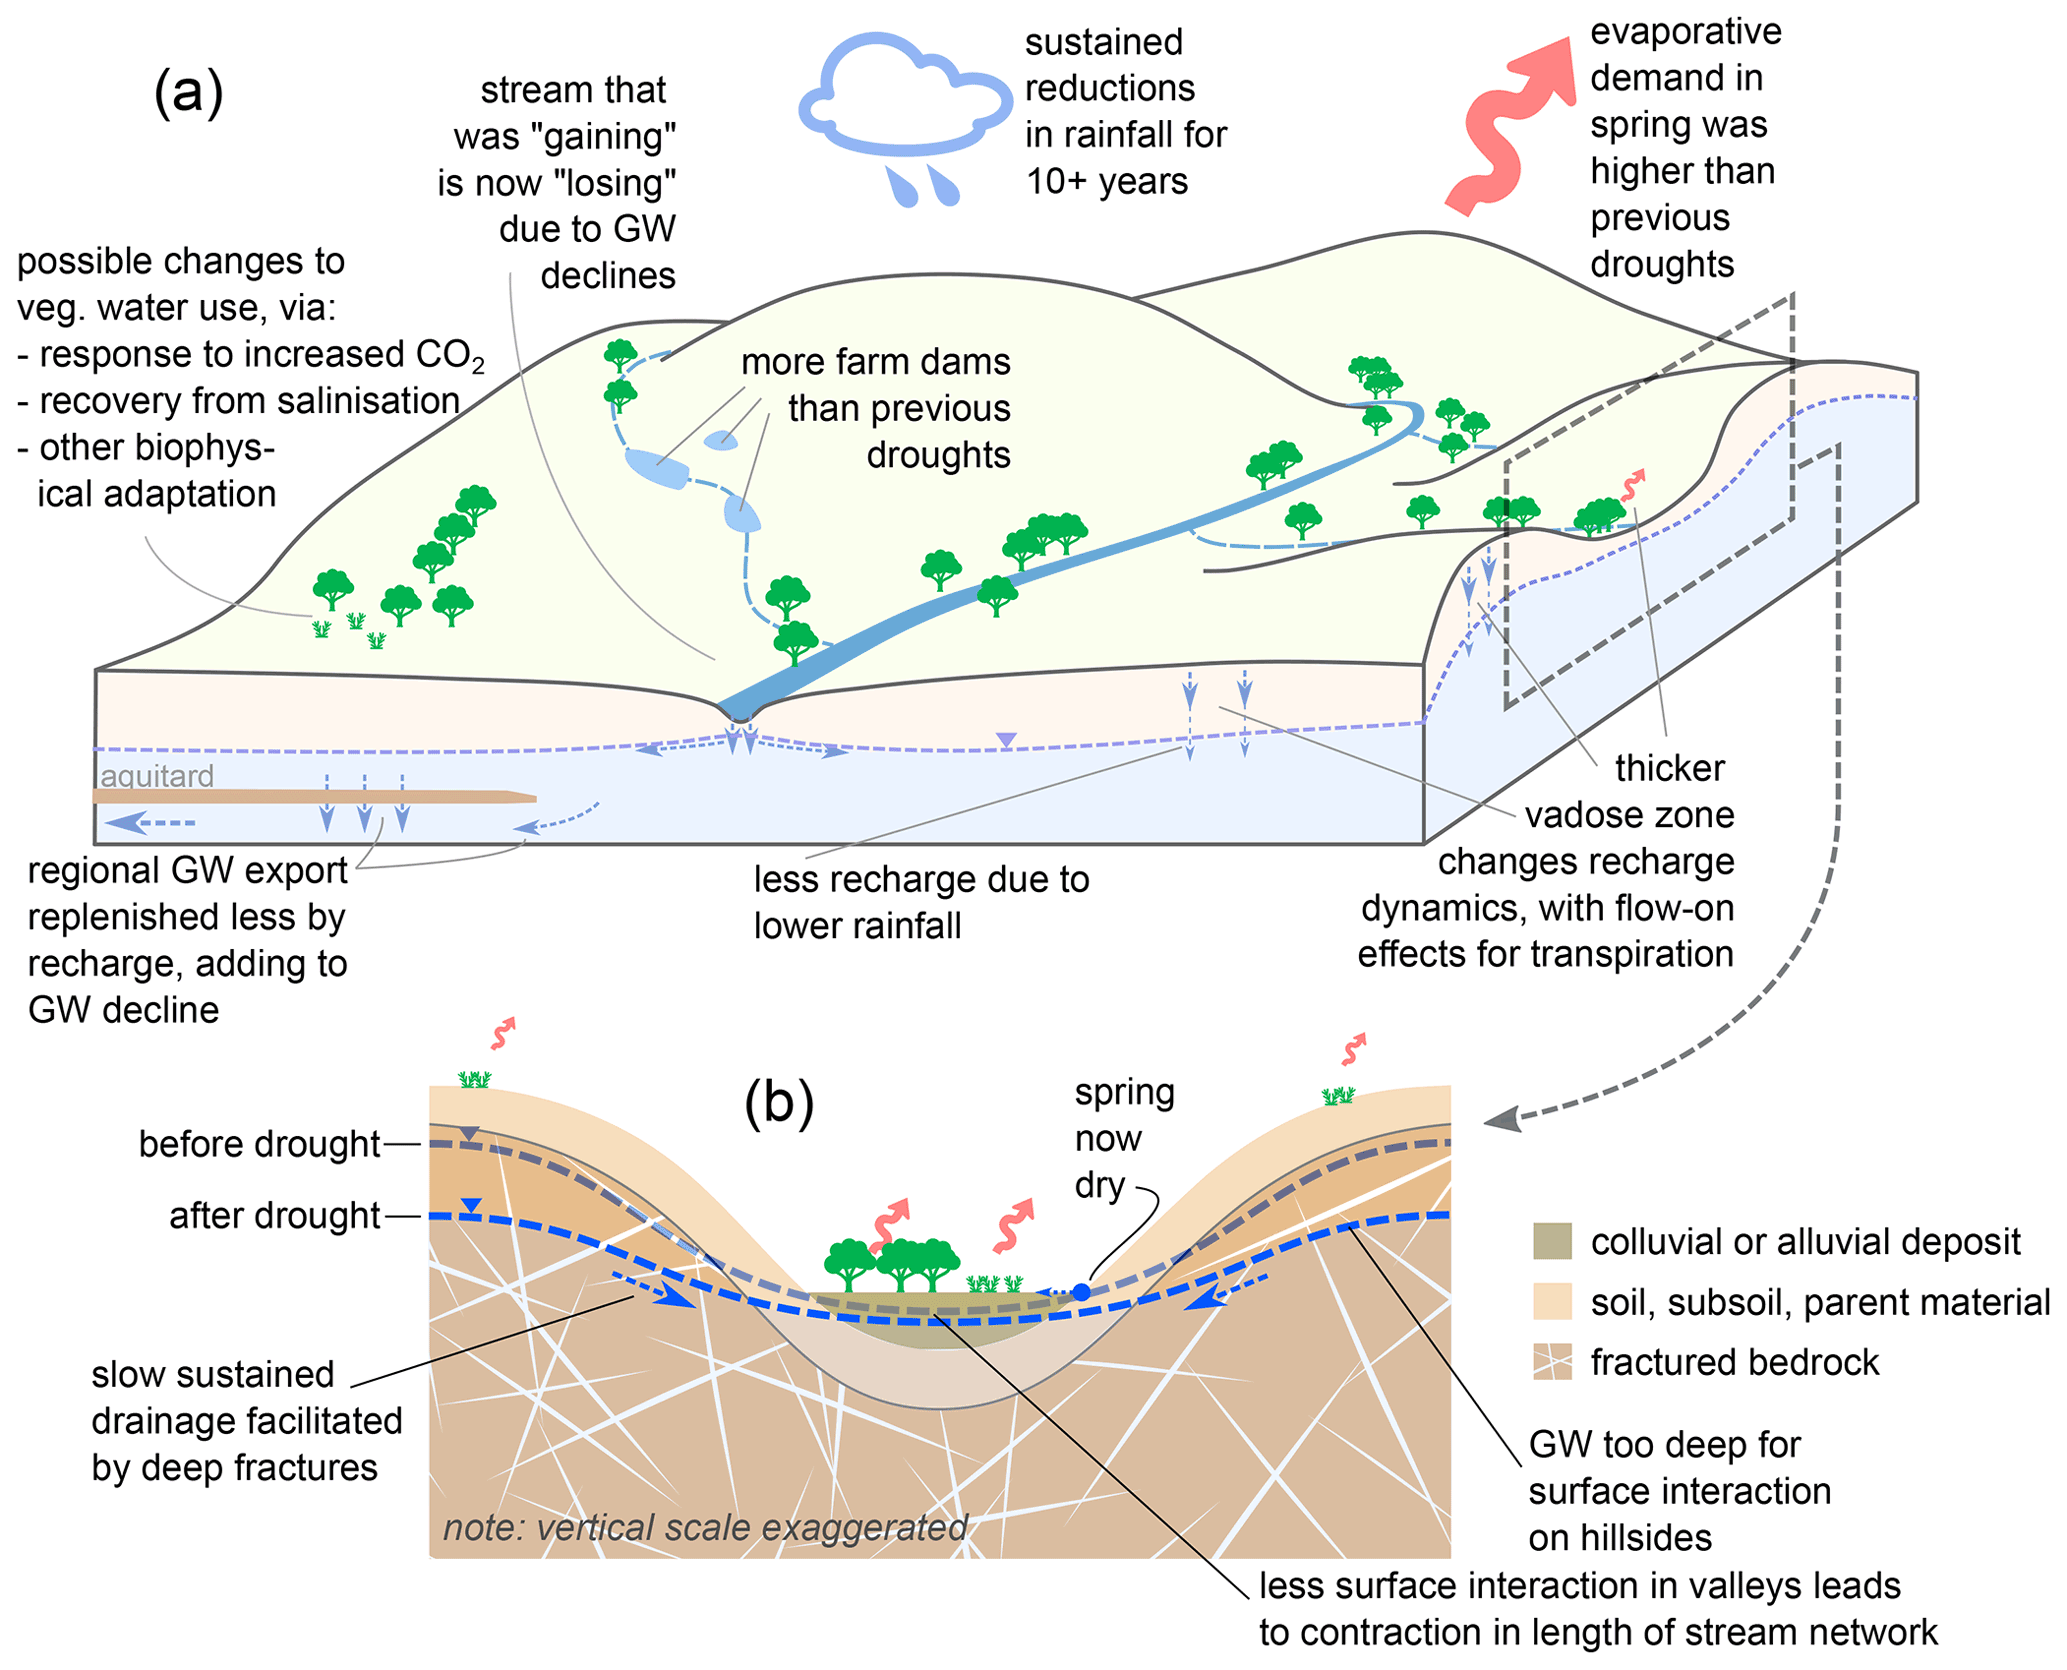
Figure 9Visual synthesis of selected process explanations explaining why the Millennium Drought had less streamflow than expected, relative to prior droughts (post-1950; these droughts were too short for significant groundwater decline). The situation depicted describes a typical catchment in central or western Victoria.

Figure 10Chain of causality from cause (top) to effect (bottom) for plausible hypothesised process explanations. Pure causes are at the top and pure effects are at the bottom, while those in-between are a mixture (i.e. effects of some things and causes of others).
In the combined perceptual model presented in Figs. 9 and 10, the lower water table is a key driver of lower streamflow. This is because groundwater is integral to flow generation in headwater catchments via numerous mechanisms (Fig. 10). On hillslopes, groundwater declines reduce episodic saturation of high conductivity near-surface layers and/or transient perched water tables. In broad colluvial and alluvial valley bottoms, water table declines reduce flow in springs and diffuse-area discharge. Shallow groundwater creates wet areas in the landscape primed for event runoff, but such areas contract under water table decline. Thus, it is hypothesised that the unexpectedly low streamflow was in large part due to the declining water table, which was itself caused by the following:
-
Recharge reductions. Recharge reduced partly due to rainfall declines and also due to increased evapotranspiration resulting from higher evaporative demand (HPE04) and possibly other changes associated with vegetation (HPEs 7, 13, and 15).
-
Sustained removal of groundwater via multiple fluxes. The fluxes removing groundwater were less sensitive to the climatic conditions, and quite sustained (Fig. 4b). These fluxes included the following:
- a.
Local (within-catchment) drainage (HPE16) from hillslopes to the base of slopes and valley bottoms (Fig. 9b) via deep fractures in the bedrock. Having drained via the subsurface to colluvial or alluvial valley floors where the water table is shallower (Fig. 9b), this water can then be removed by transpiration or direct soil evaporation, which also helps to explain the increase in AET per unit of precipitation emphasised by Peterson et al. (2021). According to this HPE, most of the groundwater decline takes place in the hillslopes, which are capable of slow but significant drainage due to, for example, fractured rock aquifers, which are widespread in those parts of Victoria that contain shifted catchments. Likewise, colluvial and alluvial deposits (refer to HPE16 in Table 2) are more common in shifted catchments, whereas non-shifting catchments tend to be erosional with v-shaped valleys (Gallant and Dowling, 2003; CSIRO, 2016).
- b.
Drainage into regional groundwater systems (HPE17; Fig. 9a; commonly known as mountain recharge) which may export the groundwater outside of the boundary of the surface water catchment. The spatial applicability of this export mechanism is lower because approximately one-third of shifted catchments are located away from regional systems (see HPE17 in Table 2 and Fig. 7d).
- a.
It is important to recognise that drainage in (a) and (b) above were not activated by the drought, but rather are hypothesised to be continuous, and the drought acted to change the balance that previously existed between these combined fluxes and recharge.
As groundwater drained, the thicker vadose zone potentially acted to delay recharge and spread it over time, increasing opportunities for transpiration, particularly near water courses and drainage lines (HPE16).
Furthermore, streamflow generated at the micro-catchment scale was likely susceptible to losses within downstream reaches. Lowland reaches which previously seasonally gained groundwater may now lose groundwater year-round (HPE18), with the potential for subsequent removal from the alluvial store via AET. Water stored in river banks, which is gradually released on timescales up to a few years and thus capable of sustaining low flows over an isolated dry year, became more permanently depleted.
Last, anthropogenic factors also likely impacted the hydrological shifts. The increase in farm dam development with time meant that the Millennium Drought saw greater farm dam harvesting of water than previous droughts (HPE23); however, the magnitude of this impact is uncertain. Furthermore, the period prior to the drought saw improvements in land management that may have resulted in less degraded soils (e.g. greater soil carbon) that were better able to retain water, even with less rainfall partitioned towards event runoff or recharge.
All of the above mechanisms, except those related to climate, display some degree of persistence (see items labelled with an asterisk in Fig. 10), and this may explain the persistent non-recovery that has been reported (Peterson et al., 2021) in some areas. In particular, groundwater-related mechanisms would persist until the recovery of the water table to pre-drought levels. This is likely to be spatially uneven, as different groundwater systems have different lag times and dynamics. Thus, a possible research avenue might be to compare perceived lag times (based on hydrogeological knowledge) with observed recovery of streamflow response.
Most mountainous study catchments in Victoria did not exhibit hydrologic shifts, and this may be explained by the absence of the above mechanisms in those catchments, as follows:
-
Such catchments tend to have erosional v-shaped valleys; flat valleys arising from colluvial or alluvial deposits are relatively rarer (CSIRO, 2016), as are aquifers large enough to receive significant seepage from a losing reach.
-
Regional groundwater flow systems are typically less common in such catchments (Fig. 7d).
-
Salinity impacts were relatively low (or absent) in such catchments (Fig. 8b).
-
Farm dam development is very low (or absent) in such catchments (Fig. 8d).
-
Spring PET increases neither affected such catchments nor the catchments further north in New South Wales and Queensland (Fig. 5d).
In addition, mountainous catchments are mostly forested (Fig. 7a and c), and some trees have mechanisms for reducing water use in times of water stress, such as temporary xylem cavitation and reducing leaf area (see Sect. 3.2.3). Tree water use is very sensitive to VPD and may steeply decline in times of high VPD. Such mechanisms, which alter partitioning within the water balance, may have contributed to the lack of shifting behaviour in forested catchments. Post-drought, uniformly high VPD across southeastern Australia (Fig. D7) may likewise be contributing to a lack of hydrological shifts in forested catchments, as trees regulate water use via stomatal control. Last, while some research has examined the impact of rising CO2 on streamflow (Ukkola et al., 2016), this prior work focussed exclusively on forested catchments, whereas the hydrological shifts were associated with grasslands. It is possible that greening contributed to reduced streamflow in such catchments (HPE06), but historic greening effects in southeastern Australian grasslands are currently a knowledge gap.
4.4 Limitations of deductive procedure used
Despite the varied methods of assessment and wide variety of evidence considered, there are nonetheless clear limitations in the deductive procedures adopted here. First, it is possible that mechanisms for changes in the rainfall–runoff relationships have been missed by the workshop participants, or that we are not aware of the importance of certain factors or their interactions (Hunt and Welter, 2010). While this study focuses on identifying individual common or frequently applicable mechanisms, in reality, different causes can act together and in different proportions in different landscapes, possibly leading to unexpected outcomes or to the same mechanism/interaction producing different outcomes in different landscapes. In cases of two competing processes, merely conceptualising interactions (as here) is often not sufficient, but it is necessary to also quantify the interactions (e.g. via simulation) to be able to guess at what the outcome might be. Such quantification is a key recommendation as a next step to this work (see the recommendations in Sect. 5).
The assessment methods are each rather blunt because they rely on generalisations and the assessment of large-scale patterns in either space, time, or both. This contrasts with common field methods for deducing hydrological processes at-site, which may rely on techniques such as hydrogeochemistry, tracers, etc. Such techniques provide individualised insight for a given catchment, in line with the concept of uniqueness of place (Beven, 2000), i.e., that each catchment is subject to distinctive hydrological processes. Furthermore, the results of such individual studies may be more directly relatable to hydrological processes. Although these benefits are not present in the methods used here, the strength of this work is a large-scale assessment of hydrologic changes and potential drivers. The landscape-scale patterns of hydrological shifts (e.g. Fig. 2; Saft et al., 2015; Peterson et al., 2021) require corresponding landscape-scale methods of evaluation. Experimental studies are difficult to conduct over large areas and/or large samples of catchments, and it is difficult to generalise regional impacts from individual field studies. In any case, the Millennium Drought is now in the past, so it is not possible to conduct experimental studies to directly confirm or refute hydrological hypotheses related to this event.
Nonetheless, the current study may be used as a prelude to planning more extensive field studies (and/or modelling studies) to test predictions of hypotheses in the present time. It may be possible via new experimental studies to gain insights that are transferable backwards in time to past droughts, and this is discussed further in Sect. 5. In summary, although the methods used here are subject to clear limitations, they are arguably suited to the present context.
As per Fig. 1, the key question of this section is what future research and/or monitoring is required to decide between and/or harmonise the plausible process explanations? Given the dominance of complementary HPEs (Sect. 3.5), it seems unnecessary to decide between those remaining (since they can occur together), although it is still desirable to investigate and confirm their relevance. The set of plausible process explanations is dominated by subsurface processes, so an overarching theme is that we need to better understand the role of groundwater directly and indirectly in streamflow generation, including indirect interactions with plant water use and the effect of multi-year declines in groundwater level. It follows that the main monitoring need is for long-term (10+-year) monitoring programmes of groundwater and the vadose zone. Given the potential for interaction among processes, it is important to have coordinated monitoring of groundwater, vadose zone, ET fluxes, streamflow, and vegetation conditions to accelerate a holistic understanding of process interactions.
Most bores in southeastern Australia have been targeted where groundwater is used, whereas this work affirms the need for investment in bores for hydrological understanding rather than impact assessment. By considering the range of hypotheses being tested, and the range of data sources currently available (including their spatial distributions and uncertainties), it should be possible to pinpoint locations where new bores would yield the greatest advances in understanding. In general, the largest spatial gaps in bore coverage are in upland areas, so this should be considered when planning new monitoring.
For specific HPEs, future research and/or monitoring needs to provide additional evidence and improve confidence include the following:
-
HPE18 (gaining to losing). Priority should be placed on retaining and commissioning bores adjacent to streams and rivers. There would likely be considerable value in reviving, even for a short time, decommissioned bores with historic pre-drought data. As with new bores, the focus for recommissioning should be on objectively identifying bores that might provide the most information, complementing existing data and considering uncertainties.
-
HPE16 (sustained hillslope drainage). This HPE differentiates dynamics in colluvial/alluvial valley bottoms from dynamics in fractured rock in hillslopes, so future research should aim to discern these differentiated dynamics in measurements. It also explains groundwater loss primarily via AET from valley bottoms, and it may be possible to design experiments to detect this using remote sensing or high-resolution products.
-
HPE17 (sustained regional drainage). Further research into the volumetric rates of flow through regional systems is required, for example through analysing water age (e.g. Markovich et al., 2019). Most current monitoring of regional systems is done via analysis of levels; quantification of flow rates is relatively rare and would provide valuable insights (even if estimating temporal changes in this rate proves infeasible).
-
HPE19 (interactions between recharge and thickened vadose zone). Simulation of these interactions may be the most effective test to increase confidence in this hypothesis. If a temporally variable vadose zone thickness together with associated recharge attenuation and enhanced opportunities for transpiration were to improve the simulation of the Millennium Drought, then this could be interpreted as support for the HPE. Few widely used models currently support such dynamics.
Moving away from groundwater to consider other perceptual models, we require the following:
-
HPE23 (farm dams). Better integration of datasets and modelling is required. Estimates of farm dam growth have recently been produced (Malerba et al., 2021), and the next step is to use such estimates in modelling (e.g. Fowler et al., 2015; Morden et al., 2021) to quantify the additional impact during the Millennium Drought relative to earlier droughts.
-
HPE13 (salinity recovery). Further confirmation may be difficult, since it is difficult to retrospectively identify areas formerly affected by salinity. The most promising avenue may be to collate and standardise existing information from the 1980s and 1990s (some of which may exist non-electronically).
-
HPE04 (evaporative demand) and HPE07 (coupling and radiation/temperature). Simulation experiments may be used to estimate the water balance impacts of mechanisms. This would require a framework capable of representing the coupling effects (e.g. Clark et al., 2015).
-
HPE21 (agricultural practices). Knowledge gaps exist regarding the prevalence of land management trends. These gaps can be filled via a mixture of a literature review (including grey literature) and holding workshops with land managers.
The Millennium Drought was longer than other droughts post-1950 (HPE05 – long drought), and this point underlies many findings in this paper. However, two pre-1950s droughts – the Federation and World War II droughts – are more comparable to the Millennium Drought than droughts in the 1950–1990 period (see Verdon-Kidd and Kiem, 2009, for more information on these droughts). Thus, a potential research direction might be to collate historical information, both qualitative and quantitative, about the hydrological impacts of these droughts, to provide new perspectives on whether the Millennium Drought was unprecedented from a hydrological perspective. Last, efforts to gather, homogenise, and publicly release historical experimental data relevant to the Millennium Drought may also be of considerable value, and we feel this should be considered a priority for Australian hydrologists. This could include identifying previously unpublished data held by individual academics or research institutions and/or making connections between previously disparate datasets.
The Millennium Drought is an important historic case study of a multi-annual event resulting in persistent shifts in the relationship between rainfall and runoff. This paper, the culmination of a multi-disciplinary eWorkshop, has provided new perspectives on the processes responsible for these hydrological changes, while at the same time demonstrating the value of using shared perceptual models and evaluation as a strategy for community research.
Through community collaboration, we have presented a broad range of hypotheses across categories including climatic forcing, vegetation, soil moisture dynamics, groundwater, and anthropogenic influence. Assessment of these hypotheses against a large body of evidence reveals that many of the hypotheses are not supported by available data. Most remaining hypotheses point to the central role of subsurface processes either directly causing the flow reductions or mediating them via long-memory processes (e.g. multi-annual groundwater storage trends). Recommendations for future research focus on developing monitoring and modelling to further confirm these hypotheses and assess their interactions.
The resulting contribution is 3-fold.
-
We have a systematic catalogue of possible mechanisms explaining flow reductions which may be relevant to droughts in other times or places and/or for future changing climate. This is the case even for process explanations subsequently determined to be inconsistent with evidence for this case study.
-
We have a holistic description of catchment response during the Millennium Drought and identify numerous mechanisms which together can explain the unexpected flow reductions.
-
We have multiple recommendations towards a better understanding of multi-year climate drying and its hydrological impact, which is essential to provide society with the means to anticipate future water crises globally (Fowler et al., 2022).
Table A1Data sources and notes for Figs. 7 and 8. All URLs were last accessed 12 April 2022.
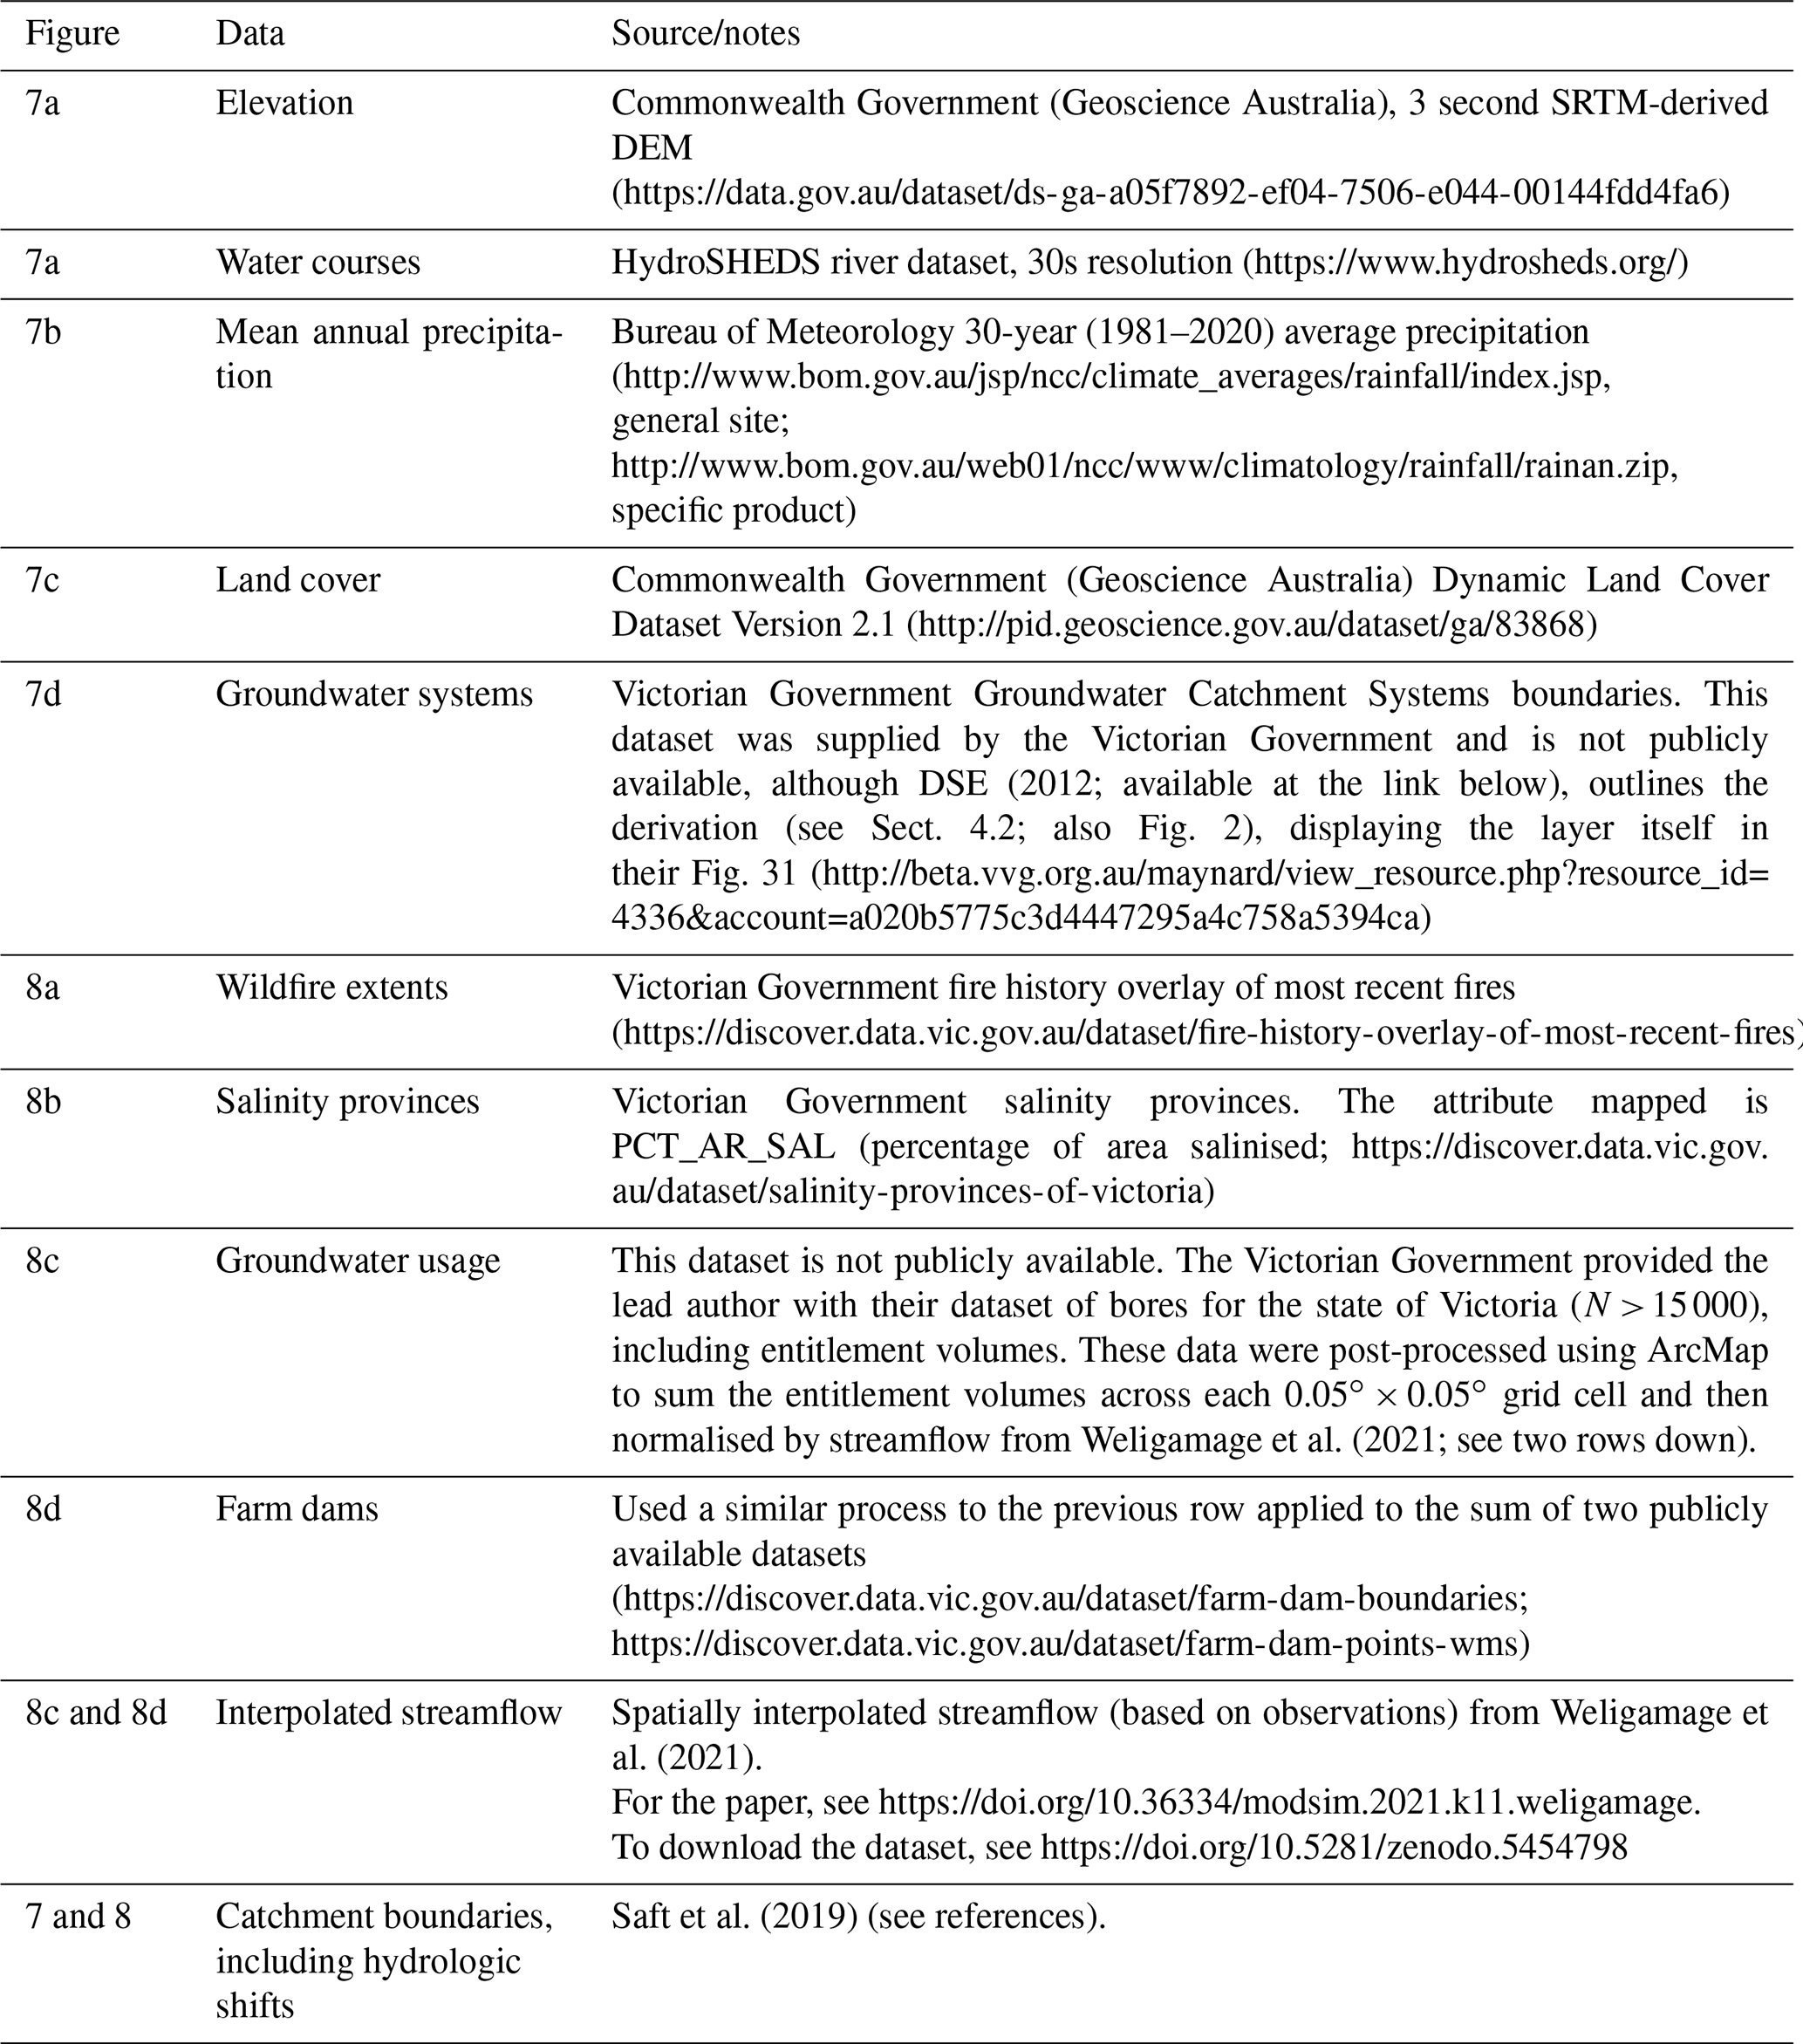
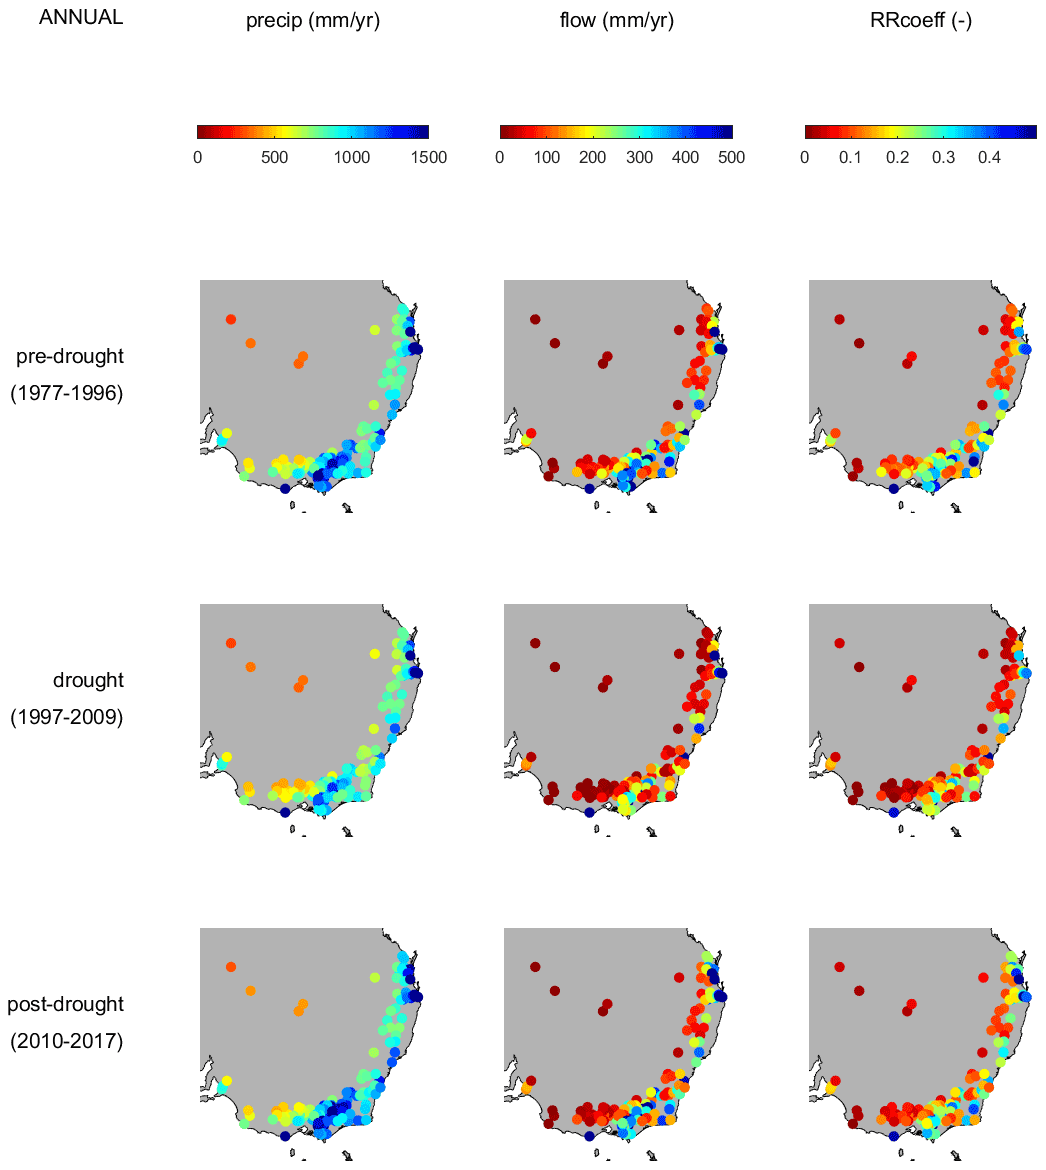
Figure B1Maps of precipitation, streamflow, and runoff coefficient over various periods, based on annual averages. Data from Fowler et al. (2021).
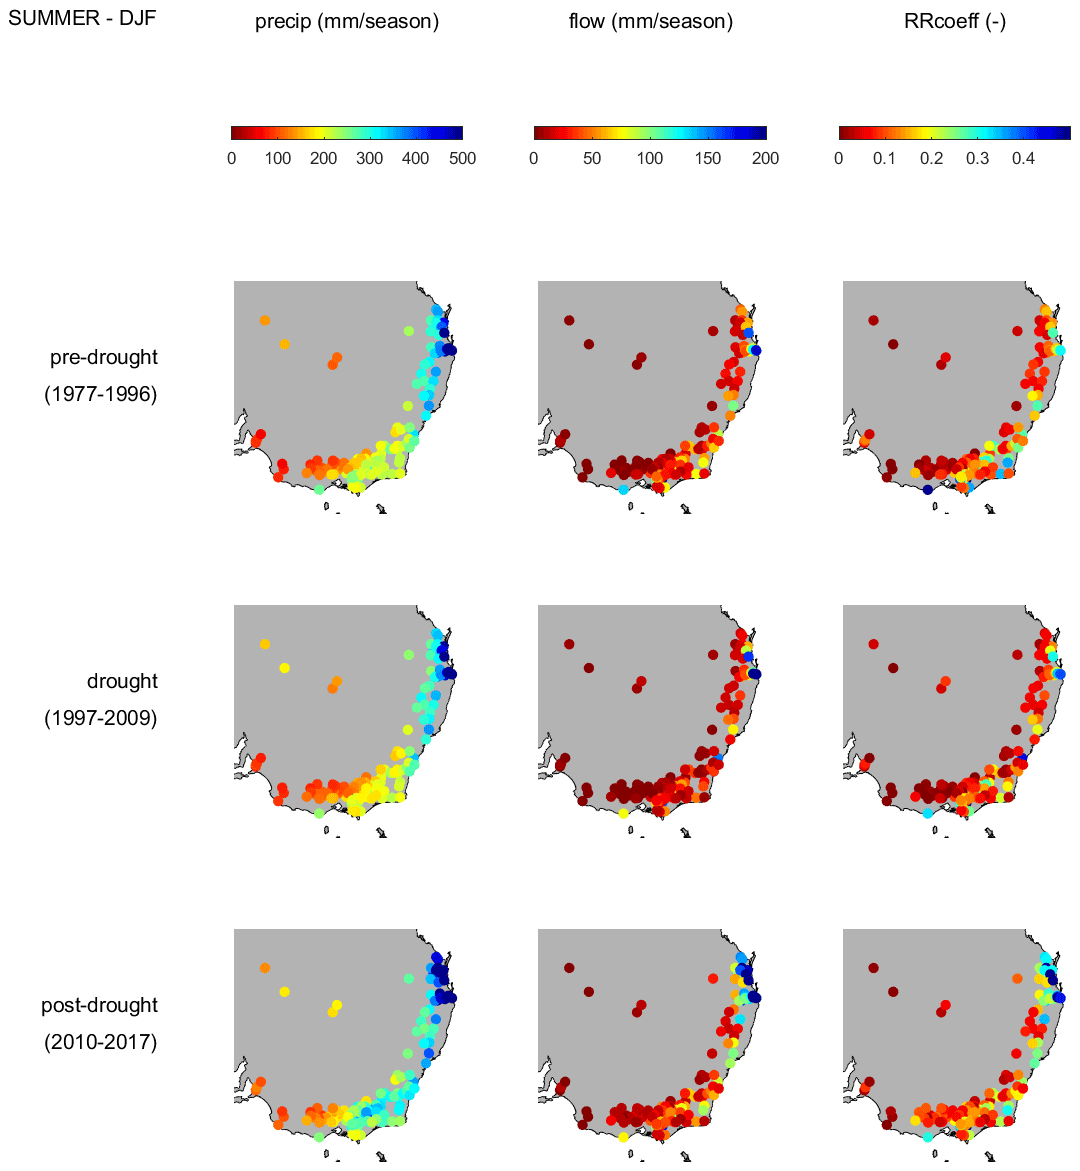
Figure B2Maps of precipitation, streamflow, and runoff coefficient over various periods, based on the average seasonal total, for summer (December, January, and February). Data from Fowler et al. (2021).
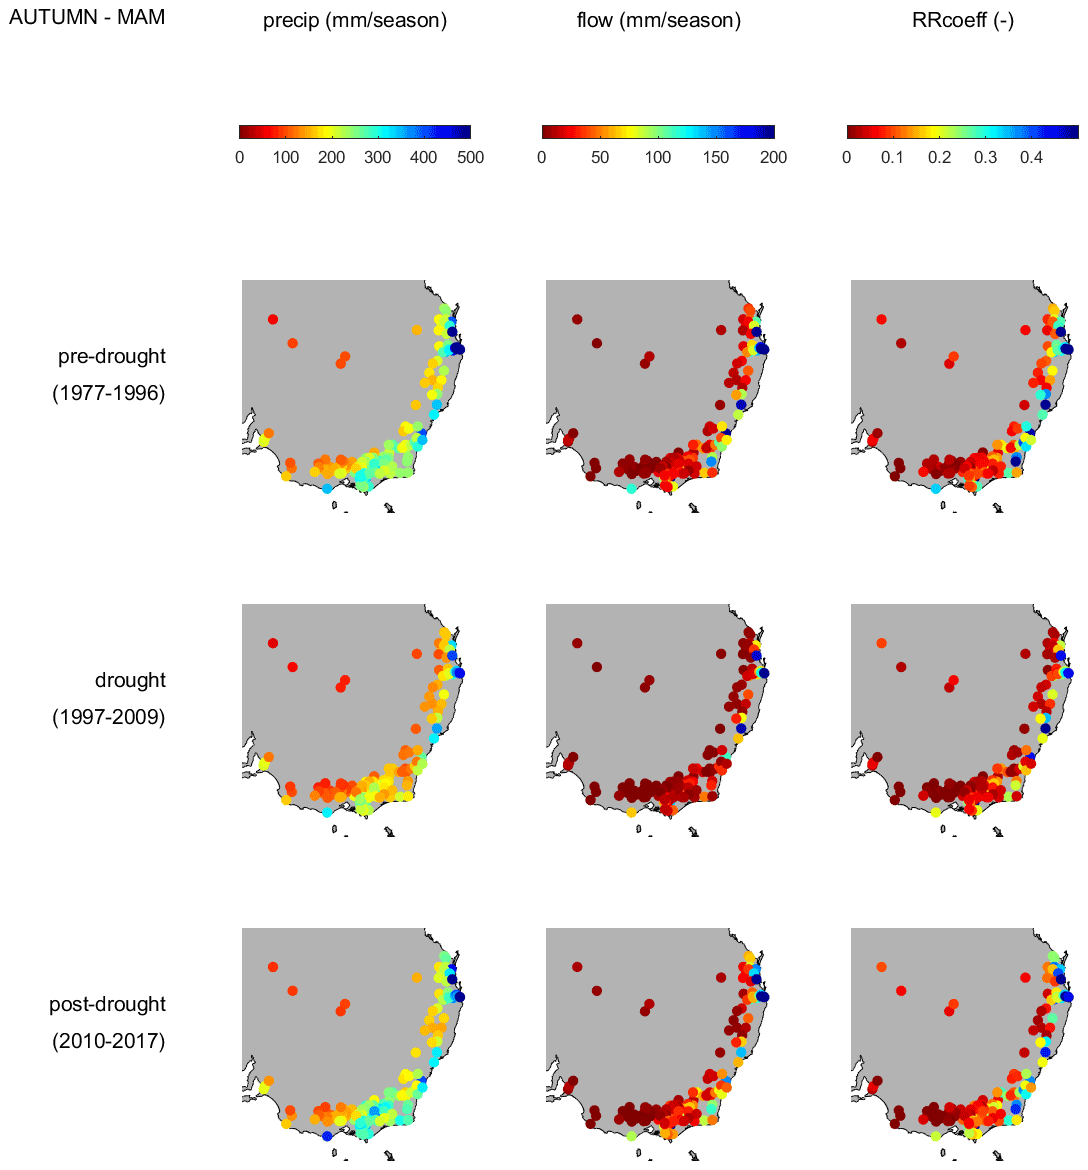
Figure B3Same as Fig. B2 but for autumn (March, April, and May).
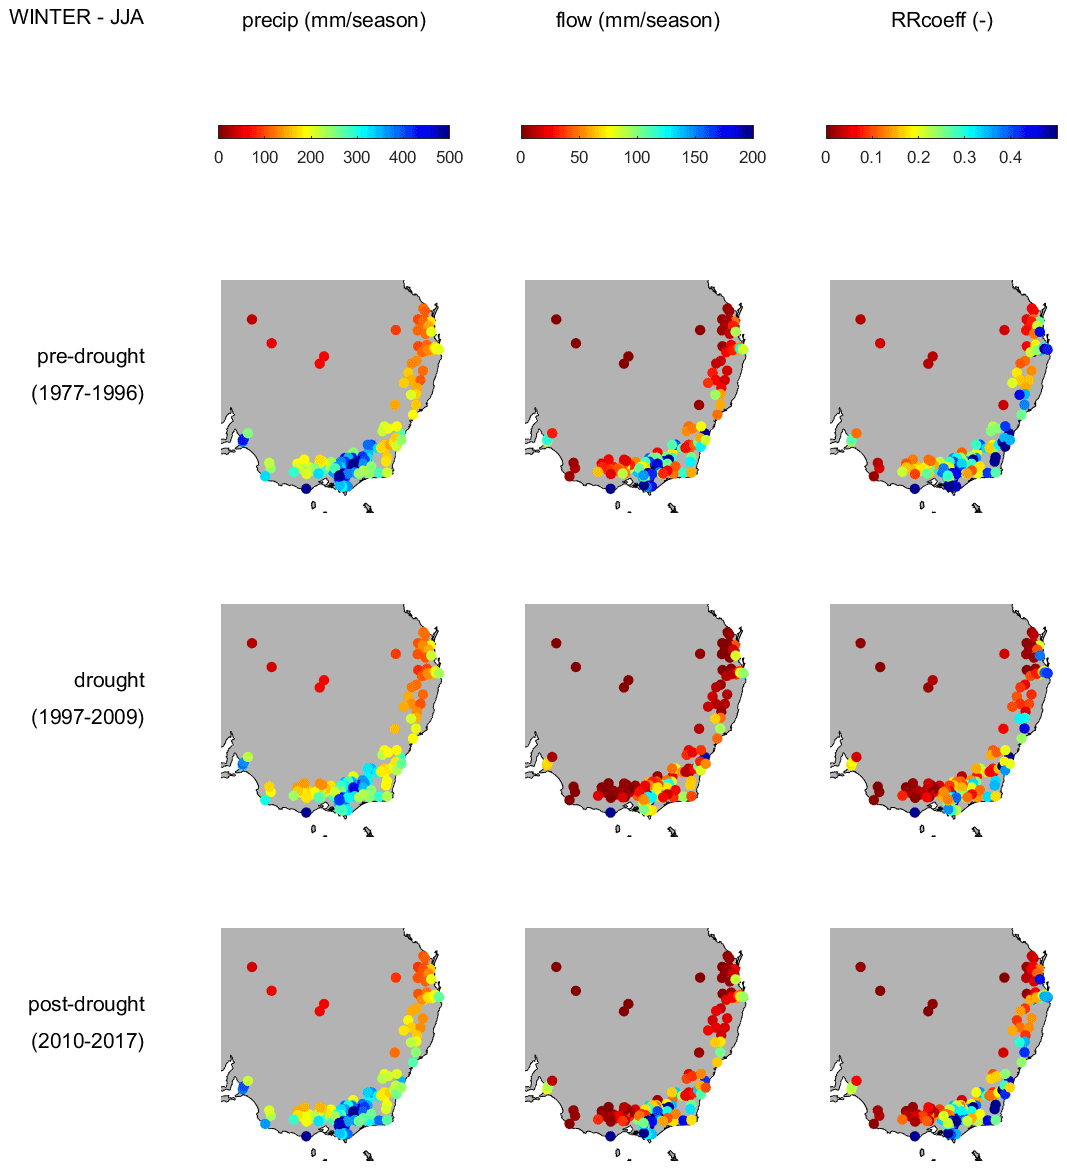
Figure B4Same as Fig. B2 but for winter (June, July, and August).
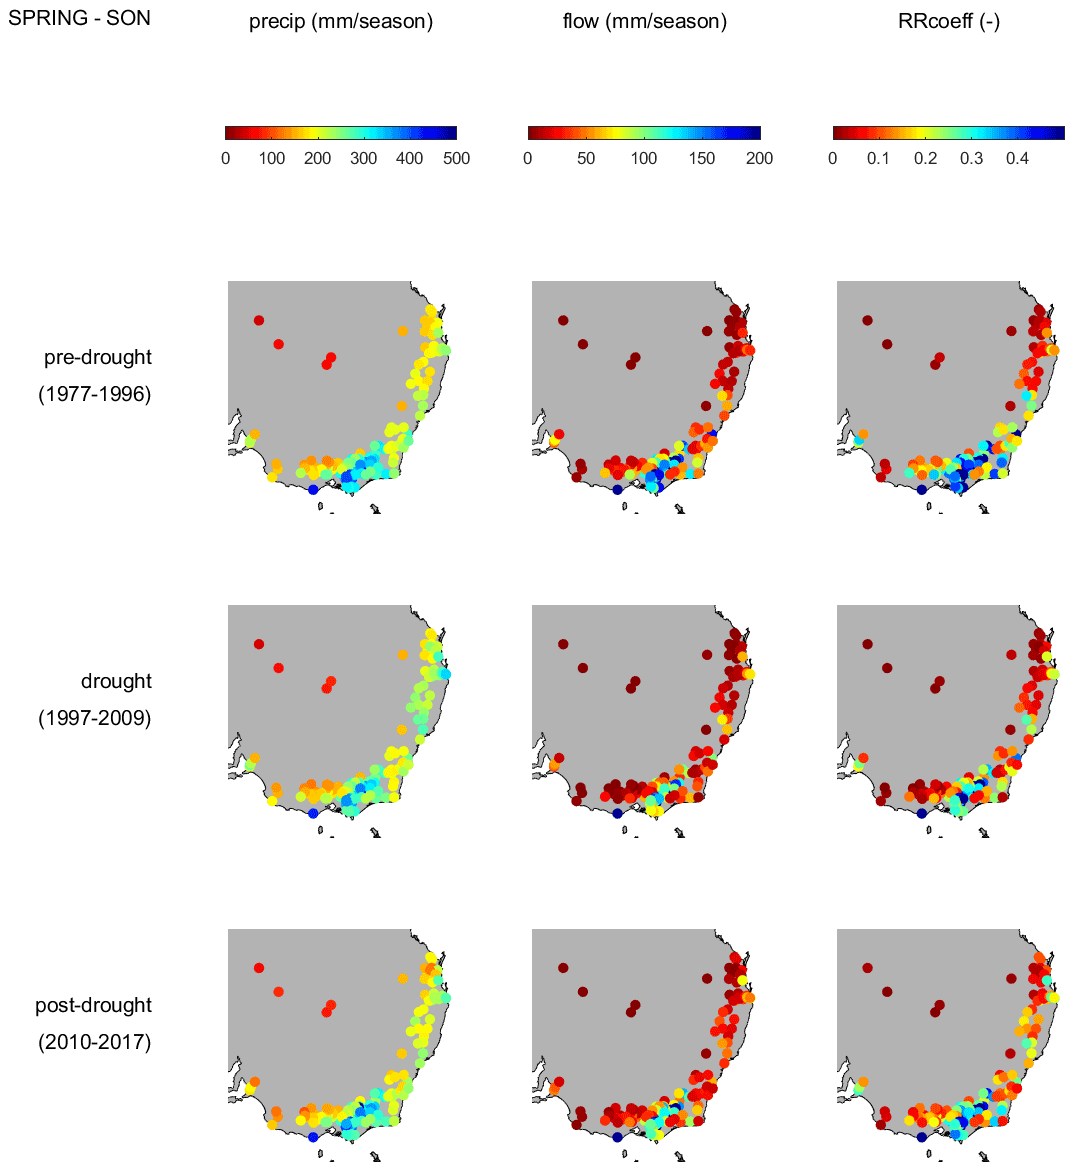
Figure B5Same as Fig. B2 but for spring (September, October, and November).
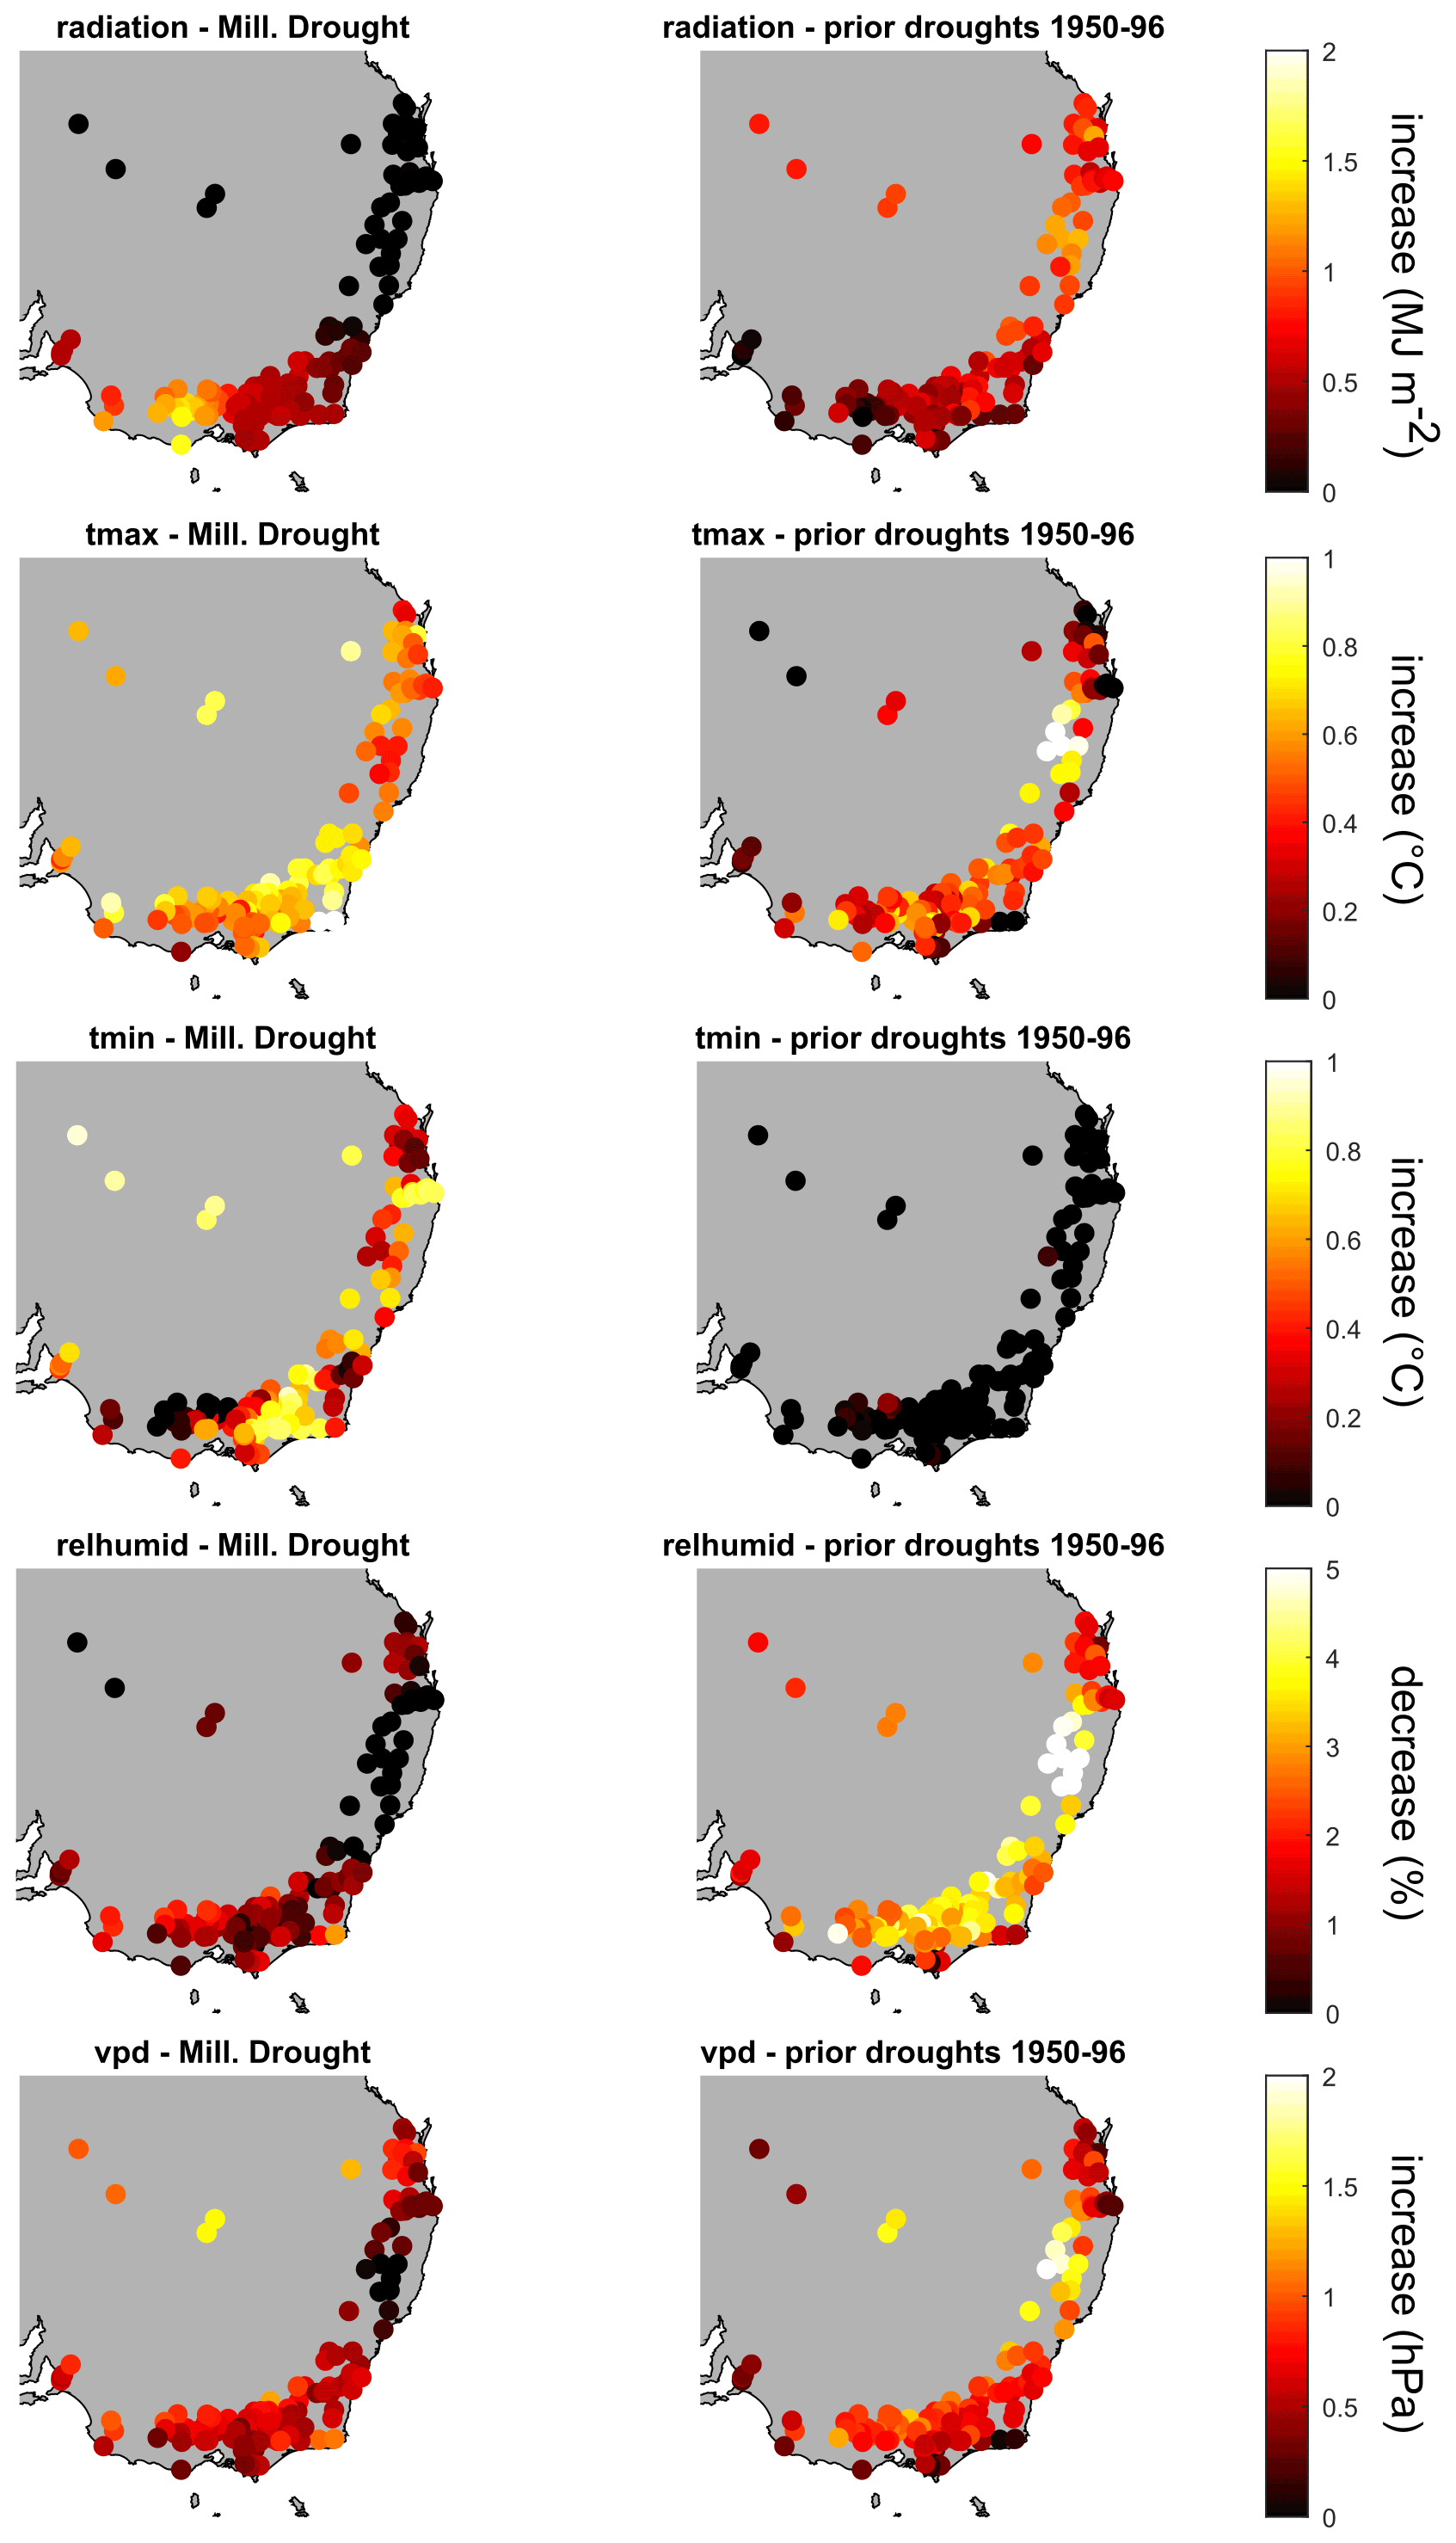
Figure C1Repeat of Fig. 5d but for five climatic drivers of PET, considering spring months only (September–November). Spring is selected since HPE04/Fig. 5d is focussed on PET in spring. Based on data from Fowler et al. (2021).
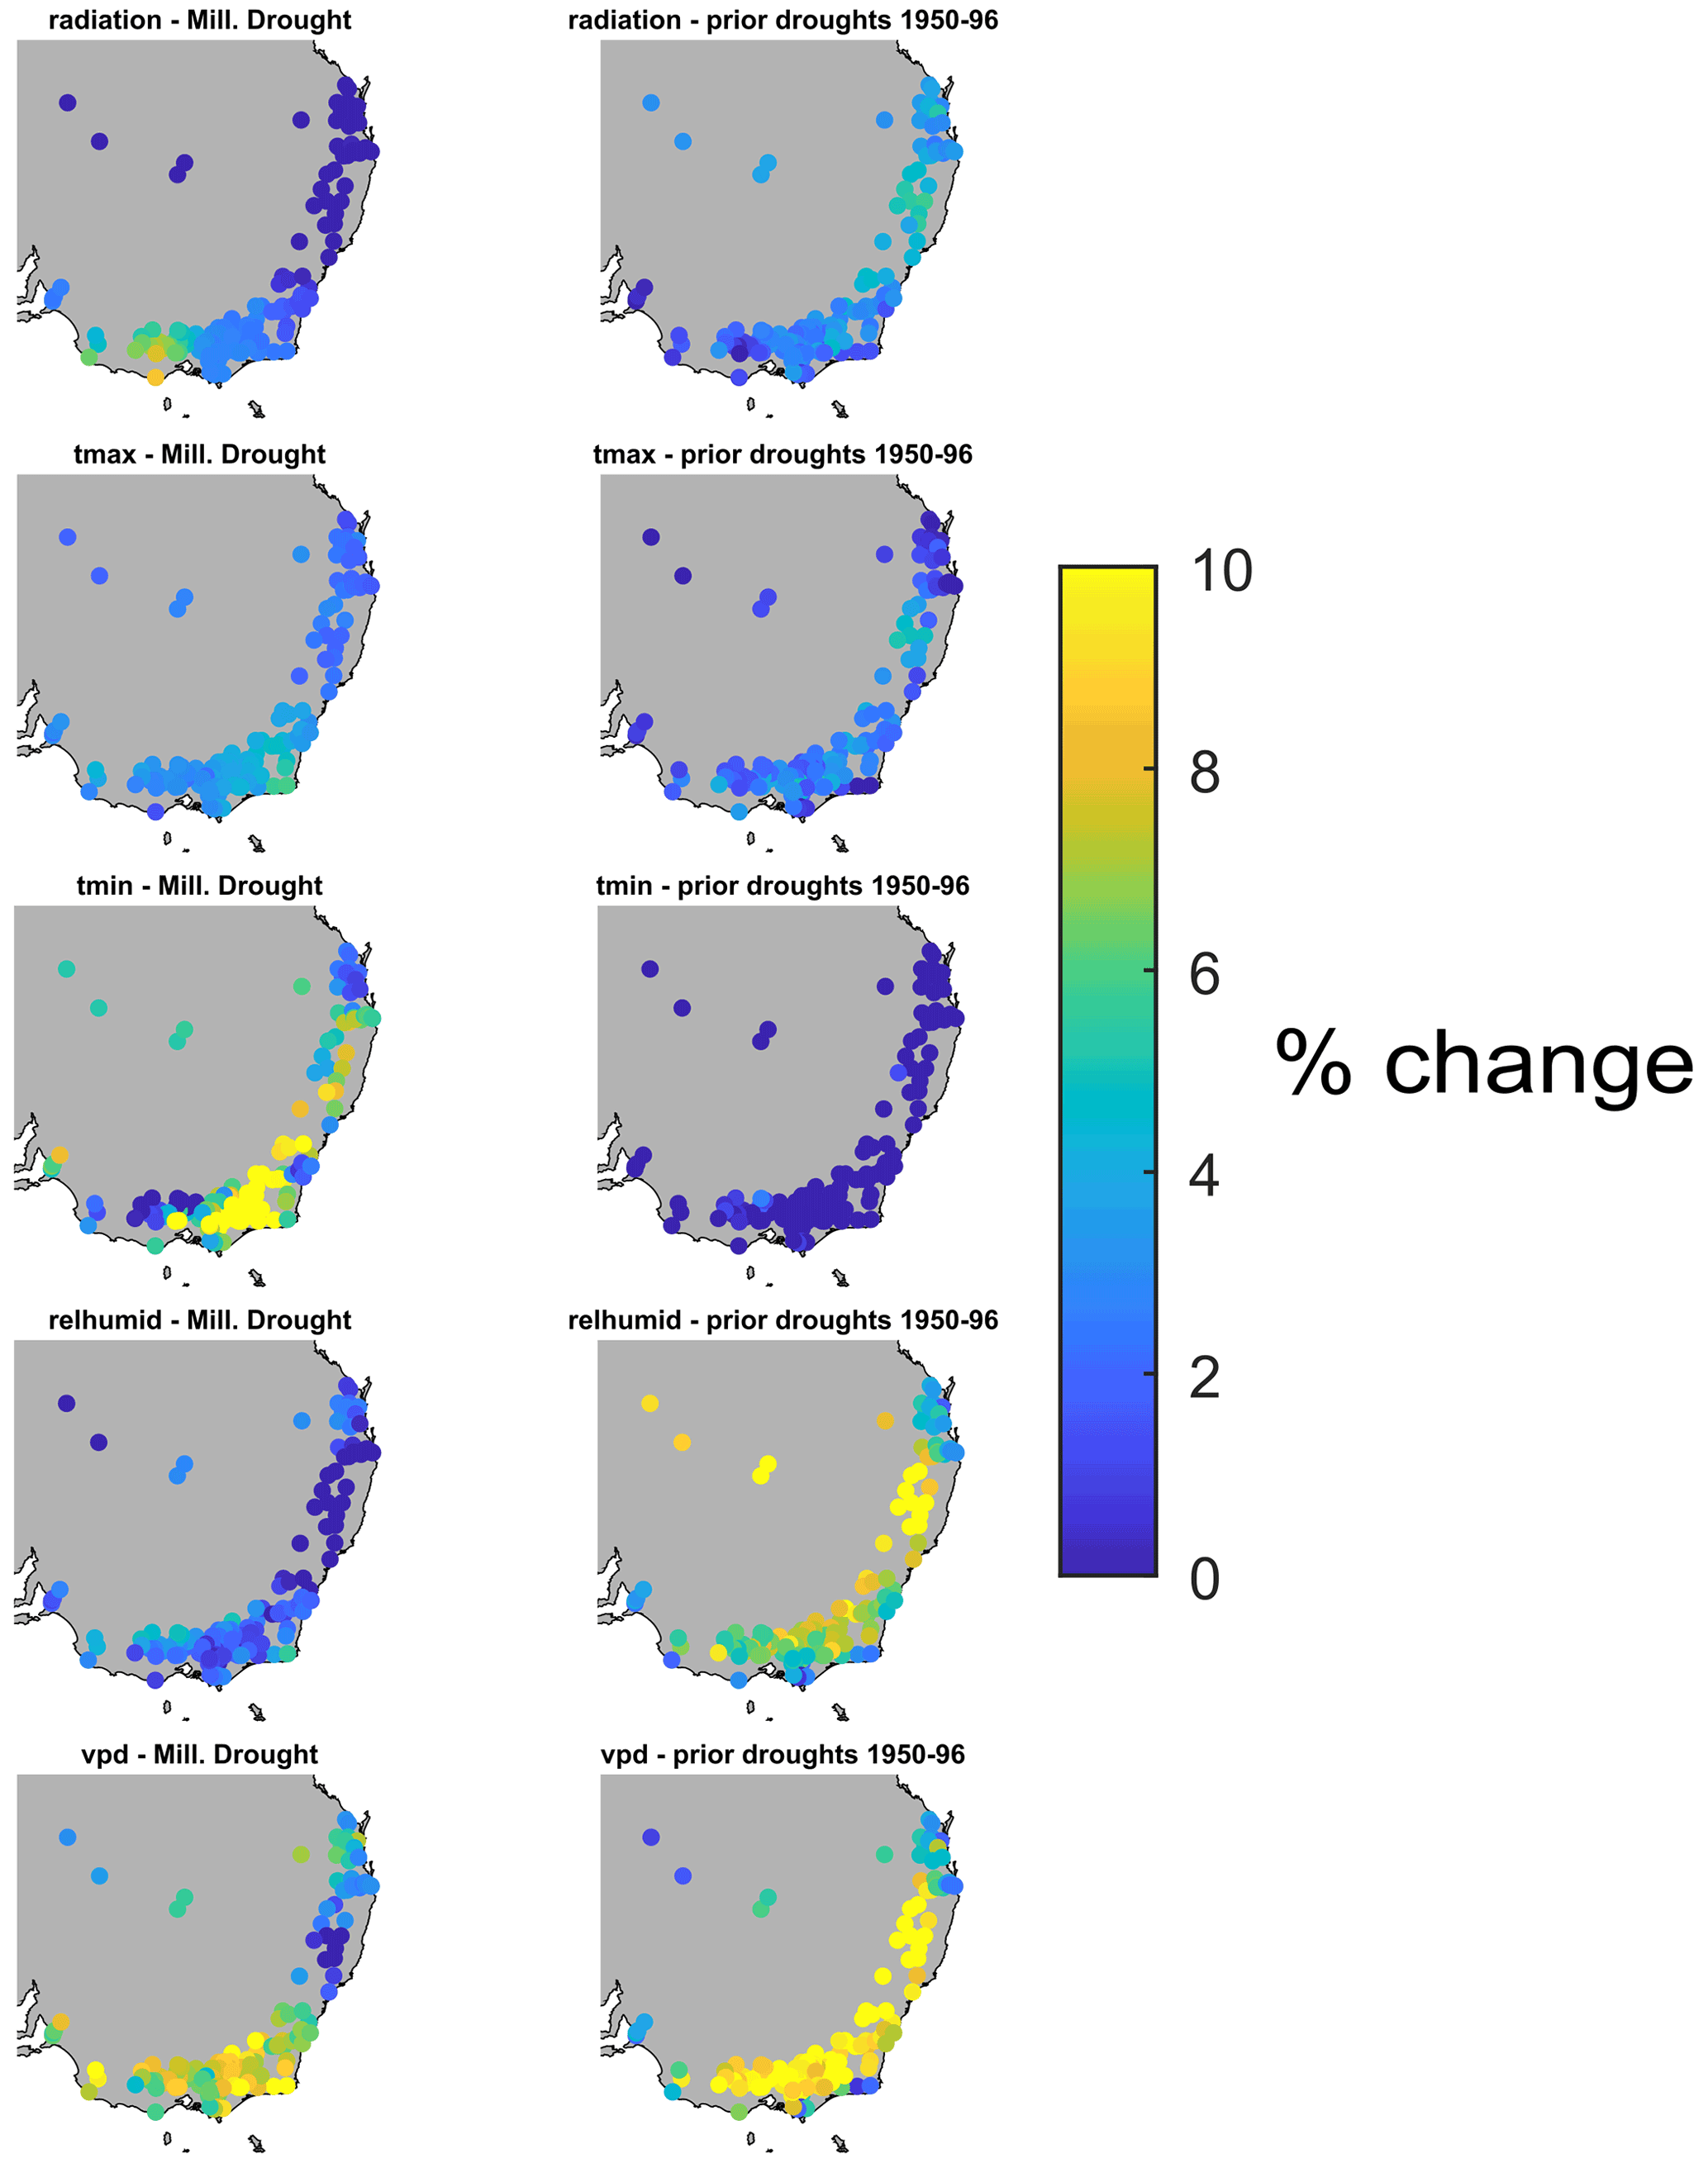
Figure C2Repeat of Fig. C1 but showing changes in percentage terms rather than actual values.
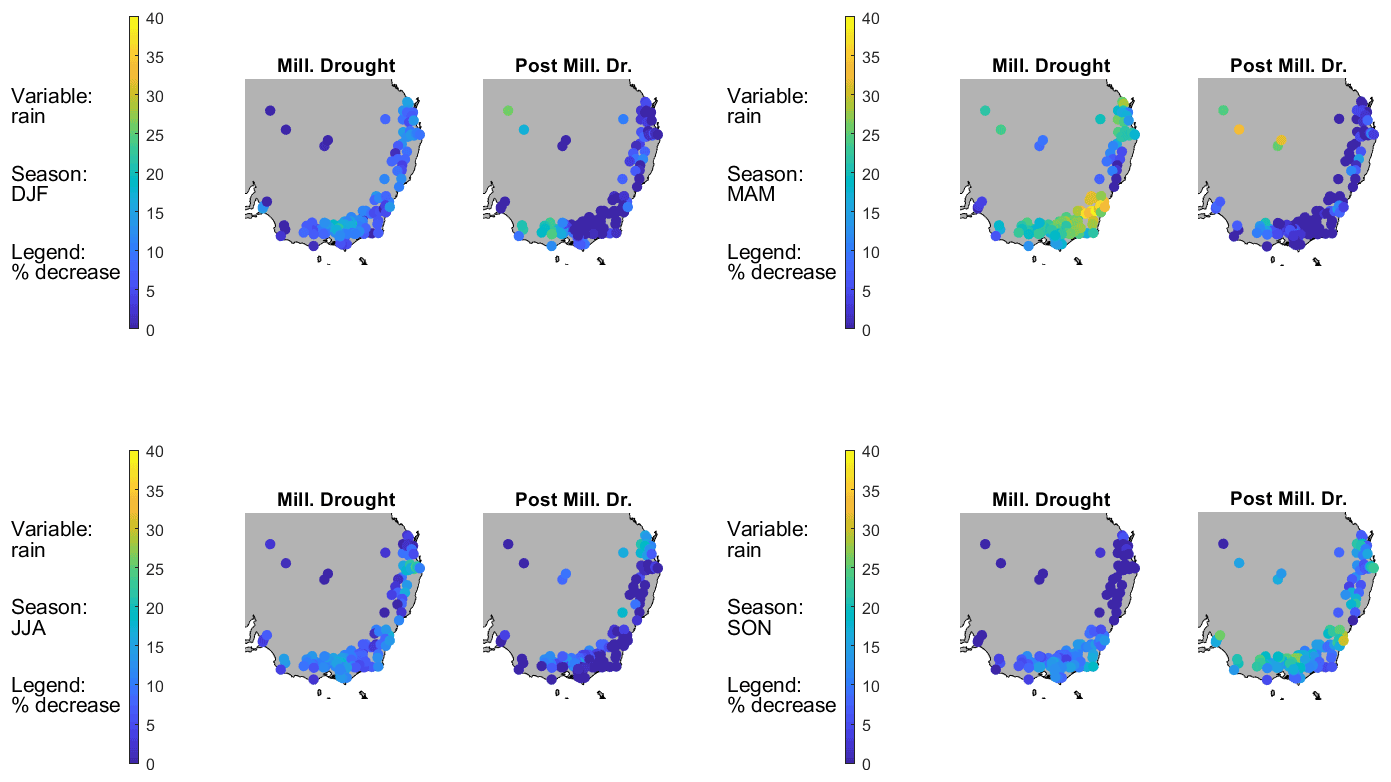
Figure D1Comparison for each season showing precipitation. For each pair, the left plot shows the change in Millennium Drought precipitation relative to the long-term average (taken as 1950–2017; the same definition as in Fig. 3), and the right plot shows the change in post-Millennium-Drought (2011–2019) precipitation relative to the long-term average. Based on data from Fowler et al. (2021).
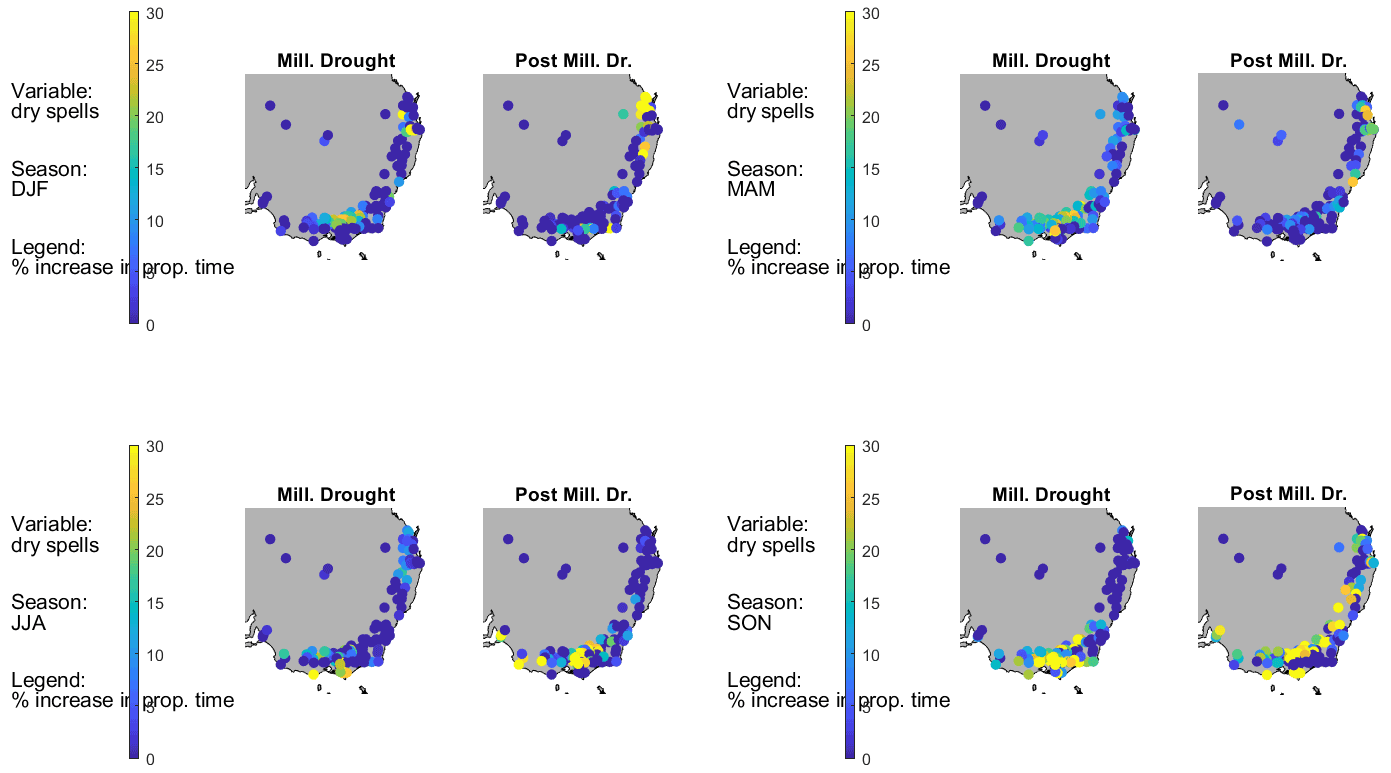
Figure D2Same as Fig. D1 except for dry spells (see Fig. 3 for dry spell definition). Based on data from Fowler et al. (2021).
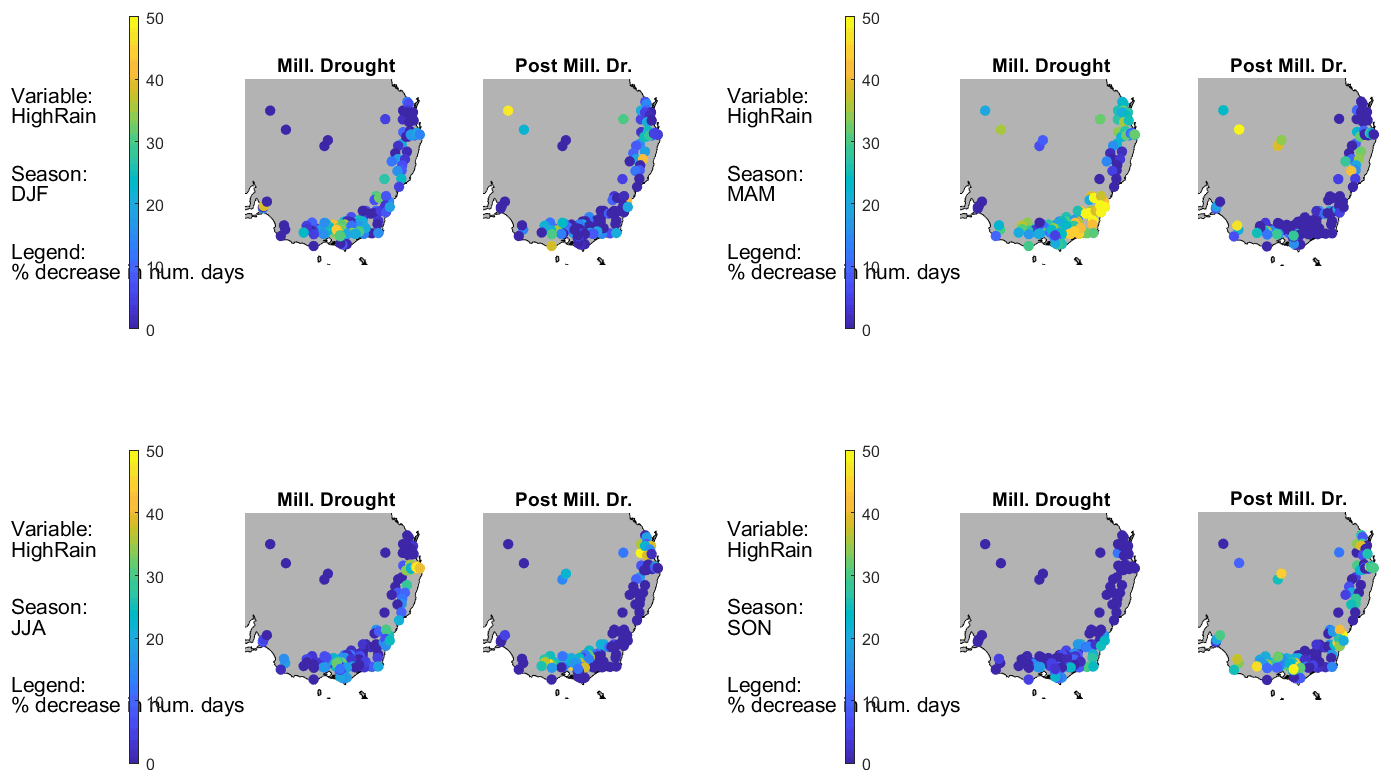
Figure D3Same as Fig. D1 except for the number of high rainfall events (see Fig. 3 for high rainfall definition). Based on data from Fowler et al. (2021).
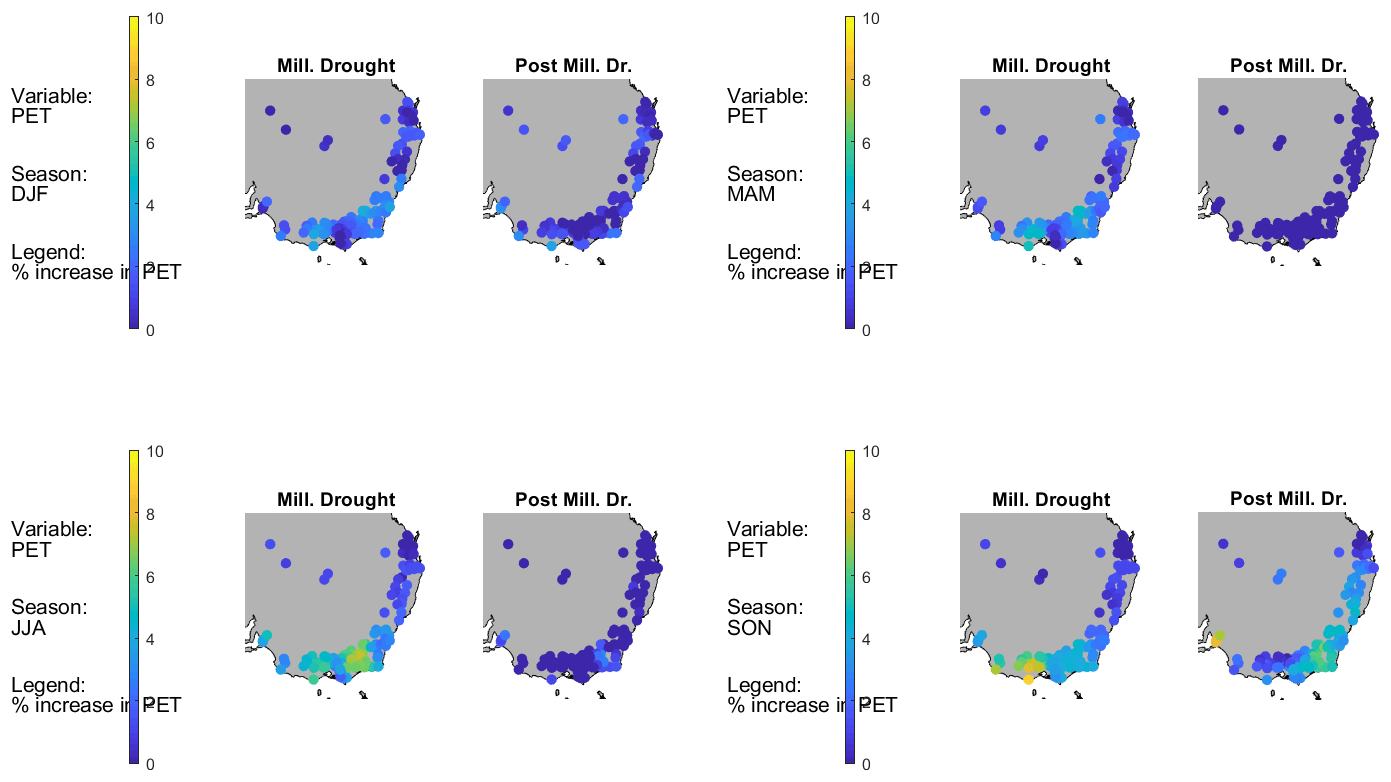
Figure D4Same as Fig. D1 except for PET (see Fig. 3 for PET definition). Based on data from Fowler et al. (2021).

Figure D5Same as Fig. D1 except for radiation. Based on data from Fowler et al. (2021).
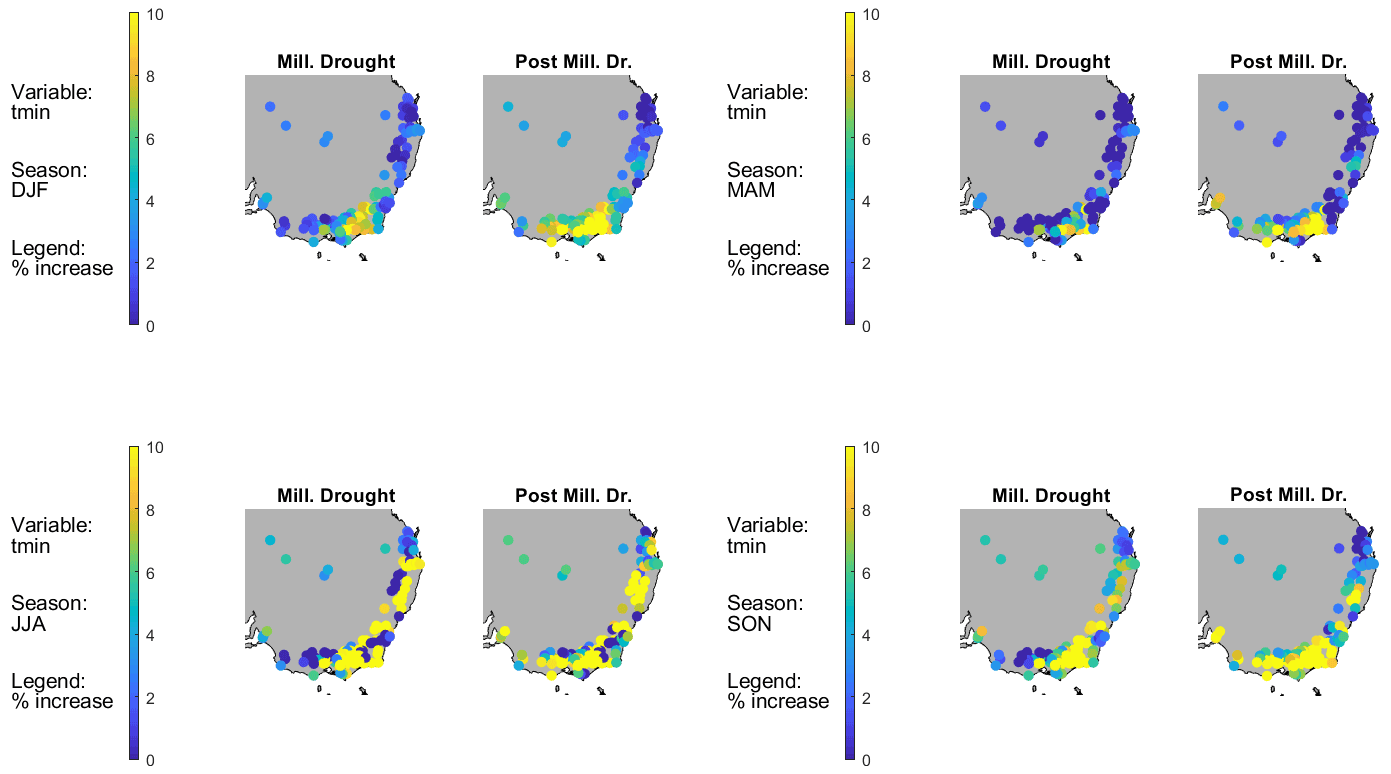
Figure D6Same as Fig. D1 except for tmin (minimum daily temperature). Based on data from Fowler et al. (2021).
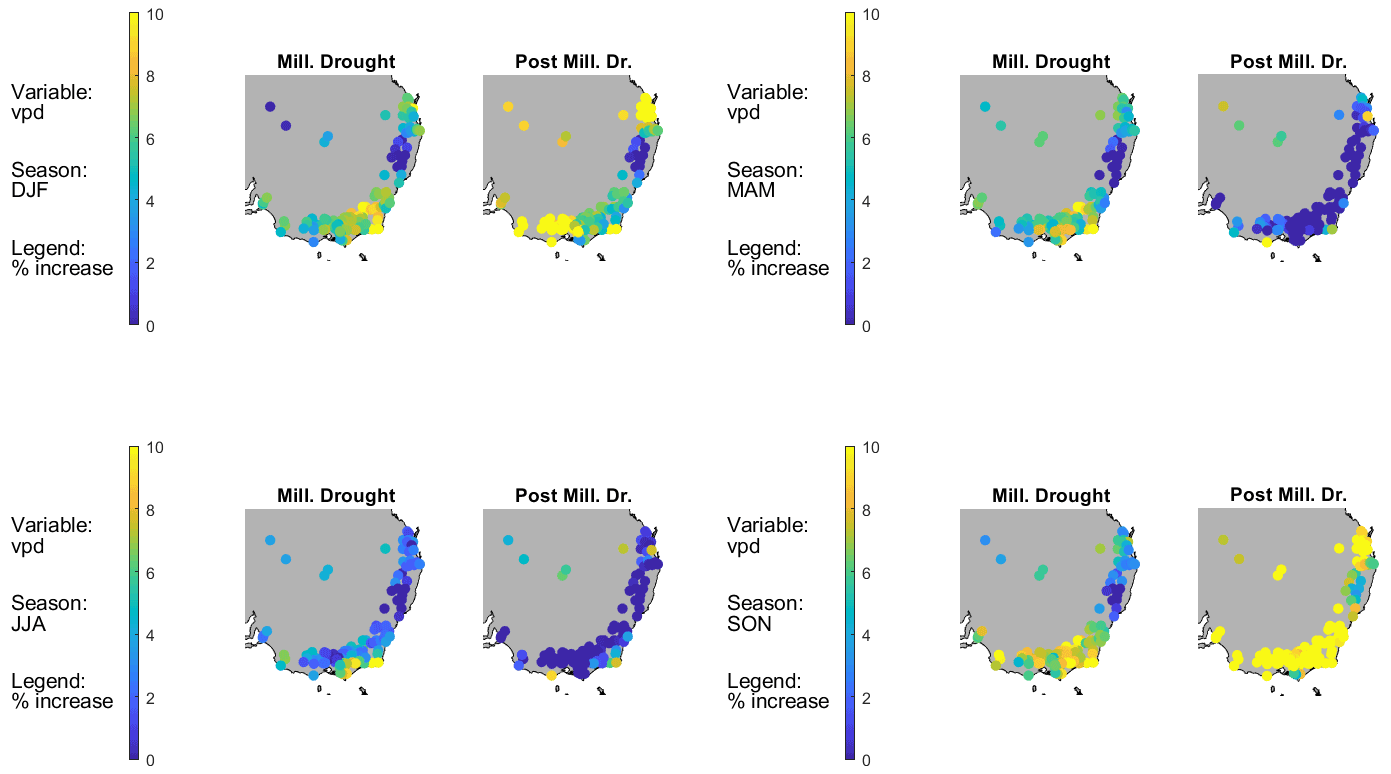
Figure D7Same as Fig. D1 except for VPD. Based on data from Fowler et al. (2021).

Figure E1Number of years that met the definition of prior droughts used to create Fig. 5, for each catchment. Based on data from Fowler et al. (2021).
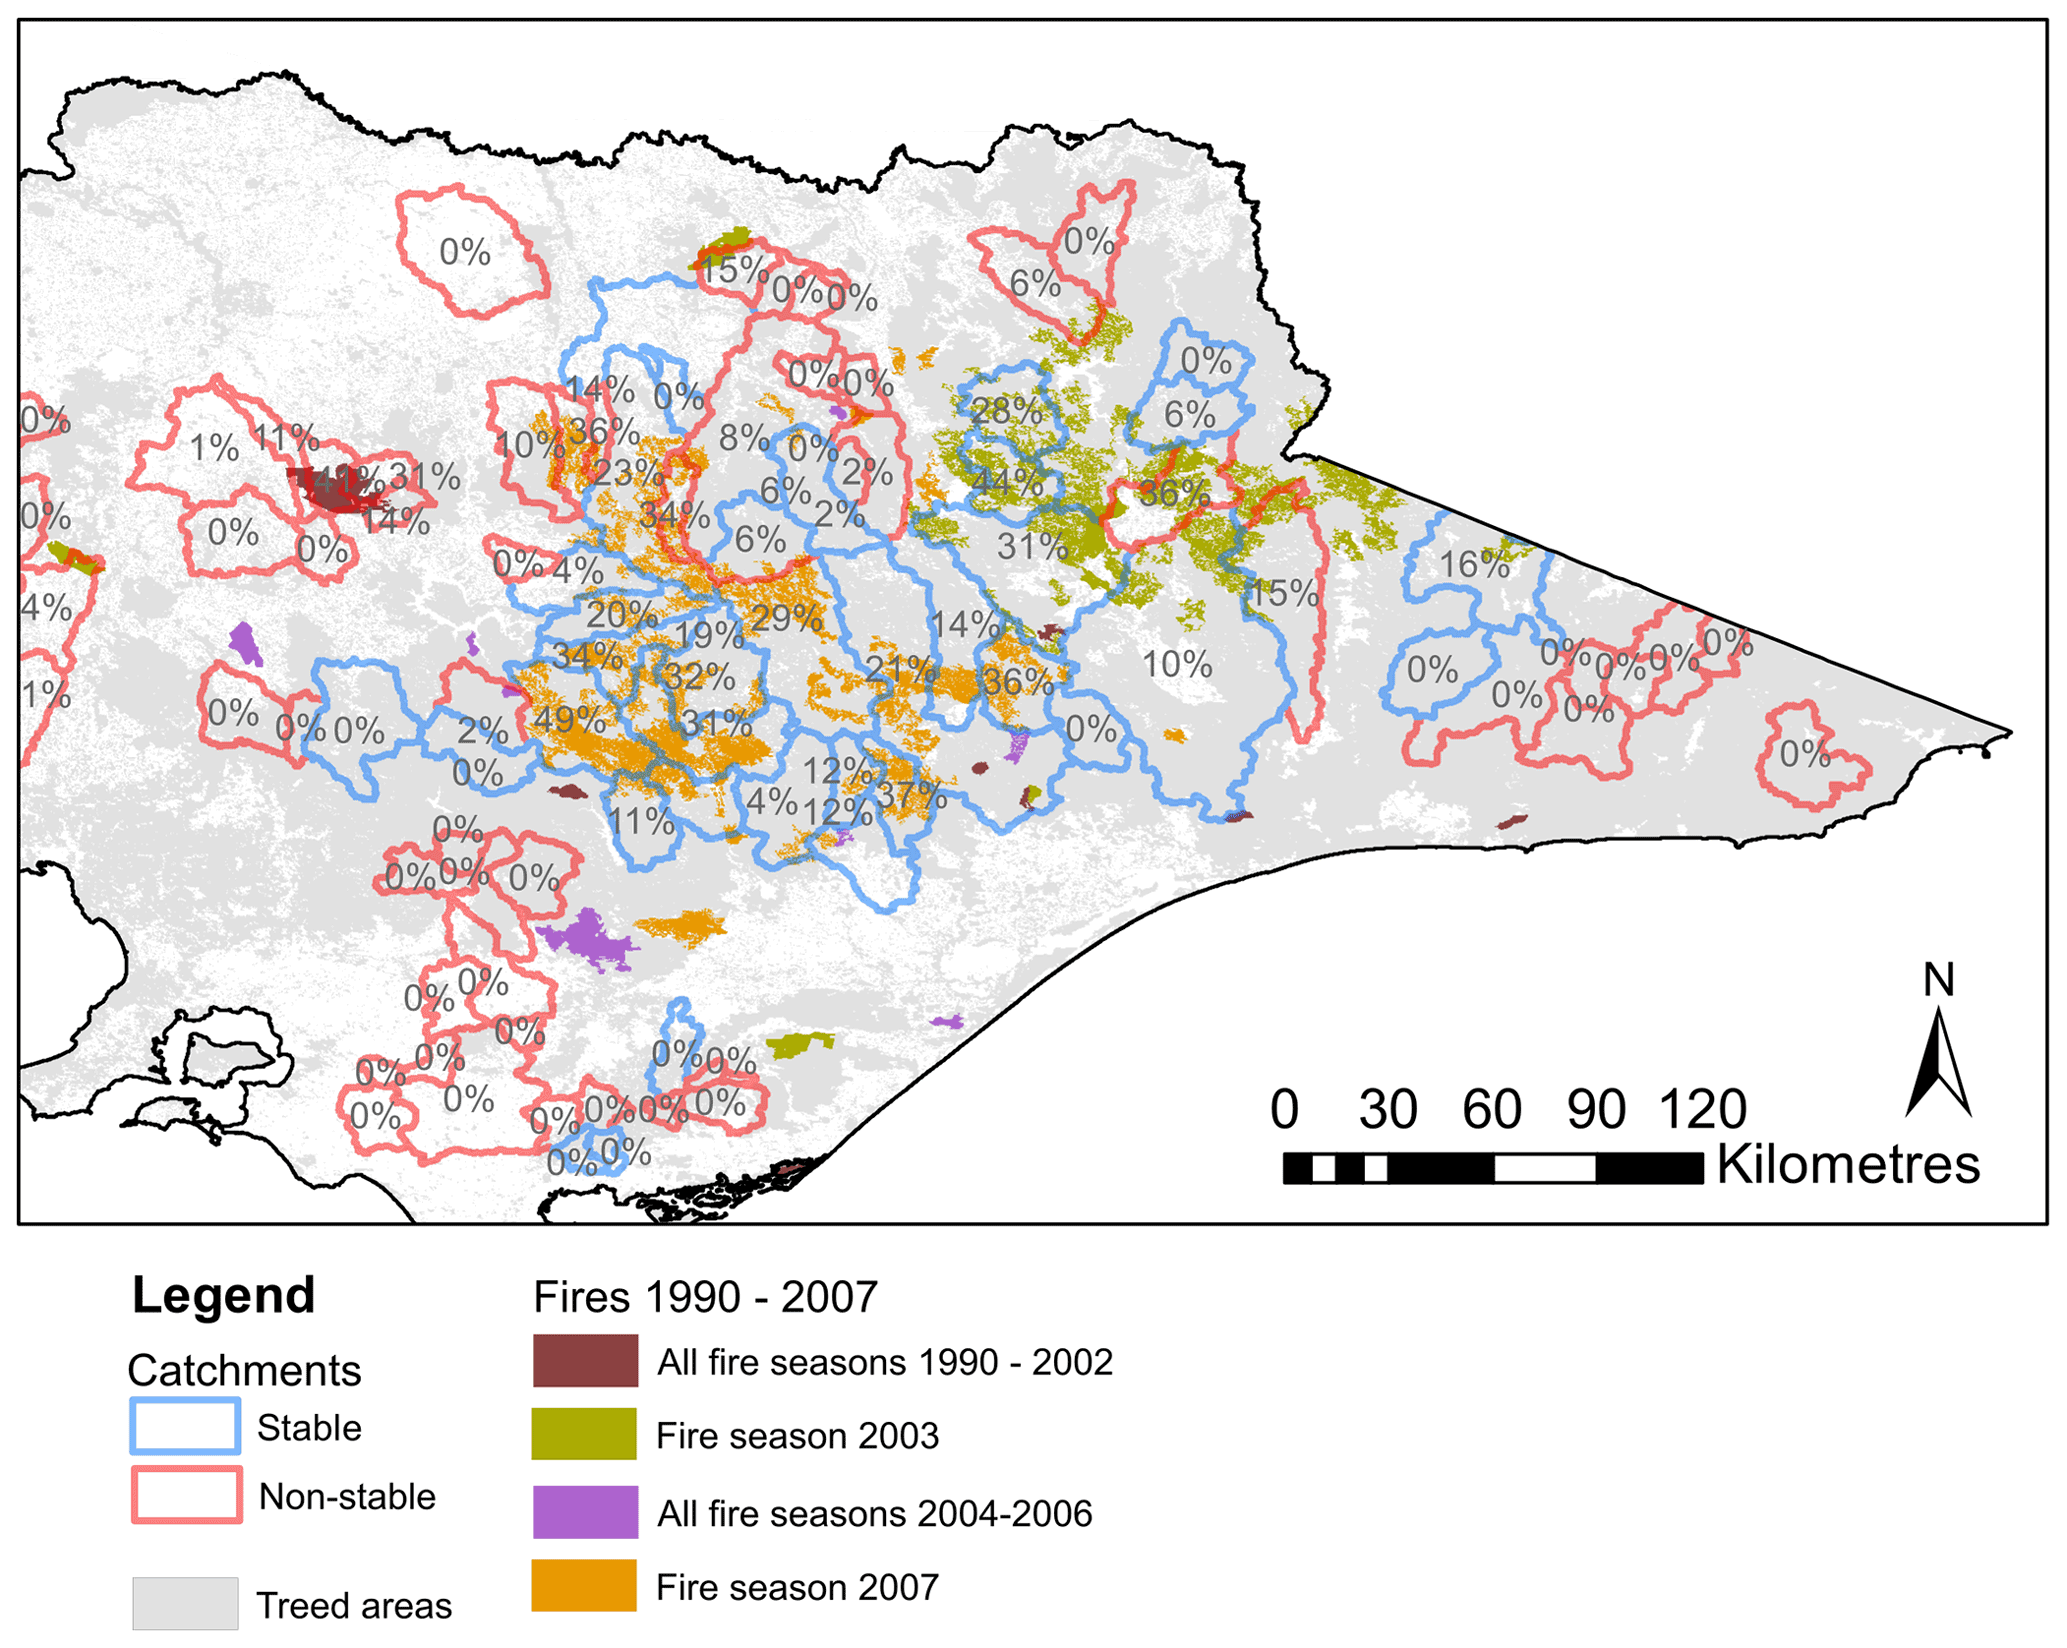
Figure E2Fire history (most recent fire) over eastern Victoria, mapped with study catchments from Peterson et al. (2021).
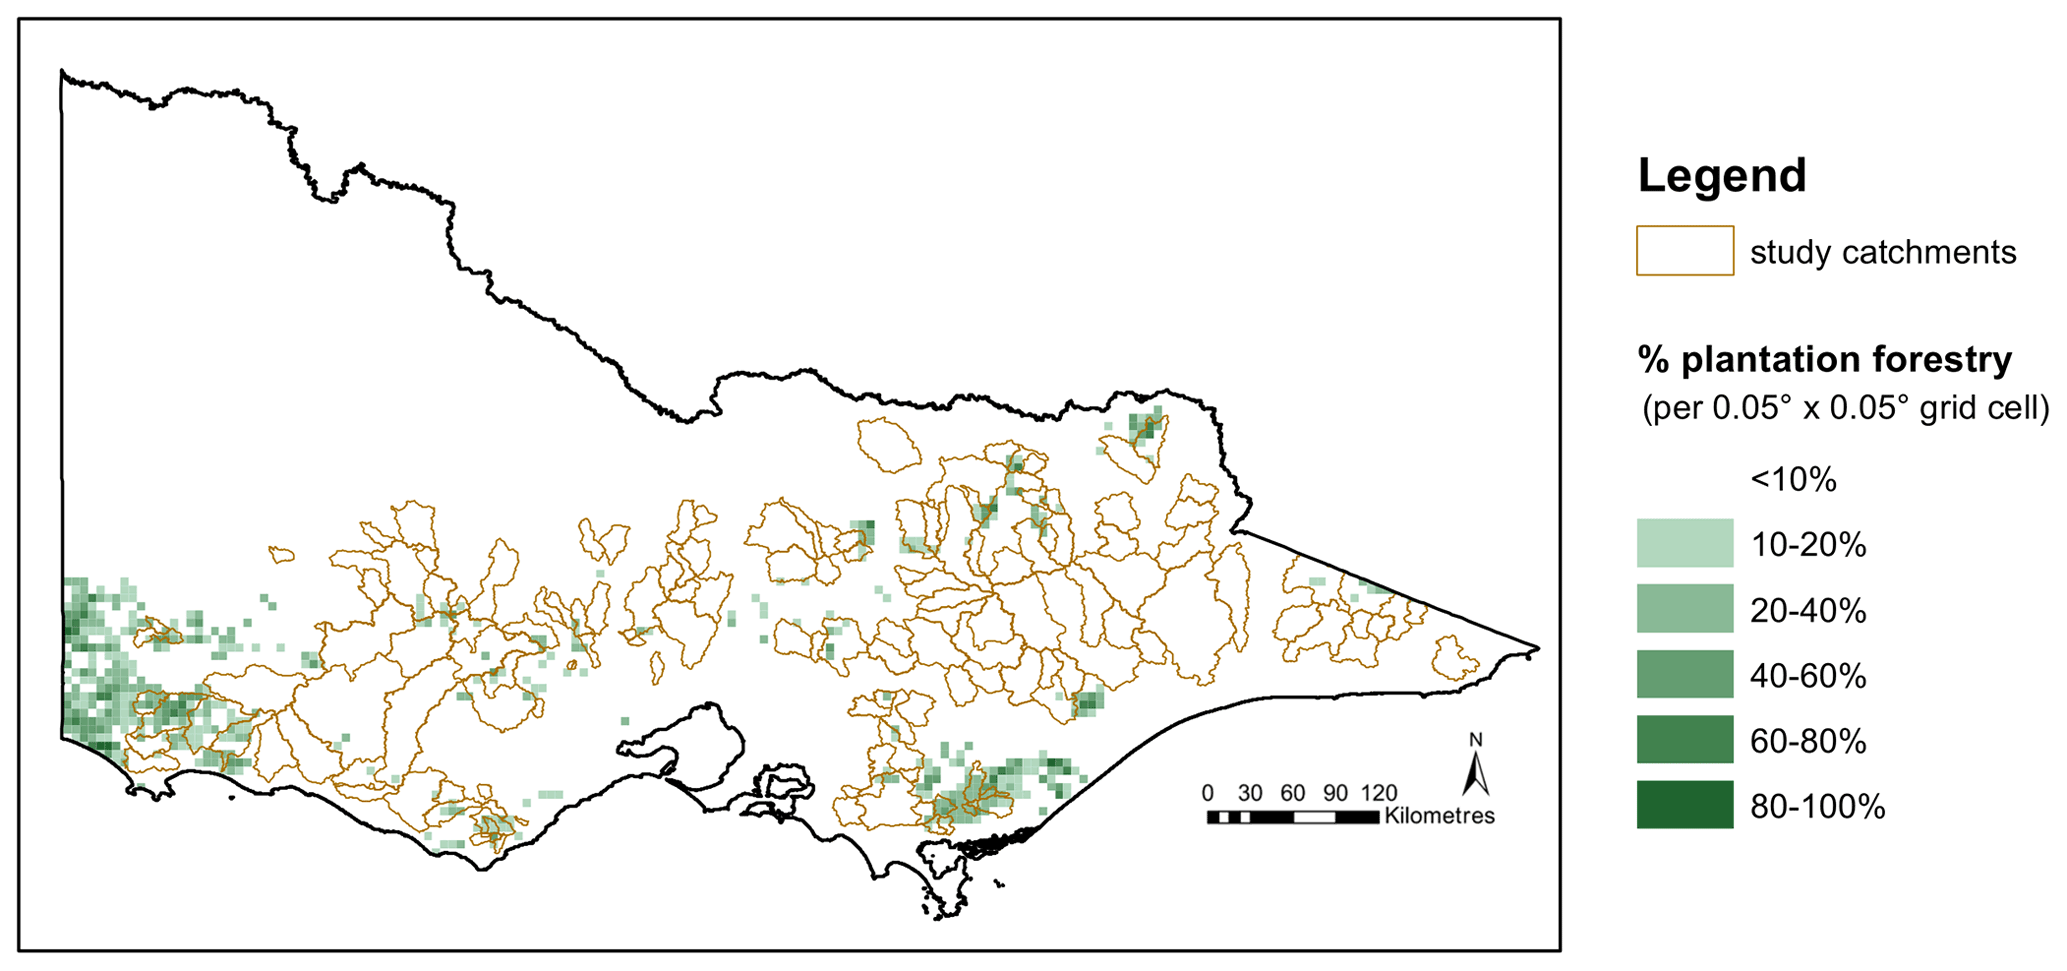
Figure E3Spatial distribution of plantation forestry in Victoria in 2016. Processed from raw data from ABARES (2016).
All hydroclimatic data used in this study are freely available as part of the CAMELS-AUS dataset at https://doi.org/10.1594/PANGAEA.921850 (Fowler et al., 2020b). Non-hydroclimatic data sources are marked in each figure (see also Table A1).
KF conceptualised this article/workshop and acted as lead convener for the workshop. MP, MS, and TP co-convened the workshop, while RN and KF facilitated. All other co-authors contributed equally to the workshop and to this article. KF coordinated the writing of the article, with input from all co-authors, all of whom contributed to at least one draft of this work, and all of whom had the opportunity to contribute to any section of the article.
At least one of the (co-)authors is a member of the editorial board of Hydrology and Earth System Sciences. The peer-review process was guided by an independent editor, and the authors also have no other competing interests to declare.
Publisher’s note: Copernicus Publications remains neutral with regard to jurisdictional claims in published maps and institutional affiliations.
The workshop and article preparation were conducted as part of Australian Research Council (ARC) Linkage Project (grant no. LP180100796), supported by the Victorian Department of Land, Environment, Water and Planning (DELWP) and Melbourne Water. The same linkage project supported the research of Margarita Saft, Keirnan Fowler, Tim J. Peterson, and Murray Peel. Keirnan Fowler also received support from LP170100598, supported by the ARC, DELWP, the Victorian Environmental Water Holder, and Australia's Bureau of Meteorology (BoM). Anna Ukkola has been supported by the ARC Centre of Excellence for Climate Extremes (grant no. CE170100023) and an ARC Discovery Early Career Researcher Award (grant no. DE200100086). Conrad Wasko has been supported by an ARC Discovery Early Career Researcher Award (grant no. DE210100479). Edoardo Daly and Ian Cartwright have been supported by the ARC Discovery Project (grant no. DP180101229). Giancarlo Bonotto has been supported by the Melbourne Research Scholarship, the Victorian Department of Environment, Land, Water and Planning, and Goulburn Broken Catchment Management Authority (grant no. TP 707158). Anthony Kiem has been supported by ARC Discovery Project (grant no. DP180102522; “Flooding in Australia – are we properly prepared for how bad it can get?”). The authors thank Wouter Knoben, for critical feedback on the draft, and reviewers Dengfeng Liu and Markus Hrachowitz, for their helpful suggestions.
This research has been supported by the Australian Research Council (grant nos. LP180100796, LP170100598, CE170100023, DE200100086, DE210100479, DP180101229, and DP180102522) and the Department of Environment, Land, Water and Planning, State Government of Victoria (grant no. TP707158).
This paper was edited by Fuqiang Tian and reviewed by Markus Hrachowitz and Dengfeng Liu.
ABARES (Australian Bureau of Agricultural and Resource Economics and Sciences): Australia's plantations 2016, Spatial dataset, Australian Government [data set], https://www.awe.gov.au/abares/forestsaustralia/forest-data-maps-and-tools/spatial-data/australias-plantations (last access: 12 April 2022), 2016.
Abram, N. J., Henley, B. J., Sen Gupta, A., Lippmann, T. J., Clarke, H., Dowdy, A. J., Sharples, J. J., Nolan, R. H., Tianran Zhang, T., Wooster, M. J., Wurtzel, J. B., Meissner, K. J., Pitman, A. J., Ukkola, A. M., Murphy, B. P., Tapper N. J., and Boer, M. M.: Connections of climate change and variability to large and extreme forest fires in southeast Australia, Communications Earth & Environment, 2, 1–17, https://doi.org/10.1038/s43247-020-00065-8, 2021.
Allen, C. D. and Breshears, D. D.: Drought-induced shift of a forest–woodland ecotone: rapid landscape response to climate variation. P. Natl. Acad. Sci., 95, 14839–14842, https://doi.org/10.1073/pnas.95.25.14839, 1998.
Alvarez-Garreton, C., Boisier, J. P., Garreaud, R., Seibert, J., and Vis, M.: Progressive water deficits during multiyear droughts in basins with long hydrological memory in Chile, Hydrol. Earth Syst. Sci., 25, 429–446, https://doi.org/10.5194/hess-25-429-2021, 2021.
Ainsworth, E. A. and Long, S. P.: What have we learned from 15 years of free-air CO2 enrichment (FACE)? A meta-analytic review of the responses of photosynthesis, canopy properties and plant production to rising CO2, New Phytol., 165, 351–372, https://doi.org/10.1111/j.1469-8137.2004.01224.x, 2005.
Ajami, H., Sharma, A., Band, L. E., Evans, J. P., Tuteja, N. K., Amirthanathan, G. E., and Bari, M. A.: On the non-stationarity of hydrological response in anthropogenically unaffected catchments: an Australian perspective, Hydrol. Earth Syst. Sci., 21, 281–294, https://doi.org/10.5194/hess-21-281-2017, 2017.
Argent, R. M.: Inland water, in: Australia state of the environment 2016, Australian Government Department of the Environment and Energy, Canberra, https://doi.org/10.4226/94/58b656cfc28d1, 2017.
Arnold, J. G., Potter, K. N., King, K. W., and Allen, P. M.: Estimation of soil cracking and the effect on surface runoff in a Texas Blackland Prairie watershed, Hydrol. Process., 19, 589–603, https://doi.org/10.1002/hyp.5609, 2005.
Avanzi, F., Rungee, J., Maurer, T., Bales, R., Ma, Q., Glaser, S., and Conklin, M.: Climate elasticity of evapotranspiration shifts the water balance of Mediterranean climates during multi-year droughts, Hydrol. Earth Syst. Sci., 24, 4317–4337, https://doi.org/10.5194/hess-24-4317-2020, 2020.
Benyon, R. G. and Doody, T. M.: Water use by tree plantations in south east South Australia, CSIRO Forestry and Forest products report series, no. 148, ISBN 9780643065321, https://doi.org/10.4225/08/585eb80e79dcd, 2004.
Beven, K. and Germann, P.: Macropores and water flow in soils, Water Resour. Res., 18, 1311–1325, https://doi.org/10.1029/WR018i005p01311, 1982.
Beven, K. J.: Uniqueness of place and process representations in hydrological modelling, Hydrol. Earth Syst. Sci., 4, 203–213, https://doi.org/10.5194/hess-4-203-2000, 2000.
Beven, K. J. and Chappell, N. A.: Perceptual perplexity and parameter parsimony, Wiley Interdisciplinary Reviews: Water, 8, e1530, https://doi.org/10.1002/wat2.1530, 2021.
Blackman, C. J., Li, X., Choat, B., Rymer, P. D., De Kauwe, M. G., Duursma, R. A., Tissue, D. T., and Medlyn, B. E.: Desiccation time during drought is highly predictable across species of Eucalyptus from contrasting climates, New Phytol., 224, 632–643, https://doi.org/10.1111/nph.16042, 2019.
Blöschl, G., Bierkens, M. F., Chambel, A., Cudennec, C., Destouni, G., Fiori, A., et al.: Twenty-three unsolved problems in hydrology (UPH) – a community perspective, Hydrolog. Sci. J., 64, 1141–1158, https://doi.org/10.1080/02626667.2019.1620507, 2019.
Bouaziz, L., Weerts, A., Schellekens, J., Sprokkereef, E., Stam, J., Savenije, H., and Hrachowitz, M.: Redressing the balance: quantifying net intercatchment groundwater flows, Hydrol. Earth Syst. Sci., 22, 6415–6434, https://doi.org/10.5194/hess-22-6415-2018, 2018.
Bouaziz, L. J. E., Aalbers, E. E., Weerts, A. H., Hegnauer, M., Buiteveld, H., Lammersen, R., Stam, J., Sprokkereef, E., Savenije, H. H. G., and Hrachowitz, M.: Ecosystem adaptation to climate change: the sensitivity of hydrological predictions to time-dynamic model parameters, Hydrol. Earth Syst. Sci., 26, 1295–1318, https://doi.org/10.5194/hess-26-1295-2022, 2022.
Brooks, J. R., Barnard, H. R., Coulombe, R., and McDonnell, J. J.: Ecohydrologic separation of water between trees and streams in a Mediterranean climate, Nat. Geosci., 3, 100–104, https://doi.org/10.1038/NGEO722, 2010.
Brown, A. E., Zhang, L., McMahon, T. A., Western, A. W., and Vertessy, R. A.: A review of paired catchment studies for determining changes in water yield resulting from alterations in vegetation, J. Hydrol., 310, 28–61, https://doi.org/10.1016/j.jhydrol.2004.12.010, 2005.
Brown, S. C., Versace, V. L., Lester, R. E., and Walter, M. T.: Assessing the impact of drought and forestry on streamflows in south-eastern Australia using a physically based hydrological model, Environ. Earth Sci., 74, 6047–6063, https://doi.org/10.1007/s12665-015-4628-8, 2015.
Caplan, J. S., Giménez, D., Hirmas, D. R., Brunsell, N. A., Blair, J. M., and Knapp, A. K.: Decadal-scale shifts in soil hydraulic properties as induced by altered precipitation, Science Advances, 5, eaau6635, https://doi.org/10.1126/sciadv.aau6635, 2019.
Cartwright, I. and Gilfedder, B.: Mapping and quantifying groundwater inflows to Deep Creek (Maribyrnong catchment, SE Australia) using 222Rn, implications for protecting groundwater-dependant ecosystems, Appl. Geochem., 52, 118–129, https://doi.org/10.1016/j.apgeochem.2014.11.020, 2015.
Cartwright, I., Weaver, T. R., Fulton, S., Nichol, C., Reid, M., and Cheng, X.: Hydrogeochemical and isotopic constraints on the origins of dryland salinity, Murray Basin, Victoria, Australia, Appl. Geochem., 19, 1233–1254, https://doi.org/10.1016/j.apgeochem.2003.12.006, 2004.
Cassel, D. K. and Nielsen, D. R. Field capacity and available water capacity, Methods of soil analysis: Part 1 Physical and mineralogical methods, 5, 901–926, https://doi.org/10.2136/sssabookser5.1.2ed.c36, 1986.
Chiew, F. H. S., Potter, N. J., Vaze, J., Petheram, C., Zhang, L., Teng, J., and Post, D. A.: Observed hydrologic non-stationarity in far south-eastern Australia: implications for modelling and prediction, Stoch. Environ. Res. Risk A., 28, 3–15, https://doi.org/10.1007/s00477-013-0755-5, 2014.
Clark, M. P., Nijssen, B., Lundquist, J. D., Kavetski, D., Rupp, D. E., Woods, R. A., Freer, J. E., Gutmann, E. D., Wood, A. W., Brekke, L. D., Arnold, J. R., Gochis, D. J., and Rasmussen, R. M.: A unified approach for process-based hydrologic modeling: 1. Modeling concept, Water Resour. Res., 51, 2498–2514, https://doi.org/10.1002/2015WR017198, 2015.
Cheng, L, Zhang, L., Wang, Y. P., Canadell, J. G., Chiew, F. H. S., Beringer, J., Li, L., Miralles, D. G., Piao, S., and Zhang, Y.: Recent increases in terrestrial carbon uptake at little cost to the water cycle, Nat. Commun., 8, 110, https://doi.org/10.1038/s41467-017-00114-5, 2017.
Condon, L. E., Markovich, K. H., Kelleher, C. A., McDonnell, J. J., Ferguson, G., and McIntosh, J. C.: Where is the bottom of a watershed?, Water Resour. Res., 56, e2019WR026010, https://doi.org/10.1029/2019WR026010, 2020.
Connell, D.: The Role of the Commonwealth Environmental Water Holder, in: Basin futures: water reform in the Murray-Darling basin, edited by: Connell, D. and Quentin Grafton, R., ANU Press, https://doi.org/10.22459/BF.05.2011.20, 2011.
Connell, D. and Grafton, Q. (Eds.): Basin futures: water reform in the Murray-Darling basin, ANU Press, https://doi.org/10.22459/BF.05.2011, 2011.
Cook, P.: A guide to regional groundwater flow in fractured rock aquifers. CSIRO publishing, ISBN 1 74008 233 8, https://citeseerx.ist.psu.edu/document?repid=rep1&type=pdf&doi=8ba781c0a31b6dcae84b31fb6313d44c0c44df5c (last access: 25 November 2022), 2003.
Cook, B. I., Mankin, J. S., and Anchukaitis, K. J.: Climate change and drought: From past to future, Current Climate Change Reports, 4, 164–179, https://doi.org/10.1007/s40641-018-0093-2, 2018.
Cornish, P. S., Tullberg, J. N., Lemerle, D., and Flower, K.: No-Till Farming Systems in Australia, in: No-till Farming Systems for Sustainable Agriculture, 511–531, Springer, Cham, https://doi.org/10.1007/978-3-030-46409-7_29, 2020.
CSIRO: AUS SRTM 1sec MRVBF mosaic v01, Bioregional Assessment Source Dataset, CSIRO [data set], https://data.gov.au/data/dataset/79975b4a-1204-4ab1-b02b-0c6fbbbbbcb5 (last access: 30 July 2021), 2016.
Deb, P., Kiem, A. S., and Willgoose, G.: Mechanisms influencing non-stationarity in rainfall-runoff relationships in southeast Australia, J. Hydrol., 571, 749–764, https://doi.org/10.1016/j.jhydrol.2019.02.025, 2019.
De Kauwe, M. G., Medlyn, B. E., Knauer, J., and Williams, C. A.: Ideas and perspectives: how coupled is the vegetation to the boundary layer?, Biogeosciences, 14, 4435–4453, https://doi.org/10.5194/bg-14-4435-2017, 2017.
De Kauwe, M. G., Medlyn, B. E., Ukkola, A. M., Mu, M., Sabot, M. E. B., Pitman, A. J., Meir, P., Cernusak, L. A., Rifai, S. W., Choat, B., Tissue, D. T., Blackman, C. J., Li, X., Roderick, M., and Briggs, P. R.: Identifying areas at risk of drought-induced tree mortality across South-Eastern Australia, Glob. Change Biol., 26, 5716–5733, https://doi.org/10.1111/gcb.15215, 2020.
De Kauwe, M. G., Medlyn, B. E., and Tissue, D. T.: To what extent can rising CO2 ameliorate plant drought stress?, New Phytol., 231, 2118–2124, https://doi.org/10.1111/nph.17540, 2021.
Denson, E., Wasko, C., and Peel, M. C.: Decreases in relative humidity across Australia, Environ. Res. Lett., 16, 074023, https://doi.org/10.1088/1748-9326/ac0aca, 2021.
Dey, R., Gallant, A. J. E., Lewis, S.C.,: Evidence of a continent-wide shift of episodic rainfall in Australia, Weather and Climate Extremes, 29, 100274, https://doi.org/10.1016/j.wace.2020.100274, 2020.
D'Odorico, P. and Porporato, A. Preferential states in soil moisture and climate dynamics, P. Natl. Acad. Sci., 101, 8848–8851, https://doi.org/10.1073/pnas.0401428101, 2004.
Dresel, P. E., Dean, J. F., Perveen, F., Webb, J. A., Hekmeijer, P., Adelana, S. M., and Daly, E.: Effect of Eucalyptus plantations, geology, and precipitation variability on water resources in upland intermittent catchments, J. Hydrol., 564, 723–739, https://doi.org/10.1016/j.jhydrol.2018.07.019, 2018.
DSE (Department of Sustainability and Environment, Victoria): SAFE (Secure Allocations, Future Entitlements) Groundwater Catchment Systems Report, ISBN 978-1-74287-552-1, http://beta.vvg.org.au/maynard/view_resource.php?resource_id=4336&account=a020b5775c3d4447295a4c758a5394ca (last access: 24 November 2022), 2012.
Duff, J., Jenkin, J., and David, G.: The Axe Creek salinity study, part A: catchment characterisation for salinity control, Report to the Victorian Government, https://vro.agriculture.vic.gov.au/dpi/vro/nthcenregn.nsf/pages/nc_axe_creek, (last access: 24 November 2022) 1982.
Dunne, T. and Black, R. D.: Partial area contributions to storm runoff in a small New England watershed, Water Resour. Res., 6, 1296–1311, https://doi.org/10.1029/WR006i005p01296, 1970.
Elliott, K. J., Miniat, C. F., Pederson, N., and Laseter, S. H.: Forest tree growth response to hydroclimate variability in the southern Appalachians, Glob. Change Biol., 21, 4627–4641, https://doi.org/10.1111/gcb.13045, 2015.
Farley, K. A., Jobbágy, E. G., and Jackson, R. B.: Effects of afforestation on water yield: a global synthesis with implications for policy, Glob. Change Biol., 11, 1565–1576, https://doi.org/10.1111/j.1365-2486.2005.01011.x, 2005.
Ferdowsian, R., D. J. Pannell, C. McCarron, A. Ryder, and Crossing, L.: Explaining groundwater hydrographs: Separating atypical rainfall events from time trends, Aust. J. Soil Res., 39, 861–875, https://doi.org/10.1071/SR00037, 2001.
Feikema, P. M., Sherwin, C. B., and Lane, P. N.: Influence of climate, fire severity and forest mortality on predictions of long term streamflow: potential effect of the 2009 wildfire on Melbourne's water supply catchments, J. Hydrol., 488, 1–16, https://doi.org/10.1016/j.jhydrol.2013.02.001, 2013.
Fensham, R. J., Fairfax, R. J., and Archer, S. R.: Rainfall, land use and woody vegetation cover change in semi-arid Australian savanna, J. Ecol., 93, 596–606, https://doi.org/10.1111/j.1365-2745.2005.00998.x, 2005.
Filipović, V., Weninger, T., Filipović, L., Schwen, A., Bristow, K. L., Zechmeister-Boltenstern, S., and Leitner, S.: Inverse estimation of soil hydraulic properties and water repellency following artificially induced drought stress, J. Hydrol. Hydromech., 66, 170, https://doi.org/10.2478/johh-2018-0002, 2018.
Fitzgerald, G. J., Tausz, M., Armstrong, R., Panozzo, J., Trębicki, P., Mollah, M., Tausz-Posch, S., Walker, C., Nuttall, J. G., Bourgault, M., Löw, M., and O'Leary, G. J.: Elevated CO2 in semi-arid cropping systems: A synthesis of research from the Australian Grains Free Air CO2 Enrichment (AGFACE) research program, Adv. Agron., 171, 1–73, https://doi.org/10.1016/bs.agron.2021.08.001, 2021.
Fowler, K., Morden, R., Lowe, L., and Nathan, R.: Advances in assessing the impact of hillside farm dams on streamflow, Australasian Journal of Water Resources, 19, 96–108, https://doi.org/10.1080/13241583.2015.1116182, 2015.
Fowler, K., Coxon, G., Freer, J., Peel, M., Wagener, T., Western, A., Woods, R., and Zhang, L.: Simulating runoff under changing climatic conditions: A framework for model improvement, Water Resour. Res., 54, 9812–9832, https://doi.org/10.1029/2018WR023989, 2018.
Fowler, K., Knoben, W., Peel, M., Peterson, T., Ryu, D., Saft, M., Seo, K., and Western, A.: Many commonly used rainfall-runoff models lack long, slow dynamics: Implications for runoff projections, Water Resour. Res., 56, e2019WR025286, https://doi.org/10.1029/2019WR025286, 2020a.
Fowler, K., Acharya, S. C., Addor, N., Chou, C., and Peel, M.: CAMELS-AUS v1: Hydrometeorological time series and landscape attributes for 222 catchments in Australia, PANGAEA [data set], https://doi.org/10.1594/PANGAEA.921850, 2020b.
Fowler, K., Peel, M., Saft, M., Nathan, R., Horne, A., Wilby, R., McCutcheon, C., and Peterson, T.: Hydrological shifts threaten water resources, Water Resour. Res., 58, e2021WR031210, https://doi.org/10.1029/2021WR031210, 2022.
Fowler, K. J., Peel, M. C., Western, A. W., Zhang, L., and Peterson, T. J.: Simulating runoff under changing climatic conditions: Revisiting an apparent deficiency of conceptual rainfall-runoff models, Water Resour. Res., 52, 1820–1846, https://doi.org/10.1002/2015WR018068, 2016.
Fowler, K. J. A., Acharya, S. C., Addor, N., Chou, C., and Peel, M. C.: CAMELS-AUS: hydrometeorological time series and landscape attributes for 222 catchments in Australia, Earth Syst. Sci. Data, 13, 3847–3867, https://doi.org/10.5194/essd-13-3847-2021, 2021.
Freund, M., Henley, B. J., Karoly, D. J., Allen, K. J., and Baker, P. J.: Multi-century cool- and warm-season rainfall reconstructions for Australia's major climatic regions, Clim. Past, 13, 1751–1770, https://doi.org/10.5194/cp-13-1751-2017, 2017.
Frisbee, M. D., Phillips, F. M., Weissmann, G. S., Brooks, P. D., Wilson, J. L., Campbell, A. R., and Liu, F.: Unraveling the mysteries of the large watershed black box: Implications for the streamflow response to climate and landscape perturbations, Geophys. Res. Lett., 39, L01404, https://doi.org/10.1029/2011GL050416, 2012.
Gallant, J. C. and Dowling, T. I.: A multiresolution index of valley bottom flatness for mapping depositional areas, Water Resour. Res., 39, 1347, https://doi.org/10.1029/2002WR001426, 2003.
Garreaud, R. D., Alvarez-Garreton, C., Barichivich, J., Boisier, J. P., Christie, D., Galleguillos, M., LeQuesne, C., McPhee, J., and Zambrano-Bigiarini, M.: The 2010–2015 megadrought in central Chile: impacts on regional hydroclimate and vegetation, Hydrol. Earth Syst. Sci., 21, 6307–6327, https://doi.org/10.5194/hess-21-6307-2017, 2017.
Gawne, B., Hale, J., Stewardson, M. J., Webb, J. A., Ryder, D. S., Brooks, S. S., Campbell, C. J., Capon, S. J., Everingham, P., Grace, M. R., Guarino, F., and Stoffels, R. J.: Monitoring of environmental flow outcomes in a large river basin: The Commonwealth Environmental Water Holder's long-term intervention in the Murray–Darling Basin, Australia, River Res. Appl., 36, 630–644, https://doi.org/10.1002/rra.3504, 2020.
Gedney, N., Cox, P. M., Betts, R. A., Boucher, O., Huntingford, C., and Stott, P. A.: Detection of a direct carbon dioxide effect in continental river runoff records, Nature, 439, 835–838, https://doi.org/10.1038/nature04504, 2006.
Gharun, M., Turnbull, T. L., and Adams, M. A.: Validation of canopy transpiration in a mixed-species foothill eucalypt forest using a soil–plant–atmosphere model, J. Hydrol., 492, 219–227, https://doi.org/10.1016/j.jhydrol.2013.03.051, 2013.
Grossiord, C., Buckley, T. N., Cernusak, L. A., Novick, K. A., Poulter, B., Siegwolf, R. T., Sperry, J. S., and McDowell, N. G.: Plant responses to rising vapor pressure deficit, New Phytol., 226, 1550–1566, https://doi.org/10.1111/nph.16485, 2020.
Guo, Y., Zhang, L., Zhang, Y., Wang, Z., and Zheng, H. X.: Estimating impacts of wildfire and climate variability on streamflow in Victoria, Australia, Hydrol. Process., 35, e14439, https://doi.org/10.1002/hyp.14439, 2021.
Habets, F., Molénat, J., Carluer, N., Douez, O., and Leenhardt, D.: The cumulative impacts of small reservoirs on hydrology: A review, Sci. Total Environ., 643, 850–867, https://doi.org/10.1016/j.scitotenv.2018.06.188, 2018.
Hannam, I.: Soil conservation in Australia, J. Soil Water Conserv., 58, 112A–115A, https://www.jswconline.org/content/58/6/112A (last access: 24 November 2022), 2003.
Heath, J. T., Chafer, C. J., Van Ogtrop, F. F., and Bishop, T. F. A.: Post-wildfire recovery of water yield in the Sydney Basin water supply catchments: An assessment of the 2001/2002 wildfires, J. Hydrol., 519, 1428–1440, https://doi.org/10.1016/j.jhydrol.2014.09.033, 2014.
Hirmas, D. R., Giménez, D., Nemes, A., Kerry, R., Brunsell, N. A., and Wilson, C. J.: Climate-induced changes in continental-scale soil macroporosity may intensify water cycle, Nature, 561, 100–103, https://doi.org/10.1038/s41586-018-0463-x, 2018.
Horridge, M., Madden, J., and Wittwer, G.: The impact of the 2002–2003 drought on Australia, J. Policy Model., 27, 285–308, https://doi.org/10.1016/j.jpolmod.2005.01.008, 2005.
Hovenden, M. J., Leuzinger, S., Newton, P. C., Fletcher, A., Fatichi, S., Lüscher, A., Reich, P. B., Andresen, L. C., Beier, C., Blumenthal, D. M., and Langley, J. A.: Globally consistent influences of seasonal precipitation limit grassland biomass response to elevated CO2, Nat. Plants, 5, 167–173, https://doi.org/10.1038/s41477-018-0356-x, 2019.
Hrachowitz, M., Fovet, O., Ruiz, L., and Savenije, H. H. Transit time distributions, legacy contamination and variability in biogeochemical scaling: how are hydrological response dynamics linked to water quality at the catchment scale?, Hydrol. Process., 29, 5241–5256., https://doi.org/10.1002/hyp.10546, 2015.
Huang, M. and Zhang, L.: Hydrological responses to conservation practices in a catchment of the Loess Plateau, China, Hydrol. Process., 18, 1885–1898, https://doi.org/10.1002/hyp.1454, 2004.
Hughes, J. D., Khan, S., Crosbie, R. S., Helliwell, S., and Michalk, D. L.: Runoff and solute mobilization processes in a semiarid headwater catchment, Water Resour. Res., 43, W09402, https://doi.org/10.1029/2006WR005465, 2007.
Hughes, J. D., Petrone, K. C., and Silberstein, R. P.: Drought, groundwater storage and stream flow decline in southwestern Australia, Geophys. Res. Lett, 39, L03408, https://doi.org/10.1029/2011GL050797, 2012.
Hulsman, P., Savenije, H. H. G., and Hrachowitz, M.: Learning from satellite observations: increased understanding of catchment processes through stepwise model improvement, Hydrol. Earth Syst. Sci., 25, 957–982, https://doi.org/10.5194/hess-25-957-2021, 2021a.
Hulsman, P., Hrachowitz, M., and Savenije, H. H.: Improving the representation of long-term storage variations with conceptual hydrological models in data-scarce regions, Water Resour. Res., 57, e2020WR028837, https://doi.org/10.1029/2020WR028837, 2021b.
Hunt, R. J. and Welter, D. E.: Taking account of “unknown unknowns”, Ground Water, 48, 477, https://doi.org/10.1111/j.1745-6584.2010.00681.x, 2010.
IPCC: Summary for Policymakers, in: Climate Change 2021: The Physical Science Basis. Contribution of Working Group I to the Sixth Assessment Report of the Intergovernmental Panel on Climate Change, edited by: MassonDelmotte, V., Zhai, P., Pirani, A., Connors, S. L., Péan, C., Berger, S., Caud, N., Chen, Y., Goldfarb, L., Gomis, M. I., Huang, M., Leitzell, K., Lonnoy, E., Matthews, J. B. R., Maycock, T. K., Waterfield, T., Yelekçi, O., Yu, R., and Zhou, B., Cambridge University Press, ISBN 978-92-9169-158-6, 2021.
Jaramillo, F. and Destouni, G. Developing water change spectra and distinguishing change drivers worldwide, Geophys. Res. Lett., 41, 8377–8386, https://doi.org/10.1002/2014GL061848, 2014.
Jaramillo, F., Cory, N., Arheimer, B., Laudon, H., van der Velde, Y., Hasper, T. B., Teutschbein, C., and Uddling, J.: Dominant effect of increasing forest biomass on evapotranspiration: interpretations of movement in Budyko space, Hydrol. Earth Syst. Sci., 22, 567–580, https://doi.org/10.5194/hess-22-567-2018, 2018.
Jensen, C. K., McGuire, K. J., and Prince, P. S.: Headwater stream length dynamics across four physiographic provinces of the Appalachian Highlands, Hydrol. Process., 31, 3350–3363, https://doi.org/10.1002/hyp.11259, 2017.
Jensen, C. K., McGuire, K. J., Shao, Y., and Andrew Dolloff, C.: Modeling wet headwater stream networks across multiple flow conditions in the Appalachian Highlands, Earth Surf. Proc. Land., 43, 2762–2778, https://doi.org/10.1002/esp.4431, 2018.
Jury, W. A., Wang, Z., and Tuli, A. A conceptual model of unstable flow in unsaturated soil during redistribution, Vadose Zone J., 2, 61–67, https://doi.org/10.2136/vzj2003.6100, 2003.
Kirono, D. G., Round, V., Heady, C., Chiew, F. H., and Osbrough, S.: Drought projections for Australia: updated results and analysis of model simulations, Weather and Climate Extremes, 30, 100280, https://doi.org/10.1016/j.wace.2020.100280, 2020.
Kuczera, G.: Prediction of water yield reductions following a bushfire in ash-mixed species eucalypt forest, J. Hydrol., 94, 215–236, https://doi.org/10.1016/0022-1694(87)90054-0, 1987.
Lambers, H.: Dryland salinity: A key environmental issue in southern Australia. Plant and Soil, v-vii, https://www.jstor.org/stable/24124331 (last access: 24 November 2022), 2003.
Lane, P. N., Best, A. E., Hickel, K., and Zhang, L.: The response of flow duration curves to afforestation, J. Hydrol., 310, 253–265, https://doi.org/10.1016/j.jhydrol.2005.01.006, 2005.
Lane, P. N., Sheridan, G. J., and Noske, P. J.: Changes in sediment loads and discharge from small mountain catchments following wildfire in south eastern Australia, J. Hydrol., 331, 495–510, https://doi.org/10.1016/j.jhydrol.2006.05.035, 2006.
Leblanc, M. J., Tregoning, P., Ramillien, G., Tweed, S. O., and Fakes, A.: Basin-scale, integrated observations of the early 21st century multiyear drought in southeast Australia, Water Resour. Res., 45, W04408, https://doi.org/10.1029/2008WR007333, 2009.
Legg, P., Frakes, I., and Gavran, M.: Australian plantation statistics and log availability report 2021, ABARES research report, Canberra, October, https://doi.org/10.25814/xj7c-p829, 2021.
Liu, N., Kala, J., Liu, S., Haverd, V., Dell, B., Smettem, K. R., and Harper, R. J.: Drought can offset potential water use efficiency of forest ecosystems from rising atmospheric CO2, J. Environ. Sci., 90, 262–274, https://doi.org/10.1016/j.jes.2019.11.020, 2020.
Liu, Y., Tian, F., Hu, H., and Sivapalan, M.: Socio-hydrologic perspectives of the co-evolution of humans and water in the Tarim River basin, Western China: the Taiji–Tire model, Hydrol. Earth Syst. Sci., 18, 1289–1303, https://doi.org/10.5194/hess-18-1289-2014, 2014.
Marcar, N.: Prospects for managing salinity in southern Australia using trees on farmland, in: Agroforestry for the management of waterlogged saline soils and poor-quality waters, edited by: Dagar, J. C. and Minhas, P., Switzerland: Springer India, https://link.springer.com/content/pdf/10.1007/978-81-322-2659-8.pdf (last access: 24 November 2022), 2016.
Malerba, M. E., Wright, N., and Macreadie, P. I.: A continental-scale assessment of density, size, distribution and historical trends of farm dams using deep learning convolutional neural networks, Remote Sensing, 13, 319, https://doi.org/10.3390/rs13020319, 2021.
Markovich, K. H., Manning, A. H., Condon, L. E., and McIntosh, J. C.: Mountain-block recharge: A review of current understanding, Water Resour. Res., 55, 8278–8304, https://doi.org/10.1029/2019WR025676, 2019.
Massari, C., Avanzi, F., Bruno, G., Gabellani, S., Penna, D., and Camici, S.: Evaporation enhancement drives the European water-budget deficit during multi-year droughts, Hydrol. Earth Syst. Sci., 26, 1527–1543, https://doi.org/10.5194/hess-26-1527-2022, 2022.
McDowell, N., Pockman, W. T., Allen, C. D., Breshears, D. D., Cobb, N., Kolb, T., Plaut, J., Sperry, J., West, A., Williams, E., and Yepez, E. A.: Mechanisms of plant survival and mortality during drought: why do some plants survive while others succumb to drought?, New Phytol., 178, 719–739, https://doi.org/10.1111/j.1469-8137.2008.02436.x, 2008.
McGlynn, B. L., McDonnel, J. J., and Brammer, D. D.: A review of the evolving perceptual model of hillslope flowpaths at the Maimai catchments, New Zealand, J. Hydrol., 257, 1–26, https://doi.org/10.1016/S0022-1694(01)00559-5, 2002.
McNaughton, K. G. and Jarvis, P. G.: Effects of spatial scale on stomatal control of transpiration, Agr. Forest Meteorol., 54, 279–302, https://doi.org/10.1016/0168-1923(91)90010-N, 1991.
Milly, P. C., Betancourt, J., Falkenmark, M., Hirsch, R. M., Kundzewicz, Z. W., Lettenmaier, D. P., and Stouffer, R. J.: Stationarity is dead: Whither water management?, Science, 319, 573–574, https://doi.org/10.1126/science.1151915, 2008.
Montanari, A., Young, G., Savenije, H. H. G., Hughes, D., Wagener, T., Ren, L. L., Koutsoyiannis, D., Cudennec, C., Toth, E., Grimaldi, S., Blöschl, G., Sivapalan, M., Beven, K., Gupta, H., Hipsey, M., Schaefli, B., Arheimer, B., Boegh, E., Schymanski, S. J., Di Baldassarre, G., Yu, B., Hubert, P., Huang, Y., Schumann, A., Post, D. A., Srinivasan, V., Harman, C., Thompson, S., Rogger, M., Viglione, A., McMillan, H., Characklis, G., Pang, Z., and Belyaev, V.: “Panta Rhei – everything flows”: change in hydrology and society – the IAHS scientific decade 2013–2022, Hydrolog. Sci. J., 58, 1256–1275, https://doi.org/10.1080/02626667.2013.809088, 2013.
Morden, R., Horne, A., Bond, N. R., Nathan, R., and Olden, J. D.: Small artificial impoundments have big implications for hydrology and freshwater biodiversity, Front. Ecol. Environ., 20, 141–146, https://doi.org/10.1002/fee.2454, 2021.
Morgan, J. A., Pataki, D. E., Körner, C., Clark, H. E. N. R. Y., Del Grosso, S. J., Grünzweig, J. M., Knapp, A. K., Mosier, A. R., Newton, P. C. D., Niklaus, P. A., Nippert, J. B., Nowak, R. S., Parton, W. J., Polley, H. W. and Shaw, M. R.: Water relations in grassland and desert ecosystems exposed to elevated atmospheric CO2, Oecologia, 140, 11–25, https://doi.org/10.1007/s00442-004-1550-2, 2004.
Morgan, J. A., LeCain, D. R., Pendall, E., Blumenthal, D. M., Kimball, B. A., Carrillo, Y., Williams, D. G., Heisler-White, J., Dijkstra, F. A., and West, M.: C4 grasses prosper as carbon dioxide eliminates desiccation in warmed semi-arid grassland, Nature, 476, 202–205, https://doi.org/10.1038/nature10274, 2011.
Morin, E.: To know what we cannot know: Global mapping of minimal detectable absolute trends in annual precipitation, Water Resour. Res., 47, W07505, https://doi.org/10.1029/2010WR009798, 2011.
Morton, F. I.: Practical estimates of lake evaporation, J. Appl. Meteorol. Clim., 25, 371–387, https://doi.org/10.1175/1520-0450(1986)025<0371:PEOLE>2.0.CO;2, 1986.
Munroe , S. E., McInerney, F. A., Andrae, J., Welti, N., Guerin, G. R., Leitch, E., Hall, T., Szarvas, S., Atkins, R., Caddy-Retalic, S., and Sparrow, B.: The photosynthetic pathways of plant species surveyed in Australia's national terrestrial monitoring network, Scientific Data, 8, 1–10, https://doi.org/10.1038/s41597-021-00877-z, 2021.
Naeth, M. A., Bailey, A. W., Chanasyk, D. S., and Pluth, D. J.: Water holding capacity of litter and soil organic matter in mixed prairie and fescue grassland ecosystems of Alberta, Rangeland Ecology & Management/Journal of Range Management Archives, 44, 13–17, https://doi.org/10.2307/4002630, 1991.
Nimmo, J. R.: The processes of preferential flow in the unsaturated zone, Soil Sci. Soc. Am. J., 85, 1–27, https://doi.org/10.1002/saj2.20143, 2021.
Nolan, R. H., Mitchell, P. J., Bradstock, R. A., and Lane, P. N.: Structural adjustments in resprouting trees drive differences in post-fire transpiration, Tree Physiol., 34, 123–136, https://doi.org/10.1093/treephys/tpt125, 2014.
Nolan, R. H., Lane, P. N., Benyon, R. G., Bradstock, R. A., and Mitchell, P. J.: Trends in evapotranspiration and streamflow following wildfire in resprouting eucalypt forests, J. Hydrol., 524, 614–624, https://doi.org/10.1016/j.jhydrol.2015.02.045, 2015.
Nolan, R. H., Gauthey, A., Losso, A., Medlyn, B. E., Smith, R., Chhajed, S. S., Fuller, K., Song, M., Li, X., Beaumont, L. J., Boer, M. M., Wright, I. J. and Choat, B.: Hydraulic failure and tree size linked with canopy die-back in eucalypt forest during extreme drought, New Phytol., 230, 1354–1365, https://doi.org/10.1111/nph.17298, 2021.
Nyman, P., Sheridan, G., and Lane, P. N.: Synergistic effects of water repellency and macropore flow on the hydraulic conductivity of a burned forest soil, south-east Australia, Hydrol. Process., 24, 2871–2887, https://doi.org/10.1002/hyp.7701, 2010.
O'Grady, A., Carter, J., and Holland, K.: Review of Australian groundwater discharge studies of terrestrial systems, CSIRO: Water for a Healthy Country National Research Flagship Report series, ISSN 1835-095X, 60 pp., https://publications.csiro.au/rpr/download?pid=csiro:EP101579&dsid=DS7 (last access: 25 November 2022), 2010.
Peel, M. C.: Hydrology: catchment vegetation and runoff, Prog. Phys. Geogr., 33, 837–844, https://doi.org/10.1177/0309133309350122, 2009.
Pepler, A. S., Dowdy, A. J., and Hope, P.: The differing role of weather systems in southern Australian rainfall between 1979–1996 and 1997–2015, Clim. Dynam., 56, 2289–2302, https://doi.org/10.1007/s00382-020-05588-6, 2021.
Peterson, T. J. and Western, A. W.: Nonlinear time-series modeling of unconfined groundwater head, Water Resour. Res., 50, 8330–8355, https://doi.org/10.1002/2013WR014800, 2014.
Peterson, T. J., Argent, R. M., Western, A. W., and Chiew, F. H. S.: Multiple stable states in hydrological models: An ecohydrological investigation, Water Resour. Res., 45, W03406, https://doi.org/10.1029/2008WR006886, 2009.
Peterson, T. J., Saft, M., Peel, M. C., and John, A.: Watersheds may not recover from drought, Science, 372, 745–749, https://doi.org/10.1126/science.abd5085, 2021.
Petheram, C., Potter, N., Vaze, J., Chiew, F., and Zhang, L.: Towards better understanding of changes in rainfall-runoff relationships during the recent drought in south-eastern Australia, in: 19th International Congress on Modelling and Simulation, Perth, Australia, 12–16, https://doi.org/10.36334/modsim.2011.I6.petheram, 2011.
Petrone, K. C., Hughes, J. D., Van Niel, T. G., and Silberstein, R. P.: Streamflow decline in southwestern Australia, 1950–2008, Geophys. Res. Lett., 37, L11401, https://doi.org/10.1029/2010GL043102, 2010.
Piao, S., Friedlingstein, P., Ciais, P., de Noblet-Ducoudré, N., Labat, D., and Zaehle, S.: Changes in climate and land use have a larger direct impact than rising CO2 on global river runoff trends, P. Natl. Acad. Sci. USA, 104, 15242–15247, https://doi.org/10.1073/pnas.0707213104, 2007.
Potter, N. J., Chiew, F. H. S., and Frost, A. J.: An assessment of the severity of recent reductions in rainfall and runoff in the Murray–Darling Basin, J. Hydrol., 381, 52–64, https://doi.org/10.1016/j.jhydrol.2009.11.025, 2010.
Potter, N. J. and Chiew, F. H. S.: An investigation into changes in climate characteristics causing the recent very low runoff in the southern Murray-Darling Basin using rainfall-runoff models, Water Resour. Res., 47, W00G10, https://doi.org/10.1029/2010WR010333, 2011.
Rempe, D. and Dietrich, W.: Direct observations of rock moisture, a hidden component of the hydrologic cycle, P. Natl. Acad. Sci. Mar, 2018, 115, 2664–2669, https://doi.org/10.1073/pnas.1800141115, 2018.
Renchon, A. A., Griebel, A., Metzen, D., Williams, C. A., Medlyn, B., Duursma, R. A., Barton, C. V. M., Maier, C., Boer, M. M., Isaac, P., Tissue, D., Resco de Dios, V., and Pendall, E.: Upside-down fluxes Down Under: CO2 net sink in winter and net source in summer in a temperate evergreen broadleaf forest, Biogeosciences, 15, 3703–3716, https://doi.org/10.5194/bg-15-3703-2018, 2018.
Rifai, S. W., De Kauwe, M. G., Ukkola, A. M., Cernusak, L. A., Meir, P., Medlyn, B. E., and Pitman, A. J.: Thirty-eight years of CO2 fertilization has outpaced growing aridity to drive greening of Australian woody ecosystems, Biogeosciences, 19, 491–515, https://doi.org/10.5194/bg-19-491-2022, 2022.
Robinson , D., Jones, S. B., Lebron, I., Reinsch, S., Domínguez, M. T., Smith, A. R., Jones, D. L., Marshall, M. R., and Emmett, B. A.: Experimental evidence for drought induced alternative stable states of soil moisture, Sci. Rep.-UK, 6, 1–6, https://doi.org/10.1038/srep20018, 2018.
Rodriguez-Iturbe, I., D'odorico, P., Porporato, A., and Ridolfi, L.: On the spatial and temporal links between vegetation, climate, and soil moisture, Water Resour. Res., 35, 3709–3722, https://doi.org/10.1029/1999WR900255, 1999.
Roodari, A., Hrachowitz, M., Hassanpour, F., and Yaghoobzadeh, M.: Signatures of human intervention – or not? Downstream intensification of hydrological drought along a large Central Asian river: the individual roles of climate variability and land use change, Hydrol. Earth Syst. Sci., 25, 1943–1967, https://doi.org/10.5194/hess-25-1943-2021, 2021.
Saffarpour, S., Western, A. W., Adams, R., and McDonnell, J. J.: Multiple runoff processes and multiple thresholds control agricultural runoff generation, Hydrol. Earth Syst. Sci., 20, 4525–4545, https://doi.org/10.5194/hess-20-4525-2016, 2016.
Saft, M., Western, A. W., Zhang, L., Peel, M. C., and Potter, N. J.: The influence of multiyear drought on the annual rainfall-runoff relationship: An Australian perspective, Water Resour. Res., 51, 2444–2463, https://doi.org/10.1002/2014WR015348, 2015.
Saft, M., Peel, M. C., Western, A. W., Perraud, J. M., and Zhang, L.: Bias in streamflow projections due to climate-induced shifts in catchment response, Geophys. Res. Lett., 43, 1574–1581, https://doi.org/10.1002/2015GL067326, 2016a.
Saft, M., Peel, M. C., Western, A. W., and Zhang, L.: Predicting shifts in rainfall-runoff partitioning during multiyear drought: Roles of dry period and catchment characteristics, Water Resour. Res., 52, 9290–9305, https://doi.org/10.1002/2016WR019525, 2016b.
Saft, M., Peel, M. C., and Peterson, T. J.: Explaining the shifts in hydrological response due to multiyear drought and subsequent recovery or non-recovery, in: Vol. 2019, AGU Fall Meeting Abstracts, H33A-05, 2019.
Salama, R. B., Farrington, P., Bartle, G. A., and Watson, G. D.: The role of geological structures and relict channels in the development of dryland salinity in the wheatbelt of Western Australia, Aust. J. Earth Sci., 40, 45–56, https://doi.org/10.1080/08120099308728062, 1993.
Sawada, Y. and Koike, T.: Ecosystem resilience to the Millennium drought in southeast Australia (2001–2009), J. Geophys. Res.-Biogeo., 121, 2312–2327, https://doi.org/10.1002/2016JG003356, 2016.
Schewe, J., Heinke, J., Gerten, D., Haddeland, I., Arnell, N. W., Clark, D. B., et al.: Multimodel assessment of water scarcity under climate change, P. Natl. Acad. Sci. USA, 111, 3245–3250, https://doi.org/10.1073/pnas.1222460110, 2014.
Schofield, N. J.: Tree planting for dryland salinity control in Australia, Agroforest. Syst., 20, 1–23, https://doi.org/10.1007/978-94-011-1832-3_1, 1992.
Semple, B., Rankin, M., Koen, T., and Geeves, G.: A note on tree deaths during the current (2001–?) drought in South-eastern Australia, Aust. Geogr., 41, 391–401, https://doi.org/10.1080/00049182.2010.498042, 2010.
Skinner, D. and Langford, J.: Legislating for sustainable basin management: the story of Australia's Water Act (2007), Water Policy, 15, 871–894, https://doi.org/10.2166/wp.2013.017, 2013.
SKM, CSIRO and Bureau of Regional Sciences: Surface and/or groundwater interception activities: initial estimates. Waterlines report, National Water Commission, Canberra, ISBN 978-1-921107-97-9, https://www.mdba.gov.au/sites/default/files/pubs/1006-BPKId-surface-groundwater-interception-activities_0.pdf (last access: 25 November 2022), 2010.
Speich, M. J. R., Zappa, M., Scherstjanoi, M., and Lischke, H.: FORests and HYdrology under Climate Change in Switzerland v1.0: a spatially distributed model combining hydrology and forest dynamics, Geosci. Model Dev., 13, 537–564, https://doi.org/10.5194/gmd-13-537-2020, 2020.
Staudinger, M., Stoelzle, M., Cochand, F., Seibert, J., Weiler, M., and Hunkeler, D.: Your work is my boundary condition!: Challenges and approaches for a closer collaboration between hydrologists and hydrogeologists, J. Hydrol., 571, 235–243, https://doi.org/10.1016/j.jhydrol.2019.01.058, 2019.
Stenson, M. P., Littleboy, M., and Gilfedder, M.: Estimation of water and salt generation from unregulated upland catchments, Environ. Modell. Softw., 26, 1268–1278, https://doi.org/10.1016/j.envsoft.2011.05.013, 2011.
Stephens, C. M., McVicar, T. R., Johnson, F. M., and Marshall, L. A.: Revisiting pan evaporation trends in Australia a decade on, Geophys. Res. Lett., 45, 11–164, https://doi.org/10.1029/2018GL079332, 2018.
Stephens, C. M., Marshall, L. A., Johnson, F. M., Lin, L., Band, L. E., and Ajami, H.: Is past variability a suitable proxy for future change? A virtual catchment experiment, Water Resour. Res., 56, e2019WR026275, https://doi.org/10.1029/2019WR026275, 2020.
Stephens, C. M., Lall, U., Johnson, F. M., and Marshall, L. A.: Landscape changes and their hydrologic effects: Interactions and feedbacks across scales, Earth-Sci. Rev., 212, 103466, https://doi.org/10.1016/j.earscirev.2020.103466, 2021.
Tauro, F.: River basins on the edge of change, Science, 372, 680–681, https://doi.org/10.1126/science.abi8770, 2021.
Tian, W., Bai, P., Wang, K., Liang, K., and Liu, C.: Simulating the change of precipitation-runoff relationship during drought years in the eastern monsoon region of China, Sci. Total Environ., 723, 138172, https://doi.org/10.1016/j.scitotenv.2020.138172, 2020.
Trancoso, R., Larsen, J. R., McVicar, T. R., Phinn, S. R., and McAlpine, C. A.: CO2-vegetation feedbacks and other climate changes implicated in reducing base flow, Geophys. Res. Lett., 44, 2310–2318, https://doi.org/10.1002/2017GL072759, 2017.
Uddin, S., Parvin, S., Löw, M., Fitzgerald, G. J., Tausz-Posch, S., Armstrong, R., and Tausz, M.: Water use dynamics of dryland canola (Brassica napus L.) grown on contrasting soils under elevated CO2, Plant Soil, 438, 205–222, https://doi.org/10.1007/s11104-019-03987-1, 2019.
Uddling, J., Teclaw, R. M., Kubiske, M. E., Pregitzer, K. S., and Ellsworth, D. S.: Sap flux in pure aspen and mixed aspen–birch forests exposed to elevated concentrations of carbon dioxide and ozone, Tree Physiol., 28, 1231–1243, https://doi.org/10.1093/treephys/28.8.1231, 2008.
Ukkola, A. M., Prentice, I. C., Keenan, T. F., Van Dijk, A. I., Viney, N. R., Myneni, R. B., and Bi, J.: Reduced streamflow in water-stressed climates consistent with CO2 effects on vegetation, Nat. Clim. Change, 6, 75–78, https://doi.org/10.1038/nclimate2831, 2016.
Van der Velde, Y., Vercauteren, N., Jaramillo, F., Dekker, S. C., Destouni, G., and Lyon, S. W. Exploring hydroclimatic change disparity via the Budyko framework, Hydrol. Process., 28, 4110–4118, https://doi.org/10.1002/hyp.9949, 2014.
Van Dijk, A. I., Beck, H. E., Crosbie, R. S., de Jeu, R. A., Liu, Y. Y., Podger, G. M., Timbal, B., and Viney, N. R.: The Millennium Drought in southeast Australia (2001–2009): Natural and human causes and implications for water resources, ecosystems, economy, and society, Water Resour. Res., 49, 1040–1057, https://doi.org/10.1002/wrcr.20123, 2013.
Van Loon, A. F. and Van Lanen, H. A. J.: A process-based typology of hydrological drought, Hydrol. Earth Syst. Sci., 16, 1915–1946, https://doi.org/10.5194/hess-16-1915-2012, 2012.
Van Loon, A. F., Gleeson, T., Clark, J., Van Dijk, A. I., Stahl, K., Hannaford, J., Di aldassarre, G., Teuling, A. J., Tallaksen, L. M., Uijlenhoet, R., Hannah, D. M., Sheffield, J., Svoboda, M., Verbeiren, B., Wagener, T., Rangecroft, S., Wanders, N., and Van Lanen, H. A.: Drought in the Anthropocene, Nat. Geosci., 9, 89–91, https://doi.org/10.1038/ngeo2646, 2016.
Verdon-Kidd, D. C. and Kiem, A. S.: Nature and causes of protracted droughts in southeast Australia: Comparison between the Federation, WWII, and Big Dry droughts, Geophys. Res. Lett., 36, L22707, https://doi.org/10.1029/2009GL041067, 2009.
Wagener, T., Sivapalan, M., Troch, P. A., McGlynn, B. L., Harman, C. J., Gupta, H. V., Kumar, P., Rao, P. S. C., Basu, N. B., and Wilson, J. S.: The future of hydrology: An evolving science for a changing world, Water Resour. Res., 46, W05301, https://doi.org/10.1029/2009WR008906, 2010.
Wagener, T., Gleeson, T., Coxon, G., Hartmann, A., Howden, N., Pianosi, F., Rahman, M., Rosolem, R., Stein, L., and Woods, R.: On doing hydrology with dragons: Realizing the value of perceptual models and knowledge accumulation, Wiley Interdisciplinary Reviews: Water, 8, e1550, https://doi.org/10.1002/wat2.1550, 2021.
Walker, G., Gilfeder, M., Evans, R., Dyson, P., and Stauffacher, M. Groundwater flow systems framework – essential tools for salinity management, https://www.mdba.gov.au/sites/default/files/archived/mdbc-GW-reports/2082_GW_Flow_Systems_framework_report.pdf (last access: 25 November 2022), 2003.
Warren, J. M., Pötzelsberger, E., Wullschleger, S. D., Thornton, P. E., Hasenauer, H., and Norby, R. J.: Ecohydrologic impact of reduced stomatal conductance in forests exposed to elevated CO2, Ecohydrology, 4, 196–210, https://doi.org/10.1002/eco.173, 2011.
Wasko, C. and Nathan, R.: Influence of changes in rainfall and soil moisture on trends in flooding, J. Hydrol., 575, 432–441, https://doi.org/10.1016/j.jhydrol.2019.05.054, 2019.
Wasko, C., Nathan, R., and Peel, M. C.: Changes in antecedent soil moisture modulate flood seasonality in a changing climate, Water Resour. Res., 56, e2019WR026300, https://doi.org/10.1029/2019WR026300, 2020.
Webb, A. A. and Kathuria, A.: Response of streamflow to afforestation and thinning at Red Hill, Murray Darling Basin, Australia, J. Hydrol., 412–413, 133–140, https://doi.org/10.1016/j.jhydrol.2011.05.033, 2012.
Weligamage, H., Fowler, K., Peterson, T., Saft, M., Ryu, D., and Peel, M.: Observation based gridded annual runoff estimates over Victoria, Australia, MODSIM21, 24th International Congress on Modelling & Simulation, https://doi.org/10.36334/modsim.2021.k11.weligamage, 2021.
Westra, S., Thyer, M., Leonard, M., Kavetski, D., and Lambert, M.: A strategy for diagnosing and interpreting hydrological model nonstationarity, Water Resour. Res., 50, 5090–5113, 2014.
Xie, Q., Huete, A., Hall, C. C., Medlyn, B. E., Power, S. A., Davies, J. M., Medek, D. E., and Beggs, P. J.: Satellite-observed shifts in C3/C4 abundance in Australian grasslands are associated with rainfall patterns, Remote Sens. Environ., 273, 112983, https://doi.org/10.1016/j.rse.2022.112983, 2022.
Yang, J., Medlyn, B. E., De Kauwe, M. G., and Duursma, R. A.: Applying the concept of ecohydrological equilibrium to predict steady state leaf area index, J. Adv. Model. Earth Sy., 10, 1740–1758, https://doi.org/10.1029/2017MS001169, 2018.
Yang, Y., Guan, H., Batelaan, O., McVicar, T. R., Long, D., Piao, S., Liang, W., Liu, B., Jin, Z., and Simmons, C. T.: Contrasting responses of water use efficiency to drought across global terrestrial ecosystems, Sci. Rep.-UK, 6, 1–8, https://doi.org/10.1038/srep23284, 2016.
Zhang, L., Dawes, W. R., and Walker, G. R.: Response of mean annual evapotranspiration to vegetation changes at catchment scale, Water Resour. Res., 37, 701–708, https://doi.org/10.1029/2000WR900325, 2001.
Zhang, Y. and Schilling, K.: Increasing streamflow and baseflow in Mississippi River since the 1940 s: Effect of land use change, J. Hydrol., 324, 412–422, https://doi.org/10.1016/j.jhydrol.2005.09.033, 2006.
Zhu, R., Zheng, H., Jakeman, A., and Zhang, L.: Tracer-aided assessment of catchment groundwater dynamics and residence time, J. Hydrol., 598, 126230, https://doi.org/10.1016/j.jhydrol.2021.126230, 2021.
Ideally Fig. 3c would plot the data against catchment-specific thresholds of runoff production, but this varies temporally and is difficult to quantify. Thus, a simple threshold is used instead, as marked in Fig. 3c.
- Abstract
- Introduction
- Current understanding of drought-induced hydrological shifts
- Possible process explanations
- Evidence-based critique of hypotheses
- Future research and monitoring needs
- Conclusion
- Appendix A: Data sources for Figs. 7 and 8
- Appendix B: Maps of precipitation, streamflow, and runoff coefficient
- Appendix C: Drivers of potential spring evapotranspiration (additional figures)
- Appendix D: Comparison of climatic conditions: during versus after the Millennium Drought
- Appendix E: Miscellaneous figures
- Code and data availability
- Author contributions
- Competing interests
- Disclaimer
- Acknowledgements
- Financial support
- Review statement
- References