the Creative Commons Attribution 4.0 License.
the Creative Commons Attribution 4.0 License.
 | 15 Nov 2022
Influence of intensive agriculture and geological heterogeneity on the recharge of an arid aquifer system (Saq–Ram, Arabian Peninsula) inferred from GRACE data
Julio Gonçalvès
Bruno Hamelin
Thomas Stieglitz
Pierre Deschamps
This study assesses the detailed water budget of the Saq–Ram Aquifer System (520 000 km2) over the 2002–2019 period using satellite gravity data from the Gravity Recovery And Climate Experiment (GRACE). The three existing GRACE solutions were tested for their local compatibility to compute groundwater storage (GWS) variations in combination with the three soil moisture datasets available from the land surface models (LSMs) of the Global Land Data Assimilation System (GLDAS). Accounting for groundwater pumping, artificial recharge, and natural discharge uniformly distributed over the Saq–Ram domain, the GRACE-derived mass balance calculation for water yields a long-term estimate of the domain-averaged natural recharge of (2.4±1.4) mm yr−1, corresponding to (4.4±2.6) % of the annual average rainfall (AAR).
Beyond the regional-scale approach proposed here, spatial heterogeneities regarding the groundwater recharge were identified. The first source of heterogeneity is of anthropogenic origin: chiefly induced by irrigation excess over irrigated surfaces (about 1 % of the domain), artificial recharge corresponds to half of the total recharge of the aquifer. The second source of recharge heterogeneity identified here is natural: volcanic lava deposits (called harrats on the Arabian Peninsula) which cover 8 % of the Saq–Ram aquifer domain but contribute to more than 50 % of the natural recharge. Hence, in addition to this application on the Arabian Peninsula, this study strongly indicates a major control of geological context on arid aquifer recharge, which has been poorly discussed hitherto.
Due to large lag times of the diffuse recharge mechanism, the annual analysis using this GRACE–GLDAS approach in arid domains should be limited to areas where focused recharge is the main mechanism, while long-term analysis is valid regardless of the recharge mechanism. Moreover, it appears that about 15 years of GRACE records are required to obtain a relevant long-term recharge estimate.
- Article
(2847 KB) - Full-text XML
-
Supplement
(475 KB) - BibTeX
- EndNote


Freshwater resources in arid regions of the world face growing pressure. Limited reserves, sporadic rainfall, droughts, agricultural production, increasing population, and living standards are contributing to environmental and economic pressures. As defined by Gleeson et al. (2020): “groundwater sustainability is maintaining long-term, dynamically stable storage and flows of high-quality groundwater using inclusive, equitable, and long-term governance and management”. Groundwater resources in arid zones have been heavily exploited for the past 50 years or so in order to meet growing demands, which has led to overexploitation and local long-term depletion in many cases (Al-Zyoud et al., 2015; Othman et al., 2018). When aquifer recharge is much lower than withdrawals, this depletion can constitute permanent groundwater mining (Bierkens and Wada, 2019; Wada et al., 2010). In arid and semi-arid regions, this is a frequent phenomenon, particularly where large aquifer replenishment mostly occurred under past climatic conditions (so-called “fossil aquifers”).
Shared between Jordan and Saudi Arabia, the Saq–Ram Aquifer System (0.5×10⁶ km2) is the main water resource of the region, the exploitation of which has enabled the development of intensive irrigated agriculture since the mid-1980s. This multi-layered aquifer system is part of the larger Arabian Aquifer System which has been recognized as one of the two most overstressed systems in the world, presenting the highest depletion rates combined with the lowest available recharges (Richey et al., 2015). Despite having significant groundwater reserves, Saudi Arabia had to cope with these difficulties by abandoning its goal of cereal self-sufficiency when groundwater mining became evident (Konikow and Kendy, 2005).
Groundwater recharge is a pivotal term of an aquifer's water mass balance when it comes to assessing the (un)sustainability of its exploitation. Recharge can be assessed indirectly or directly (Banks et al., 2021; Shanafield and Cook, 2014) by studying either surface water bodies (e.g. seepage meters, baseflow discharge, heat tracers), unsaturated (e.g. lysimeters) or saturated zones (e.g. water-table fluctuation). Various types of estimation methods (MacDonald et al., 2021) such as numerical models, tracer approaches (e.g. stable isotopes, tritium, chloride), physical approaches (e.g. Darcy's law), and remote sensing (e.g. gravity-based approach) are routinely applied. While generally low in an arid context, recharge can be highly variable in both space and time, making its estimation even more complex (Scanlon et al., 2006).
Local-scale studies have demonstrated that whilst the Saq–Ram Aquifer System was mainly recharged under past wet climatic conditions, it is currently receiving a modest modern recharge. A groundwater model applied on the Tabuk region of Saudi Arabia (Kawecki and Pim, 1987 in Lloyd and Pim, 1990) yielded a lateral groundwater flow of 3.1 mm yr−1 at steady state which indicates that the natural recharge must be a minor proportion of this figure considering the regional water-table decline initiated in the mid-1980s. More recently, Al-Sagaby and Moallim (2001) applied a chloride mass balance (CMB) method on a sand dune located in the Al Qasim region and derived 1.8 mm yr−1 of natural recharge, i.e. 2.5 % of the annual average rainfall (AAR). Other chloride mass balance approaches were applied to small alluvial aquifers of the Asir and Hijaz mountains (along the Red Sea in western Saudi Arabia; Bazuhair and Wood, 1996) yielding recharges equal to approximately 3.5 % of the AAR. A Darcy's law method involving the average hydraulic gradient observed on the Saq sandstone outcrops south of Tayma revealed a natural recharge of 2.5 mm yr−1 (i.e. 4.3 % of the AAR; BRGM and Abunayyan Trading Corp., 2008). The methods used in most of these studies are relevant and convenient when applied at local scales; they are however much more challenging to integrate over large multi-layered aquifers such as the Saq–Ram Aquifer System.
Since 2002, the GRACE (Gravity Recovery And Climate Experiment) twin-satellite system has provided monthly Earth gravity measurements over large domains, variations of which are chiefly due to mass changes in water bodies (Landerer and Swenson, 2012). GRACE gravity variations integrate terrestrial water storage (TWS) variations which include groundwater storage (GWS) variations over large regional-scale aquifers. Without the use of specific downscaling approaches, these selected aquifers are usually larger than 0.1×10⁶ km2, given the native spatial resolution of the GRACE data (filtered up to for some products; Landerer and Swenson, 2012; Wiese et al., 2016). As it is much less time- and cost-consuming than ground-based methods, this remote-sensing approach has been widely used for quantifying variations in aquifer storage (e.g. Bonsor et al., 2018; Othman et al., 2018; Ramillien et al., 2014; Richey et al., 2015; Scanlon et al., 2021; Sun, 2013). Some studies implemented GRACE-derived GWS variations in regional-scale mass balance equations to estimate the domain-averaged recharge for large regional aquifers of the Saharan belt (from 0.6×10⁶ to 2×10⁶ km2; Gonçalvès et al., 2013; Mohamed et al., 2017; Mohamed and Gonçalvès, 2021).
Likewise, Fallatah et al. (2019) applied this approach to the Saq Aquifer System, considering a 440 000 km2 surface area domain excluding the Jordanian part (i.e. Ram aquifer), even though it has been recognized as hydrologically connected to the Saq (UN-ESCWA and BGR, 2013). Using a unique GRACE solution (i.e. CSR RL05M v1) over the 2002–2016 period, their study yielded 11.9 mm yr−1 of total recharge, i.e. natural plus artificial recharge (mostly irrigation return flow from agricultural practices and some wastewater reinjection in large cities). Subtracting an irrigation return flow of about 2.3 mm yr−1, using a plausible 15 % out of the 7800×106 m3 yr−1 mean agricultural pumping during 2002–2016 (Gonçalves et al., 2013), yields a residual natural recharge estimate of 9.6 mm yr−1, which is significantly higher than previous estimates from local studies mentioned above (i.e. approximately 2.5 mm yr−1). This natural recharge, estimated using Fallatah et al. (2019), equates to about 18 % of the AAR over the Saq Aquifer System, while similar arid-zone aquifers (in the Sahara) present recharges of (1.8±0.3) % of the AAR with the same GRACE-derived method (Mohamed and Gonçalvès, 2021). Furthermore, MacDonald et al. (2021) established a recent synthesis of groundwater recharge estimates in Africa using more local methods (chloride mass balance, environmental tracers, water balance, calibrated groundwater models, and soil physics methods). Considering only the arid regions presenting annual precipitations below 150 mm, their study revealed on average recharges corresponding to (3.3±5.5) % of the AAR.
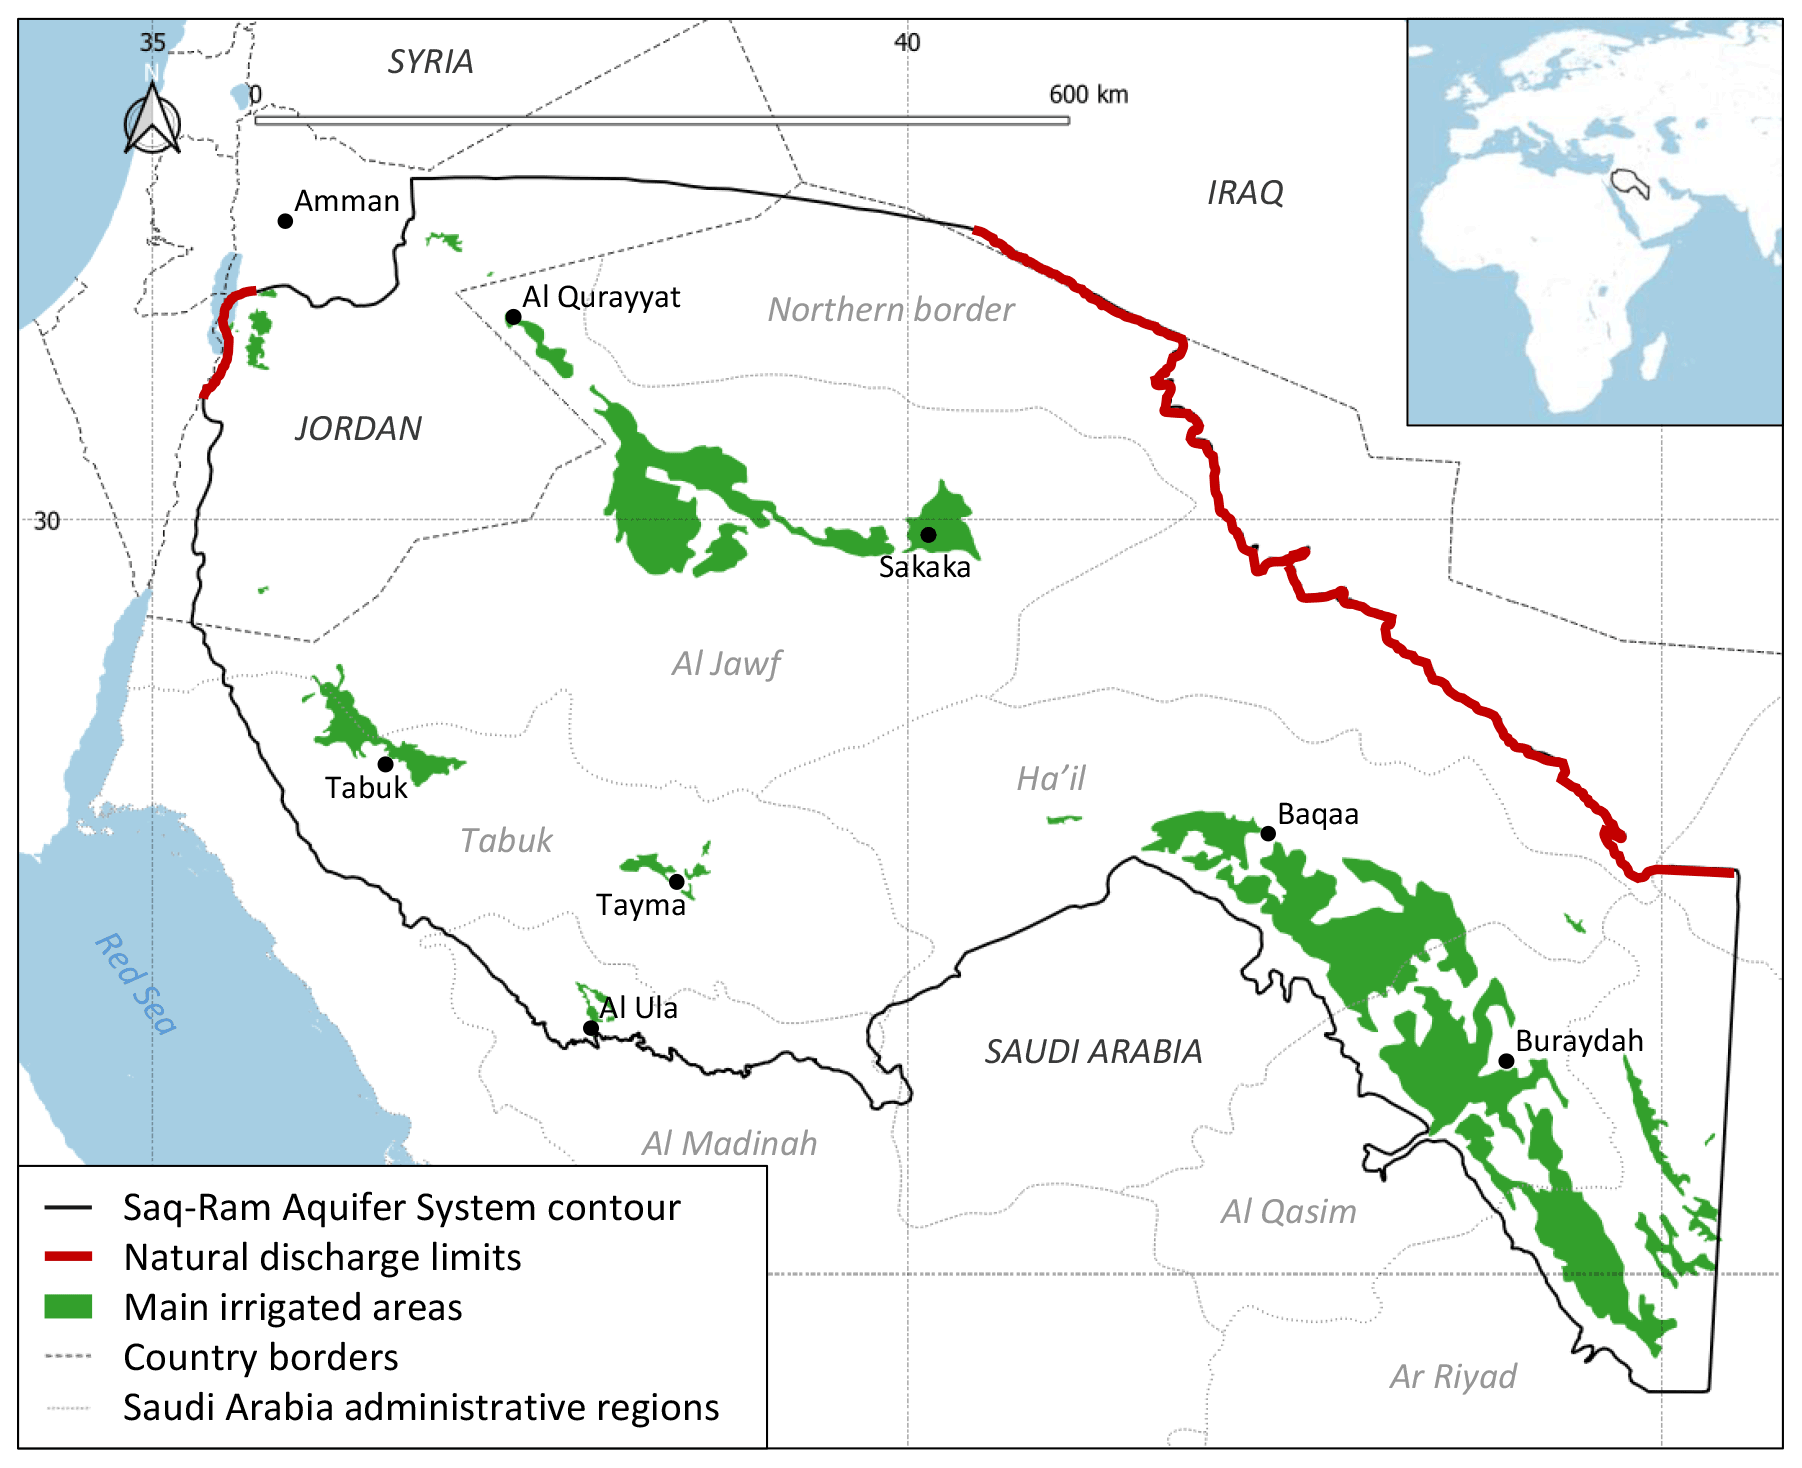
Figure 1Context map of the Saq–Ram Aquifer System (WGS84 coordinates shown by straight dotted lines every 5∘ (Shorelines and country borders extracted from Wessel and Smith, 1996; Administrative regions extracted from https://www.gadm.org/, last access: 10 November 2022).
The present study proposes a reappraisal of the GRACE-derived water budget of the combined Saq–Ram Aquifer System, accounting for groundwater withdrawal, natural drainage, and artificial recharge in order to provide a long-term estimate (2002–2019) of the domain-averaged natural recharge. The three existing GRACE solutions (Jet Propulsion Laboratory – JPL, Centre for Space Research – CSR, Goddard Space Flight Center – GSFC) were tested for their local compatibility to compute GWS variations by combining with the three soil moisture datasets (Variable Infiltration Capacity – VIC, Community Land Surface Model – CLSM, National Oceanic and Atmospheric administration model – NOAH) available from the land surface models (LSMs) of the Global Land Data Assimilation System (GLDAS). The relevance and consequences of such an application of the GRACE–GLDAS approach on arid aquifers in terms of temporal resolution of the recharge are discussed. Leading to domain-averaged values for the groundwater fluxes, the integrative approach proposed here was then refined by identifying first-order spatial heterogeneities regarding the recharge of the Saq–Ram aquifer: (i) the comparison between the natural recharge obtained here and the values identified for other large arid aquifers is used to highlight a major geological control on recharge distribution; (ii) distributed over the agricultural areas, the overall irrigation excess provides a reliable estimate of the artificial recharge; (iii) this artificial recharge corresponds to half of the total aquifer recharge.
2.1 Study site
Underlying the Nafud desert of the northern Arabian Peninsula, the Saq–Ram Aquifer System (520 000 km2 spanning 10∘ longitude and 8∘ latitude) constitutes the main water resource supporting vital needs of more than 3.5 million people (considering the Disi–Mudawarra water conveyance system in Jordan (UN-ESCWA and BGR, 2013). Since the mid-1980s, its intensive exploitation through large irrigated areas (Fig. 1) has been quickly recognized as causing a depletion of the groundwater resource, making it one of the world's most overstressed aquifer systems to date (Richey et al., 2015).
Mean annual temperature is about 26 ∘C ranging between 27 and 43 ∘C in summer, and between 8 and 20 ∘C in winter. Typical of other arid domains, recharge (when it occurs) is associated with intermittent rainfall events (de Vries and Simmers, 2002). Extracted from the Climatic Research Unit database (CRU; Harris et al., 2020), the long-term annual average rainfall (AAR) over the studied domain is 55 mm yr−1 (over the period 1901–2019), with a maximum of 80 mm in 1982- and a minimum of about 40 mm in 1978 and 2009 (Fig. 2).
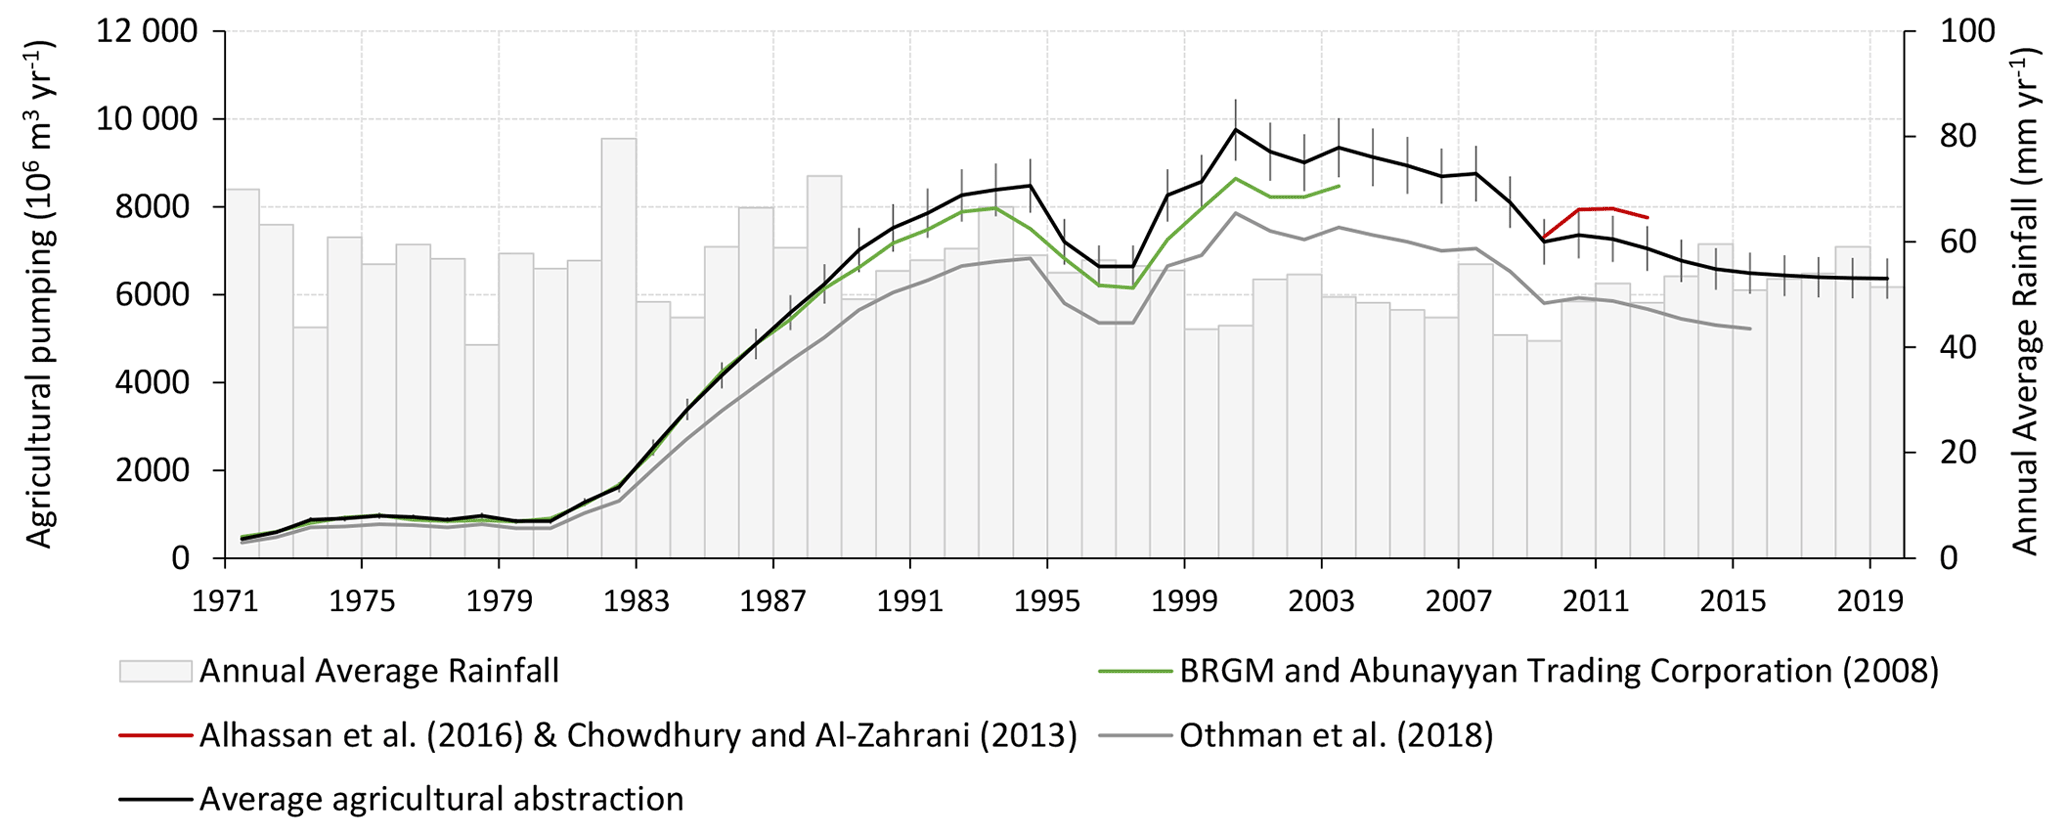
Figure 2Annual average rainfall (Climatic Research Unit; mm yr−1) of the Saq–Ram Aquifer System and agricultural withdrawal (from different sources represented by coloured lines; 106 m3 yr−1) of its Saudi part (except for Othman et al.'s, 2018 data corresponding to the Al-Qassim, Ha'il, and Al Jawf regions of Saudi Arabia). Most of these previously published data come from governmental entities, without providing any associated uncertainty.
2.2 Hydrogeological context
2.2.1 Definition of the reservoirs
Mainly located in the northern half of Saudi Arabia, and shared with Jordan, the overall Saq–Ram Aquifer System includes multiple subsystems of different depths and ages (Paleozoic, Mesozoic, and Cenozoic) which are mostly interconnected (see UN-ESCWA and BGR, 2013, for more details about these subsystems).
-
Paleozoic and Mesozoic deep aquifer systems:
-
the most productive Saq–Ram formation (western Saudi Arabia and Jordan);
-
Wasia–Biyadh–Aruma Aquifer System (northern Saudi Arabia).
-
-
Cenozoic shallow aquifer systems:
-
Basalt Aquifer System – Azraq–Dhuleil basin (Jordan);
-
Tawil Quaternary Aquifer System – Wadi Sirhan Basin (northern Saudi Arabia);
-
Umm er Radhuma–Dammam Aquifer System – Widyan–Salman (Saudi Arabia, Iraq, and Kuwait);
-
other Cenozoic and Quaternary overlying formations (e.g. harrats).
-
Hence, a succession of sedimentary formations (chiefly sandstone) unconformably overlies the southern Precambrian basement composed of igneous and metamorphic complexes. Dipping gradually towards the north-east to reach a 10 km thickness near the Arabian Gulf, these formations become locally confined (e.g. Hanadir and Qusaiba shale formation) but stay globally interconnected, especially by the late Cenozoic reactivation of the Kahf fault systems (Othman et al., 2018). The Tabuk–Al Ula and Al Qurayyat–Al Jawf regions are characterized by overlying volcanic lava deposits called harrats. These wide and thick heterogenous reservoirs constitute one of the largest multi-layered aquifer systems worldwide.
2.2.2 Natural discharge
In order to limit the error in the water balance associated with the lateral drainage as much as possible, this study focuses on the “large” Saq–Ram Aquifer System contour (Fig. 1) defined by Barthélemy et al. (2006). In this large-scale domain, the contact with the crystalline basement along the southwestern margin and the northern aquifer limit can be considered as no-flow boundaries. A drainage boundary toward the eastern flank of the Dead Sea was estimated at 54×106 m3 yr−1 by Siebert et al. (2014), or ranging between 30×106 and 90×106 m3 yr−1 (Salameh, 1996; Lensky et al., 2005; in Siebert et al., 2014). A further 80×106 m3 yr−1 groundwater drainage along the Iraqi border, toward the Umm er Radhuma–Dammam Aquifer System (and ultimately the Euphrates basin) was reported in Frenken and UN-FAO (2009). Other unquantified outlets exist (e.g. drainage toward the southern basement and the Khuff aquifer at the southeast), but these are likely minor factors in the water budget compared to other outflows in particular agricultural withdrawals. Moreover, Alsharhan and Nairn (1997) showed that the main Saq formation disappears around where the eastern vertical border (∼45∘ E, Fig. 1) has been outlined by Barthélemy et al. (2006). Finally, with regard to historical piezometric maps of the Saq aquifer (Sharaf and Hussein, 1996; Lloyd and Pim, 1990), it can be assumed that the southeastern limit with the Khuff aquifer is likely inactive, given the large drawdown cone created by the intensive pumping of the Al Qasim area.
2.2.3 Groundwater pumping
Groundwater pumping time series can be challenging to obtain in regions where the regulation and monitoring of withdrawals was implemented only recently, as in Saudi Arabia. For countries where most of the water resource is used for agriculture, these data are often estimated using proxies such as agricultural surfaces identified by satellite imagery combined with estimates of irrigation doses supplied per crop type. The BRGM and Abunayyan Trading Corp. (2008) applied such a method for each region of Saudi Arabia within the Saq aquifer (i.e. excluding the Jordanian part of the Saq–Ram Aquifer System) over the 1971–2003 period (Fig. 2). Othman et al. (2018) presented a time series (1970–2015) of the cumulative pumping amounts for the Al Qasim, Ha'il, and Al Jawf regions (Fig. 1) with data provided by the Water Resources Development Department in the Ministry of Environment, Water and Agriculture (MEWA) of Saudi Arabia (Fig. 2). This updated time series revealed a good correlation (R2=0.996) with the 1971–2003 BRGM estimates (indicating the same source of data), and the three regions considered account for the majority of agricultural withdrawals (85 % on average) from the Saq aquifer. In addition, Alhassan et al. (2016) and Chowdhury and Al-Zahrani (2013) provided regional values of the agricultural water demand for the 2009–2012 period, yielding an average 7.7×10⁹ m3 yr−1 for the Saq aquifer. Domestic withdrawals for 2003 are given by the BRGM and Abunayyan Trading Corp. (2008) for each region of Saudi Arabia, yielding 300×106 m3 yr−1 for the entire Saq aquifer in that year. The 2003 industrial water demand is also reported by the same authors at about 20×106 m3 yr−1.
Finally, Jordan groundwater pumping data are given by region in 2015 and 2017 by the Jordan Water Sector Facts and Figures (Almomani et al., 2015; http://www.mwi.gov.jo/Default/Ar, last access: 10 November 2022), both reporting about 300×106 m3 yr−1 for the Jordanian part of the Saq–Ram Aquifer System.
2.3 Gravity and soil moisture data
The GRACE twin-satellite system launched in 2002 by NASA and the German Aerospace Center (DLR) monitors the Earth's gravity at a spatial resolution on a monthly basis. Followed by GRACE-FO (GRACE Follow-On) in 2018, the mission measures gravity anomalies (i.e. gravity value of a given month minus the average value from January 2004 to December 2009), which are chiefly due to mass variations in water bodies (groundwater, soil water, and surface water). Monthly gravity anomalies, denoted as terrestrial water storage (TWS), are expressed in water height (i.e. equivalent water thickness) and can thus be used for hydrological mass balance calculations at the regional scale. After more than 1 decade of gravity field processing using spherical harmonics (Landerer and Swenson, 2012; Swenson and Wahr, 2006), an alternative interpretation using Mass Concentration blocks (termed Mascons) of discrete spherical caps at the Earth's surface was proposed (Watkins et al., 2015). The main advantage of this new interpretation is lower geophysical signal losses inducing less post-processing treatment. Provided by different computing centres (GRACE/GRACE-FO Mascon data are available at http://grace.jpl.nasa.gov, last access: 10 November 2022), three alternative solutions of Mascon interpretations were retrieved: (i) Jet Propulsion Laboratory (JPL; 3×3∘ squared tiles; Watkins et al., 2015; Wiese et al., 2019); (ii) Centre for Space Research (CSR; 1×1∘ hexagonal tiles; Save, 2020; Save et al., 2016); (iii) Goddard Space Flight Center (GSFC; 1×1∘ squared tiles; Loomis, 2020; Loomis et al., 2019).
The proposed scaling factors which correspond to downscaling factors (Scanlon et al., 2016) were not used here. In fact, these downscaling factors are based on the mass distribution calculated by LSMs accounting for surface and subsurface water transfers (Landerer and Swenson, 2012), while TWS variations in such arid regions are expected to be chiefly controlled by groundwater mass variations. Moreover, as stated by the authors, the use of such gain factors is not suitable to quantify trends. We used 187 monthly observations for the period between April 2002 and July 2020. The trend of a time series can be analysed and interpreted in terms of variation in water amounts (e.g. in mm yr−1) and thus net water fluxes over a domain of interest.
The Global Land Data Assimilation System (GLDAS; data available at https://ldas.gsfc.nasa.gov/gldas, last access: 10 November 2022) provides soil water storage (SWS) for the first couple of metres by combining ground-based, satellite data, and hydrological surface model results (Rodell et al., 2004). Matching the GRACE observation dates, we retrieved the 187 monthly data from the 2.1 versions with a spatial resolution computed with the (i) Variable Infiltration Capacity model (VIC; Beaudoing et al., 2020a); (ii) Community Land Surface model (CLSM; Li et al., 2020); and (iii) National Oceanic and Atmospheric administration model (NOAH; Beaudoing et al., 2020b).
The SWS anomalies were computed the same way as for the GRACE TWS anomalies, i.e. by subtracting the January 2004 to December 2009 average from each monthly value of the time series. Both the GRACE products and GLDAS solutions were spatially averaged using the surface weight of each polygon within the Saq–Ram aquifer domain (Fig. 3).
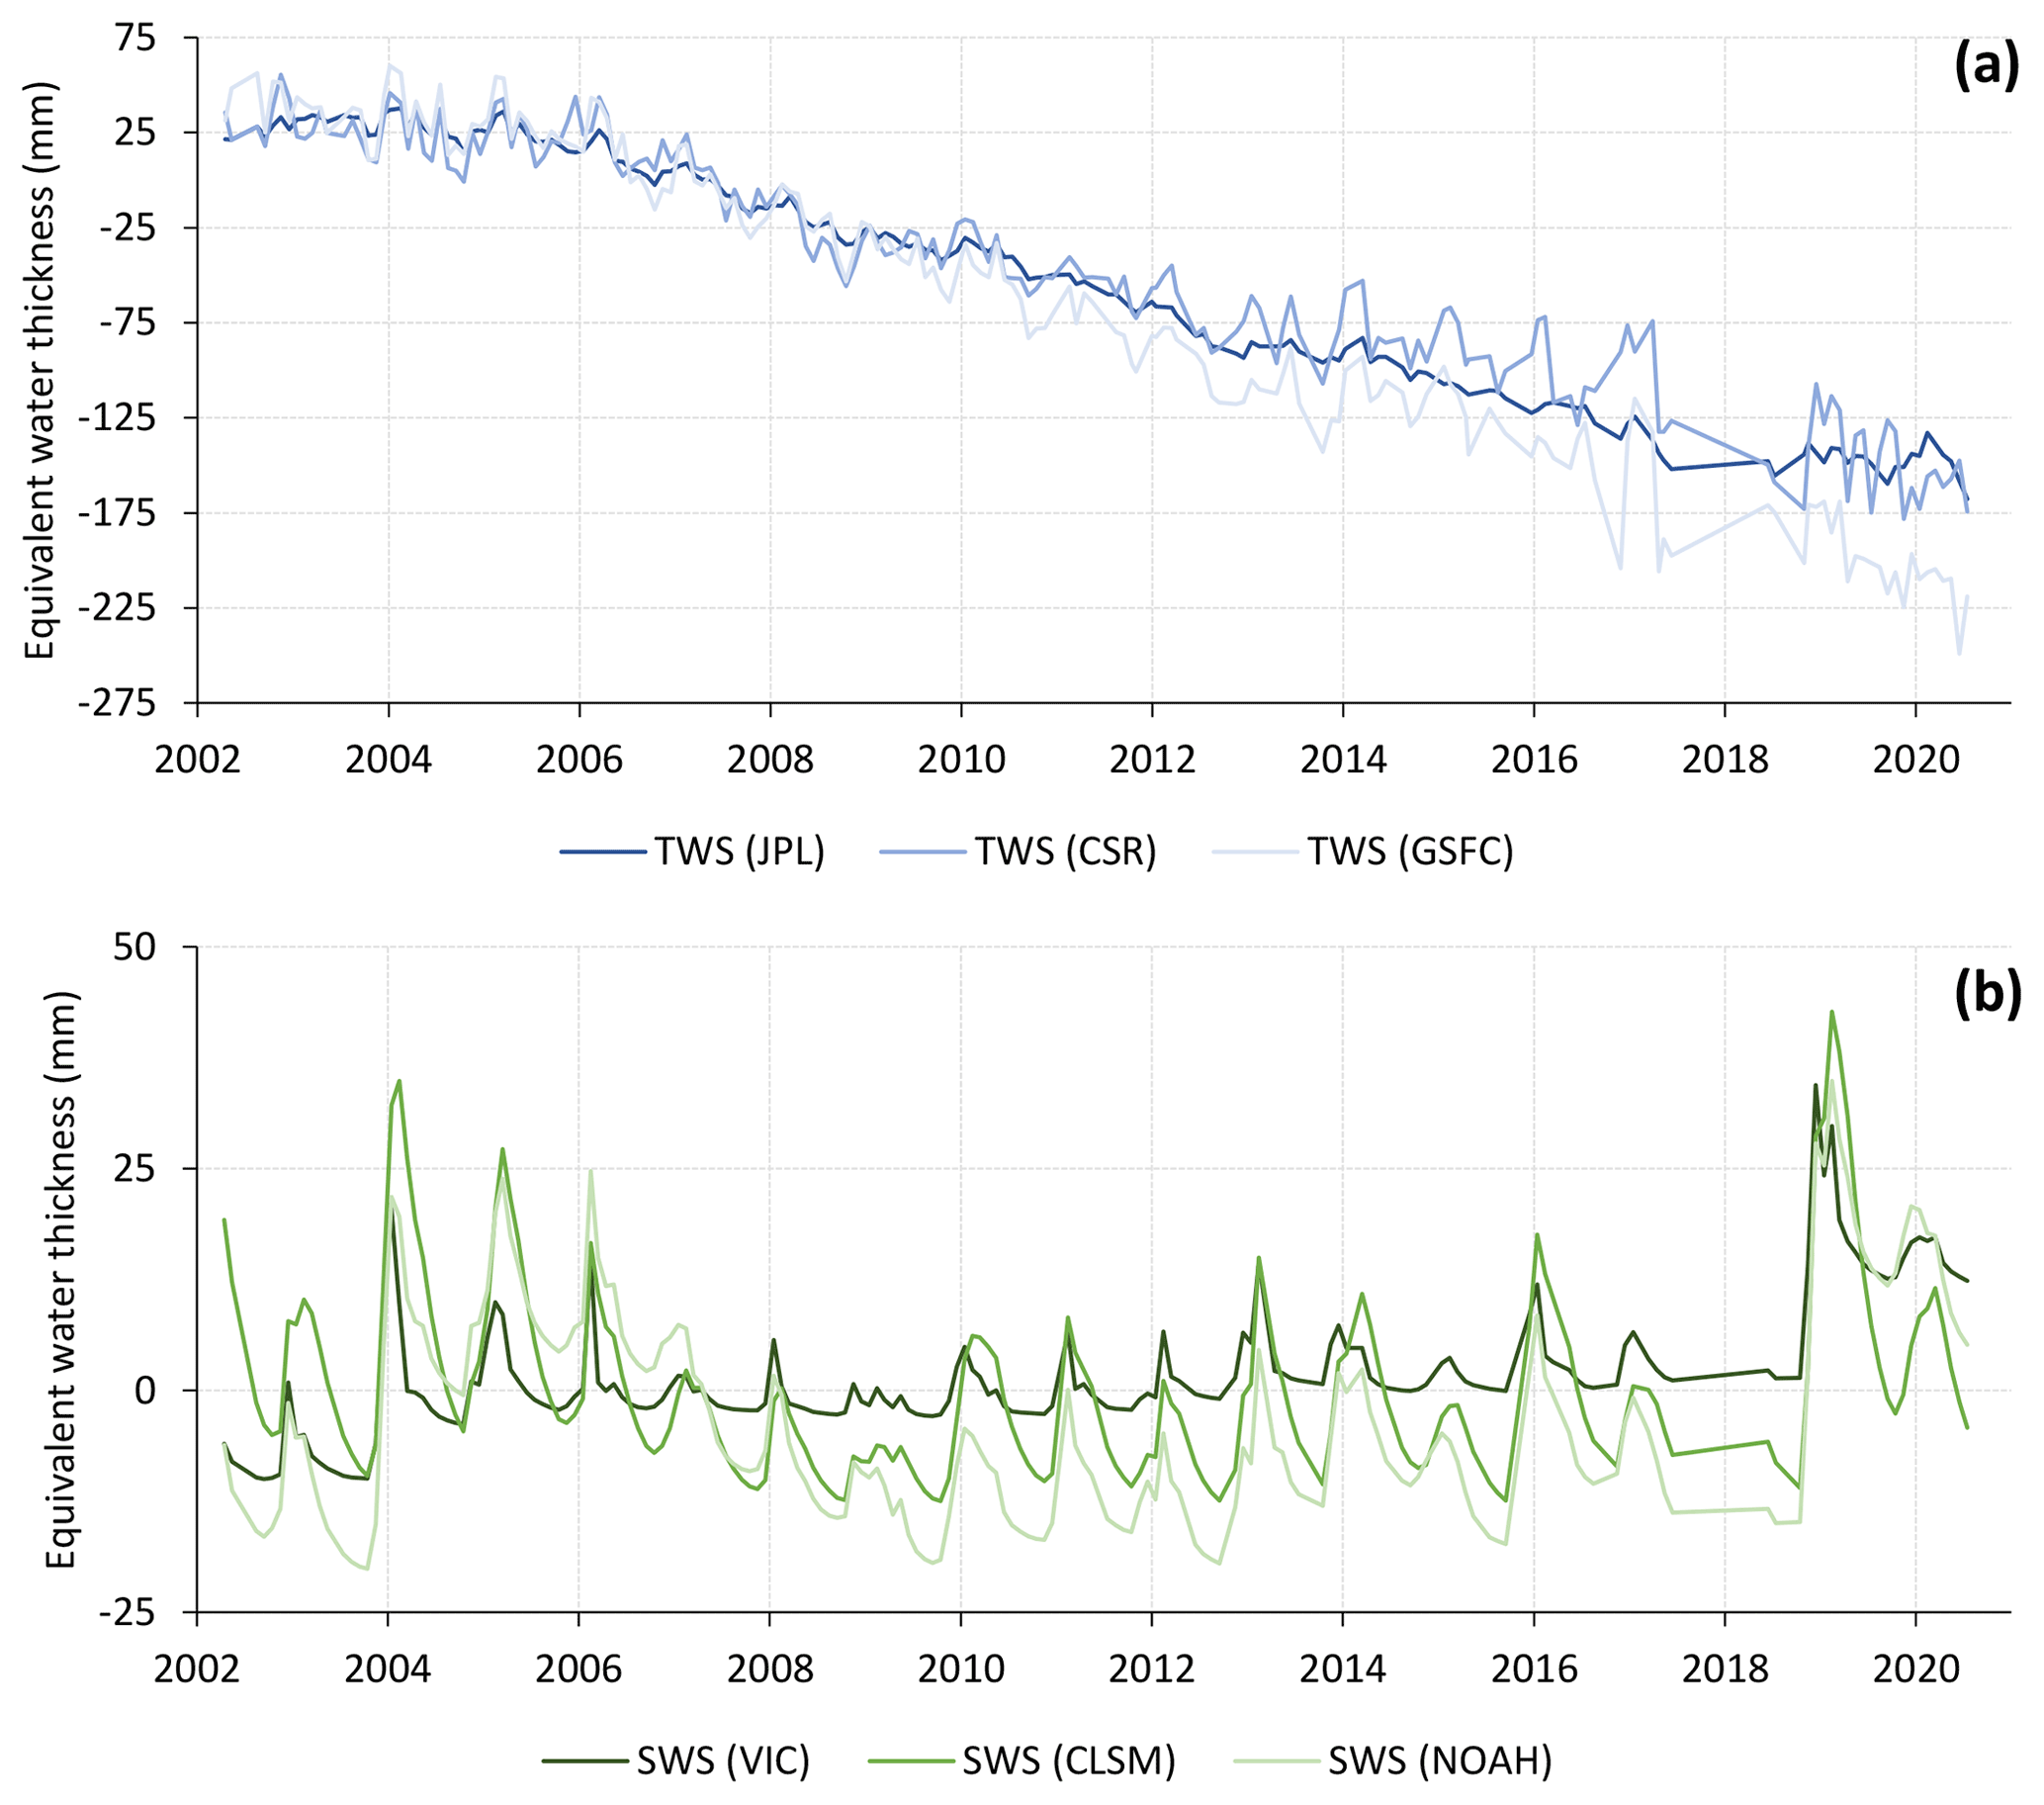
Figure 3Monthly times series of (a) the GRACE-JPL, GRACE-CSR, and GRACE-GSFC terrestrial water storage anomalies (TWS; mm) and (b) the GLDAS-VIC, GLDAS-CLSM, and GLDAS-NOAH soil water storage anomalies (SWS; mm) of the Saq–Ram domain.
While the time series of the three GRACE solutions (Fig. 3a) clearly show a significant decrease of the TWS, chiefly due to an increasing groundwater deficit (no permanent surface water bodies over the studied domain), the GLDAS products reveal a three-phase behaviour of the SWS signal (Fig. 3b) which can be related to variations of the climatic inputs of the respective models: a great variability from 2002 to 2006; small variations and values close to zero, or poorly negative, from 2007 to 2018; and high variability and positive values after 2019.
The increasing discrepancies among the GRACE-JPL, GRACE-CSR, and GRACE-GSFC products for TWS, which are clearly apparent after 2012, are mainly due to the diverse shape and size of the Mascons, and the various methods of eliminating signal leakage effects used by the three respective computing centres. Lenczuk et al. (2020) acknowledge that the GRACE-GSFC product differs the most from the others.
2.4 Methods
The data are used to build a regional-scale water mass balance and estimate recharge from variations in groundwater storage (ΔGWS). Usually obtained by piezometric measurements, it is difficult to obtain spatially meaningful averages of ΔGWS over large and poorly monitored regions such as the Arabian Peninsula. GRACE data provide a valuable integrated mapping of water storage over large domains. In arid areas, surface water can generally be neglected. Moreover, the Saq–Ram aquifer is devoid of any permanent surface water bodies. Thus, using GLDAS SWS estimates, the first step was to isolate the GWS anomalies from the TWS anomalies expressed in water height with the following simple decomposition of the GRACE data:
And thus:
Upon identification of a long-term trend (18 years in our case) of the GWS signal (using a fourth-order polynomial regression to filter out the seasonal signal), ΔGWS is calculated and can be introduced in an overall groundwater balance equation to identify one unknown (e.g. recharge) if all other fluxes are known. The following water budget can be expressed for each of the GRACE solutions:
where R is the total recharge, Qw is the groundwater withdrawal, and Qd is the natural discharge.
By estimating the artificial recharge flow Ra (i.e. irrigation return flow and domestic water return flow), it is possible to estimate only the natural contribution Rn to the recharge of the Saq–Ram Aquifer System:
Long-term time series of groundwater withdrawal (Sect. 3.1) and artificial recharge flow (Sect. 3.2) are thus required over the GRACE period considered here (2002–2019) in order to compute the natural recharge rate. Note that the main natural discharge flows (Qd) previously estimated by other studies have already been listed in the section “Hydrogeological context” (Sect. 2.2).
3.1 Groundwater pumping
Groundwater withdrawals from the Jordanian part of the Saq–Ram Aquifer System were estimated with the 2015 and 2017 Jordan Water Sector Facts and Figures (Almomani et al., 2015; http://www.mwi.gov.jo/Default/Ar, last access: 10 November 2022). Using the 2000–2017 evolution of the number of wells per usage and the 2015 and 2017 total groundwater pumping volumes per region, the 2002–2019 time series were reconstructed by extrapolating the trend of the previous years to the missing values of 2018 and 2019. This resulted in m3 r−1 of mean agricultural pumping, and m3 yr−1 of domestic uptake for the Jordanian part of the Saq–Ram domain over the 2002–2019 period.
Using previously published data (see Sect. 2.2), we can also estimate a continuous agricultural pumping time series for the Saudi part of the Saq–Ram Aquifer System (Fig. 2). First, we computed linear regressions between the Othman et al. (2018) time series (grey curve in Fig. 2) and (i) BRGM and Abunayyan Trading Corp. (2008) data (green curve), (ii) Alhassan et al. (2016) and Chowdhury and Al-Zahrani (2013) data (red curve) given per region of Saudi Arabia. Subsequently, as shown in Fig. 2, the mean agricultural withdrawals and their uncertainties were obtained (black curve) by averaging these two regressions. In the absence of data for the 2016–2019 period, we extrapolated the trend of the previous years assuming a similar evolution of the agricultural coverage as documented in the recent Statistical Yearbook from the Ministry of Economy and Planning of Saudi Arabia (General Authority for statistics, 2019; https://www.stats.gov.sa/en/46, last access: 10 November 2022). This yielded an average agricultural uptake of m3 yr−1 for the Saudi part of the Saq–Ram domain over the 2002–2019 period.
Domestic pumping was reconstructed for the 2002–2019 period based on the BRGM and Abunayyan Trading Corp. (2008) domestic withdrawals per region of Saudi Arabia observed in 2003, and the Saudi Arabia population growth figures per region (United Nations, 2019). For the 2002–2019 period, we obtained an average of m3 yr−1.
Industrial pumping is unknown. Only the 2003 industrial water demand is reported in the BRGM and Abunayyan Trading Corp. (2008) at 17×106 m3 yr−1. This corresponds to 0.2 % of the total uptakes and can thus be neglected, particularly when considering the uncertainty involved with the other pumping volumes.
3.2 Artificial recharge
The artificial recharge by irrigation return flow and wastewater reinjection was considered in this study in order to separate artificial and natural recharge. Based on a spatial decision support system, Multsch et al. (2013) carried out the assessment of the so-called “water footprint” (WF) of the agriculture for each region of Saudi Arabia. Using the blue WF (i.e. irrigation dose, coming entirely from groundwater in Saudi Arabia) and grey WF (i.e. irrigation in excess returning to the shallow aquifer and needed to dilute soil pollutants) computed per region by the authors, it is possible to assess a weighted average irrigation return flow coefficient (IRFC) of (11.6±5.8) % for the Saq aquifer domain. Since the associated uncertainties of WF flows are not given, we used half of the IRFC figure as the margin of error. Applying this coefficient to the agricultural withdrawal time series, this yielded an average irrigation return flow of m3 yr−1 for the Saq–Ram Aquifer System (including the Jordanian contribution estimated at m3 yr−1) over the 2002–2019 period.
Regarding domestic water, Chowdhury and Al-Zahrani (2015) reported an average wastewater generation coefficient of about 70 % in Saudi Arabia. This study also revealed that 38 % of this wastewater is treated by plants. Al-Jasser's (2011) data indicate that 27 % of the treated wastewater of Riyadh city does not return to the aquifer, and that the other 73 % returns to groundwater through irrigation use and direct injection in Wadis. All combined, it can be estimated from these figures that 63 % of domestic uptake returns to the aquifer (i.e. m3 yr−1 for the Saq–Ram Aquifer System over the 2002-2019 time period).
3.3 Local compatibility between GLDAS models and GRACE products
The high frequency component of the TWS signal corresponds to the seasonality (including soil moisture variations) which is theoretically simulated by the GLDAS LSMs (Fig. 3). Even if only long-term trends are interpreted here, it is crucial to verify the compatibility of each of the GLDAS models with each of the GRACE solutions before assessing the ΔGWS (Gonçalvès et al., 2013; Scanlon et al., 2019). A soil moisture amplitude of a GLDAS model greater than the seasonality as shown by a GRACE product disqualifies this soil model for the groundwater mass balance analysis. Hence, the six time series were detrended and their annual amplitudes compared (Fig. 4). This analysis revealed that, for the Saq–Ram Aquifer System, the GLDAS-CLSM and GLDAS-NOAH products are not compatible with the GRACE-JPL solution since their mean amplitudes are greater (i.e. overestimated simulated seasonality in SWS compared to the TWS observations). The other two GRACE solutions (CSR and GSFC) are compatible with the three GLDAS products with similar performance.
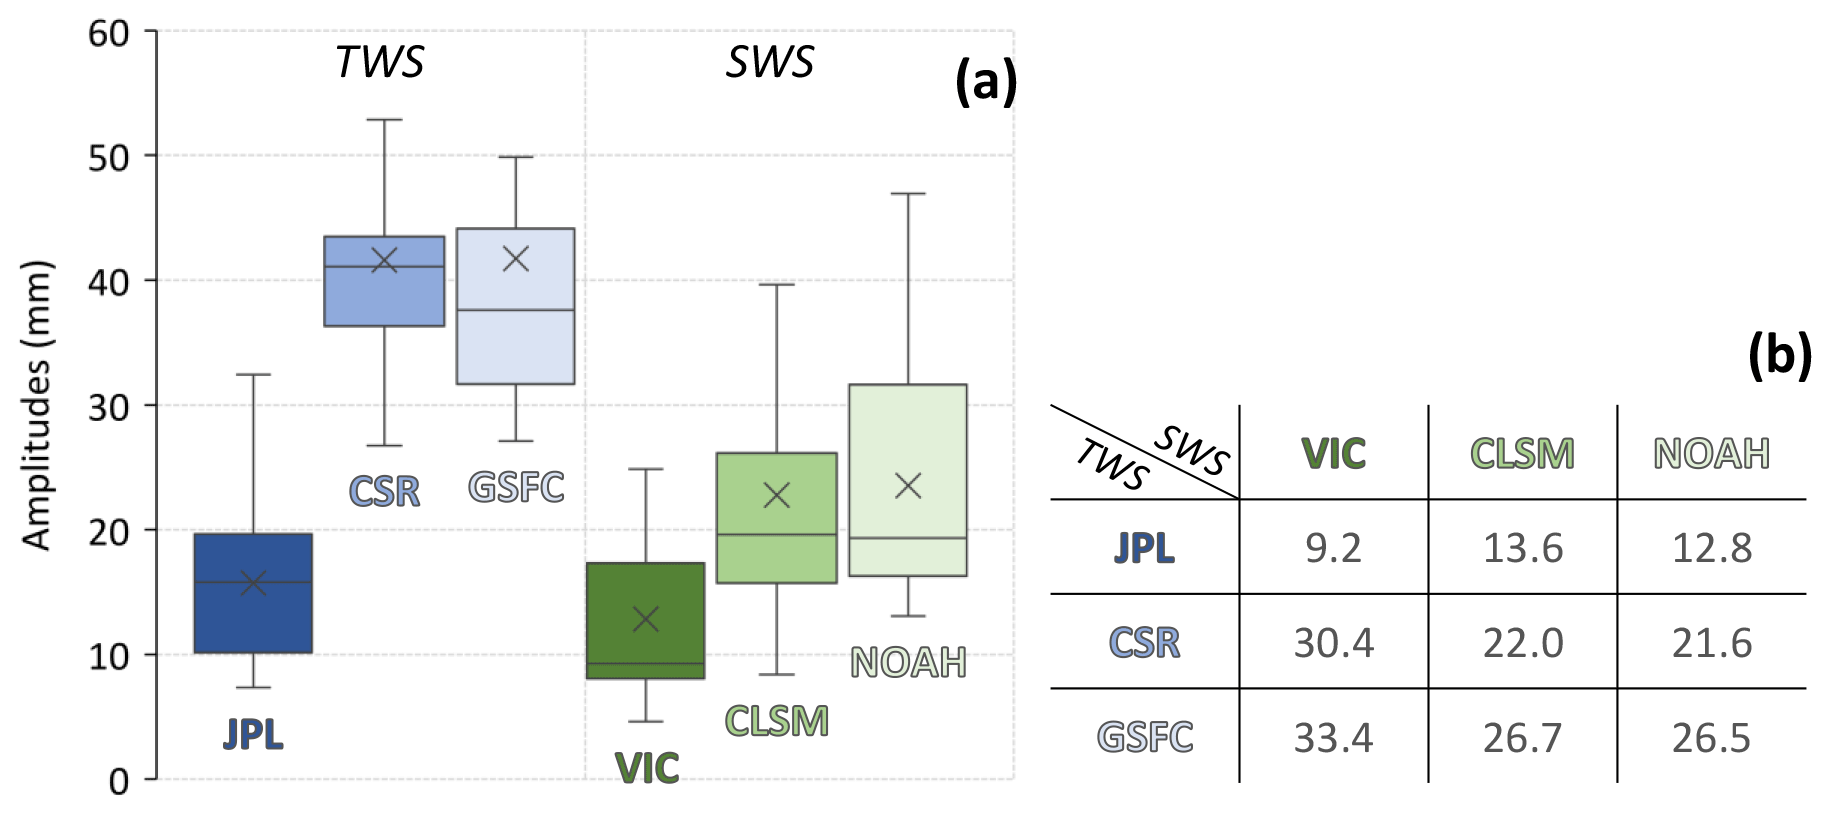
Figure 4(a) Annual amplitude comparison between the three GRACE solutions and the three GLDAS products and (b) the associated RMSE of the linear regressions applied on these amplitudes.
3.4 GRACE–GLDAS water budgets for the 2002–2019 period
After computing the long-term average (18 years) GWS variation for each of the GRACE–GLDAS solutions and implementing the fluxes previously estimated, the water budgets were calculated (Table 1).
Table 1Domain-averaged groundwater budget in mm yr−1 (106 m3 yr−1) of the Saq–Ram Aquifer System (520 000 km2) for each of the GRACE–GLDAS solutions (and associated standard deviation (SD) 1 sigma) for the 2002–2019 period.
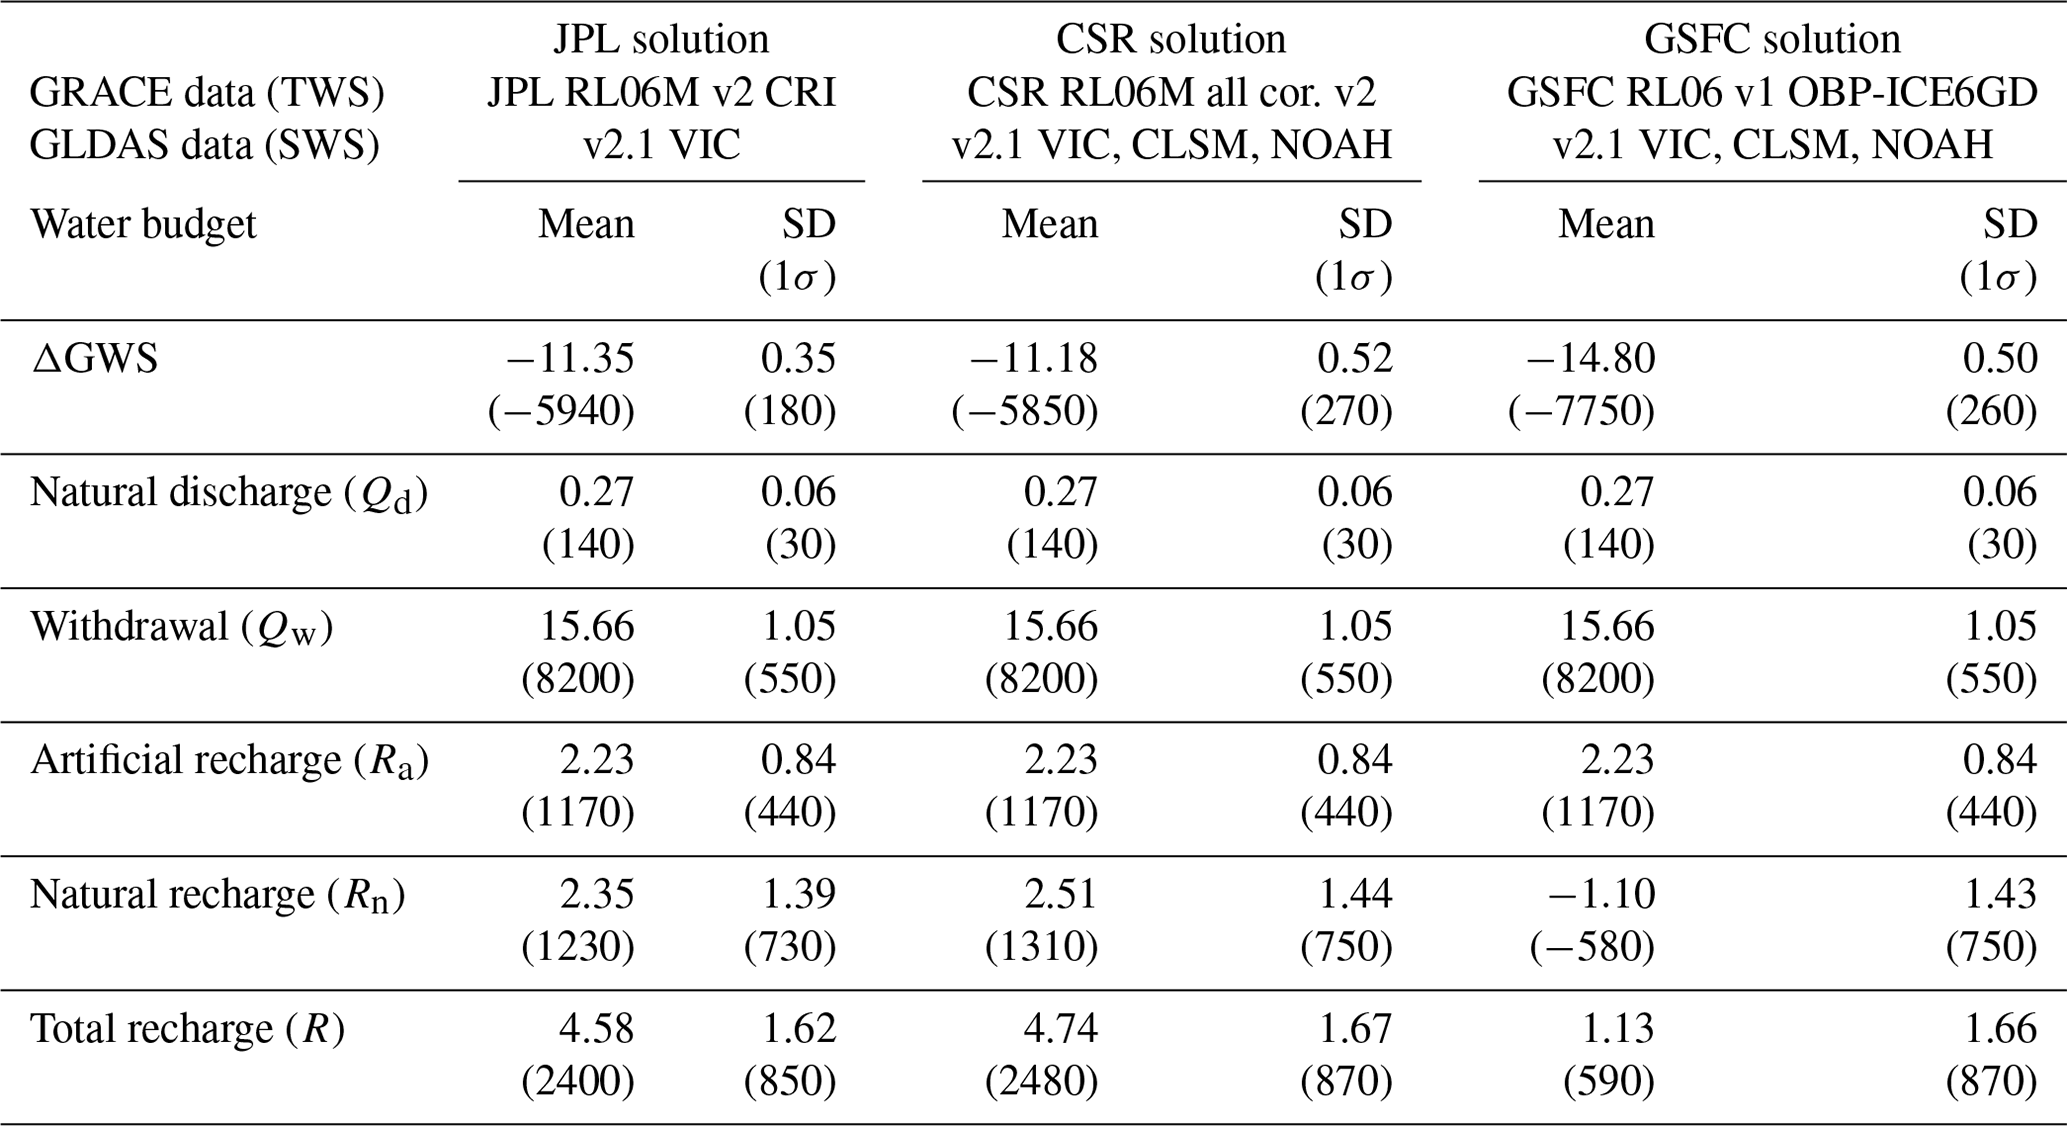
The negative natural recharge, i.e. evaporation losses from the water table, obtained with the GRACE-GSFC solution is not realistic (see the following discussion; Sect. 4.1). Therefore, only the results obtained from the GRACE-JPL and GRACE-CSR solutions were considered. Hence, the 2002–2019 average natural recharge of the Saq–Ram Aquifer System is estimated at (2.4±1.4) mm yr−1. Using the long-term annual average rainfall (AAR) of 55 mm yr−1, the domain-average natural recharge corresponds to (4.4±2.6) % of the AAR.
This study provides an estimate of the 2002–2019 domain-averaged natural recharge with associated standard deviation accounting for temporal variations in natural discharge, groundwater pumping, and irrigation return flow. The uncertainties associated with the calculation of the ΔGWS long-term trends with the GRACE and GLDAS products have also been considered. Errors associated with GRACE measurements could not be accounted for as they are not provided with the raw Mascons data (i.e. before the application of unwanted scaling factors). However, Blazquez et al. (2018) investigated the uncertainty of raw GRACE data by solving a global water budget using trends in ocean mass, ice loss from Antarctica, Greenland, Arctic islands, and trends in water storage over land and glaciers. The authors estimated a 0.27 mm yr−1 uncertainty for the GRACE data, a figure significantly lower than the uncertainties of the ΔGWS trends used in this study (Table 1).
Even if the Saq–Ram domain is devoid of any permanent surface water bodies, ephemeral streams are known to be important for (eco)hydrology and local groundwater recharge in arid regions (Shanafield et al., 2021; Dogramaci et al., 2015; Schilling et al., 2021). However, runoff coefficients were estimated at about 1 % in the region (Al-Hasan and Mattar, 2013), while more than 90 % of this runoff is lost by evaporation in the lowlands. Thus, accounting for recharge redistribution through ephemeral streams in the domain-averaged water budget of the large Saq–Ram Aquifer System would be quantitatively insignificant.
4.1 Negative natural recharge of the GRACE-GSFC solution results
The GRACE-GSFC solution resulting in negative natural recharge suggests that the Saq–Ram Aquifer System on average is subject to 1.1 mm yr−1 of evaporation losses from the water table. A clear relationship between evaporation losses (also called evaporative pumping) and vadose zone thickness has long been demonstrated (Coudrain-Ribstein et al., 1998; Fontes et al., 1986; Kamai and Assouline, 2018; Zammouri, 2001). Stable isotope measurements by Fontes et al. (1986) in northern Sahara revealed that a groundwater evaporation rate of 2.0 mm yr−1 is reached for an average 10 m vadose zone thickness (between 6 and 30 m for 1.0 mm yr−1 of groundwater evaporation rate according to Coudrain-Ribstein et al., 1998). Two recent studies (Ahmed et al., 2015; Zaidi et al., 2015) computed a mean vadose zone thickness of about 150 m (ranging from 15 to 300 m) for a domain including the vast majority of the Saq–Ram Aquifer System. According to Kamai and Assouline (2018), a vadose zone thickness of 150 m would induce a mean groundwater evaporation loss of about 0.07 mm yr−1, well below 1.1 mm yr−1. This discrepancy suggests that the GRACE-GSFC solution is not suitable for this study (probably due to differences in the treatment of the raw GRACE data with the other two products) and that its results may not yield a meaningful mass balance. We therefore only interpreted the JPL and CSR solutions that yield positive water balances (Table 1).
4.2 Contribution of the volcanic lava deposits (harrats) to the recharge
At 55 mm yr−1 of long-term average rainfall, the natural recharge of the Saq–Ram aquifer domain corresponds to (4.4±2.6) % of incoming precipitation. This value can be compared to the average (1.7±1.2) % recharge–AAR ratio obtained by similar gravity-based approaches on Saharan aquifers with similar hydrogeological characteristics: Murzuq Basin in Libya (0.6×10⁶ km2; Mohamed and Gonçalvès, 2021 using GRACE data from Bonsor et al., 2018); Nubian Sandstones System (NSAS) covering Egypt, Libya, Chad, and Sudan (2.1×10⁶ km2; Mohamed et al., 2017); north-western Sahara Aquifer System (NWSAS) in Algeria, Tunisia, and Libya (1.2×10⁶ km2; Mohamed and Gonçalvès, 2021); Tindouf Basin in Algeria and Morocco (0.3×10⁶ km2; Gonçalvès et al., 2022); and Djeffara Basin in Tunisia and Libya (0.1×10⁶ km2; Gonçalvès et al., 2021). A clear positive offset compared to the regression is observed for the Saq–Ram Aquifer System (Fig. 5). One of the main differences between the Saq–Ram and the five Saharan basins is that the latter correspond to almost purely sedimentary porous domains, while the Saq–Ram presents a substantial proportion of overlying volcanic lava deposits called harrats (8 % of the domain, i.e. 40 000 km2 represented by black areas in Fig. 5), over which a higher local precipitation is observed (i.e. AAR of 60 mm yr−1 using CRU data from Harris et al., 2020).

Figure 5Recharge (R) versus annual average rainfall (AAR) for the Saq–Ram Aquifer System, compared to other Sahara aquifer systems assessed with a similar approach, and their associated simplified geological maps (Pollastro et al., 1999; Persits et al., 1997).
To our knowledge, there is no study reporting recharge rates on these basaltic deposits strictly within the studied domain, but data are available for other parts of the Harrat al-Sham (Syria, Jordan, Saudi Arabia; also called Al Harrah in Saudi Arabia), which corresponds to the largest volcanic lava deposit of the Arabian Peninsula, partly extending over the Saq–Ram Aquifer System. Dafny et al. (2003) reported that the recharge of the northern Golan heights (located at the western extremity of the Harrat al-Sham) corresponds to 30 % of AAR, consistent with the piezometric contour map revealing a major recharge area in this thick volcanic formation. For the Amman-Zarqa Basin (Jordan) located more in the central part of the Harrat al-Sham, Mahamid (2005) derived a recharge of about 18 % of AAR through a steady state model applied on the upper layer which includes a large proportion of limestone formation (B2/A7) underlying the basalt formation (forming a multi-layer aquifer). Provided as supplementary material, we applied a water table fluctuation method on the average seasonal piezometric signal of the limestone/basaltic formation of the very same Amman-Zarqa Basin documented by Al-Zyoud (2012) and Al-Zyoud et al. (2015), yielding a recharge of about (29±3) % of AAR. Other areas of high recharge rate within the Harrat al-Sham are revealed by the piezometric heights reported in different studies: the Jabal al-Druze volcanic cone (Syria; Al-Homoud et al., 1995), as well as a basaltic relief located between the cities of Safawi and Ruwaished (Jordan; Abu-Jaber et al., 1998) which is partly in the Saq–Ram domain. Moreover, another major overlying volcanic deposit, i.e. Harrat al-'Uwayrid (located between the cities of Tabuk and Al-Ula), corresponds to a preferential recharge area for the Saq–Ram formation as pictured by a water table mound observed on the contour map of Lloyd and Pim (1990).
Considering the three values previously mentioned leads to an average recharge–AAR ratio of (26±6) % for the Harrat Al-Sham. Recharge–AAR ratios about 10 times those of porous sedimentary basins (1 % to 3 %) have also been noted for karstic aquifers in arid environments (Gonçalvès et al., 2021; Messerschmid and Aliewi, 2022). Basalts and karst formations share common characteristics which may explain a “funnel” role for precipitations: intense fracturing, thin soil, and scarce vegetation.
Hence, considering average values of (26±6) % and (1.7±1.2) % of recharge–AAR ratios over the volcanic and porous sedimentary domains respectively, we can assess the average recharge of the Saq–Ram Aquifer System independently from any data previously used in this study. This yields a total natural recharge of (2.1±0.7) mm yr−1, consistent with the results obtained using the GRACE–GLDAS water budget approach (i.e. (2.4±1.4) mm yr−1), with a (0.9±0.6) mm yr−1 contribution to the total domain-averaged recharge by the porous sedimentary outcrops and a (1.2±0.3) mm yr−1 of contribution by volcanic lava deposits. In other words, these volcanic lava deposits (harrats), which cover 8 % of the Saq–Ram Aquifer System, contribute to more than 50 % of the total natural recharge.
4.3 Influence of the vadose zone and recharge mechanism on GRACE–GLDAS interpretations in arid domains
The main characteristic of aquifers in arid domains is the presence of a thick unsaturated zone (deep water table) causing considerable lag times in exchanges between the ground surface and the water table (Fig. 6). The lag time (n years) between surface infiltration (I) and recharge (R) corresponds to the transit time of water across the vadose zone from the soil surface to the water table at depth. This lag time is highly dependent on the recharge mechanism, with large lags of hundreds of years for diffuse recharge and at most, 1 year for focused recharge (Scanlon et al., 2006). Diffuse recharge occurs fairly uniformly over large areas (precipitation or irrigation), while focused recharge refers to a mechanism of concentration of the recharge from surface topographic depressions (e.g. perennial and non-perennial streams, lakes, and playas).

Figure 6Conceptual representation of the treatment of the vadose zone in the GRACE–GLDAS water budget approach.
The standard interpretation of GRACE data consists of subtracting ΔSWS given by GLDAS models from ΔTWS obtained from satellite Earth gravity monitoring. However, the water balance calculated by LSMs in GLDAS is restricted to the top soil (about the first 2 m, ΔSWST; Fig. 6). Therefore, the implicit assumption behind the standard interpretation is that the soil moisture variations in the deep vadose zone (ΔSWSD from 2 m depth to the water table elevation) are negligible, which means that infiltration at 2 m from the top of this deep vadose zone (I) equals the recharge outflowing at its bottom (R). For small lag times (focused recharge), or shallow aquifers, this assumption is valid both on an annual basis and for long-term averages. In the case of large lag times (diffuse recharge) as for the vast majority of arid domains (including the Saq–Ram Aquifer System), this assumption may be valid for long-term average values (I=R) but not on a yearly timescale (Ii≠Ri for a specific year i, Fig. 6). In this case, the application of a yearly GRACE–GLDAS approach will provide annual percolation rates at the bottom of the LSMs (Ii), i.e. future recharges (Ri+n reaching the water table only after n years of lag time). Hence, yearly analysis using GRACE–GLDAS solutions in arid domains should be restricted to areas where focused recharge is the main mechanism, while a long-term analysis is valid irrespective of the recharge mechanism (focused or diffuse).
Regarding long-term analysis, the length of the time series considered has a significant impact on the calculated interannual recharge (Fig. 7). The computed recharge of the Saq–Ram Aquifer System and the NWSAS (Gonçalvès et al., 2013; Mohamed and Gonçalvès, 2021) is considerably different when considering different time periods of GRACE data. Compared to the NWSAS real estimate for the long-term average recharge obtained using a 14C interpretation (i.e. (1.6±2.3) mm yr−1; Chekireb et al., 2021), it appears that about 15 years of GRACE data are required to obtain the long-term average recharge. By fitting the best threshold regression models (dashed lines), it is possible to estimate that the long-term natural recharge of the Saq–Ram Aquifer System is 2.6 mm yr−1.
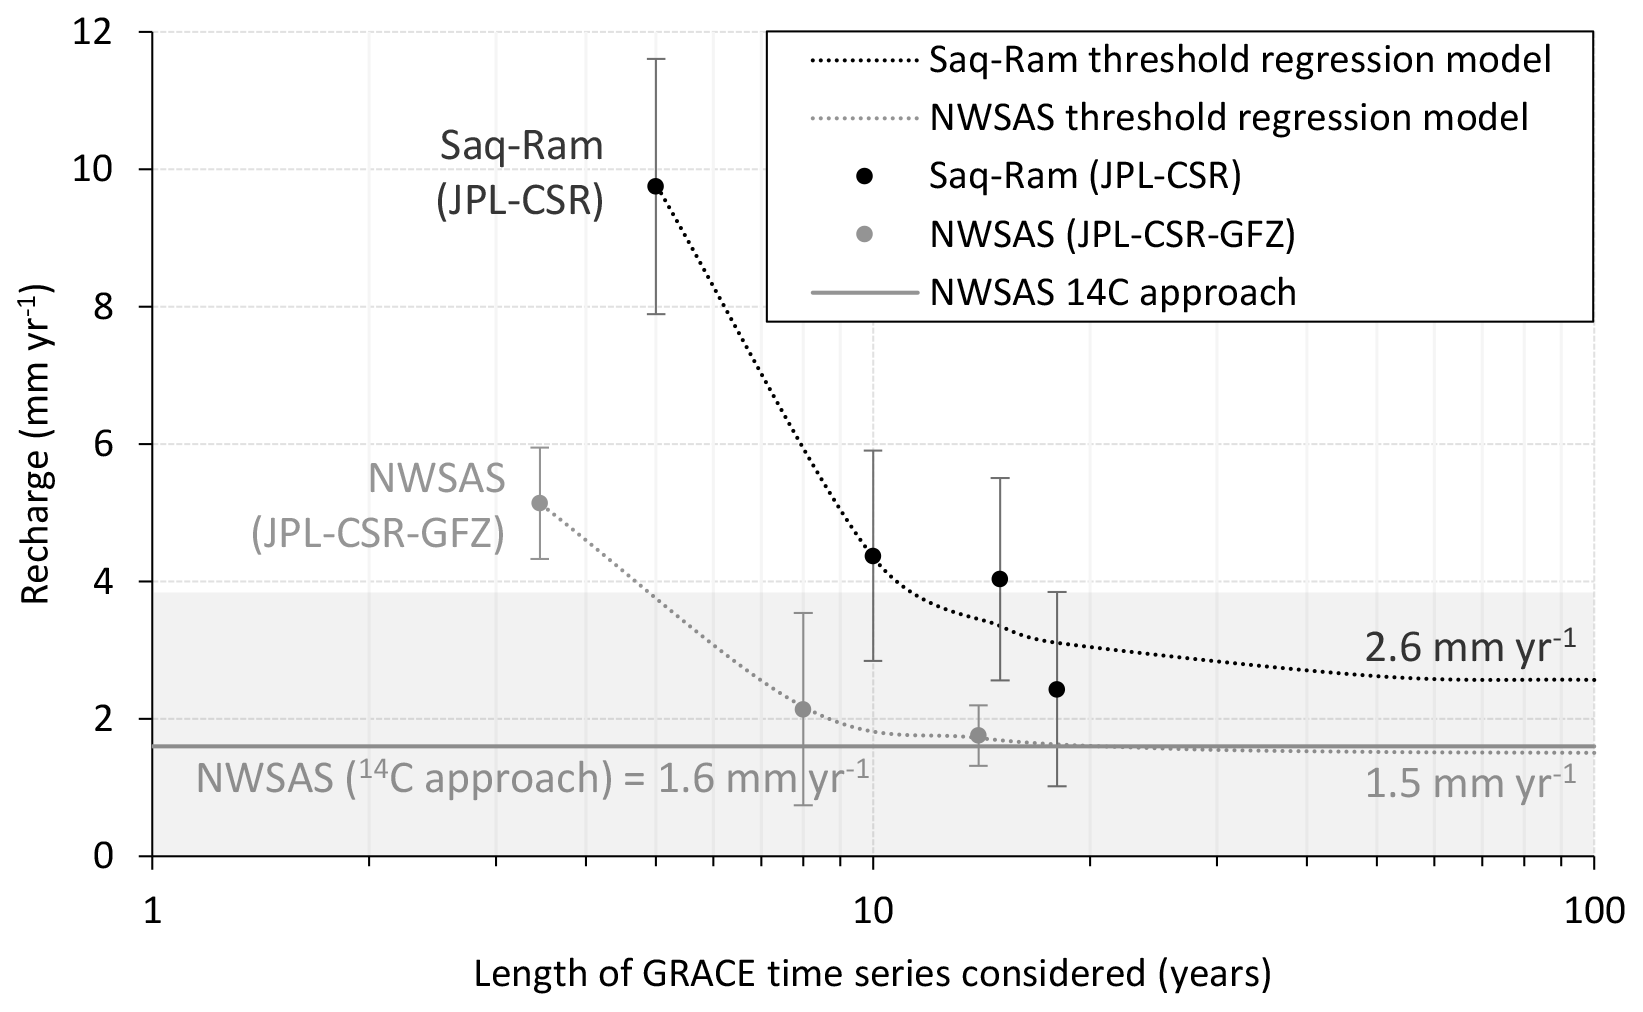
Figure 7Changes in recharge rate and associated error bars considering different lengths of GRACE time series for the Saq–Ram Aquifer System compared to the NWSAS recharge rates obtained by GRACE and 14C approaches (14C uncertainty as a grey square), and their associated threshold regression models.
In this study, we retrieved gravity data from the GRACE satellite system and soil moisture variations inferred from GLDAS models to construct a water mass balance with the aim of estimating the long-term average natural recharge over the Saq–Ram aquifer domain. As recommended by Gonçalvès et al. (2013) and Scanlon et al. (2019), the local compatibility of the three existing GRACE solutions (JPL, CSR, GSFC) with the soil moisture datasets available from the three GLDAS models (VIC, CLSM, NOAH) was tested to compute groundwater storage variations. Accounting for (15.7±1.1) mm yr−1 of groundwater pumping, (2.2±0.8) mm yr−1 of artificial recharge, and (0.3±0.06) mm yr−1 of natural discharge derived from previous studies, the GRACE-derived water budget yielded a (2.4±1.4) mm yr−1 of domain-averaged natural recharge over the 2002–2019 period, corresponding to (4.4±2.6) % of the annual average rainfall.
In line with many other studies (local or for other similar arid aquifers), we suggest that this recharge rate is spatially very heterogeneous. Volcanic lava deposits, which cover 8 % of the Saq–Ram aquifer domain, contribute to more than 50 % of the total natural recharge when considering previously published recharge rates over the terrain. Further, due to the intensive agricultural practices of the last decades, artificial recharge by irrigation excess (about 1 % of the domain area), corresponds to half of the total recharge of the aquifer.
Hence, in addition to this application on the Arabian Peninsula, this study strongly indicates a major control of geological context on arid aquifer recharge which has been poorly discussed hitherto. Regarding water resource management, this work has (i) local implications, including promoting more hydrogeological studies on these productive basaltic formations overlying the Saq–Ram Aquifer System, and (ii) regional implications, including questioning the impact on sustainability calculations for numerous MENA (Middle East and North Africa) countries presenting basaltic and/or karstic aquifers.
The two major datasets used in this study are GRACE (three products: https://search.earthdata.nasa.gov/search?q=JPL CRI&fpj=GRACE-FO, NASA, 2022a; https://www2.csr.utexas.edu/grace/RL06_mascons.html, CSR, 2022; https://earth.gsfc.nasa.gov/geo/data/grace-mascons, NASA, 2022b) and GLDAS (three products: https://search.earthdata.nasa.gov/search?fpj=GLDAS, NASA, 2022c).
The supplement related to this article is available online at: https://doi.org/10.5194/hess-26-5757-2022-supplement.
PS and JG developed the concept for the paper; PS performed data compilation and analyses, as well as compiling the first paper drafts; JG, BH, TS, and PD helped with interpreting the results, improving the paper, and assisting with answering questions.
The contact author has declared that none of the authors has any competing interests.
Publisher's note: Copernicus Publications remains neutral with regard to jurisdictional claims in published maps and institutional affiliations.
We thank Séverine Thomas and Imen Khabouchi for their logistical and technical support. The three anonymous reviewers and the editor are acknowledged for their comments, which improved the paper.
This research has been supported by the Agence Française pour le développement d'AL-ULA (AFALULA) and the Royal Commission of Al-Ula (RCU) through funding of the project “Past, present and future Water resources in Al-Ula Oasis” (WAO), which this study is part of.
This paper was edited by Harrie-Jan Hendricks Franssen and reviewed by three anonymous referees.
Abu-Jaber, N. S., Ali, A. J., and Al Qudah, K.: Use of Solute and Isotopic Composition of Ground Water to Constrain the Ground Water Flow System of the Azraq Area, Jordan, Groundwater, 36, 361–365, https://doi.org/10.1111/j.1745-6584.1998.tb01101.x, 1998.
Ahmed, I., Nazzal, Y., Zaidi, F. K., Al-Arifi, N. S. N., Ghrefat, H., and Naeem, M.: Hydrogeological vulnerability and pollution risk mapping of the Saq and overlying aquifers using the DRASTIC model and GIS techniques, NW Saudi Arabia, Environ. Earth Sci., 74, 1303–1318, https://doi.org/10.1007/s12665-015-4120-5, 2015.
Al-Hasan, A. A. S. and Mattar, Y.: Mean runoff coefficient estimation for ungauged streams in the Kingdom of Saudi Arabia, Arab. J. Geosci., 7, 2019–2029, https://doi.org/10.1007/s12517-013-0892-7, 2013.
Alhassan, A. A., McCluskey, A., Alfaris, A., and Strzepek, K.: Scenario Based Regional Water Supply and Demand Model: Saudi Arabia as a Case Study, Int. J. Environ. Sci. Dev., 7, 46–51, https://doi.org/10.7763/IJESD.2016.V7.739, 2016.
Al-Homoud, A. S., Allison, R. J., Sunna, B. F., and White, K.: Geology, Geomorphology, Hydrology, Groundwater and Physical Resources of the Desertified Badia Environment in Jordan, GeoJ., 37, 51–67, https://doi.org/10.1007/BF00814885, 1995.
Al-Jasser, A. O.: Saudi wastewater reuse standards for agricultural irrigation: Riyadh treatment plants effluent compliance, J. King Saud Univ. – Eng. Sci., 23, 1–8, https://doi.org/10.1016/j.jksues.2009.06.001, 2011.
Almomani, T., Almomani, M., Subah, A., and Hammad, N.: Jordan Water Sector Facts and Figures 2013, 2015, 2017, Dtsch. Ges. Für Int. Zusammenarbeit GIZ GmbH, https://doi.org/10.13140/RG.2.1.3419.4088, 2015.
Al-Sagaby, A. and Moallim, A.: Isotopes based assessment of groundwater renewal and related anthropogenic effects in water scarce areas: Sand dunes study in Qasim area, Saudi Arabia, IAEA-TECDOC-1246, IAEA – International Atomic Energy Agency, Vienna, https://inis.iaea.org/collection/NCLCollectionStore/_Public/33/003/33003275.pdf (last access: 10 November 2022), 2001.
Alsharhan, A. S. and Nairn, A. E. M.: Sedimentary basins and petroleum geology of the Middle East, Elsevier, 843 pp., https://doi.org/10.1016/B978-0-444-82465-3.X5000-1, 1997.
Al-Zyoud, S.: Geothermal Cooling in Arid Regions: An Investigation of the Jordanian Harrat Aquifer System, PhD Thesis, Technische Universität Darmstadt, Darmstadt, https://doi.org/10.13140/RG.2.2.36447.20640, 2012.
Al-Zyoud, S., Rühaak, W., Forootan, E., and Sass, I.: Over Exploitation of Groundwater in the Centre of Amman Zarqa Basin – Jordan: Evaluation of Well Data and GRACE Satellite Observations, Resources, 4, 819–830, https://doi.org/10.3390/resources4040819, 2015.
Banks, E. W., Cook, P. G., Owor, M., Okullo, J., Kebede, S., Nedaw, D., Mleta, P., Fallas, H., Gooddy, D., John MacAllister, D., Mkandawire, T., Makuluni, P., Shaba, C. E., and MacDonald, A. M.: Environmental tracers to evaluate groundwater residence times and water quality risk in shallow unconfined aquifers in sub Saharan Africa, J. Hydrol., 598, 125753, https://doi.org/10.1016/j.jhydrol.2020.125753, 2021.
Barthélemy, Y., Béon, O., Nindre, Y.-M., Munaf, S., Poitrinal, D., Gutierrez, A., Vandenbeusch, M., Shoaibi, A., and Wijnen, M.: Modelling of the Saq aquifer system (Saudi Arabia), in: IAH Hydrogeology Selected Papers vol. 10, Taylor & Francis, 175–190, https://www.researchgate.net/publication/332189029_Modelling_of_the_Saq_aquifer_system_Saudi_Arabia (last access: 10 November 2022), 2006.
Bazuhair, A. S. and Wood, W. W.: Chloride mass-balance method for estimating ground water recharge in arid areas: examples from western Saudi Arabia, J. Hydrol., 186, 153–159, https://doi.org/10.1016/S0022-1694(96)03028-4, 1996.
Beaudoing, H., Rodell, M., and NASA/GSFC/HSL: GLDAS Noah Land Surface Model L4 monthly 1.0×1.0 degree V2.1, Goddard Earth Sci. Data Inf. Serv. Cent. GES DISC, Greenbelt, Maryland, USA, https://doi.org/10.5067/LWTYSMP3VM5Z, 2020a.
Beaudoing, H., Rodell, M., and NASA/GSFC/HSL: GLDAS VIC Land Surface Model L4 monthly 1.0×1.0 degree V2.1, Goddard Earth Sci. Data Inf. Serv. Cent. GES DISC, Greenbelt, Maryland, USA, https://doi.org/10.5067/VWTH7S6218SG, 2020b.
Bierkens, M. F. P. and Wada, Y.: Non-renewable groundwater use and groundwater depletion: a review, Environ. Res. Lett., 14, 063002, https://doi.org/10.1088/1748-9326/ab1a5f, 2019.
Blazquez, A., Meyssignac, B., Lemoine, J., Berthier, E., Ribes, A., and Cazenave, A.: Exploring the uncertainty in GRACE estimates of the mass redistributions at the Earth surface: implications for the global water and sea level budgets, Geophys. J. Int., 215, 415–430, https://doi.org/10.1093/gji/ggy293, 2018.
Bonsor, H., Shamsudduha, M., Marchant, B., MacDonald, A., and Taylor, R.: Seasonal and Decadal Groundwater Changes in African Sedimentary Aquifers Estimated Using GRACE Products and LSMs, Remote Sens., 10, 904, https://doi.org/10.3390/rs10060904, 2018.
BRGM and Abunayyan Trading Corp.: Investigations for updating groundwater mathematical model(s) of the Saq and overlying aquifers, Ministry of Water and Electricity, Saudi Arabia, https://fr.scribd.com/document/16845648/Saq-Aquifer-Saudi-Arabia-2008 (last access: 10 November 2022), 2008.
Chekireb, A., Gonçalvès, J., Hamelin, B., Deschamps, P., and Séraphin, P.: Analytical Expressions of Radiocarbon Distribution in Transient State Unconfined Aquifers and Their Application to Determination of Past and Present Recharges of North Africa Aquifers, Water Resour. Res., 57, e2021WR030018, https://doi.org/10.1029/2021WR030018, 2021.
Chowdhury, S. and Al-Zahrani, M.: Reuse of treated wastewater in Saudi Arabia: an assessment framework, J. Water Reuse Desalin., 3, 297–314, https://doi.org/10.2166/wrd.2013.082, 2013.
Chowdhury, S. and Al-Zahrani, M.: Characterizing water resources and trends of sector wise water consumptions in Saudi Arabia, J. King Saud Univ. – Eng. Sci., 27, 68–82, https://doi.org/10.1016/j.jksues.2013.02.002, 2015.
Coudrain-Ribstein, A., Pratx, B., Talbi, A., and Jusserand, C.: L'évaporation des nappes phréatiques sous climat aride est-elle indépendante de la nature du sol?, Comptes Rendus Académie Sci. – Ser. IIA – Earth Planet. Sci., 326, 159–165, https://doi.org/10.1016/S1251-8050(00)89030-8, 1998.
CSR: CSR GRACE/GRACE-FO RL06 Mascon Solutions (version 02), https://www2.csr.utexas.edu/grace/RL06_mascons.html, last access: 14 November 2022.
Dafny, E., Gvirtzman, H., Burg, A., and Fleischerc, L.: The hydrogeology of the Golan basalt aquifer, Israel, Isr. J. Earth Sci., 52, 139–153, 2003.
de Vries, J. J. and Simmers, I.: Groundwater recharge: an overview of processes and challenges, Hydrogeol. J., 10, 5–17, https://doi.org/10.1007/s10040-001-0171-7, 2002.
Dogramaci, S., Firmani, G., Hedley, P., Skrzypek, G., and Grierson, P. F.: Evaluating recharge to an ephemeral dryland stream using a hydraulic model and water, chloride and isotope mass balance, J. Hydrol., 521, 520–532, https://doi.org/10.1016/j.jhydrol.2014.12.017, 2015.
Fallatah, O. A., Ahmed, M., Cardace, D., Boving, T., and Akanda, A. S.: Assessment of modern recharge to arid region aquifers using an integrated geophysical, geochemical, and remote sensing approach, J. Hydrol., 569, 600–611, https://doi.org/10.1016/j.jhydrol.2018.09.061, 2019.
Fontes, J. C., Yousfi, M., and Allison, G. B.: Estimation of long-term, diffuse groundwater discharge in the northern Sahara using stable isotope profiles in soil water, J. Hydrol., 86, 315–327, https://doi.org/10.1016/0022-1694(86)90170-8, 1986.
Frenken, K. and UN-FAO: Irrigation in the Middle East Region in figures: AQUASTAT survey – 2008, Food and Agriculture Organization of the United Nations, Rome, https://www.fao.org/3/i0936e/i0936e00.pdf (last access: 10 November 2022), 2009.
General Authority for statistics: Statistical Yearbook of 1965–2018, Kingdom of Saudi Arabia, https://www.stats.gov.sa/en/46 (last access: 10 November 2022), 2019.
Gleeson, T., Cuthbert, M., Ferguson, G., and Perrone, D.: Global Groundwater Sustainability, Resources, and Systems in the Anthropocene, Annu. Rev. Earth Planet. Sci., 48, 431–463, https://doi.org/10.1146/annurev-earth-071719-055251, 2020.
Gonçalvès, J., Petersen, J., Deschamps, P., Hamelin, B., and Baba-Sy, O.: Quantifying the modern recharge of the “fossil” Sahara aquifers, Geophys. Res. Lett., 40, 2673–2678, https://doi.org/10.1002/grl.50478, 2013.
Gonçalvès, J., Séraphin, P., Stieglitz, T., Chekireb, A., Hamelin, B., and Deschamps, P.: Coastal aquifer recharge and groundwater–seawater exchanges using downscaled GRACE data: case study of the Djeffara plain (Libya–Tunisia), Comptes Rendus Géoscience, 353, 297–318, https://doi.org/10.5802/crgeos.74, 2021.
Gonçalvès, J., Seraphin, P., and Nutz, A.: Dealing with hydrologic data scarcity: the case of the Tindouf Basin, Comptes Rendus Géoscience, submitted, 2022.
Harris, I., Osborn, T. J., Jones, P., and Lister, D.: Version 4 of the CRU TS monthly high-resolution gridded multivariate climate dataset, Sci. Data, 7, 109, https://doi.org/10.1038/s41597-020-0453-3, 2020.
Kamai, T. and Assouline, S.: Evaporation From Deep Aquifers in Arid Regions: Analytical Model for Combined Liquid and Vapor Water Fluxes, Water Resour. Res., 54, 4805–4822, https://doi.org/10.1029/2018WR023030, 2018.
Konikow, L. F. and Kendy, E.: Groundwater depletion: A global problem, Hydrogeol. J., 13, 317–320, https://doi.org/10.1007/s10040-004-0411-8, 2005.
Landerer, F. W. and Swenson, S. C.: Accuracy of scaled GRACE terrestrial water storage estimates, Water Resour. Res., 48, W04531, https://doi.org/10.1029/2011WR011453, 2012.
Lenczuk, A., Leszczuk, G., Klos, A., and Bogusz, J.: Comparing variance of signal contained in the most recent GRACE solutions, Geod. Cartogr., 19–37, https://doi.org/10.24425/gac.2020.131084, 2020.
Li, B., Beaudoing, H., and Rodell, M.: GLDAS Catchment Land Surface Model L4 monthly 1.0×1.0 degree V2.1, Goddard Earth Sci. Data Inf. Serv. Cent. GES DISC, Greenbelt, Maryland, USA, https://doi.org/10.5067/FOUXNLXFAZNY, 2020.
Lloyd, J. W. and Pim, R. H.: The hydrogeology and groundwater resources development of the Cambro-Ordovician sandstone aquifer in Saudi Arabia and Jordan, J. Hydrol., 121, 1–20, https://doi.org/10.1016/0022-1694(90)90221-I, 1990.
Loomis, B. D.: GSFC GRACE and GRACE-FO RL06 v1 OBP-ICE6GD, MD, USA, https://earth.gsfc.nasa.gov/geo/data/grace-mascons (last access: 10 November 2022), 2020.
Loomis, B. D., Luthcke, S. B., and Sabaka, T. J.: Regularization and error characterization of GRACE mascons, J. Geod., 93, 1381–1398, https://doi.org/10.1007/s00190-019-01252-y, 2019.
MacDonald, A. M., Lark, R. M., Taylor, R. G., Abiye, T., Fallas, H. C., Favreau, G., Goni, I. B., Kebede, S., Scanlon, B., Sorensen, J. P. R., Tijani, M., Upton, K. A., and West, C.: Mapping groundwater recharge in Africa from ground observations and implications for water security, Environ. Res. Lett., 16, 034012, https://doi.org/10.1088/1748-9326/abd661, 2021.
Mahamid, J. A.: Integration of Water Resources of the Upper Aquifer in Amman-Zarqa Basin Based on Mathematical Modeling and GIS, Jordan, Freib. Online Geosci., 12, 223 pp., https://doi.org/10.23689/fidgeo-879, 2005.
Messerschmid, C. and Aliewi, A.: Spatial distribution of groundwater recharge, based on regionalised soil moisture models in Wadi Natuf karst aquifers, Palestine, Hydrol. Earth Syst. Sci., 26, 1043–1061, https://doi.org/10.5194/hess-26-1043-2022, 2022.
Mohamed, A. and Gonçalvès, J.: Hydro-geophysical monitoring of the North Western Sahara Aquifer System's groundwater resources using gravity data, J. Afr. Earth Sci., 178, 104188, https://doi.org/10.1016/j.jafrearsci.2021.104188, 2021.
Mohamed, A., Sultan, M., Ahmed, M., Yan, E., and Ahmed, E.: Aquifer recharge, depletion, and connectivity: Inferences from GRACE, land surface models, and geochemical and geophysical data, Geol. Soc. Am. Bull., 129, 534–546, https://doi.org/10.1130/B31460.1, 2017.
Multsch, S., Al-Rumaikhani, Y. A., Frede, H.-G., and Breuer, L.: A Site-sPecific Agricultural water Requirement and footprint Estimator (SPARE:WATER 1.0), Geosci. Model Dev., 6, 1043–1059, https://doi.org/10.5194/gmd-6-1043-2013, 2013.
NASA: JPL GRACE/GRACE-FO RL06 Mascon Solutions (version 02), https://search.earthdata.nasa.gov/search?q=JPL CRI&fpj=GRACE-FO (last access: 14 November 2022), 2022a.
NASA: GSFC GRACE/GRACE-FO RL06 Mascon Solutions (version 02), https://earth.gsfc.nasa.gov/geo/data/grace-mascons (last access: 14 November 2022), 2022b.
NASA: GLDAS Land Surface Model Products (CLSM, VIC, NOAH), https://search.earthdata.nasa.gov/search?fpj=GLDAS (last access: 14 November 2022), 2022c.
Othman, A., Sultan, M., Becker, R., Alsefry, S., Alharbi, T., Gebremichael, E., Alharbi, H., and Abdelmohsen, K.: Use of Geophysical and Remote Sensing Data for Assessment of Aquifer Depletion and Related Land Deformation, Surv. Geophys., 39, 543–566, https://doi.org/10.1007/s10712-017-9458-7, 2018.
Persits, F. M., Ahlbrandt, T. S., Tuttle, M. L., Charpentier, R. R., Brownfield, M. E., and Takahashi, K. I.: Maps showing geology, oil and gas fields and geological provinces of Africa, Maps showing geology, oil and gas fields and geological provinces of Africa, US Geological Survey, Reston, VA, https://doi.org/10.3133/ofr97470A, 1997.
Pollastro, R. M., Karshbaum, A. S., and Viger, R. J.: Maps showing geology, oil and gas fields and geologic provinces of the Arabian Peninsula, Maps showing geology, oil and gas fields and geologic provinces of the Arabian Peninsula, US Geological Survey, Reston, VA, https://doi.org/10.3133/ofr97470B, 1999.
Ramillien, G., Frappart, F., and Seoane, L.: Application of the Regional Water Mass Variations from GRACE Satellite Gravimetry to Large-Scale Water Management in Africa, Remote Sens., 6, 7379–7405, https://doi.org/10.3390/rs6087379, 2014.
Richey, A. S., Thomas, B. F., Lo, M.-H., Reager, J. T., Famiglietti, J. S., Voss, K., Swenson, S., and Rodell, M.: Quantifying renewable groundwater stress with GRACE, Water Resour. Res., 51, 5217–5238, https://doi.org/10.1002/2015WR017349, 2015.
Rodell, M., Houser, P. R., Jambor, U., Gottschalck, J., Mitchell, K., Meng, C.-J., Arsenault, K., Cosgrove, B., Radakovich, J., Bosilovich, M., Entin, J. K., Walker, J. P., Lohmann, D., and Toll, D.: The Global Land Data Assimilation System, B. Am. Meteorol. Soc., 85, 381–394, https://doi.org/10.1175/BAMS-85-3-381, 2004.
Save, H.: CSR GRACE and GRACE-FO RL06 Mascon Solutions v02, TX, USA, https://www2.csr.utexas.edu/grace/RL06_mascons.html (last access: 10 November 2022), 2020.
Save, H., Bettadpur, S., and Tapley, B. D.: High-resolution CSR GRACE RL05 mascons, J. Geophys. Res.-Solid, 121, 7547–7569, https://doi.org/10.1002/2016JB013007, 2016.
Scanlon, B. R., Keese, K. E., Flint, A. L., Flint, L. E., Gaye, C. B., Edmunds, W. M., and Simmers, I.: Global synthesis of groundwater recharge in semiarid and arid regions, Hydrol. Process., 20, 3335–3370, https://doi.org/10.1002/hyp.6335, 2006.
Scanlon, B. R., Zhang, Z., Save, H., Wiese, D. N., Landerer, F. W., Long, D., Longuevergne, L., and Chen, J.: Global evaluation of new GRACE mascon products for hydrologic applications, Water Resour. Res., 52, 9412–9429, https://doi.org/10.1002/2016WR019494, 2016.
Scanlon, B. R., Zhang, Z., Rateb, A., Sun, A., Wiese, D., Save, H., Beaudoing, H., Lo, M. H., Müller-Schmied, H., Döll, P., Beek, R., Swenson, S., Lawrence, D., Croteau, M., and Reedy, R. C.: Tracking Seasonal Fluctuations in Land Water Storage Using Global Models and GRACE Satellites, Geophys. Res. Lett., 46, 5254–5264, https://doi.org/10.1029/2018GL081836, 2019.
Scanlon, B. R., Rateb, A., Pool, D. R., Sanford, W., Save, H., Sun, A., Long, D., and Fuchs, B.: Effects of climate and irrigation on GRACE-based estimates of water storage changes in major US aquifers, Environ. Res. Lett., 16, 094009, https://doi.org/10.1088/1748-9326/ac16ff, 2021.
Schilling, O. S., Cook, P. G., Grierson, P. F., Dogramaci, S., and Simmons, C. T.: Controls on Interactions Between Surface Water, Groundwater, and Riverine Vegetation Along Intermittent Rivers and Ephemeral Streams in Arid Regions, Water Resour. Res., 57, e2020WR028429, https://doi.org/10.1029/2020WR028429, 2021.
Shanafield, M. and Cook, P. G.: Transmission losses, infiltration and groundwater recharge through ephemeral and intermittent streambeds: A review of applied methods, J. Hydrol., 511, 518–529, https://doi.org/10.1016/j.jhydrol.2014.01.068, 2014.
Shanafield, M., Bourke, S. A., Zimmer, M. A., and Costigan, K. H.: An overview of the hydrology of non-perennial rivers and streams, WIREs Water, 8, e1504, https://doi.org/10.1002/wat2.1504, 2021.
Sharaf, M. A. and Hussein, M. T.: Groundwater quality in the Saq aquifer, Saudi Arabia, Hydrolog. Sci. J., 41, 683–696, https://doi.org/10.1080/02626669609491539, 1996.
Siebert, C., Rödiger, T., Mallast, U., Gräbe, A., Guttman, J., Laronne, J. B., Storz-Peretz, Y., Greenman, A., Salameh, E., Al-Raggad, M., Vachtman, D., Zvi, A. B., Ionescu, D., Brenner, A., Merz, R., and Geyer, S.: Challenges to estimate surface- and groundwater flow in arid regions: The Dead Sea catchment, Sci. Total Environ., 485–486, 828–841, https://doi.org/10.1016/j.scitotenv.2014.04.010, 2014.
Sun, A. Y.: Predicting groundwater level changes using GRACE data: Predicting Groundwater Level Changes Using Grace Data, Water Resour. Res., 49, 5900–5912, https://doi.org/10.1002/wrcr.20421, 2013.
Swenson, S. and Wahr, J.: Post-processing removal of correlated errors in GRACE data, Geophys. Res. Lett., 33, L08402, https://doi.org/10.1029/2005GL025285, 2006.
UN-ESCWA and BGR: Inventory of Shared Water Resources in Western Asia, United Nations, Beirut, https://doi.org/10.18356/48e4072c-en, 2013.
United Nations: World Population Prospects 2019, Online Edition, Rev. 1, https://population.un.org/wpp/ (last access: 10 November 2022), 2019.
Wada, Y., van Beek, L. P. H., van Kempen, C. M., Reckman, J. W. T. M., Vasak, S., and Bierkens, M. F. P.: Global depletion of groundwater resources, Geophys. Res. Lett., 37, L20402, https://doi.org/10.1029/2010GL044571, 2010.
Watkins, M. M., Wiese, D. N., Yuan, D.-N., Boening, C., and Landerer, F. W.: Improved methods for observing Earth's time variable mass distribution with GRACE using spherical cap mascons, J. Geophys. Res.-Solid, 120, 2648–2671, 2015.
Wessel, P. and Smith, W. H. F.: A global, self-consistent, hierarchical, high-resolution shoreline database, J. Geophys. Res.-Solid, 101, 8741–8743, https://doi.org/10.1029/96JB00104, 1996.
Wiese, D. N., Landerer, F. W., and Watkins, M. M.: Quantifying and reducing leakage errors in the JPL RL05M GRACE mascon solution: GRACE JPL RL05M LEAKAGE ERROR REDUCTION, Water Resour. Res., 52, 7490–7502, https://doi.org/10.1002/2016WR019344, 2016.
Wiese, D. N., Yuan, D.-N., Boening, C., Landerer, F. W., and Watkins, M. M.: JPL GRACE and GRACE-FO Mascon Ocean, Ice, and Hydrology Equivalent Water Height JPL RL06 Version 02. Ver. 2, PO.DAAC, CA, USA, https://doi.org/10.5067/TEMSC-3MJ62, 2019.
Zaidi, F. K., Nazzal, Y., Ahmed, I., Naeem, M., and Jafri, M. K.: Identification of potential artificial groundwater recharge zones in Northwestern Saudi Arabia using GIS and Boolean logic, J. Afr. Earth Sci., 111, 156–169, https://doi.org/10.1016/j.jafrearsci.2015.07.008, 2015.
Zammouri, M.: Case Study of Water Table Evaporation at Ichkeul Marshes (Tunisia), J. Irrig. Drain. Eng., 127, 265–271, https://doi.org/10.1061/(ASCE)0733-9437(2001)127:5(265), 2001.