the Creative Commons Attribution 4.0 License.
the Creative Commons Attribution 4.0 License.
 | 08 Nov 2022
Assessing runoff sensitivity of North American Prairie Pothole Region basins to wetland drainage using a basin classification-based virtual modelling approach
Christopher Spence
Zhihua He
Kevin R. Shook
John W. Pomeroy
Colin J. Whitfield
Jared D. Wolfe
Wetland drainage has been pervasive in the North American Prairie Pothole Region. There is strong evidence that this drainage increases the hydrological connectivity of previously isolated wetlands and, in turn, runoff response to snowmelt and rainfall. It can be hard to disentangle the role of climate from the influence of wetland drainage in observed records. In this study, a basin-classification-based virtual modelling approach is described that can isolate these effects on runoff regimes. The basin class which was examined, entitled Pothole Till, extends throughout much of Canada's portion of the Prairie Pothole Region. Three knowledge gaps were addressed. First, it was determined that the spatial pattern in which wetlands are drained has little influence on how much the runoff regime was altered. Second, no threshold could be identified below which wetland drainage has no effect on the runoff regime, with drainage thresholds as low as 10 % in the area being evaluated. Third, wetter regions were less sensitive to drainage as they tend to be better hydrologically connected, even in the absence of drainage. Low flows were the least affected by drainage. Conversely, during extremely wet years, runoff depths could double as the result of complete wetland removal. Simulated median annual runoff depths were the most responsive, potentially tripling under typical conditions with high degrees of wetland drainage. As storage capacity is removed from the landscape through wetland drainage, the size of the storage deficit of median years begins to decrease and to converge on those of the extreme wet years. Model simulations of flood frequency suggest that, because of these changes in antecedent conditions, precipitation that once could generate a median event with wetland drainage can generate what would have been a maximum event without wetland drainage. The advantage of the basin-classification-based virtual modelling approach employed here is that it simulated a long period that included a wide variety of precipitation and antecedent storage conditions across a diversity of wetland complexes. This has allowed seemingly disparate results of past research to be put into context and finds that conflicting results are often only because of differences in spatial scale and temporal scope of investigation. A conceptual framework is provided that shows, in general, how annual runoff in different climatic and drainage situations will likely respond to wetland drainage in the Prairie Pothole Region.
- Article
(4594 KB) - Full-text XML
- BibTeX
- EndNote


Wetlands exhibit a diversity of functions providing ecosystem services that society values. Wetlands play active roles in buffering precipitation, storing water, attenuating streamflow, and reducing the areas contributing to downstream flooding (Godwin and Martin, 1975; Hubbard and Linder, 1986; Bullock and Acreman, 2003; Acreman and Holden, 2013; Haque et al., 2017). They provide habitat for animal species valuable for pest control (i.e. insectivorous beetles and birds), food sources (i.e. waterfowl), and crop pollination (e.g. bees; Vickruck et al., 2021). The periodic hydrological isolation and water retention function of wetlands provides value by allowing nutrients entering wetlands to be processed and reduced before downstream transport can occur. High nutrient loading in some lakes and streams in the absence of wetland services has led to more frequent harmful algal blooms (Ali and English, 2019). Surface water and groundwater often intersect in wetlands, making them important aquifer recharge locations or sources of surface water in otherwise dry, arid conditions and environments (Hayashi et al., 2003). Wetlands also exhibit characteristics that make them vulnerable to removal, despite their value to society. Urbanization has been a cause of wetland loss for centuries across the globe, particularly in coastal locations (Li et al., 2018). Wetland removal to expand food production in agricultural landscapes is widespread (Cortus et al., 2009; Golden et al., 2014; van Meter and Basu, 2015). Riparian wetlands are commonly removed so that shorelines and riverbanks can be engineered for better access to waterbodies. Estimates of global wetland loss range from 30 % to 87 %, depending on the methodologies employed and periods of study (Davidson, 2014; Hu et al., 2017). Rates of wetland loss are not the same everywhere, and some regions and periods have experienced very high rates of loss (Li et al., 2018).
The Prairie Pothole Region located in the Great Plains of North America is a globally significant wetland-dominated region. As the Wisconsinan Glaciation ended and continental glaciers receded, ice blocks were left on the landscape; these formed depressions, or prairie potholes, where they melted. The rain shadow created by the cordillera to the west results in a dry climate with limited opportunities for fluvial erosion and drainage network development. This and the undulating topography have resulted in a landscape with a poorly integrated drainage network populated with millions of depressions that are hydrologically isolated from one another, except during rare periods of connectivity. The ponds that form in these depressions range from ephemeral to permanent, and even a single wetland can have substantial variations in ponded areas between dry and wet conditions (van der Kamp and Hayashi, 2009). During wet periods, ponds may fill and spill, or fill and merge, creating intermittent surface water connections among each other and higher-order streams (Tiner, 2003; Shaw et al., 2012; Leibowitz et al., 2016). Surface water storage dynamics are a critical component of Prairie Pothole Region hydrology (Haque et al., 2017).
A distinct suite of hydrological processes (Millar, 1971; Poiani and Johnson, 1993; Su et al., 2000; Niemuth et al., 2010; Liu and Schwartz, 2011) controls pothole surface water storage dynamics, resulting in the functional behaviour important for response to upslope wetland drainage. The water budget of a single depression is strongly dictated by meltwater from snow that drifts into depressions because evapotranspiration generally exceeds rainfall (Woo and Rowsell, 1993; Hayashi et al., 1998; van der Kamp and Hayashi, 1998; Fang et al., 2010). Local runoff from within the pothole's immediate basin is most likely to occur during snowmelt when the ground is frozen, infiltration rates are lower, and evapotranspiration rates are low (Spence, 2007). Pothole hydrological connections beyond their local depressional basins vary in time and space through intertwined transient but fast surface water pathways and persistent but slow groundwater pathways (Ameli and Creed, 2017; Ali et al., 2017). Surface outflow from the depression occurs only when the pond volume exceeds the depression volume. In the subsurface, when the water table is close to the topographic surface where hydraulic conductivities are exponentially higher than deeper in the soil profile, shallow groundwater flux can be large enough to sustain water levels in ponds that prolong surface water connections (Brannen et al., 2015). Whether groundwater recharges, flows through, or discharges at depressions will depend on the topographic location (Winter and Rosenberry, 1995, 1998; Rosenberry and Winter, 1997; LaBaugh et al., 1998). Surface runoff flowing into a wetland from outside its depression requires surface storage capacity in upslope depressions to be met, such that there can be surface hydrological connectivity from upslope areas. This connectivity determines the area that can contribute to runoff into a wetland or from the wetland complex (Shaw et al., 2012; Hayashi et al., 2016; Shook et al., 2021).
Changes to wetland hydrological connectivity caused by drainage alter the function of the wetland complex (Cohen et al., 2016). There is strong scientific consensus that wetland drainage should enhance runoff by removing depression storage capacity from the landscape (Rannie, 1980; Hubbard and Linder, 1986; Miller and Nudds, 1996; Labaugh et al., 1998; Gleason et al., 2007; Pomeroy et al., 2012, 2014; Dumanski et al., 2015; Whitfield et al., 2020; Baulch et al., 2021). Specifically, Wilson et al. (2019) showed that Assiniboine River tributaries with intensive drainage showed higher mean runoff ratios. The strength of this enhancement for any single event or specific basin remains a point of debate. This is because, even if wetland distribution, surface storage capacity, and structural hydrological connectivity were spatially uniform, which they are not, there are a multitude of antecedent wetland conditions that interact with meteorological inputs to influence responses. These are difficult to control experimentally when using observed meteorological and hydrometric records (Ehsanzadeh et al., 2012). It is very difficult to measure or infer the contributing area, especially for historical events. Using the Cold Regions Hydrological Model (CRHM) to control for variable state conditions and parameters, Pomeroy et al. (2014) may be the only study to have been able to estimate the sensitivity of runoff and found that, in Smith Creek, a 400 km2 basin in east central Saskatchewan, when wetland area was reduced, both high- and low-magnitude runoff events increased substantially. Wetland drainage was shown to have a strong impact on floods due to both snowmelt and rainfall. They found that the complete drainage of current wetlands resulted in simulated increases of 32 % in annual runoff and 78 % in peak daily runoff for the flood of record. Conversely, a scenario of restoring wetlands to the distribution in place in 1958 decreased annual runoff by 29 % and peak runoff in the flood of record by 32 %.
Outside of Smith Creek, the precise response of flood regimes to climate and drainage has so far eluded researchers and water managers. This is an important knowledge gap because wetland drainage in the Prairie Pothole Region has been extensive, with the removal of between 40 % and 71 % of historic wetlands across much of the region and as large as 95 % in the southern edges of the region in Iowa and Minnesota (van Meter and Basu, 2015). Most wetlands removed during colonization by Europeans, Canadians, and Americans in the late 1800s were small wetlands that flood temporarily, as these were easier to convert to annual crop production (Miller et al., 2009). More recently, there is evidence to suggest that drainage is focused on nuisance wetlands close to basin outlets and raised road embankments that are logistically easier to drain (Lloyd-Smith et al., 2020). The objective of this research is to address three key knowledge gaps about the influence of wetland drainage on runoff regimes in prairie pothole basins. First, does the relative size and location of the drained wetlands make a difference to the change in runoff response? Second, is there a threshold below which wetland drainage has no effect on the runoff regime? Finally, third, what is the role of climate? That is, do wetter regions and conditions, which presumably have more numerous or frequent connections, have less sensitivity to drainage as they tend to operate closer to the storage capacity?
2.1 Framework of classification-based virtual basin modelling
Virtual basin modelling was developed as a technique for prediction in ungauged basins. It repeats a known or exemplar basin's biogeophysical structure, drainage system, and process interactions but permits it to be driven by distinctive meteorological forcings at many locations. The first application of the virtual basin method in the Canadian Prairie was by Armstrong et al. (2015) to examine the spatial variability in Canadian Prairie evapotranspiration. Spence et al. (2022) successfully introduced a basin-classification-based virtual hydrological model framework that has proven useful for evaluating the sensitivity of prairie basins to stressors. This framework provides a novel tool with which to also disentangle the role of wetland drainage from that of climate on basin runoff. The work presented here is distinctly different from that of Spence et al. (2022), as a different basin class is investigated here and a different stressor. In this framework, a hydrological model of a virtual or stylized basin is parameterized using the predominant characteristics of a class. The model inputs or parameters can be manipulated to simulate the probable response to wetland drainage within a region. The output can be considered representative of how the whole of the basins of that class would respond. A basin-classification-based virtual modelling platform has the following three main components: (1) a classification analysis to derive virtual basin characteristics, (2) the parameterization and evaluation of a hydrological model of the virtual basin, and (3) the application of the model to evaluate response to multiple scenarios. This approach to basin classification, virtual basin set-up, and hydrological model application is described with full details in Spence et al. (2022) and is succinctly described below for the current study.

Figure 1The seven classes of basins in the Canadian Prairie ecozone. The focus of this research is on the Pothole Till class (in light blue).
2.2 Basin classification
Wolfe et al. (2019) classified over 4000 small drainage basins (averaging approximately 100 km2) across the extent of the Canadian Prairie ecozone, from the HydroSHEDS dataset (Lehner and Grill, 2013), into seven broad classes each expected to respond in a hydrologically coherent manner based on geology, topography, wetland distribution, soils, and land cover using a Hierarchical Classification of Principal Components (HCPC) approach (Fig. 1). The classification approach here follows that described by Wolfe et al. (2019), using the same elevation (Farr et al., 2007), water extent and distribution (Pekel et al., 2016), surficial geology (GSC, 2014), soils (AAFC, 2015), land use (AAFC, 2016), and tillage practices (Statistics Canada, 2016) but does not include climate (temperature and precipitation), as these are instead used as inputs to the hydrological model, and so the delineation of the seven classes differs slightly from that shown in Wolfe et al. (2019).
2.3 Model set-up and parameterization
The model application follows that used by Spence et al. (2022) to evaluate the sensitivity of High Elevation Grasslands (HEG; Fig. 1) hydrology to climate but instead using the Pothole Till (PHT) class. The PHT class was selected for use herein, as it has a large geographic extent (Fig. 1), features the highest wetland density and a high cropland coverage (Wolfe et al., 2019), and is a region of active wetland drainage. This class featured 879 basins for which median basin characteristics, including area, land cover fractions, basin slope and elevation, soil type, and wetland distribution were calculated during the basin classification procedure.
Table 1CRHM parameters for the Pothole Till virtual basin model. The suffix “-w” in the hydrologic response unit (HRU) name indicates HRUs in the wetland catena. Routing length is the typical distance across the HRU to the next downstream HRU. LAI denotes maximum annual leaf area index. Fetch is the unobstructed distance for blowing snow transport. Ds is the depth to the lower soil zone (m). When parameters were derived from the literature, references are provided. As the virtual basin area is 100 km2, the fraction of each HRU type in the basin can be calculated from the areas provided by dividing by 100.
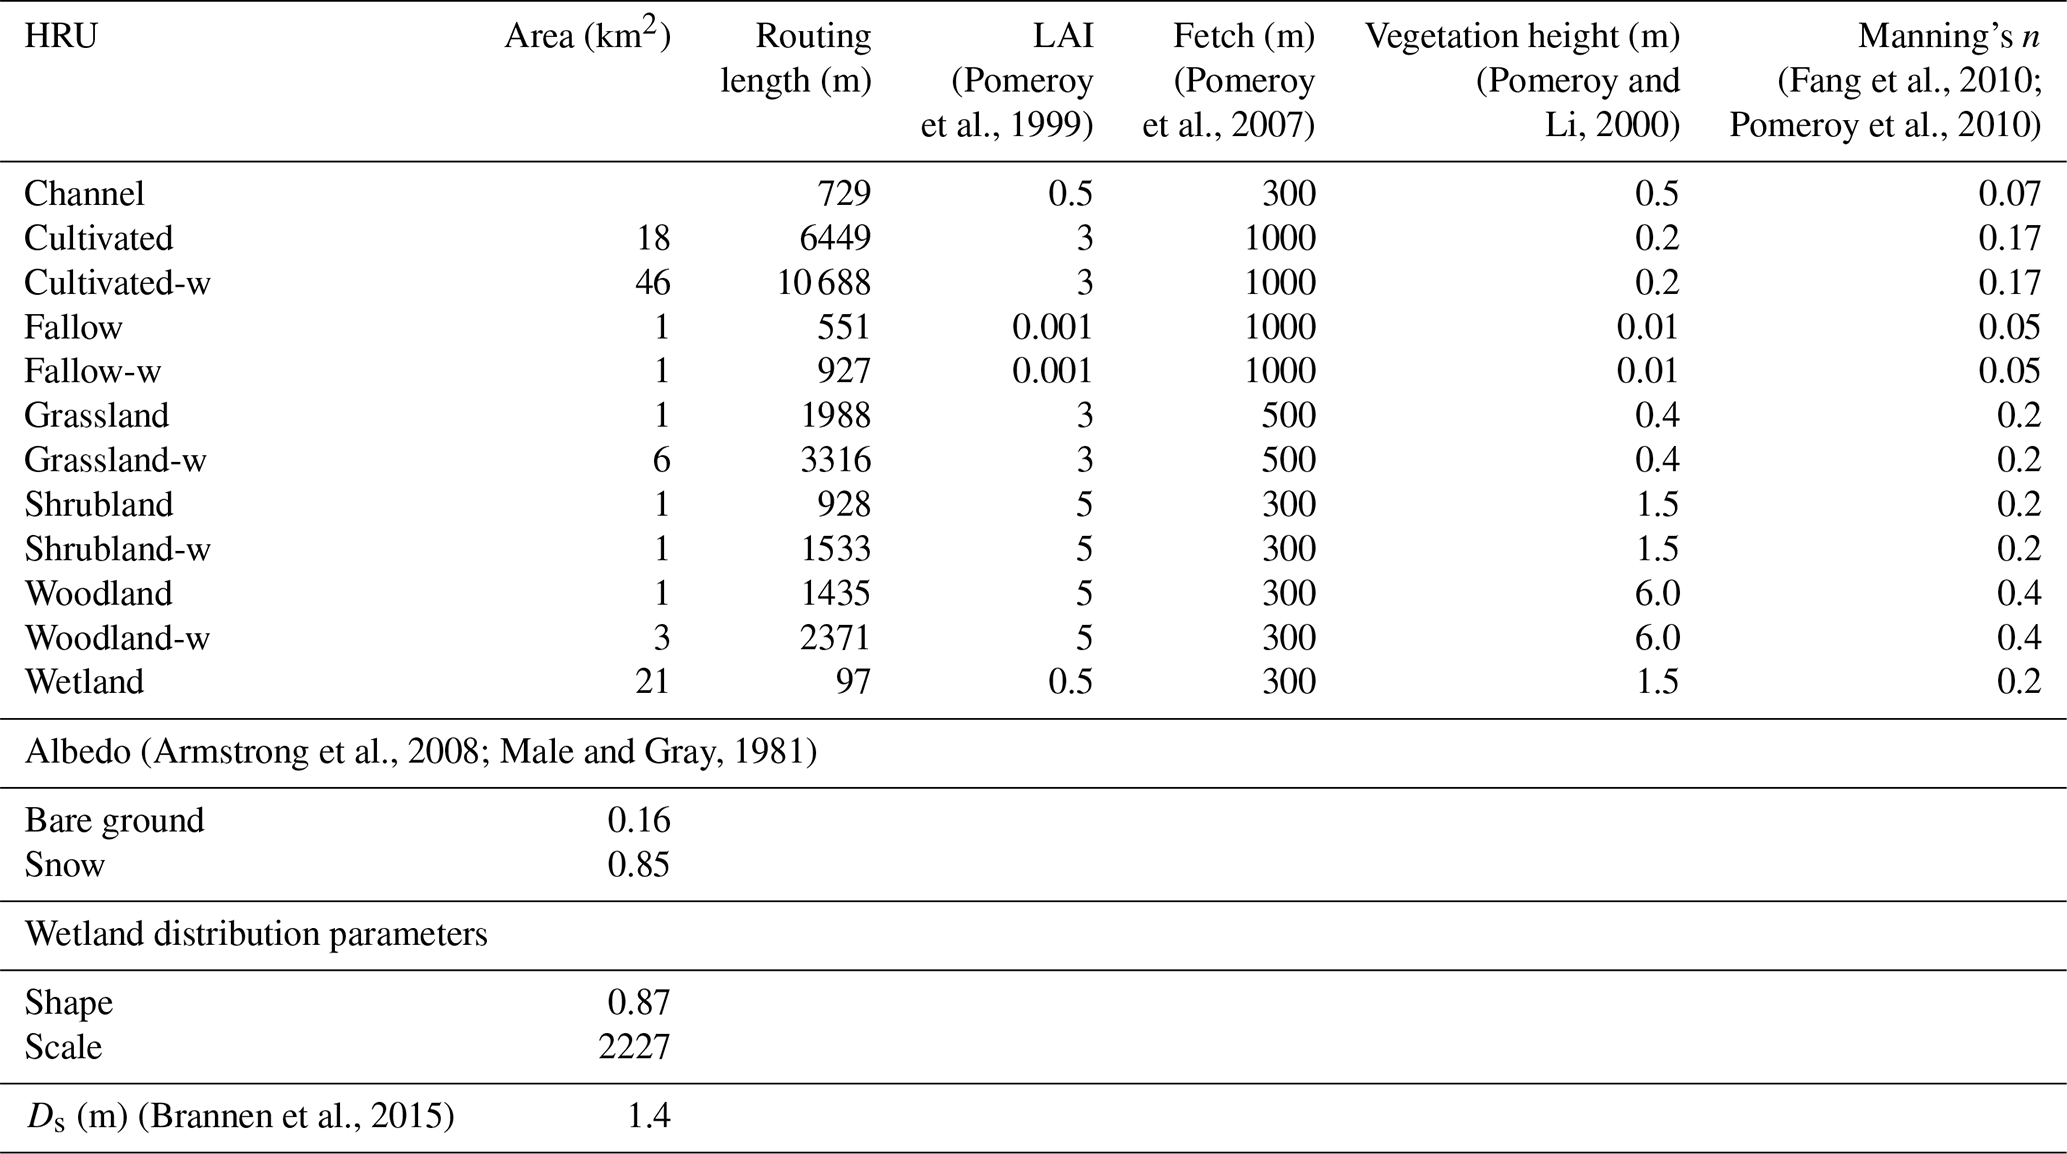
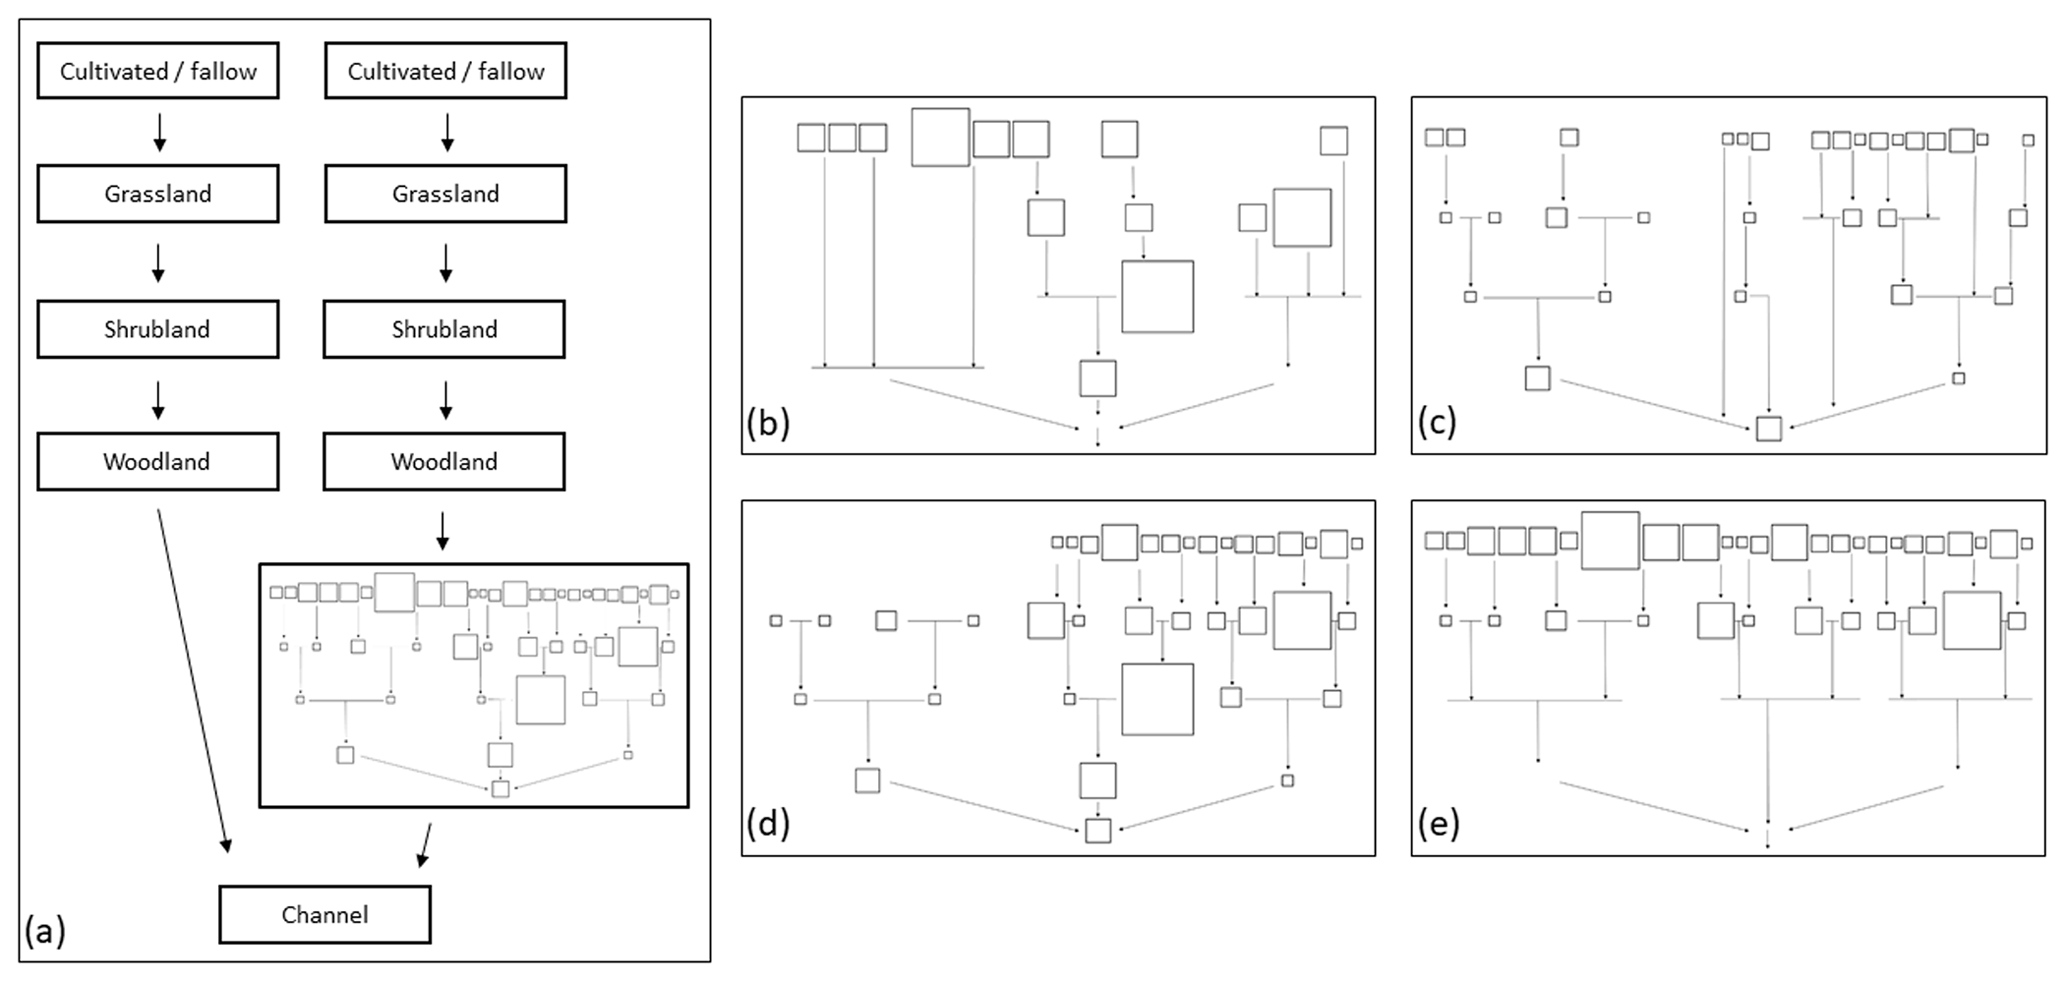
Figure 2Panel (a) illustrates the runoff routing among the HRUs showing the non-wetland and wetland catenas, where the latter includes routing runoff from the non-contributing portion of the basin through a wetland complex. The relative sizes and locations of the wetlands in this complex are conveyed by the squares in panel (a). Panels (b) through (e) illustrate an example of the complex under a 30 % drainage scenario (the removal of 30 % of wetland area), which would be substituted into the wetland catena in panel (a). Panel (b) is the small-to-large scenario, panel (c) is the large to small, panel (d) is the top to bottom, and panel (e) is the bottom to top.
The Cold Regions Hydrological Modelling platform (CRHM) was used to simulate virtual basin response to four drainage scenarios (see below). CRHM is a flexible, modular, process-based, spatially semi-distributed hydrological modelling platform that includes the key hydrological processes predominant in western Canada (Pomeroy et al., 2007). The Prairie Hydrological Model (PHM) configuration of CRHM (Pomeroy et al., 2010, 2012, 2014) applies a specific set of modules to represent prairie hydrological processes, as described in Spence et al. (2022), and was also applied in this study. Key processes included here include partitioning of rainfall and snowfall based on a psychrometric energy balance, wind redistribution and sublimation of snow, energy balance snowmelt, infiltration to frozen and unfrozen soils, evapotranspiration, crop growth, soil moisture and groundwater dynamics, fill and spill depressional storage simulation, and runoff routing to streamflow. The virtual basin (100 km2) was divided into hydrological response units (HRUs), and these are landscape/drainage areas, each of which has a single set of parameter values informed by the basin classification (Table 1). HRU areas were set according to the median for that land cover observed across all PHT basins (Table 1). Routing distances across each HRU were calculated as the average across the 879 basins in the Pothole Till class (Table 1). As discussed earlier, wetlands exert significant control on basin-scale runoff response. This control was represented by separating the virtual basin into non-wetland and wetland catenas according to median effective and non-effective fractions of PHT basins, respectively (Fig. 2). The first, the non-wetland catena, routes water sequentially from cultivated to grassland to shrubland to woodland HRUs and then to the HRU outlet. The wetland catena portion features a wetland complex which receives runoff from the upslope HRUs. Runoff is routed through this complex of 46 wetland HRUs, with the size of individual wetlands set to follow the shape and scale parameters of a generalized Pareto distribution determined for the class using methods described in Wolfe et al. (2019). This approach has been shown to effectively represent how wetlands dictate the transmission of runoff from prairie basins (Pomeroy et al., 2014; Spence et al., 2022). The wetland distribution parameters were derived from relatively coarse wetland extent data used in the classification by Wolfe et al. (2019). The shape and scale parameters of this wetland distribution likely underestimate the presence of numerous small wetlands due to the relatively coarse resolution (minimum wetland pixel size is 30 m by 30 m) available in the remote sensing products.
2.4 Model application
The virtual basin model was run over a 46-year baseline period (1960–2006) using Adjusted and Homogenized Canadian Climate Data (AHCCD) daily precipitation data (Mekis and Vincent, 2011; Vincent et al., 2012) collected at four locations that represent the variation in climate across the class (Fig. 1; Table 2). This dataset corrects shifts identified due to station relocation and changes in observing practices and automation. Other discontinuities were adjusted in the dataset with multiple linear regression using a penalized maximal t test and a quantile-matching algorithm. For precipitation, corrections were applied to account for wind undercatch, evaporation, and gauge-specific wetting losses. Snowfall density corrections were derived based on coincident ruler and Nipher measurements. Trace precipitation was added. The daily precipitation data were converted to hourly data required by CRHM by linear interpolation within its observation module. The other hourly forcing variables (temperature, relative humidity, and wind speed) were taken from Environment and Climate Change Canada observations for the same four locations.
Table 2Location and climate characteristics (1981–2010 climate normal) of the four selected climate stations located in and near the Pothole Till class. Ta is mean annual temperature and P denotes mean annual precipitation.

Table 3Sources of observed data for model evaluation. Water Survey of Canada's (WSC) hydrometric data were obtained from the HYDAT database, available at https://collaboration.cmc.ec.gc.ca/cmc/hydrometrics/www/ (last access: 2 November 2022). Effective drainage area is defined by Godwin and Martin (1975) to be the drainage area that contributes water to the gauged location during the median annual flood and was also obtained from HYDAT. These are unavailable for many Manitoba basins and are likely underestimates for Saskatchewan basins because of wetland drainage subsequent to the calculation. Pond-level data were obtained from the University of Saskatchewan. Note: n/a is not applicable.
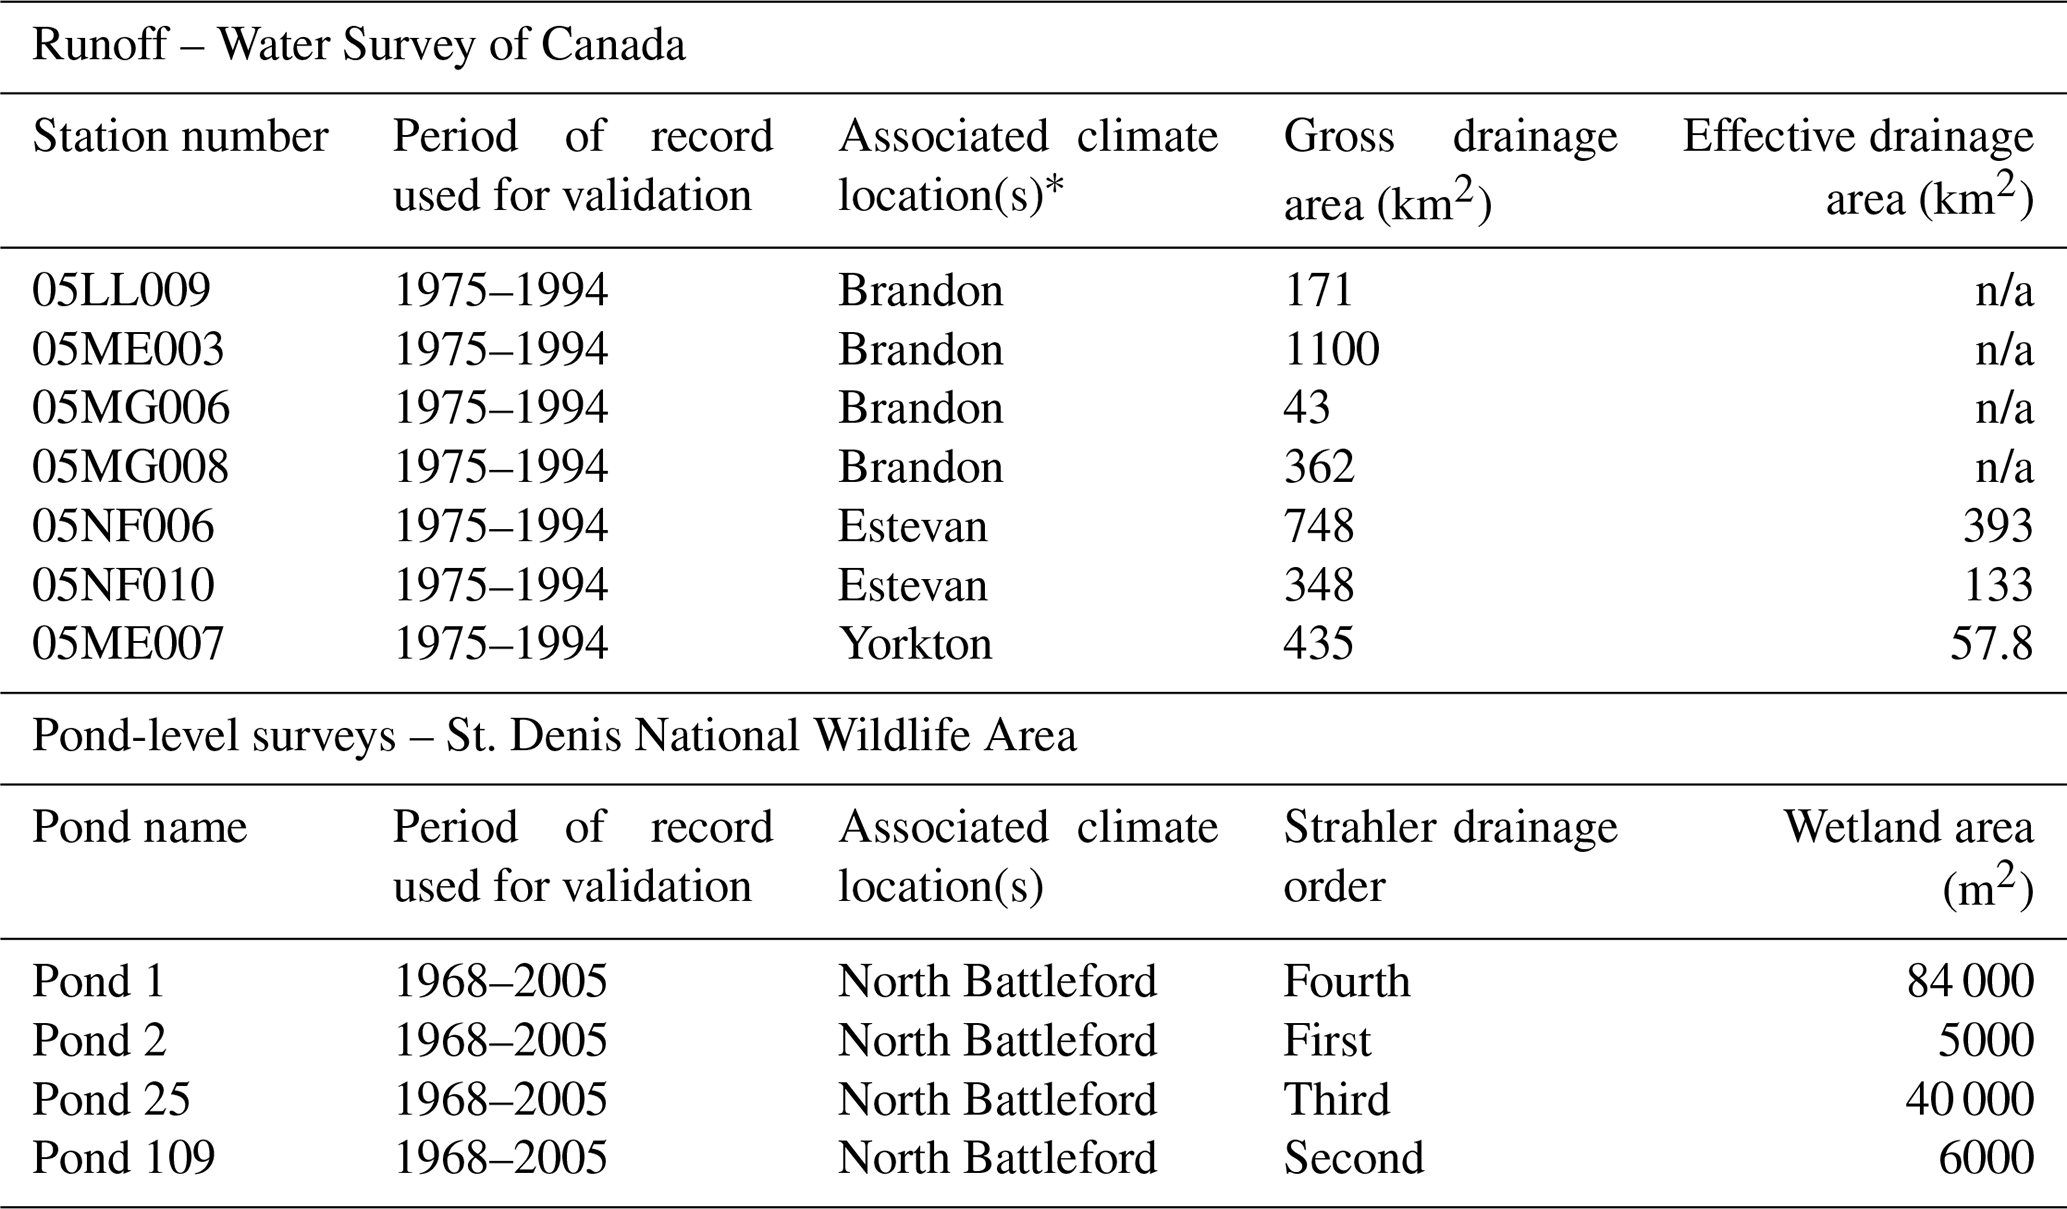
∗ There were no WSC gauges meeting the criteria for North Battleford.
2.5 Model validation
Canadian Prairie storage state variables often have long hydrological memories, so the first 5 years of the simulation period were discarded, as these were considered to be of dubious quality. The remaining 42-year period of simulation (1965–2006) was used to assess model behaviour. The models created with the CRHM algorithms, especially for its surface processes, are strongly physically based and do not require calibration from streamflow. Furthermore, as a virtual basin has no specific location, it cannot be calibrated to streamflow observations from a gauged basin. As there are few unregulated gauged basins of the size simulated here in the sparsely gauged Canadian Prairie Pothole Region, using a model in which parameters are set based on hydrological process research rather than calibration is advantageous. Previous studies have described the application of CRHM to Canadian Prairie basins; its ability to represent the region's predominant hydrological processes is well established (Fang et al., 2010), and the virtual basin model approach has been successfully applied and tested in the HEG class (Spence et al., 2022). Furthermore, the aim of the simulations was not to simulate specific basins in the region but to assess the sensitivity of the hydrological regime to different wetland complex configurations under climates typical of the region. To assess how the model simulated runoff, mean monthly runoff depths for the PHT virtual basin were plotted and visually compared to the seven Water Survey of Canada (WSC) stations gauging a stream within 100 km of one of the climate locations (Table 3) and for which the drainage area boundaries are completely within the PHT class.
Maximum annual pond depths have been measured at the St. Denis National Wildlife Area (NWA) in central Saskatchewan (Fig. 1) since the late 1960s. These data represent the only known long-term dataset of wetland storage state in the PHT class. Data from four wetlands with the longest period of record and fewest data gaps were selected for evaluation of the virtual basin results. These observed wetlands are connected by intermittent streams and represent locations on first, second, third and fourth order channels, though these channels are usually dry. The wetlands range in size from 5000 to 84 000 m2 in size (Table 3). These characteristics represent a diversity of wetland topologies and geometries. The average annual maximum pond depth for these four wetlands was compared to the average annual maximum daily depression storage in all 46 simulated wetlands using correlation analysis. These simulated values are not exactly the same metric as the observations but can be expected to respond to climate in a comparable manner if the model simulations are robust.
2.6 Drainage scenarios
In the context of this paper, the term “drainage” refers to wetland drainage, which is the act of removing surface water storage capacity from depressions and not the movement of water through a basin. Wetland drainage in this region is typically enacted by first removing any woody vegetation from around the wetland with backhoes and graters. Infilling and levelling is used where possible to flatten the depression. Ditches are dug between each depression to their maximum depth, following the local grade to allow drainage towards the closest intermittent streambed or road ditch. These drainage techniques completely remove wetland depression storage capacity from the landscape. Four sets of drainage scenarios (two based on area and two based on relative location) were implemented based on an approach first demonstrated by Pomeroy et al. (2012) for the Vermilion River basin, Alberta. The two scenarios based on area first drained wetlands (1) from smallest to largest and (2) largest to smallest and are referred to as small to large and large to small, respectively. The two scenarios based on relative location first drained wetlands (1) from those farthest from the basin outlet to those closest and (2) from those closest to the basin outlet to those farthest. These are referred to as top to bottom and bottom to top, respectively. These sets of scenarios were chosen as they were expected to encompass the full range of basin response to wetland drainage, even though, in reality, drainage will follow a hybrid of these scenarios, according to decision-making by individual landowners. In each set of scenarios, depression storage was reduced by completely removing the storage capacity of an individual wetland HRU, according to either the relative wetland size or location. The drainage fraction ranged between 0 (no wetland HRUs removed) and 100 % (all wetland HRUs removed). Between these states, the nominal drainage was in increments of 10 %, which is the percentage based on the total original wetland HRU area (0 % scenario). The term “nominal” is used to describe the drainage because, as individual HRUs were removed, it was not possible to remove exact percentages of the total wetland area, and the actual drainage was set to be equal to or less than the nominal drainage level. The scenarios remove fewer wetlands for the same level of drainage than would be the case if the wetland complex included smaller wetlands that are not captured by the remote sensing product. These absent wetlands are too small to individually influence the basin-scale response, unlike a single large depression (Shook et al., 2021). Accordingly, misrepresenting this part of the wetland area distribution is not expected to bias model simulations of annual runoff. However, Shook et al. (2021) showed that using a coarse representation of a wetland distribution may inflate the role of large wetlands in controlling contributing area and runoff, so this should be considered when interpreting these results.
As each wetland was drained, its parameter values were converted to those of the cropland HRUs, as cropland conversion is the normal purpose of wetland drainage for these agricultural landscapes. These parameters were changed to ensure the simulation of evapotranspiration, snow redistribution, and soil moisture in the wetland HRU emulated that of cropland. In addition, depression storage capacity of the converted HRU was set to zero, and the value of Manning's n was changed to that of the channel HRU, based on the assumption that ditching between the wetlands is associated with wetland drainage. The drainage scenarios were designed to indicate the sensitivity of runoff and storage to drainage when specific parts of the wetland complex are drained (e.g. ones at the bottom of the catena or ones that are larger) rather than predict the response of any specific drainage scenario that has occurred in an actual basin.
Pearson correlation analyses (α = 0.05) were conducted to determine the strength of the relationship between climate wetness and sensitivity to drainage. Wetter regions were defined as those with above-average mean annual precipitation or baseline mean annual runoff (i.e. P > 431 mm and Q > 13.5 mm). Sensitivity to wetland removal for each drainage scenario was measured as changes in maximum, median, and minimum annual runoff, as well as runoff of different return periods. The 1:2.33- (median), 1:10-, and 1:42-year return periods were calculated. Return periods were calculated with a simple rank technique following Spence and Mengistu (2019) because Zhang et al. (2020) determined that no single frequency distribution can be used to characterize flood frequencies in the Canadian Prairie, hence the non-typical 1:42-year return period, which is the maximum return period possible for the period of simulation.
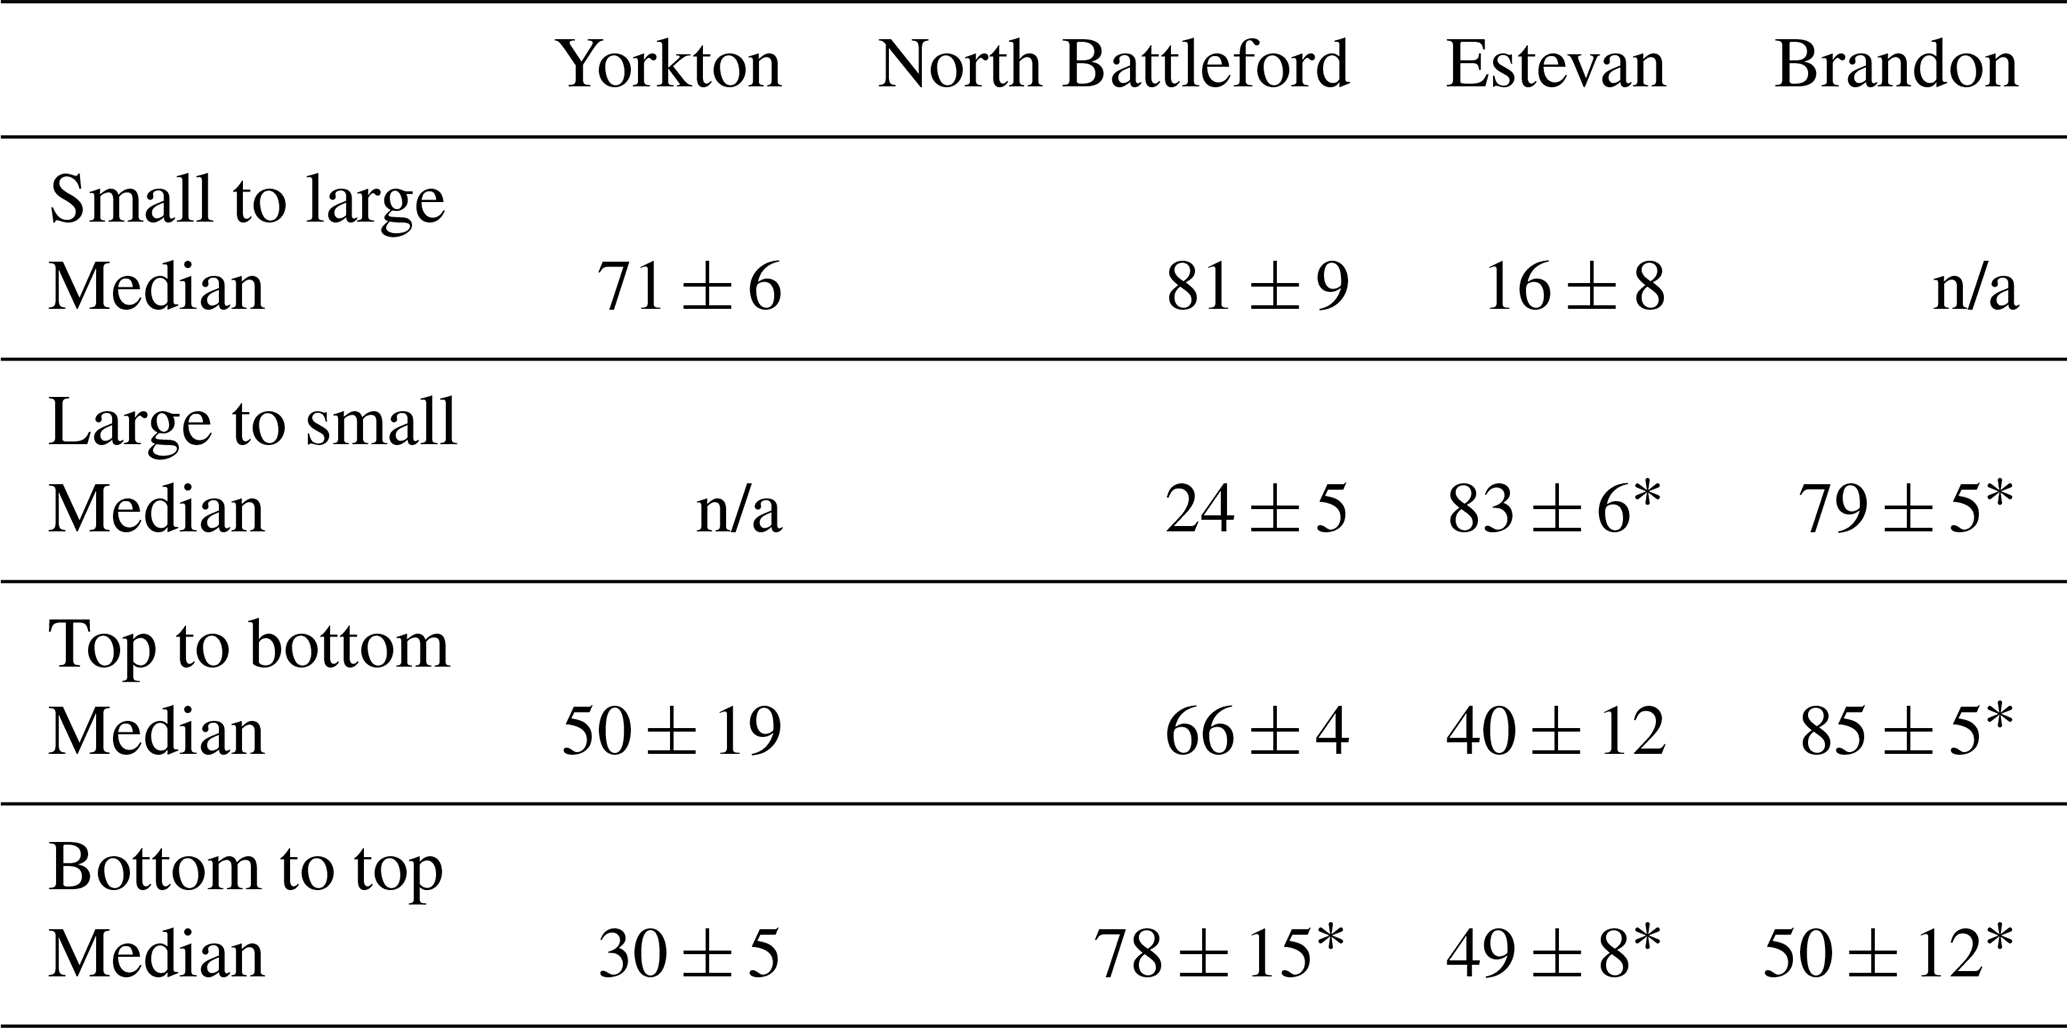
Two methods were employed to determine if the sequence of drainage influenced runoff response to wetland removal. First, the simulated values of mean, minimum, median, and maximum runoff (for the 42-year simulation period) were collated for the 10 %, 50 %, and 90 % nominal wetland removal rates for each of the four drainage scenarios and four climates. The variation among these scenarios at these drainage rates was used as a metric of the difference among the scenarios. Finally, Kolmogorov–Smirnov tests were run to test if there were differences among the distributions of annual runoff over the 42-year simulation period (1965–2006) for each drainage scenario in each climate. Piecewise linear regression was used to determine if there was a threshold below which wetland drainage has no effect on runoff. The median annual flood and 1:42-year flood simulated for each climate location and nominal drainage rate were both evaluated for thresholds. Regression was performed in R, using the segmented package (Muggeo, 2003), which fits regression models with segmented relationships and provides, where they exist, the breakpoints between segments. These breakpoints, where identified, were values at which the rate of change in runoff with wetland drainage changed significantly. Thresholds below which wetland drainage has no effect on runoff were identified as being when the rate of change increased from zero.
In addition to the removal of storage capacity, basins with high rates of wetland removal are more efficient at moving water to the outlet. In each drainage scenario, one wetland remains as the last to be removed. As an indication of how quickly runoff leaves this wetland within each drainage scenario, the recession coefficient defined by Dingman (1973) was determined from the wetland storage time series, as follows:
where S0 is defined as antecedent storage, St is storage on day t, and the recession coefficient t∗ (d) can be the reciprocal of the slope of the best fit line between ln (S) and t as storage declines (McNamara et al., 1998). Finally, the range and variability in the runoff regime was calculated for each drainage pattern scenario for each climate using the coefficient of variation in runoff.
The importance of exceeding depression storage capacity on this landscape for hydrological connectivity and runoff response has been known since the 1950s (Stichling and Blackwell, 1958). Leibowitz and Vining (2003) identified that the extent of hydrological connections should be a function of precipitation, P, and local relief, r. The former dictates the supply of water. The latter is the capacity with which a basin can transmit it. The number of connections, C, should be inversely proportional to relief and proportional to the precipitation, as follows:
The Leibowitz and Vining (2003) scheme provides a quantitative framework that was applied to evaluate the role of drainage in enhancing annual runoff. If fractional drainage, d, reduces effective relief by removing storage capacity and enhancing the ability of a basin to transmit water, then it can have an inverse relationship to local relief. To determine the relationship fractional drainage and precipitation have with the number of hydrological connections, represented by the annual maximum connected area, Ac, the strength of the relationship was evaluated using multiple linear regression in R using the lm package (Wilkinson and Rogers, 1973; Chambers, 1992).
Similarly, multiple linear regression was applied to determine if the relationship among mean annual runoff, Q, d, and P was like that of Ac.
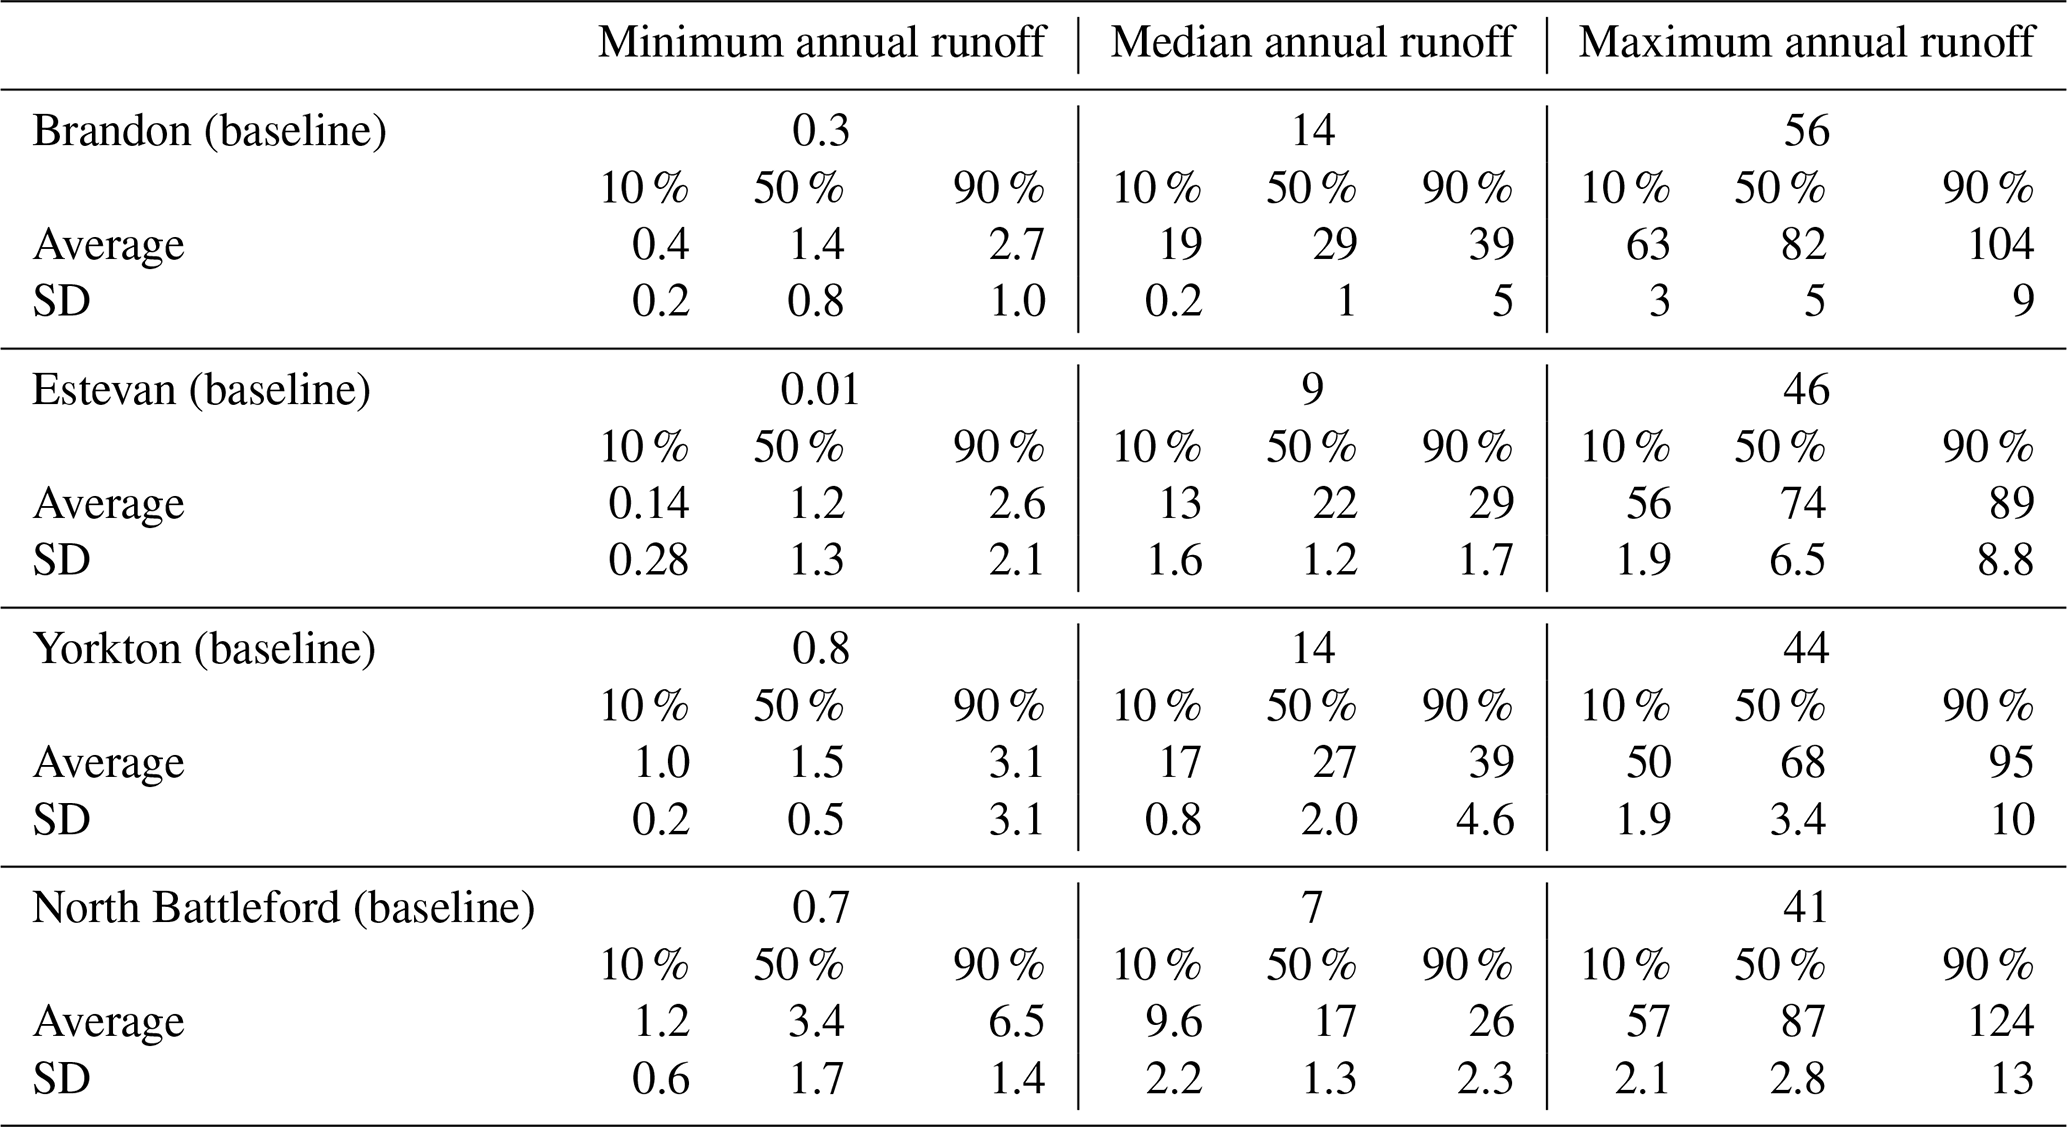
Table 4Simulated (CRHM) baseline annual runoff (mm) for the PHT virtual basin for three of the four climate locations and observed annual runoff from corresponding WSC hydrometric gauges. The 25th, 50th, and 75th percentiles are denoted with q25, q50, and q75 and the standard deviation with SD.
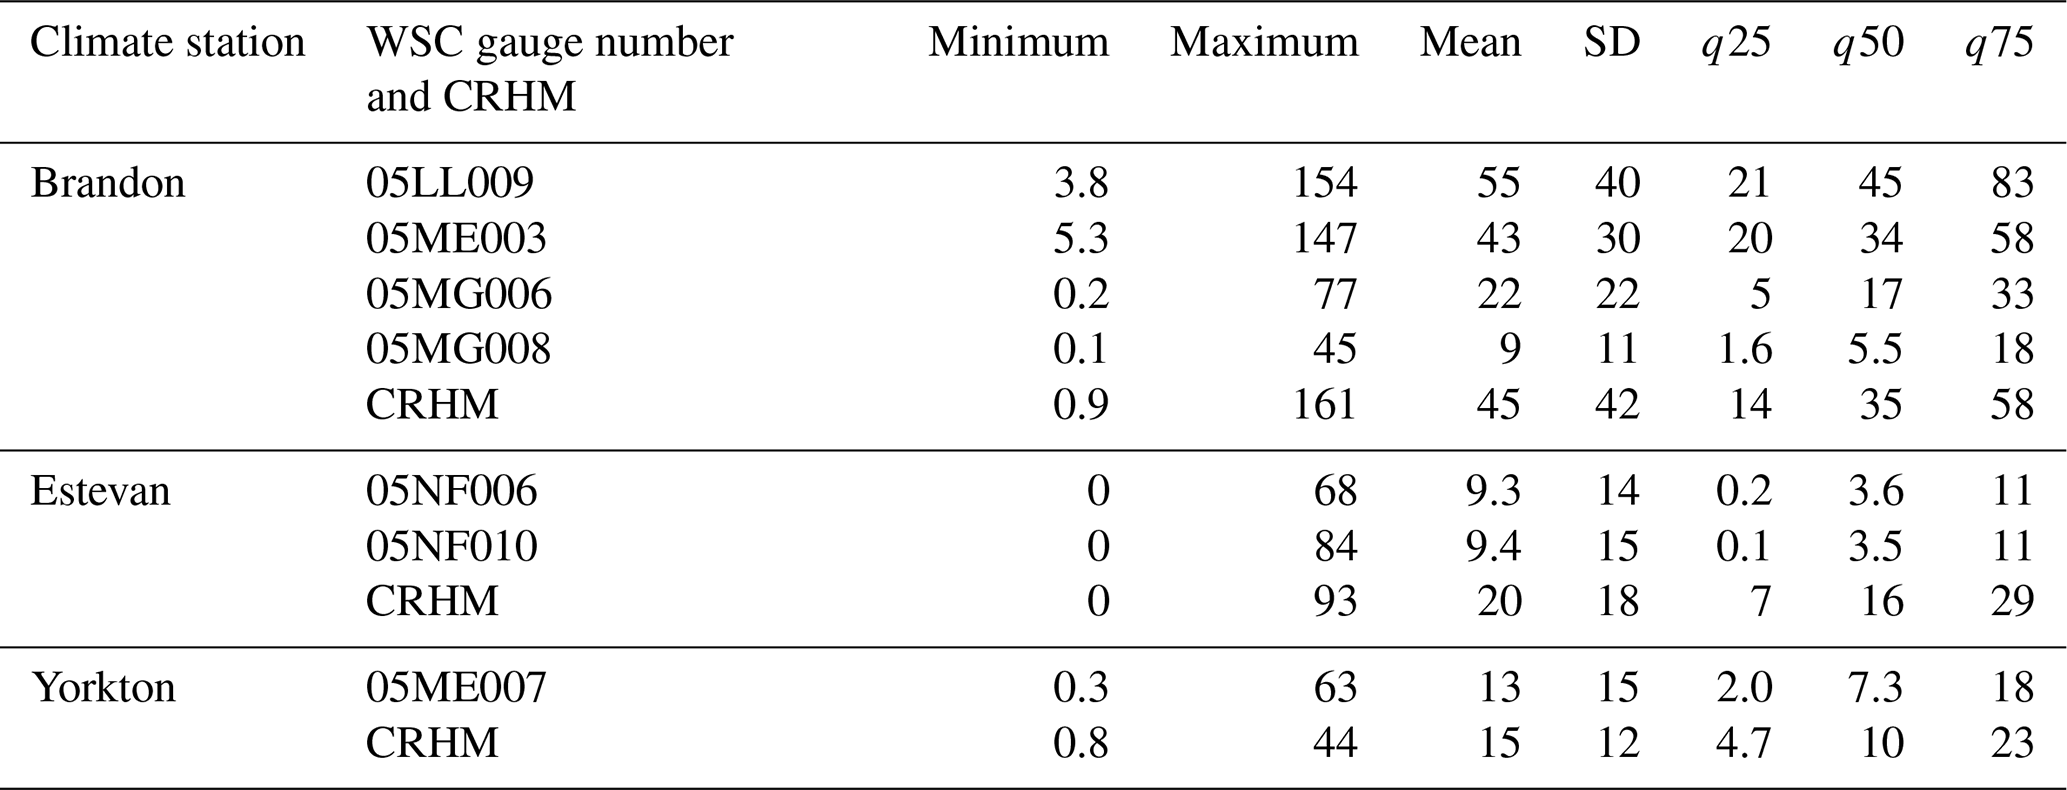
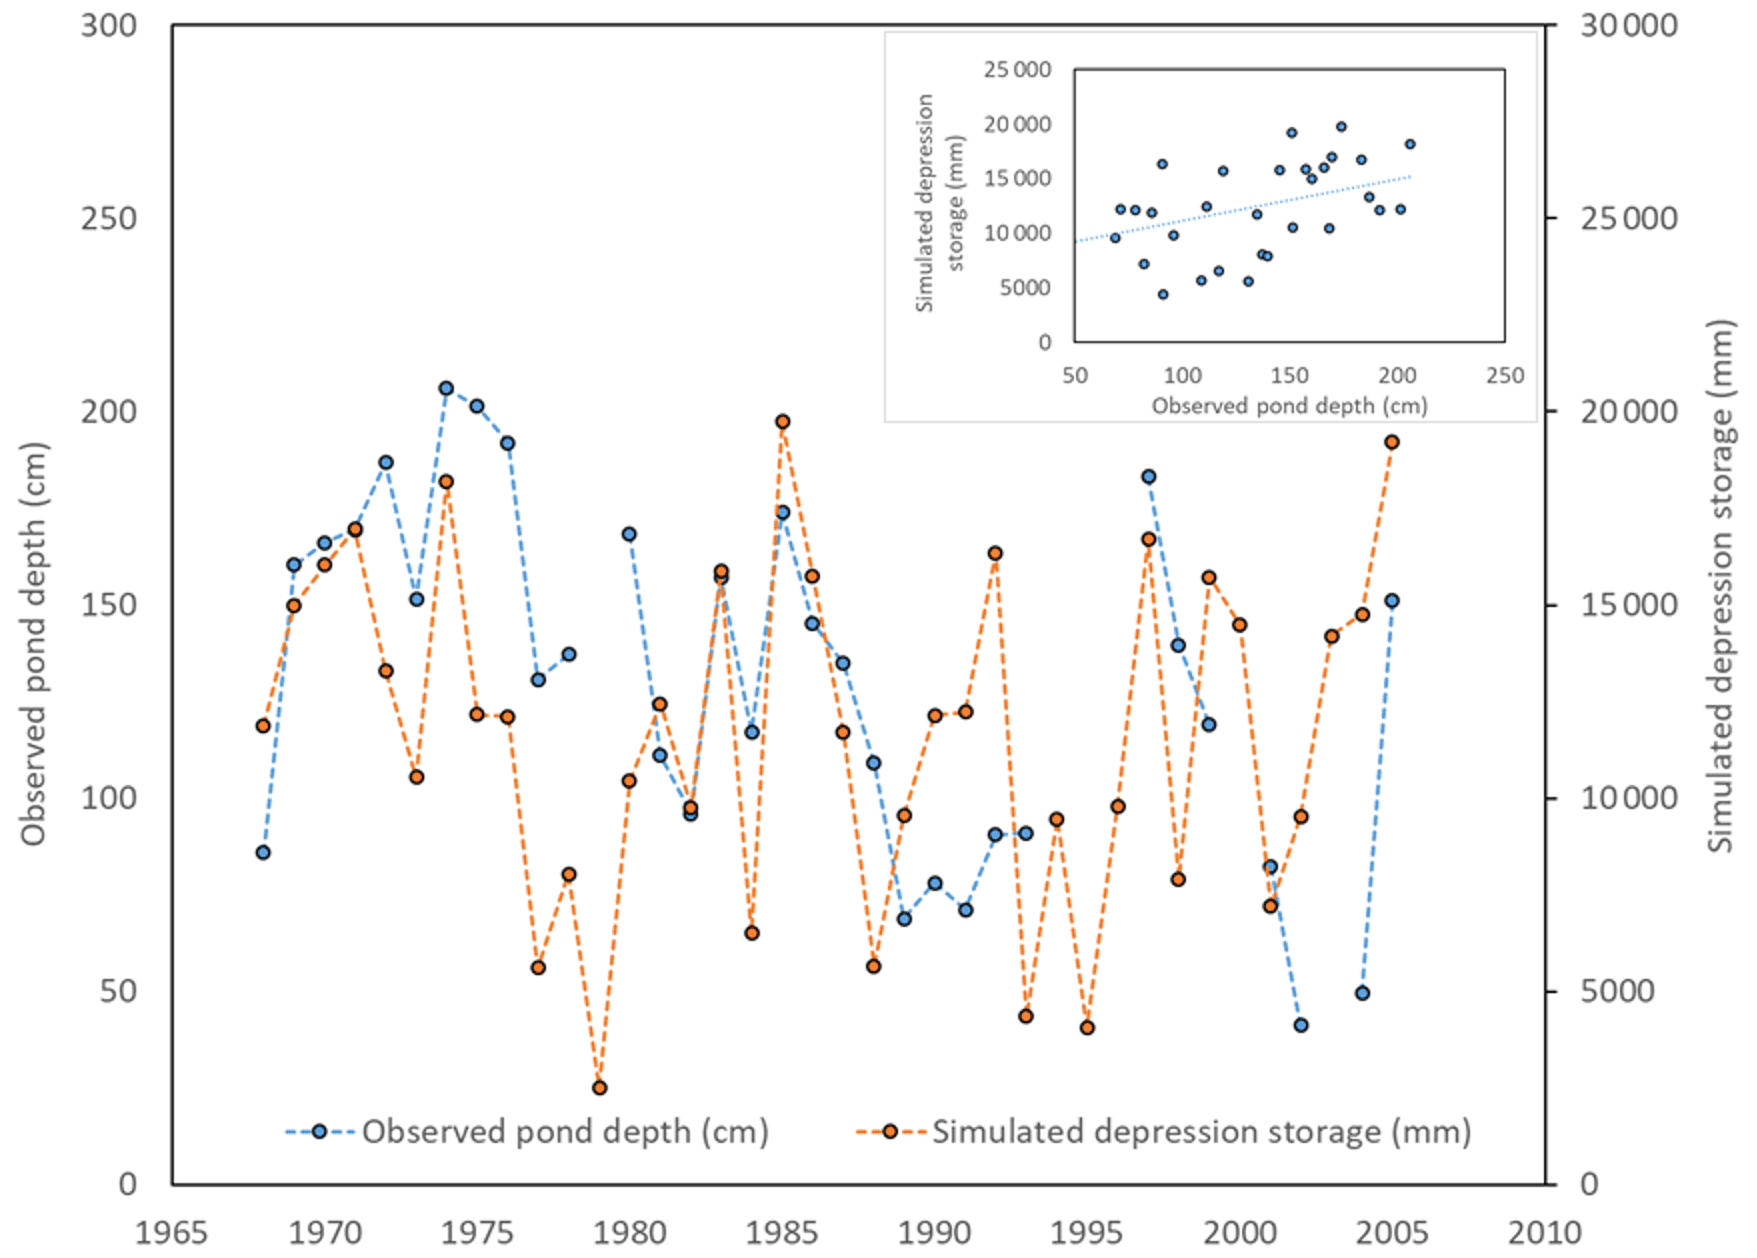
Figure 3Annual average of observed depths in four ponds at the St. Denis NWA (blue line) and simulated depression storage in the virtual model for the 1968–2005 period (orange line). The inset illustrates the relationship between the two annual averages (r = 0.42, p = 0.02, slope = 38.431, and intercept = 7290.5).
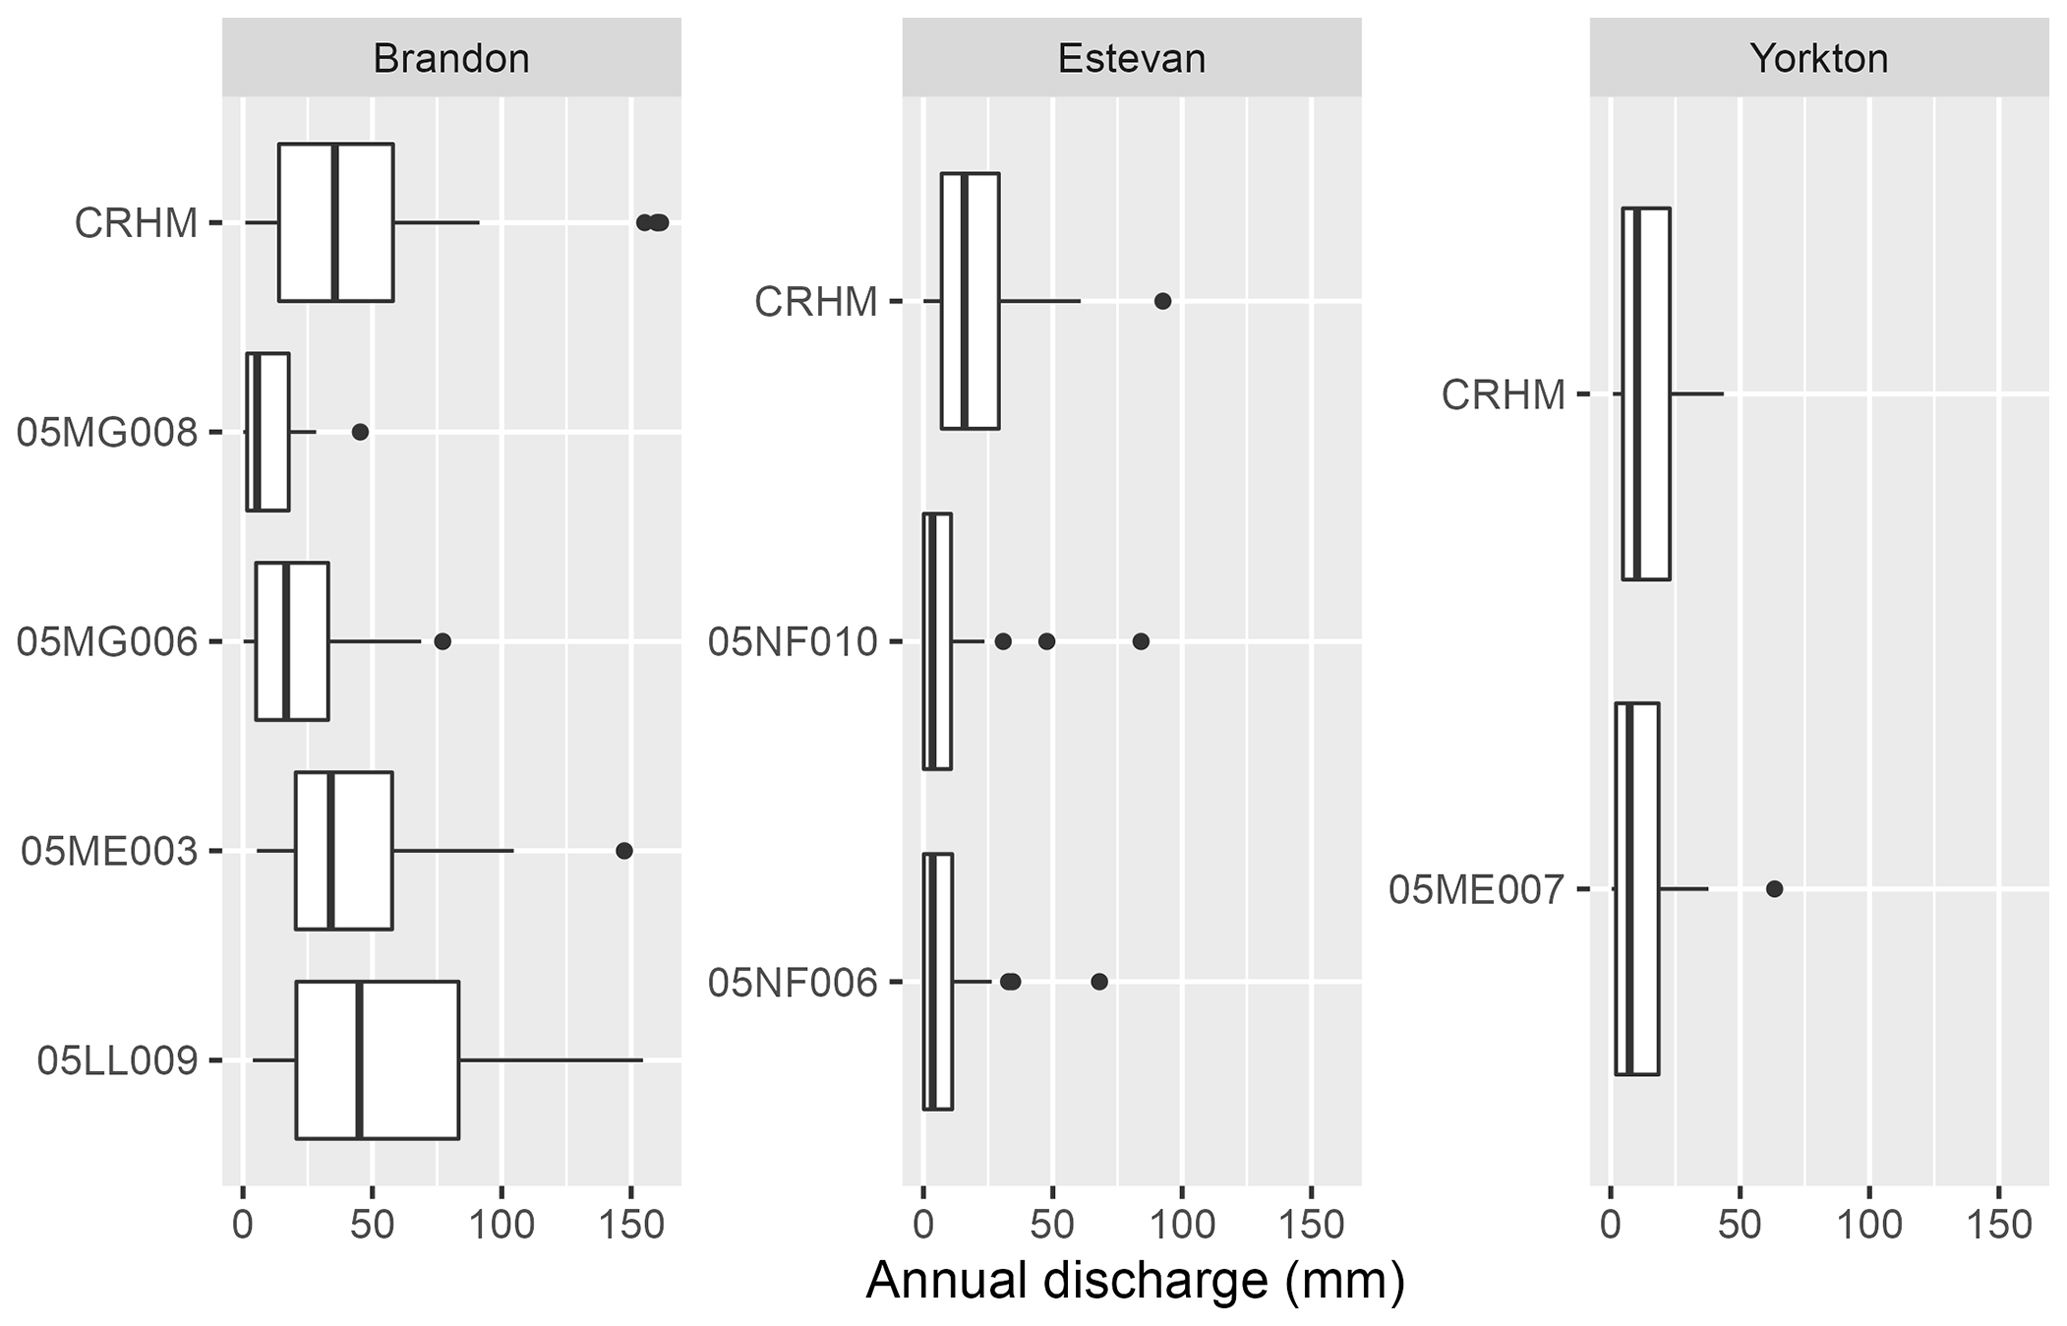
Figure 4Simulated (CRHM) baseline (recently observed wetland conditions) annual runoff for the PHT virtual basin for three of the four climate locations and observed annual runoff from corresponding WSC hydrometric gauges. The vertical line in the middle of the box denotes the mean, and the top and bottom of the box denote plus or minus 1 standard deviation. The whiskers denote 10th and 90th percentiles. Circles represent values beyond these percentiles.
3.1 Model validation
The time series of observed pond depths at the St. Denis NWA and simulated depression storage indicates the virtual model can capture long-term behaviour of storage in PHT basins. The values were reasonably correlated (r = 0.41), as indicated by their time series (Fig. 3). The model runs selected for this comparison were forced with the North Battleford climate, which is the closest (162 km) of the selected climate datasets. Some differences between the model and observation values can be attributed to the distance and different precipitation inputs between the two sites, and this is most apparent in the early 1990s. Through 1989 and 1990, St. Denis experienced 42 mm less precipitation than North Battleford. Similarly, St. Denis was 80 mm drier than North Battleford in 1993. The observational record becomes sparser after 1993, but the model still tends to capture year-to-year variation in storage and within the same relative amounts as earlier in the record. The virtual model was able to capture the range of annual runoff observed at the WSC stations (Fig. 4; Table 4). There was no gauged basin close enough in proximity to North Battleford that was entirely in PHT; thus, this station is absent from the validation. Runoff regimes among gauged streams close to Brandon can be diverse. The model simulations captured this range, but not necessarily for a specific basin, though the virtual model box plot was very similar to the runoff behaviour observed for 05ME0003 (Birdtail Creek near Birtle). Simulated mean annual runoff was overestimated when the model was forced with a climate from Estevan, but extreme dry and wet years were comparable. Simulations compared best with observations when forced with a Yorkton climate. Better agreement for some of the WSC gauges can be expected where those basins exhibit characteristics that are most similar to the median of all basins in the PHT class used to parameterize CRHM.
Table 5Simulated annual runoff (mm) for each drainage scenario for each climate forcing for the period of simulation. The baseline average for each climate station is provided, as is the average and standard deviation for each set of drainage scenarios at each of the four climate stations. Note: SD is for standard deviation.
3.2 Role of drainage pattern
The relatively low standard deviations among the various drainage patterns using meteorological data forcings for several climate stations (Table 5) show that any difference in the increase in annual runoff for the same drainage amount was subtle among the four drainage pattern scenarios. The probability distributions of annual runoff were not statistically significantly different among the different drainage pattern scenarios at any of the four climate locations. Kolmogorov–Smirnov scores were always near 0.1, with p values of no less than 0.8 for the 10 %, 50 %, and 90 % nominal drainage rate scenarios for each of the four climates. When 50 % of the wetland area was removed, median annual runoff did not vary much among the four drainage pattern scenarios, with coefficients of variation of 0.03 (Brandon), 0.05 (Estevan), 0.06 (North Battleford), and 0.07 (Yorkton).
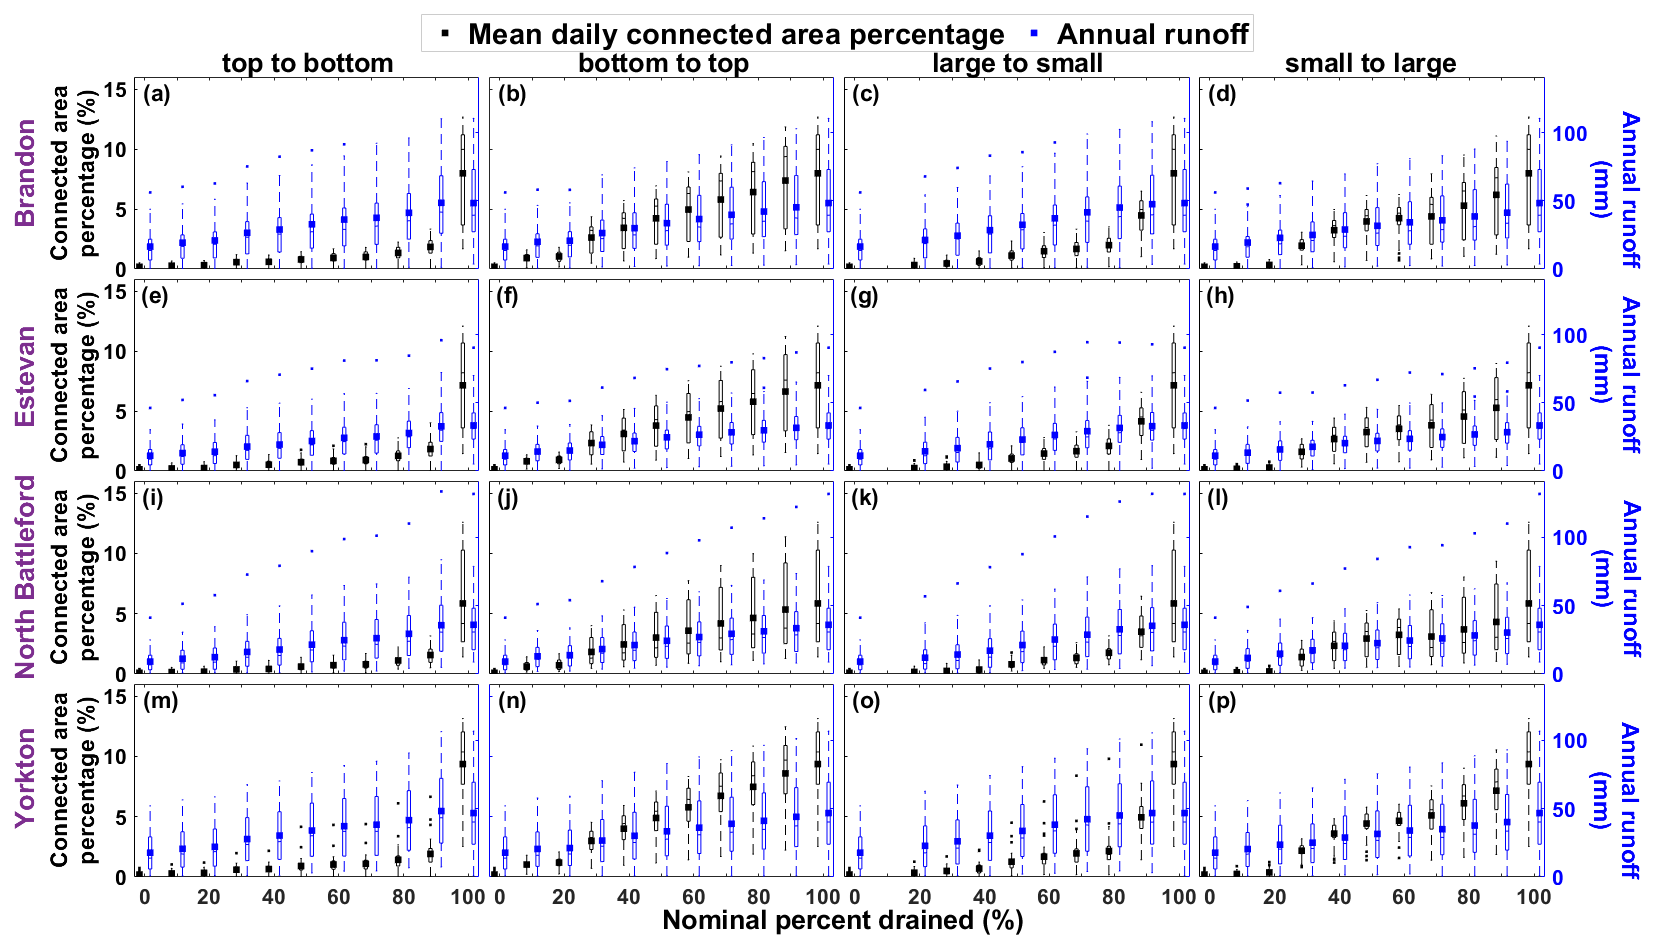
Figure 5Box plots of annual runoff depth (mm; blue) and annual maximum connected area percentage (black) for baseline (0 % drainage) and four drainage pattern scenarios for each of the four climates for the period of simulation (1965–2006).
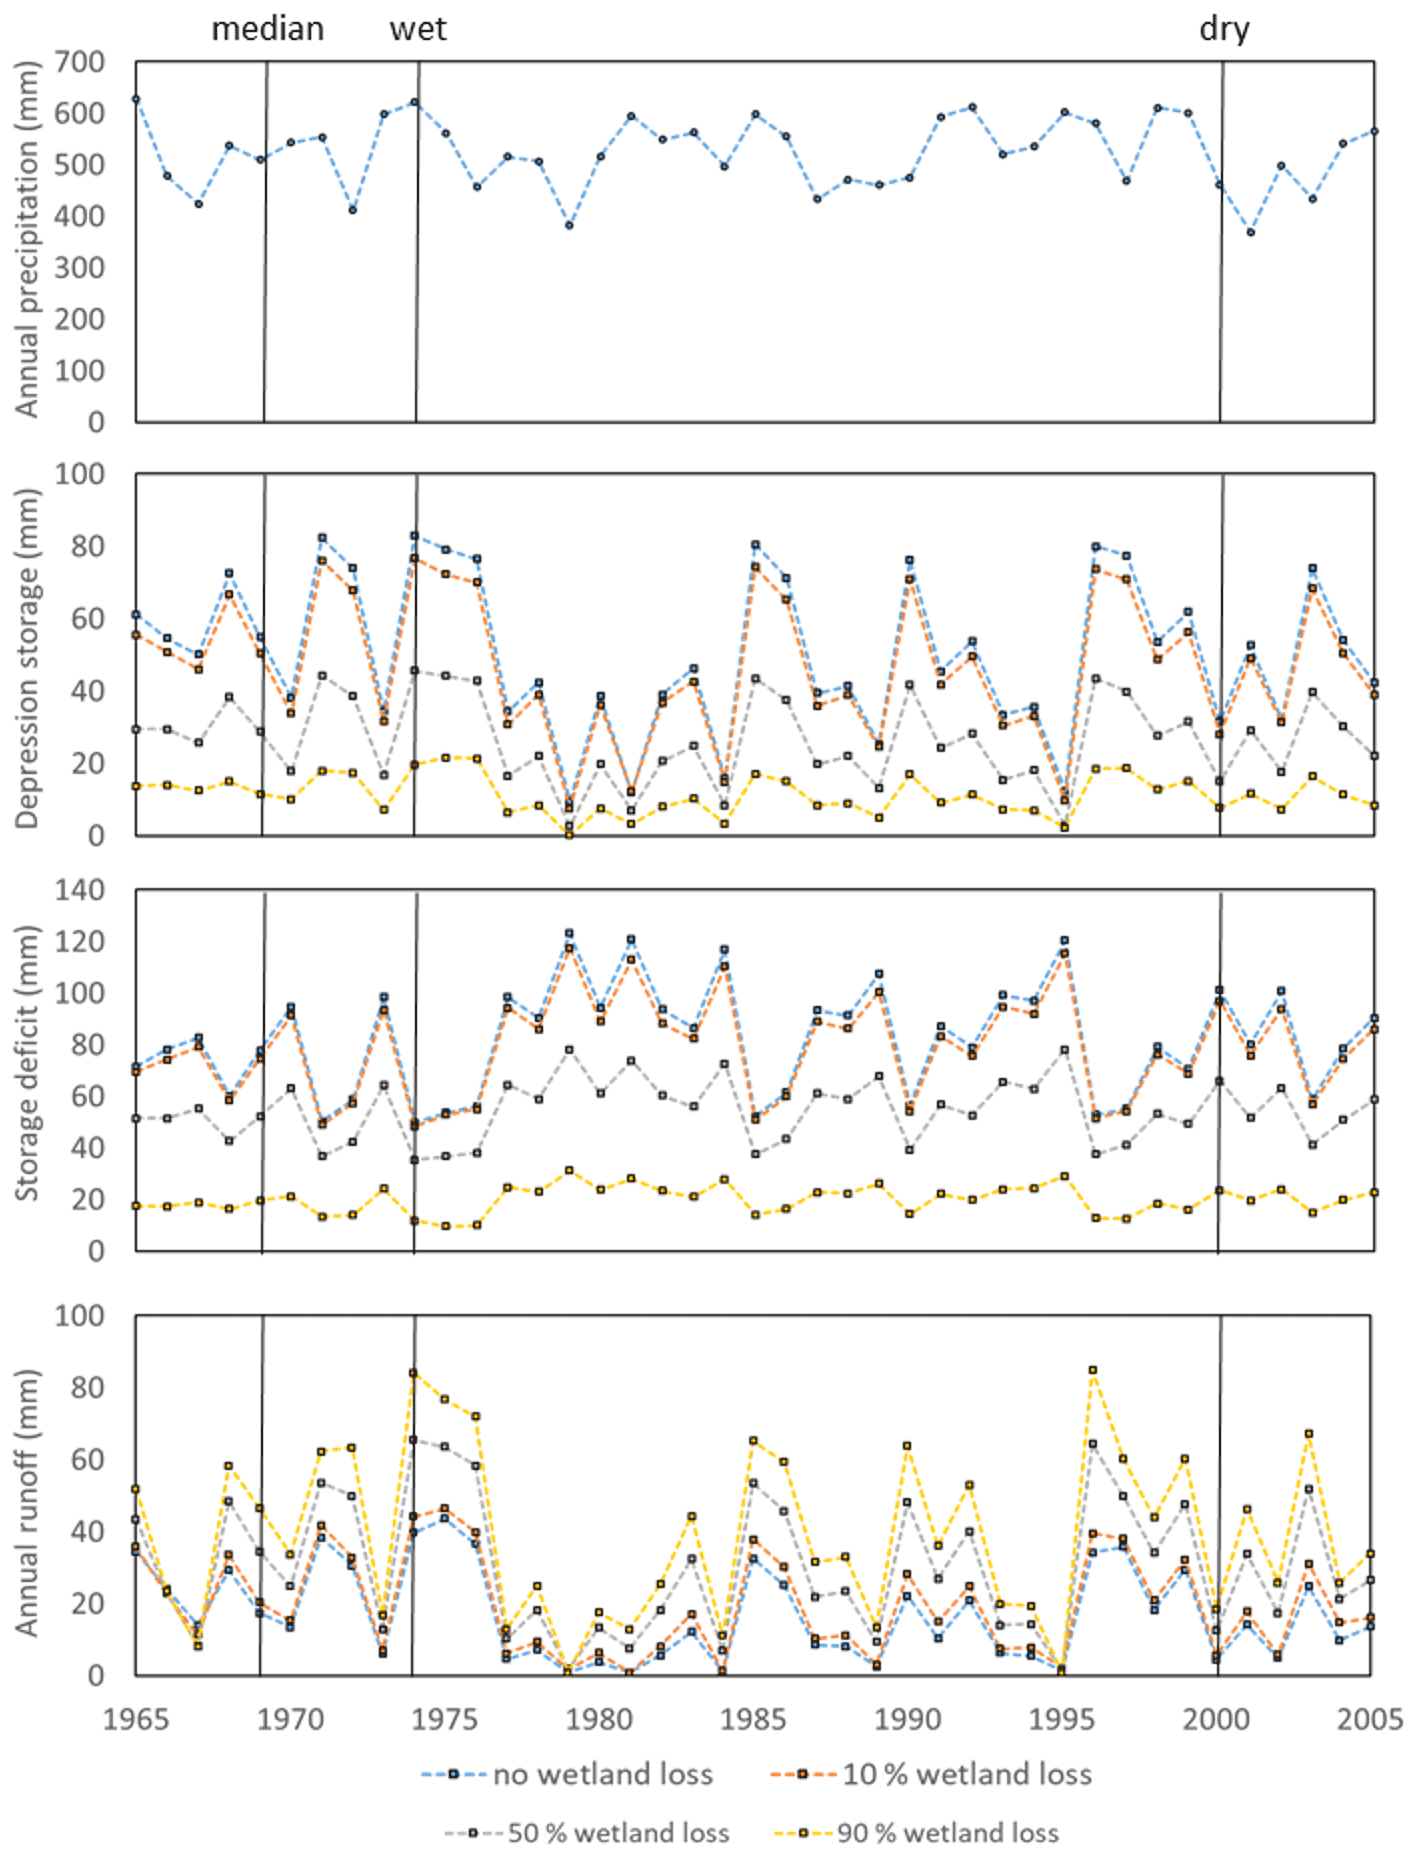
Figure 6Time series of Yorkton annual precipitation and simulated depression storage, storage deficit, and runoff for the small-to-large drainage scenario. Black lines highlight specific extreme dry (2000), extreme wet (1974), and median (1969) years discussed in the text.
3.3 Influence of fractional wetland drainage on annual runoff volume
Model simulations suggest that there are increases in annual runoff, even with relatively low magnitudes of wetland drainage. Median annual runoff increased between 10 % and 19 % for drainage scenarios when only 10 % of wetland area was drained (Table 5). In low flow years, annual runoff response across the four climate forcings and drainage patterns exhibited little absolute change, only increasing by 2.3 to 5.8 mm (Table 5, Fig. 5), even once 90 % of wetland area was drained and converted to cropland. This minimal response is largely because, when conditions are dry (e.g. year 2000; Fig. 6), there is little water available, and storage deficits are high, so little water proceeds to the basin outlet, even if there is a reduction in storage capacity with wetland removal. Baseline median annual runoff at the four locations averaged 11 ± 3.6 mm. This increased to averages of 15 ± 4.2, 24 ± 5.3, and 33 ± 6.8 mm among the climates and drainage scenarios at the 10 %, 50 %, and 90 % nominal percent drainages from current conditions, respectively (Table 5). Baseline maximum annual runoff averaged 47 ± 6.5 mm. Removing 10 %, 50 %, and 90 % wetland area increased average simulated maximum annual runoff to 57 ± 5.3, 78 ± 8.4, and 103 ± 15 mm among the climates and drainage scenarios. Complete drainage of wetlands and conversion to cropland in the model resulted in a more than doubling of simulated maximum annual runoff and more than tripling of median annual runoff.
Table 6Drainage thresholds (with standard error), where breakpoints indicate a difference in the rate of change in annual median runoff. Note: n/a is not applicable.
The asterisk∗ denotes instances when a slower change rate occurs after the breakpoint. Units are in percentages.
3.4 The absence of a threshold nominal wetland drainage rate
No thresholds were found below which the removal of wetland storage capacity did not increase the median annual flood (Table 6). Breakpoints occurred in almost every drainage scenario, but these were always associated with shifts from a non-zero rate of increase in runoff. The removal of the largest wetland in the distribution almost always resulted in an even faster rate of increased runoff with wetland drainage. Rates of increase in runoff only slowed once, on average, 68 % of the wetland area had already been removed.

Figure 7Change in mean minimum (circles), median (squares), and maximum (triangles) annual runoff for each of the four climate locations (red – North Battleford; yellow – Estevan; blue – Brandon; purple – Yorkton) compared to the baseline mean annual runoff. The dashed line represent 13.5 mm a−1 of median runoff, which is the average of the four locations.
3.5 Role of climate
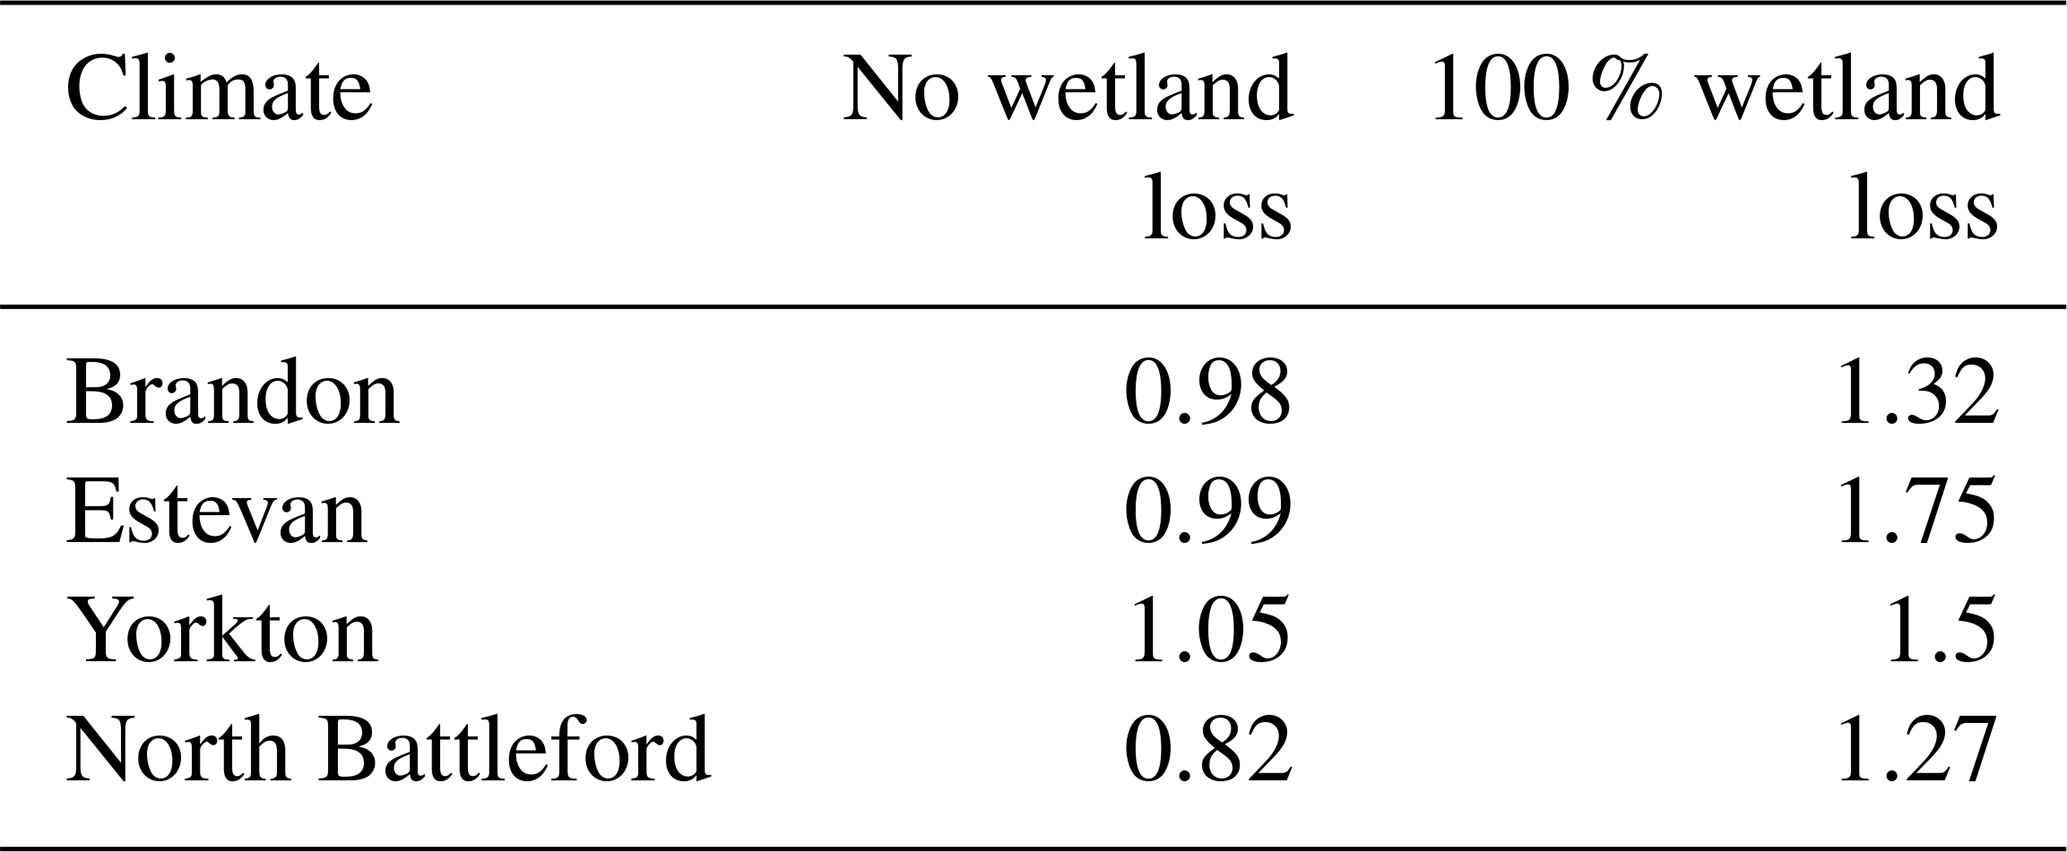
Simulated baseline mean annual runoff was used as an indicator of climate wetness as precipitation alone does not account for the role of evapotranspiration in dictating water available for runoff. Those locations with drier climates tended to be more sensitive to wetland drainage but only during extreme years (Fig. 7). The change in mean minimum annual runoff (across the four drainage patterns) over the period of simulation with 100 % wetland drainage was most pronounced with a climate such as North Battleford's, which had the lowest baseline mean annual runoff. This change diminished with sites that were progressively wetter. Change in mean median annual runoff was not sensitive to baseline climate. The change in mean annual maximum annual runoff had a similar pattern to that of low flows, but there was less change in the wetter climates at Yorkton and Brandon. Within a specific climate, however, dry years were less affected by drainage than median or extreme wet years. Again, using the Yorkton small-to-large drainage scenario as an example, Fig. 6 indicates that dry years were not as influenced by drainage as wet years with higher baseline flows. This is primarily because, in dry years, there is little water available for runoff production, depression storage is low (Fig. 6), capacity to retain storage is high, and areas hydrologically connected to the outlet are small (Fig. 5).
Basin-scale storage capacities decrease substantially with the drainage of wetlands (from 125 to 81 mm with 50 % wetland loss). The virtual basin with 50 % wetland loss in an extreme wet year such as 1974 holds a comparable amount of water in depression storage as a median year without any drainage (i.e. 1969; Fig. 6). Annual precipitation in 1969 and 1974 was 510 and 622 mm, respectively. The storage deficit with no drainage in 1969 was 77 mm but decreased to 52 mm with 50 % drainage, which is almost identical to that in 1974 (50 mm). With this smaller storage deficit created by removing half the wetland storage capacity, simulated annual runoff in median conditions of 1969 doubled from 17 to 34 mm and converged on the high water 1974 annual runoff of 40 mm. Likewise, a median year with 90 % wetland loss only retains the same amount of water on the landscape as that in an extreme dry year (1969 vs. 2000; Fig. 6).
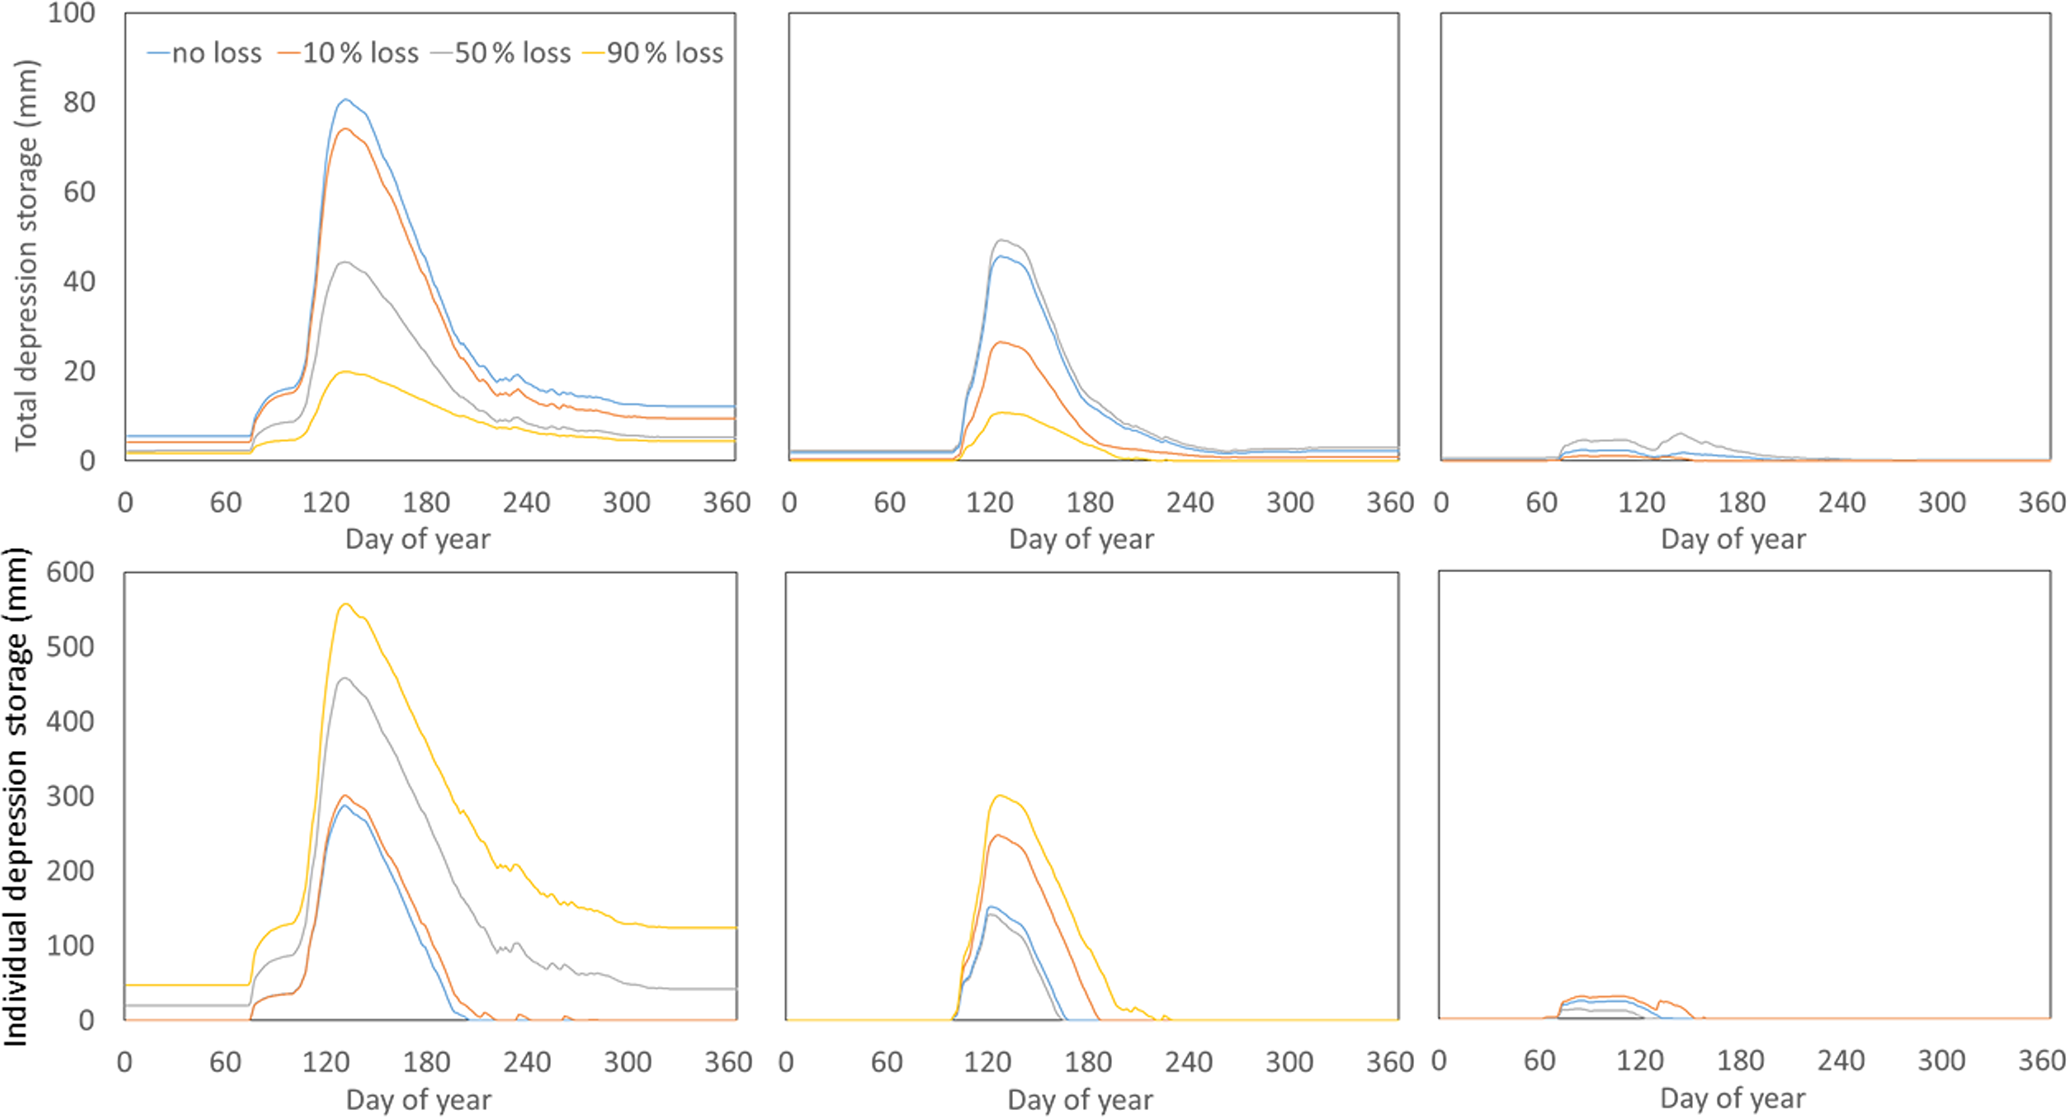
Figure 8Total depression storage in millimetres across the entire 100 km2 virtual basin for (a) an extreme wet year (e.g. 1974), (b) the median year (e.g. 1969), and (c) an extreme dry year (e.g. 2000). Similarly, individual depression storage held in one 0.08 km2 wetland during (d) an extreme wet year (e.g. 1974), (e) the median year (e.g. 1969), and (f) an extreme dry year (e.g. 2000) is shown.
As drainage rates increase, the last remaining wetland in each drainage scenario receives more water from upslope as storage capacity above it is removed. It stays fuller and connected to downstream locations longer (Fig. 8), meaning that separate portions of the basin can remain connected to the basin outlet longer for a smaller amount of annual precipitation. The storage recession coefficient t∗ for this wetland for a median year for the baseline Yorkton scenario was 69 d. For the small-to-large scenario, the increase is steady to 92 d, once 10 % of wetlands are removed, and 117 and 156 d, for the 50 % and 90 % wetland removal scenarios. This enhanced hydrological connectivity is exemplified in the top-to-bottom 90 % drainage pattern scenario. In this scenario, relatively small wetlands remain at the bottom of a hydrologically well-connected system. This resulted in the largest annual runoff response to drainage of any of the four scenarios (Fig. 5; Table 5).
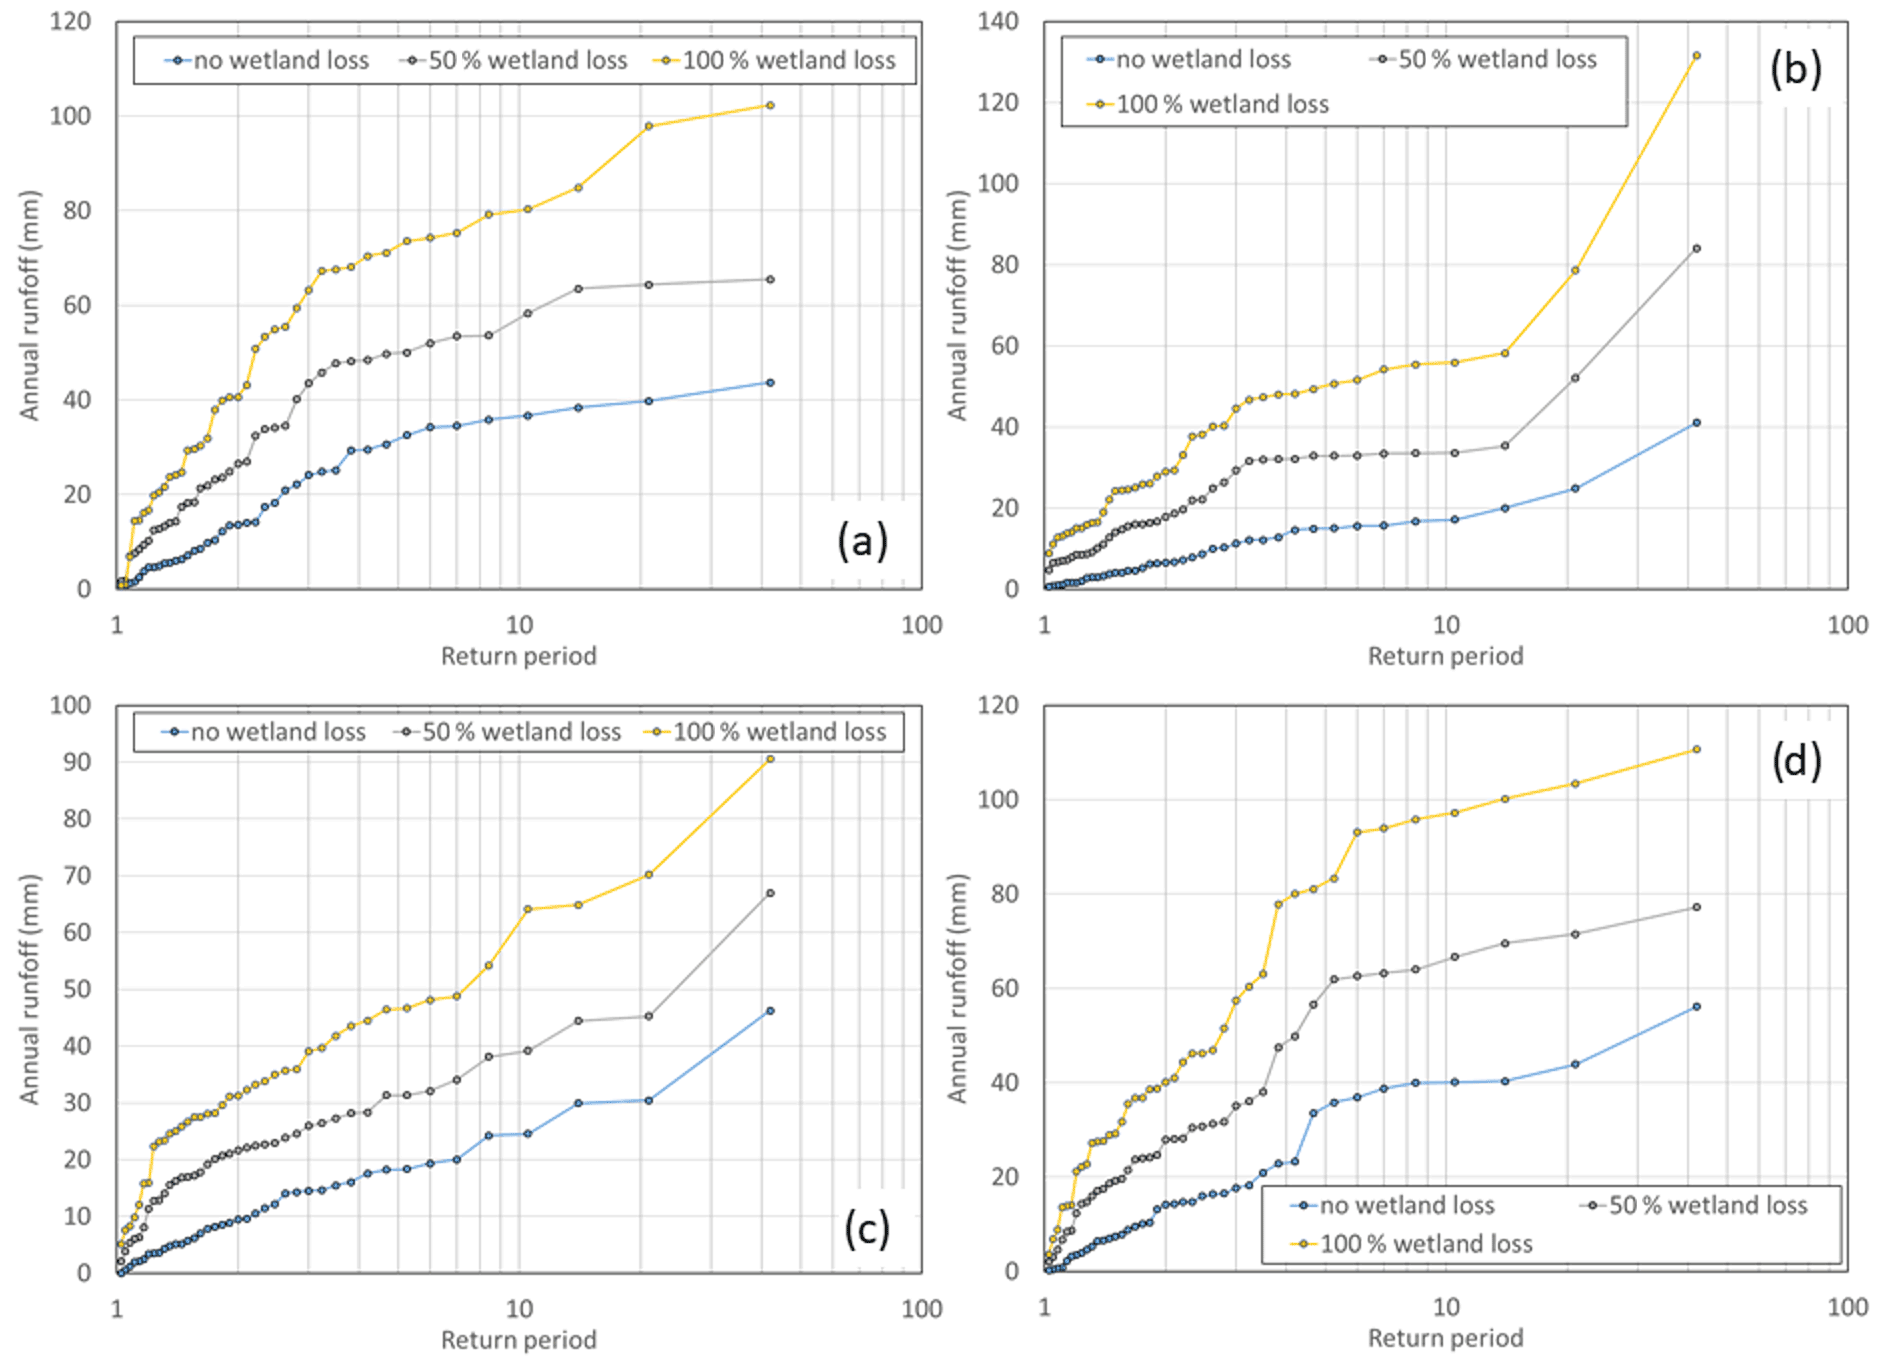
Figure 9Flood frequency curves for the four climate locations at (a) Yorkton, (b) North Battleford, (c) Estevan, and (d) Brandon for no wetland loss, 50 % wetland loss by area, and complete wetland loss, using the small-to-large wetland drainage scenario.
Sometimes what differentiates a year of extreme high runoff from a median year is high basin antecedent storage. Antecedent depression storage in a median year can be as little as half that of an extreme wet year (1969 vs. 1974; Fig. 6), meaning that more incoming precipitation goes into storage in a median year. In addition, because precipitation can be ∼ 100 mm lower in the median year than a particularly wet year, a larger portion is directed to the storage deficit. This further suppresses runoff in a median year relative to an extremely wet year. As storage capacity is removed from the landscape through wetland drainage, the size of the storage deficit of median years begins to decrease and to converge on those of extreme wet years. This is why median year runoff increases faster than runoff in extreme wet years. Model simulations of flood frequency show that, with wetland drainage, the same amount of precipitation can generate a maximum event that would have only generated a median event without wetland drainage (Fig. 9). One key characteristic of all 16 model simulations is the increasing range between extreme high and low runoff with wetland drainage (Fig. 7). The range in annual runoff increased by 57 ± 17 mm, and the coefficient of variation increased accordingly across the four climates (Table 7).
Table 7Coefficient of variation in annual runoff for the period of simulation (1965–2006).
Applying multiple linear regression analysis to the Leibowitz and Vining (2003) scheme indicates that hydrological connectivity and mean annual runoff increase with both precipitation and fractional drainage as follows:
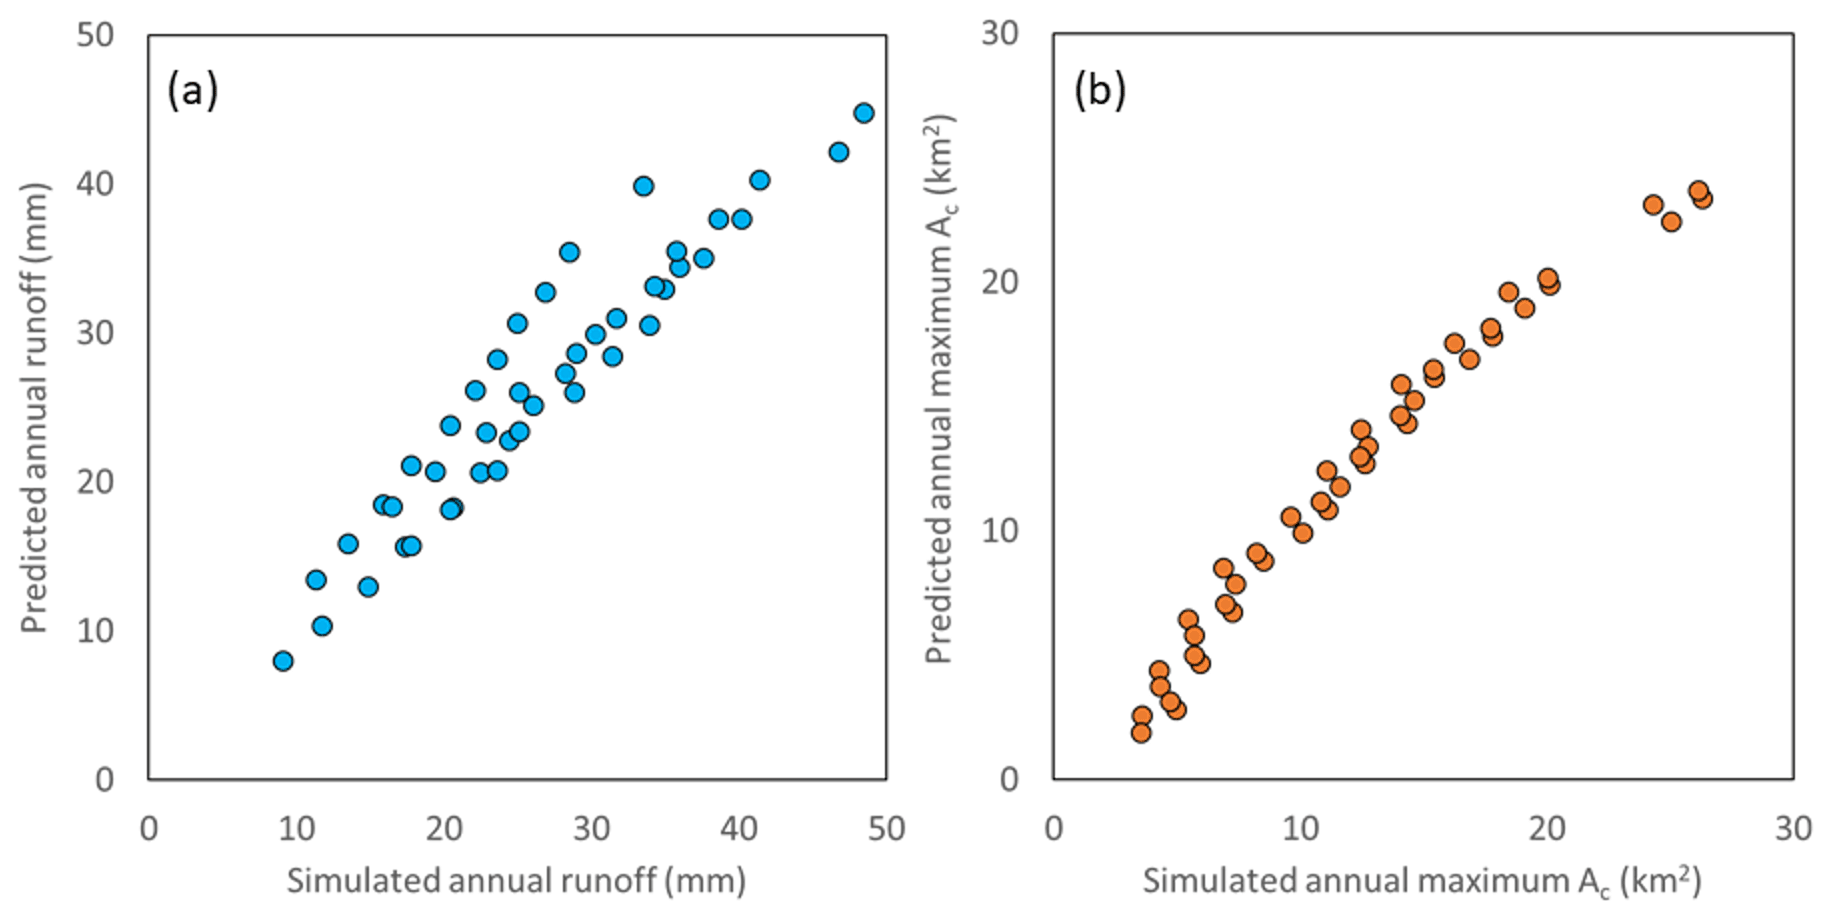
Figure 10(a) CRHM-simulated mean annual runoff vs. mean annual runoff predicted using Eq. (6) and (b) CRHM-simulated mean annual maximum contributing area vs. mean annual maximum contributing area using Eq. (5).
Both equations exhibit a relationship with an R2 of 0.9 and p < 0.001 at a confidence interval of 95 % (Fig. 10). Equations (5) and (6) demonstrate simply the positive relationship that drainage has with hydrological connectivity and runoff amount. The values of the coefficients suggest that mean annual runoff changes faster with changes in wetland drainage than annual precipitation.
The threshold at which runoff responds to drainage is as low as 10 % of the wetland area (the lowest scenario evaluated herein) and possibly lower. While current knowledge would imply the drainage pattern would result in significant differences in the degree of change in annual runoff (Acreman and Holden, 2013; Shook et al., 2013), it did not. This finding is consistent with Shook et al. (2021), who found that the arrangement of depressions was relatively unimportant, provided that the number of depressions was large and that the area of the largest depression was a small fraction of the total area. There were no significant statistical differences in the distribution of simulated annual runoff amongst preferentially draining large/small wetlands or upbasin/downbasin. While the response to individual runoff-producing events can be different among wetland complexes, model simulations imply that when the periods spanning multiple decades are evaluated, drainage pattern does not make a statistically significant difference. Upon closer inspection, there were subtle differences in the runoff response to the drainage pattern. When wetlands with larger storage capacity were preferentially removed, there were shifts in the hydrological connections. It is through the influence of wetland storage capacity on hydrological connectivity that wetland removal influences runoff response. Removal of these “gatekeepers” (Phillips et al., 2011) enhances the rate of increase in runoff (Table 6) because it enhances the ability of the basin to sustain hydrological connections when water is available (Fig. 8). Decline in the rate of increase in runoff sometimes occurs at higher nominal drainage rates. Once all the gatekeepers have been removed, there is a less marginal impact of removing remaining wetlands. These results corroborate those of Shaw et al. (2012) and Pomeroy et al. (2012), who demonstrated the importance of surface storage state – the volume and the spatial distribution – to the transfer of water downstream and the dynamics of connectivity across this landscape. The results also agree with Shook et al. (2021) in that the location and size of large gatekeeping wetlands can dominate the basin connectivity.
Higher hydrological connectivity with drainage results in faster rates of filling in remaining downstream wetlands. McKenna et al. (2019), when applying a model to drained and undrained cases, found that consolidation drainage sped up the rate of filling and that the earlier filling caused an order of magnitude more water to spill from the basin than would have otherwise. They also found that short pulses of water (priming) are more able to reach the terminal wetland. This kind of behaviour was documented here with the extended periods of connection in wetland HRUs under drainage (Fig. 8). This explains one reason why large consolidated wetlands in wetland complexes tend to stay fuller longer than intact smaller ones because there is a larger contributing area available to them, as the wetlands upslope have been removed (McCauley et al., 2015). They also tend to be groundwater discharge locations, and this augments storage and keeps them closer to capacity. Because consolidated wetlands tend to be fuller, a wetland complex dominated by consolidated wetlands is less able to attenuate flooding than the original complex (Haque et al., 2017).
The major influence of wetland drainage on runoff production is the removal of storage capacity and resultant increase in basin connectivity. This allows areas upslope of the wetland that would have previously only very infrequently contributed to runoff to become areas that do so regularly (Tiner, 2003; Ehsanzadeh, 2016; Haque et al., 2017), allowing runoff access to basin outlets. It is the drainage pattern that most expands the connected area that most enhances runoff (Fig. 5). While McCauley et al. (2015) claim that wetland drainage increases flooding probability (as also suggested in Fig. 9), Hayashi et al. (2016) suggested that wetland drainage would only impact flood frequency if large terminal wetlands (i.e. gatekeepers) are removed, as these tend to have the largest storage capacity. The simulations presented here provide results that support and advance on both of these studies. Even removal of small wetlands increases flooding probability (Fig. 9), which concurs with McCauley et al. (2015). Model simulations also support Hayashi et al. (2016) in that they demonstrated that runoff increases faster once large wetlands are removed (Table 6). An advantage of the virtual basin model approach employed here is that it simulated a long period that included a wide variety of precipitation and antecedent storage conditions across a diversity of wetland complexes. This has allowed the seemingly disparate results of past research from individual basins to be put into a broader regional and longer-term context and find that conflicting results are often only because of differences in spatial scale and temporal scope of investigation. Something to consider with the basin-classification-based virtual modelling approach is that the results are representative of what would be expected in a typical PHT basin and not any specific basin. Because the model does not represent a specific basin, good model performance should be determined not necessarily on how well simulations emulate observations from one place but how well the variability in hydrological behaviour is captured. Departures from the modelled results will exist, depending on how different a specific basin is from the parameterized virtual basin. The results are best interpreted as how basins across the class as a whole would respond to wetland drainage.
For instance, Simonovic and Juliano (2001) concluded that wetland drainage does not enhance low frequency–high magnitude floods, despite the removal of storage capacity from the landscape, while Pomeroy et al. (2010, 2014) suggested otherwise. Herein, simulated runoff during both extreme wet and dry conditions was less sensitive to wetland drainage than average conditions. These similar degrees of change are related to baseline hydrological connectivity. During wet conditions, baseline connectivity is typically high and storage deficits are low and wetland drainage cannot increase connectivity much more, and runoff response to drainage in extreme years was less than in median years, substantiating Simonovic and Juliano (2001). During dry conditions, the lack of water results in little hydrological connectivity, even with a high rate of wetland drainage. With drainage, as capacity is removed, the storage deficit in median years converges on those of wet years, which is why median years increase faster as wetland area drained increases, also substantiating the results of Pomeroy et al. (2010, 2014).
Without capacity on the landscape to hold water, the separation in storage conditions among dry–median–wet years decreases (Fig. 8). Shook et al. (2013) noted how much surface storage on the landscape instils a degree of memory in the hydrological system. Without surface storage, precipitation becomes a more important driver of runoff response. In a region such as the Canadian Prairie where drought and deluge are both common (Johnson et al., 2005), this can enhance the difference between extremes and reduce buffering of extremes. There are economic reasons to remove surface water storage capacity from the landscape during wet periods, but removing the storage capacity of wetland depressions desiccates the region more quickly with the onset of drought.
Model simulations suggest runoff responds to drainage, climate, and atmospheric conditions in five specific ways (Fig. 11). The response of the runoff regime to drainage is immediate during average conditions (Fig. 11; no. 1), but runoff depths increase more if key wetlands with large storage capacity, gatekeepers, are removed (no. 2). If drainage continues to 100 % loss, the rate of increase in runoff must slow because the total change has to converge at the same point, if all else is held equal. However, drier climates experience greater increases in runoff than wetter ones as there is more capacity to enhance hydrologic connectivity over baseline conditions (no. 3). During dry conditions, however, runoff response is tempered as there is little water available for runoff even though drainage permits greater potential for hydrologic connections (no. 4). Drainage enhances runoff during extreme wet years (no. 5), but not as much as average years, again because, under wetter conditions where hydrologic connections in the basin are greater, the relative degree of connectivity with drainage does not change as dramatically under a baseline condition.
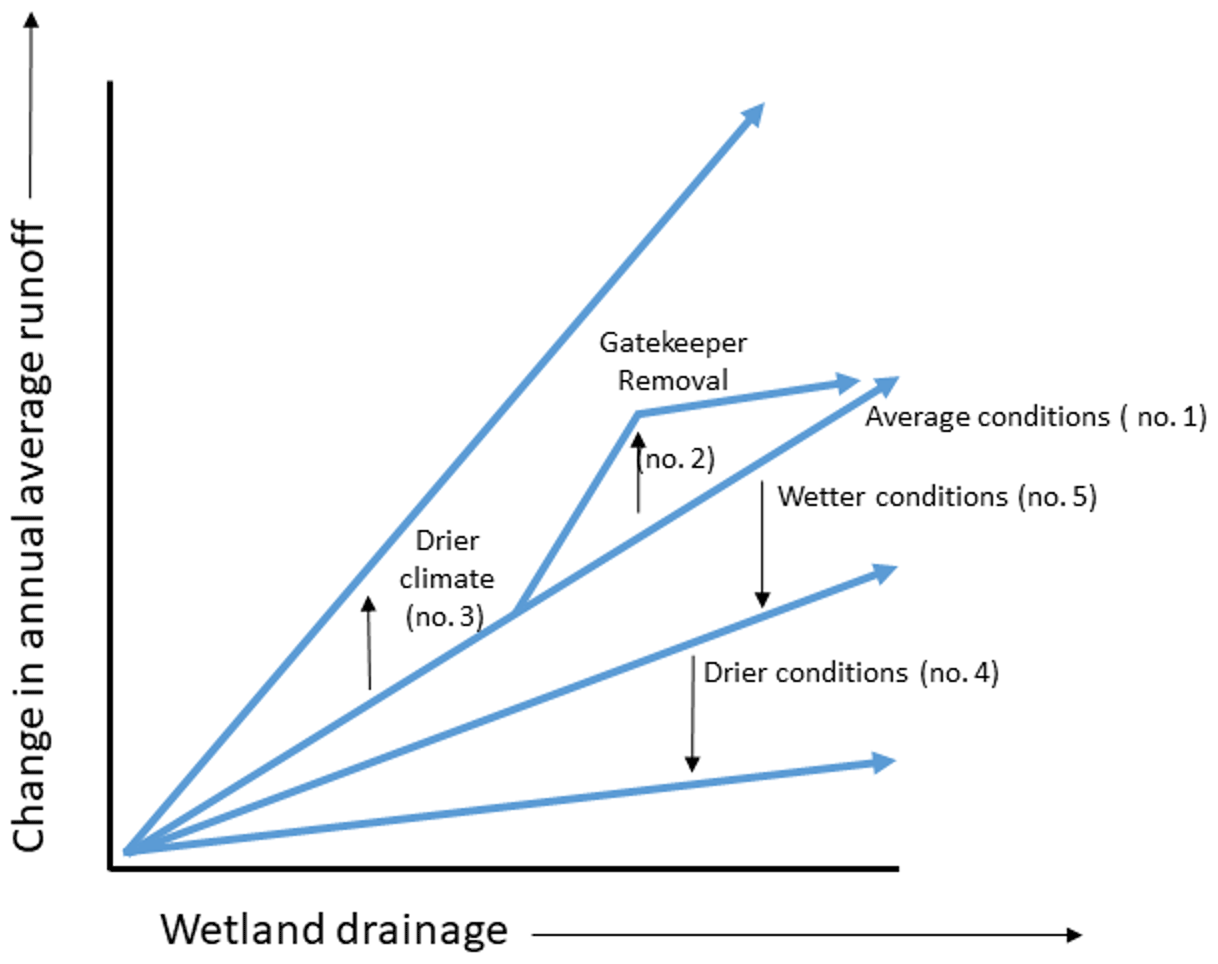
Figure 11Conceptual framework of runoff response to wetland drainage in the Prairie Pothole Till class. Five different runoff responses to drainage are shown, representing a range of annual wetness/dryness conditions and climate. Complete description of these responses is provided in the discussion text.
The objective of this research was to address three key knowledge gaps about the influence of wetland drainage on runoff regimes. First, is runoff response different with the geometry and topology of drainage (i.e. the spatial patterns of drainage)? Virtual basin model simulations imply that the drainage pattern does not relate to how the long-term runoff regime responds to drainage. However, the removal of gatekeeper wetlands does. Bias that might be introduced into the wetland distribution by coarse data makes it difficult to identify what the threshold size of a gatekeeper wetland might be and precisely how much runoff might increase with its removal. Second, is there a threshold below which wetland drainage has no effect on the annual runoff regime? No threshold could be discerned in our analysis, despite considering drainage levels as low as 10 % of wetland area. Third, do wetter regions and conditions, which presumably have more frequent connections, result in reduced sensitivity to drainage, as they tend to operate closer to the storage capacity anyway? Not necessarily. Wetter climates result in a muted response in extremely high runoff, and climate was inconsequential for median conditions. But, in the same climate, minimum, median, and maximum annual runoff all reacted differently to simulated drainage. Minimum flows did not change, maximum runoff doubled, and median runoff tripled. The removal of storage capacity enhances hydrological connectivity during median annual runoff to the extent that this runoff approaches maximum runoff amounts prior to drainage, which results in a faster rate of change than during high runoff conditions when wetlands are well connected and already near their storage capacity.
The response of runoff to wetland drainage is complicated, and this has been reflected in the diversity of findings in the literature. The results produced by the virtual basin modelling with CRHM imply that, in many instances, these seemingly possibly contradictory results are actually consistent. Differences often have to do with the scope and scale of the study. The conceptual framework and quantifiable relationships provided here show, in general, how annual runoff in different climatic and drainage situations will likely respond to wetland drainage in the PHT landscape. The authors are working diligently to communicate the information summarized here to water management agencies, indigenous peoples, agricultural producers, and basin stewardship groups. These ongoing efforts will hopefully mean that these results will be used to inform agricultural policies and practices, water management programmes, and wetland conservation efforts so that everyone in society can benefit from living in this remarkable environment.
Climate data inputs, model outputs, and model parameter files have been uploaded to the Federated Research Data Repository. Data are available under the title “Virtual Watershed Model Simulations for Typified Prairie Watersheds in Pothole Till” at https://doi.org/10.20383/103.0650 (He et al., 2022).
CS, JWP, and CJW conceived the study. ZH, KRS, and JWP led the modelling effort and data analysis. JDW led the basin classification. All authors contributed to writing.
The contact author has declared that none of the authors has any competing interests.
Publisher's note: Copernicus Publications remains neutral with regard to jurisdictional claims in published maps and institutional affiliations.
We want to thank our stakeholders because the financial support over the years from the Canada Research Chair programme and NSERC Discovery Grants have contributed to the CRHM model development. We wish to thank Tom Brown, of the Centre for Hydrology, for his development of CRHM code over 2 decades. The authors wish to thank two anonymous reviewers, for providing suggestions that improved the paper.
This research has been supported by the Canada First Research Excellence Fund (Global Water Futures/Prairie Water).
This paper was edited by Fabrizio Fenicia and reviewed by two anonymous referees.
AAFC: Detailed Soil Surveys, Agriculture and Agri-Food Canada, Government of Canada [data set], https://open.canada.ca/data/en/dataset/7ed13bbe-fbac-417c-a942-ea2b3add1748 (last access: 5 July 2022), 2015.
AAFC: Annual Crop Inventory, Agriculture and Agri-Food Canada, Government of Canada [data set], https://open.canada.ca/data/en/dataset/ba2645d5-4458-414d-b196-6303ac06c1c9 (last access: 5 July 2022), 2016.
Acreman, M. and Holden, J.: How wetlands effect floods, Wetlands, 33, 773–786, 2013.
Ali, G. and English, C.: Phytoplankton blooms in Lake Winnipeg linked to selective water-gatekeeper connectivity, Sci. Rep.-UK, 9, 8395, https://doi.org/10.1038/s41598-019-44717-y, 2019.
Ali, G., Haque, A., Basu, N. B., Badiou, P., and Wilson, H.: Groundwater-driven wetland-stream connectivity in the Prairie Pothole Region: Inferences based on electrical conductivity data, Wetlands, 37, 773–785, 2017.
Ameli, A. A. and Creed, I. F.: Quantifying hydrologic connectivity of wetlands to surface water systems, Hydrol. Earth Syst. Sci., 21, 1791–1808, https://doi.org/10.5194/hess-21-1791-2017, 2017.
Armstrong, R. N., Pomeroy, J. W., and Martz, L. W. Evaluation of three evaporation estimation methods in a Canadian prairie landscape, Hydrol. Process., 22, 2801–2815, 2008.
Armstrong R. N., Pomeroy J. W., and Martz L. W.: Variability in evaporation across the Canadian Prairie region during drought and non-drought periods, J. Hydrol., 521, 182–195, https://doi.org/10.1016/j.jhydrol.2014.11.070, 2015.
Baulch, H., Whitfield, C., Wolfe, J., Basu, N., Bedard-Haughn, A., Belcher, K., Clark, R., Ferguson, G., Hayashi, M., Ireson, A., Lloyd-Smith, P., Loring, P., Pomeroy, J. W., Shook, K., and Spence, C.: Synthesis of science: findings on Canadian Prairie wetland drainage, Can. Water Resour. J., 46, 229–241, https://doi.org/10.1080/07011784.2021.1973911, 2021.
Brannen, R., Spence, C., and Ireson, A.: Influence of shallow groundwater-surface water interactions on the hydrological connectivity and water budget of a wetland complex, Hydrol. Process., 29, 3862–3877, 2015.
Bullock, A. and Acreman, M.: The role of wetlands in the hydrological cycle, Hydrol. Earth Syst. Sci., 7, 358–389, https://doi.org/10.5194/hess-7-358-2003, 2003.
Chambers, J. M.: tatistical Models in Southern California, Linear models, in: Statistical Models, edited by: Chambers, J. M. and Hastie, T. J., Wadsworth & Brooks/Cole, Pacific Grove, ISBN 0 534 16765-9, 1992.
Cohen, M. J., Creed, I. F., Alexander, L., Basu, N. B., Calhoun, A. J. K., Craft, C., D'Amico, E., DeKeyser, E., Fowler, L., Golden, H. E., Jawitz, J. W., Kalla, P., Kirkman, K., Lane, C. R., Lang, M., Leibowitz, S. G., Lewis, D. B., Marton, J., McLaughlin D. L., Mushet, D. M., Raanan-Kiperwas, H., Rains, M. C., Smith, L., and Walls, S. C.: Do geographically isolated wetlands influence landscape function?, P. Natl. Acad. Sci. USA, 113, 1978–1986, 2016.
Cortus, B. G., Unterschultz, J. R., Jeffrey, S. R., and Boxall, P. C.: The impacts of agriculture support programs on wetland retention on grain farms in the Prairie Pothole Region, Can. Water Resour. J., 34, 245–254, 2009.
Davidson, N. C.: How much wetland has the world lost? Long term and recent trends in global wetland area, Mar. Freshwater Res., 65, 936–941, 2014.
Dingman, S. L.: Effects of permafrost on stream characteristics in the discontinuous permafrost zone of Central Alaska, Permafrost: North American Contribution to the Second International Conference, National Academy of Sciences, Washington, DC, Yakutsk, USSR, 13–28 July 1973, 447–453, 1973.
Dumanski, S., Pomeroy, J. W., and Westbrook, C. J.: Hydrological regime changes in a Canadian Prairie basin, Hydrol. Process., 29, 3893–3904, 2015.
Ehsanzadeh, E.: Impact of climate variability and wetland drainage on watershed response in depression dominated landscapes, Int. J. River Basin Mgmt., 16, 169–178, 2016.
Ehsanzadeh, E., Spence, C., van der Kamp, G., and McConkey, B.: On the behaviour of dynamic contributing areas and flood frequency cures in North American Prairie watersheds, J. Hydrol., 414–415, 364–373, 2012.
Fang, X., Pomeroy, J. W., Westbrook, C. J., Guo, X., Minke, A. G., and Brown, T.: Prediction of snowmelt derived streamflow in a wetland dominated prairie basin, Hydrol. Earth Syst. Sci., 14, 991–1006, https://doi.org/10.5194/hess-14-991-2010, 2010.
Farr, T. G., Rosen, P. A., Caro, E., Crippen, R., Duren, R., Hensley, S., Kobrick, M., Paller, M., Rodriguez, E., Roth, L., Seal, D., Shaffer, S., Shimada, J., Umland, J., Werner, M., Oskin, M., Burbank, D., and Alsdorf, D.: The shuttle radar topography mission, Rev. Geophys., 45, RG2004, https://doi.org/10.1029/2005RG000183, 2007.
Gleason, R. A., Tangen, B. A., Laubhan, M. K., Kermes, K. E., and Euliss Jr., N. H.: Estimating water storage capacity of existing and potentially restorable wetland depressions in a subbasin of the Red River of the North, U. S. Geological Survey Open-File Report 2007–1159, U.S. Geological Survey, Reston,, 36 pp., 2007.
Godwin, R. B. and Martin, F. R. J.: Calculation of gross and effective drainage areas for the Prairie Provinces, Canadian Hydrology Symposium – 1975 Proceedings, 11–14 August 1975, Winnipeg, Manitoba. Associate Committee on Hydrology, National Research Council of Canada, 219–223, 1975.
Golden, H. E., Lane, C. R., Amatya, D. M., Bandilla, K. W., Kiperwas, H. R., Knightes, C. D., and Ssegane, H.: Hydrologic connectivity between geographicall isolated wetlands and surface water systems: A review of select modeling methods, Environ. Modell. Softw., 53, 190–206, 2014.
GSC: Canadian Geoscience Map, Surficial geology of Canada/Géologie des formations superficielles du Canada, Geological Survey of Canada, Government of Canada, Natural Resources Canada, 195 pp., https://doi.org/10.4095/295462, 2014.
Haque, A., Ali, G., and Badiou, P.: Hydrological dynamics of prairie pothole wetlands: Dominant processes and landscape controls under contrasted conditions, Hydrol. Process., 32, 2405–2422, 2017.
Hayashi, M., van der Kamp, G., and Rudolph, D. L.: Water and solute transfer between a prairie wetland and adjacent uplands, 1. Water balance, J. Hydrol., 207, 42–55, 1998.
Hayashi, M., van der Kamp, G., and Schmidt, R.: Focused infiltration of snowmelt water in partially frozen soil under small depressions, J. Hydrol., 270, 214–229. https://doi.org/10.1016/s0022-1694(02)00287-1, 2003.
Hayashi, M., van der Kamp, G., and Rosenberry, D. O.: Hydrology of prairie wetlands: Understanding the integrated surface-water and groundwater processes, Wetlands, 36, S237–S254. https://doi.org/10.1007/s13157-016-0797-9, 2016.
He, Z., Shook, K., Spence, C., Pomeroy, J. W., Whitfield, C. J., and olfe, J. D.: Virtual Watershed Model Simulations for Typified Prairie Watersheds in Pothole Till, Federated Data Research Depository [data set], https://doi.org/10.20383/103.0650, 2022.
Hu, S., Niu, Z., Chen, Y., Li, L., and Zhang, H.: Global wetlands: Potential distribution, wetland loss, and status, Sci. Total Environ., 586, 319–327, 2017.
Hubbard, D. E. and Linder, R. L.: Spring runoff retention in Prairie Pothole wetlands, J. Soil Water Conserv., 41, 122–125, 1986.
Johnson, W. C., Millett, B. V., Gilmanov, T., Voldseth, R. A., Guntenspergen, G. R., and Naugle, D. E.: Vulnerability of northern prairie wetlands to climate change, Bioscience, 55, 863–872, 2005.
Labaugh, J. W., Winter, T. C., and Rosenberry, D. O.: Hydrologic functions of prairie wetlands, Great Plains Research, 8, 17–37, 1998.
Lehner, B. and Grill, G.: Global river hydrography and network routing: baseline data and new approaches to study the world’s large river systems, Hydrol. Process., 27, 2171–2186, 2013.
Leibowitz, S. G. and Vining, K. C.: Temporal connectivity in a prairie pothole complex, Wetlands, 23, 13–25, 2003.
Leibowitz, S. G., Mushet, D. M., and Newton, W. E.: Intermittent surface water connectivity: Fill and spill vs fill and merge dynamics, Wetlands, 36, 323–342, https://doi.org/10.1007/s13157-016-0830-z, 2016.
Li, X., Bellerby, R., Craft, C., and Widney, S. E.: Coastal wetland loss, consequences, and challenges for restoration, Anthropocene Coasts, 1, 1–15, 2018.
Liu, G. and Schwartz, F. W.: An integrated observational and model-based analysis of the hydrologic response of prairie pothole systems to variability in climate, Water Resour. Res., 47, W02504, https://doi.org/10.1029/2010WR009084, 2011.
Lloyd-Smith, P., Boxall, P., and Belcher, K.: From rhetoric to measurement: The economics of wetland conservation in the Canadian Prairies, Smart Prosperity Institute Clean Economy Working Paper Series, WP 20-05, Smart Prosperity Institute, Ottawa, 37 pp., 2020.
Male, D. H. and Gray, D. M.: Snowcover ablation and runoff, in: Handbook of Snow: Principles, Processes, Management and Use, edited by: Gray, D. M. and Male, D. H., Pergamon Press, Toronto, 360–436, ISBN 10 0080253741, 1981.
McCauley, L. A., Anteau, M. J., Post van der Burg, M., and Wiltermuth, M. T.: Land use and wetland drainage affect water levels and dynamics of remaining wetlands, Ecosphere 6, 1–22, 2015.
McKenna, O. P., Kucia, S. R., Mushet, D. M., Anteau, M. J., and Wiltermuth, M. T.: Synergistic interaction of climate and land-use drivers alter the function of North American, Prairie-Pothole wetlands, Sustainability, 11, 6581, https://doi.org/10.3390/su11236581, 2019.
McNamara, J. P., Kane, D. L., and Hinzman, L. D.: An analysis of streamflow hydrology in the Kuparuk River Basin Arctic Alaska: a nested watershed approach, J. Hydrol., 206, 39–57, 1998.
Mekis, É. and Vincent, L. A.: An overview of the second generation adjusted daily precipitation dataset for trend analysis in Canada, Atmosphere-Ocean, 49, 163–177, 2011.
Millar, J. B.: Shoreline-area ratio as a factor in rate of water loss from small sloughs, J. Hydrol., 14, 259–284, 1971.
Miller, B. A., Crumpton, W. G., and van der Valk, A. G.: Spatial distribution of historical wetland classes on the Des Moines Lobe, Iowa, Wetlands, 29, 1146–1152, 2009.
Miller, M. W. and Nudds, T. D.: Prairie landscape change and flooding in the Mississippi River Valley, Conserv. Biol., 10, 847–853, 1996.
Muggeo, V. M. R.: Estimating regression models with unknown break-points, Stat. Med., 22, 3055–3071, 2003.
Niemuth, N. D., Wangler, B., and Reynolds, R. E.: Spatial and temporal variation in wet area of wetlands in the Prairie Pothole Region of North Dakota and South Dakota, Wetlands, 30, 1053–1064, 2010.
Pekel, J.-F., Cottam, A., Gorelick, N., and Belward, A. S.: High-resolution mapping of global surface water and its long-term changes, Nature, 540, 418–422, https://doi.org/10.1038/nature20584, 2016.
Phillips, R. W., Spence, C., and Pomeroy, J. W.: Connectivity and runoff dynamics in heterogeneous basins, Hydrol. Process., 25, 3061–3075, 2011.
Poiani, K. A. and Johnson, W. C.: A spatial simulation model of hydrology and vegetation dynamics in semi-permanent prairie wetlands, Ecol. Appl., 3, 279–293, 1993.
Pomeroy, J. W. and Li, L.: Prairie and arctic areal snow cover mass balance using a blowing snow model, J. Geophys. Res.-Atmos., 105, 26619–26634, 2000.
Pomeroy, J. W., Granger, R. J., Pietroniro, A., Toth, B., Hedstrom, N. R., and Woxholtt, S.: Classification of the boreal forest for hydrological processes, in: Proceedings of 9th International Boreal Forest Research Association Conference, Oslo, Norway, 21–23 September 1998, 49–59, 1999.
Pomeroy, J. W., Gray, D. M., Brown T., Hedstrom, N. H., Quinton, W. L., Granger, R. J., and Carey, S. K.: The cold regions hydrological model: a platform for basing process representation and model structure on physical evidence, Hydrol. Process., 21, 2650–2667, 2007.
Pomeroy, J. W., Fang, X., Westbrook, C., Minke, A., Guo, X., and Brown, T.: Prairie Hydrological Model Study Final Report, Centre for Hydrology Report No. 7, University of Saskatchewan, Saskatoon, 113 pp., 2010.
Pomeroy, J. W., Fang, X., Shook, K., Westbrook, C., and Brown, T.: Informing the Vermilion River Watershed Plan through Application of the Cold Regions Hydrological Model Platform, 2012, Centre for Hydrology Report #12, Centre for Hydrology, University of Saskatchewan, Saskatoon, Canada, Saskatoon, 2012.
Pomeroy, J. W., Shook, K., Fang, X., Dumanski, S., Westbrook, C., and Brown, T.: Improving and testing the prairie hydrological model at Smith Creek Research Basin, Centre for Hydrology Report #14, Centre for Hydrology, University of Saskatchewan, Saskatoon, Canada, Saskatoon, 2014.
Rannie, W. F.: The Red River flood control system and recent flood events, Water Resour. Bull., 16, 207–214, 1980.
Rosenberry, D. O. and Winter, T. C.: Dynamics of water table fluctuations in an upland between two prairie pothole wetlands in North Dakota, J. Hydrol., 191, 266–289, 1997.
Shaw, D. A., Vanderkamp, G., Conly, F. M., Pietroniro, A., and Martz, L.: The fill–spill hydrology of prairie wetland complexes during drought and deluge, Hydrol. Process., 26, 3147–3156, 2012.
Shook, K., Pomeroy, J. W., Spence, C., and Boychuk, L.: Storage dynamics simulations in prairie wetland hydrology models: evaluation and parameterization, Hydrol. Process., 27, 1875–1889, https://doi.org/10.1002/hyp.9867, 2013.
Shook, K., Papalexiou, S., and Pomeroy, J. W.: Quantifying the effects of Prairie depressional storage complexes on drainage basin connectivity, J. Hydrol., 593, 125846, https://doi.org/10.1016/j.jhydrol.2020.125846, 2021.
Simonovic, S. P. and Juliano, K. M.: The role of wetlands during low frequency flooding events in the Red River Basin, Can. Water Resour. J., 26, 377–397, 2001.
Spence, C.: On the relation between dynamic storage and runoff: A discussion on thresholds, efficiency, and function, Water Res. Res., 43, W12416, https://doi.org/10.1029/2006WR005645, 2007.
Spence, C. and Mengistu, S. G.: On the relationship between floods and contributing area, Hydrol. Process., 33, 1980–1992, 2019.
Spence, C., He, Z., Shook, K. R., Mekonnen, B. A., Pomeroy, J. W., Whitfield, C. J., and Wolfe, J. D.: Assessing hydrological sensitivity of grassland basins in the Canadian Prairies to climate using a basin classification-based virtual modelling approach, Hydrol. Earth Syst. Sci., 26, 1801–1819, https://doi.org/10.5194/hess-26-1801-2022, 2022.
Statistics Canada: Table 32-10-0162-01, Selected land management practices and tillage practices used to prepare land for seeding, historical data, Census of Agriculture, Statistics Canada, Government of Canada, https://www150.statcan.gc.ca/t1/tbl1/en/cv.action?pid=3210016201 (last access: 5 July 2022), 2016.
Stichling, W. and Blackwell, S. R.: Drainage area as a hydrologic factor on the Canadian prairies, IUGG Proceedings, Toronto, Ontario, September 1957, 365–376, 1958.
Su, M., Stolte, W. J., and van der Kamp, G.: Modelling Canadian prairie wetland hydrology using a semi-distributed streamflow model, Hydrol. Process., 14, 2405–2422, 2000.
Tiner, R. W.: Geographically isolated wetlands of the United States, Wetlands, 23, 494–516, 2003.
van der Kamp, G. and Hayashi, M.: The groundwater recharge function of small wetlands in the semi-arid northern prairies, Great Plains Research, 8, 39–56, 1998.
van der Kamp, G. and Hayashi, M.: Groundwater wetland ecosystem interaction in the semiarid glaciated plains of North America, Hydrogeol. J., 17, 203–214, 2009.
van Meter, K. J. and Basu, N. B.: Signatures of human impact: size distributions and spatial organization of wetlands in the Prairie Pothole landscape, Ecol. Appl., 25, 451–465, 2015.
Vickruck, J., Purvis, E. E., Kwafo, R., Kerstiens, H., and Galpern, P.: Diversifying Landscapes for Wild Bees: Strategies for North American Prairie Agroecosystems, Current Landscape Ecology Reports, 6, 1–12, 2021.
Vincent, L. A., Wang, X. L., Milewska, E. J., Wan, H., Yang, F., and Swail, V.: A second generation of homogenized Canadian monthly surface air temperature for climate trend analysis, J. Geophys. Res., 117, D181, https://doi.org/10.1029/2012JD017859, 2012.
Whitfield, P. H., Shook, K. R., and Pomeroy, J. W.: Spatial patterns of temporal changes in Canadian Prairie streamflow using an alternative trend assessment approach, J. Hydrol., 582, 124541, https://doi.org/10.1016/j.jhydrol.2020.124541, 2020.
Wilkinson, G. N. and Rogers, C. E.: Symbolic descriptions of factorial models for analysis of variance, Appl. Stat., 22, 392–399, https://doi.org/10.2307/2346786, 1973.
Wilson, H. F., Casson, N. J., Glenn, A. J., Badiou, P., and Boychuk, L.: Landscape controls on nutrient export during snowmelt and an extreme rainfall runoff event in northern agricultural watersheds, J. Environ. Qual., 48, 841–849, 2019.
Winter, T. C.and Rosenberry, D. O.: The interaction of groundwater with prairie pothole wetlands in the Cottonwood Lake area, east-central North Dakota, 1997–1990, Wetlands, 15, 193–211, 1995.
Winter, T. C. and Rosenberry, D. O.: Hydrology of prairie pothole wetlands during drought and deluge: A 17-year study of the Cottonwood Lake wetlands complex in North Dakota in the perspective of longer term measured and proxy hydrological records, Climatic Change, 40, 189–209, 1998.
Wolfe, J. D., Shook, K. R., Spence, C., and Whitfield, C. J.: A watershed classification approach that looks beyond hydrology: application to a semi-arid, agricultural region in Canada, Hydrol. Earth Syst. Sci., 23, 3945–3967, https://doi.org/10.5194/hess-23-3945-2019, 2019.
Woo, M. K. and Rowsell, R. D.: Hydrology of a prairie slough, J. Hydrol., 146, 175–207, 1993.
Zhang, Z., Stadnyk, T. A., and Burn, D. H.: Identification of a preferred statistical distribution for at-site flood frequency analysis in Canada, Can. Water Resour. J., 45, 43–58, https://doi.org/10.1080/07011784.2019.1691942, 2020.