the Creative Commons Attribution 4.0 License.
the Creative Commons Attribution 4.0 License.
 | 07 Oct 2022
Subsurface flow paths in a chronosequence of calcareous soils: impact of soil age and rainfall intensities on preferential flow occurrence
Anne Hartmann
Markus Weiler
Konrad Greinwald
Theresa Blume
Soil hydrologic processes play an important role in the hydro-pedo-geomorphological feedback cycle of landscape evolution. Soil properties and subsurface flow paths both change over time, but due to a lack of observations, subsurface water flow paths are often not properly represented in soil and landscape evolution models. We investigated the evolution of subsurface flow paths across a soil chronosequence in the calcareous glacier forefield at the Griessfirn glacier in the Swiss Alps. Young soils developed from calcareous parent material usually have a high pH value, which likely affects vegetation development and pedogenesis and thus the evolution of subsurface flow paths. We chose four glacial moraines of different ages (110, 160, 4 900, and 13 500 years) and conducted sprinkling experiments with the dye tracer Brilliant Blue on three plots at each moraine. Each plot was divided into three equal subplots, and dyed water was applied with three different irrigation intensities (20, 40, and 60 mm h−1) and an irrigation amount of 40 mm. Subsequent excavation of soil profiles enabled the tracing of subsurface flow paths. A change in flow types with increasing moraine age was observed from a rather homogeneous matrix flow at 110 and 160 years to heterogeneous matrix and finger-shaped flow at 4 900 and 13 500 years. However, the proportion of preferential flow paths is not necessarily directly related to the moraine age but rather to soil properties such as texture, soil layering, organic matter content, and vegetation characteristics such as root length density and biomass. Irrigation intensity had an effect on the number of finger-shaped flow paths at the two old moraines. We also found that flow paths in this calcareous material evolved differently compared to a previous study in siliceous material, which emphasizes the importance of parent material for flow path evolution. Our study provides a rare systematic dataset and observations on the evolution of vertical subsurface flow paths in calcareous soils, which is useful to improve their representation in the context of landscape evolution modeling.
- Article
(9670 KB) - Full-text XML
- BibTeX
- EndNote


Pedogenesis and its interaction with hydrological, geomorphological, and ecological processes plays an important and complex role in landscape evolution. Understanding the complex interaction between soil and water during landscape evolution is crucial for the understanding of natural history but also for the application of modern landscape management practices such as landscape restoration. The parent material as the starting point for soil development has a strong impact on the resulting soil characteristics (Retzer, 1949). The mineral composition of the parent material determines the mineral composition of the soil and nutrients released during weathering, which can either be processed by flora and fauna or leached from the soil. The parent material influences weathering rates as well as the chemical and physical properties of the soil and thus soil formation (Sauer et al., 2015) and also vegetation composition (Michalet et al., 2002).
The role of water in pedogenesis is particularly multi-facetted (Lin, 2003) and often governed by feedback cycles: hydrology has a strong influence on the evolution of soil structure and texture, which in turn has an influence on soil hydrology. The hydraulic conditions influence geochemical and biological (weathering) processes (White and Blum, 1995). Soil water also serves as a transport medium and therefore influences the relocation of substances and particles within the soil matrix. Finally, soil water availability, which is also governed by the soil hydraulic conditions, influences vegetation composition and coverage.
Preferential flow (which is known to be ubiquitous) further complicates the investigation of these interactions, as it introduces additional spatial variability and leads to locally increased water availability, flow velocities, and deeper water transport – all of which will increase rates of weathering and transport in these locations. Preferential flow is, however, not only controlled by soil properties (Koestel and Jorda, 2014) but also by rainfall characteristics such as amount (Bachmair et al., 2009) and intensity (Wiekenkamp et al., 2016). Extreme rainfall events can exert a particularly strong influence on water partitioning and thus affect pedogenic (e.g., weathering, solute transport) and geomorphic (e.g., water erosion) processes (van der Meij et al., 2018).
Despite the importance of the hydrological processes in this context, their consideration within soil–landscape evolution models (SLEMs) is still insufficient (Samouëlian et al., 2012). Landscape evolution modeling is an important tool to better understand landscape formation but also to assess how landscapes are affected by global climate change (Montagne and Cornu, 2010) or anthropogenic interventions (Cui et al., 2021) such as land use change and hydrologic alterations (Newman et al., 2017). In particular, the evolution of vertical and horizontal subsurface flow paths – including the occurrence of preferential flow paths – are currently omitted in SLEMs (van der Meij et al., 2018), which can lead to incorrectly modeled transport and relocation processes (Sauer et al., 2012). One of the reasons for this neglect is the lack of knowledge of how soil hydraulic systems evolve over time. For a proper consideration of hydrologic processes in SLEMs, more field data on the evolution of soil hydraulic parameters and hydraulic function are needed (van der Meij et al., 2018).
While many studies have investigated soil development (e.g., Egli et al., 2010; He and Tang, 2008; Dümig et al., 2011; Vilmundardóttir et al., 2014; D'Amico et al., 2014), only a limited number of studies have investigated the evolution of soil hydraulic properties and subsurface flow paths. In previous field studies on the development of soil hydraulic properties, the main focus was on the saturated conductivity (Ksat), which was found to decrease with age, and changes were mainly related to changes in soil properties such as texture and bulk density (Brooks and Richards, 1993; Beerten et al., 2012; Maier et al., 2020). Beerten et al. (2012) found that hydraulic parameters describing the retention curves were harder to interpret and were affected by the organic carbon content. Lohse and Dietrich (2005) estimated points on the retention curves and hydraulic conductivity functions for a soil chronosequence from 300 to 4.1 million years of age developed from volcanic deposits. A shift to higher water retention and horizontal subsurface flow was observed alongside the development from a rather homogeneous to a layered system with increasing clay content. A similar change in hydrological pathways was found in volcanic catchments (ranging in age from 0.225 to 82.2 Ma), where pathways changed from deep percolation to shallow subsurface flow (Yoshida and Troch, 2016). These studies examined the development of flow paths on a rather large spatial and temporal scale and thus did not investigate vertical preferential flow paths. A detailed investigation of vertical subsurface hydrological flow paths in co-evolution with soil (hydraulic) properties was so far only carried out for a chronosequence of 10 000 years on siliceous glacial till (Hartmann et al., 2020a), where an increase in preferential flow with increasing moraine age was found.
Previous studies showed conflicting results regarding the influence of rainfall intensity on preferential flow path occurrence. An increase in preferential flow with increasing rainfall intensity at the catchment scale was observed by evaluating the sequence of water content responses at different depths (Lin and Zhou, 2008; Wiekenkamp et al., 2016; Demand et al., 2019). Bromide tracer experiments in lysimeters with stony soils by Cichota et al. (2016) showed an increase in preferential flow with increasing irrigation intensity under soil moisture conditions near field capacity (comparing rainfall events of 5 and 20 mm h−1). Wu et al. (2015) found, based on Brilliant Blue dye tracer experiments, a decrease in preferential flow at higher intensities (comparing rainfall events of 50, 100, and 150 mm h−1), when the initial soil water content was high. However, as the relationship between flow paths and rainfall intensity can be influenced by various factors, cross-study comparisons are difficult and probably unlikely to identify the underlying controls. It is therefore crucial to investigate this relationship systematically and under controlled conditions.
Our study, carried out in the Swiss Alps, focuses on two main research gaps: (i) the evolution of vertical subsurface flow paths during soil formation in calcareous soils, and (ii) the impact of rainfall intensities on preferential flow occurrence as soils and hillslopes evolve over time. Calcareous soils are of special interest here, as they make up a third of the Earth's land surface area (Taalab et al., 2019). The high pH value of young calcareous soils determines plant nutrient availability (low P availability, high N loss; Hopkins and Ellsworth, 2005; Taalab et al., 2019) and thus vegetation development (Michalet et al., 2002). Also, weathering rates and pedogenesis in calcareous soils differ strongly from other parent materials (Musso et al., 2022; Ehrlich et al., 1955). To investigate the temporal evolution of subsurface flow paths over the millennia, irrigation experiments were conducted on a set of four pro-glacial moraines, with each moraine representing a different age class (chronosequence approach). We used Brilliant Blue dye to trace the occurrence of vertical subsurface flow paths across 13 500 years of landscape evolution recorded in our chronosequence and investigated a possible connection between the proportion of preferential flow paths to properties of the vegetation cover (e.g., coverage, root length density, biomass).
The chronosequence approach assumes that, for a sequence of sites (in this case, moraines) with similar characteristics such as topography, climate, and parent material on which the soil was formed, time can be treated as the only variable. It is well known that the application of this chronosequence concept has some limitations, as landscape development is much more complex (Wojcik et al., 2021). The assumption that time is the only factor affecting soil development in a spatial sequence of soils is often the only option for the historical tracking of landscape development at a particular location and thus still a fundamental tool for representing temporal changes in the Earth's surface system (Phillips, 2015).
With our study we generated a rare systematic dataset and observations on the evolution of preferential flow paths in the context of landscape evolution, which will help to ensure proper handling of (subsurface) hydrologic processes and their role within the feedback cycle of the hydro-pedo-geomorphological system when it comes to soil and landscape evolution modeling.
2.1 Study site
The study area at the Griessfirn glacier forefield is located above the treeline between 2030–2200 m a.s.l. in the Central Swiss Alps (46∘85′ N, 8∘82′ E). The geology is dominated by schists, marl, and quartzites (Musso et al., 2019) but also includes limestone (Frey, 1965). The closest official weather station at a similar elevation (2106 m a.s.l.) is located at a distance of 48 km at Mount Pilatus (46∘98′ N, 8∘25′ E). The recorded annual mean temperature is 1.8 ∘C, and the annual precipitation is 1 752 mm (1981–2010) (MeteoSwiss, 2020).
A chronosequence of four moraines was selected to investigate the effect of hillslope age on subsurface flow paths. The four selected moraines were dated by Musso et al. (2019) based on historical maps and additional radiocarbon dating. The youngest moraine is located at 2 200 m a.s.l. and was dated to an age of 110 years (110 a, a = years). The three other moraines are 160 (160 a), 4 900 (4.9 ka, k=1000), and 13 500 (13.5 ka) years old and are located at an elevation of 2 030 m a.s.l. (see Fig. 1). The choice of the 110 a moraine as the youngest moraine is the result of the local conditions, as no adequate moraine younger than that could be identified that also ensured comparability in terms of elevation and microclimate (Musso et al., 2019). We therefore had to compromise and selected the moraine with an age of 110 years as our youngest moraine. At each moraine, the vegetation was mapped (Greinwald et al., 2021b), and the soil physical characteristics were identified in 10, 30, and 50 cm depth (Hartmann et al., 2020b).

Figure 1Location of the four selected moraines in the Griessfirn glacier forefield (left, photo by © Google Maps, 2020) and the surface cover of each age class (right).
The vegetation coverage of the two young moraines is sparse, with carpet-forming dwarf shrubs (e.g., Dryas octopetala, Salix retusa) stabilizing the slopes by their dense root stocks and facilitating the establishment of other plant species, such as patches of pioneer plants (e.g., Saxifraga aizoides) and mosses (e.g Tortella densa, Distichium capillaceum) at the 110 a moraine and Anthyllis vulneraria, Saxifraga oppositifolia, or Silene acaulis (pioneer plants) at the 160 a moraine. The soil at the 110 and 160 a moraines was classified as a Hyperskeletic Leptosol (Musso et al., 2019). At the 110 a moraine the soil texture was identified as mainly sandy loam with tendencies to sandy clay loam, whereas the soil type at the 160 a moraine was mainly identified as sandy loam and, in some occasions, as loamy sand. The bulk density and porosity are homogeneous in the upper 50 cm at the 110 a moraine and range between 1.6–1.9 g cm −3 and around ≈0.3, respectively. The 160 a moraine has a slightly lower bulk density (≈1.55 g cm −3) and higher porosity (≈0.4), but both moraines have a similarly low organic matter content (<10 weight-%). The two older moraines (4.9 and 13.5 ka) are densely covered with grass (e.g., Festuca violacea agg.), dwarf shrubs (e.g., Rhododendron hirsutum, Vaccinium myrtillus, Vaccinium vitis-idaea), and sedges (Carex ferruginea, Carex sempervirens). At both moraines, the soil was classified as a Calcaric Skeletic Cambisol (Musso et al., 2019). The soil texture varies over the top 50 cm. Silty clay and silty clay loam are dominant in the upper 10 cm, while loam and silty loam are predominant in 30 cm, and sandy loam in 50 cm. The soil at the 13.5 ka moraine contains a little less clay in the top 50 cm but a little more silt than the soil at the 4.9 ka moraine. The organic matter content in the top 10 cm at both old moraines is with ≈25 weight-% distinctly higher compared to the young moraines and declines with depth. Correspondingly, the porosity is with ≈0.8 distinctly higher and also rapidly declines with depth at both moraines, whereas the bulk density is low (≈0.5 g cm−3) in the top soil and increases with depth but still remains <1.5 g cm−3 in 50 cm.
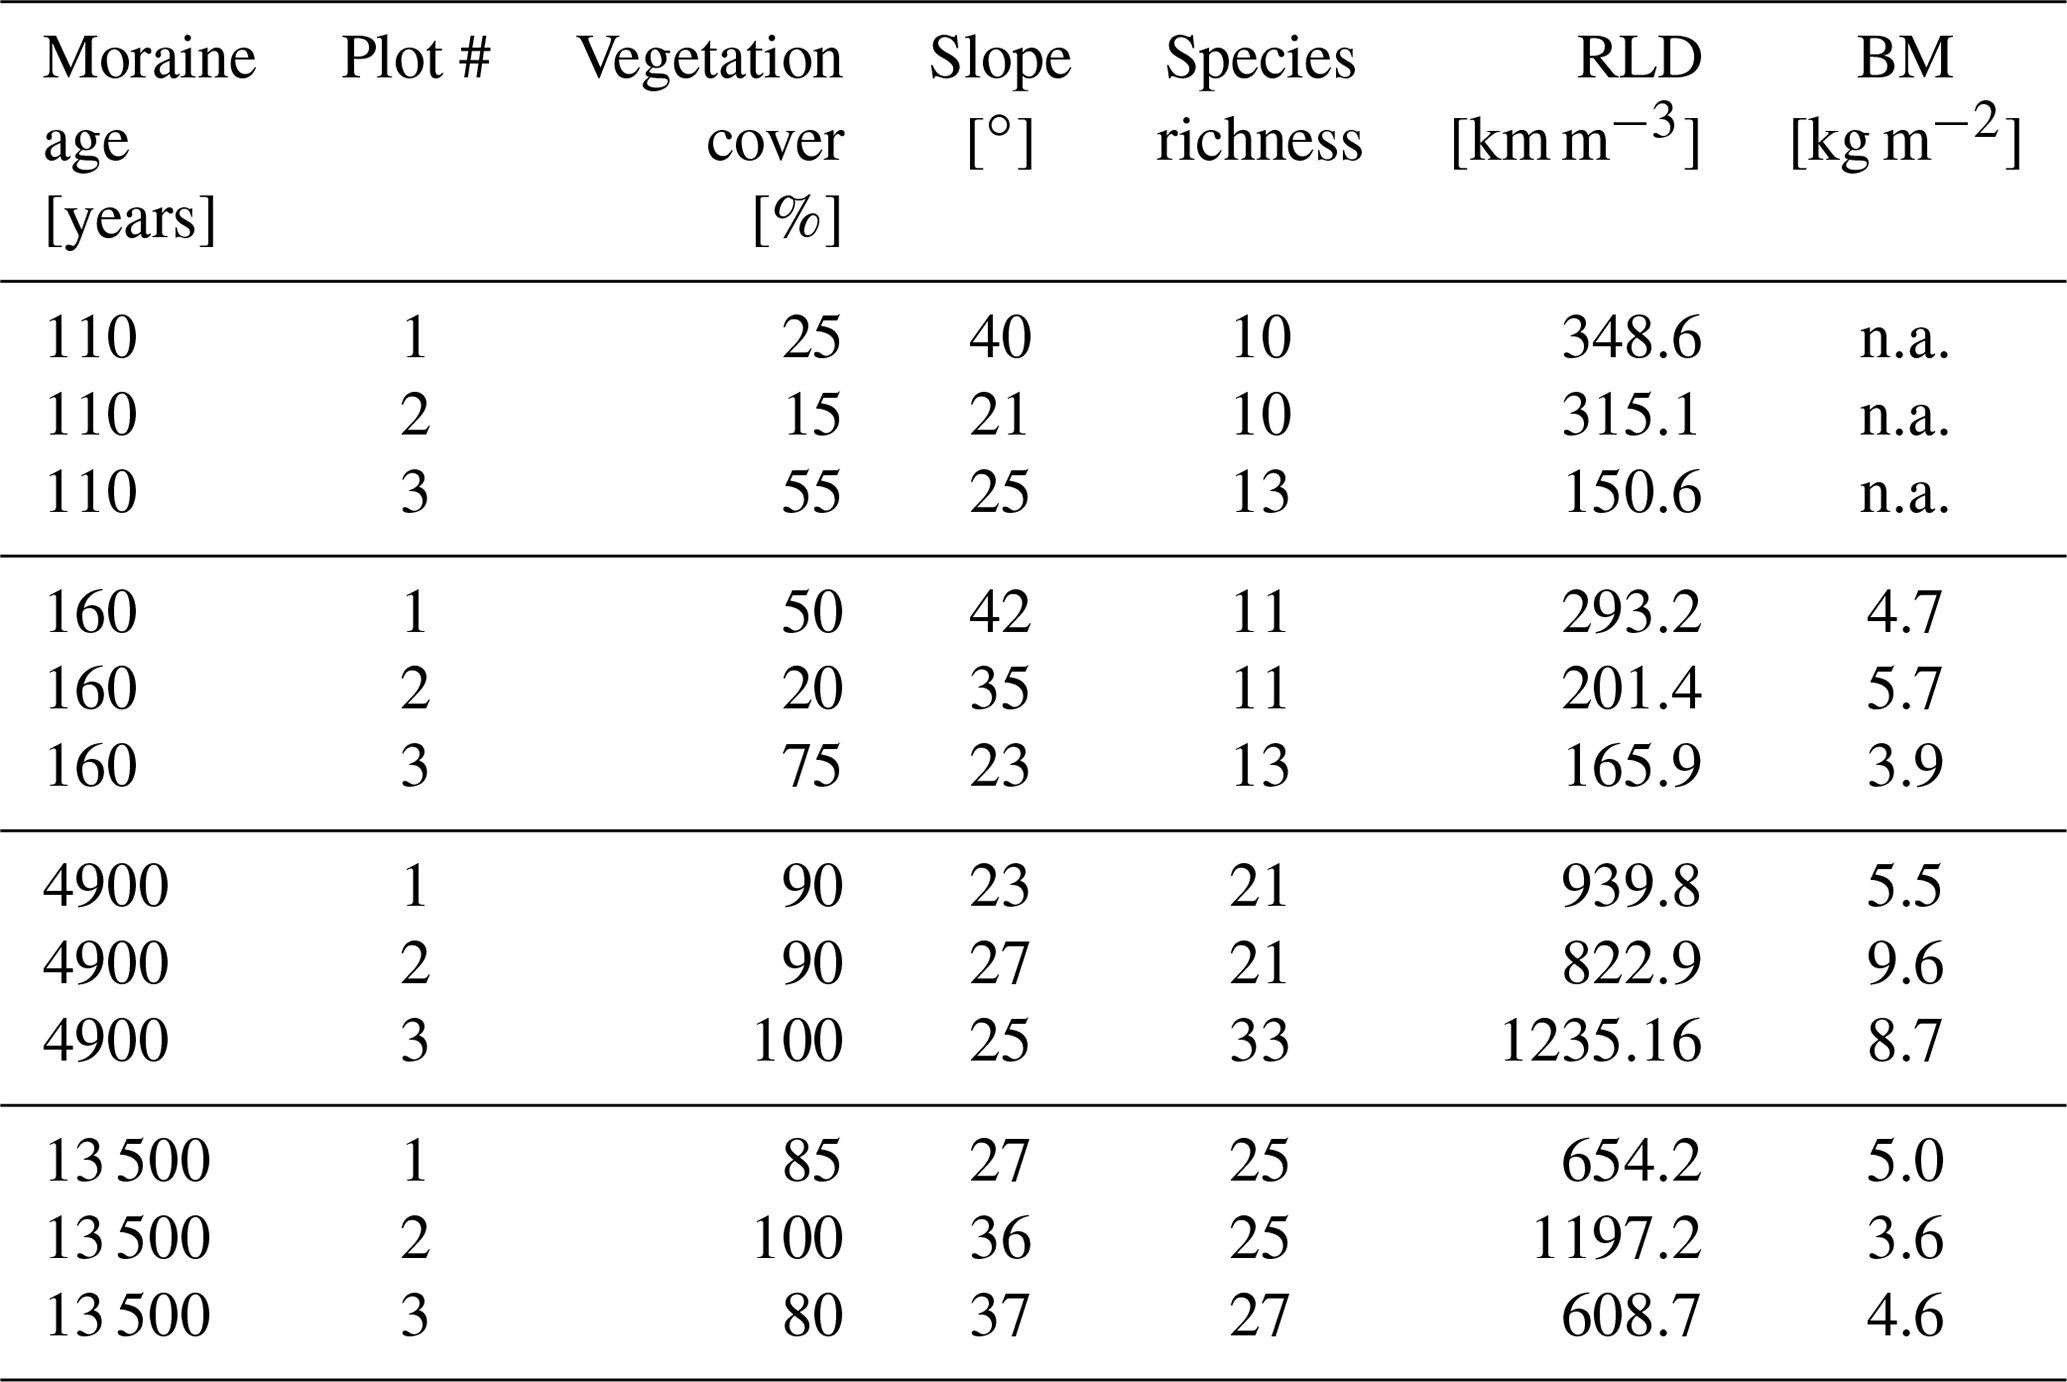
For the Brilliant Blue tracer experiments, three plots (1.0×1.5 m) were selected on each moraine. To capture the spatial heterogeneity of the vegetation cover, the plots at each moraine were chosen along a gradient in vegetation complexity (Greinwald et al., 2021b). At each plot, species richness, root length density (RLD), vegetation cover, above-ground biomass (BM), and the slope were measured or estimated by Greinwald et al. (2021a) (Table 1).
Table 1Main plot characteristics and vegetation parameters at the tracer experiment plots (BM = above ground biomass, RLD = root length density, n.a. = analysis was not carried out).
2.2 Dye tracer irrigation experiments
The dye tracer experiments were conducted between 25 July and 14 September 2019. Each of the three 1.5 m × 1.0 m experimental plots per moraine was further divided into three equal subplots of 0.5 m × 1.0 m for individual irrigation with 40 mm of a 4 g L−1 Brilliant Blue FCF solution (Fig. 2). To reduce interception, large vegetation in the form of shrubs, bushes, and tall grass was cut to a height of a few centimeters before irrigation. The three subplots were irrigated with the same amount (40 mm) but different intensities (20, 40, and 60 mm h−1). The irrigation intensities represent extreme events with return periods of 2.8, 60, and 100 years (Fukutome et al., 2017), respectively.
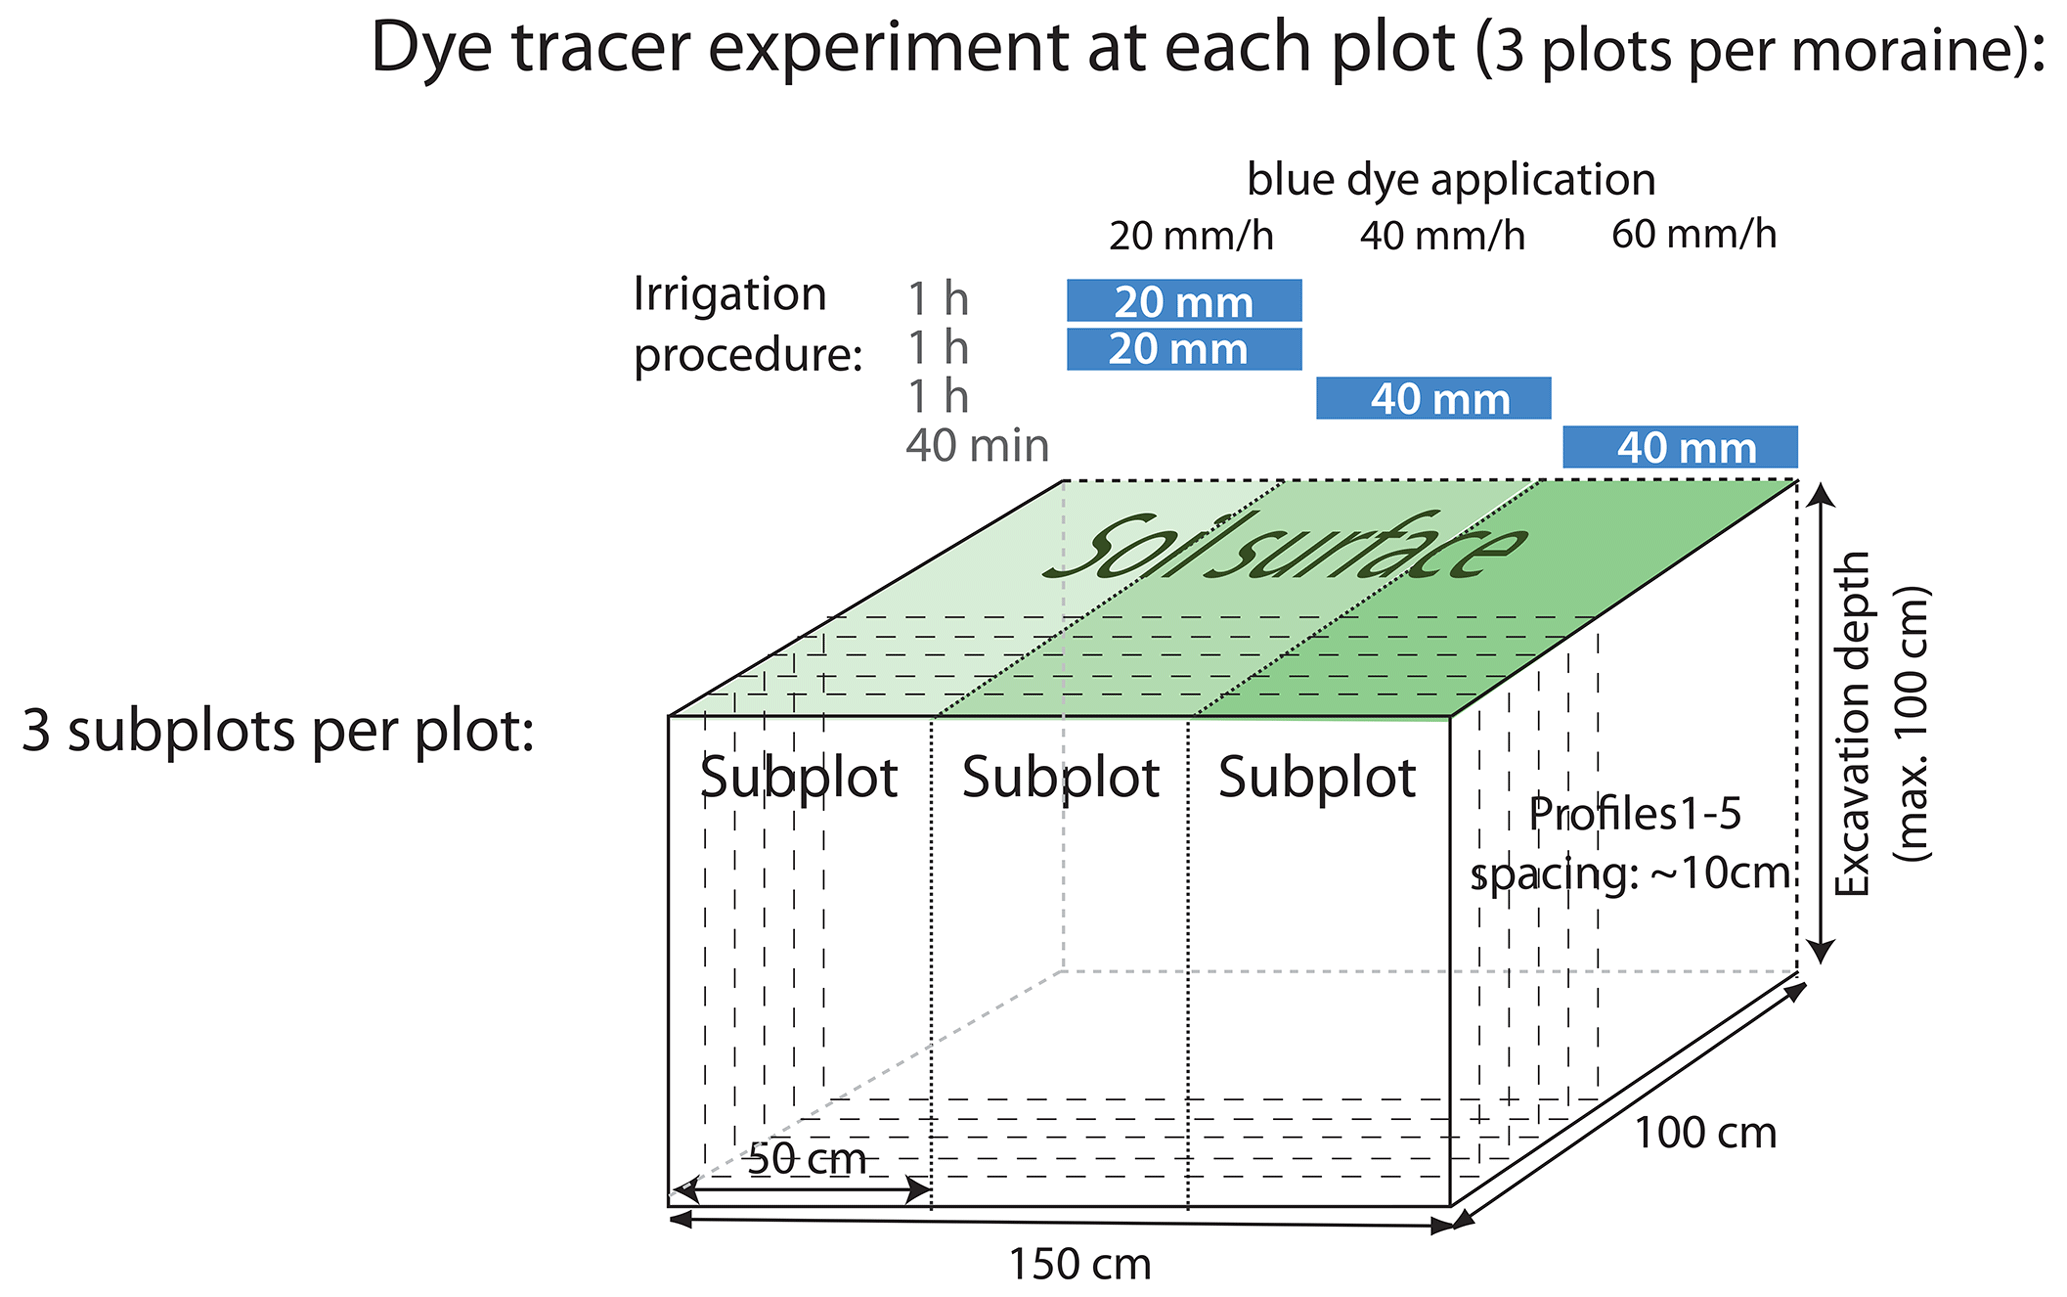
Each subplot was irrigated individually, while the other two were covered by a tarpaulin. A hand-operated sprayer and a battery-powered pump were used for tracer application. Since the irrigation system only provided a flow rate of 1 L min−1, the different irrigation intensities were achieved by alternating intervals of irrigation and breaks. The first subplot was irrigated for 2 h in a sequence of 1 min irrigation and 5 min break to irrigate the subplot with 40 mm at an intensity of 20 mm h−1. The intensity of 40 mm h−1 at the second subplot was achieved by a sequence of 1 min irrigation and 2 min break for 60 min. The last plot was irrigated for 40 min in a sequence of 1 min irrigation and 1 min break to achieve an intensity of 60 mm h−1. An overview of the experimental design and an illustration of the irrigation procedure is provided in Fig. 2. After the experiment, the whole plot was covered with a tarp to protect it from potential natural rainfall until the excavation on the following day.
A first vertical profile was excavated 10–15 cm downslope of the lower edge of the irrigated plot to check for subsurface lateral flow. The plots were then excavated in five vertical profiles in approximately 10 cm segments, starting the first segment 10 cm upslope from the lower edge of the irrigated plot. Pickaxes, spades, and hand shovels were used to excavate the profiles. The profiles were cleaned carefully, and protruding roots were cut off. Rocks and stones were not removed but cleaned from soil. The soil profiles of the subplots were photographed with a Panasonic Lumix DMC-FZ18 camera and a resolution of 2248 pixels × 3264 pixels. To avoid direct sunlight and to provide a uniform light distribution, a large umbrella was used for shading. A Kodak gray-scale and a wooden frame were included in the photographs for a later geometric correction and color adjustment.
2.3 Image analysis and flow type classification
The photographs of the profiles were converted into tricolor images to differentiate between stained and unstained areas as well as rocks by using the image analysis procedure by Weiler and Flühler (2004). To avoid possible interference from interactions around the inner and outer subplot boundaries, a buffer with a width of 6 cm between adjacent subplots and 5 cm to the outer plot boundary was excluded from the analysis. The analysis includes a geometric correction, a background subtraction, and a color adjustment to correct differences in image illumination and changes in the spectral composition of the daylight. A further correction of the tricolor images using the photographs was necessary, since – due to poor lighting conditions or a heterogeneous background color distribution in the soil caused by, for example, material transitions, small stones, or organic matter – the image analysis software was not able to recognize all large dye stains as coherent objects. Thus, the software detected interruptions within blue stains that did not correspond to the field observations and would have been identified as a large number of individual flow paths during the following analysis. The manual correction of the tricolor images using the original photographs eliminated these interruptions (Hartmann et al., 2020a). In the resulting tricolor images, the horizontal and vertical lengths of a pixel correspond to 1 mm.
The volume density (VD) corresponds to the dye coverage and was calculated for each of the five profiles per subplot as the fraction of stained pixels in each pixel row, thus providing depth profiles of volume density. The surface area density (SAD) is an indicator for the number of individual flow paths and was calculated for each pixel row of the five profiles by using the intercept density, which describes the number of interfaces between stained and unstained pixels divided by the horizontal width of the soil profile. The combination of both profile parameters provides the information whether the stained area is the sum of many small fragments or a few large ones.
The dye patterns of each profile per subplot were then classified into flow type categories according to the approach proposed by Weiler and Flühler (2004). This classification is based on the proportions of three selected stained path width (SPW) classes (stained path width <20, 20–200, >200 mm) on the volume density. The stained path width is equal to the horizontal extent of a stained flow path. This classification method distinguishes between five flow types: (1) macropore flow with low interaction, (2) mixed macropore flow (low and high interaction), (3) macropore flow with high interaction, (4) heterogeneous matrix flow or finger flow, and (5) homogeneous matrix flow. The five flow types differ in the spatial extent of the water transport and thus in the proportion of the involved soil matrix, which impacts flow velocities, water availability, and solute transport. From (1) to (5), the preferentiality of the water transport decreases and the homogeneity and spatial water availability increases.
We define macropore flow as water transport via root channels, earthworm burrows, and flow along fissures largely bypassing the matrix. The characteristic dye patterns show narrow but long individual stains, which in some cases can be broader due to interactions with the surrounding soil matrix. The level of lateral interactions between the water transported via macropores and the surrounding soil matrix mainly depends on the soil matrix. In low-permeability or saturated soils, the lateral interactions are usually minimal, and the characteristic dye patterns show narrow but long individual stains. Permeable soils enable extensive lateral interactions between macropore water and the soil matrix. The dye patterns show broader individual stains.
Here, the term ”finger flow” summarizes all flow types that cause finger-shaped flow patterns, which includes finger flow caused by flow instabilities in the wetting front (Nimmo, 2021), finger-shaped flow paths due to water repellency, air entrapment or textural layering (Hendrickx and Flury, 2001), and also funneled flow leading to vertical, elongated, finger-like flow paths. The latter is caused by the redirection and funneling of water by textural boundaries and large rocks (Hendrickx and Flury, 2001) or by the heterogeneity of soil hydraulic properties (Nimmo, 2021). The characteristic flow patterns of all these flow types are very similar and thus cannot be distinguished by the image analysis: they show broader, vertically elongated, coherent flow paths, which indicate a preferential vertical water transport, leaving large parts of the soil matrix dry.
Dye patterns that could not be classified as one of these flow types were categorized as undefined. We used a modified version (Hartmann et al., 2020a) of the Weiler and Flühler (2004) classification, which was more suitable for stony alpine soils. In the case of homogeneous matrix flow, the modified classification prevents a high stone content from leading to the detection of a heterogeneous flow pattern as a result of the coherent stained area being broken up into smaller pieces, which then could be falsely classified as heterogeneous matrix flow, finger-shaped flow, or macropore flow depending on the abundance of rocks. In this case, the flow type is assigned to a new flow type class called (6) “homogeneous matrix flow between rocks”.
The modified classification also avoids a clear differentiation between “macropore flow with high interaction” and “finger-shaped flow”. As the original classification assigns finger-shaped flow paths only when the medium-sized stained path width (20–200 mm) and the biggest stained path width class (>200 mm) account for approximately half of the dye coverage, fingers with smaller widths (not necessarily caused by macropores) were not detected as such and automatically counted as macropore flow with high interaction. Hartmann et al. (2020a) observed that finger-like flow paths with smaller widths were frequently present in alpine soils. Their dye patterns and distributions of stained path width classes are similar to “macropore flow with high interaction”. These classes cannot be distinguished from each other in the image analysis. Thus we renamed this class to (3) “macropore flow with high interaction or finger-shaped flow”.
The classification was done for each pixel row per profile. To quantify the proportion of preferential flow per profile, a preferential flow fraction index (PFF) was calculated as the proportion of all preferential flow type classes at each profile. As the flow type classification was done for each pixel row, the PFF is the number of pixel rows classified as a preferential flow type (flow types 1–4) divided by the total number of pixel rows.
To determine a representative infiltration depth per subplot, we used the median value of the maximum staining depths per subplot. To obtain the distribution of maximum staining depths, we determined for each pixel column of the five profile images per subplot the location of the deepest blue-colored pixel. The median value was chosen to represent the infiltration depth, since this measure is less affected by outliers (e.g., single deep infiltration flow paths) than the mean value.
2.4 Statistical analysis
2.4.1 Statistical differences between profiles
A bootstrapped LOESS (local least-squares-based polynomial smoothing) regression (BLR) approach (Keith et al., 2016) was used to test differences between experiments in the observed VD profiles and SAD profiles with regard to moraine age and irrigation intensity. The BLR approach is a combination of bootstrapped data resampling with local least-squares-based polynomial smoothing (LOESS) regression and was proposed by Keith et al. (2016) for the comparison of any soil property profiles from datasets of two different characteristics. For the pair-wise test, the two datasets containing several profile observations of the soil variable of interest are combined and resampled depth-wise n=1 000 times by bootstrapping with replacement. Each resampled dataset is modeled using LOESS regression. Out of the 1 000 LOESS regressions, the 95 % confidence intervals are calculated and compared with the LOESS regression of the uncombined individual set of profile observations. When the modeled LOESS regression of the original dataset lies outside of the confidence interval, the null hypothesis that there is no difference between the two original datasets is rejected. For the LOESS regression, we used all five profiles per subplot.
2.4.2 Statistical differences between median infiltration depths
To test for significant differences in observed infiltration depths among age classes and among irrigation intensities, the non-parametric Mood's median test was used (Hervé, 2018). The significance level was set to p<0.05. The Mood's median test compares median pairs of two or more groups. A p-value lower than 0.05 indicates that the median of at least one group is significantly different from the other groups. To identify which groups are statistically different, a pairwise Mood's median tests across groups was used as a post hoc test (Mangiafico, 2016). The test was also used to detect significant differences between the dye pattern characteristics among the age classes.
To investigate differences and similarities in the relationship between PFF and site or vegetation characteristics, a linear regression of PFF with site and vegetation characteristics was plotted by using the ggplot2-package (Wickham, 2016). A 95 % confidence interval was chosen for the significance test of the linear relationship. All data analyses were carried out using R (R Core Team, 2017).
3.1 Vertical dye pattern analysis
We consider the median maximum staining depth as the representative infiltration depth of the soil profile. The representative infiltration depths are less than 1 m but vary strongly between the age classes and irrigation intensities (Fig. 3). Across the moraine ages, the representative infiltration depths differ significantly (Fig. 3, top) but do not show an age trend. A significant relationship between irrigation intensity and representative infiltration depth is only found at the 13.5 ka moraine, where the infiltration depth increases with irrigation intensity. Sorted by irrigation intensity, no distinct age trend in the infiltration depths is observed (Fig. 3, bottom).
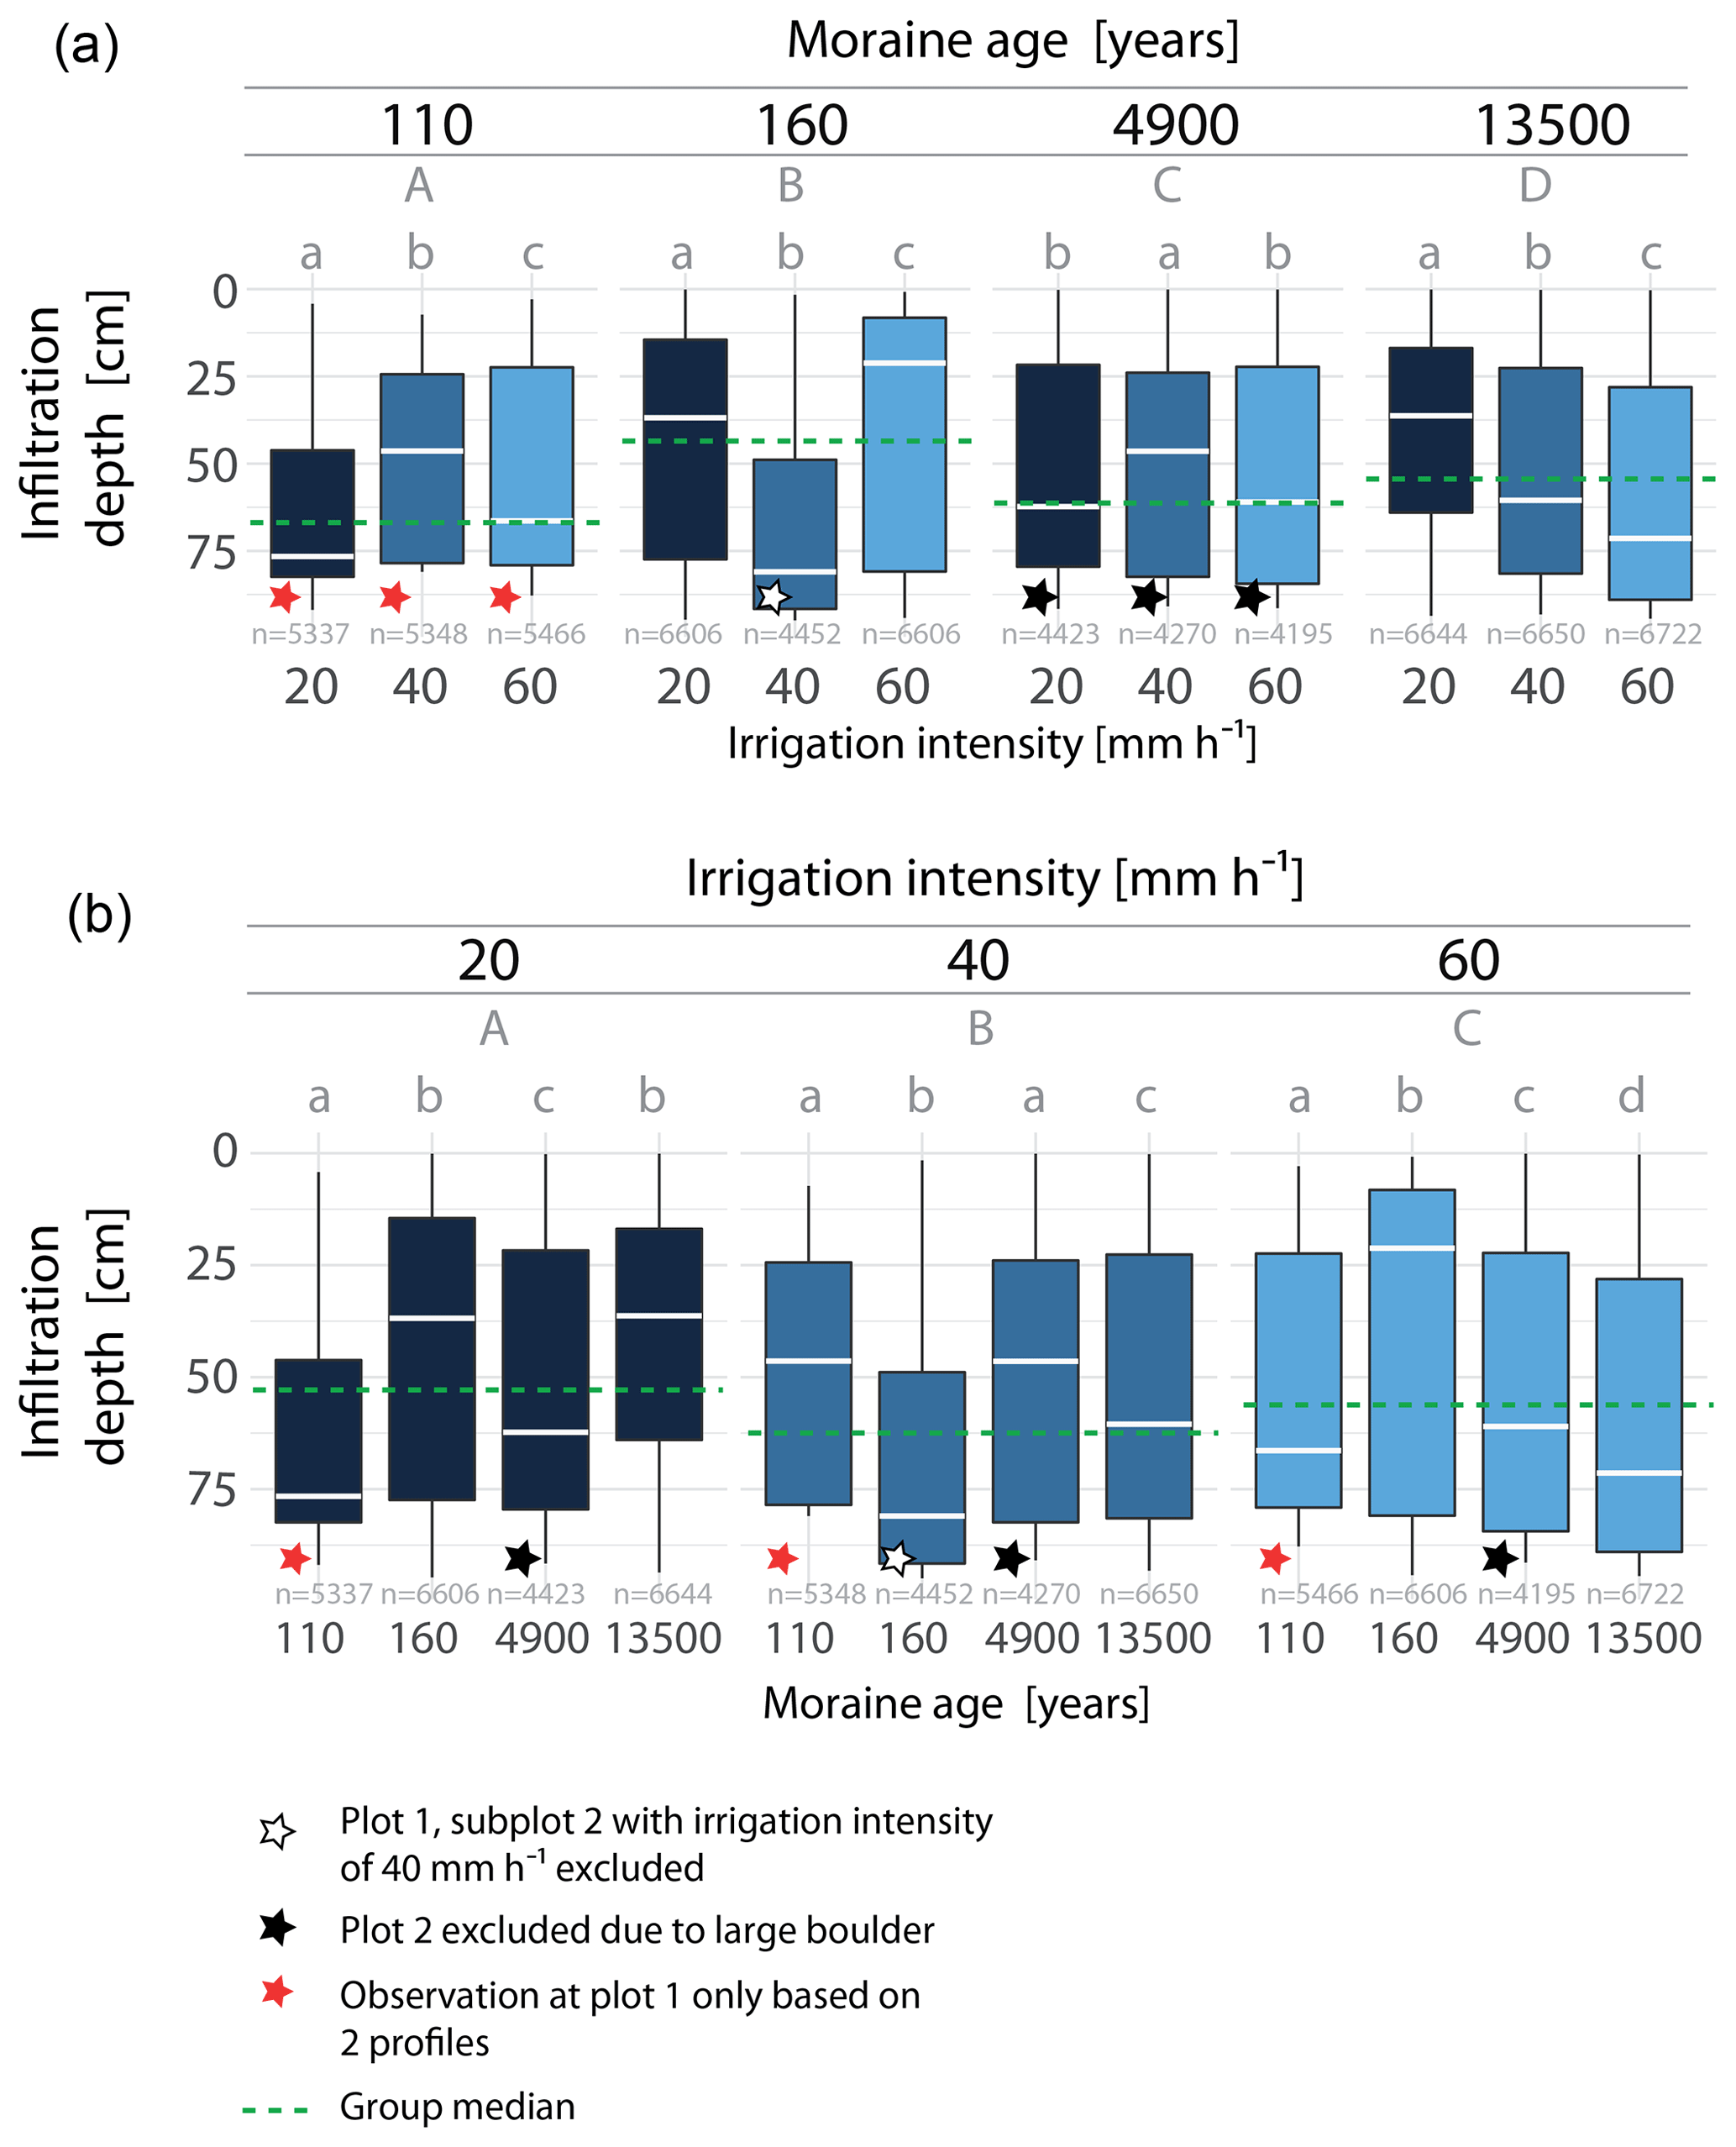
Figure 3Maximum staining depth in each pixel column along the profile width at all excavated profiles at each age class (a) and irrigation intensity (b). Median values indicate the representative infiltration depth. Significant differences in median values are indicated by different letters. Upper case letters indicate the results of the Mood's median test in combination with a post hoc test among the age classes (upper plot) and irrigation intensities (lower plot). The dashed green line shows the group median used for the test. Different lower case letters denote the results among the irrigation intensity in each age class (upper plot) and the results among the age classes at each irrigation intensity (lower plot); n equals the number of pixel columns evaluated in each box plot.
The averaged volume density (VD) profiles (over the 5 profiles per subplot) of the three stained path width (SPW) classes per subplot are displayed in Fig. 4. The sum of the VD profiles of the three SPW classes per subplot is equal to the VD profile of all stained areas (which is also equal to the dye coverage). At the two young moraines (110 and 160 a) we observed clearer differences in the VD profiles between the experimental plots of the single age groups compared to between the irrigation intensities (Fig. 4). At both young moraines, the VD of SPW > 200 mm is high over the entire profile depth at the plots labeled plot 3. These are also the two plots with a distinctly higher vegetation cover (Table 1) at these otherwise sparsely vegetated young moraines. At the two other plots of the 110 and 160 a moraines, the fractions of SPW > 200 mm are high in the upper 10–20 cm but distinctly decline with depth. At the 4.9 and 13.5 ka moraines, the fraction of SPW > 200 mm is lower in the upper 10–20 mm compared to the young moraines. Over the entire profile range, path widths of the category 20 < SPW < 200 mm most often have the largest share of the dye coverage. The proportion of SPW < 20 mm is negligible at all age classes.

Figure 4Mean volume density profiles per age class and irrigation intensity. The volume density is the fraction of stained pixels, color coded here by flow path width (stained path width, SPW) and rocks. Maximum infiltration depth was >1 m in 31 of the 36 experiments. Arrows indicate the maximum infiltration depth < 1 m at the remaining 5 plots.
Most of the cross-section of plot 2 at the 4.9 ka moraine and the subplot irrigated with 40 mm h−1 of plot 1 at the 160 a moraine was occupied by a large boulder in the ground (see Fig. A1). Please note that, due to the strong inhibition of the water transport, these subplots were excluded from further analysis. Further, it must be taken into account that the results of plot 1 at the 110 a moraine are based on only two observations (= two profiles per subplot), as the excavation had to be interrupted due to an unforeseen change in weather conditions. Despite protection, the rest of the experimental plot collapsed due to a thunderstorm.
The depth integrals of the dye pattern characteristics were compared across all experiments using boxplots, where each box plot contained the information of 3 experiments à 5 soil profiles (Fig. 5). The dye coverage (= integral of the VD profile) corresponds to the area percentage of all blue-colored areas per profile (Fig. 5a). The proportions of the three SPW classes (Fig. 5b–d) are also given as the area percentage per profile. The dye coverage varies strongly (between the experimental plots) at the 110 and 160 a moraines, with the majority ranging between 10 % and 60 % (Fig. 5a). The variation decreases with moraine age, and the dye coverage at the oldest moraines mostly ranges between 20 % and 50 %. The proportion of SPW < 20 mm increases slightly with age (Fig. 5b) but remains negligible, with an average area proportion of less than 2 % on the total profile area. An increase with age can be seen in the area proportion of 20 < SPW < 200 mm (Fig. 5c), with a corresponding decrease in the area proportion of the SPW > 200 mm (Fig. 5d).
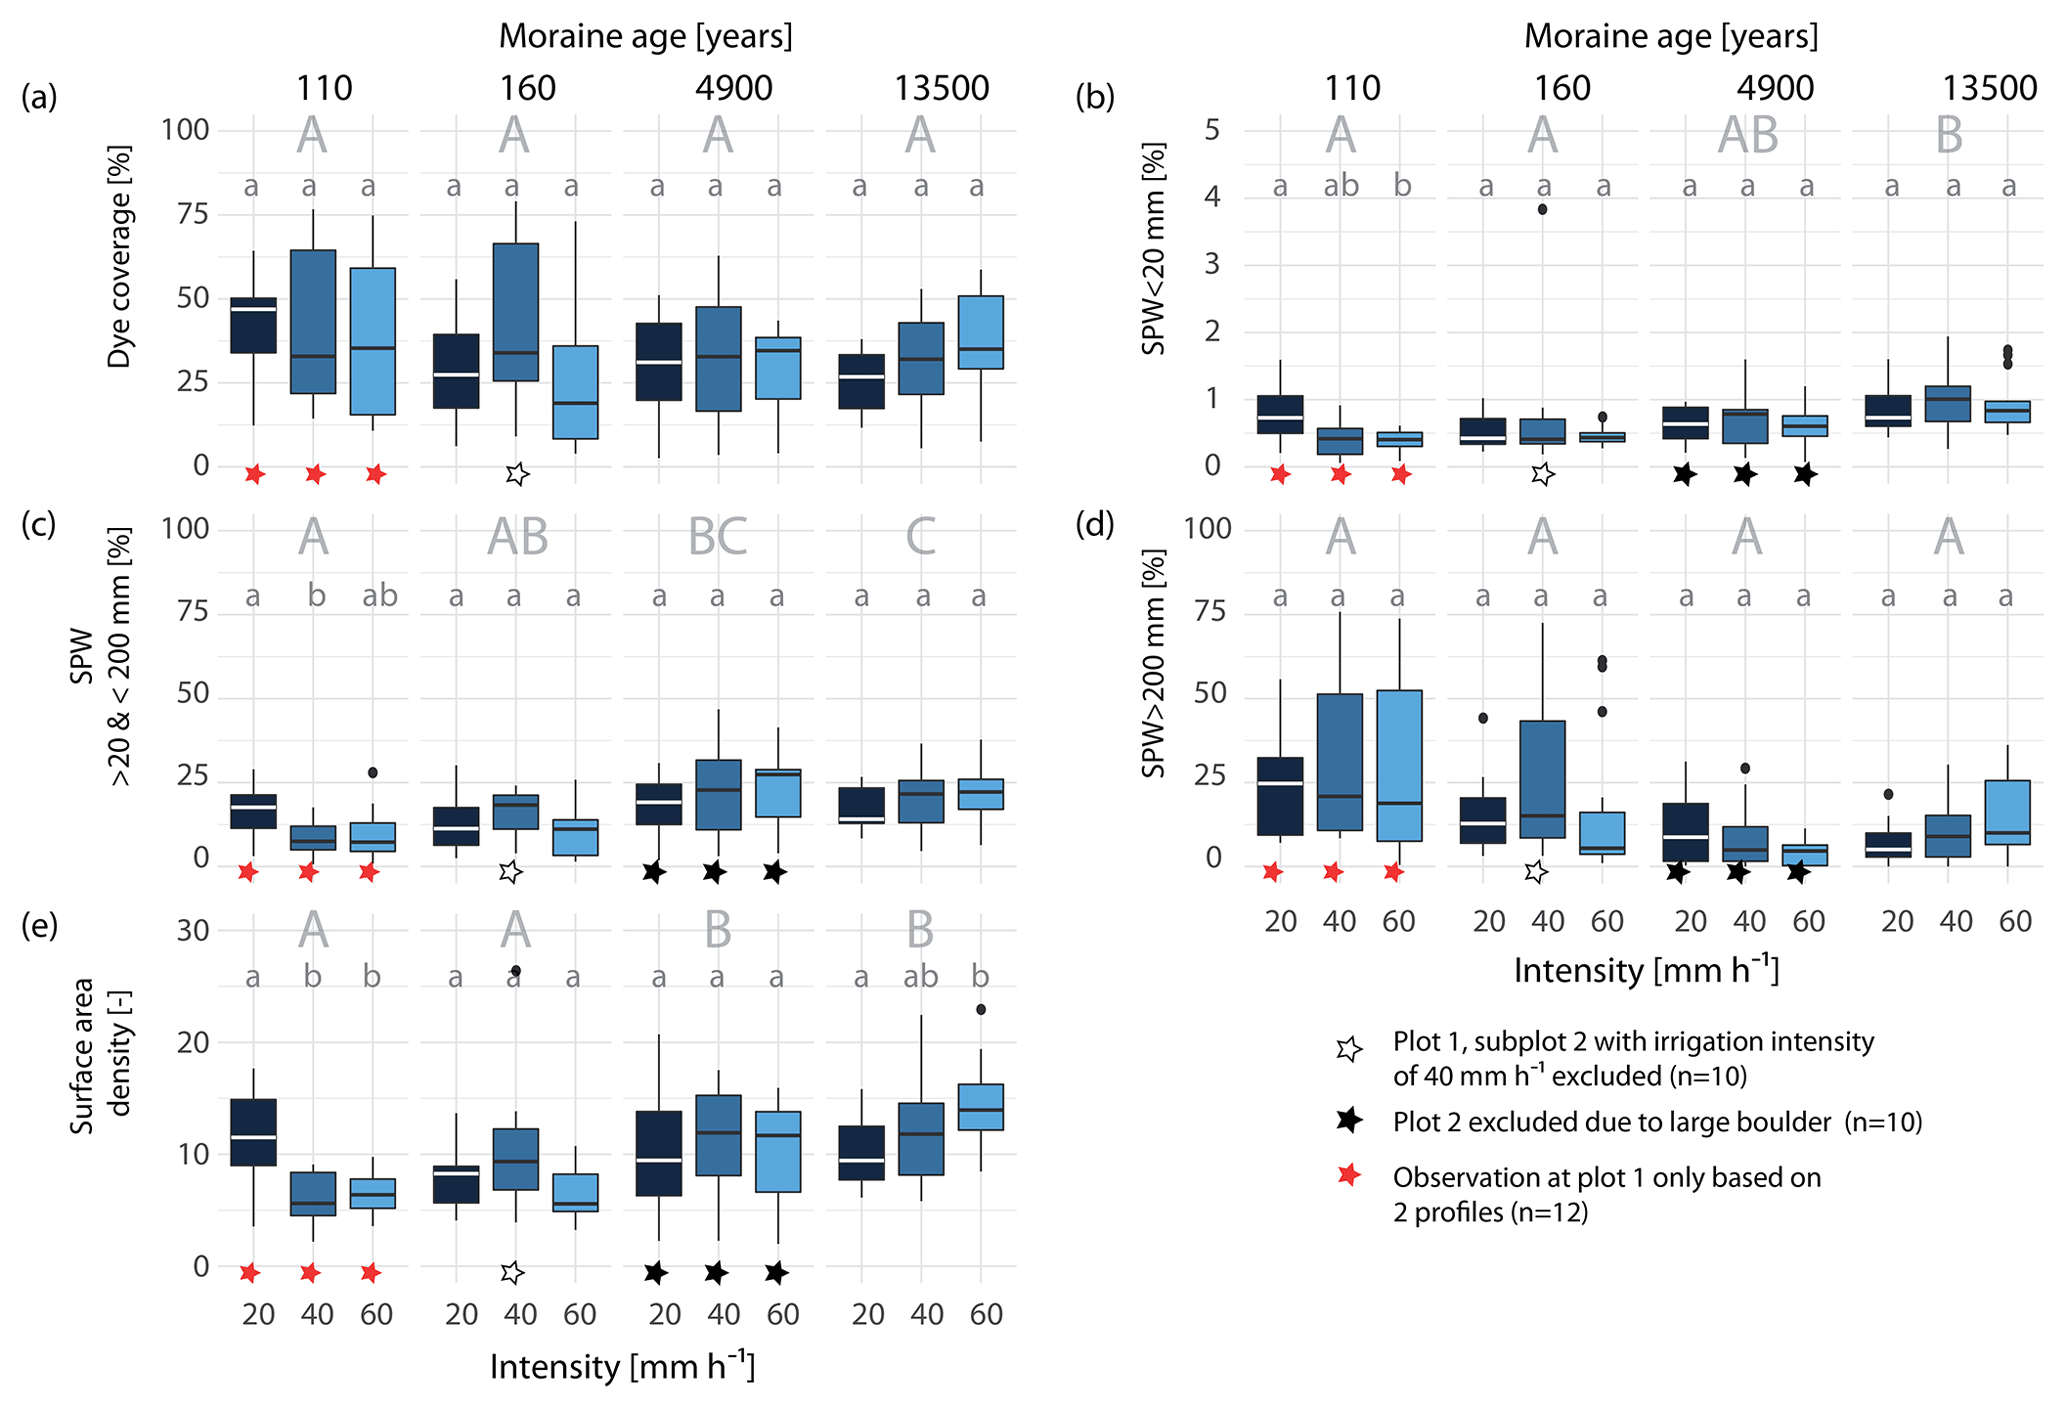
Figure 5Box plots of dye staining characteristics compared across the three irrigation intensities and the four age classes (each box plot shows the data of 3 plots à 5 profiles, 15 profiles in total). (a) Dye coverage (volume density) in area percent of the entire soil profile, proportion of (b) stained path with (SPW) <20 mm, (c) 20 mm < SPW < 200 mm, (d) and SPW > 200 mm in area percent of the entire soil profile, and (e) integral of the surface area density (measure for the number of flow paths) per age class and irrigation intensity. Upper case letters indicate the results of the Mood's median test among the age classes. Different letters denote significantly different median values among the age classes (medians not shown). Lower case letters denote the results among the irrigation intensity in each age class.
To clarify if the stained area described by VD (Figs. 5a–d and 4) is made up of many small flow paths or few large ones, VD has to be jointly interpreted with the surface area density (SAD) (Figs. 5e and 6), which is a measure for the number of individual flow paths. SAD increases along the chronosequence (Fig. 5e) with the exception of very high SAD values at the youngest moraine irrigated with 20 mm h−1. A depth-differentiated display of SAD (for the increments of 0–20, 20–40, 40–60, and 60–100 cm) per age class and irrigation intensity is given in Fig. 6. At the young moraines, the SAD in the upper 10–20 cm is comparable to that of the old moraines but decreases more strongly with depth (Fig. 6). At 80 cm, SAD seems to be higher at the older moraines. The combination of SAD and VD reveals distinct differences in the staining patterns along the chronosequence. The young moraines are dominated by a high VD (in some cases restricted to the shallow depth only), a low SD, and a dominant fraction of SPW > 200 mm. In contrast, the old moraines have a high fraction of 20 < SPW < 200 mm combined with a high SAD, which indicates a higher number of smaller, narrow blue-colored areas and thus more individual active flow paths at the older moraines and less individual flow paths but larger continuous areas used for water transport at the young moraines.
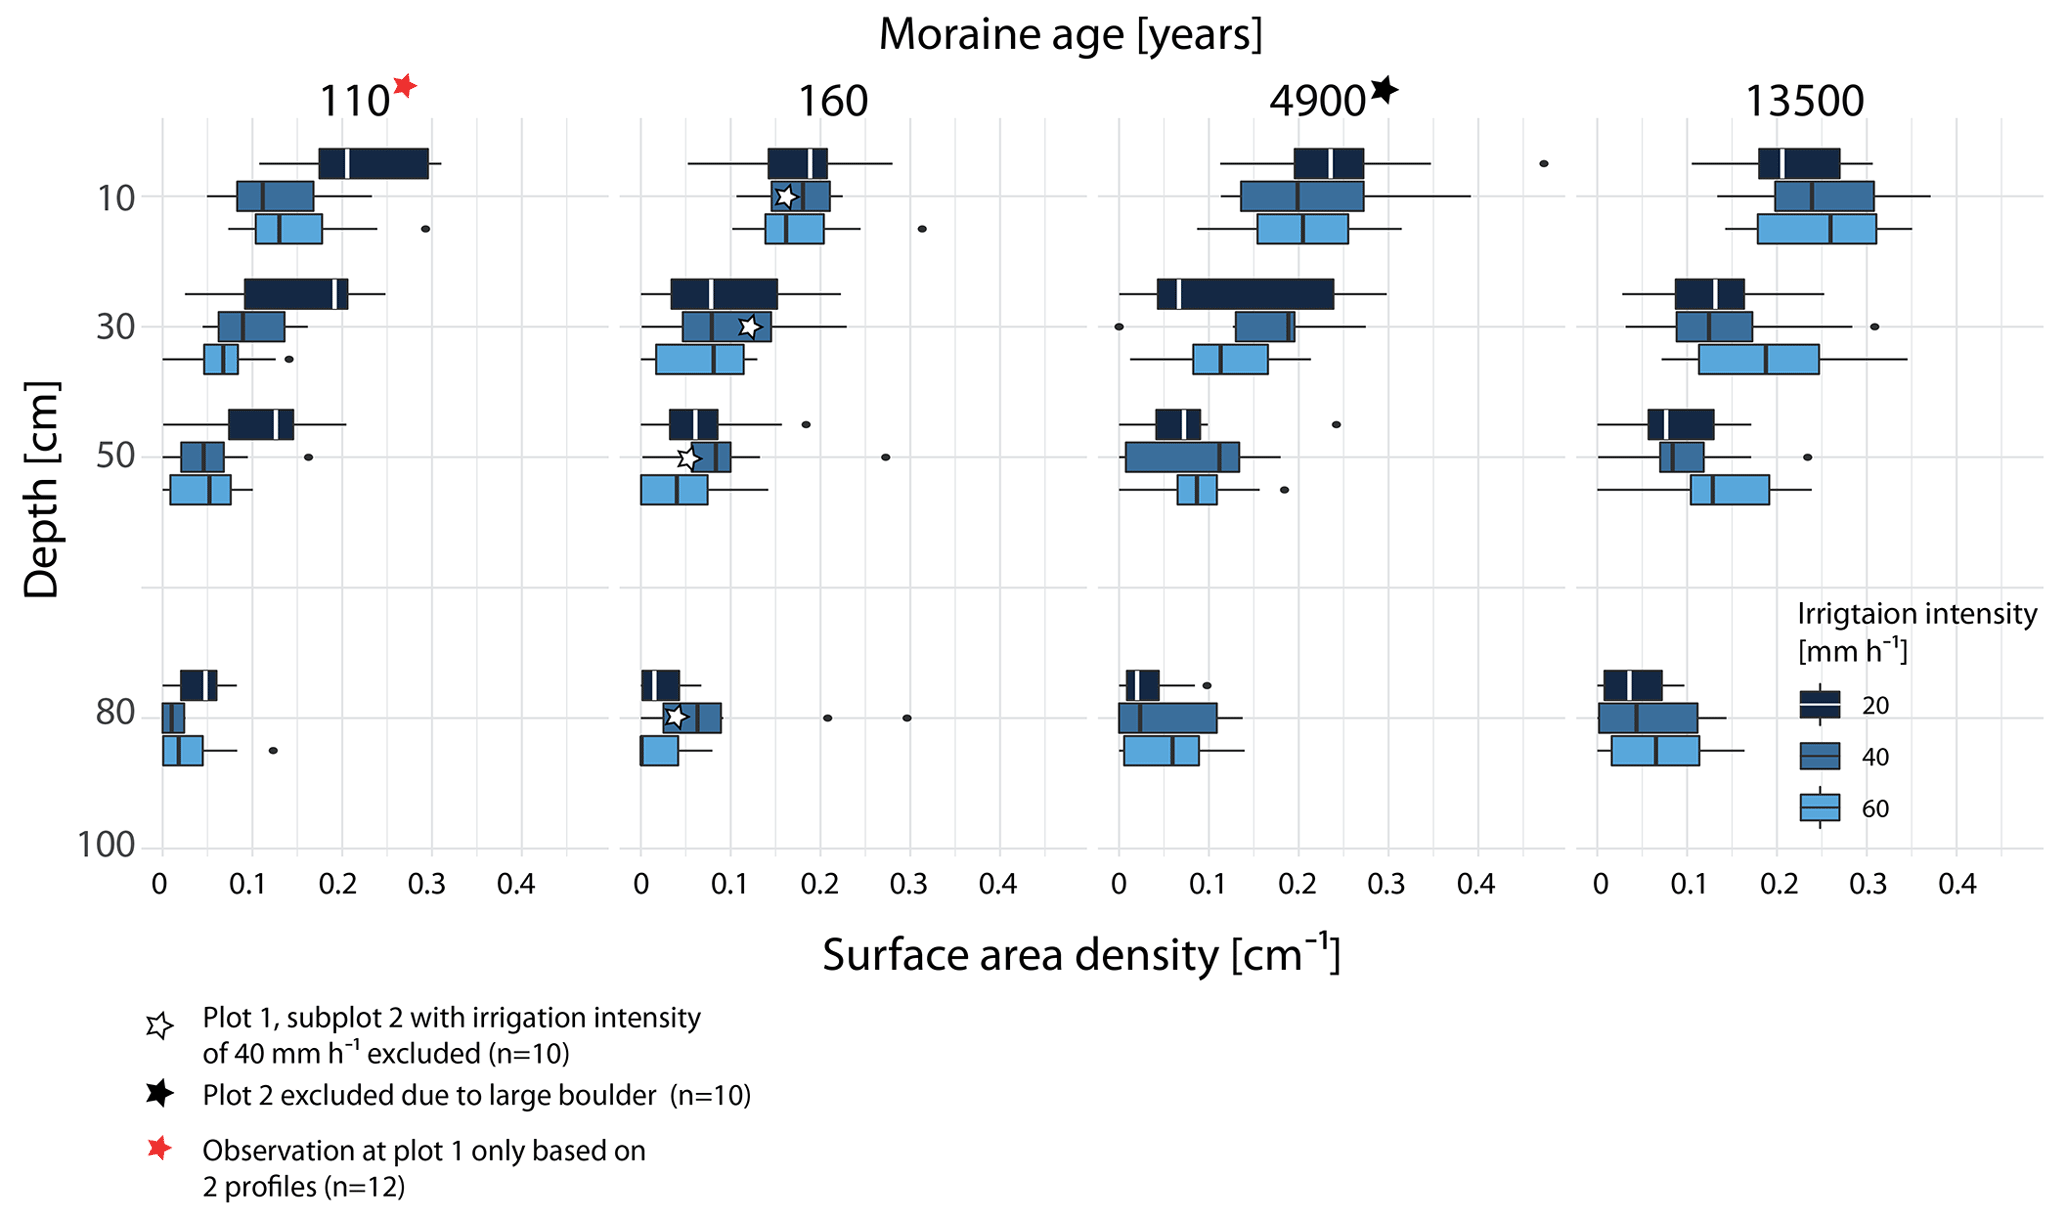
Figure 6Surface area density (an indicator for the number of flow paths observed across the profile at a certain depth) for the depth increments of 0–20, 20–40, 40–60, and 60–100 cm per age class and irrigation intensity. Each box contains the information of the five profiles per subplot (n=15).
Different irrigation intensities mostly do not lead to significant differences between the resulting dye pattern characteristics (Fig. 5). Even though there are no statistically significant differences between the medians in dye coverage, the medians at the young moraines tend to decrease and at the old moraine to increase with increasing intensity (Fig. 5a). The respective fractions of the three SPW classes also seem to be affected by irrigation intensity, but changes are only significant for the two SPW classes < 200 mm at the 110 a moraine. At this age class, a reduction in the median areal fraction with increasing intensity is observed for all three SPW classes. The interquartile range, however, increases for SPW > 200 mm. At the 4.9 ka moraine, a tendency towards higher fractions of 20 < SPW < 200 mm and a tendency towards lower fractions of SPW > 200 mm with increasing intensity are observed. On the other hand, at the 13.5 ka moraine, a tendency towards higher proportions is found for both SPW classes. However, the differences between the intensity levels are not tested as statistically significant. A statistically significant increase of SAD with irrigation intensity can be seen at the 13.5 ka moraine and a decrease at the 110 a moraine (Fig. 5e). The SAD at the 160 a moraine also tends to decrease with increasing intensity, but according to the Mood's median test, the differences are not statistically significant. The depth distribution of SAD per irrigation intensity (Fig. 6) shows an increase in SAD with increasing irrigation intensity at all depths at the oldest moraine and a tendency to a higher SAD at the 4.9 ka moraine starting at a depth of 20 cm.
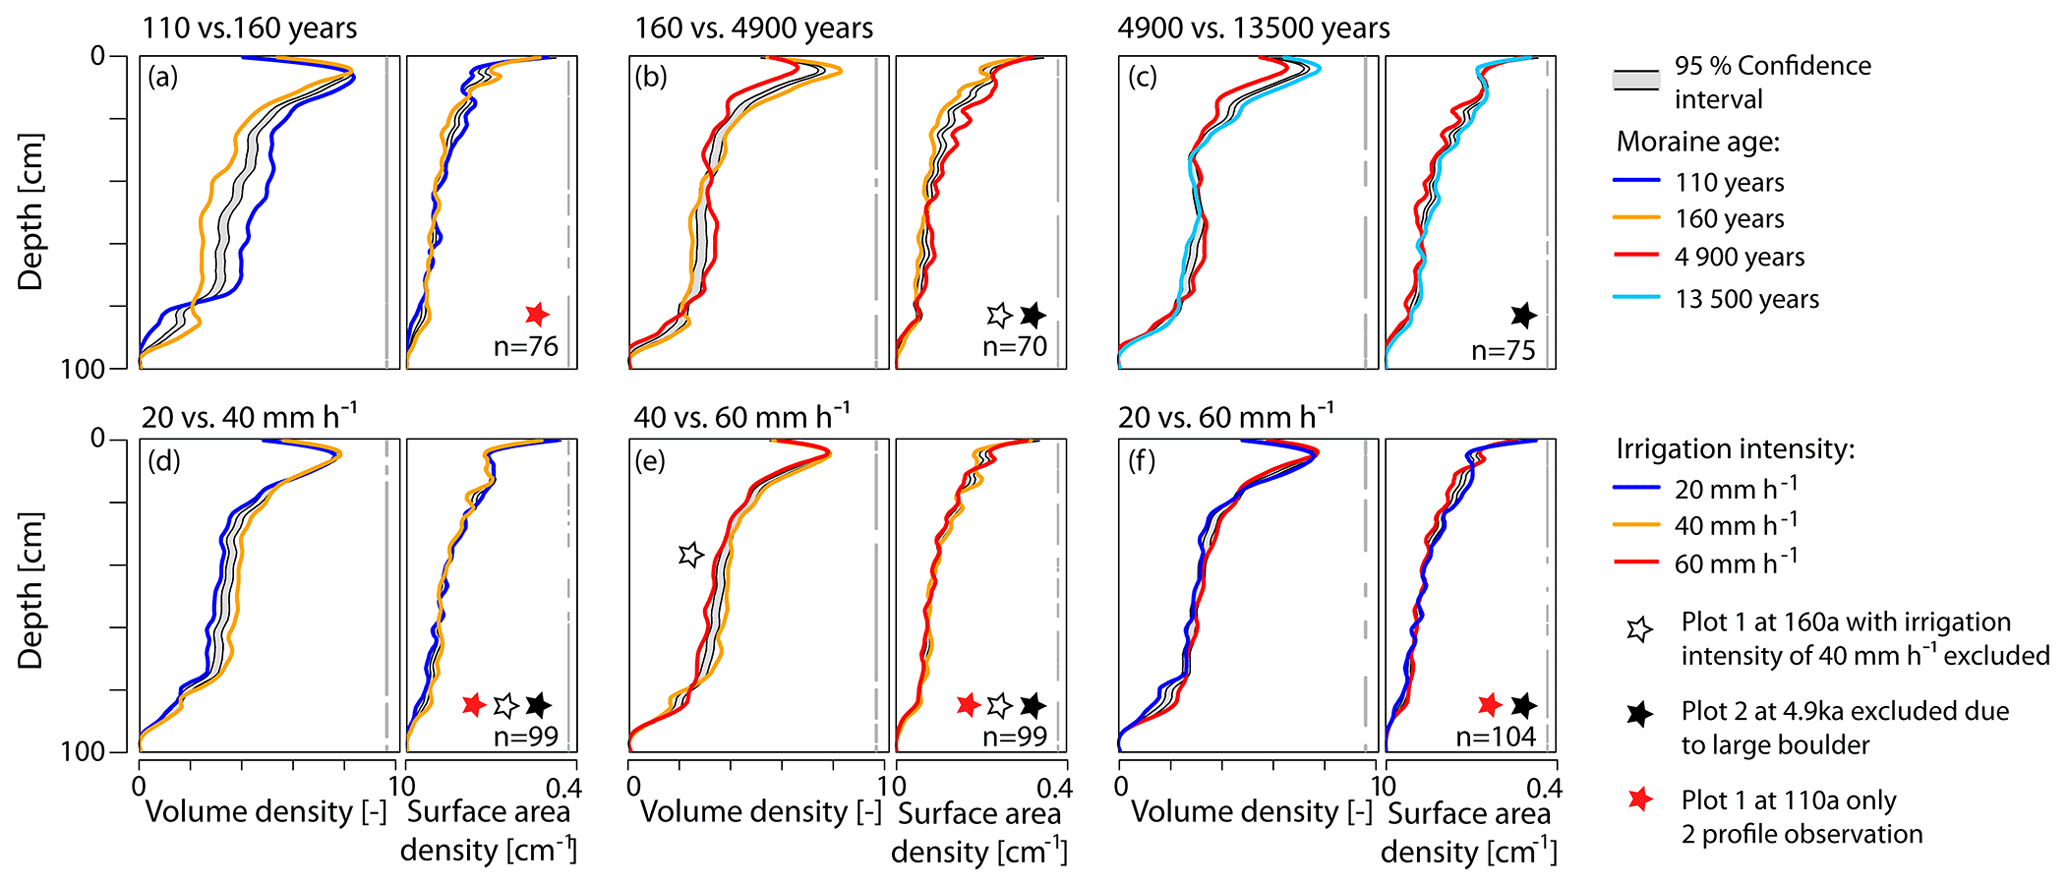
Figure 7Differences in volume density and surface area density profiles with respect to (a–c) moraine age and (d–f) irrigation intensity. If the profile lines sit outside the gray-shaded confidence interval, the two profiles are considered to be significantly different. The parts of the depth profiles where this is the case are indicated by gray vertical bars on the right of each plot; n denotes the number of profiles used for the depth-wise re-sampling.
To quantitatively assess the impact of age and irrigation intensity on the dye pattern, a statistical approach in the form of a bootstrapped LOESS regression (BLR) was used. The approach is designed for a comparison of two datasets with profile observations (Keith et al., 2016). The results of the BLR approach for a pair-wise comparison of the averaged volume density and surface area density profiles are shown in Fig. 7. Next to the 95 % confidence interval of the 1 000 LOESS regressions (bootstrap resampled out of the combination of both compared datasets), the LOESS regression of both original datasets are shown. The differences between the two profiles are significant if the LOESS regression curves sit outside the confidence interval. It would actually be sufficient to plot only one LOESS regression of the original datasets (Keith et al., 2016), but we plotted both. Based on the moraine age as the test variable, we compared the sets of all volume density and surface area profiles per moraine age along the chronosequence (Fig. 7a–c). We find statistically significant differences in the volume density and surface area density profiles among the neighboring age classes. The gray vertical bar indicating where differences are significant is almost continuous and has only a few short interruptions.
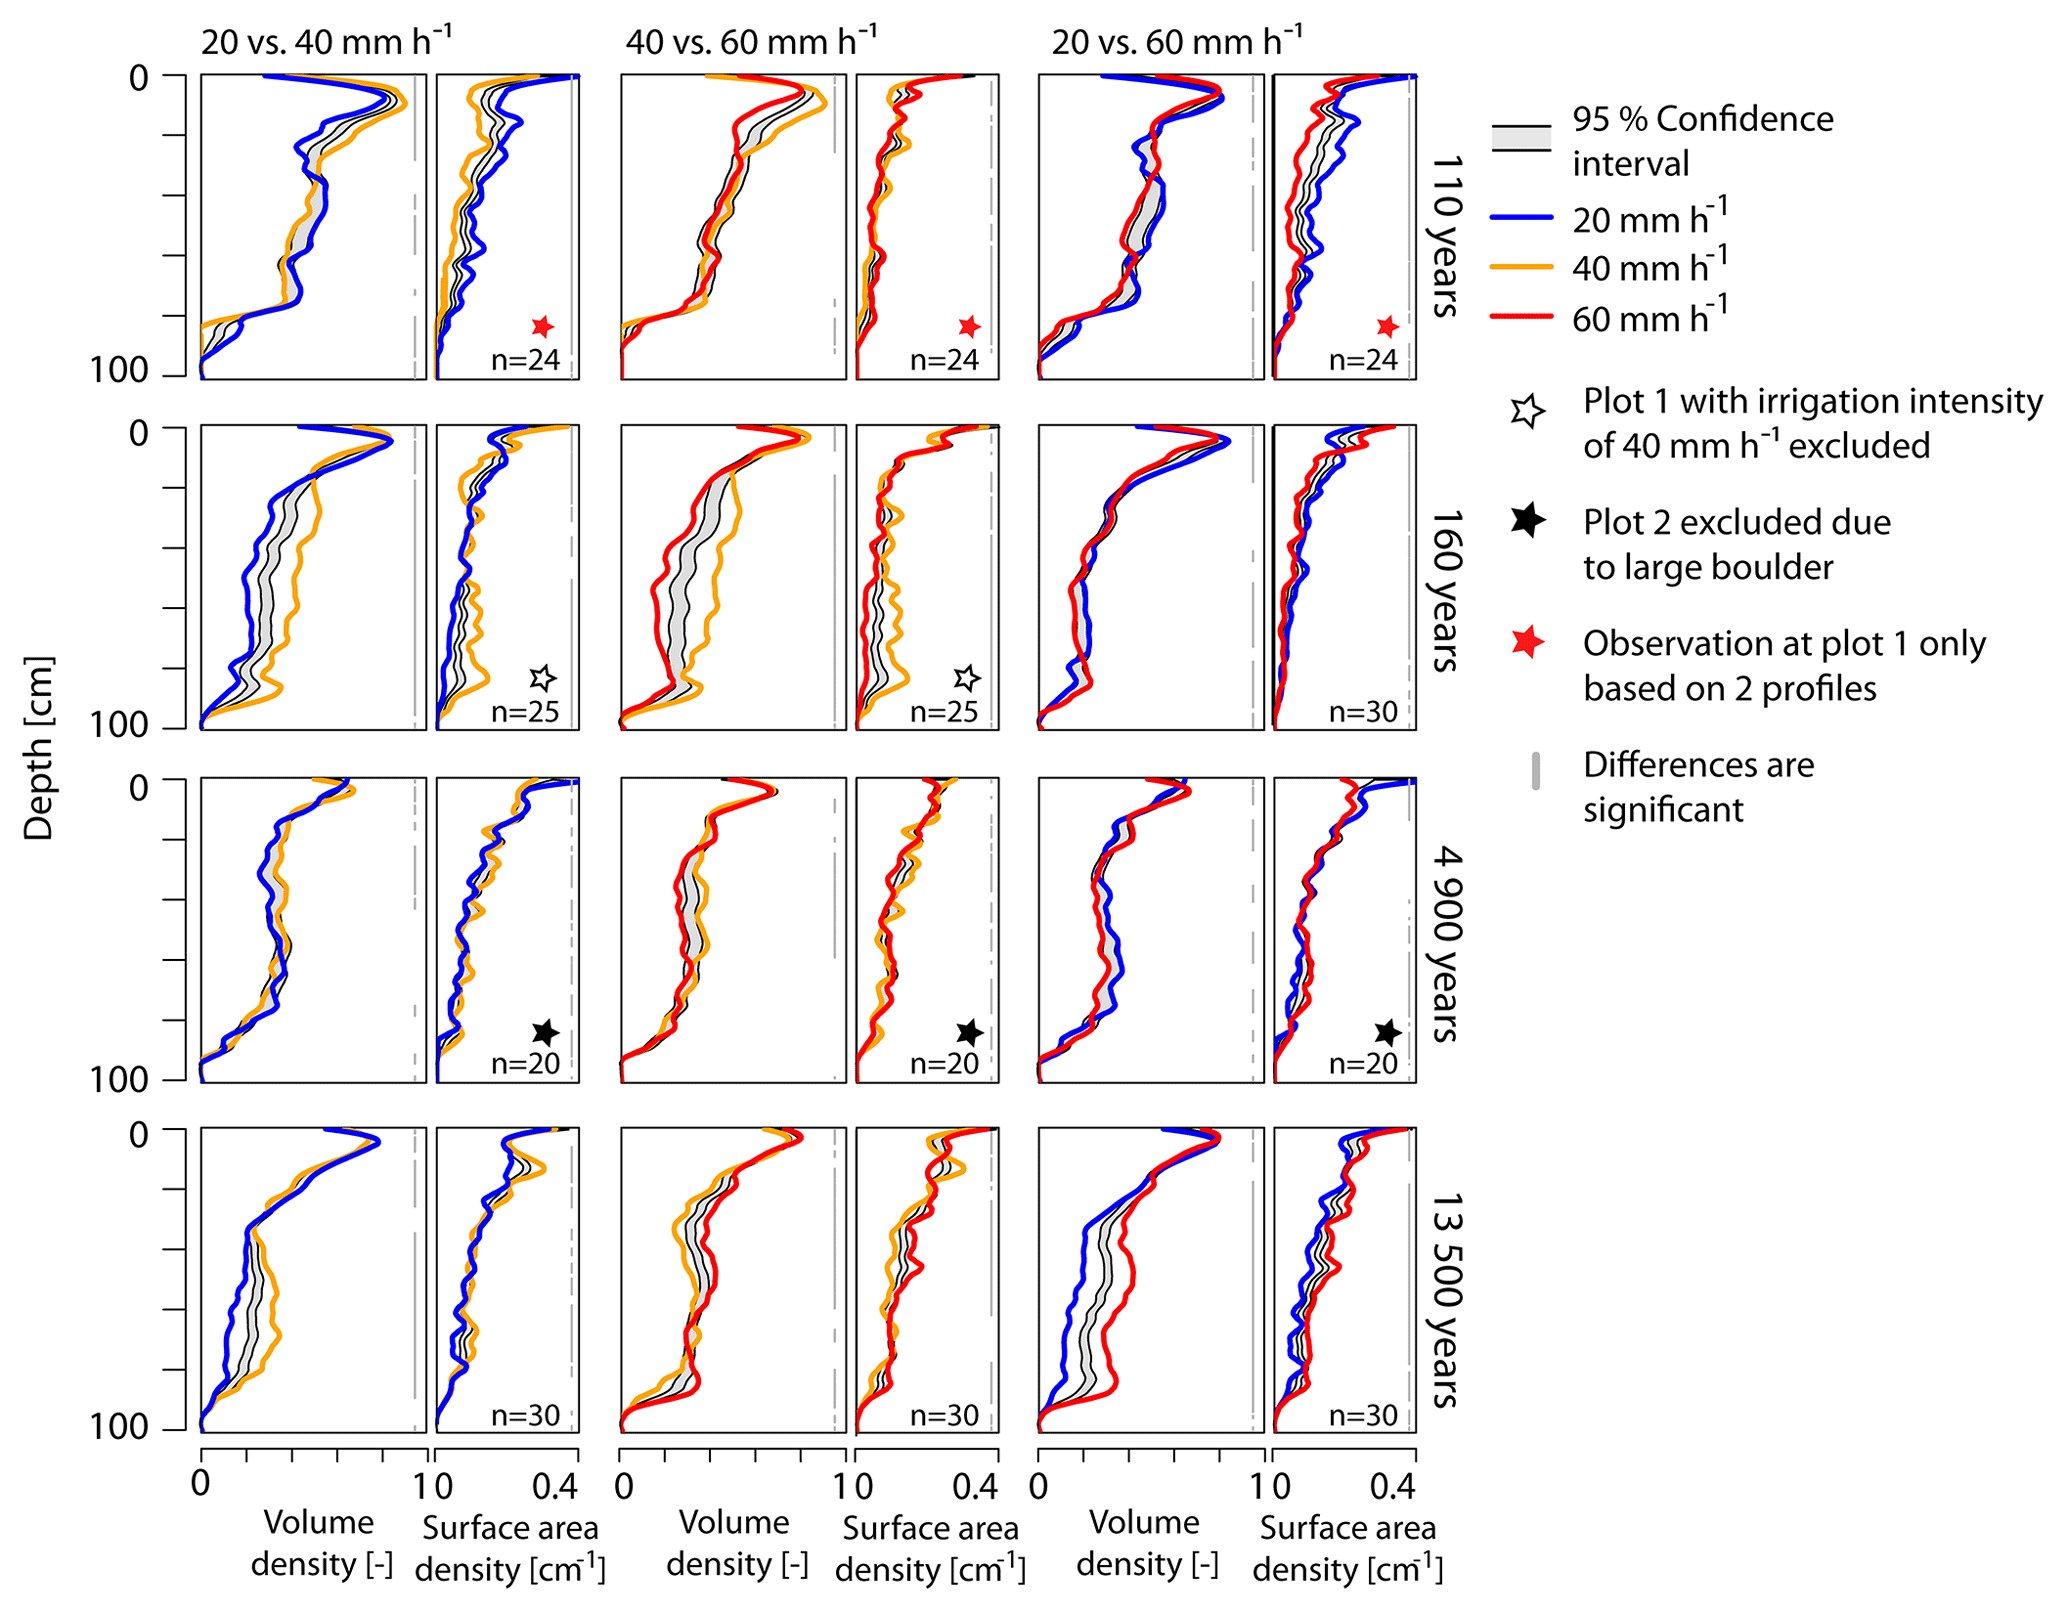
Figure 8BLR-test for differences in volume density profiles and surface area density profiles among the three irrigation intensities per age class. If the profile lines sit outside the gray-shaded confidence interval, the two profiles are considered to be significantly different. The parts of the depth profiles where this is the case are indicated by gray vertical bars on the right of each plot. n denotes the number of profiles used for the depth-wise re-sampling.
When comparing the profiles with regard to the irrigation intensity irrespective of age, we see that significant differences are dominating, but the LOESS regression profiles are mostly located very close to the confidence interval (Fig. 7d–f). The profile comparison between irrigation intensities, carried out individually for each age class, shows similar results (Fig. 8). At the 4.9 ka moraine, the gray bars indicating significant differences are often disrupted, with a slight tendency towards more significant differences in the upper half meter for VD. In contrast, at the 160 a moraine and especially at the 13.5 ka moraine, the regression lines are located far outside of the confidence interval, indicating significant differences across all irrigation intensities (except 20 mm h−1 vs. 60 mm h−1 at 160 a).
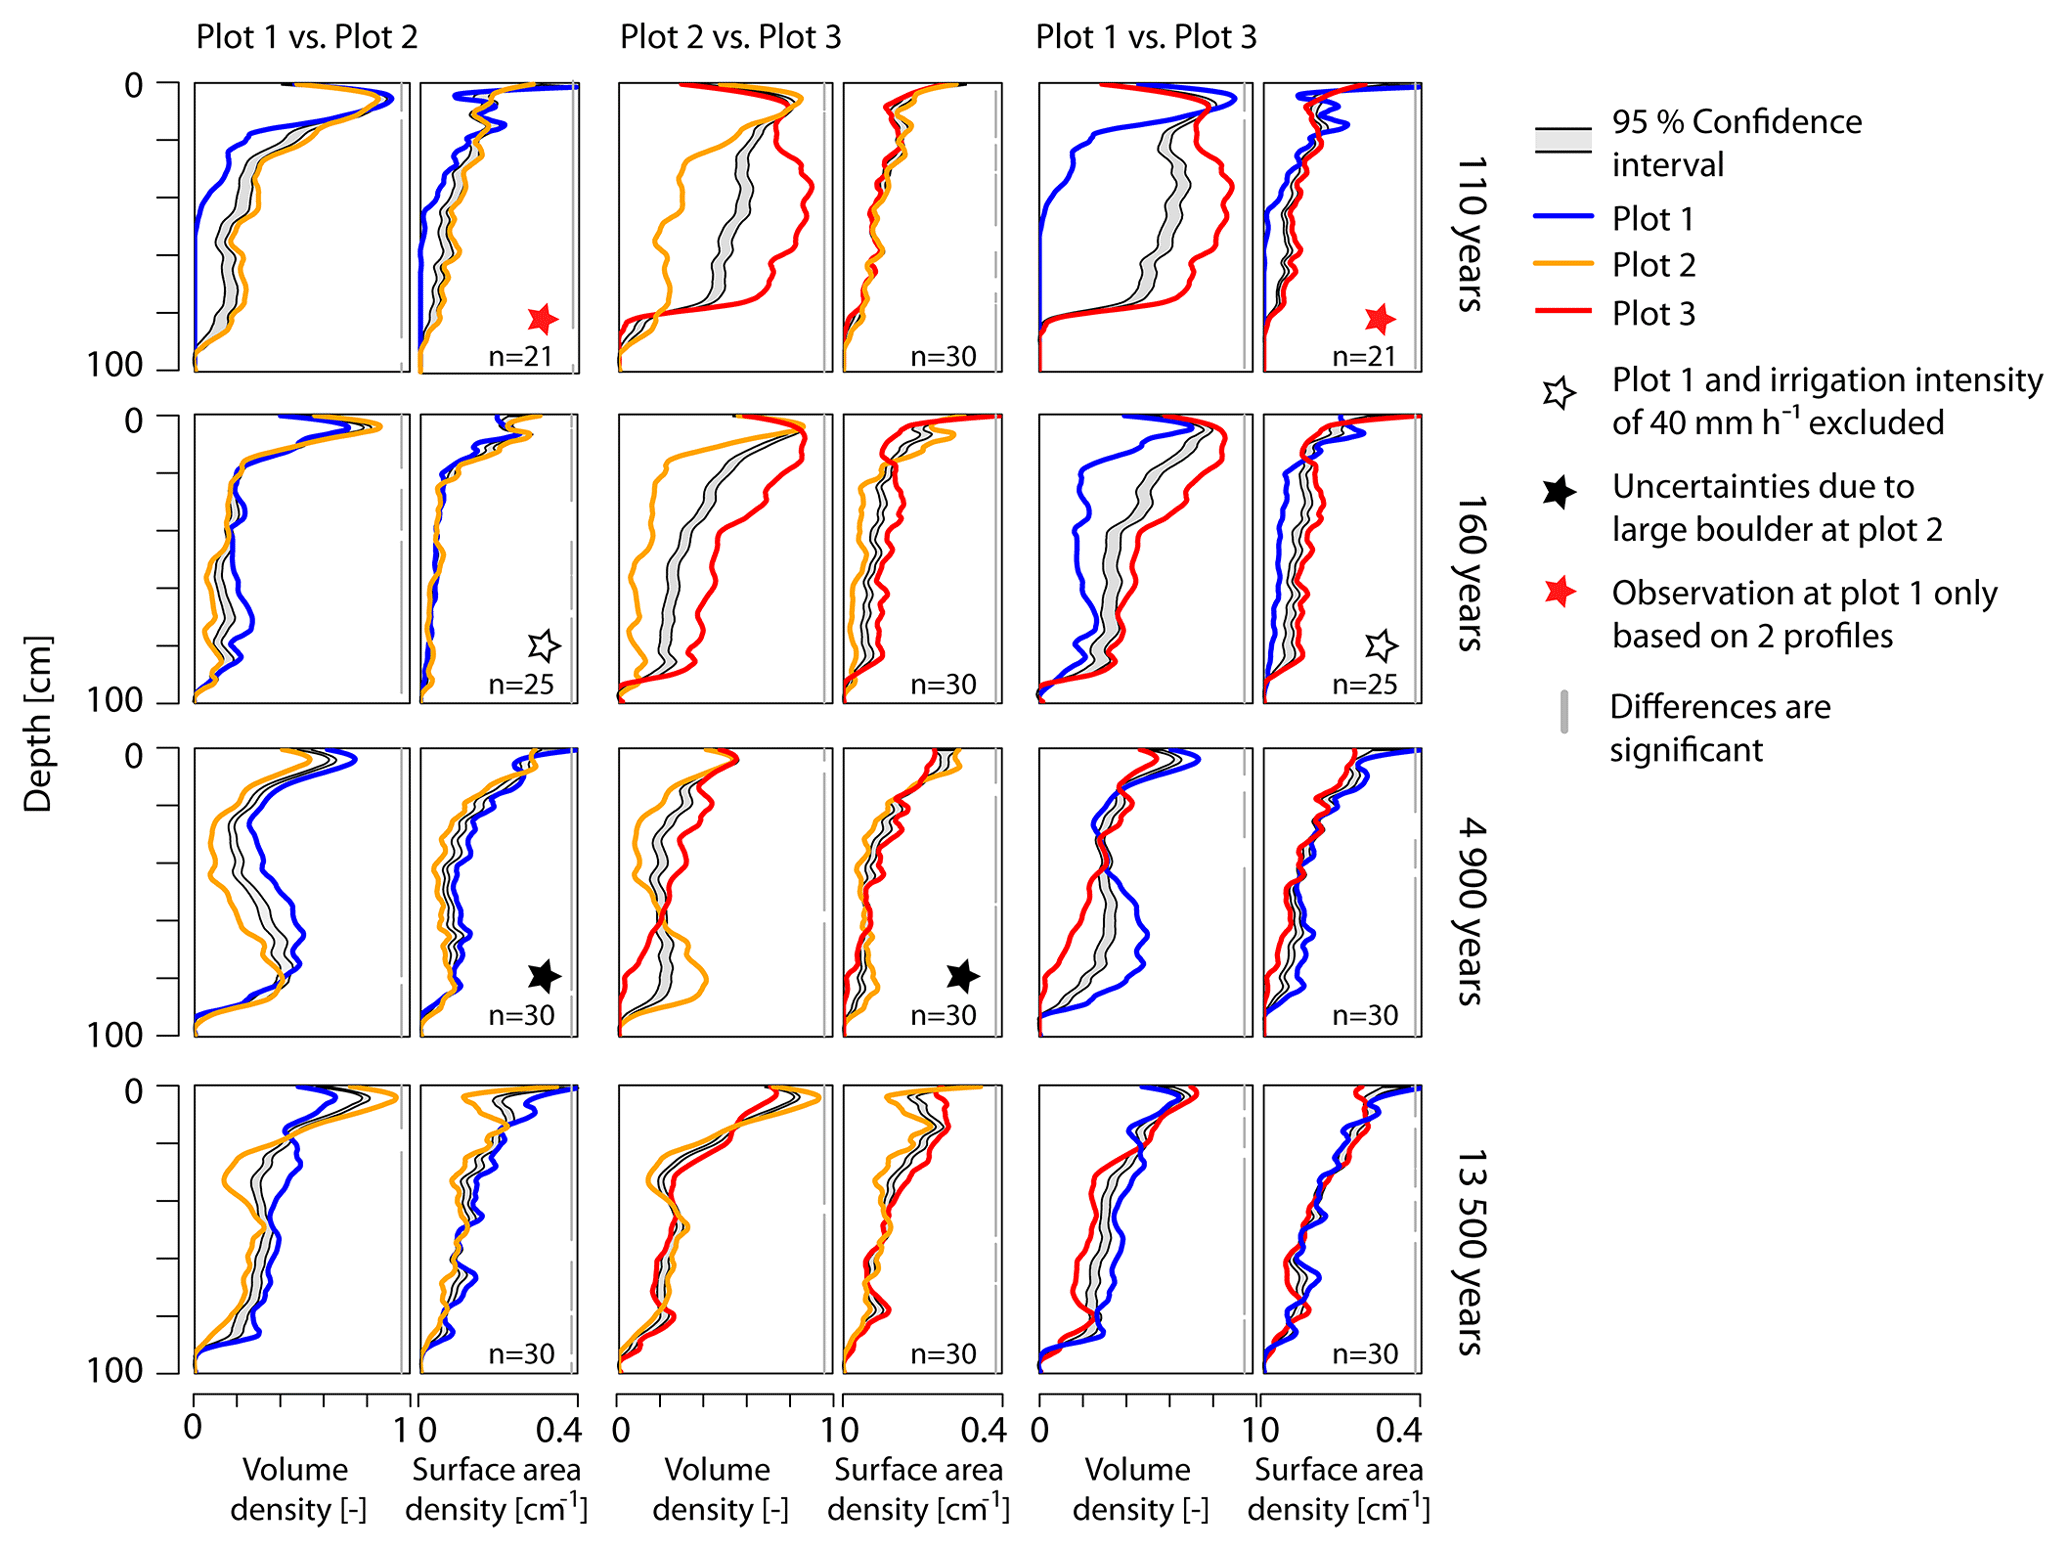
Figure 9BLR test for differences in volume density profiles and surface area density profiles among the three experimental plots per age class. If the profile lines sit outside the gray-shaded confidence interval, the two profiles are considered to be significantly different. The parts of the depth profiles where this is the case are indicated by gray vertical bars on the right of each plot; n denotes the number of profiles used for the depth-wise re-sampling.
To investigate the spatial variability within each age class, we compared the profiles of the three plots per moraine (Fig. 9). In this case, profiles across all irrigation intensities were used, revealing significant differences between the three plots for all age classes. The profiles at the 4.9 and 13.5 ka moraines show mainly significant differences, with no comparison within the age class being particularly striking. The LOESS regression profile lines comparing plot 1 and 2 with plot 3 at the two young moraines (110 and 160 a), however, lie far outside the confidence interval, which indicates strong differences between the profiles at plot 3 and the other two plots. This resembles the strong differences in the mean VD profiles (Fig. 4) at the two young moraines. Plot 3 at both moraines clearly stands out from the other plots, with a higher vegetation cover and a larger VD at greater depths.
3.2 Flow type classification
Using the VD profiles of the three SPW classes and their fraction of the total dye coverage to characterize flow types (Weiler, 2001), we found that, over the millennia, flow types transition from matrix flow to preferential flow in the form of finger-shaped flow (Fig. 10a). At the youngest moraine, matrix flow is the predominant flow type (relative frequency > 0.6) followed by the flow type class “macropore flow with high interaction or finger-shaped flow”. A reliable distinction between macropore flow with high interaction and finger-shaped flow could be made neither through the image analysis nor through on-site assessment. As narrow macropores were sometimes present (e.g., thin root channels), they certainly contribute to water transport, but it is also likely that this process is obscured by finger-shaped flow paths. Since the water transport patterns of both flow types cannot be distinguished and both show finger-shaped flow patterns, they are also referred to as finger-shaped flow in the following.
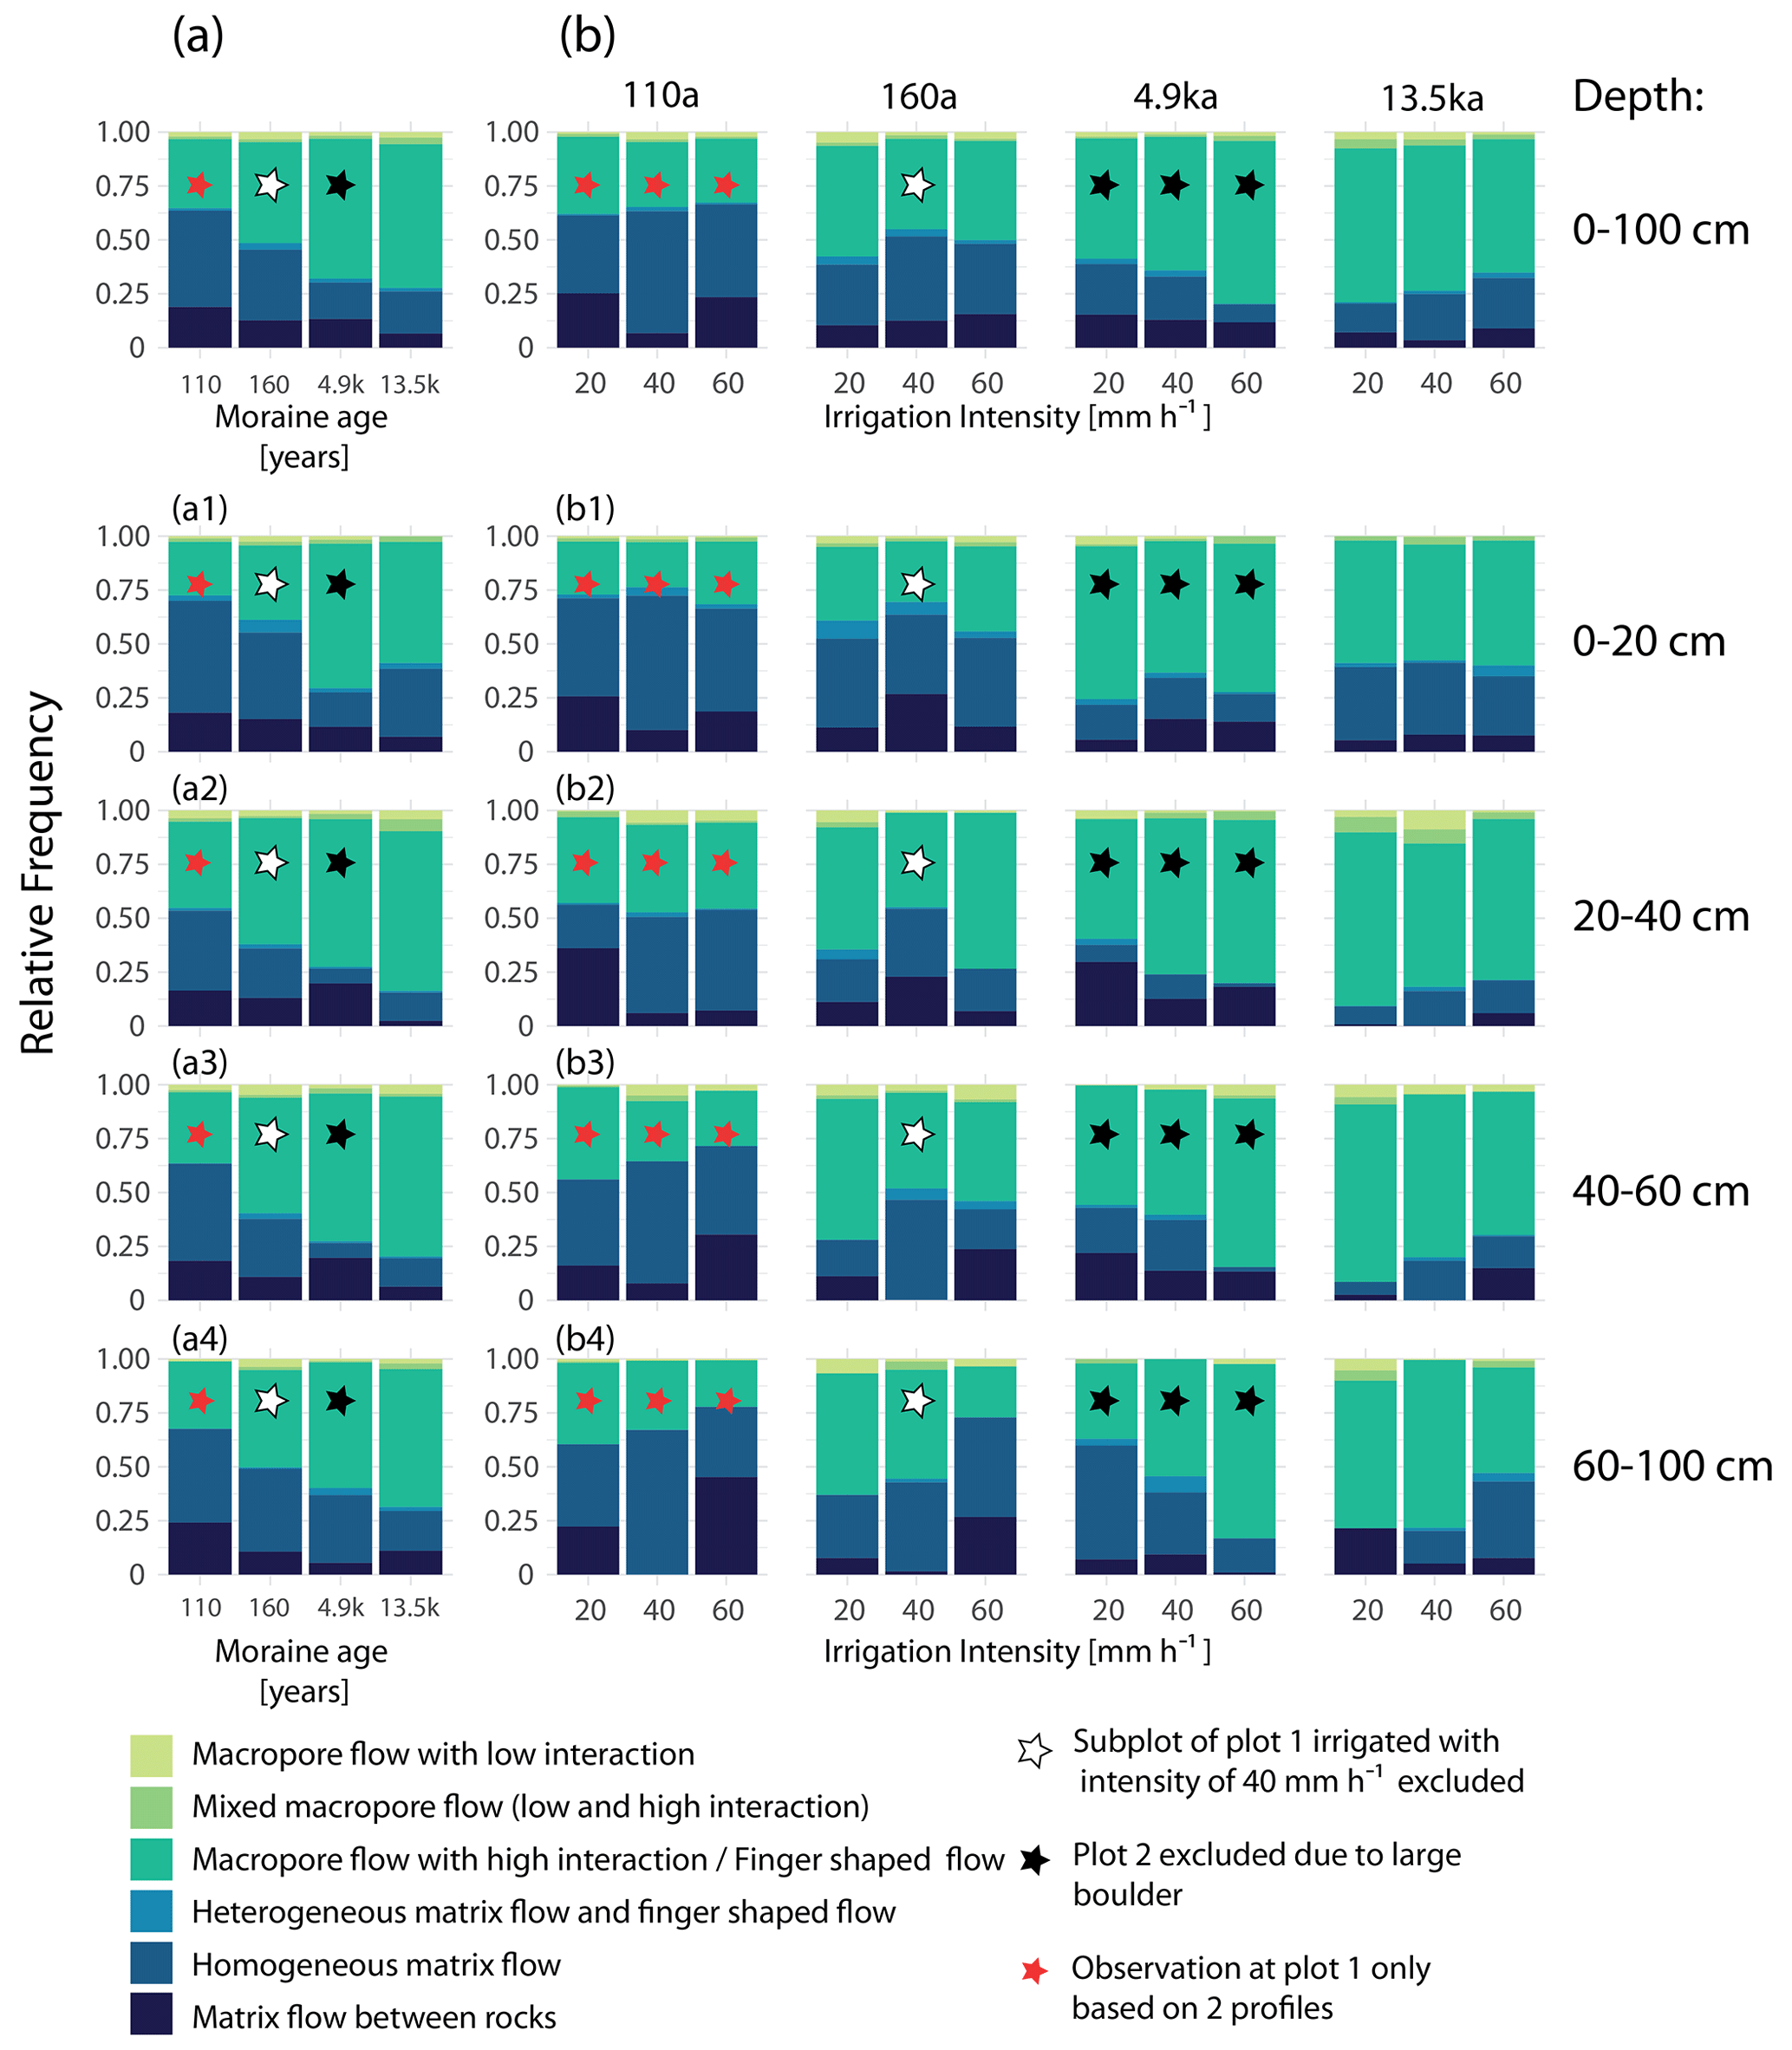
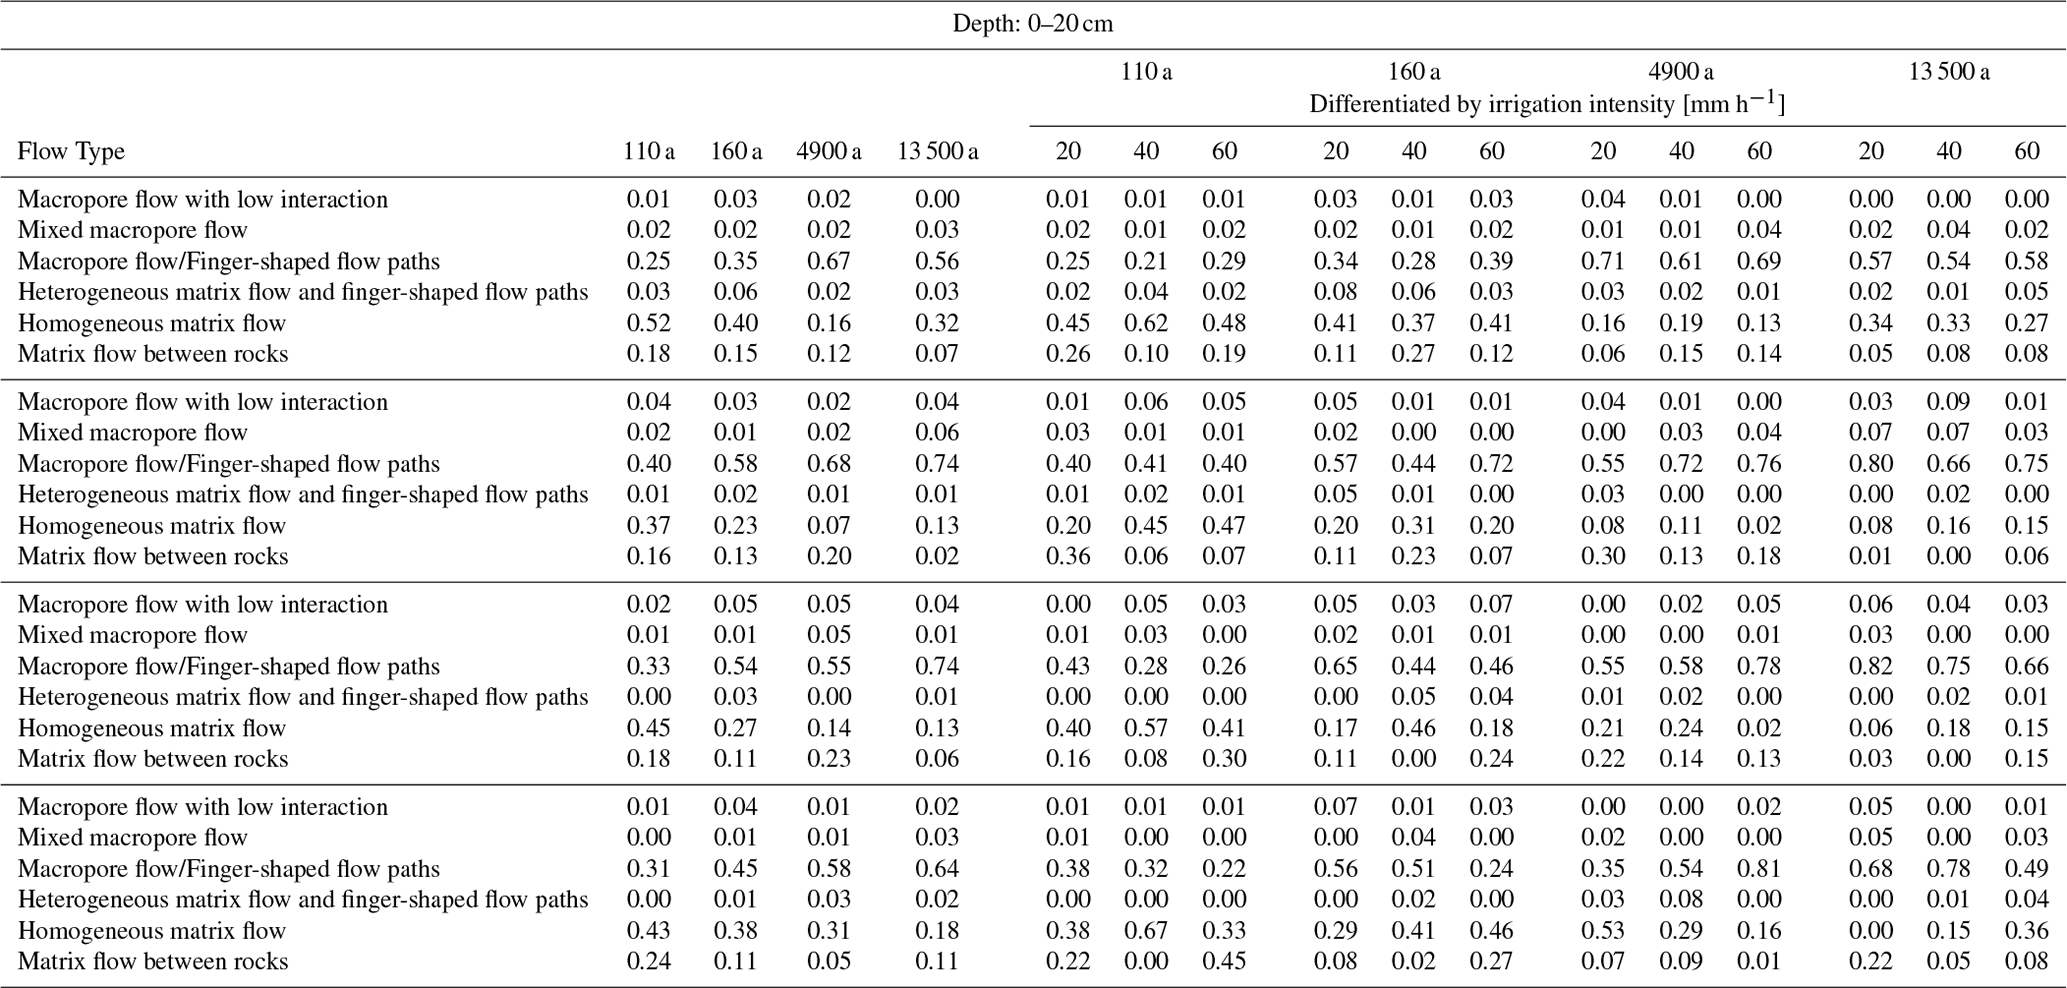
Figure 10Relative frequency distribution of flow types (a) for the four moraine age classes, and (b) differentiated by irrigation intensity for each moraine age. The flow type frequency distribution is displayed once for the entire profile depth of 100 cm (a, b) and once differentiated by four depth segments (a1–a4, b1–b4). Matrix flow types are displayed in a blue color scale and preferential flow types in a green color scale. A list of the relative frequencies of flow type occurrence can be found in Tables A1 and A2 in the Appendix.
At the 160 a moraine, the relative frequency of matrix flow already decreased to 0.5, and the frequency of finger-shaped flow increased. At the two oldest moraines, the dominant flow type is finger-shaped flow, and the relative frequency of matrix flow dropped below 0.3. Considering the entire profile depth of 1 m, the frequency of matrix flow decreases and the frequency of finger-shaped flow increases continuously with moraine age. A depth-differentiated view shows a higher proportion of finger-shaped flow at the 4.9 ka moraine than at the 13.5 ka moraine in the upper 20 cm (Fig. 10a1). At the other depths (Fig. 10a2 to a4), however, a continuous increase in finger-shaped flow frequency with moraine age was observed.
With regard to the irrigation intensity, no consistent impact on the flow type distribution across the millennia could be identified (Fig. 10b). At the 110 and 160 a moraines, the two dominant flow types (matrix flow and finger-shaped flow) show an almost-equal distribution across all irrigation intensities. A tendency towards less matrix flow is observed at the 4.9 ka moraine, whereas at the 13.5 ka moraine the frequency of matrix flow increases with increasing irrigation intensity. Differentiated by depth, we observed no systematic trend in flow type frequency distribution, with increasing irrigation intensity in the upper 20 cm for all age groups (Fig. 10b1). Below a depth of 20 cm, the 4.9 ka moraine and the 13.5 ka moraine each show a trend-like behavior in the shift of the frequency distribution with irrigation intensity similar to what we see for the entire soil profile (Fig. 10b2 to b4). Below a depth of 40 cm, the relative frequency of matrix flow also increases with increasing irrigation intensity at the 110 and 160 a moraines (Fig. 10b3–b4).
3.3 Correlation of preferential flow frequency with site characteristics
Infiltration patterns and the formation of subsurface flow paths can be related to site characteristics. We tested the correlation between the preferential flow fraction (PFF) in the topsoil (0–20 cm) and the site characteristics listed in Table 1 by applying a simple linear model (Fig. 11). These site characteristics include age (which summarizes many physical and biotic characteristics), slope as a purely physical descriptor, and then several vegetation characteristics, such as vegetation cover, species richness, above-ground biomass, and root length density. Although the sample size is quite small and the analysis cannot identify direct causalities and does not account for possible multi-collinearities, it nevertheless provides some insight into potential controls of preferential flow occurrence.
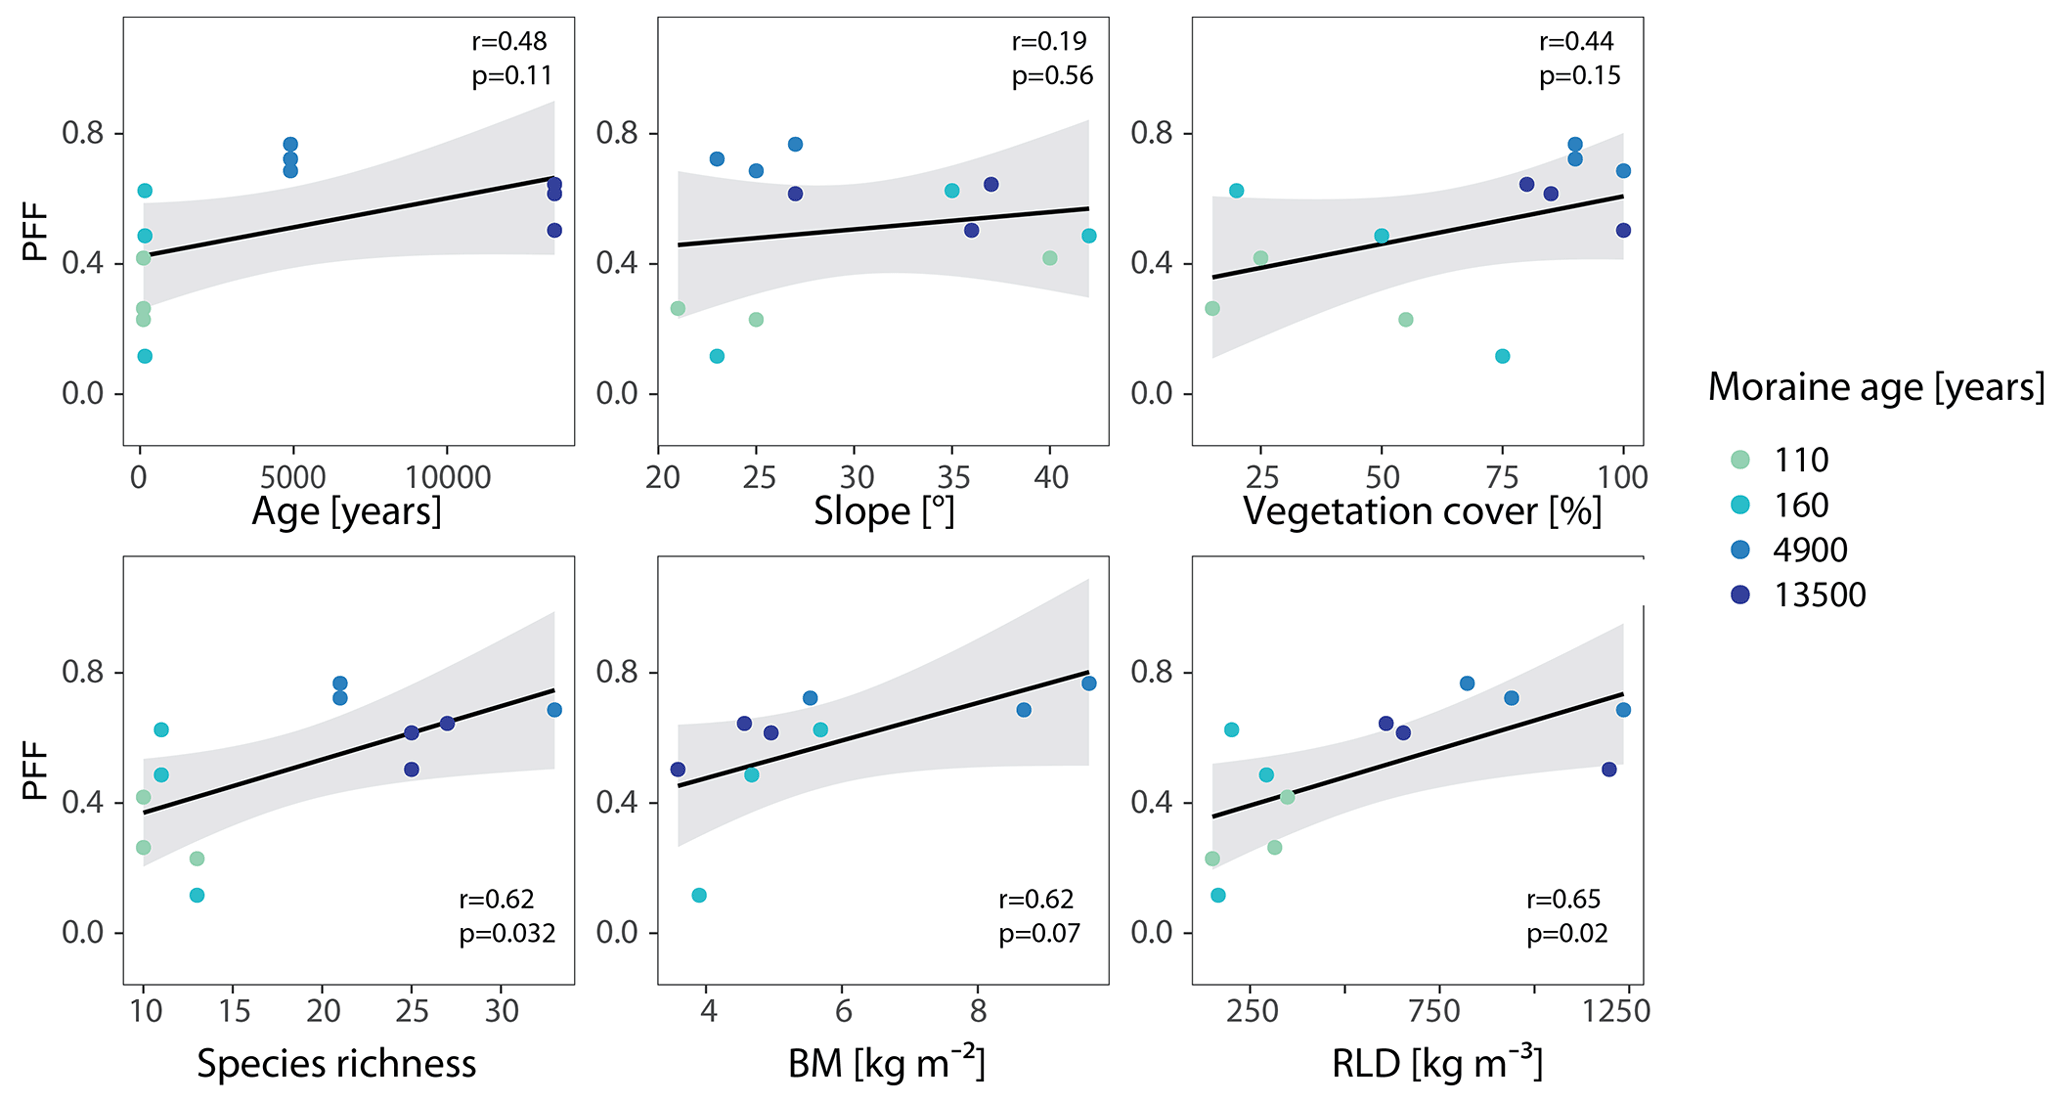
Figure 11Frequency of preferential flow (PFF) in the upper 20 soil centimeters in relation to moraine age, slope, and vegetation characteristics (BM = above ground biomass, RLD = root length density).
Between moraine age and PFF, we only observed a small and, at the 0.05-level, statistically not-significant (p>0.05 at r<0.5) correlation. A correlation between slope and preferential flow occurrence can also be ruled out (r<0.2). The vegetation cover shows the weakest correlation with PFF (r<0.5) out of the four tested vegetation parameters, whereas the species richness, BM, and RLD have a stronger correlation with PFF (r>0.6). The relationship (r>0.6) between PFF and BM is not statistically significant (p=0.07). However, since the p-value is affected by sample size, we have to point out that, due to missing data at the 110 a moraine, the sample size for BM is reduced compared to the other vegetation properties (n=9 instead of n=12). This can negatively affect the comparability of the correlations. The relationships of PFF with species richness and RLD are both statistically significant (p<0.05), whereas the strongest linear relation exists between PFF and RLD (r=0.65).
4.1 Evolution of flow paths
Across the chronosequence, we observed significant differences in the dye patterns (Fig. 7). Based on the flow type classification of the dye patterns, we found that the frequency of matrix flow decreases with age, and the frequency of finger-shaped flow increases. The frequency of matrix flow is especially high (>0.6) in the top soil (0–20 cm) at the 110 and 160 a moraines. However, at these two moraines, distinctly more surface runoff was observed during the irrigation experiments than at the older moraines. At both young moraines, the high amounts of surface runoff (unfortunately unquantified) were mainly observed at plot 1 and 2. From purely visual observation, during irrigation, it seemed like the amount of surface runoff increased with irrigation intensity at the younger moraines. At these four plots, the water infiltrated homogeneously in the top 10 cm, but there was hardly any staining in the soil below this depth (Fig. 4). Lateral subsurface flow, however, was not observed. In contrast, at plot 3 at both young moraines, deep infiltration and vertical homogeneous water transport were observed.
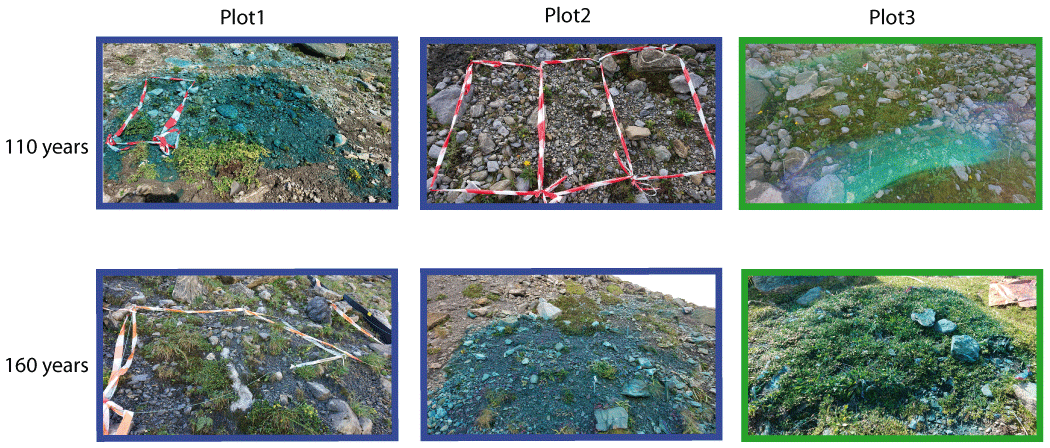
Figure 12Surface of the plots at the 110- and 160-year-old moraine. Frame color indicates plots with a similar degree of vegetation coverage. Photograph of the high complexity plot at 110-year-old moraine is disrupted by lens flares due to backlighting.
The surface of the young moraines is characterized by high-density stone deposits (Fig. 12), but since the stone cover was roughly similar at all three plots per age class, we do not assume that the differences in surface runoff are related to the amount of stones at the surface. We observed that rocks at the surface mostly result in only very local, small-scale redistribution and preferential infiltration instead of surface runoff. We therefore link the differences in infiltration patterns and resulting staining patterns to the differences in vegetation cover. Whereas both plots labeled as plot 3 showed a high degree of vegetation coverage (>50 %, Table 1), which was evenly distributed over the entire plot area (Fig. 12), plot 1 and 2 at both moraines had a low vegetation cover, with only a few single vegetation patches between gravel and small stones. We hypothesize that structural sealing could be the cause for the reduced infiltration depths and higher amounts of surface runoff at plot 1 and 2 of the two young moraines, as surface runoff started only a few minutes after the start of the irrigation. At both moraines, the aggregate stability of the loamy to sandy soils with low organic matter content was found to be comparatively low (Greinwald et al., 2021c). Thus, high irrigation intensities are suspected to have caused the structural sealing of the soil surface, which induced overland flow on these otherwise coarse-textured soils with high saturated hydraulic conductivities (Maier et al., 2021) and a small water-holding capacity (Hartmann et al., 2020b). The disruption of the soil surface structure due to irrigation and the wash-in of released fine particles can lead to clogging of near-surface pores (Assouline, 2004), which results in a reduction in near-surface porosity and unsaturated hydraulic conductivity (Armenise et al., 2018). This phenomenon was also suggested by Maier and van Meerveld (2021) during large-scale sprinkling experiments at the same moraines. The high vegetation cover at the other plots likely protected the soil surface from the impact of the irrigation, and a homogeneous and deep infiltration was observed (Fig. 4).
The pore space of coarse-textured, unsorted, sandy soil is mainly made out of large pores, which provide only a low water retention capacity and lead mostly to a fast downward transport of water (Hartmann et al., 2020b). The root system has a low density (Table 1, Greinwald et al., 2021a) at the early stages of vegetation succession and does not impact the water transport. The sparse vegetation cover also does not inhibit infiltration, and the water can infiltrate deep into the soil. Only larger stones and occasional clay lenses (the size of a few centimeters) or other material heterogeneities create heterogeneous matrix flow.
At the two oldest moraines, the vegetation cover was dense and probably has a high interception storage capacity (albeit reduced by vegetation trimming). The fine textured soil with a higher porosity (and higher proportion of fine pores) and lower bulk density has a higher water retention capacity than the two young moraines. The soil is heterogeneous, with a higher organic matter content in the upper layer and depth gradients in porosity (decreasing) and bulk density (increasing) (Hartmann et al., 2020b). The root system is dense, with most of the root mass (>90 %) located in the uppermost 30 cm (Greinwald et al., 2021a). At both moraines, deep infiltration, almost no surface runoff, and no subsurface lateral flow were observed. The image analysis has shown that finger-shaped flow dominates (Fig. 10), with fingers already induced at the soil surface or within the upper 20 cm. Thus, water infiltrated heterogeneously, and/or the water transport pattern was affected by properties of the soil surface or of the upper soil layer.
Heterogeneous infiltration patterns under grass cover causing finger-shaped flow with large parts of dry soil were also observed by de Jonge et al. (2009), who found water repellency to be the main cause for this flow pattern. The hydrophobicity index (HI) at each moraine was measured by Maier and van Meerveld (2021). The mean HI at the youngest moraine is small (HI < 2) and increases continuously with age (4.9 ka: mean HI = 5.05; 13.5 ka: mean HI = 9.36). The fraction of preferential flow paths in the top 20 cm, however, was highest at the 4.9 ka moraine (Fig. 10). Inaccuracies in the comparison of HI with our results can arise from the dependency of soil hydrophobicity on soil moisture (de Jonge et al., 2009) and the fact that HI was measured outside the experimental plots on different days than the irrigation experiments (likely different antecedent soil moisture). Water repellency is also positively correlated with the organic matter content (de Jonge et al., 2009; Mataix-Solera and Doerr, 2004) and is also higher when the organic matter is made up of complex compounds (Mainwaring et al., 2004).
Hartmann et al. (2020b) found a slightly higher organic matter content in the top 20 cm at the 4.9 ka moraine compared to the 13.5 ka moraine, which corresponds with the higher fraction of finger-shaped flow at the 4.9 ka moraine. Hydrophobic organic compounds are also released by root activities (Doerr et al., 1998). We observed a significant correlation between the increase in preferential flow paths in the upper 20 cm and root length density and the above-ground biomass. The connection of preferential flow paths and RLD is probably also attributed to the fact that roots form channels, which improve infiltration (Zhang et al., 2015). The strong correlation with above-ground biomass but less correlation with vegetation cover is more difficult to explain and likely depends on the vegetation species. The vegetation cover at the 13.5 ka moraine was mainly composed of dense grass vegetation, while at the 4.9 ka moraine, shrubs were also occasionally present, which, on the one hand, produces more biomass but also forms a root system with a higher quantity of longer roots with larger diameters, which enhances infiltration locally.
Soil layering with layers of fine texture above coarse texture are known to facilitate the formation of finger-shaped flow (Morales et al., 2010). In such layered soils, homogeneous infiltration fronts become unstable and break into finger-shaped flow at the material boundaries (Starr et al., 1978; Hendrickx and Flury, 2001; Wang et al., 2018). At our sites, weathering and organic matter accumulation formed a surface layer with a finer grain size and higher water retention than the unweathered and coarser soil below, which is clearly pronounced at the 4.9 and 13.5 ka moraines (Hartmann et al., 2020b). Material heterogeneities, such as gravel and sand patches, were also observed and likely facilitated the formation of finger-shaped flow paths.
Despite the almost 10 000 year age difference between the 13.5 and the 4.9 ka moraine, the 4.9 ka moraine shows a higher proportion of preferential flow paths in the upper 20 cm, which is also associated with a higher proportion of BM, RLD, and vegetation cover. In addition, the clay content, organic matter, and porosity are also higher at the 4.9 ka moraine (Hartmann et al., 2020b). This discontinuous trend raises concerns that the two moraines do not fall within the chronosequence approach assumptions that time is the only variable during landscape development. Thus it cannot be excluded that, for example, different initial site conditions, climate boundary conditions, or/and geomorphological disturbances could have led to different rates of change (Wojcik et al., 2021) in the topsoil.
Compared to the results described by Hartmann et al. (2020a) for soils developed from siliceous glacial till under similar climatic conditions, we found distinct differences in the flow path evolution at this calcareous forefield. While the flow path development was nearly identical in the first 5 000 years in both geologies, it differs distinctly after 10 thousand years of landscape development. In both geologies, the flow paths developed from a more or less homogeneous to heterogeneous matrix flow at 160 years to finger-shaped flow after 5 000 years. After more than 10 000 years of landscape development, subsurface hydrology at the calcareous geology is ruled by finger-shaped flow and deep infiltration, whereas at the siliceous geology, storage capacity in the top soil strongly increased, with a corresponding reduction in infiltration depths and a shift to macropore flow.
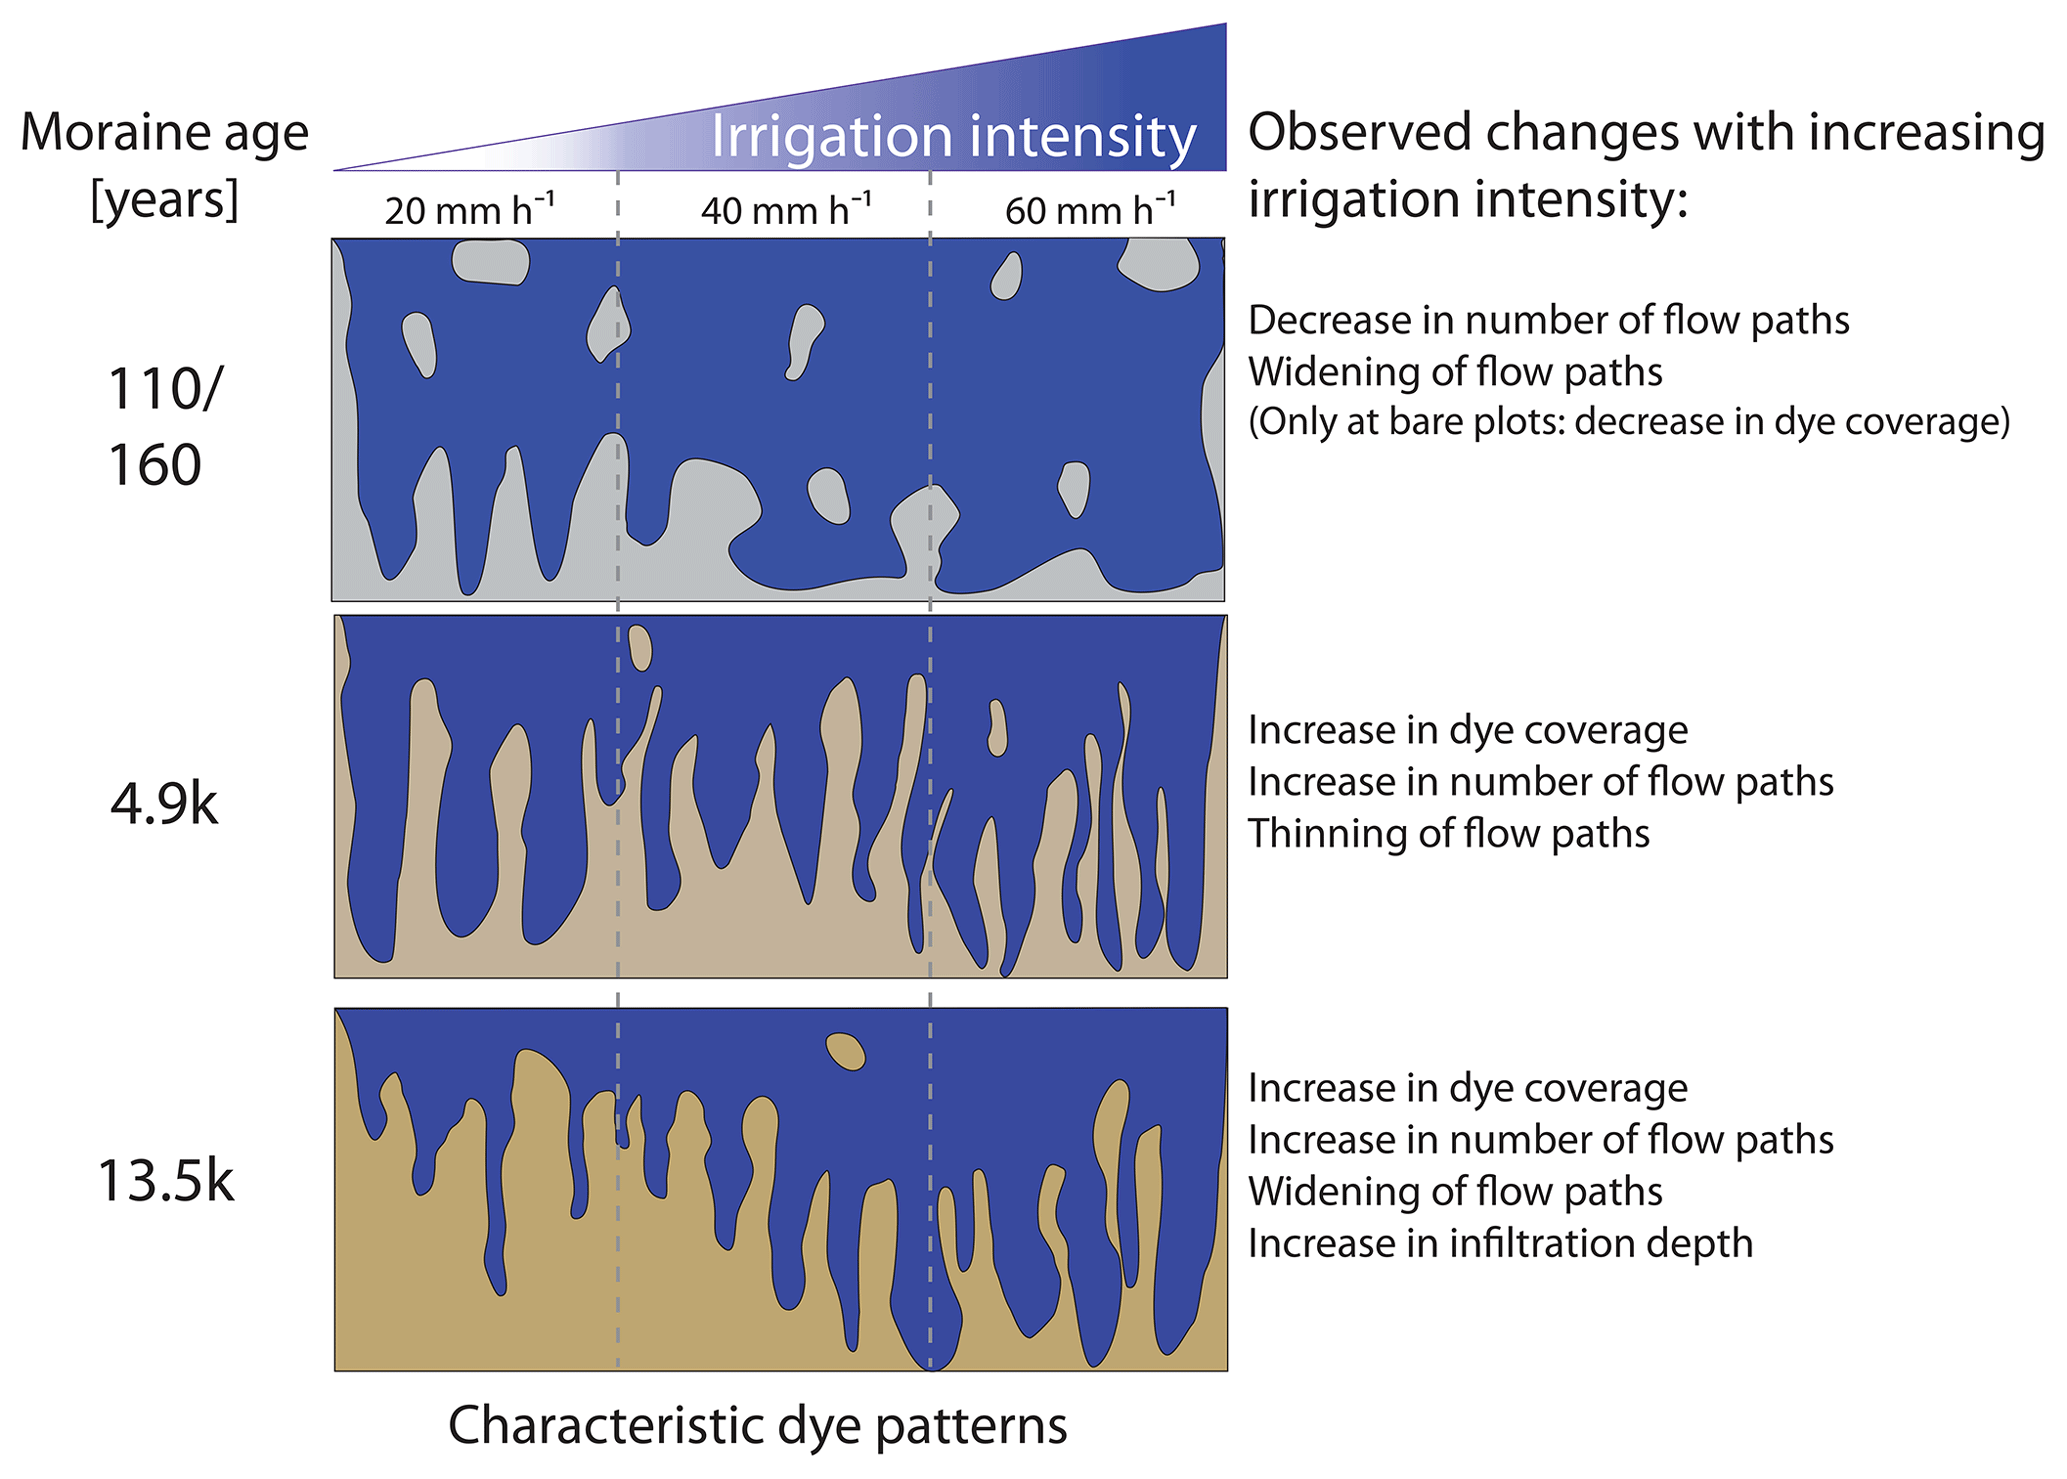
Figure 13Characteristic dye patterns and observed changes with increasing irrigation intensity at the four age classes.
4.2 Impact of irrigation intensity
Studying the impact of irrigation intensities on subsurface flow paths is often hampered by the influence of different initial and boundary conditions (e.g., Wu et al., 2015; Cichota et al., 2016). Our study was specifically designed to minimize these effects by dividing the irrigation plots into three adjacent subplots. This allows for the assumption that the initial and boundary conditions (excluding the controlled irrigation intensity) of the subplots per plot were almost identical. From the end of July to the beginning of September 2019, we measured a precipitation amount of 360 mm at the glacier forefield. Matric potentials, measured by tensiometers in 10, 30 , and 50 cm at the 160 a, 4.9 , and 13.5 ka moraines, never dropped below field capacity. Thus, the initial soil moisture was consistently high across the irrigation experiments at all age classes.
The observed changes in dye patterns and flow paths with increasing irrigation intensity at the four age classes are schematically summarized in Fig. 13. At the young moraines, we observed an increase in the frequency of matrix flow at greater depths with increasing irrigation intensity, which is evidenced by an increase in the SPW > 200 mm with a simultaneous decrease in the median dye coverage and a decrease in the number of flow paths (SAD) (Fig. 5e). The decrease in median dye coverage with increasing intensity is particularly pronounced at the four bare plots of these young moraines (data not shown). No clear trend can be seen at the two plots with a higher vegetation cover. However, the decrease in SAD and the increase in stained path widths indicates that water flow paths that reach greater depths tend to widen and to merge with increasing irrigation intensity. This process might be facilitated by higher water contents at greater depths or by a change in material properties.
At the 4.9 ka moraine, however, we observed an increase in dye coverage (Fig. 5a) and an increase in the number of flow paths (Fig. 5e). The proportion of 20 < SPW < 200 mm increases (Fig. 5c), and the proportion of SPW > 200 mm decreases (Fig. 5d), which then leads to an increase in the frequency of finger-shaped flow paths in the flow type classification (Fig. 10b2 to b4). At the 13.5 ka moraine, we observed an increase in dye coverage (Fig. 5a), an increase in infiltration depth (Fig. 3), a broadening of the flow paths (Fig. 5c and d), and an increase in the number of flow paths (Figs. 5e and 6) with increasing irrigation intensity. Different from the 4.9 ka moraine, the increase in the proportion of SPW > 200 mm on the dye coverage leads to a transition to more matrix flow (Fig. 10) in the flow type classification.
The impact of irrigation intensity on water flow paths is slightly obscured by the process of flow type classification, as it is only based on the occurrence of the three SPW classes as fractions of the dye coverage (Weiler, 2001). The number of flow paths or the dye coverage itself are not taken into account. We observed at both age classes that, with increasing irrigation intensity, more fingers are generated, and more soil space is used for water transport (Fig. 5).
The formation of finger-shaped flow paths and their properties – such as number, flow velocity, or width – are also in a complex interplay with the surrounding soil moisture, flux, and soil properties. Studies focusing on the formation of finger-shaped flow paths found the finger width to be influenced not only by soil properties and initial and boundary conditions (Glass et al., 1989) but also by the flow rate through the finger (Parlange and Hill, 1976; White et al., 1976), with higher flow rates leading to an increase in finger width. This was also observed by Ma et al. (2008), who also found a positive correlation between rainfall intensity, time of finger flow occurrence, and mean velocity. The increase in mean velocity of the fingers leads to a faster downward transport and thus deeper infiltration depths with higher irrigation intensities (Cremer et al., 2017). An increase in the number of fingers with higher fluxes was also observed (Sililo and Tellam, 2000). These findings by other studies are similar to our observations at the 13.5 ka moraine. It is unclear what causes the different observations in the dominant flow path widths at the 4.9 and 13.5 ka moraines. We can only speculate whether the higher organic matter content, the higher root density, or soil properties such as the lower hydraulic conductivities and higher porosity play a role in producing narrower flow paths with increasing irrigation intensity at the 4.9 ka moraine.
4.3 Uncertainties
Apart from the reduced sample size at plot 1 at the 110 a moraine and the uncertainties due to large boulders at the 160 a and 4.9 ka moraines, some further uncertainties need to be mentioned. In general, the dark gray soil color at the 110 and 160 a moraines made the color detection of the tracer difficult. In addition, at plot 3 of the 110 a moraine, a setup of suitable lighting conditions was difficult due to stormy weather conditions. As a result, the lighting of the photographs was very unfavorable for the image analysis. Even during the profile excavation in the field, it was not possible to determine with great certainty whether the dark-colored, wet soil was stained or not. Thus, blue stains on larger stones along the profile depth were considered as an indicator for the validity of the observed dye tracer pattern, which shows an almost complete coloring of the soil (Fig. 4).
We further assume that the irrigation with the hand-operated sprayer, which had to be held close to the soil surface due to strong winds, sometimes led to a high force of application and promoted structural sealing at the bare plots of the 110 and 160 a moraines. At both moraines, deep infiltration was often found at the boundaries of the bare plots. Since the plot boundaries were not irrigated, they were also not affected by structural sealing. Water running off to the sides infiltrated deep into the soil. This observation suggests that a more homogeneous and deep transport of the water can take place in this quite homogeneous and unsorted material (Hartmann et al., 2020b) if the surface is not influenced by particle displacement. Thus, it is assumed that the proportion of preferential flow paths at the young moraines is generally overestimated, and homogeneous to heterogeneous matrix flow with deep infiltration are probably the dominant flow types under natural rainfall conditions. As the plot boundaries (outer boundaries and boundaries of neighboring subplots) are excluded from the image analysis to avoid edge effects, the deep percolation observed here could not be accounted for in our quantitative analysis.
Based on Brilliant Blue dye experiments in a glacial chronosequence on calcareous parent material, we found that subsurface flow paths change with age: from homogeneous, gravity-driven matrix flow in sandy, coarse-grained, loose soils with low root density at the young moraines to a heterogeneous matrix flow and finger-shaped flow paths in silty, layered soils with dense vegetation cover and high root density at the old moraines. The occurrence of preferential flow paths increases with soil age, but as it appears mainly in the form of finger-shaped flow paths, it is mainly controlled by soil surface characteristics (organic matter content, soil texture, soil layering) and vegetation characteristics (RLD, hydrophobicity, BM). We also found an increase in the number of preferential flow paths with increasing irrigation intensity at the two old moraines, which leads to an increase in soil space used for water transport and thus efficient infiltration preventing surface runoff, even at high intensities. When infiltration was not impaired by structural sealing, water percolated deep into the soil (>1 m) at all four age classes. The observed finger-shaped flow paths and deep drainage, even after more than 10 000 years of landscape development, contrasts with the observed high storage capacity, reduced infiltration, and occasional macropore flow in a moraine on siliceous parent material of the same age (Hartmann et al., 2020a). The observed differences in flow path evolution in these two different geologies under nearly identical climate conditions emphasizes the important role of the parent material in landscape evolution.
Our findings deliver important insights on how landscape evolution affects hydrological processes in transient alpine landscapes, where glacial retreat is accelerating and thus more and more hillslopes are freed of ice and weathering, erosion, and plant succession are initiated. Our study made it clear that, due to the complexity of landscape development, time should not be regarded as the only primary evolutionary factor. The geology and the resulting landscape properties (e.g., soil structure and texture, vegetation, organic matter content) have a primary impact on the development of subsurface hydrological flow paths. The type of hydrological flow paths significantly influences the redistribution of solid and solutes and thus also affects landscape development. The feedback between soil hydraulic process and soil structure is an important aspect that needs to be included in SLEMs. Therefore, it is necessary to intensify studies on the main influencing factors (e.g., soil properties, vegetation characteristics) on preferential flow path formation. The data and observations provided here can thus help to improve the handling of hydrologic processes and their role within the feedback cycle of the hydro-pedo-geomorphological system when it comes to soil and landscape evolution modeling.
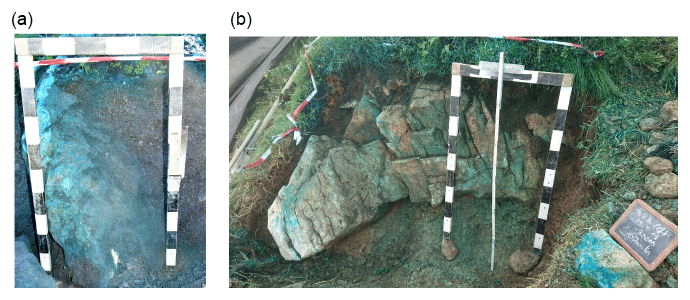
Figure A1Hidden boulders at the 160 a (a) and 4.9 ka (b) moraine. The boulder occupied most of the cross section of the subplot irrigated with 40 mm h−1 at plot 1 of the 160 a and most of the cross section of plot 2 at the 4.9 ka moraine. Due to this strong disturbance, the corresponding plot and subplot were neglected in the further analyses. The length of one black or white scale segment of the wooden frame equals 10 cm.
Table A1Relative frequencies of flow type occurrence for the profile depth of 100 cm. Left: listed for each age class. Right: differentiated by irrigation intensity for each age class.
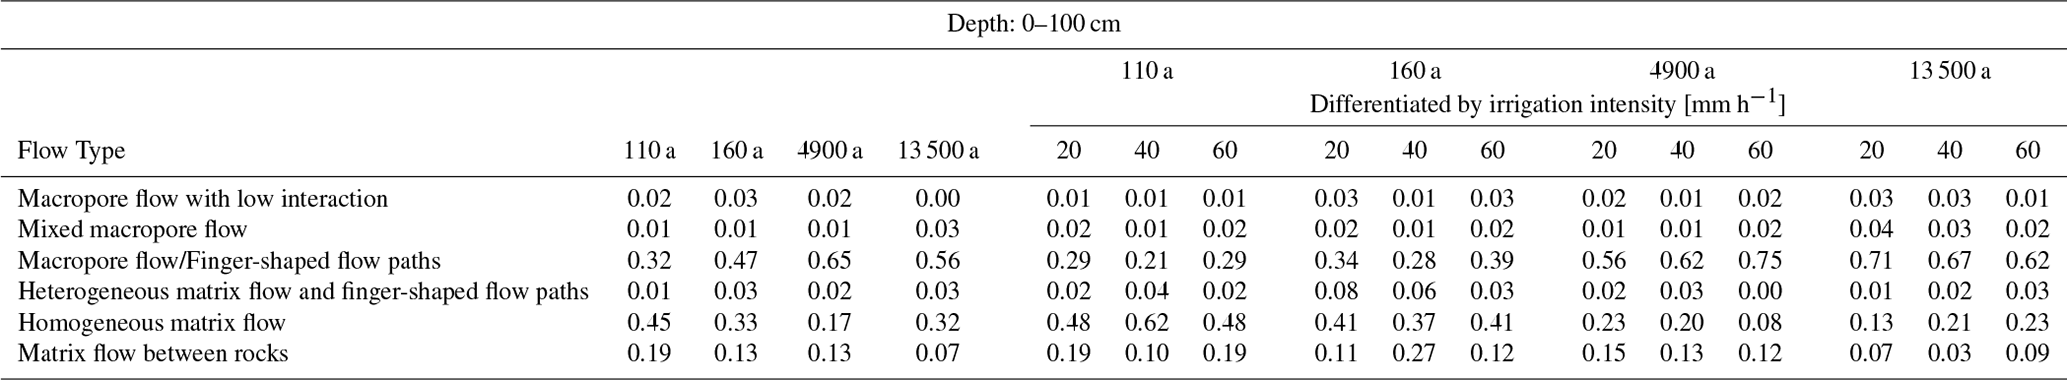
Table A2Relative frequencies of flow type occurrence in the depth segments of 0–20, 20–40, 40–60, and 60–100 cm. Left: listed for each age class. Right: differentiated by irrigation intensity for each age class.
The soil structure and texture data are described in detail in Hartmann et al. (2020b). It is available at the online repository of the German Research Centre for Geosciences (GFZ, Hartmann et al., 2020c) and can be accessed via the https://doi.org/10.5880/GFZ.4.4.2020.004. The Brilliant Blue images can be obtained from the authors upon request.
AH conducted the tracer experiments, soil sampling, and the laboratory analysis. KG provided information on site and vegetation characteristics. AH prepared the images and performed the analyses in discussion with TB. MW and TB were involved in planning the fieldwork. AH prepared the manuscript with contributions from all co-authors.
At least one of the (co-)authors is a member of the editorial board of Hydrology and Earth System Sciences. The peer-review process was guided by an independent editor, and the authors also have no other competing interests to declare.
Publisher's note: Copernicus Publications remains neutral with regard to jurisdictional claims in published maps and institutional affiliations.
We thank Nina Zahn, Wibke Richter, Louisa Kanis, Peter Grosse, and Carlo Seehaus for their persevering assistance in the field. We also thank the Canton Uri, the community Unterschächen, and Korporation Uri for permission to conduct the experiments. Many thanks to Christine, Franz, and Matthias Stadler at Chammlialp for their support and kind hospitality. The authors are very grateful to John R. Nimmo and an anonymous reviewer for their critical reading, valuable comments, and suggestions for improving the manuscript.
This research has been supported by the German Research Foundation (DFG) and the Swiss National Science Foundation (SNF) within the DFG-SNF project HILLSCAPE (Hillslope Chronosequence and Process Evolution), grant no. BL 1184/4-1.
The article processing charges for this open-access publication were covered by the Helmholtz Centre Potsdam – GFZ German Research Centre for Geosciences.
This paper was edited by Genevieve Ali and reviewed by John R. Nimmo and one anonymous referee.
Armenise, E., Simmons, R. W., Ahn, S., Garbout, A., Doerr, S. H., Mooney, S. J., Sturrock, C. J., and Ritz, K.: Soil seal development under simulated rainfall: Structural, physical and hydrological dynamics, J. Hydrol., 556, 211–219, https://doi.org/10.1016/j.jhydrol.2017.10.073, 2018. a
Assouline, S.: Rainfall-induced soil surface sealing: A critical review of observations, conceptual models, and solutions, Vadose Zone J., 3, 570–591, https://doi.org/10.2113/3.2.570, 2004. a
Bachmair, S., Weiler, M., and Nützmann, G.: Controls of land use and soil structure on water movement: Lessons for pollutant transfer through the unsaturated zone, J. Hydrol., 369, 241–252, https://doi.org/10.1016/j.jhydrol.2009.02.031, 2009. a
Beerten, K., Deforce, K., and Mallants, D.: Landscape evolution and changes in soil hydraulic properties at the decadal, centennial and millennial scale: A case study from the Campine area, northern Belgium, Catena, 95, 73–84, https://doi.org/10.1016/j.catena.2012.03.005, 2012. a, b
Brooks, S. M. and Richards, K. S.: Establishing the role of pedogenesis in changing soil hydraulic properties, Earth Surf. Proc. Land., 18, 573–578, https://doi.org/10.1002/esp.3290180609, 1993. a
Cichota, R., Kelliher, F., Thomas, S., Clemens, G., Fraser, P., and Carrick, S.: Effects of irrigation intensity on preferential solute transport in a stony soil, N. Zeal. J. Agricult. Res., 59, 141–155, https://doi.org/10.1080/00288233.2016.1155631, 2016. a, b
Cremer, C., Schuetz, C., Neuweiler, I., Lehmann, P., and Lehmann, E.: Unstable Infiltration Experiments in Dry Porous Media, Vadose Zone J., 16, vzj2016.10.0092, https://doi.org/10.2136/vzj2016.10.0092, 2017. a
Cui, L., Li, G., Chen, Y., and Li, L.: Response of Landscape Evolution to Human Disturbances in the Coastal Wetlands in Northern Jiangsu Province, China, Remote Sens., 13, 2030, https://doi.org/10.3390/rs13112030, 2021. a
D'Amico, M. E., Freppaz, M., Filippa, G., and Zanini, E.: Vegetation influence on soil formation rate in a proglacial chronosequence (Lys Glacier, NW Italian Alps), Catena, 113, 122–137, https://doi.org/10.1016/j.catena.2013.10.001, 2014. a
de Jonge, L. W., Moldrup, P., and Schjønning, P.: Soil Infrastructure, Interfaces & Translocation Processes in Inner Space (“Soil-it-is”): towards a road map for the constraints and crossroads of soil architecture and biophysical processes, Hydrol. Earth Syst. Sci., 13, 1485–1502, https://doi.org/10.5194/hess-13-1485-2009, 2009. a, b, c
Demand, D., Blume, T., and Weiler, M.: Spatio-temporal relevance and controls of preferential flow at the landscape scale, Hydrol. Earth Syst. Sci., 23, 4869–4889, https://doi.org/10.5194/hess-23-4869-2019, 2019. a
Doerr, S., Shakesby, R., and Walsh, R.: Spatial Variability of Soil Hydrophobicity in Fire-Prone Eucalyptus and Pine Forests, Portugal, Soil Sci., 163, 313–324, https://doi.org/10.1097/00010694-199804000-00006, 1998. a
Dümig, A., Smittenberg, R., and Kögel-Knabner, I.: Concurrent evolution of organic and mineral components during initial soil development after retreat of the Damma glacier, Switzerland, Geoderma, 163, 83–94, https://doi.org/10.1016/j.geoderma.2011.04.006, 2011. a
Egli, M., Mavris, C., Mirabella, A., and Giaccai, D.: Soil organic matter formation along a chronosequence in the Morteratsch proglacial area (Upper Engadine, Switzerland), Catena, 82, 61–69, https://doi.org/10.1016/j.catena.2010.05.001, 2010. a
Ehrlich, W., Rice, H., and Ellis, J.: Influence of the Composition of Parent Materials on Soil Formation in Manitoba, Can. J. Agricult. Sci., 35, 407–421, 1955. a
Frey, F.: Geologie der östlichen Claridenkette, PhD thesis, ETH Zurich, Zurich, https://doi.org/10.3929/ethz-a-000088454, 1965. a
Fukutome, S., Schindler, A., and Capobianco, A.: MeteoSwiss extreme value analyses: User manual and documentation, 2nd Edn., Technical Report, MeteoSwiss, 255 pp. https://www.meteoschweiz.admin.ch/home/service-und-publikationen/publikationen.subpage.html/de/data/publications a
Glass, R., Parlange, J.-Y., and Steenhuis, T.: Wetting front instability I: Theoretical discussion and dimensional analysis, Water Resour. Res., 25, 1187–1194, https://doi.org/10.1029/WR025i006p01187, 1989. a
Greinwald, K., Dieckmann, L. A., Schipplick, C., Hartmann, A., Scherer-Lorenzen, M., and Gebauer, T.: Vertical root distribution and biomass allocation along proglacial chronosequences in Central Switzerland, Arct. Antarct. Alp. Res., 53, 20–34, https://doi.org/10.1080/15230430.2020.1859720, 2021a. a, b, c
Greinwald, K., Gebauer, T., Musso, A., and Scherer-Lorenzen, M.: Similar successional development of functional community structure in glacier forelands despite contrasting bedrocks, J. Veg. Sci., 32, e12993, https://doi.org/10.1111/jvs.12993, 2021b. a, b
Greinwald, K., Gebauer, T., Treuter, L., Kolodziej, V., Musso, A., Maier, F., Lustenberger, F., and Scherer-Lorenzen, M.: Root density drives aggregate stability of soils of different moraine ages in the Swiss Alps, Plant Soil, 468, 439–457, https://doi.org/10.1007/s11104-021-05111-8, 2021c. a
Hartmann, A., Semenova, E., Weiler, M., and Blume, T.: Field observations of soil hydrological flow path evolution over 10 millennia, Hydrol. Earth Syst. Sci., 24, 3271–3288, https://doi.org/10.5194/hess-24-3271-2020, 2020a. a, b, c, d, e, f
Hartmann, A., Weiler, M., and Blume, T.: The impact of landscape evolution on soil physics: evolution of soil physical and hydraulic properties along two chronosequences of proglacial moraines, Earth Syst. Sci. Data, 12, 3189–3204, https://doi.org/10.5194/essd-12-3189-2020, 2020b. a, b, c, d, e, f, g, h, i
Hartmann, A., Weiler, M., and Blume, T.: Soil physical and hydraulic properties along two chronosequences of proglacial moraines, GFZ Data Services [data set], https://doi.org/10.5880/GFZ.4.4.2020.004, 2020c. a
He, L. and Tang, Y.: Soil development along primary succession sequences on moraines of Hailuogou Glacier, Gongga Mountain, Sichuan, China, Catena, 72, 259–269, https://doi.org/10.1016/j.catena.2007.05.010, 2008. a
Hendrickx, J. M. H. and Flury, M.: Uniform and Preferential Flow Mechanisms in the Vadose Zone, in: Conceptual Models of Flow and Transport in the Fractured Vadose Zone, National Research Council, National Academy Press, Washington, DC, 149–187, https://nap.nationalacademies.org/catalog/10102/conceptual-models-of-flow-and-transport-in-the-fractured (last access: 8 November 2021), 2001. a, b, c
Hervé, M.: RVAideMemoire: testing and plotting procedures for biostatistics, R package version 0.9-69, CRAN [code], https://CRAN.R-project.org/package=RVAideMemoire (last access: 21 September 2021), 2018. a
Hopkins, B. and Ellsworth, J.: Phosphorus availability with alkaline/calcareous soil Western Nutrient Salt, in: Proceeding of 6th Western Nutrient Management Conference, 3–5 March 2005, Lake City, UT, 88–93, 2005. a
Keith, A., Henrys, P., Rowe, R., and Mcnamara, N.: Technical note: A bootstrapped LOESS regression approach for comparing soil depth profiles, Biogeosciences, 13, 3863–3868, https://doi.org/10.5194/bg-13-3863-2016, 2016. a, b, c, d
Koestel, J. and Jorda, H.: What determines the strength of preferential transport in undisturbed soil under steady-state flow?, Geoderma, 217-218, 144–160, https://doi.org/10.1016/j.geoderma.2013.11.009, 2014. a
Lin, H.: Hydropedology: Bridging Disciplines, Scales, and Data, Vadose Zone J., 2, 1–11, https://doi.org/10.2113/2.1.1, 2003. a
Lin, H. and Zhou, X.: Evidence of subsurface preferential flow using soil hydrologic monitoring in the Shale Hills catchment, Eur. J. Soil Sci., 59, 34–49, https://doi.org/10.1111/j.1365-2389.2007.00988.x, 2008. a
Lohse, K. A. and Dietrich, W. E.: Contrasting effects of soil development on hydrological properties and flow paths, Water Resour. Res., 41, W12419, https://doi.org/10.1029/2004WR003403, 2005. a
Ma, K.-C., Tan, Y.-C., and Chen, C.-H.: Effect of hysteresis and rainfall intensity on finger dynamics, Irrig. Drain., 57, 585–602, https://doi.org/10.1002/ird.388, 2008. a
Maier, F. and van Meerveld, I.: Long-Term Changes in Runoff Generation Mechanisms for Two Proglacial Areas in the Swiss Alps I: Overland Flow, Water Resour. Res., 57, e2021WR030221, https://doi.org/10.1029/2021WR030221, 2021. a, b
Maier, F., van Meerveld, I., Greinwald, K., Gebauer, T., Lustenberger, F., Hartmann, A., and Musso, A.: Effects of soil and vegetation development on surface hydrological properties of moraines in the Swiss Alps, Catena, 187, 104353, https://doi.org/10.1016/j.catena.2019.104353, 2020. a
Maier, F., van Meerveld, I., and Weiler, M.: Long-Term Changes in Runoff Generation Mechanisms for Two Proglacial Areas in the Swiss Alps II: Subsurface Flow, Water Resour. Res., 57, e2021 WR030223, https://doi.org/10.1029/2021WR030223, 2021. a
Mainwaring, K. A., Morley, C. P., Doerr, S. H., Douglas, P., Llewellyn, C. T., Llewellyn, G., Matthews, I., and Stein, B. K.: Role of heavy polar organic compounds for water repellency of sandy soils, Environ. Chem. Lett., 2, 35–39, https://doi.org/10.1007/s10311-004-0064-9, 2004. a
Mangiafico, S. S.: Summary and Analysis of Extension Program Evaluation in R, version 1.19.10. rcompanion.org/handbook/, http://rcompanion.org/documents/RHandbookProgramEvaluation.pdf (last access: 25 September 2021), 2016. a
Mataix-Solera, J. and Doerr, S.: Hydrophobicity and aggregate stability in calcareous topsoils from fire-affected pine forests in southeastern Spain, Geoderma, 118, 77–88, https://doi.org/10.1016/S0016-7061(03)00185-X, 2004. a
MeteoSwiss: Climate normals Grimsel Hospiz Reference period 1981–2010, Federal Office of Meteorology and Climatology MeteoSwiss, https://www.meteoswiss.admin.ch/product/output/climate-data/climate-diagrams-normal-values-station-processing/GRH/climsheet_GRH_np8110_e.pdf (last access: 8 July 2021), 2020. a
Michalet, R., Gandoy, C., Joud, D., Pagès, J.-P., and Choler, P.: Plant Community Composition and Biomass on Calcareous and Siliceous Substrates in the Northern French Alps: Comparative Effects of Soil Chemistry and Water Status, Arct. Antarct. Alp. Res., 34, 102–113, https://doi.org/10.1080/15230430.2002.12003474, 2002. a, b
Montagne, D. and Cornu, S.: Do we need to include soil evolution module in models for prediction of future climate change?, Climatic Change, 98, 75–86, https://doi.org/10.1007/s10584-009-9666-3, 2010. a
Morales, V. L., Parlange, J.-Y., and Steenhuis, T. S.: Are preferential flow paths perpetuated by microbial activity in the soil matrix? A review, J. Hydrol., 393, 29–36, https://doi.org/10.1016/j.jhydrol.2009.12.048, 2010. a
Musso, A., Lamorski, K., Sławiński, C., Geitner, C., Hunt, A., Greinwald, K., and Egli, M.: Evolution of soil pores and their characteristics in a siliceous and calcareous proglacial area, Catena, 182, 104154, https://doi.org/10.1016/j.catena.2019.104154, 2019. a, b, c, d, e
Musso, A., Tikhomirov, D., Plötze, M. L., Greinwald, K., Hartmann, A., Geitner, C., Maier, F., Petibon, F., and Egli, M.: Soil Formation and Mass Redistribution during the Holocene Using Meteoric 10Be, Soil Chemistry and Mineralogy, Geosciences, 12, 99, https://doi.org/10.3390/geosciences12020099, 2022. a
Newman, S., Osborne, T. Z., Hagerthey, S. E., Saunders, C., Rutchey, K., Schall, T., and Reddy, K. R.: Drivers of landscape evolution: multiple regimes and their influence on carbon sequestration in a sub-tropical peatland, Ecol. Monogr., 87, 578–599, https://doi.org/10.1002/ecm.1269, 2017. a
Nimmo, J. R.: The processes of preferential flow in the unsaturated zone, Soil Sci. Soc. Am. J., 85, 1–27, https://doi.org/10.1002/saj2.20143, 2021. a, b
Parlange, J. Y. and Hill, D. E.: Theoretical analysis of wetting front instability in soils, Soil Sci., 122, 236–239, https://doi.org/10.1097/00010694-197610000-00008, 1976. a
Phillips, J. D.: The robustness of chronosequences, Ecol. Model., 298, 16–23, https://doi.org/10.1016/j.ecolmodel.2013.12.018, 2015. a
R Core Team: R: A Language and Environment for Statistical Computing, R Foundation for Statistical Computing, Vienna, Austria, https://www.R-project.org/ (last access: 9 February 2022), 2017. a
Retzer, J. L.: Soil Development in the Rocky Mountains, Soil Sci. Soc. Am. J., 13, 446–448, https://doi.org/10.2136/sssaj1949.036159950013000C0080x, 1949. a
Samouëlian, A., Finke, P., Goddéris, Y., and Cornu, S.: Hydropedology: Synergistic Integration of Soil Science and Hydrology, in: chap. Hydrologic information in pedologic models, edited by: Lin, H., Academic Press, Elsevier B.V., 595–636, ISBN 9780123869418, 2012. a
Sauer, D., Finke, P., Sørensen, R., Sperstad, R., Schülli-Maurer, I., Høeg, H., and Stahr, K.: Testing a soil development model against southern Norway soil chronosequences, Quatern. Int., 265, 18–31, https://doi.org/10.1016/j.quaint.2011.12.018, 2012. a
Sauer, D., Schülli-Maurer, I., Wagner, S., Scarciglia, F., Sperstad, R., Svendgård-Stokke, S., Sørensen, R., and Schellmann, G.: Soil development over millennial timescales - A comparison of soil chronosequences of different climates and lithologies, IOP Conf. Ser. Earth Environ. Sci., 25, 012009, https://doi.org/10.1088/1755-1315/25/1/012009, 2015. a
Sililo, O. T. and Tellam, J. H.: Fingering in Unsaturated Zone Flow: A Qualitative Review with Laboratory Experiments on Heterogeneous Systems, Groundwater, 38, 864–871, https://doi.org/10.1111/j.1745-6584.2000.tb00685.x, 2000. a
Starr, J. L., DeRoo, H. C., Frink, C. R., and Parlange, J.-Y.: Leaching Characteristics of a Layered Field Soil, Soil Sci. Soc. Am. J., 42, 386–391, https://doi.org/10.2136/sssaj1978.03615995004200030002x, 1978. a
Taalab, A., Ageeb, G., Siam, H. S., and Mahmoud, S. A.: Some Characteristics of Calcareous soils. A review, Mid. East J. Agricult. Res., 8, 96–105, 2019. a, b
van der Meij, W., Temme, A., Lin, H., Gerke, H., and Sommer, M.: On the role of hydrologic processes in soil and landscape evolution modeling: concepts, complications and partial solutions, Earth-Sci. Rev., 185, 1088–1106, https://doi.org/10.1016/j.earscirev.2018.09.001, 2018. a, b, c
Vilmundardóttir, O. K., Gísladóttir, G., and Lal, R.: Early stage development of selected soil properties along the proglacial moraines of Skaftafellsjökull glacier, SE-Iceland, Catena, 121, 142–150, https://doi.org/10.1016/j.catena.2014.04.020, 2014. a
Wang, Y., Li, Y., Wang, X., and Chau, H. W.: Finger Flow Development in Layered Water-Repellent Soils, Vadose Zone J., 17, 170171, https://doi.org/10.2136/vzj2017.09.0171, 2018. a
Weiler, M.: Mechanisms controlling macropore flow during infiltration dye tracer experiments and simulations, PhD thesis, Swiss Federal Institute of Technology Zurich, Zurich, https://doi.org/10.3929/ethz-a-004180115, 2001. a, b
Weiler, M. and Flühler, H.: Inferring flow types from dye patterns in macroporous soils, Geoderma, 120, 137–153, https://doi.org/10.1016/j.geoderma.2003.08.014, 2004. a, b, c
White, A. F. and Blum, A. E.: Effects of climate on chemical weathering in watersheds, Geochim. Cosmochim. Ac., 59, 1729–1747, https://doi.org/10.1016/0016-7037(95)00078-E, 1995. a
White, I., Colombera, P. M., and Philip, J. R.: Experimental Study of Wetting Front Instability Induced by Sudden Change of Pressure Gradient, Soil Sci. Soc. Am. J., 40, 824–829, https://doi.org/10.2136/sssaj1976.03615995004000060012x, 1976. a
Wickham, H.: ggplot2: Elegant Graphics for Data Analysis, Springer-Verlag, New York, 213 pp., https://doi.org/10.1007/978-0-387-98141-3, 2016. a
Wiekenkamp, I., Huisman, J., Bogena, H., Lin, H., and Vereecken, H.: Spatial and temporal occurrence of preferential flow in a forested headwater catchment, J. Hydrol, 534, 139–149, https://doi.org/10.1016/j.jhydrol.2015.12.050, 2016. a, b
Wojcik, R., Eichel, J., Bradley, J. A., and Benning, L. G.: How allogenic factors affect succession in glacier forefields, Earth-Sci. Rev., 218, 103642, https://doi.org/10.1016/j.earscirev.2021.103642, 2021. a, b
Wu, Q., Liu, C., Lin, W., Zhang, M., Wang, G., and Zhang, F.: Quantifying the preferential flow by dye tracer in the North China Plain, J. Earth Sci., 26, 435–444, https://doi.org/10.1007/s12583-014-0489-4, 2015. a, b
Yoshida, T. and Troch, P. A.: Coevolution of volcanic catchments in Japan, Hydrol. Earth Syst. Sci., 20, 1133–1150, https://doi.org/10.5194/hess-20-1133-2016, 2016. a
Zhang, Y., Niu, J., Yu, X., Zhu, W., and Du, X.: Effects of fine root length density and root biomass on soil preferential flow in forest ecosystems, Forest Syst., 24, e012, https://doi.org/10.5424/fs/2015241-06048, 2015. a