the Creative Commons Attribution 4.0 License.
the Creative Commons Attribution 4.0 License.
 | 06 Oct 2022
The relative importance of antecedent soil moisture and precipitation in flood generation in the middle and lower Yangtze River basin
Qihua Ran
Jin Wang
Xiuxiu Chen
Lin Liu
Sheng Ye
Floods have caused severe environmental and socioeconomic losses worldwide in human history and are projected to exacerbate due to climate change. Many floods are caused by heavy rainfall with highly saturated soil; however, the relative importance of rainfall and antecedent soil moisture and how it changes from place to place has not been fully understood. Here we examined annual floods from more than 200 hydrological stations in the middle and lower Yangtze River basin. Our results indicate that the dominant factor in flood generation shifts from rainfall to antecedent soil moisture with the increase in watershed area. The ratio of the relative importance of antecedent soil moisture and daily rainfall (SPR) is positively correlated with topographic wetness index and has a negative correlation with the magnitude of annual floods. This linkage between watershed characteristics that are easy to measure and the dominant flood-generation mechanism provides a framework to quantitatively estimate potential flood risk in ungauged watersheds in the middle and lower Yangtze River basin.
- Article
(4823 KB) - Full-text XML
-
Supplement
(761 KB) - BibTeX
- EndNote


Flooding is one of the most destructive and costly natural hazards in the world, resulting in considerable fatalities and property losses (Suresh et al., 2013). River floods have affected nearly 2.5 billion people between 1994 and 2013 worldwide (CRED, 2015) and caused USD 104 billion in losses every year (Desai et al., 2015). The damages may be further exacerbated by the increasing frequency and intensity of extreme rainfall events, according to climate change projections (IPCC, 2012; Ohmura and Wild, 2002). Flood control infrastructure and more accurate predictions are needed to reduce flood damages, which requires a better understanding of the underlying mechanism of flood generation and the drivers of change (Villarini and Wasko, 2021).
Numerous studies have been conducted to investigate the cause of floods across the world (Blöschl et al., 2013; Munoz et al., 2018; Zhang et al., 2018). Many studies focused on examining the environmental and social characteristics that lead to specific catastrophic flood events (Blöschl et al, 2013; Liu et al., 2020; Zhang et al., 2018). Others concentrated on single locations, usually catchment outlets, to explore the influential factors of floods and the future trends (Brunner et al., 2016; Munoz et al., 2018). Yet, given the amount of data and time required, it is not practical to apply these detailed studies to hundreds of catchments to generate an overview of the flood-generation mechanism at a large scale.
Recently, researchers started to investigate the dominant flood-generation mechanisms at regional scales (Berghuijs et al., 2019b; Do et al., 2020; Garg and Mishra, 2019; Smith et al., 2018; Tramblay et al., 2021; S. Ye et al., 2017). Most of these studies are conducted in North America and Europe with well-documented long-term records (Berghuijs et al., 2016; Blöschl et al., 2019; Do et al., 2020; Musselman et al., 2018; Rottler et al., 2020). Some research was conducted in China recently (Yang et al, 2019; Yang et al, 2020), though this kind of work is still limited, and further investigations are needed given the considerable spatial heterogeneity and complexity in flood generation.
As the largest river in China, the Yangtze River basin has long suffered from floods. In summer 2020, 378 tributaries of the Yangtze River had floods exceeding the alarm level, causing billions of U.S. dollars in damage (Xia and Chen, 2021). With increasing public awareness, more accurate prediction is needed, which relies on better understanding. However, due to the limitation of observations, there are only a few regional studies of the flood-generation mechanism in China, with a few in the Yangtze River basin (Zhang et al., 2018; Yang et al., 2019, 2020). The large number of dams and reservoirs built along the river further complicated the situation (Feng et al., 2017; Li et al., 2011; Yang et al., 2019).
Because of the relatively warm temperature, snowmelt has little impact on flood generation in the Yangtze River basin (Yang et al., 2020). Floods in the Yangtze River basin usually occur during summer with relatively wet soil and high rainfall (Wang et al., 2022). Heavy rainfall with high antecedent soil moisture has also been identified as a dominant driver of floods across the world (Beighuijs et al., 2019b; Garg and Mishra, 2019; Tramblay et al., 2021; Wasko et al., 2020). Recently, studies started to examine the relative importance of rainfall and antecedent soil moisture in flood generation (Brunner et al., 2021; Wasko et al., 2021; Bennett et al., 2018; Bertola et al., 2021). Quantitative evaluation of the relative contribution of rainfall and antecedent soil moisture and its change across watersheds is still limited and currently unavailable in China (Y. Liu et al., 2021; Wu et al., 2018).
Based on the watersheds in the middle and lower Yangtze River basin, this study attempts to explore the following questions: (1) is there a way to quantitatively describe the relative importance of antecedent soil moisture and rainfall on flood generation? (2) How would this combination of flood-generation rainfall and soil moisture vary across watersheds, and what are the influential factors? Based on the observations and model estimation (Sect. 2), the spatial distribution patterns of antecedent soil moisture and rainfall were obtained and analyzed to investigate their individual contribution to flood generation and the influential factors (Sect. 3). This allows for a further examination of the relative importance of antecedent soil moisture and rainfall on flood generation and its linkage to watershed characteristics and its implications for flood prediction (Sect. 4). All of the results are summarized in Sect. 5.
2.1 Study area
The Yangtze River is the largest river in China, with a total length of 6300 km and annual discharge of 920 km3 at the outlet (Yang et al., 2018). It drains through an area of 1.8×10⁶ km2, lying between 90∘33′ and 122∘25′ E and 24∘30′ and 35∘45′ N and is home to over 400 million people, most of which live in the middle and lower Yangtze River basin (YZRB; Cai, 2020). The elevation of the YZRB declines from west to east, from over 3000 m in Qinghai–Tibet Plateau and around 1000 m in the central mountain region to 100 m in the East China Plain (Wang et al., 2013). The vegetation types in the YZRB are forests, shrubs, grassland, and agricultural land, accounting for 11.85 %, 12.65 %, 32.26 %, and 42.88 %, respectively. Grassland and shrubs are the dominant vegetation in the middle and upper YZRB, while the downstream YZRB is dominated by forests and agricultural land (Miao et al., 2015). There are more than 51 000 reservoirs of different sizes in the whole basin, including 280 large ones (Peng et al., 2020).
Most of the YZRB is semi-humid and humid, with a typical subtropical monsoon climate. The mean annual temperature is approximately 13.0 ∘C, varying from −4 to 18 ∘C downstream. The mean annual precipitation of the whole basin is about 1200 mm, increasing from 300 mm in the western headwaters to 2400 mm downstream (Li et al., 2021). Most of the precipitation comes between June and September. The premise of the persistent heavy rain in the Yangtze River basin is the frequent activity of weak cold air in the north and the intersection of mid-latitude air masses and monsoon air masses (Kato, 1985). Studies have found that both annual precipitation and the frequency of extreme precipitation events have increased in the middle and lower reaches of the Yangtze River (Qian and Xu, 2020; Fu et al., 2013). As a result, floods have occurred frequently in the middle and lower reaches of the Yangtze River where most of the population in the YZRB live (N. Liu et al., 2018).
2.2 Data
In this work, we focus on the middle and lower reaches of the Yangtze River for the high population density and increasing flood risk. A 30 m digital elevation model (DEM) was downloaded from Geospatial Data Cloud (http://www.gscloud.cn/, last access: 1 November 2020), from which the drainage area corresponding to the hydrological station was extracted by ArcGIS. Daily precipitation data and temperature data between 1970 and 2016 from 247 meteorological stations within and near the YZRB were downloaded from China Meteorological Data Network (https://data.cma.cn/, last access: 1 November 2020; Fig. 1). The temperature data were used to estimate potential evaporation. The observed precipitation and estimated potential evaporation were interpolated into the whole YZRB using the Thiessen polygon method (Meena et al., 2013). The interpolated precipitation and potential evaporation were then averaged for the drainage area corresponding to each hydrological station.
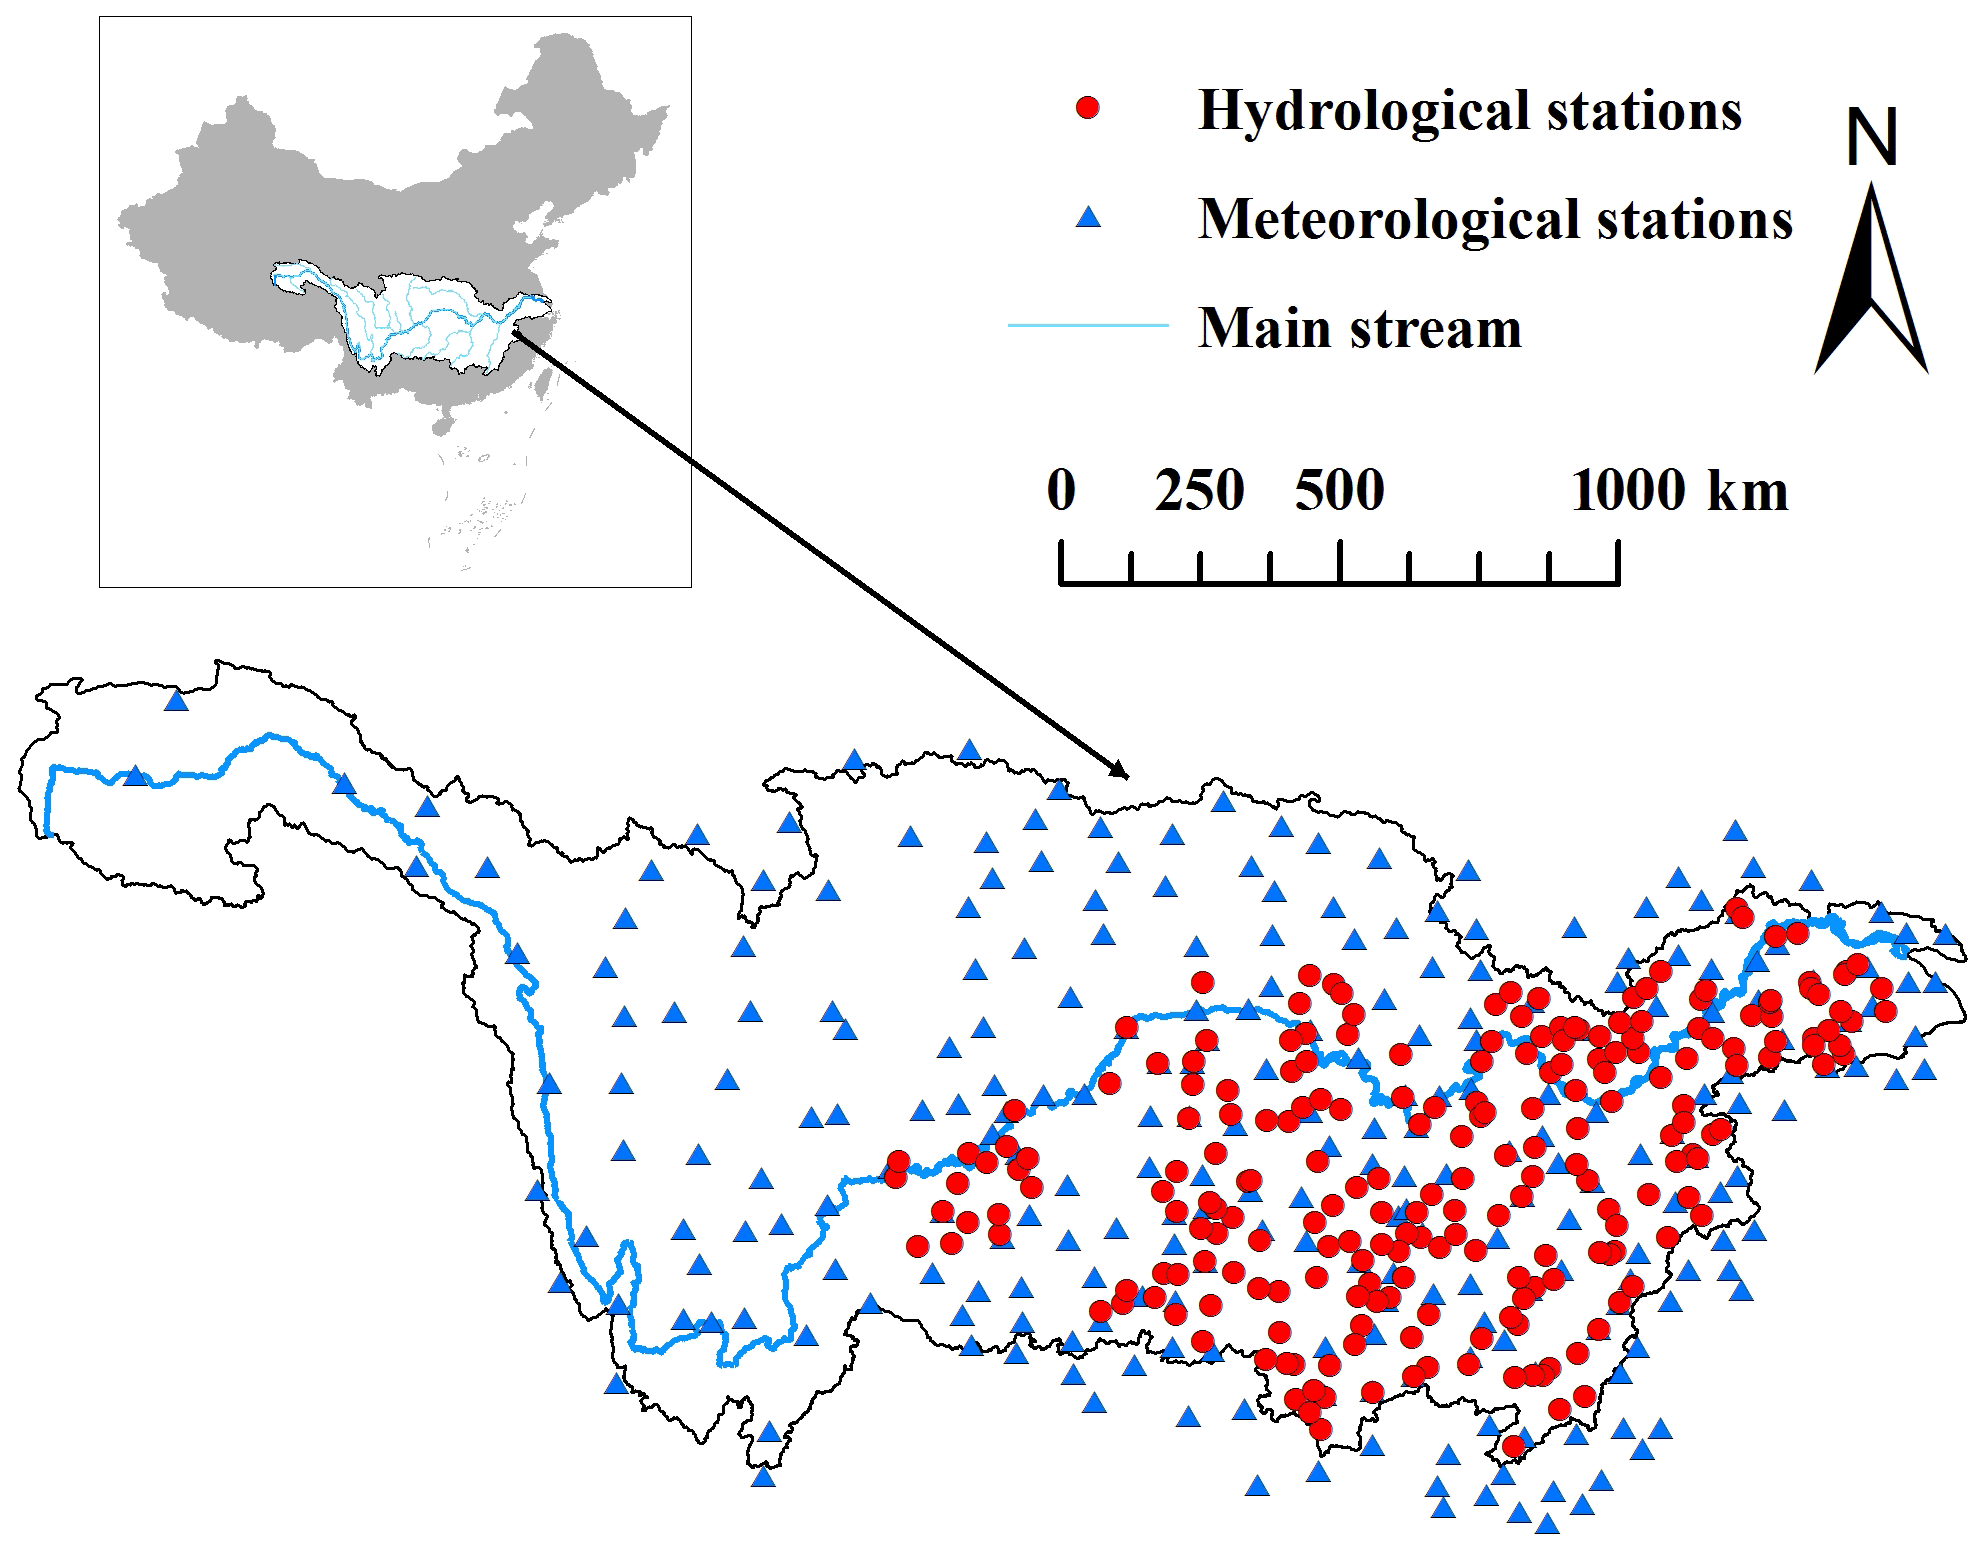
Figure 1Map of the Yangtze River basin, the meteorological stations, and hydrological stations. The blue line is the main stream of the Yangtze River.
The daily streamflow data were collected from 267 hydrological stations from the Annual Hydrological Report of the People's Republic of China, among which 224 stations with at least 20 years of records from both the period from 1970 to 1990 and the period from 2007 to 2016 were selected; the data from 1990 to 2007 were not found in the online repository (see Fig. S1 in the Supplement for data availability). Information on 361 reservoirs in the middle and lower YZRB, including capacity and controlling area, was downloaded and extracted from the Global Reservoir and Dam database (GRanD; Lehner et al., 2011). A previous study showed that this database provides reliable information on medium-sized and large reservoirs in China (Yang et al., 2021). Watersheds with more than 80 % of the drainage area under control reservoirs, according to the GRanD database, and/or located right downstream of reservoirs and water gates were considered to be watersheds under strong regulation (regulated watersheds).
2.3 Calculation of hydrological and topographic characteristics
2.3.1 Potential evaporation estimation
The temperature data were used to estimate potential evaporation following the Hargreaves method (Allen et al., 1998; Vicente-Serrano et al., 2014; Berti et al., 2014).
where ET0 is potential evaporation (mm d−1), Tmax is the highest temperature (∘C), Tmin is the lowest temperature (∘C), Tmean is the mean temperature (∘C), and Ra is the outer space radiation [MJ m−2 d−1], which can be calculated as follows:
where dr is the reciprocal of the relative distance between the Sun and the Earth, ωs is the angle of sunshine hours, δ is the inclination of the Sun (rad), and φ is geographic latitude (rad). dr, δ, and ωs can be calculated by the following formula:
where J is the daily ordinal number (1 January is 1).
2.3.2 Soil water storage estimation
The soil water storage was estimated based on the daily water balance, as follows (Berhuijs et al., 2016, 2019b):
where S is the soil water storage (mm), which is initially set to 0. Due to the long term of simulation, the change in the initial value would not significantly affect the results. P is precipitation (mm d−1), Q is discharge normalized by area (mm d−1), and ET is evaporation (mm d−1), which can be calculated from potential evapotranspiration (ET0), where the soil water storage (S) is used as the upper limit of daily ET, as follows:
The estimation of soil water storage and ET is highly simplified and is not used for prediction but to capture the first order of the temporal variation in and the relative wetness of soil in the study time period, which helps develop a framework that differentiates the relative contribution of precipitation and soil moisture in flood generation.
2.3.3 Topographic wetness index estimation
Topographic wetness index was calculated to represent the combined impacts of drainage area and topographic gradient, as follows (Alfonso et al., 2011; Grabs et al., 2009):
where Ad is drainage area, and α is topographic gradient estimated from DEM. TWI represents the propensity of subsurface flow accumulation and frequency of saturated conditions and thus can be used to predict relative surface wetness and hydrological responses (Meles et al., 2020). It is widely used to quantify topographic impact on hydrological processes (spatial-scale effects, hydrological flow path, etc.) and in land surface models for hydrological, biogeochemical, and ecological processes (Sørensen et al., 2006).
2.4 Quantification of the relative importance of soil moisture and precipitation during floods
The maximum daily discharge of each year was selected as the annual flood, which was then averaged across years as the mean annual maximum flood (AMF). The observed rainfall on that day and the estimated soil water storage on the day before AMF in each year were also averaged across years as daily rainfall (P) and antecedent soil moisture (S0). Since almost all the AMFs in our study region come during rainy season when rainfall occurs on most of the days, it could be difficult to isolate the events of AMFs among consecutive flow events. To avoid the bias that may be caused in event separation, the soil moisture on the day before the AMF was used as antecedent soil moisture instead of the day before the AMF event. To examine the impacts from a long-lasting rainfall event, especially for the large watersheds with longer concentration time, we also calculated the mean accumulated rainfall from 2 d (rainfall on the flood day and the day before; P2) to 7 d before (weekly rainfall; P7).
The percentile of antecedent soil moisture (S0) was calculated to represent the relative saturation of soil moisture in the time series, while the percentile of daily rainfall (P) was estimated to show the relative intensity (P′), thus representing the relative magnitude of rainfall events across time. The percentile of accumulated rainfall was also calculated for the 2 to 7 d of rainfall.
To quantify the relative importance of antecedent soil moisture and rainfall in flood generation, ratio of the relative importance of antecedent soil moisture and daily rainfall (SPR) at the AMFs was derived, i.e., SPR = . When SPR is large, the antecedent soil moisture is much closer to the maximum, while, when the daily rainfall is less extreme, floods are more affected by the antecedent soil moisture. On the other hand, a smaller SPR indicates a relatively larger magnitude of rainfall compared with antecedent soil moisture; that is, rainfall is more extreme and influential in flood generation.
3.1 Spatial patterns of antecedent soil moisture and precipitation during floods
Figure 2 shows the spatial distribution of the percentile of antecedent soil moisture and daily rainfall during the annual maximum floods (AMFs) in the middle and lower reaches of the Yangtze River. As we can see from Fig. 2a, in the middle and lower reaches of YZRB, when AMFs occurred, the percentile of antecedent soil saturation was generally high, and most of them are larger than 0.6; the farther away it was from the main stream, the more saturated the soil was. On the other hand, along and near the main stream and the delta, the antecedent soil saturation rate could be much smaller, with values even less than 0.4.
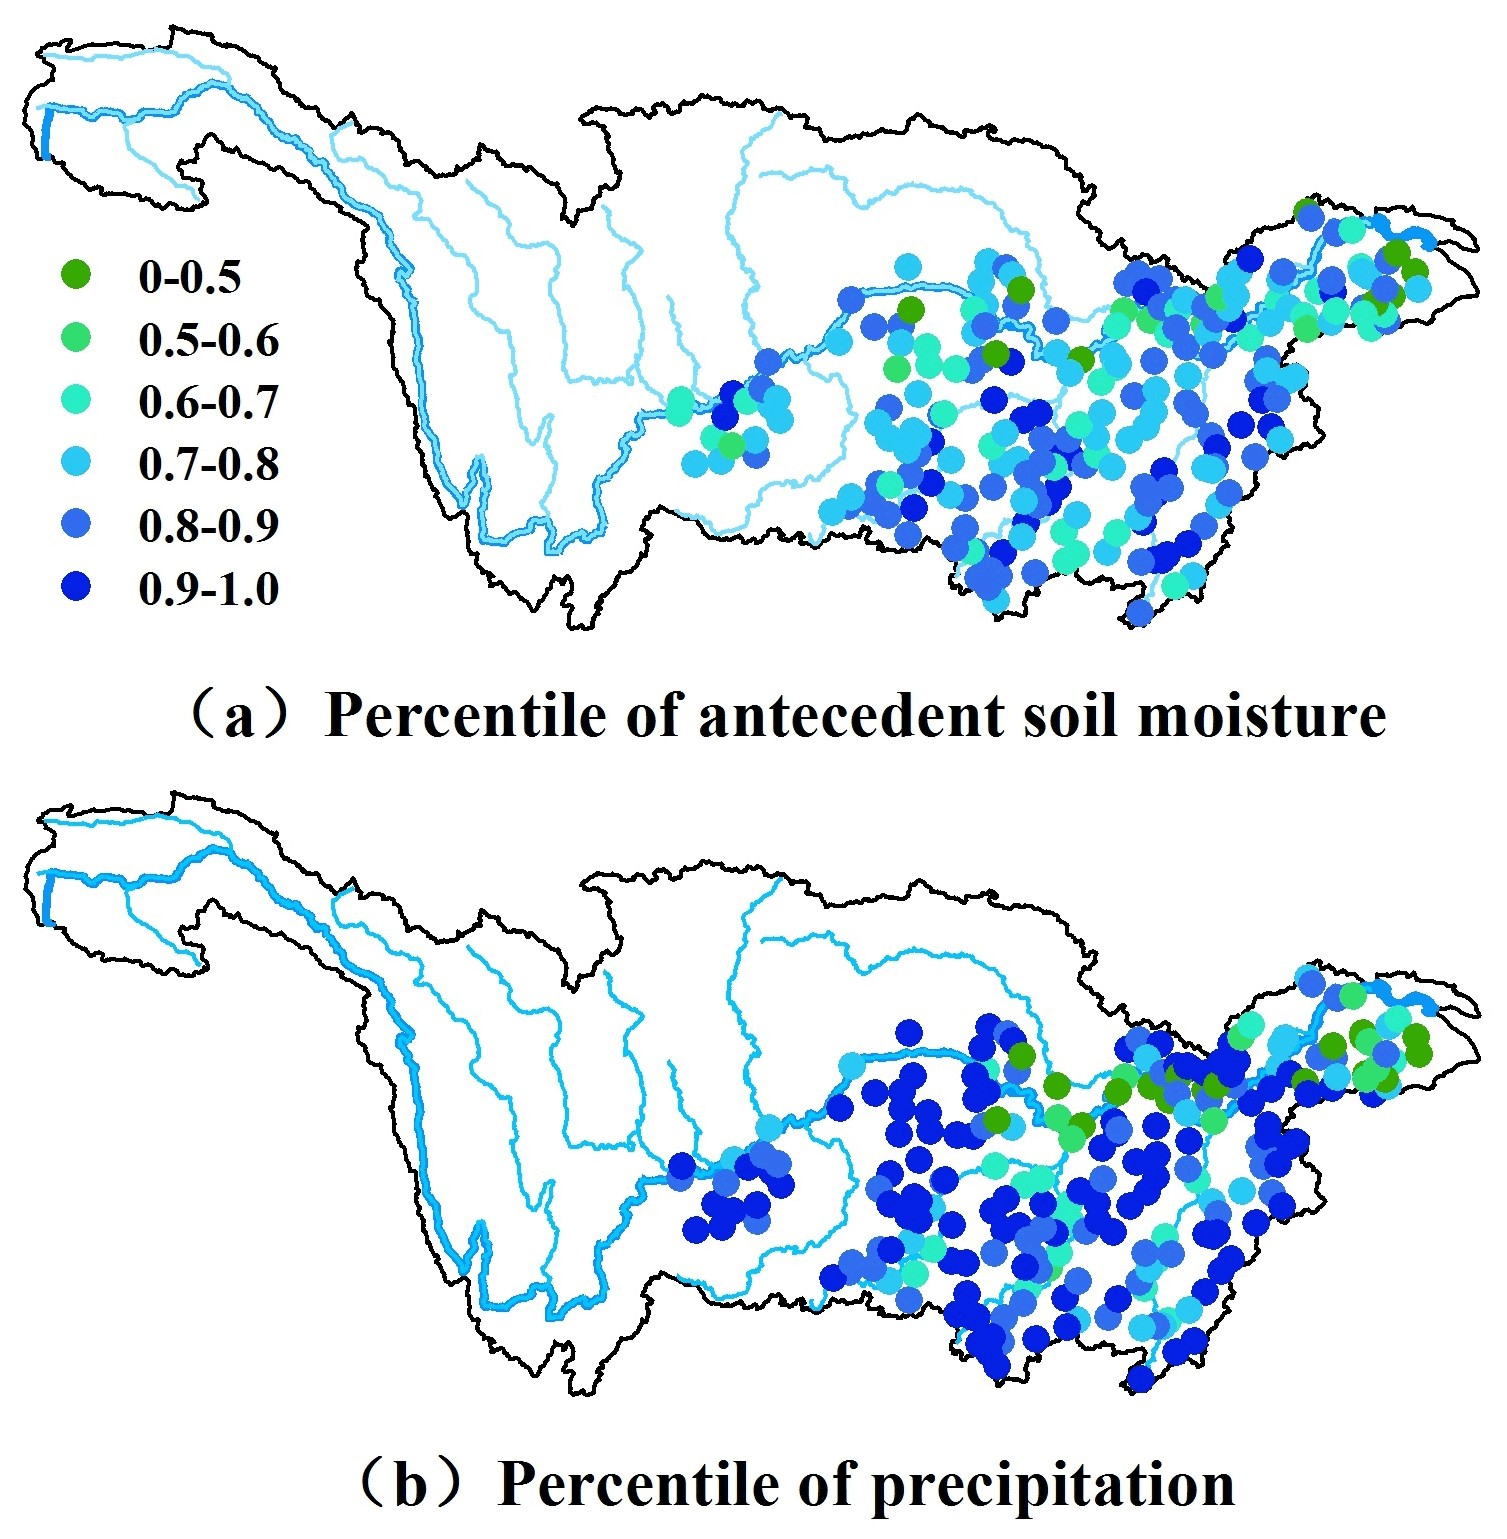
Figure 2The spatial distribution of (a) the percentile of antecedent soil moisture during annual maximum flood and (b) the percentile of daily precipitation during annual maximum flood.
Figure 2b shows the daily rainfall during the AMFs. As we can see, the percentile of daily rainfall is relatively high (>0.8) at more than half of the study sites, while it is small (<0.5) for the sites along the main stream and in the delta (Fig. 2b). Comparison between Fig. 2a and b suggests that, except for the sites on the main stream and in the delta, sites with relatively high antecedent soil saturation rate (i.e., >0.8; the blue dots) during AMFs are also the ones with relatively small daily rainfall contribution (i.e., <0.8; the light blue and cyan dots). That is, for these sites, the AMFs usually occur under much wetter conditions, while extreme rainfall on the flood day is not necessary, suggesting the relative importance of soil wetness. For the sites with both the percentile of soil moisture and rainfall between 0.6 and 1, both the antecedent soil moisture and rainfall play important roles in flood generation. As for the sites on the main stream and in the delta, both antecedent soil moisture and rainfall are low during AMFs; this is likely due to the regulations from large reservoirs and water gates.
3.2 The scaling effect in the contribution of antecedent soil moisture and rainfall
To further investigate the relative importance of antecedent soil moisture and rainfall in flood generation and the potential influential factors, we examined their correlation with the catchment area (Fig. 3). Given the complicated environmental and social impacts, the regulated watersheds and sites on the main stream are presented separately (the green dots and cyan dots in Fig. 3, respectively). Our study will focus on the sites that are not dominated by regulations (the blue dots in Fig. 3). For simplicity, we will refer them as natural watersheds.
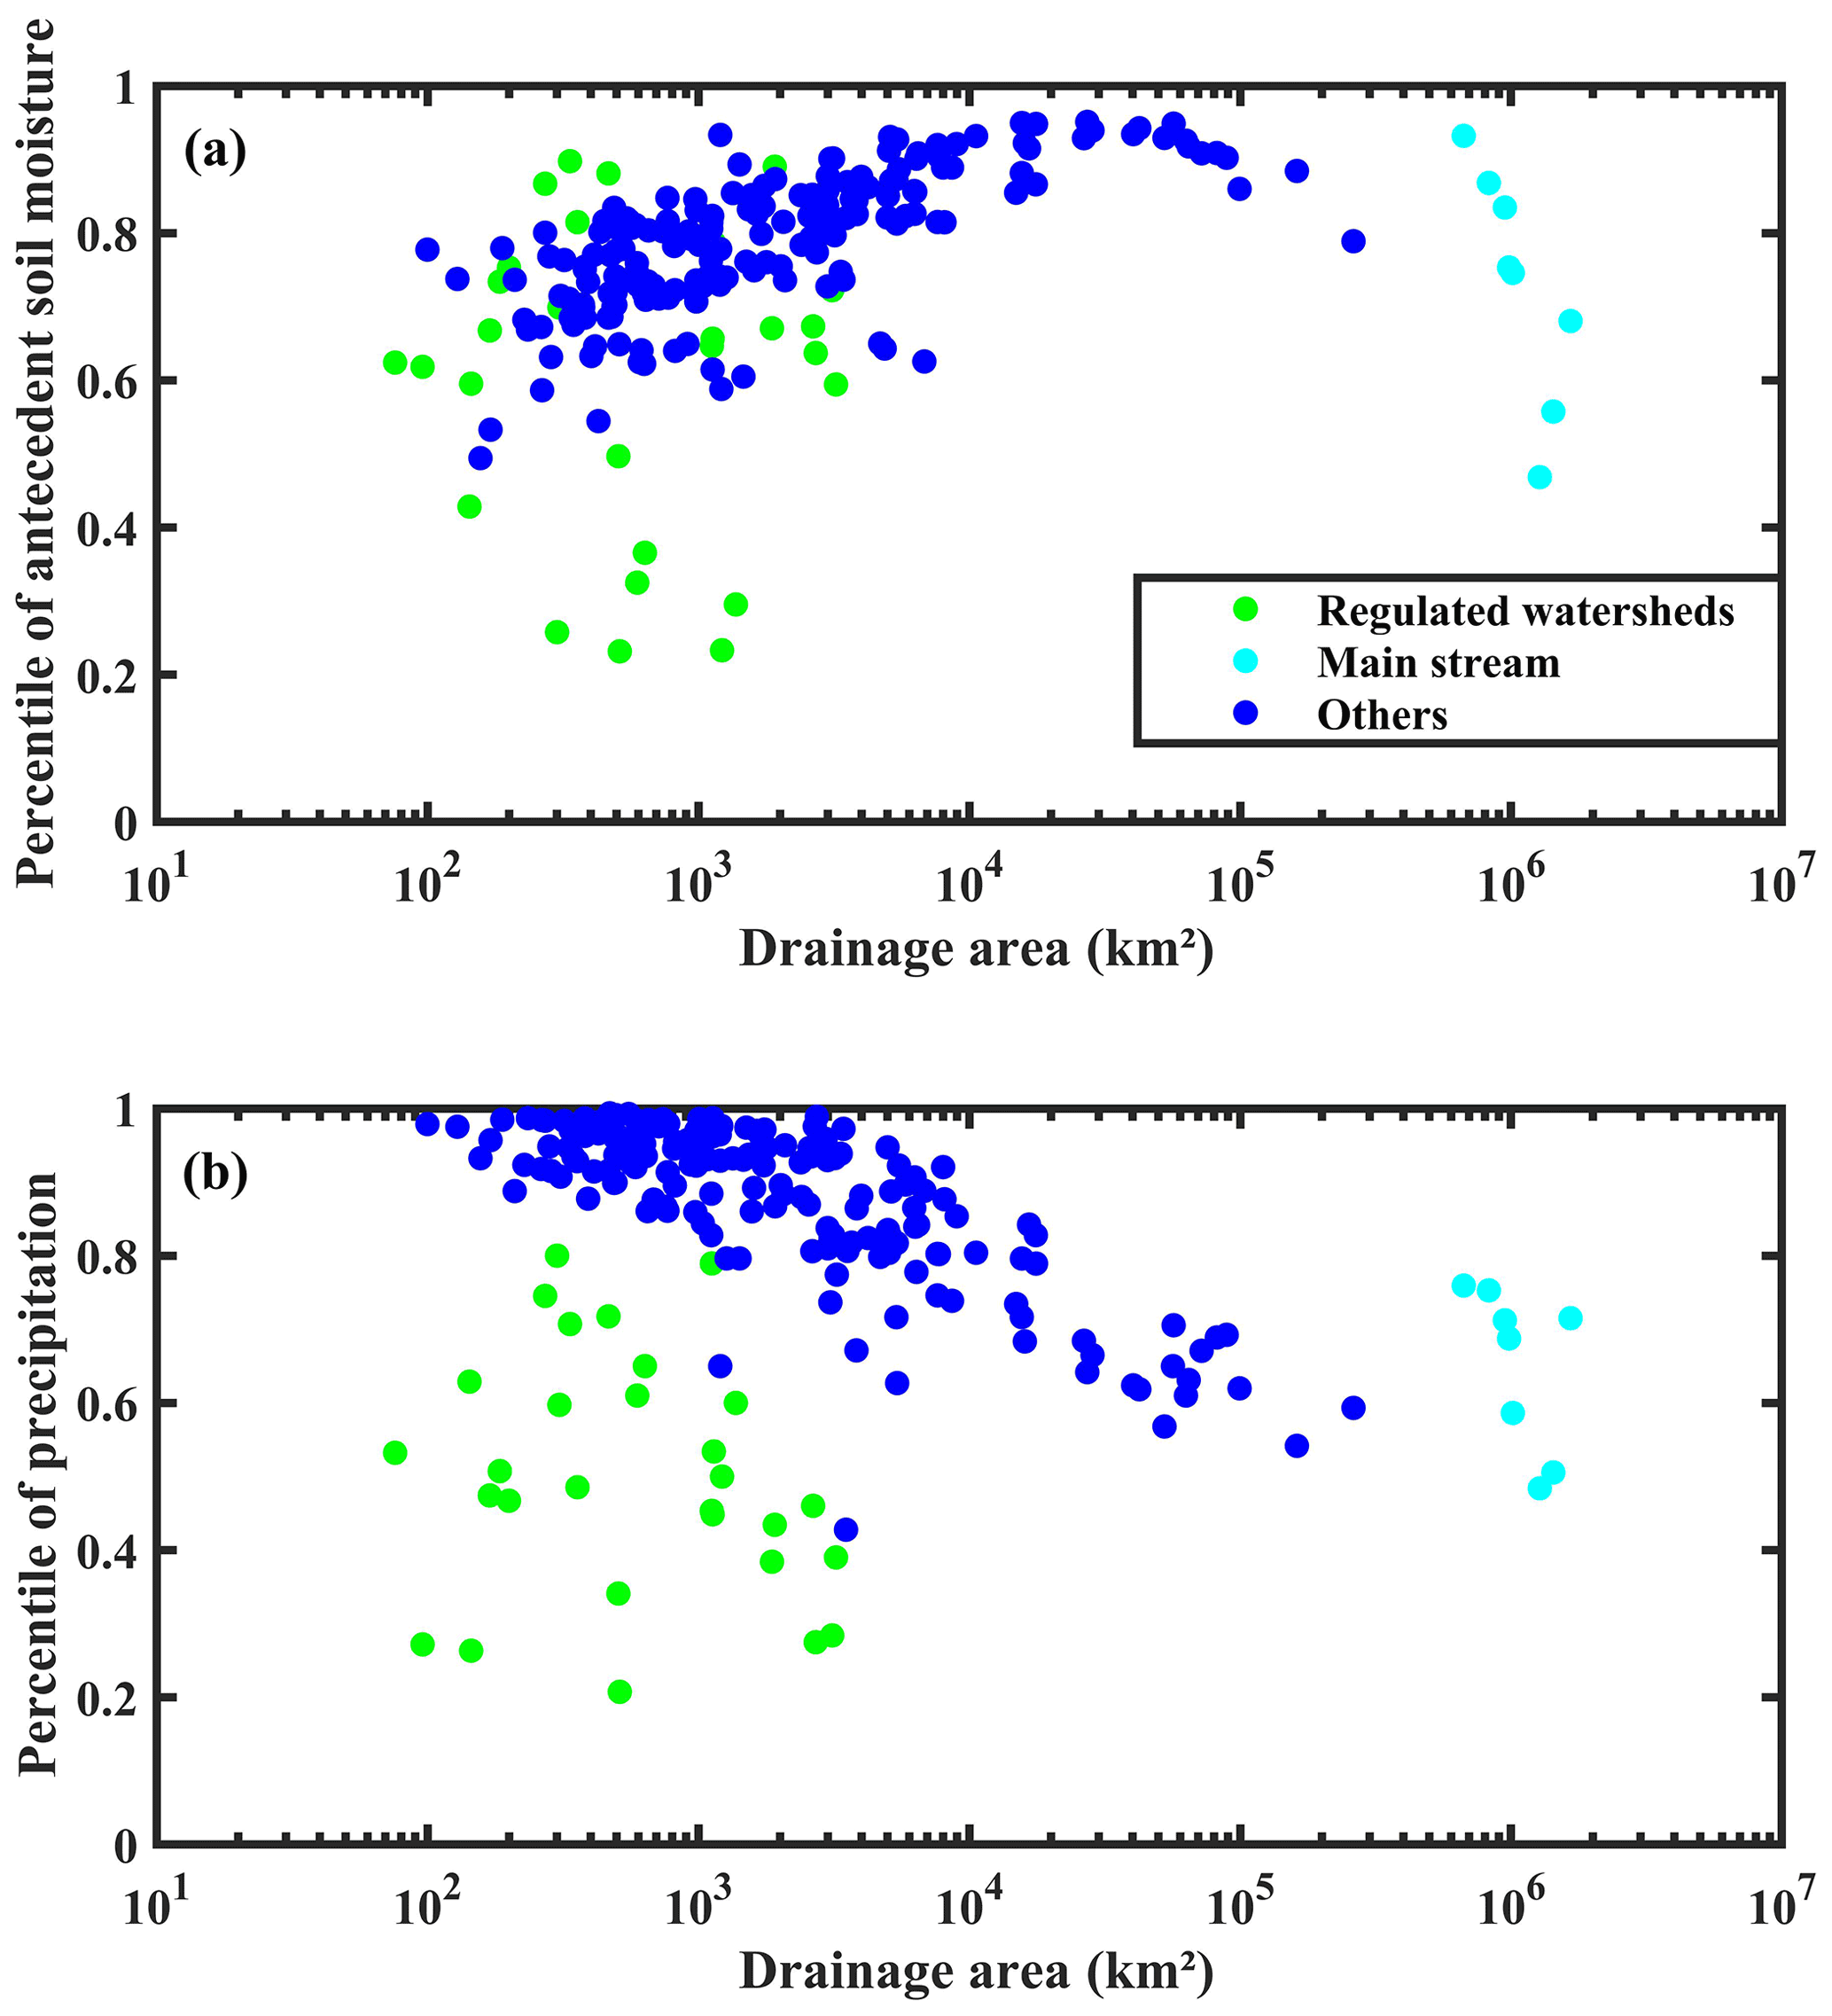
Figure 3Scatterplot of the drainage area and (a) the percentile of antecedent soil moisture of AMF events (the linear regression for blue dots is R2=0.46, and p value < 0.001) and (b) the percentile of precipitation on the day of AMF events (the linear regression for blue dots is R2=0.61, and p value < 0.001). The green dots represent the regulated watershed, the cyan dots represent the sites on the main stream, and the rest of the sites are shown in blue.
As we can see from Fig. 3, during the occurrence of AMFs, the percentile of antecedent soil wetness increases with watershed area (p value < 0.001), while the percentile of daily rainfall decreases with watershed area (p value < 0.001). That is, with the increase in watershed size, antecedent soil moisture becomes more and more saturated, while the precipitation is less and less extreme during AMFs, suggesting the rising contribution of antecedent soil moisture and declining importance of daily precipitation in flood generation. As for the regulated watersheds (green dots in Fig. 3), there is no clear correlation between the drainage area and the percentile of antecedent soil moisture or rainfall, which is understandable. Meanwhile, both the percentile of antecedent soil moisture and rainfall decreases with watershed area for main stream sites.
3.3 The scaling impacts on accumulated rainfall
The saturation of soil before floods could be due to previous rainfall events and could also be caused by accumulated rainfall in long-lasting rainfall events that eventually generate floods (Xie et al., 2018). Figure 4 presents the correlation between the percentile of accumulated rainfall and drainage area. When a single day of rainfall is considered, it is negatively correlated with drainage area (Fig. 3a); when accumulated rainfall is considered, the correlation gradually shifts from a negative to a positive correlation (Fig. 4). For example, when 2 d of rainfall were examined, the correlation between accumulated rainfall and drainage area shifts from negative to positive at 10 000 km2; the negative correlation in Fig. 3a is only valid for watersheds larger than 10 000 km2 (Fig. 4a). This transition area increases from 10 000 km2 for 2 d of rainfall to 100 000 km2 for 4 d of rainfall (Fig. 4c). The number of watersheds with negative correlation also decreases. Eventually, the weekly rainfall has a similar positive correlation with drainage area to that of antecedent soil moisture (Fig. 4f). The increase in the transition area may be explained by the increasing response time and confluence time in large watersheds; it takes days to generate flow events by heavy rainfall and for them to reach outlets where they can be observed in large watersheds. This is also consistent with the conclusion in the Yellow River basin (Ran et al., 2020b) and our previous findings of the dominant flood-generation mechanism in the middle and lower YZRB because weekly rainfall is the dominant flood driver for sites on the main streams and the major tributaries (Wang et al., 2022). The regulated watersheds do not show a significant correlation, which is understandable for the strong human intervention. For the negative correlation between accumulated rainfall and drainage area at main stream sites, it is difficult to decide whether it is due to the scaling effect or human intervention.
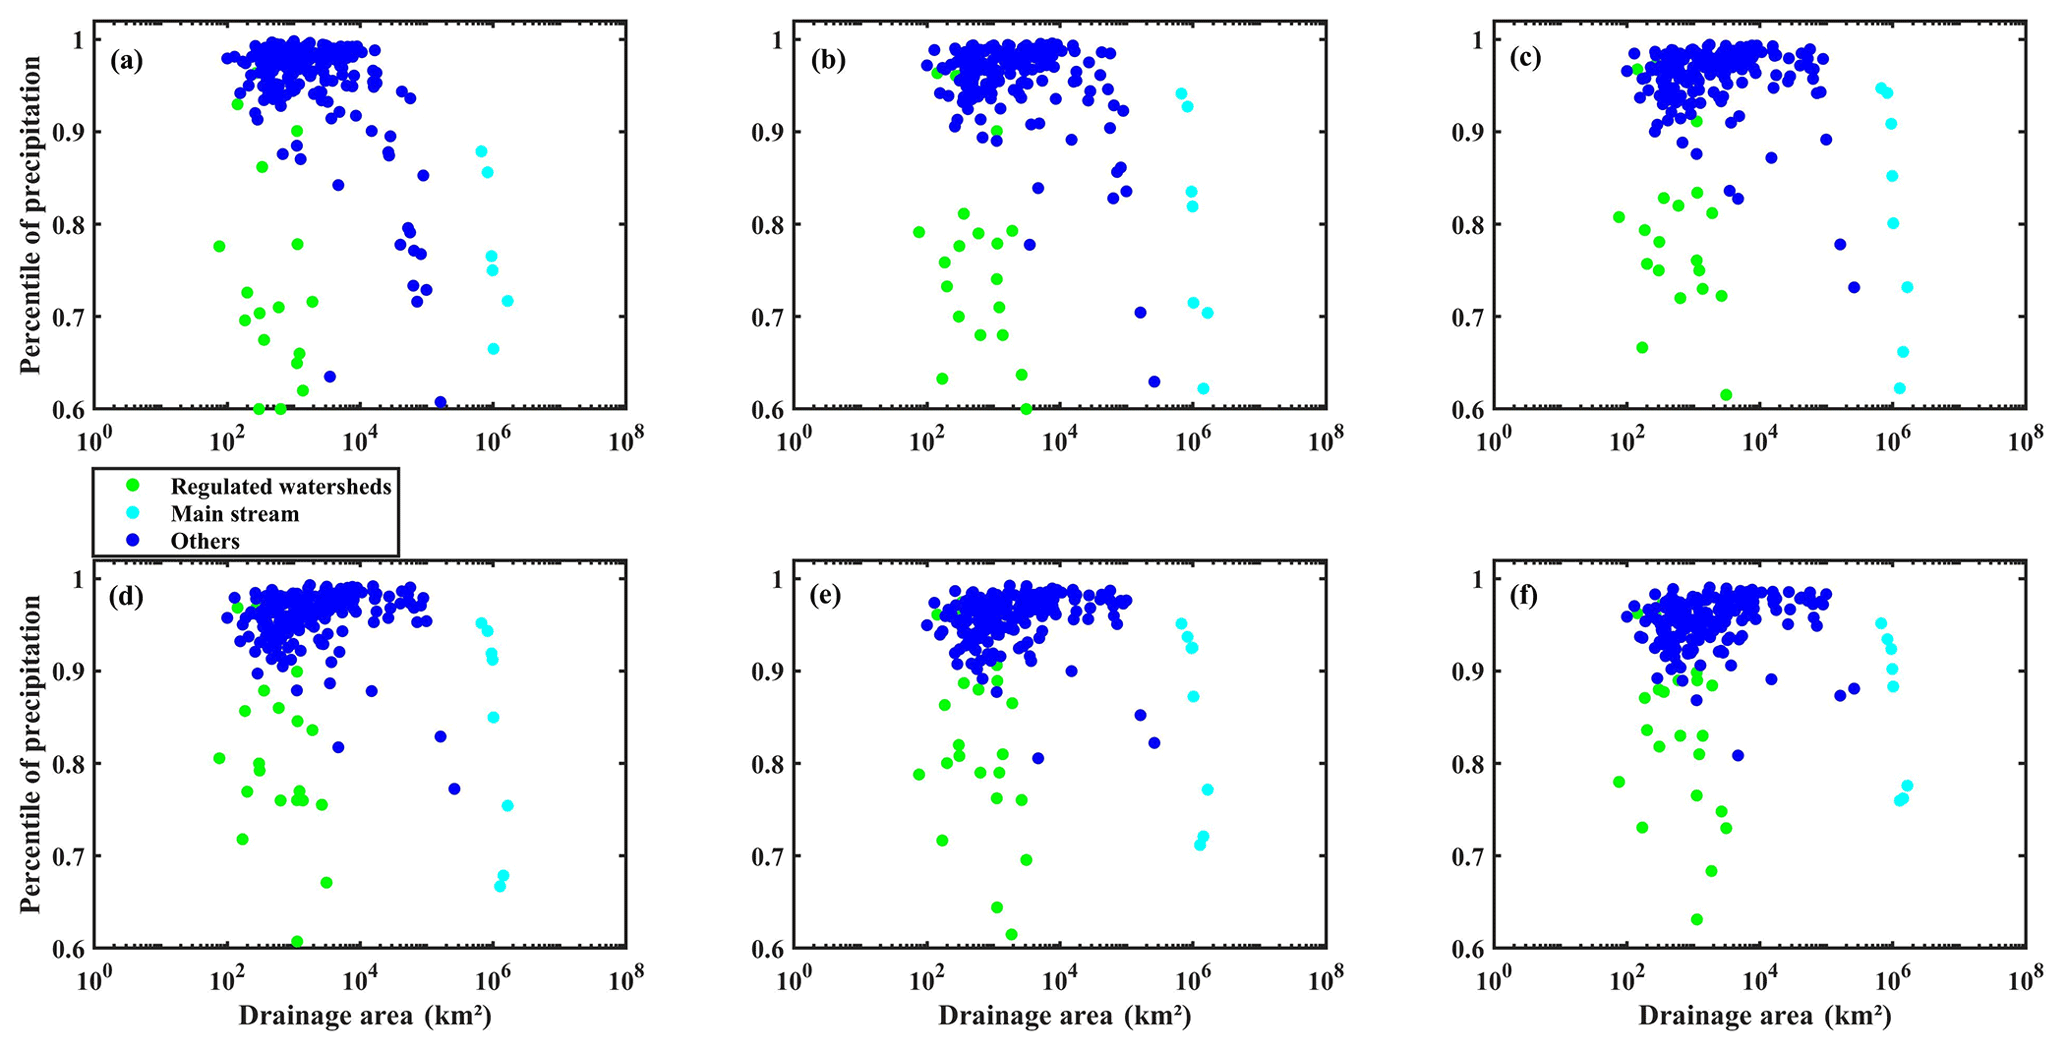
Figure 4Scatterplot comparing the drainage area and the percentile of accumulated rainfall of (a) 2 d, (b) 3 d, (c) 4 d, (d) 5 d, (e) 6 d, and (f) 7 d for AMF events.
3.4 The interlink of watershed characteristics, flood, antecedent soil moisture, and rainfall
Figure 5 presents the percentile of antecedent soil moisture and rainfall during the AMFs at the study watersheds. The circles are scaled by watershed size and colored with topographic gradient. Except for the watersheds with strong human intervention (regulated ones and the ones on the main stream), there is a negative correlation between the contribution of rainfall and antecedent soil moisture. The lower right of the scatter is mostly big blue dots which are large watersheds with a gentle topographic gradient. That is, AMFs usually occur when soil moisture is close to saturation, while extreme rainfall is not necessary for AMFs in these watersheds. On top of the scatter are relatively small yellow and green dots. Those are medium to small watersheds with a steep topographic gradient; that is, AMFs are usually generated with extreme rainfall, while the saturation of soil moisture is not necessary. This negative correlation indicates the shift in dominance in AMF generation from extreme rainfall to antecedent soil wetness from small steep watersheds to large flat ones.

Figure 5Scatterplot of the percentile of precipitation and antecedent soil moisture. The color represents the topographic gradient, and the size of circles is scaled by drainage area.
Figure 6 shows the relative importance of antecedent soil moisture and rainfall. For the natural watersheds (the circles), SPR increases with drainage area and declines with topographic gradient. That is, the larger the drainage area, the more essential the contribution of antecedent soil moisture to floods, and the less influential the rainfall is in flood generation. For watersheds with a similar drainage area (i.e., the green or light blue dots in Fig. 6b), the topographic gradient also impacts on SPR, i.e., SPR decreases with slope. That is, the relative importance of rainfall increases at steeper watersheds. This may be attributed to the shortened hydrological response time due to the steep topography which facilitates rainfall-induced floods generation. As a combination of both drainage area and topographic gradient, TWI is positively correlated with SPR at natural watersheds, with less scatter than the correlation between SPR and drainage area or topographic gradient alone. That is, watersheds with a larger area and gentler topographic gradient that are easier to wet tend to have larger SPR; thus, soil wetness is more important in flood generation. There is no significant correlation between SPR and TWI for the regulated watersheds along tributaries (black triangles). However, the sites on the main stream show opposite pattern because the SPR at these sites decreases with TWI and drainage area. It is difficult to determine whether this is because of reservoir regulation or not. More data about watersheds larger than 10 000 km2 but with limited human intervention are needed to examine this hypothesis.
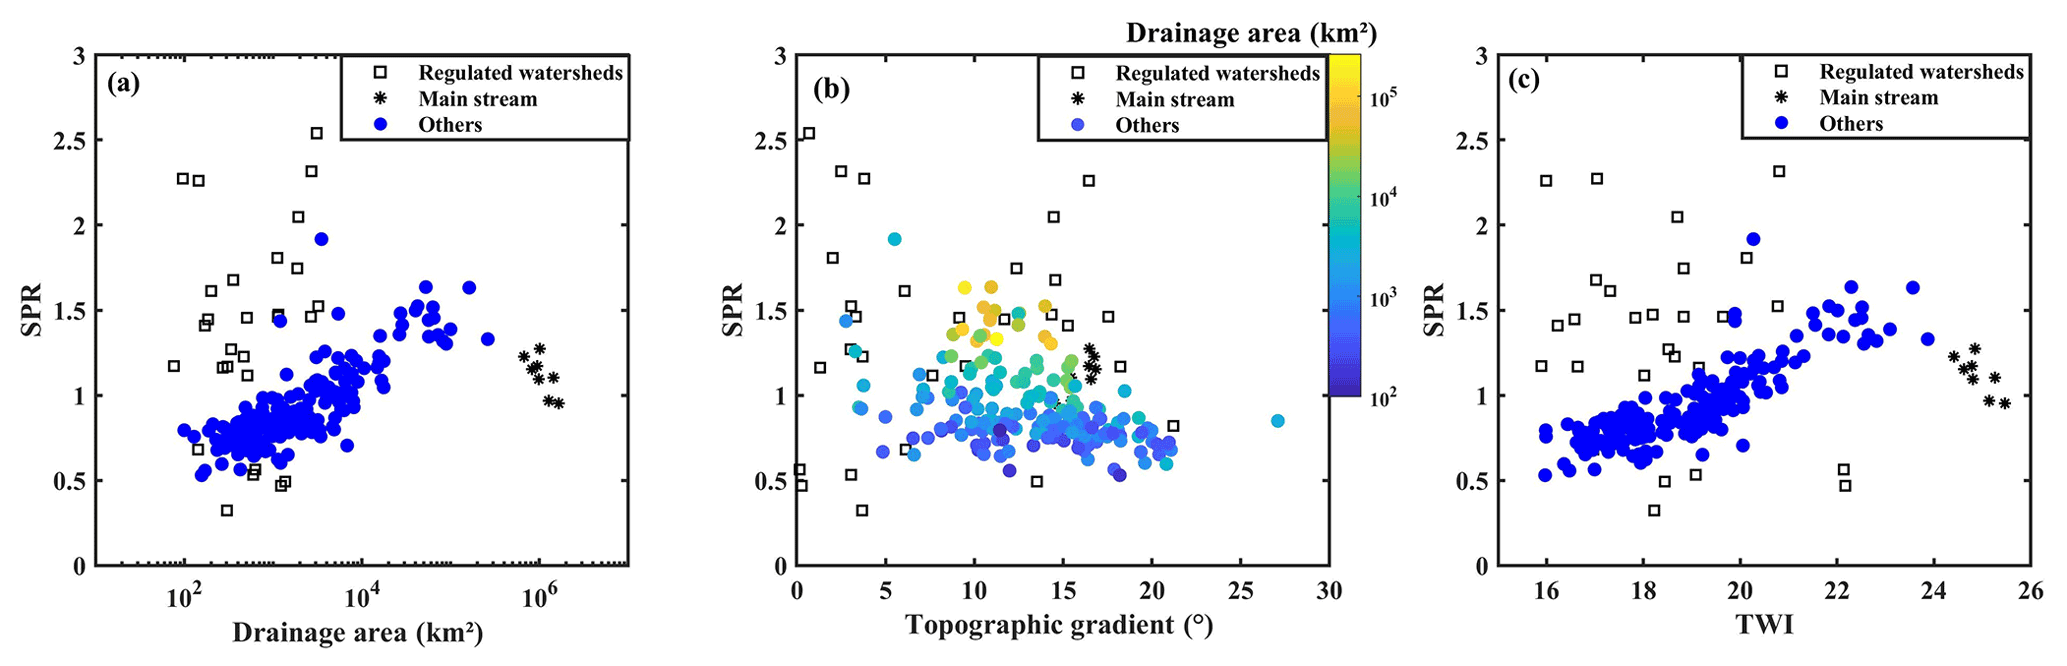
Figure 6Scatterplots between the ratio of antecedent soil moisture and precipitation (SPR) and (a) drainage area, (b) topographic gradient, and (c) topographic wetness index (TWI).
Besides TWI, SPR is also correlated with the magnitude of AMF (Fig. 7). As Fig. 7 shows, the area-normalized flood peak declines with flood-generation SPR. Watersheds with a large flood peak are mostly the ones with a steep topographic gradient and small SPR (i.e., SPR < 1) and vice versa. Catchments with more extreme floods are the ones with relatively smaller influence of soil moisture on flood generation. Similar correlation was also found at the event scale in our experimental mountainous watershed, which is located at a headwater of the Yangtze River (L. Liu et al., 2021).
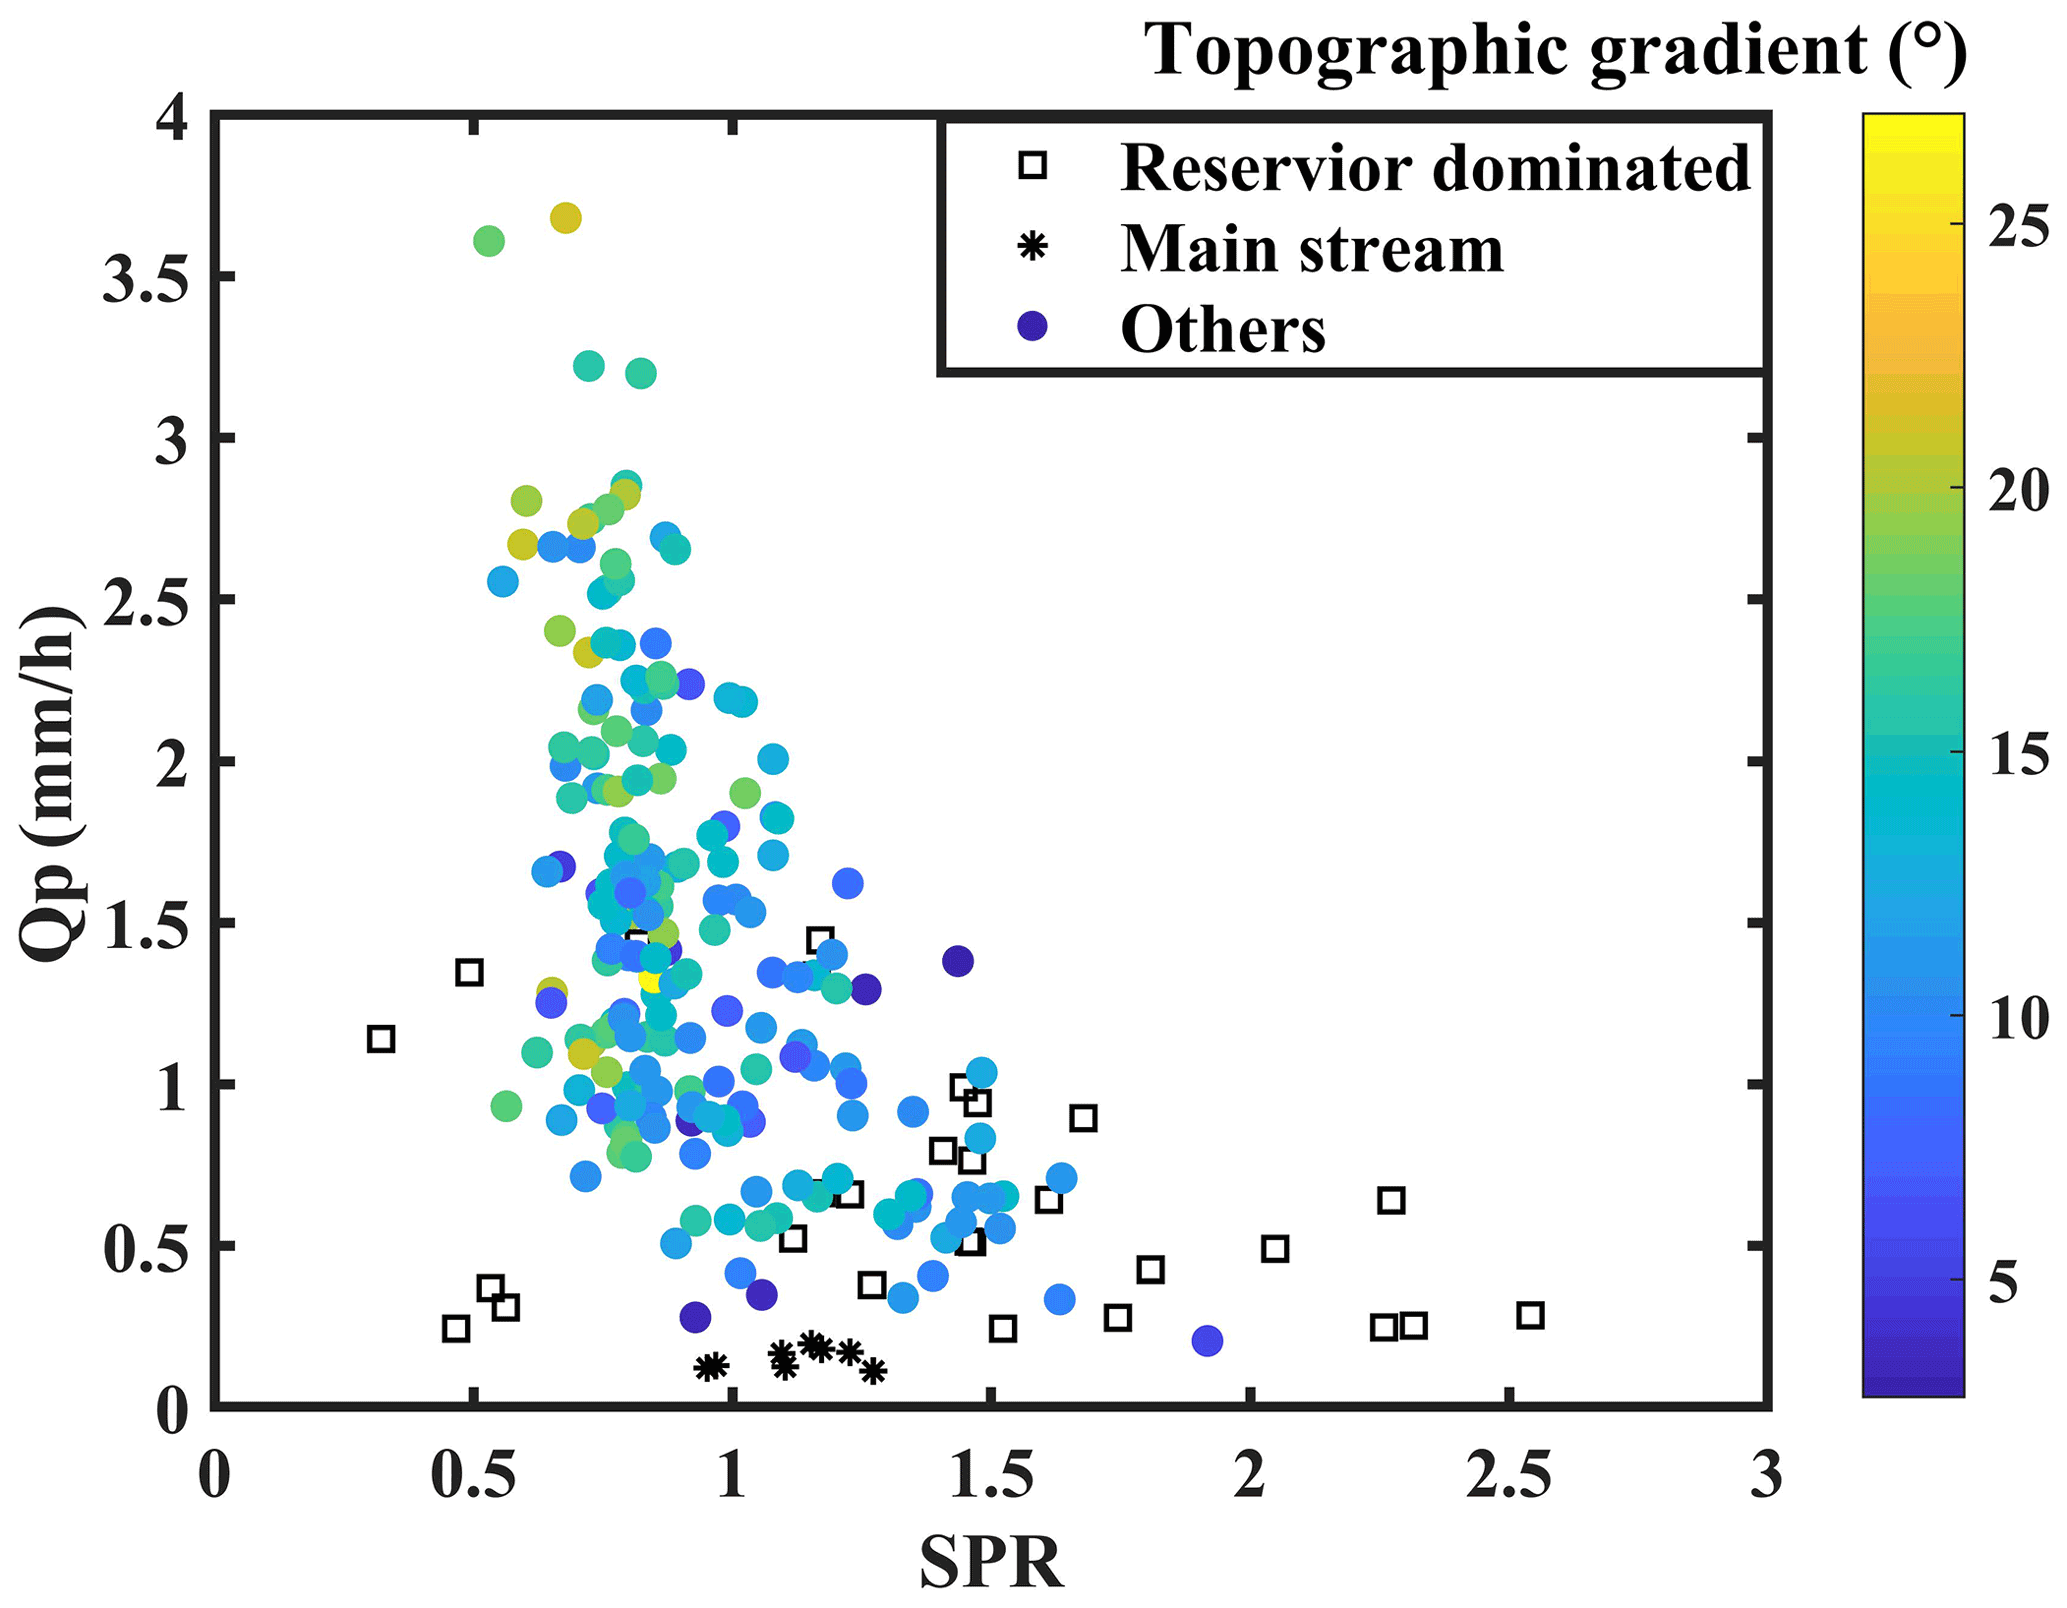
Figure 7Scatterplot between the ratio of antecedent soil moisture and precipitation (SPR) and area-weighted annual maximum discharge (QP). The color represents topographic gradient.
4.1 The relative importance of antecedent soil moisture and rainfall in flood generation
While soil moisture and rainfall are the two main drivers of floods in the middle and lower Yangtze River basin, the dominance of each factor varies across the relatively natural watersheds. Floods in large watersheds are usually generated when soil is almost saturated, despite the relatively small rainfall amount, while extreme rainfall is usually observed during floods in small to medium-sized watersheds (blue dots in Fig. 3). The rising contribution of antecedent soil moisture in large watersheds was consistent with the findings in Australian watersheds (Wasko and Nathan, 2019), and the declining influence of rainfall at larger watersheds was also found in Indian watersheds (Garg and Mishra, 2019). This contrast correlation with watershed size indicates a shift in dominance in AMF generation, which may be attributed to the longer confluence time in the large watersheds and less heterogeneity in small watersheds.
This shift in dominance can be observed more straightforwardly from the negative correlation between the percentile of rainfall and antecedent soil moisture in Fig. 5. The natural watersheds in Fig. 5 could be grouped into three classes based on their drainage area and topographic gradient. When a watershed is large and flat, the flood occurrence is mainly determined by soil wetness (i.e., the big blue dots at the lower right of the scatter); on the other hand, when a watershed is small and steep, heavy rainfall dominates (i.e., the small yellow and green dots at the upper left of the scatter). Between these two groups are relatively small watersheds with a gentle topographic gradient for which the occurrence of AMF requires both highly saturated soil and relatively heavy rainfall. That is, the dominant influential factor(s) in AMFs generation across watersheds is correlated with the topographic characteristics (i.e., watershed size and topographic gradient). This helps quantify the relative importance of soil moisture and rainfall in flood generation in the existing work.
This shift in dominance is not observed in the main stream sites (i.e., cyan dots in Fig. 3), where the percentile of both antecedent soil moisture and precipitation declines with drainage area. This may be attributed to the more complicated flood-generation mechanism at a large scale and the strong human intervention on the main stream (reservoirs, water gate regulation, etc.; Gao et al., 2018; Long et al., 2020; Zhang et al., 2017). The major responsibilities of reservoirs on the main stream are to reduce peak flow and postpone the time to flood peak (Volpi et al., 2018). As a result, the original flood peak would be delayed by the regulation, and the actual flood peak would occur when rainfall declines/stops and soil water drains. Another possibility is that, when watershed size is larger than 100 000 km2, the impact of antecedent soil moisture declines as well. To examine this hypothesis, more data from watersheds larger than 100 000 km2 and with limited human intervention are needed. However, this is beyond the scope of this work and requires future studies.
4.2 Linkage between topographic characteristics, SPR, and floods
The correlation between TWI and SPR (Fig. 6c) demonstrates that the relative importance of soil moisture and rainfall could be inferred from topographic characteristics quantitatively. We could derive the relative dominance of soil moisture and rainfall in flood generation in specific watershed from its TWI for the natural watersheds without significant human intervention. Rainfall and soil moisture level have been identified as being dominant drivers of floods, individually or together, in watersheds worldwide (Berghuijs et al., 2016, 2019b; Garg and Mishra, 2019; Tramblay et al., 2021; S. Ye et al., 2017). Our findings provide a framework to quantify the relative importance of rainfall and soil moisture and to further identify the influential factors of their importance based on topographic characteristics that are easy to measure.
Meanwhile, the SPR also presents a negative correlation with the magnitude of AMFs (Fig. 7). That is, we could infer the mean annual AMF based on the SPR for each watershed. Since the characteristic SPR could be estimated from TWI, we could derive a quantitative estimation of the mean AMFs from topographic characteristics that are easy to measure, even in watersheds with limited hydrologic records. There is also similar negative correlation between TWI and AMFs (Fig. S2). This would be helpful for flood control management in ungauged watersheds, especially in the mountainous watersheds with risks of flash floods. Similar correlation was also found in the observations from our experimental watershed, which is a headwater of Yangtze River (L. Liu et al., 2021). The ratio of observed antecedent soil moisture and event precipitation also presents a similar declining trend with discharge at the event scale. However, the correlation between SPR and discharge at the event scale is preliminary, and more data with a higher resolution and more detailed analysis are needed for validation at the event scale. For this study, our goal is to present the framework to derive flood-generation SPR that could be estimated from topographic characteristics and to provide information on mean AMFs.
In conclusion, based on the topographic characteristics, we could derive the relative importance of soil moisture and rainfall in flood generation (SPR), and from this relative importance ratio, we could further infer the average flood magnitude at these watersheds. As a result, we could link the topographic characteristics and annual floods through the characteristic SPR during the AMFs.
4.3 Implications
Our findings could be helpful for potential flood risk evaluation in ungauged basins, e.g., headwaters in a mountainous region. With the construction of large reservoirs, the capability of flood risk control has improved substantially along the main stream (Zou et al., 2011; Zhang et al., 2015). However, it is still difficult for a quantitative evaluation of flood risk in upstream mountainous watersheds, which are vulnerable to floods but difficult for hydrological modeling and prediction due to limited hydrologic records.
Our findings suggest that we could derive the flood-generation SPR of each watershed from the drainage area and topographic gradient that are easy to measure. The correlation between SPR and the flood peak provides information of the mean annual floods in ungauged watersheds. Therefore, in regions without observation data, by building flood control infrastructure such as dams and gates, the mean annual flood peak obtained by SPR based on the topographic characteristics can be used to provide quantitative information for flood control and disaster management. Flood control infrastructure could be designed based on the estimated mean annual flood peak and the demographic information. With a further validation of this framework at the event scale, by using the observed soil moisture from remote sensing data and precipitation forecast to generate real-time prediction of SPR values, we could further provide an early warning of floods in these ungauged watersheds. This would be helpful, given the increasing possibility of extreme rainfall events due to climate change; however, more data and examination are needed in future studies.
4.4 Limitations
Previous works usually identified the dominant flood-generation mechanism based on the comparison of the timing of events (Berghuijs et al, 2016; 2019b; Blöschl et al., 2017; S. Ye et al., 2017). Similar work has been implemented in our study watersheds, suggesting the importance of soil moisture and rainfall (Wang et al., 2022). Based on that, we further looked into the records to quantitatively evaluate the relative importance of soil moisture and rainfall in flood generation. However, there are limitations to our methods.
The precipitation data we used were averaged for the study watersheds from 247 meteorological stations. Given the large area and considerable spatial heterogeneity, the precipitation data we used may not always be representative of the actual precipitation events. The daily data could also average the rainfall intensity at an hourly scale, which could be influential in small mountainous watersheds. ET was scaled as 0.75 × ET0 to ensure that it is smaller than the potential evaporation. This is a simplified estimation of ET, and a more sophisticated method is needed for further analysis on specific catchments at the event scale.
The estimation of soil moisture is also highly simplified, which cannot be considered to be a precise estimation at the event scale. To reduce the influence from this simplification, we used the percentile of soil moisture to represent the relative wetness of soil moisture and the seasonal trend of soil moisture, which was then compared with the percentile of rainfall (see the Supplement and Figs. S3 and S4). While more sophisticated models can be used for soil moisture estimation, there could still be substantial uncertainties (Ran et al., 2020a), yet the seasonal trend and the relative magnitude, after averaging through long-term records, would be less impacted by the simplification in the estimation (Berghuijs et al., 2019b; Zhang et al., 2019).
Our findings may appear different from those in Yang et al. (2020), which attributed the dominant flood-generation mechanism in the Yangtze River basin to rainfall. This may be explained by different classification criteria. Yang et al. (2020) considered both short rain and long rain as rainfall impacts, while here we only considered the daily rainfall. Thus, the importance of antecedent soil moisture may be considered to be long-rain impacts in Yang et al. (2020). It is possible that soil moisture on the day before the AMFs may not be the soil moisture before the event in large catchments due to the long concentration time. We estimated the concentration time for 10 sites with the largest drainage areas (larger than 100 000 km2). The ones on the main stream and at the outlets of major tributaries following the United States Bureau of Reclamation (USBR) method (USBR, 1973; Ockert and Jeff, 2014). The concentration time is mostly within 2 d for main stream sites and is less than 24 h for sites at the outlets of major tributaries (Table S1 in the Supplement). Since the rest of the sites are all smaller than these, so too would be the concentration time. That is, for the natural watersheds we focused on, the concentration time is likely to be within 1 d. Thus, the soil moisture on the day before the AMFs would contribute to the generation of AMFs and should be applicable for this study.
Besides, the exchange with groundwater was not considered in the soil moisture estimation. The exchange with groundwater is more complicated and heterogenous (i.e., rivers could receive groundwater recharge in hilly areas and recharge groundwater in lower-lying land; Che et al., 2021). According to Huang et al. (2021), the variation in groundwater level in the Yangtze River basin is relatively small. Since the goal of this study is to capture the first-order seasonal variation in soil moisture and develop a framework that differentiates the relative importance of precipitation and soil moisture in flood generation, in this study, we estimated the soil moisture following Berhuijs et al. (2016, 2019b) with a simple water balance equation.
Moreover, this work is focused on the relative importance of soil moisture and rainfall, so the impact of snowmelt is not considered due to the warm and humid climate in the study watersheds. To apply our findings to cold watersheds with significant snow impact, the snowmelt component needs to be incorporated. In addition, our method is based on the average values from many years. While previous work indicated that the occurrence of floods in our study watersheds is highly concentrated (Wang et al., 2021), there could be strong interannual variability in other watersheds. In future studies, an annual-scale and event-scale analysis are needed to examine and improve our findings before it can be applied to watersheds with more diverse climate and landscape conditions. There could be uncertainties embedded in the estimation of soil moisture due to the uncertainties in the inputs and model structures. Comprehensive evaluation of the performance and uncertainty is beyond the scope of our study. More sophisticated models with a groundwater component, remote sensing data, and reanalysis product with a higher spatiotemporal resolution are needed to provide a more accurate estimation and further validation of soil moisture, ET, and advance our understanding of flood-generation SPR.
Heavy rainfall on highly saturated soil was identified as the dominant flood-generation mechanism across world (Berghuijs et al., 2019b; Wang et al., 2021; Wasko et al., 2020). This study aims to further evaluate the relative importance of antecedent soil moisture and rainfall on flood generation and the controlling factors. Climate and hydrological data from 224 hydrological stations and 247 meteorological stations in the middle and lower reaches of the Yangtze River basin were analyzed, along with the modeled soil moisture. Except for the regulated watersheds, the relative importance of antecedent soil moisture and daily rainfall present a significant correlation with the drainage area; the larger the watershed, and the more essential the antecedent soil saturation rate is in flood generation, the less important the daily rainfall will be.
Using the percentile of antecedent soil moisture and rainfall as coordinates, the flood-generation mechanism(s) of study watersheds could be grouped into three classes, namely antecedent soil-moisture-dominated large flat watersheds, heavy rainfall-dominated steep and small to middle-sized watersheds, and small to middle-sized watersheds with a gentle topographic gradient where flood occurrence requires both highly saturated soil and heavy rainfall. Our analysis further shows that the ratio of relative importance between antecedent soil moisture and rainfall (SPR) can be predicted by a topographic wetness index. When the topographic wetness index is large, the dominance of the antecedent soil moisture for extreme floods is stronger, and vice versa. The SPR also presents a negative correlation with area-normalized flood peak.
With the potential increase in extreme rainfall events (Gao and Xie, 2016; Chen and Zhai, 2016), upstream mountainous watersheds in the middle and lower Yangtze River basin are facing a higher risk of extreme floods. The lack of hydrological records further increases the vulnerability of people in these watersheds. The flood risks could be reduced by the construction of flood control facilities, but it is difficult to set flood control standards in these ungauged watersheds. Our findings provide a framework to quantitatively estimate the possible flood risk for these ungauged watersheds. Based on measurable watershed characteristics (i.e., drainage area and topographic gradient), the flood-generation SPR could be derived, which could then be used to estimate the mean annual flood. This information can provide scientific support for flood control management and infrastructure construction.
Future analysis at the event scale could help generate the flood-generation curve between SPR and discharge at the event scale to further improve flood risk predictions in these small, ungauged watersheds. With more data from other regions and the improved estimation or observation of soil moisture, we could expand our analysis to watersheds with more diverse climate and topographic characteristics to examine and refine our findings and to enhance our understandings of flood generation. Comparison between different time periods (i.e., before and after 2000) could also reveal temporal changes in flood generation, which may be linked to climate change, yet longer data records are needed to generate representative patterns.
The code is available from the authors upon request.
DEM data were downloaded from Geospatial Data Cloud at http://www.gscloud.cn/ (Chinese Academy of Sciences, 2020). Climatological data used in this study were obtained from China Meteorological Data Network, which can be accessed at http://data.cma.cn/ (CMA, 2020). Discharge data come from Annual Hydrological Report of the People's Republic of China issued by Yangtze River Water Resources Commission.
The supplement related to this article is available online at: https://doi.org/10.5194/hess-26-4919-2022-supplement.
QR and SY conceptualized the original idea and designed the work. JW conducted the data analysis. XC and LL contributed to the data collection and preparation. JL conducted additional analysis during the revision. QR, JW, and SY wrote the paper.
The contact author has declared that none of the authors has any competing interests.
Publisher's note: Copernicus Publications remains neutral with regard to jurisdictional claims in published maps and institutional affiliations.
This research has been funded by the National Key Research and Development Program of China (grant no. 2019YFC1510701-01) and National Natural Science Foundation of China (grant no. 51979243).
This research has been supported by the National Key Research and Development Program of China (grant no. 2019YFC1510701-01) and the National Natural Science Foundation of China (grant no. 51979243).
This paper was edited by Manuela Irene Brunner and reviewed by three anonymous referees.
Alfonso, R., Nilza, M. R. C., and Anderson, L. R.: Numerical Modelling of the Topographic Wetness Index: An Analysis at Different Scales, Int. J. Geosci., 4, 476–483, https://doi.org/10.4236/ijg.2011.24050, 2011.
Allen, R. G., Pereira, L. S., and Races, D.: Crop evapotranspiration – Guidelines for computing crop water requirements, FAO Irrigation and drainage paper No. 56, FAO, Rome, Italy, https://www.fao.org/3/X0490E/x0490e00.htm (last access: 10 November 2021), 1998.
Bennett, B., Leonard, M., Deng, Y., and Westra, S.: An empirical investigation into the effect of antecedent precipitation on flood volume, J. Hydrol., 567, 435–445, https://doi.org/10.1016/j.jhydrol.2018.10.025, 2018.
Berghuijs, W. R., Woods, R. A., Hutton, C. J., and Sivapalan, M.: Dominant flood generating mechanisms across the United States, Geophys. Res. Lett., 43, 4382–4390, https://doi.org/10.1002/2016GL068070, 2016.
Berghuijs, W. R., Allen, S. T., Harrigan, S., and Kirchner, J. W.: Growing Spatial Scales of Synchronous River Flooding in Europe, Geophys. Res. Lett., 46, 1423–1428, https://doi.org/10.1029/2018GL081883, 2019a.
Berghuijs, W. R., Harrigan, S., Molnar, P., Slater, L. J., and Kirchner, J. W.: The Relative Importance of Different Flood-Generating Mechanisms Across Europe, Water Resour. Res., 55, 4582–4593, https://doi.org/10.1029/2019WR024841, 2019b.
Bertola, M., Viglione, A., Vorogushyn, S., Lun, D., Merz, B., and Blöschl, G.: Do small and large floods have the same drivers of change? A regional attribution analysis in Europe, Hydrol. Earth Syst. Sci., 25, 1347–1364, https://doi.org/10.5194/hess-25-1347-2021, 2021.
Blöschl, G., Nester, T., Komma, J., Parajka, J., and Perdigão, R. A. P.: The June 2013 flood in the Upper Danube Basin, and comparisons with the 2002, 1954 and 1899 floods, Hydrol. Earth Syst. Sci., 17, 5197–5212, https://doi.org/10.5194/hess-17-5197-2013, 2013.
Blöschl, G., Hall, J., Parajka, J., Perdigão, R. A., Merz, B., Arheimer, B., Aronica, G. T., Bilibashi, A., Bonacci, O., Borga, M., Čanjevac, I., Castellarin, A., Chirico, G. B., Claps, P., Fiala, K., Frolova, N. L., Gorbachova, L., Gül, A., Hannaford, J., Harrigan, S., Kireeva, M. B., Kiss, A., Kjeldsen, T. R., Kohnová, S., Koskela, J. J., Ledvinka, O., Macdonald, N., Mavrova-Guirguinova, M., Mediero, L., Merz, R., Molnar, P. H., Montanari, A., Murphy, C., Osuch, M., Ovcharuk, V., Radevski, I., Rogger, M., Salinas, J. L., Sauquet, E., Šraj, M., Szolgay, J., Viglione, A., Volpi, E., Wilson, D., Zaimi, K., and Živković, N.: Changing climate shifts timing of European floods, Science, 357, 588–590, https://doi.org/10.1126/science.aan2506, 2017.
Blöschl, G., Hall, J., Viglione, A., Perdigao, R. A., Parajka, J., Merz, B., Lun, D., Arheimer, B., Aronica, G. T., Bilibashi, A., Boháč, M., Bonacci, O., Borga, M., Čanjevac, I., Castellarin, A., Chirico, G. B., Claps, P., Frolova, N., Ganora, D., Gorbachova, L., Gül, A., Hannaford, J., Harrigan, S., Kireeva, M., Kiss, A., Kjeldsen, T. R., Kohnová, S., Koskela, J. J., Ledvinka, O., Macdonald, N., Mavrova-Guirguinova, M., Mediero, L., Merz, R., Molnar, P., Montanari, A., Murphy, C., Osuch, M., Ovcharuk, V., Radevski, I., Salinas, J. L., Sauquet, E., Šraj, M., Szolgay, J., Volpi, E., Wilson, D., Zaimi, K., and Živković, N.: Changing climate both increases and decreases European river floods, Nature, 573, 108–111, 2019.
Berti, A., Tardivo, G., Chiaudani, A., Rech, F., and Borin, M.: Assessing reference evapotranspiration by the Hargreaves method in north-eastern Italy, Agr. Water Manage., 140, 20–25, https://doi.org/10.1016/j.agwat.2014.03.015, 2014.
Brunner, M. I., Seibert, J., and Favre, A. C.: Bivariate return periods and their importance for flood peak and volume estimation, Wire's Water, 3, 819–833, https://doi.org/10.1002/wat2.1173, 2016.
Brunner, M. I., Swain, D. L., Wood, R. R., Manuela, I. B., Daniel, L. S., Raul, R. W., Florian, W., James, M. D., Eric, G., and Ralf, L.: An extremeness threshold determines the regional response of floods to changes in rainfall extremes, Commun. Earth Environ., 2, 173–183, https://doi.org/10.1038/s43247-021-00248-x, 2021.
Cai, Q. H.: Great protection of Yangtze River and watershed ecology, Yangtze River, 01, 70–74, https://doi.org/10.16232/j.cnki.1001-4179.2020.01.011, 2020.
Che, Q., Su, X., Zheng, S., and Li, Y.: Interaction between surface water and groundwater in the Alluvial Plain (anqing section) of the lower Yangtze River Basin: environmental isotope evidence, J. Radioanal. Nucl. Chem., 329, 1331–1343, 2021.
Chen, Y. and Zhai, P.: Mechanisms for concurrent low-latitude circulation anomalies responsible for persistent extreme precipitation in the Yangtze River Valley, Clim. Dynam., 47, 989–1006, https://doi.org/10.1007/s00382-015-2885-6, 2016.
Chinese Academy of Sciences: Digital Elevation Model, http://www.gscloud.cn, last access: 1 November 2020.
CMA: Surface meteorological station daily dataset, http://data.cma.cn/, last access: 1 November 2020.
CRED: The human cost of natural disasters: A gobal perspective: Centre for research on the epidemiology of disasters, https://www.researchgate.net/publication/317645955 (last access: 10 November 2021), 2015.
Desai, B., Maskrey, A., Peduzzi, P., De Bono, A., and Herold, C. Making Development Sustainable: The Future of Disaster Risk Management, Global Assessment Report on Disaster Risk Reduction, UNISDR, http://archive-ouverte.unige.ch/unige:78299 (last access: 10 November 2021), 2015.
Do, H. X., Mei, Y., and Gronewold, A. D.: To what extent are changes in flood magnitude related to changes in precipitation extremes?, Geophys. Res. Lett., 47, e2020GL088684, https://doi.org/10.1029/2020GL088684, 2020.
Feng, B. F., Dai, M. L., and Zhang, T.: Effect of Reservoir Group Joint Operation on Flood Control in the Middle and Lower Reaches of Yangtze River, J. Water Resour. Res., 3, 278–284, https://doi.org/10.12677/JWRR.2017.63033, 2017.
Fu, G., Yu, J., Yu, X., Ouyang, R., Zhang, Y., Wang, P., Liu, W., and Min, L.: Temporal variation of extreme rainfall events in China, 1961–2009, J. Hydrol., 487, 48–59, https://doi.org/10.1016/j.jhydrol.2013.02.021, 2013.
Gao, T. and Xie, L.: Spatiotemporal changes in precipitation extremes over Yangtze River basin, China, considering the rainfall shift in the late 1970s, Global Planet. Change, 147, 106–124, https://doi.org/10.1016/j.gloplacha.2016.10.016, 2016.
Gao, Y., Wang, H., Lu, X., Xu, Y., Zhang, Z., and Schmidt, A. R.: Hydrologic Impact of Urbanization on Catchment and River System Downstream from Taihu Lake, J. Coast. Res., 84, 82–88, https://doi.org/10.2112/SI84-012.1, 2018.
Garg, S. and Mishra, V.: Role of extreme precipitation and initial hydrologic conditions on floods in Godavari river basin, India, Water Resour. Res., 55, 9191–9210, https://doi.org/10.1029/2019WR025863, 2019.
Grabs, T., Seibert, J., Bishop, K., and Laudon, H.: Modeling spatial patterns of saturated areas: A comparison of the topographic wetness index and a dynamic distributed model, J. Hydrol., 373, 15–23, https://doi.org/10.1016/j.jhydrol.2009.03.031, 2009.
Huang, C., Zhou, Y., Zhang, S., Wang, J., Liu, F., Gong, C., Yi, C., Li, L., Zhou, H., Wei, L., Pan, X., Shao, C., Li, Y., Han, W., Yin, Z., and Li, X.: Groundwater resources in the Yangtze River Basin and its current development and utilization, Geol. China, 48, 979–1000, 2021.
IPCC: Managing the Risks of Extreme Events and Disasters to Advance Climate Change Adaptation, edited by: Field, C. B., Barros, V., Stocker, T. F., Dahe, Q., Dokken, D. J., Ebi, K. L., Mastrandrea, M. D., Mach, K. J., Plattner, G., Allen, S. K., Tignor, M., and Midgley, P. M., Cambridge University Press, https://doi.org/10.1017/CBO9781139177245, 2012.
Kato, K.: On the Abrupt Change in the Structure of the Baiu Front over the China Continent in Late May of 1979, J. Meteorol. Soc. Jpn., 63, 20–36, https://doi.org/10.2151/jmsj1965.63.1_20, 1985.
Lehner, B., Reidy Liermann, C., Revenga, C., Vörösmarty, C., Fekete, B., Crouzet, P., Döll, P., Endejan, M., Frenken, K., Magome, J., Nilsson, C., Robertson, J. C., Rodel, R., Sindorf, N., and Wisser, D.: High-resolution mapping of the world's reservoirs and dams for sustainable river-flow management, Front. Ecol. Environ., 9, 494–502, 2011.
Li, Q., Wei, F., and Li, D.: Interdecadal variation of East Asian summer monsoon and drought/flood distribution over eastern China in the last 159 years, J. Geogr. Sci., 21, 579–593, https://doi.org/10.1007/s11442-011-0865-2, 2011.
Li, X., Zhang, K., Gu, P., Feng, H., Yin, Y., Chen, W., and Cheng, B.: Changes in precipitation extremes in the Yangtze River Basin during 1960–2019 and the association with global warming, ENSO, and local effects, Sci. Total Environ., 760, 144244, https://doi.org/10.1016/j.scitotenv.2020.144244, 2021.
Liu, B., Yan, Y., Zhu, C., Ma, S., and Li, J.: Record-breaking Meiyu rainfall around the Yangtze River in 2020 regulated by the subseasonal phase transition of the North Atlantic Oscillation, Geophys. Res. Lett., 47, e2020GL090342, https://doi.org/10.1029/2020GL090342, 2020.
Liu, L., Ye, S., Chen, C., Pan, H., and Ran, Q.: Nonsequential Response in Mountainous Areas of Southwest China, Front. Earth Sci., 9, 1–15, https://doi.org/10.3389/feart.2021.660244, 2021.
Liu, N., Jin, Y., and Dai, J.: Variation of Temperature and Precipitation in Urban Agglomeration and Prevention Suggestion of Waterlogging in Middle and Lower Reaches of Yangtze River, in: 3rd International Conference on Energy Equipment Science and Engineering (Iceese 2017), 28–31 December 2017, Beijing, China, 128 pp., https://doi.org/10.1088/1755-1315/128/1/012165, 2018.
Liu, S., Huang, S., Xie, Y., Wang, H., Leng, G., Huang, Q., Wei, X., and Wang, L.: Identification of the Non-stationarity of Floods: Changing Patterns, Causes, and Implications, Water Resour. Manage., 33, 939–953, 2018.
Liu, Y., Xinyu, L., Liancheng, Z., Yang, L., Chunrong, J., Ni, W., and Juan, Z.: Quantifying rain, snow and glacier meltwater in river discharge during flood events in the Manas River Basin, China, Nat. Hazards, 108, 1137–1158, https://doi.org/10.1007/s11069-021-04723-8, 2021.
Long, L. H., Ji, D. B., Yang, Z. Y., Cheng, H. Q., Yang, Z. J., Liu, D. F., Liu, L., and Lorke, A.: Tributary oscillations generated by diurnal discharge regulation in Three Gorges Reservoir, Environ. Res. Lett., 15, 084011, https://doi.org/10.1088/1748-9326/ab8d80, 2020.
Meena, R. S., Ramakae, J., and Kishanjit, K. K.: Precipitation-runoff simulation for a Himalayan River Basin, India using artificial neural network algorithms, Sci. Cold Arid Reg., 5, 85–95, https://doi.org/10.3724/SP.J.1226.2013.00085, 2013.
Meles, M. B., Younger, S. E., Jackson, C. R., Du, E., and Drover, D.: Wetness index based on landscape position and topography (WILT): Modifying TWI to reflect landscape position, J. Environ. Manage., 255, 109863, https://doi.org/10.1016/j.jenvman.2019.109863, 2020.
Miao, Q., Huang, M., and Li, R., Q.: Response of net primary productivity of vegetation in Yangtze River Basin to future climate change, J. Nat. Resour., 25, 1296–1305, https://doi.org/10.11849/zrzyxb.2010.08.007, 2015.
Munoz, S. E., Giosan, L., Therrell, M. D., Remo, J. W. F., Shen, Z., Sullivan, R. M., Wiman, C., O'Donnell, M., and Donnelly, J. P.: Climatic control of Mississippi River flood hazard amplified by river engineering, Nature, 556, 95–98, 2018.
Musselman, K. N., Lehner, F., Ikeda, K., Clark, M. P., Prein, A. F., Liu, C., Barlage, M., and Rasmussen, R.: Projected increases and shifts in rain-on-snow flood risk over western North America, Nat. Clim. Change, 8, 808–812, 2018.
Ockert, J. G. and Jeff, C. S.: Review of methods used to estimate catchment response time for the purpose of peak discharge estimation, Hydrolog. Sci. J., 59, 1935–1971, https://doi.org/10.1080/02626667.2013.866712, 2014.
Ohmura, A. and Wild, M.: Is the hydrological cycle accelerating?, Science, 298, 1345–1346, 2002.
Peng, T., Tian, H., Singh, V. P., Chen, M., Liu, J., Ma, H. B., and Wang, J. B.: Quantitative assessment of drivers of sediment load reduction in the Yangtze River basin, China, J. Hydrol., 580, 124242, https://doi.org/10.1016/j.jhydrol.2019.124242, 2020.
Qian, H. and Xu, S.-B.: Prediction of Autumn Precipitation over the Middle and Lower Reaches of the Yangtze River Basin Based on Climate Indices, Climate, 8, 53, https://doi.org/10.3390/cli8040053, 2020.
Ran, Q., Chen, X., Hong Y., Ye S., and Gao, J.: Impacts of terracing on hydrological processes: A case study from the Loess Plateau of China, J. Hydrol., 588, 125054, https://doi.org/10.1016/j.jhydrol.2020.125045, 2020a.
Ran, Q., Zong, X., Ye, S., Gao, J., and Hong, Y.: Dominant mechanism for annual maximum flood and sediment events generation in the Yellow River basin, Catena, 187, 104376, https://doi.org/10.1016/j.catena.2019.104376, 2020b.
Rottler, E., Francke, T., Bürger, G., and Bronstert, A.: Long-term changes in central European river discharge for 1869–2016: impact of changing snow covers, reservoir constructions and an intensified hydrological cycle, Hydrol. Earth Syst. Sci., 24, 1721–1740, https://doi.org/10.5194/hess-24-1721-2020, 2020.
Smith, J. A., Cox, A. A., Baeck, M. L., Yang, L., and Bates, P.: Strange floods: the upper tail of flood peaks in the United States, Water Resour. Res., 54, 6510–6542, 2018.
Sørensen, R., Zinko, U., and Seibert, J.: On the calculation of the topographic wetness index: evaluation of different methods based on field observations, Hydrol. Earth Syst. Sci., 10, 101–112, https://doi.org/10.5194/hess-10-101-2006, 2006.
Suresh, S. S., Benefit, O., Augustine, T., and Trevor, P.: Peoples' Perception on the Effects of Floods in the Riverine Areas of Ogbia Local Government Area of Bayelsa State, Nigeria, Knowledge Manage., 12, 21–44, https://doi.org/10.18848/2327-7998/CGP/v12i02/50793, 2013.
Tramblay, Y., Villarini, G., El Khalki, E. M., Gründemann, G., and Hughes, D.: Evaluation of the drivers responsible for flooding in Africa, Water Resour. Res., 57, e2021WR029595, https://doi.org/10.1029/2021WR029595, 2021.
USBR – United States Bureau of Reclamation:. Design of small dams, 2nd Edn., Water Resources Technical Publications, Washington, DC, https://www.osti.gov/biblio/29108 (last access: 10 November 2021),1973.
Vicente-Serrano, S. M., Azorin-Molina, C., Sanchez-Lorenzo, A., Revuelto, J., Lopez-Moreno, J. I., Gonzalez-Hidalgo, J. C., Moran-Tejeda, E., and Espejo, F.: Reference evapotranspiration variability and trends in Spain, 1961–2011, Global Planet. Change, 121, 26–40, https://doi.org/10.1016/j.gloplacha.2014.06.005, 2014.
Villarini, G. and Wasko, C.: Humans, climate and streamflow, Nat. Clim. Change, 11, 725–726, https://doi.org/10.1038/s41558-021-01137-z, 2021.
Volpi, E., Di Lazzaro, M., Bertola, M., Viglione, A., and Fiori, A.: Reservoir Effects on Flood Peak Discharge at the Catchment Scale, Water Resour. Res., 54, 9623–9636, https://doi.org/10.1029/2018wr023866, 2018.
Wang, J., Ran, Q., Liu, L., Pan, H., and Ye, S.: Study on the Dominant Mechanism of Extreme Flow Events in the Middle and Lower Reaches of the Yangtze River, China Rural Water and Hydropower, 06, 119–124, 2022.
Wang, W., Xing W., Yang, T., Shao, Q., Peng, S., Yu, Z., and Yong, B.: Characterizing the changing behaviours of precipitation concentration in the Yangtze River Basin, China, Hydrol. Process., 27, 3375–3393, https://doi.org/10.1002/hyp.9430, 2013.
Wasko, C. and Nathan, R.: Influence of changes in rainfall and soil moisture on trends in flooding, J. Hydrol., 575, 432–441, https://doi.org/10.1016/j.jhydrol.2019.05.054, 2019.
Wasko, C., Nathan, R., and Peel, M. C.: Changes in antecedent soil moisture modulate flood seasonality in a changing climate, Water Resour. Res., 56, e2019WR026300, https://doi.org/10.1029/2019WR026300, 2020.
Wasko, C., Nathan, R., Stein, L., and O'Shea, D.: Evidence of shorter more extreme rainfalls and increased flood variability under climate change, J. Hydrol., 603, 126994, https://doi.org/10.1016/j.jhydrol.2021.126994, 2021.
Wu, X. S., Guo, S. L., and Ba, H. H.: Long-term precipitation forecast method based on SST multipole index, J. Water Conserv., 10, 1276–1283, https://doi.org/10.13243/j.cnki.slxb.20180544, 2018.
Xia, J. and Chen, J.: A new era of flood control strategies from the perspective of managing the 2020 Yangtze River flood, Sci. China-Earth Sci., 64, 1–9, https://doi.org/10.1007/s11430-020-9699-8, 2021.
Xie, Z., Du, Y., Zeng, Y., and Miao, Q.: Classification of yearly extreme precipitation events and associated flood risk in the Yangtze-Huaihe River Valley, Sci. China-Earth Sci., 61, 1341–1356, https://doi.org/10.1007/s11430-017-9212-8, 2018.
Yang, H. F., Yang, S. L., Xu, K. H., Milliman, J. D., Wang, H., Yang, Z., Chen, Z., and Zhang, C. Y.: Human impacts on sediment in the Yangtze River: A review and new perspectives, Global Planet. Change, 162, 8–17, https://doi.org/10.1016/j.gloplacha.2018.01.001, 2018.
Yang, L., Wang, L., Li, X., and Gao, J.: On the flood peak distributions over China, Hydrol. Earth Syst. Sci., 23, 5133–5149, https://doi.org/10.5194/hess-23-5133-2019, 2019.
Yang, W., Yang, H., and Yang, D.: Classifying floods by quantifying driver contributions in the Eastern Monsoon Region of China, J. Hydrol., 585, 124767, https://doi.org/10.1016/j.jhydrol.2020.124767, 2020.
Yang, W., Yang, H., Yang, D., and Hou, A.: Causal effects of dams and land cover changes on flood changes in mainland China, Hydrol. Earth Syst. Sci., 25, 2705–2720, https://doi.org/10.5194/hess-25-2705-2021, 2021.
Ye, S., Li, H., Leung, L. R., Guo, J., Ran, Q., Demissie, Y., and Sivapalan, M.: Understanding flood seasonality and its temporal shifts within the contiguous United States, J. Hydrometeorol., 18, 1997–2009, 2017.
Ye, X., Xu, C.-Y., Li, Y., Li, X., and Zhang, Q.: Change of annual extreme water levels and correlation with river discharges in the middle-lower Yangtze River: Characteristics and possible affecting factors, Chinese Geogr. Sci., 27, 325–336, https://doi.org/10.1007/s11769-017-0866-x, 2017.
Zhang, H., Liu, S., Ye, J., and Yeh, P. J. F.: Model simulations of potential contribution of the proposed Huangpu Gate to flood control in the Lake Taihu basin of China, Hydrol. Earth Syst. Sci., 21, 5339–5355, https://doi.org/10.5194/hess-21-5339-2017, 2017.
Zhang, K., Wang, Q., Chao, L., Ye, J., Li, Z., Yu, Z., Yang, T., and Ju, Q.: Ground observation-based analysis of soil moisture spatiotemporal variability across a humid to semi-humid transitional zone in China, J. Hydrol., 574, 903–914, 2019.
Zhang, S., Kang, L., and He, X.: Equal proportion flood retention strategy for the leading multireservoir system in upper Yangtze River, in: International Conference on Water Resources and Environment, WRE 2015, July 2015, Beijing, China, https://doi.org/10.1201/b19079-20, 2015.
Zhang, W., Villarini, G., Vecchi, G. A., and Smith, J. A.: Urbanization exacerbated the rainfall and flooding caused by hurricane Harvey in Houston, Nature, 563, 384–388, 2018.
Zou, B., Li, Y., and Feng, B.: Analysis on dispatching influence of Three Gorges Reservoir on water level of main stream in mid-lower reaches of Yangtze River: a case study of flood in July, 2010, Yangtze River, 42, 80–82+100, https://doi.org/10.16232/j.cnki.1001-4179.2011.06.004, 2011.