the Creative Commons Attribution 4.0 License.
the Creative Commons Attribution 4.0 License.
 | 06 Oct 2022
Response of active catchment water storage capacity to a prolonged meteorological drought and asymptotic climate variation
Jing Tian
Zhengke Pan
Jiabo Yin
Yanlai Zhou
Jun Wang
Studies on the hydrological response to continuous extreme and asymptotic climate change can improve our ability to cope with intensified water-related problems. Most of the literature focused on the runoff response to climate change, while neglecting the impacts of the potential variation in the active catchment water storage capacity (ACWSC) that plays an essential role in the transfer of climate inputs to the catchment runoff. This study aims to systematically identify the response of the ACWSC to a long-term meteorological drought and asymptotic climate change. First, the time-varying parameter is derived to reflect the ACWSC periodic and abrupt variations in both drought and non-drought periods. Second, the change points and varying patterns of the ACWSC are analyzed based on the Bayesian change point analysis with multiple evaluation criteria. Finally, various catchment properties and climate characteristics are used to explore the possible relationship between these variables and the temporal variation characteristics of the ACWSC. The catchments that suffered from a prolonged meteorological drought in southeast Australia were selected as the case study. Results indicate that: (1) the increase in amplitude change in the ACWSC is observed in 83/92 catchments during the prolonged drought period, and significant shifts in the mean value of the ACWSC are detected in catchments; (2) the average response time of the ACWSC for all 92 catchments with significant changes is 641.3 d; (3) the values of the ACWSC changed significantly in the catchments with small areas, low elevations, small slope ranges, large forest coverage, and high soil water-holding capacities. This study could enhance our understanding of the variations in catchment property under climate change.
- Article
(2500 KB) - Full-text XML
- BibTeX
- EndNote


Climate change has been one of the most important drivers influencing the mechanism of runoff generation and the confluence process of catchments (Jung et al., 2012; Changnon and Gensini, 2019). Depending on the extent and duration of climate change, it could be classified into extreme (e.g., from prolonged meteorological drought to extremely wet conditions in a period) and asymptotic changes (climate change in different seasons in a normal year). For instance, significant variations (i.e., less runoff than expected) in hydrological behavior have been reported during the decade-long millennium drought of many catchments in southeastern Australia compared with the previous wet period (Saft et al., 2016). In addition, seasonally asymptotic variations have been identified in many catchments in America due to the seasonal growth and die-off of vegetation (Deng et al., 2018; Pan et al., 2019a), in Asia (Deng et al., 2016) and in Australia (Pan et al., 2019b). Studies on the hydrological response of catchments to different climate change scenarios not only can improve our understanding of the hydrological variation mechanism of the catchment, but can also enhance our ability to prevent unpredictable extreme events (Kusangaya et al., 2014; Kundu et al., 2017).
Accordingly, studies on the hydrological response to the changing environments generally included two main approaches, i.e., statistical analysis and hydrological modeling. Statistical analysis methods can be used to detect trend changes of prolonged hydrological and meteorological data series (Costa et al., 2003; Siriwardena et al., 2006); nevertheless, they usually lack sufficient physical explanations for the potential variation in catchment hydrological response (Lin et al., 2015). Hydrological models that can comprehensively consider the spatial heterogeneity and physical process of the catchment are broadly used to quantify the hydrological response under multiple climate conditions (Abbaspour et al., 2007; Tu, 2009; Chen et al., 2019; Tian et al., 2021). For example, Chawla and Mujumdar (2015) adopted the variable infiltration capacity (VIC) model to evaluate the runoff response in the upper Ganga basin. Shen et al. (2018) adopted the Hydrological Model of École de Technologies Supérieure (HMETS) to estimate the uncertainty of runoff response to climate change. Tian et al. (2021) applied the Soil and Water Assessment Tool (SWAT) model to assess the effects of climate change on future runoff in the Han River basin, China. However, most of the previous studies on hydrologic response mainly focused on the variations in runoff response to climate change, without paying attention to the causality between the varying climates (i.e., extreme, and asymptotic changes of climates) and variation in catchment properties.
Many previous studies (McNamara et al., 2011; Melsen et al., 2016; Carrer et al., 2019) indicated that the active catchment water storage capacity (ACWSC) is one of the most significant parameters influencing the mechanism of hydrological response of catchments. According to McNamara and colleagues, the ACWSC “refers to the maximum volume of water stored within a catchment and its distribution among groundwater, soil moisture, vegetation, surface water, and snowpack, which are the variables that ultimately characterize the state of the hydrological system” (McNamara et al., 2011). The root zone storage capacity is defined as “the maximum amount of soil moisture that can be accessed by vegetation for transpiration” (Gao et al., 2014; Nijzink et al., 2016; Singh et al., 2020; Bouaziz et al., 2022). For a given catchment, the value of the ACWSC should be greater than or equal to the root zone storage capacity.
Our previous study identified the impact of a meteorological drought on the ACWSC by investigating the changes in hydrological model parameters before and after drought events (Pan et al., 2020). Results showed that there were significant shifts in the ACWSC in almost two thirds of the catchments in southeastern Australia during the prolonged meteorological drought period. Two subsets of catchments with opposite response directions were identified in the study area, i.e., the subsets of catchments with reduced and increased runoff generation rates, respectively. The main potential reasons may be the difference in the proportion of evergreen broadleaf forests in these catchments. We only considered the average shifts from the non-drought period to the drought period and treated the ACWSC of each period as a constant while neglecting the time-varying characteristics of the ACWSC of each catchment attributable to the periodic climate change, and thus were unable to reflect variation in catchment characteristics under asymptotic climate.
Recently, studies of the potential time-varying ACWSC characteristics based on the simulation of the temporal variations of hydrological parameters have attracted a lot of attention (Coron et al., 2012; Brigode et al., 2013; Patil and Stieglitz, 2015; Deng et al., 2018) and provided a new approach for better representing changes in catchment characteristics (Deng et al., 2016). Accordingly, the selected model parameters that refer to the ACWSC in the model structure were constructed as multiple hypothetical functions based on physical covariates (e.g., time covariates and catchment attributes), and their simulation results were evaluated and compared with observations through specific criteria. Thus, the functional form that achieved the best simulation performance would be recognized as the best item to represent the potential changes in the catchment property (Jeremiah et al., 2013; Westra et al., 2014; Pan et al., 2019a, b).
In this study, we systematically explore the response of the ACWSC both to extreme climate changes (i.e., prolonged meteorological drought) and to asymptotically periodic climate changes. Three scientific questions will be investigated as follows:
-
What are the change characteristics of the ACWSC under the conditions of prolonged meteorological drought and asymptotic climate variation?
-
Which catchment features and climate factors are more likely to relate to the change in the ACWSC?
-
What is the difference in the ACWSC when both extreme climate variation and asymptotic climate variation are considered compared with extreme climate variation only?
2.1 Study area
In this study, southeastern Australia is selected as the initial study area. To minimize the impact of human activities, 398 catchments that were not disturbed by reservoirs or irrigation systems are selected. The study area extends from southern Victoria to New South Wales and Queensland. The study area and the locations of the 398 initial catchments are illustrated in Fig. 1. Saft et al. (2015) and Pan et al. (2019b) indicated that these catchments had experienced about 10 years of meteorological drought near the millennium, which had a significant impact on the stability of local ecosystems and the development of society, economy, and politics (Nicholls, 2004; Hunt, 2009; Potter et al., 2011; Hughes et al., 2012; van Dijk et al., 2013; Saft et al., 2015).
Table 1Description of the dataset adopted in this study.

Note: AWHC denotes the available soil water-holding capacity; Ks refers to the saturated hydraulic conductivity.
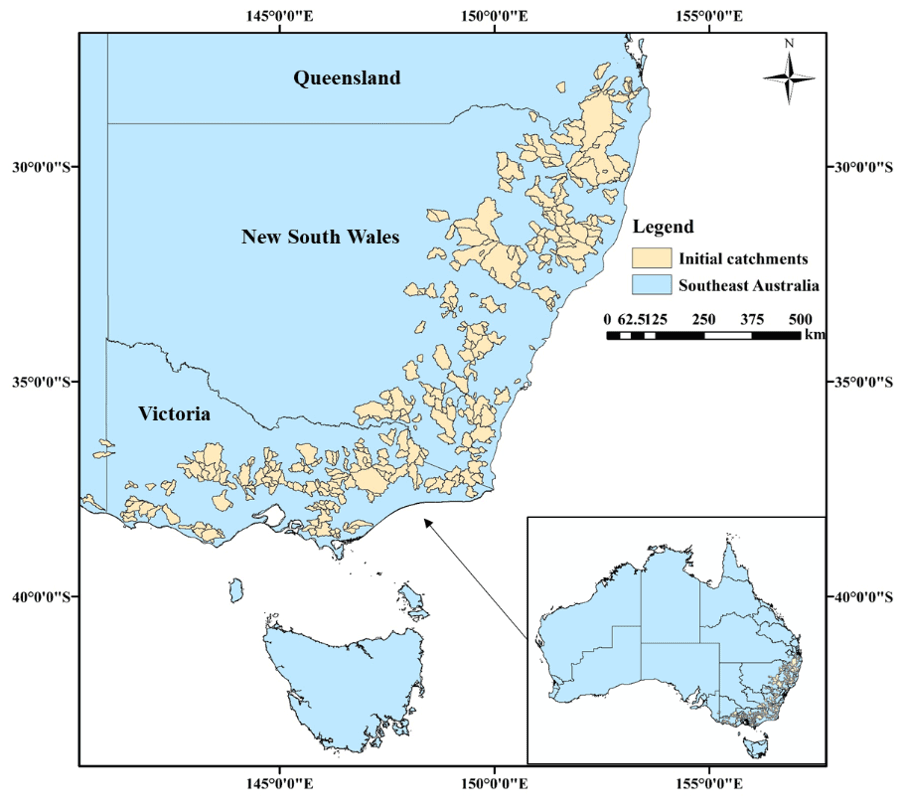
Figure 1Spatial distribution of the original 398 catchments in southeastern Australia that were selected from Zhang et al. (2013).
The essential climate characteristics include the large proportion of arid areas, the semi-annular distribution of annual precipitation, and the terrain, geology, land cover, and climate conditions are differentiated between various state catchments. The annual mean precipitation and temperature range from 507 to 1814 mm and 8.26 to 19.52∘, respectively. From the perspective of spatial and temporal distribution, the precipitation in the catchments of Victoria state is mainly concentrated in winter. By contrast, the northern catchments in New South Wales and Queensland states have more rain in summer than in winter. The potential reason for this phenomenon is ENSO (El Niño–Southern Oscillation). In terms of runoff, runoff in summer is dominant in northern catchments, while runoff in winter is more likely to occur in southern catchments.
2.2 Data set
Table 1 summarizes the description and source of the three types of data sets, which include (1) meteorological data (daily precipitation and potential evapotranspiration – PET), (2) hydrological data (daily runoff), and (3) catchment characteristics (catchment area, mean elevation, mean slope, forest coverage percentage, etc.).
Table 2Summary of the characteristics of the 145 catchments that had prolonged meteorological drought, including the mean, median, minimum, and maximum estimates of nine catchment features.
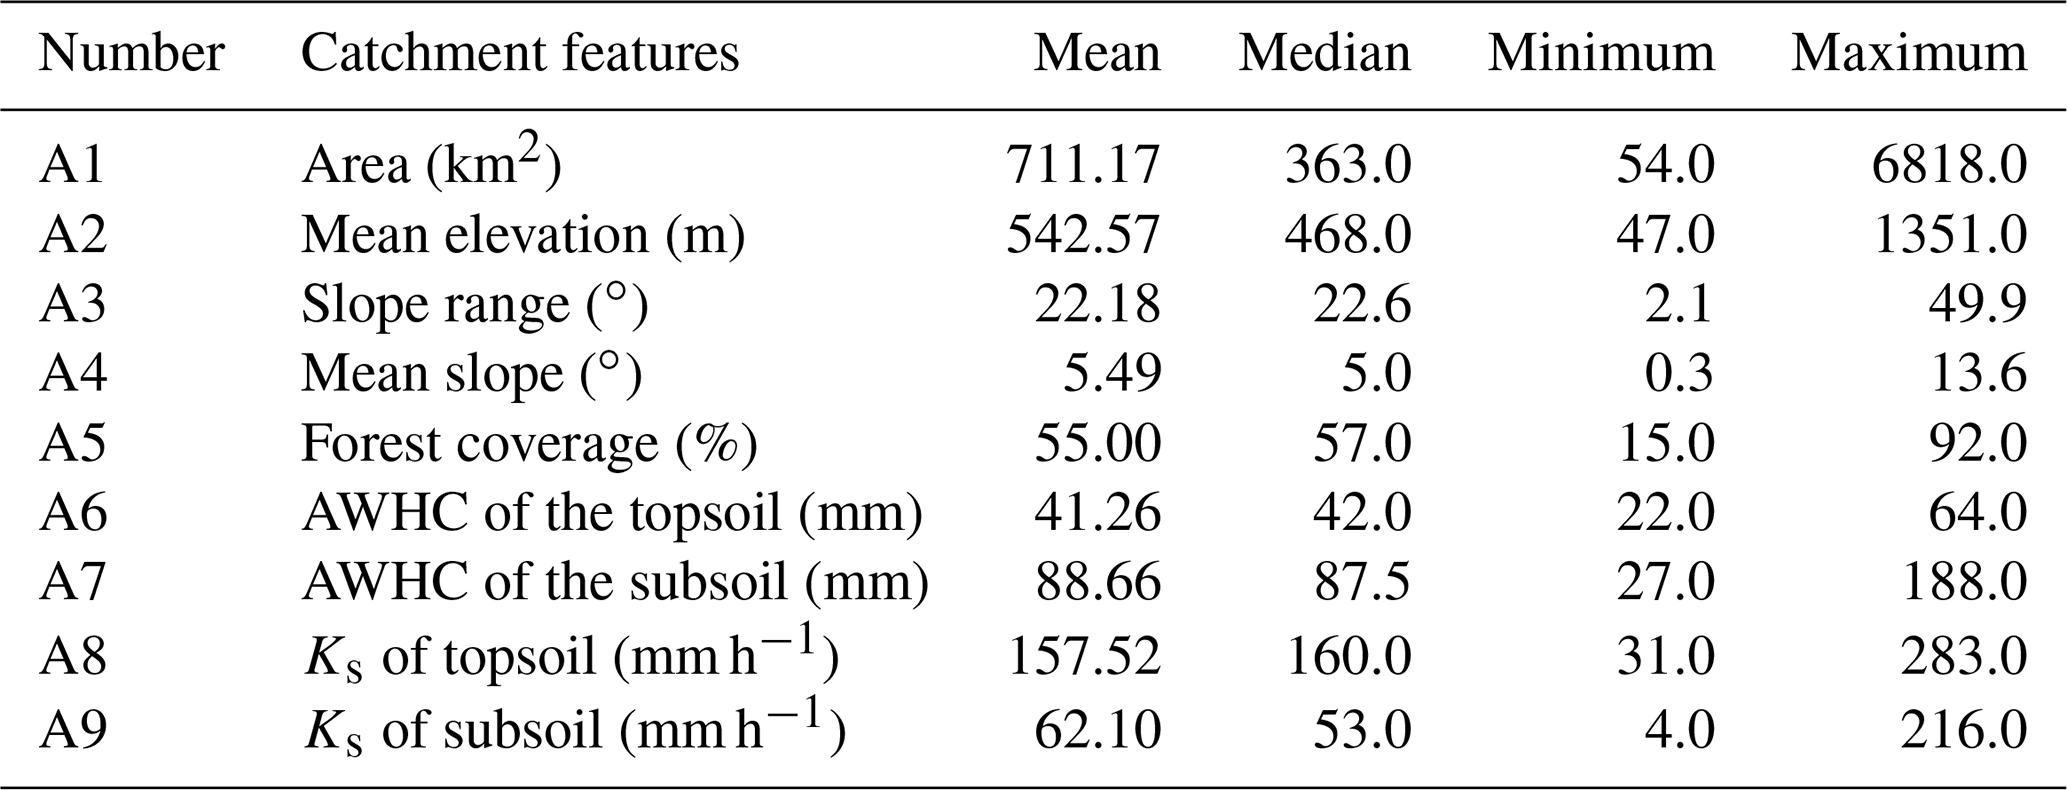
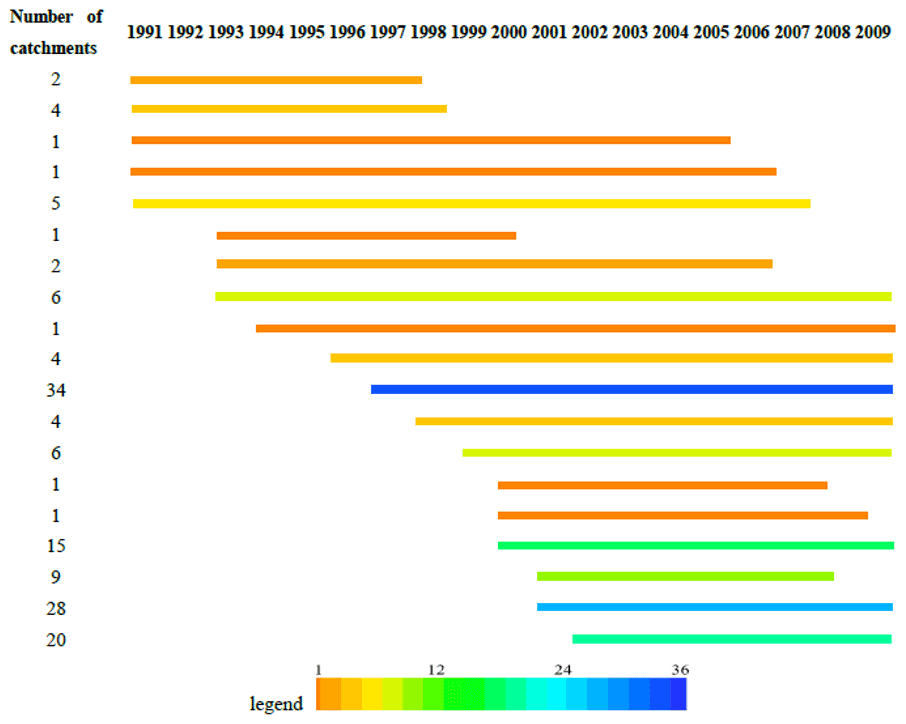
Figure 2The drought periods correspond to 145 catchments with prolonged meteorological drought in southeastern Australia.
A total of 398 catchments were selected by Zhang et al. (2013), with catchment areas ranging from 50 to 17 000 km2. The collection period of observations of these catchments ranges from 1976 to 2011. It is noted that the historical meteorological observations of all catchments in the data sets were complete. However, the daily runoff observations of 125 catchments were incomplete with the integrity of the time series being less than 80 %. Thus, these catchments were excluded, and the remaining 273 catchments were used for meteorological drought identification. Finally, 145 catchments were identified through a long-term meteorological drought with a drought period longer than 7 years. The drought periods corresponding to these 145 catchments are exhibited in Fig. 2. Based on the identification criteria of the prolonged drought period, all the drought periods in these catchments lasted more than 7 years. In addition, the drought periods of 35 % of the catchments spanned over 13 years. The prolonged meteorological drought of most catchments started after 1990 and ended before 2009. In particular, the meteorological drought of 34 catchments began in 1997, and of the 37 catchments it began in 2001.
The characteristics of the 145 catchments with prolonged meteorological drought (Table 2) demonstrate that there are significant differences in physical properties among different catchments. For example, the catchment area, mean elevation, and mean slope range from 54 to 6818 km2, from 47 to 1351 m, and from 0.3 to 13.6∘, respectively. The interval of forest coverage is [15 %, 92 %]. These catchment features were selected as potential impact factors and analyzed further in Sect. 4.3.
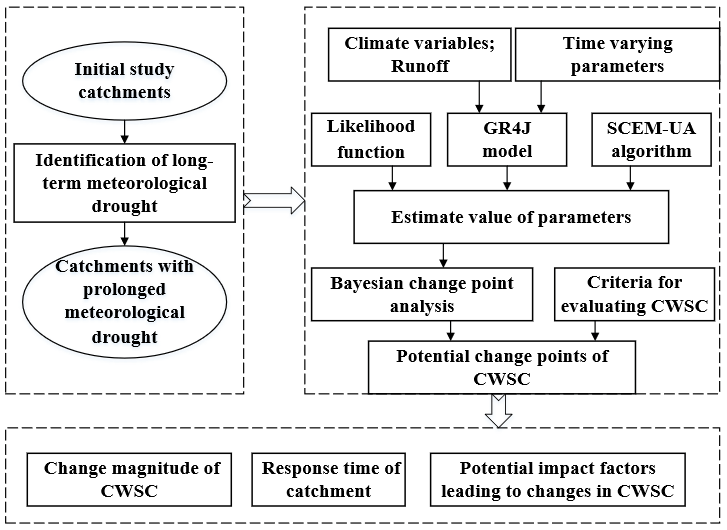
The proposed methodology and procedures are sketched in Fig. 3. To investigate the response of the ACWSC to the prolonged meteorological drought and asymptotic climate variation, the study scheme is conducted with the following three procedures: (1) identification of prolonged meteorological drought; (2) derivation of the response of the ACWSC to long-term meteorological drought and asymptotic climate variation based on the Bayesian change point analysis and the hydrological modeling approach; and (3) analysis of potential factors (i.e., properties of the catchments and climate characteristics) that may be related to the potential changes of the ACWSC and the response time (defined as the time interval between the occurrence of the prolonged meteorological drought and the abrupt shift of the ACWSC).
3.1 Identification of prolonged meteorological drought
There are many methods or indexes, such as the standardized precipitation index (SPI) (Bayat et al., 2015), rainfall departure analysis (Kumar et al., 2020), and standardized precipitation–evapotranspiration index (SPEI) (Das et al., 2021), that have been used to identify the prolonged meteorological drought. Saft et al. (2015) introduced a drought definition algorithm that was based on the annual rainfall only and proved to have a lower degree of dependence and more robustness than other selected approaches in the southeastern Australia catchments. It is mentioned that the prolonged drought period should be longer than 7 years according to the defined algorithm. For more detailed information about this method, please refer to Saft et al. (2015) and Pan et al. (2019b).
3.2 Hydrological model
The GR4J hydrological model (modèle du Génie Rural à 4 paramètres Journalier) was used to simulate the potential change characteristics of the ACWSC before and after the prolonged meteorological drought. The GR4J model is a daily lumped rainfall–runoff model developed by Perrin et al. (2003) and improved by Le Moine et al. (2008), and it has been used in more than 400 regions with various climatic characteristics around the world, such as China (Zeng et al., 2019), France (Perrin et al., 2003), North America (Pan et al., 2019a), and Australia (Coron et al., 2012). Its validity in the simulation of the rainfall–runoff relationship and reflection of potential changes in catchment properties was verified by Le Moine et al. (2008).
3.2.1 Model structure
The original GR4J model framework proposed by Perrin et al. (2003) only contains four parameters, and its structure is shown in Fig. 4. The meanings of the four model parameters are introduced as follows: θ1 is the maximum capacity of the soil moisture accounting for storage, which is used to represent the ACWSC (mm) in this study; θ2 is the groundwater exchange coefficient (mm); θ3 represents the one-day-ahead maximum capacity of the routing storage (mm); and θ4 is the time base of unit hydrograph UH1 (day). All model parameters are real values, θ1, θ3 and θ4 are positive, and θ2 can be positive, negative, or 0.
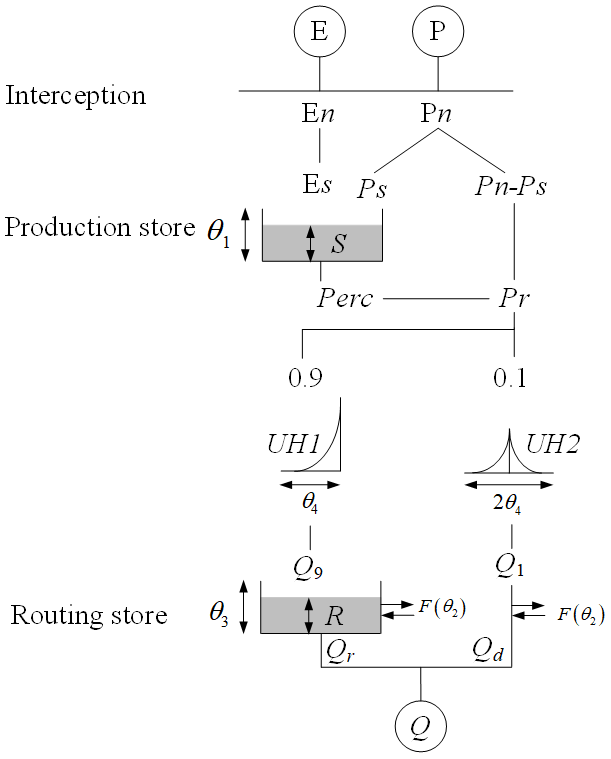
Figure 4Diagram of the GR4J model proposed by Perrin et al. (2003).
Based on the existing data and catchment attributes, it is almost impossible to obtain the real value of the ACWSC with current technology. However, the hydrological simulation method provides a new perspective for revealing the potential changes of the ACWSC, i.e., we can use a specific parameter (θ1) in the GR4J model to represent the ACWSC and characterize its variation in the real catchment. Similar studies can be found in Westra et al. (2014) and Deng et al. (2016). Hence, the simulated values of parameter θ1 and its time-varying characteristics are used to represent the change in the real ACWSC. It should be noted that θ2, θ3 and θ4 are assumed to remain constant; similar parameter settings can be found in previous studies (Westra et al., 2014; Pan et al., 2020).
3.2.2 Periodicity of the ACWSC
As explained, parameter θ1 in the GR4J model was used to represent the real ACWSC according to its implications. Our previous work (Pan et al., 2020) verified that the ACWSC (i.e., parameter θ1) had an “abrupt” point after the prolonged meteorological drought, which assumes that the offset of the estimated θ1 represents the change in the ACWSC. Meanwhile, θ1 in each period is recognized as a constant value and does not include the periodicity of the ACWSC that was outlined by many previous works (Nepal et al., 2017; Kunnath-Poovakka and Eldho, 2019; Sezen and Partal, 2019). However, Westra et al. (2014) and Pan et al. (2020) indicated that the ACWSC had periodic variability that may be due to the seasonal growth and wiling of catchment vegetation.
In this study, the potentially periodic variation characteristics of the ACWSC (represented by GR4J model parameter θ1) were included to reflect the asymptotic change within different periods (i.e., periods before and after the change point), which was described by the sine function. The sine function is one of the most fundamental functional forms to represent the periodic change of variables (Westra et al., 2014; Pan et al., 2019a, b). Furthermore, the potentially extreme change in the ACWSC between the two periods was denoted by the variations between Eqs. (1) and (2). The time-varying functions of θ1 during two periods are presented as follows:
Before the change point:
After the change point:
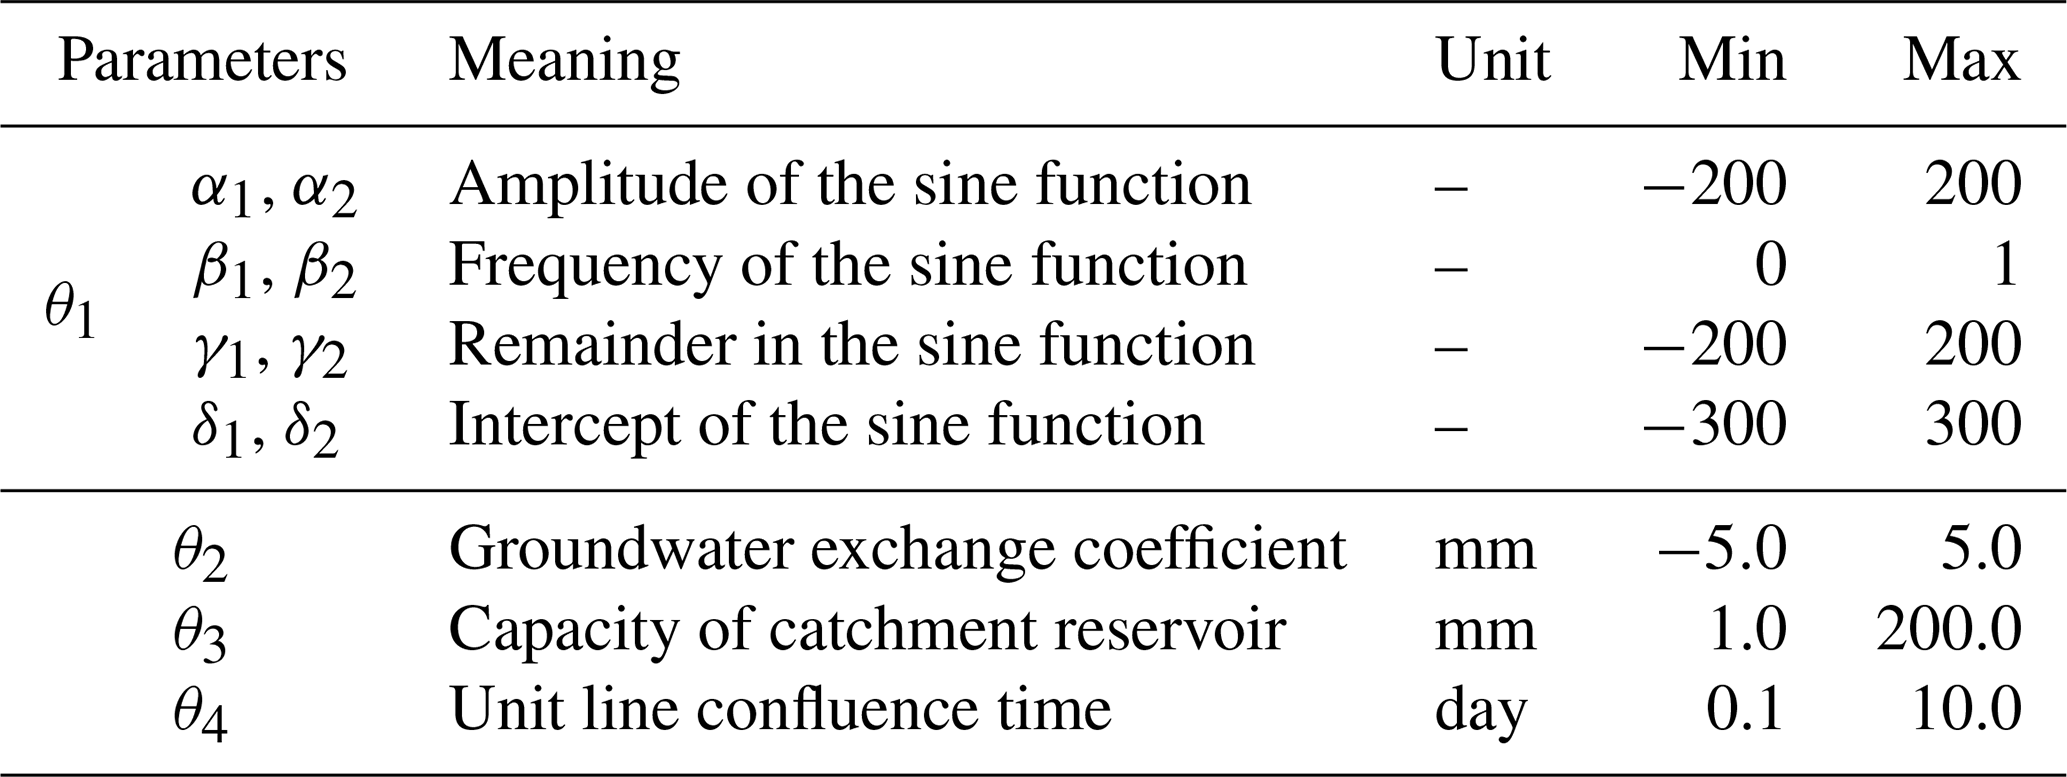
where, α1, β1, γ1, δ1 and α2, β2, γ2, δ2 are regression parameters for the time-varying function; α1 and α2 signify the amplitude of the sine function; β1 and β2 represent the frequency of the sine function; γ1 and γ2 denote the remainder in the sine function; and δ1 and δ2 refer to the intercept.
3.2.3 Likelihood function and parameter estimation
(1) Likelihood function
In this study, the likelihood function for catchment i from Thiemann et al. (2001) was adopted, which is shown as follows:
where p means the probability of likelihood; ; Γ(.) denotes the gamma function; T is the number of time steps; q represents the measured runoff; ξ denotes the climate variable input into the hydrological model; et refers to the residual error at time step t; and r is the type of the residual-error model (in this study, r is represented by Gaussian distribution). When verifying the model type of the residual, parameters ω(r), β(r) are constant values as r is certain. In addition, the prior distribution of all unknown quantities is the uniform distribution.
(2) Parameter estimation
The posterior distribution of all unknown variables was estimated using the Shuffled complex evolution metropolis (SCEM-UA) algorithm, which was based on the Markov chain Monte Carlo method (Vrugt et al., 2003; Ajami et al., 2007). For the convergence of parameters, the Gelman–Rubin convergence value was selected as the evaluation standard, and the convergence threshold was 1.2. The pre-set ranges of all parameters are shown in Table 3.
3.3 Change point analysis of ACWSC
3.3.1 Bayesian change point analysis
The Bayesian change point analysis is one of the best ways available to explore the possible change time of the ACWSC (Carlin et al., 1992; Cahill et al., 2015). The likelihood probability was used to evaluate the possibility of each potential change point. The most likely time point of each potential scheme is regarded as the ultimate change point of that catchment.
3.3.2 Criteria for evaluating significant changes in ACWSC
To evaluate whether the ACWSC changed significantly under climate change, the following three criteria were adopted.
(1) The Nash–Sutcliffe efficiency coefficient
To guarantee the reasonable simulation results of the GR4J model, the Nash–Sutcliffe efficiency (NSE) coefficient values before and after the change point should be greater than 0.6. Furthermore, the difference in NSE values between the two periods should be less than |±20 %|.
(2) Minimum requirements for significant changes in storage capacity
The change rate of the estimated parameter before and after the change point should exceed |±20 %|, i.e., .
(3) Robustness requirements of the results
The initial values of model parameters were created three times to reduce their impacts on the final simulation results. Moreover, only the catchments that have significant changes in computation results will be taken as the final change items. If the simulation results meet such robustness requirements, the results would have the lowest dependency and the strongest stability on the adopted algorithm and model.
3.4 Response time of a catchment
Van Lanen et al. (2013) and Huang et al. (2017) showed that the recharge between the groundwater and surface runoff would alleviate the hydrological response under short-term meteorological drought. In other words, groundwater would buffer the surface runoff during the drought period. If the duration of the meteorological drought was longer than several years or even decades, the hydraulic connection between the surface runoff and the underground runoff would be weak due to the gradual decrease of groundwater level. For example, Pan et al. (2020) indicated that the ACWSC may change with the occurrence of the prolonged meteorological drought, and the potential reasons were the difference in soil composition and the extensive death of vegetation during the drought period. It should also be noted that the ACWSC would not change immediately after the occurrence of the meteorological drought but respond after a period due to the existence of catchment elasticity (e.g., the existence of the hydraulic connection between surface runoff and groundwater). Thus, the time interval between the occurrence of the meteorological drought and the change point of the ACWSC is named the “catchment response time”.
3.5 Potential factors associated with the changes in ACWSC
The process that leads to the change in the ACWSC cannot be measured directly, and thus some measurable factors are used to probe the lurking correlation between the change in the ACWSC and the catchment response time. We select 33 potential factors of catchments and list them in Table 4, which includes nine catchment features and 24 local climate variables. It is noted that because of the limitation of available data for catchment characteristics, only one static/constant value of the catchment features (A1–A9) was used for the correlation analysis. Furthermore, climate variables in four time scales were used, including daily (B1–B4), monthly (B5–B7), seasonal (B8–B15), and annual (B16–B24) variables.
Table 4Category of the selected variables that may be associated with the changes in the ACWSC. The selected variables were divided into two parts, i.e., catchment features (nine variables) and climate variables (24 variables).
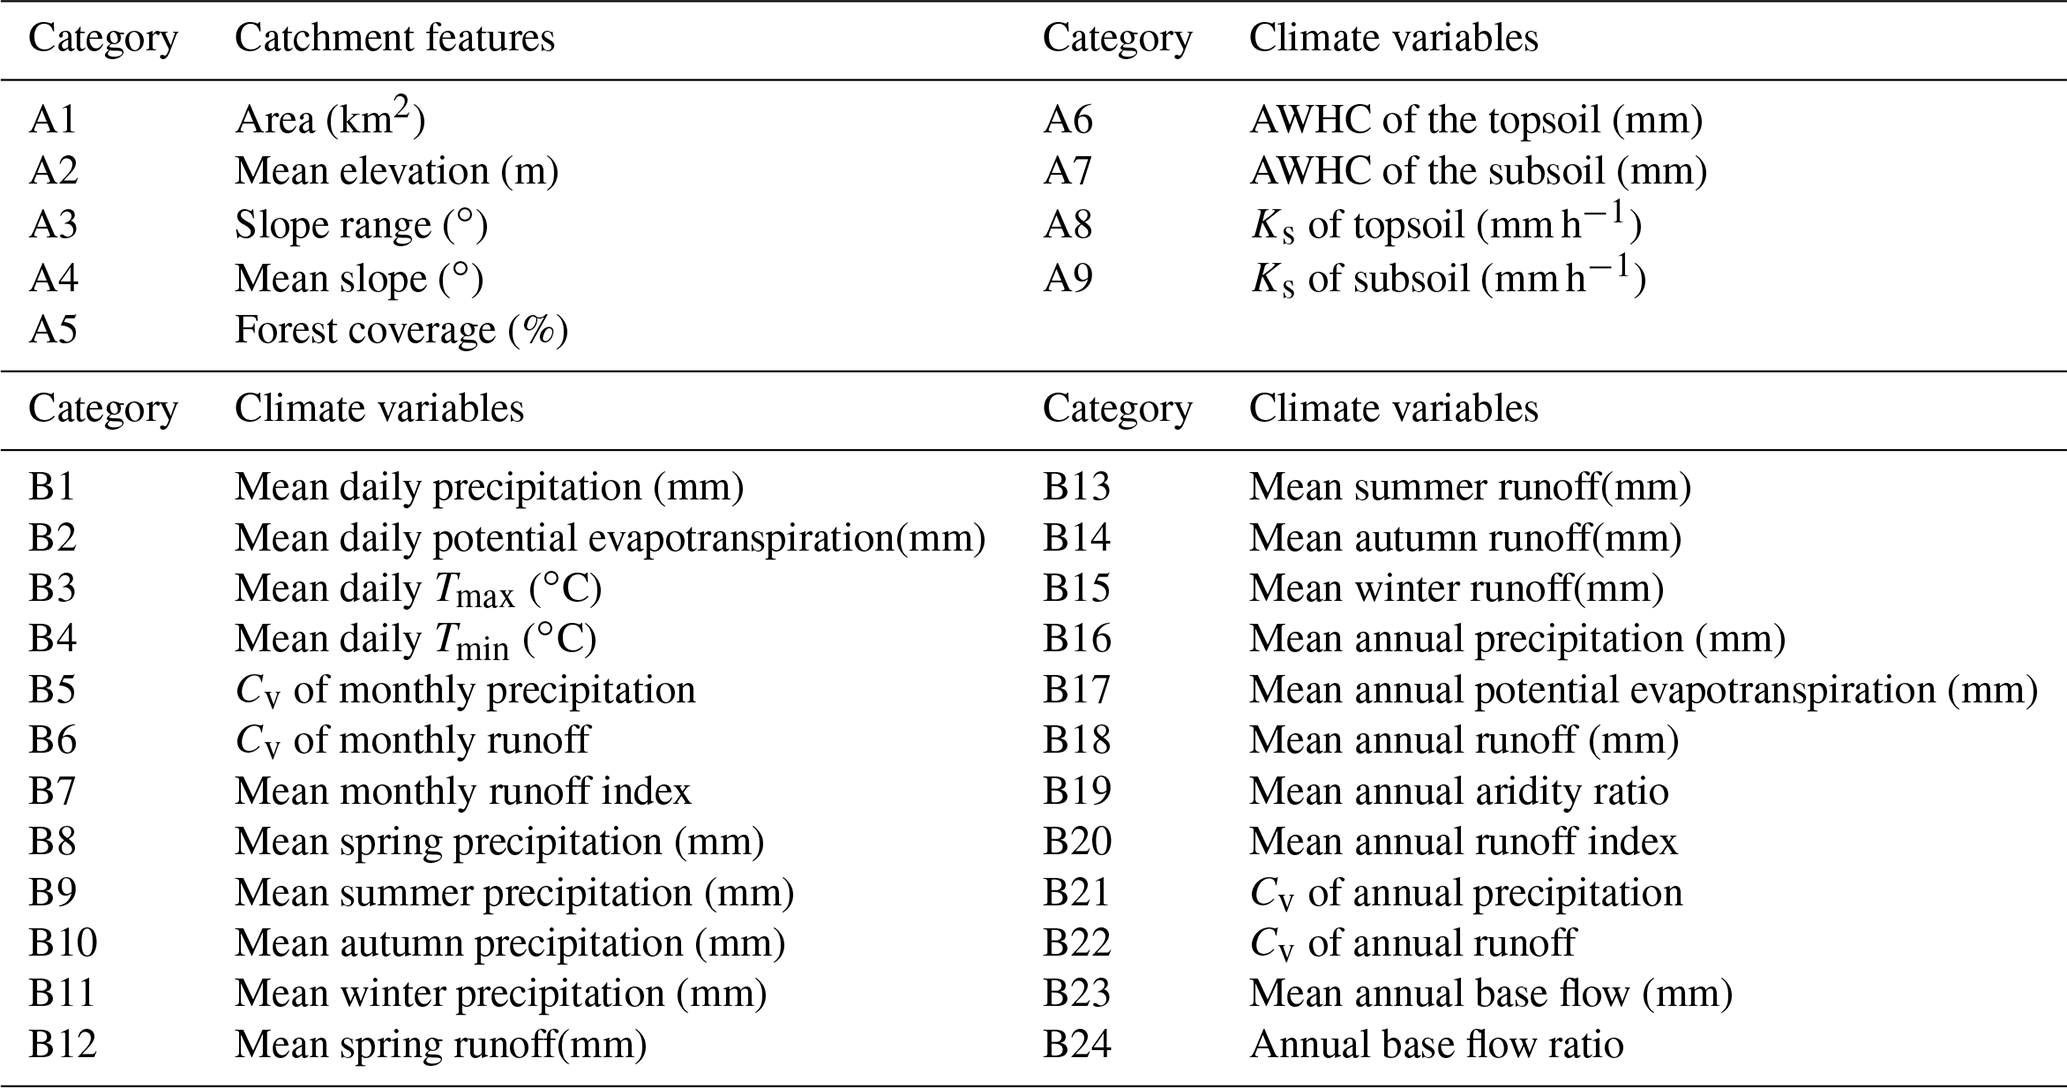
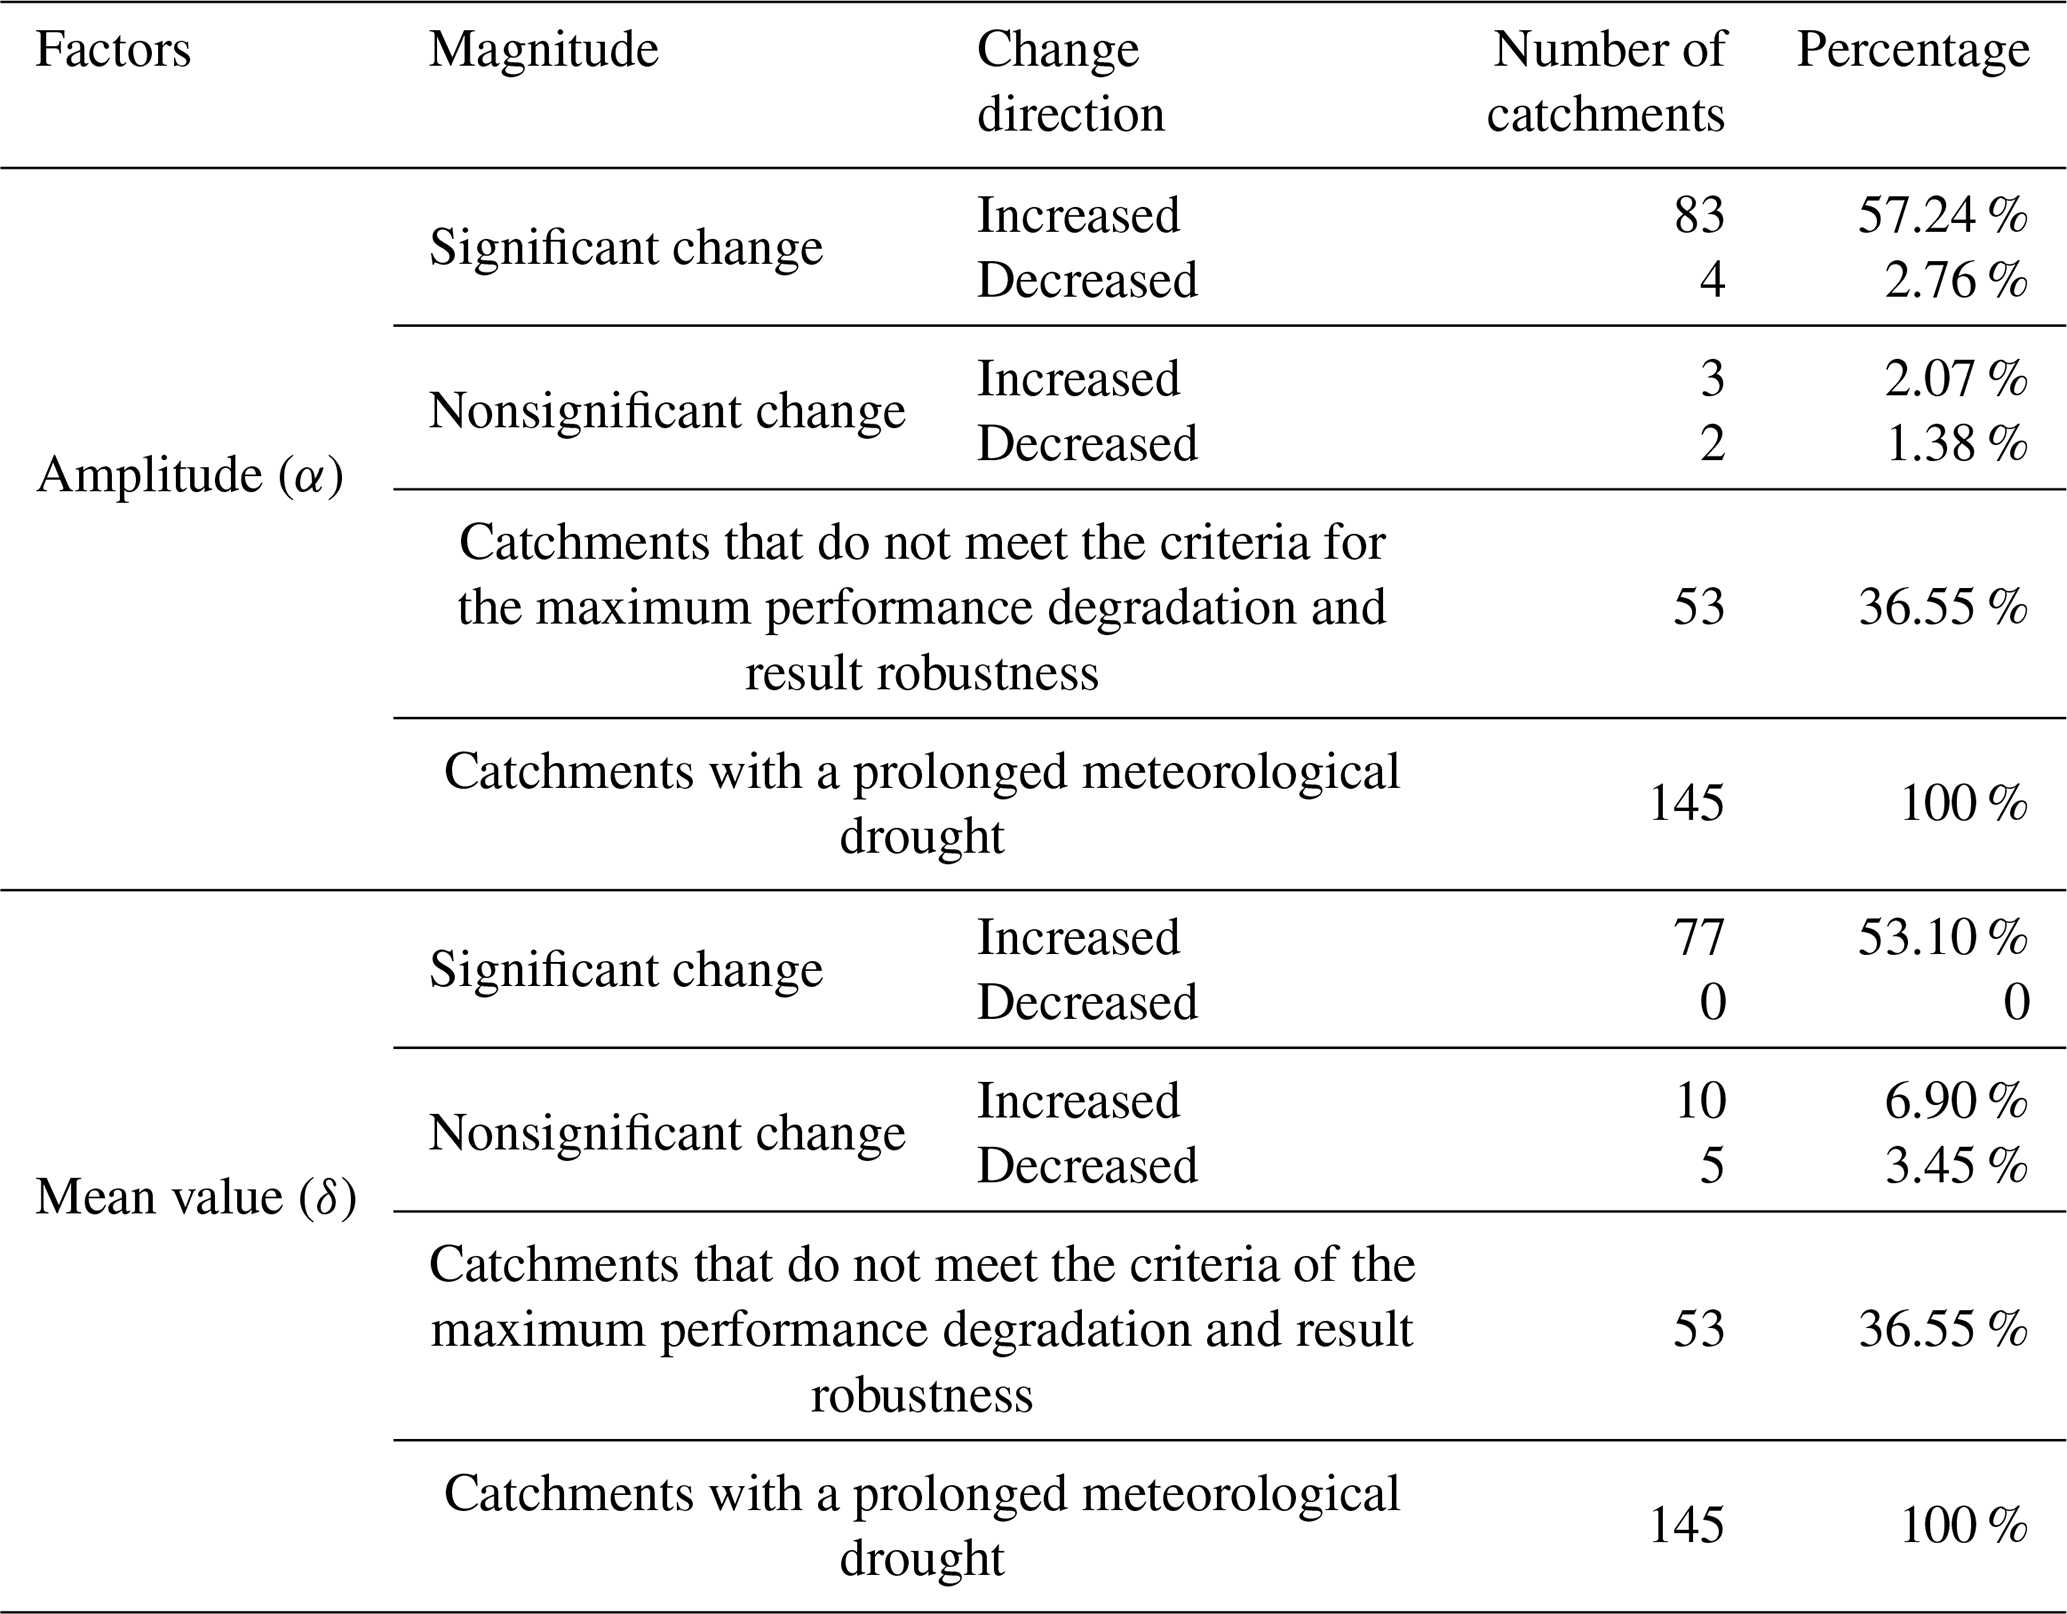
Table 5Summary of catchments with different change patterns in the amplitude α and mean value δ in the regression function of the ACWSC due to a prolonged meteorological drought.
4.1 Change pattern of the ACWSC
The most likely change point was confirmed when three criteria had been satisfied. The changing pattern of the ACWSC was determined by Eqs. (1) and (2). In other words, Eqs. (1) and (2) reflected the potential periodic and asymptotic feature during the period before and after the change point, respectively. It is obvious that α1(α2) and δ1(δ2) are the most important parameters in the regression function, which refer to the amplitude and intercept of the time-varying parameter θ1, respectively. Furthermore, the variation between δ1 and δ2 denotes the average difference between θ1 and , reflecting the potential change between the ACWSC of periods before and after the change point.
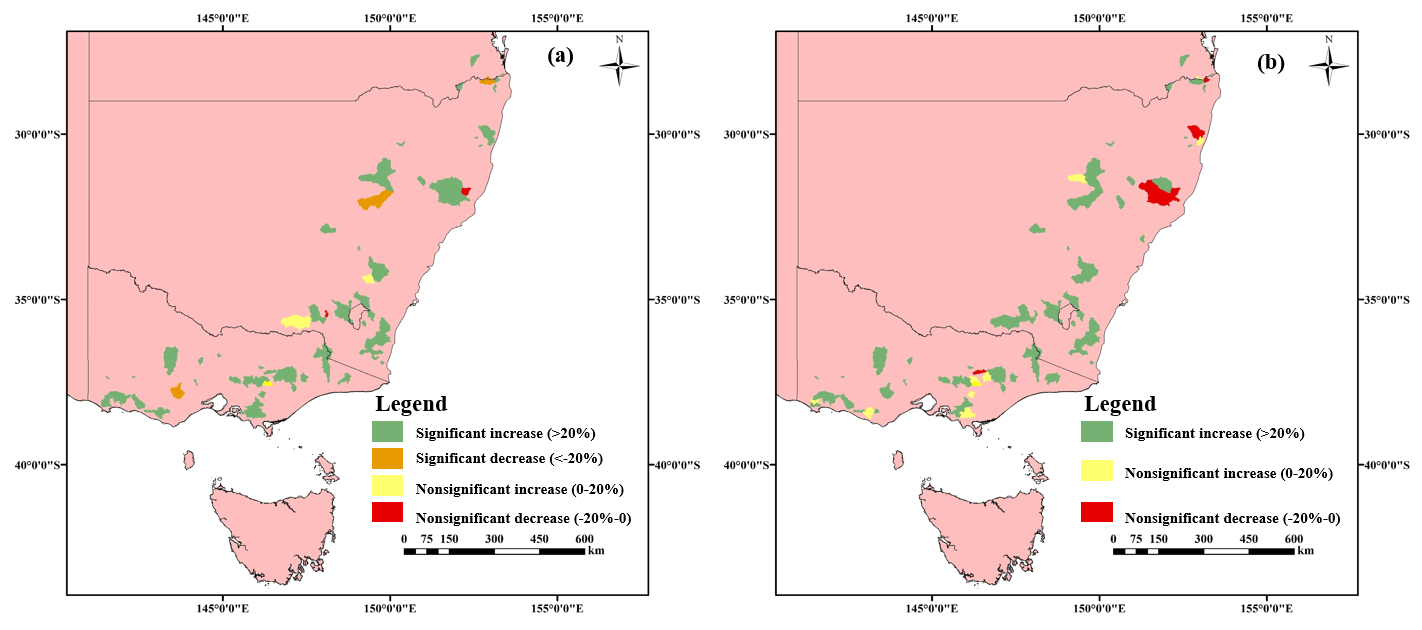
Figure 5Spatial distribution of catchments with different change patterns in the ACWSC after prolonged drought. Panels (a) and (b) illustrate the spatial distribution of catchments with different variation forms in the amplitude α and mean value δ during the drought period, respectively.
Table 5 presents the variation characteristics (amplitude α and mean value δ) of the ACWSC in the 145 studied catchments with meteorological drought in southeastern Australia. The results showed that 36.6 % of the catchments (55 of 145 catchments) were identified to violate the criteria of the maximum performance degradation and result robustness, and thus were removed from further analysis. The remaining 92 catchments were retained as the set of catchments that satisfied the basic criteria of NSE performance and resultant robustness. As presented in Eqs. (1) and (2), amplitude α represents the range of variation in the ACWSC, a larger |α| implies a greater variation interval of the ACWSC during the specific period. Significant changes in amplitude α were found in 60.0 % of the catchments (87 of 145 catchments) during the drought period, in which 57.2 % of the catchments (83 of 145 catchments) experienced a significantly increased change in amplitude α while 2.8 % of the catchments (4 of 145 catchments) had significantly decreased variation during the drought period. In addition, only 3.4 % of the catchments (5 of 145 catchments) experienced a nonsignificant change in amplitude α , in which 3 (2) catchments had a slight increase (decrease) trend. This means that most of the catchments (87 of 92 catchments) experienced a significant increase trend in the range of variation during the prolonged drought period (Table 5), indicating an increased dramatic cyclical variation magnitude of the ACWSC during the transformation from the non-drought period to the prolonged drought period.
The regression parameter δ, which refers to the intercept (i.e., mean value) of the ACWSC during the specific period, was used to evaluate the average difference between the ACWSC during the two periods. As Table 5 indicates, a significant increase in mean value δ was identified in 84 % of the catchments (77 of 145 catchments) after the change point, but no catchment was found to experience a significant decrease in δ during the drought period. In addition, the number of catchments with nonsignificant changes in δ was 15, and 6.9 % of the catchments (10 of 145 catchments) and 3.5 % of the catchments (5 of 145 catchments) were identified to have a nonsignificant increase and decrease trend during the drought period, respectively. These results illustrate that most catchments (77 of 92 catchments) experienced a significant increase trend in the average ACWSC during the transformation from the non-drought period to the prolonged drought period, indicating a mainstream trend of increased ACWSC during the latter period.
The spatial distribution of the 92 catchments that satisfied the criteria of NSE performance and resultant robustness is presented in Fig. 5. Obvious convergence was found in the spatial distribution of the catchments with different change forms in the amplitude of the periodic change and the average variation level of the two periods. For instance, catchments with nonsignificant change in δ were mainly concentrated in the middle part of the south region of Australia. The reason for this phenomenon may be the similar physical features and climatic characteristics of adjacent catchments, which may result in the relatively consistent change direction of catchments in a region.
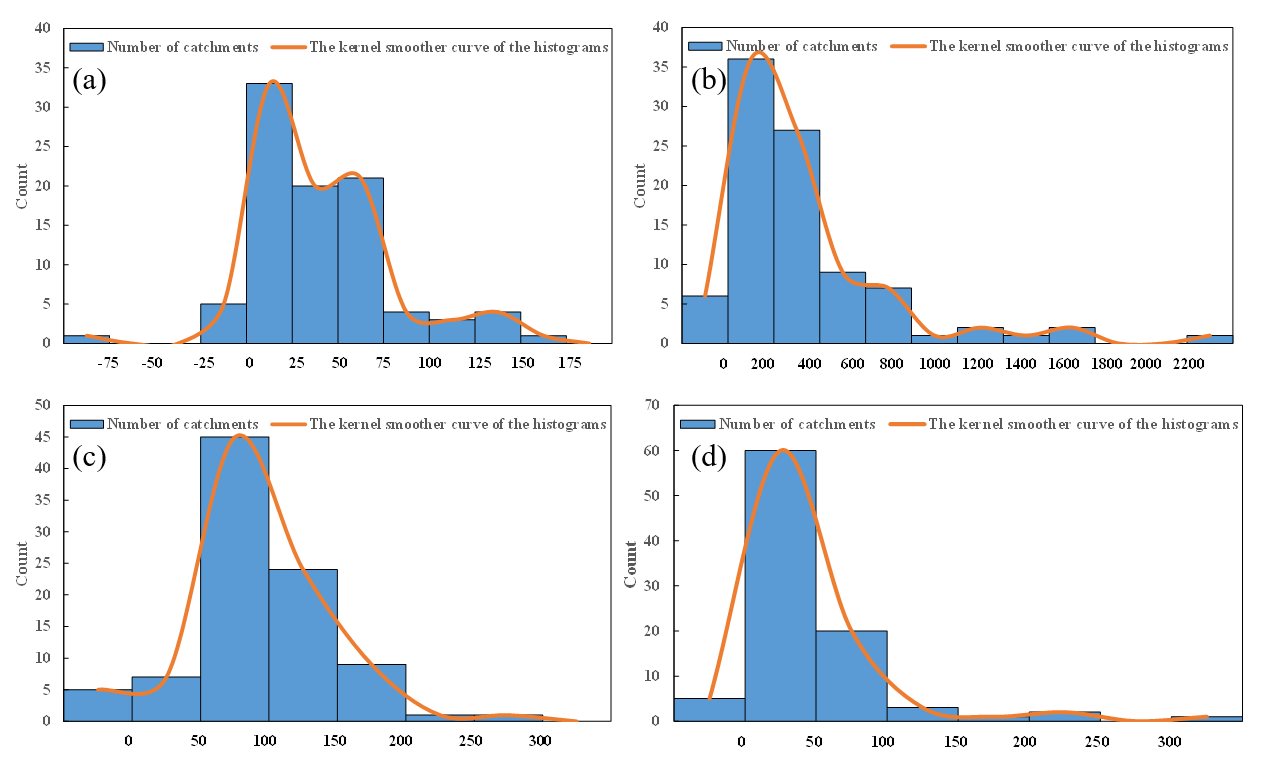
Figure 6The magnitudes of change in the amplitude and mean value of the ACWSC between the periods before and after the change point. Panels (a) and (b) illustrate the magnitude of absolute and relative percentage changes in estimated parameter α, respectively. Panels (c) and (d) refer to magnitude of absolute and relative percentage changes in the estimated mean value of parameter δ.
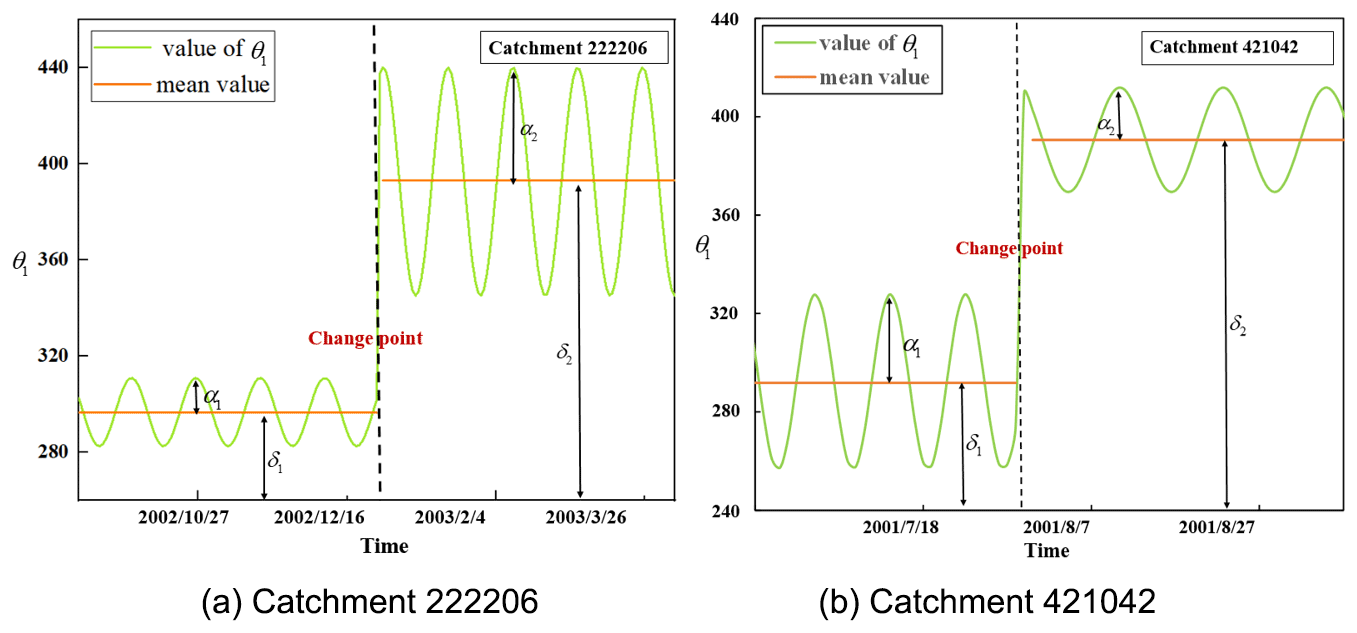
Figure 7Time-varying patterns of model parameter θ1 in two example catchments (i.e., catchment 222206 and 421042).
Figure 6 illustrates the statistical results of the change in amplitude α and mean value δ between two periods (before and after the change point) in all catchments in southeastern Australia. Figure 6a and b show the absolute and relative change percentage of amplitude α between two periods, indicating that the absolute differences in the amplitude between two periods, i.e., ∥α2−α1∥ are concentrated within the interval of [0, 75] for 80.4 % of the catchments while the relative changes are mostly concentrated within the interval of [0 %, 400 %] for 69.6 % of the catchments. The fitting curves in Fig. 6a and b, which were based on the kernel smoother method (Yandell, 1996), had significant positive biases, indicating that many more catchments experienced an increased tendency in the variation range of periodic changes of the ACWSC during the drought period. Figure 6c and d show the absolute and relative change percentage of the mean value δ, respectively, indicating that the absolute change in the mean value, i.e., ∥δ2−δ1∥, is concentrated within the interval of [50, 150] for 75 % of the catchments while the relative change, i.e., , is mostly concentrated within the interval of [0 %, 50 %] for 65.2 % of the catchments. Similarly, the fitting curves in Fig. 6c and d had remarkable positive biases as well, indicating that many more catchments experienced an increased tendency in the mean value of the ACWSC after the change point.
Among the catchments with significant variation in θ1, two types of typical catchments were taken as examples to present the specific changes of the ACWSC (shown in Fig. 7). In catchment #222206, both α2 and δ2 increased significantly after the change point compared with α1 and δ1. Based on the posterior probability of each possible change point, it was found that the change probability of the ACWSC was the greatest on 27 December 2002. Changes in θ1 indicate that the ACWSC of catchment #222206 tends to increase after the change point. In catchment #421042, the amplitude α2 decreases significantly while the mean value δ2 increases significantly after the change point. The time corresponding to the change point was 30 July 2001, which refers to the moment when θ1 changes. Therefore, these results for the two example catchments suggest that the ACWSC of various catchments may experience different magnitudes of change under a sustained reduction in rainfall. In addition, a time lag phenomenon clearly occurred between the onset of the meteorological drought and the change in θ1.
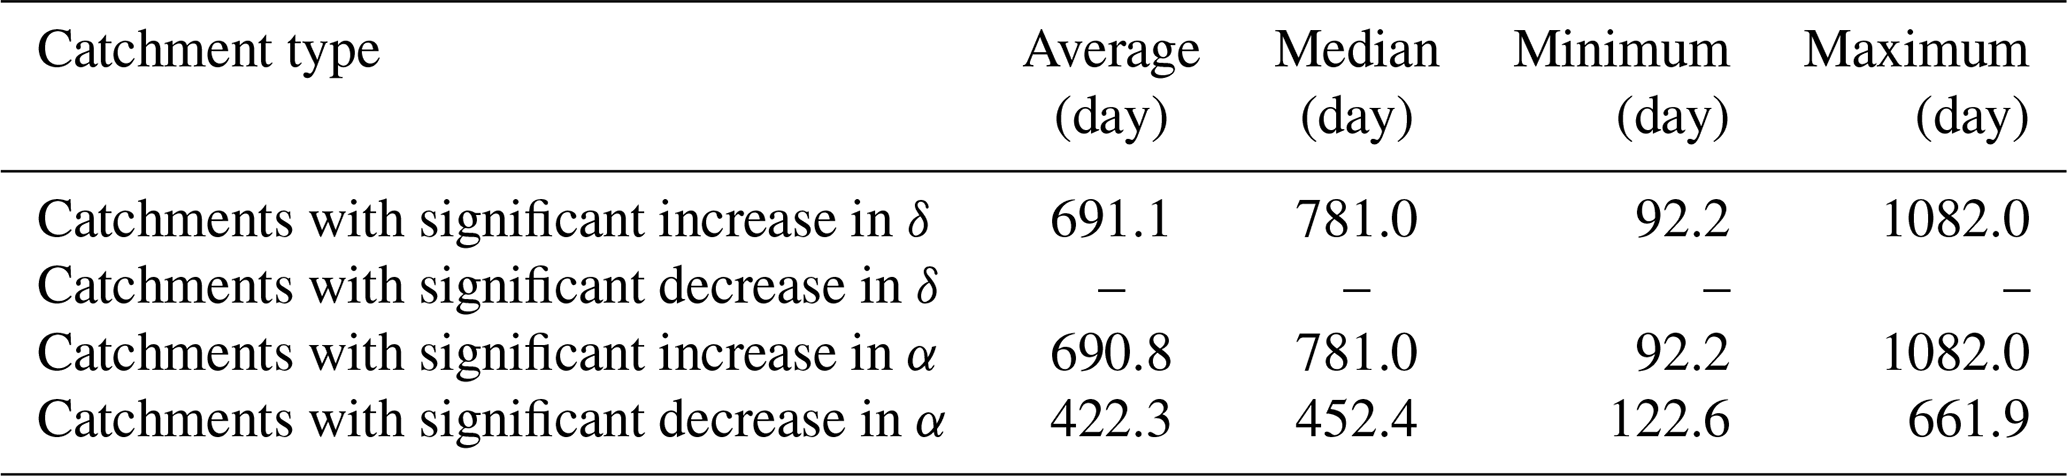
Table 6Response times of different groups of catchments with significant increase or decrease in regression parameters α and δ.
4.2 Response time of catchments with significant change in the ACWSC
As mentioned in Sect. 3.4, the response time refers to the time interval between the occurrence of the meteorological drought and the change point of the ACWSC. The magnitude distribution of response time in the 92 catchments that satisfied the basic criteria of NSE performance and robustness of results is shown in Fig. 8, which indicates that the response time in nearly one third of the catchments () fell within the range of 800–1000 d, followed by the response time of 17 catchments falling within the range of 600–800 d. Furthermore, as shown in Table 6, the average and median response times of the catchments with significant changes in δ are 660.7 and 750.6 d, respectively. Since no significantly decreased variation in δ was found, the catchments with significant changes in δ after the change point all realized a significantly increased trend. In the catchments with a significant increase in amplitude α, the average and median estimates of the response time are 660.4 and 750.6 d, respectively; while those of the catchments with a significant decrease in α are 391.9 and 422 d, respectively. According to the results shown in Table 6, a significant difference was identified in the length of the response time between two sets of catchments with a significant increase and decrease in amplitude α. However, it is not clear whether the difference between the groups of catchments with significant increase or decrease in the amplitude α is real or simply sampling fluctuations.
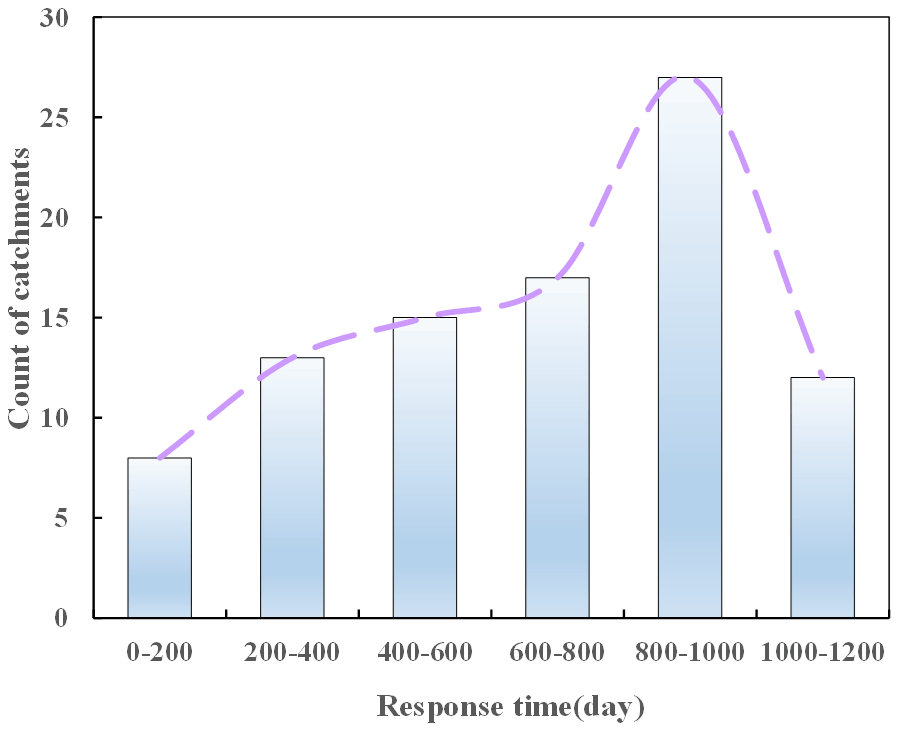
Figure 8Magnitude distribution of the response time in 92 catchments that satisfied the basic criteria of NSE performance and result robustness.
4.3 Factors for shifts in the ACWSC
To provide a better understanding of the response of the variation pattern of the ACWSC to the prolonged meteorological drought and the variation characteristics under asymptotic climate change, we investigated whether the change in the ACWSC (especially in the amplitude α and mean value δ) was associated with particular catchment features and/or climate inputs, i.e., are variations in the ACWSC more likely to occur in the catchments with certain characteristics? Thus, nine multiple catchment features and 24 climate variables that may drive the shifts in the variation of the amplitude α and mean value δ were analyzed in this part.

Figure 9Comparison of physical features between the gα(S) and gα(NS)groups and gα(SI) and gα(SD) subsets for the study catchments. The orange and green boxes (two left columns) denote the physical characteristics of the gα(S) and gα(NS) groups which were divided according to the significance level of the variation in the amplitude after the change point. The purple and yellow columns (two right columns) denote the catchment features of the gα(SI) and gα(SD) subsets with significantly increased and decreased change patterns in the amplitude after the change point, respectively.
4.3.1 Difference analysis of factors
Difference between groups of catchments with significant and nonsignificant change in α
To explore the potential differences in catchment properties and climate inputs between catchments with different variation patterns, the 92 selected catchments were divided into two groups – namely, the gα(S) (catchments with significant change in α) and the gα(NS) group (catchments with non-significant change in α) – according to the significance level of the variation in amplitude α between the periods before and after the change point. As illustrated in Table 5, the gα(S) and gα(NS) groups included 87 and 5 catchments, respectively. Overall, 94.6 % () of the studied catchments experienced a significant shift in amplitude α, which indicated that the long-term drought in these catchments resulted in a remarkable change in the variation range of the ACWSC. The two left columns in each panel in Fig. 9 refer to the statistical features of catchments in the gα(S) and gα(NS) groups. There was a significant difference in the mean and median estimate of catchment area between these two groups, with their difference ratio reaching 21.2 % and 25.1 %, respectively, i.e., the gα(NS) group indicated a notably larger catchment area than the gα(S) group. However, no other features (mentioned in Table 1) showed similarly significant variation between the gα(S) and gα(NS) groups. Among the adopted nine catchment features, the results indicated the difference in the catchment area may be one of the most important factors in influencing the variation degree of the amplitude α of the ACWSC. However, due to the limited number of catchments in the gα(NS) group (only 5.4 % of the adopted 92 catchments), it is still not clear whether the statistical values of this group were real or simply sampling fluctuation.
The two right columns in Fig. 9 refer to catchment subsets with a significant increase pattern in amplitude α after the change point, namely, the sα(IS) and the sα(DS) subsets, which denoted the catchment aggregation that experienced significantly increased and decreased changes after the change point, respectively. It should be noted that the two subsets were extracted from the gα(S) group. Most catchments (95.4 % of catchments) experienced a significantly increased change in the amplitude α of the ACWSC after the change point, while only 4.6 % (four in 87 catchments) of catchments went through a significantly decreased change after the change point. The increased variation range of the ACWSC that occurred during the prolonged drought led to a higher fluctuation range of the ACWSC and more intense variation in runoff generation rate. Thus, the significantly increased pattern in amplitude α and more intense variation in runoff generation rate were the mainstream change direction in the studied catchment data set.
Significant differences were found in both the mean and median estimate of features of catchment area and mean elevation between the sα(IS) and the sα(DS) subsets (see two right columns in Fig. 9), with the difference ratio reaching 46.7 % and 58.5 %, respectively. The sα(DS) subset had a significantly larger catchment area than the sα(IS) subset. Moreover, there was a significant difference in the median estimate of the Ks of the subsoil between the two subsets, with the difference ratio reaching 27.7 %; however, it was nonsignificant in the mean estimate of the Ks of the subsoil. Due to the limited number of catchments within the sα(DS) subset (included only four catchments), it was inadequate to judge whether this was a general finding or simply the uniqueness of the sample.
Overall, it was likely that catchments with small areas, low elevations, small slope ranges, large forest coverage, and high AWHC of soil may change more significantly in amplitude α after the interference of the meteorological drought. Generally, small areas of large forest cover will require considerable (partitioning of) soil water storage. After experiencing persistent meteorological drought, the pressure on water resources in the catchment increased and tree cover was lost in large quantities due to withering. Canopy retention and uptake by the forest is an important part of ACWSC, and the dieback of trees in the forest may result in a significant change in ACWSC (Adams et al., 2012). Therefore, these catchments are more vulnerable under prolonged drought due to competition for moisture uptake than catchments with low forest cover and large areas.
Difference between groups of catchments with significant and nonsignificant change in δ
Similarly, we also analyzed the potential relationship between the change in the mean value δ of the ACWSC and the catchment features or climate characteristics. According to the significance level of the change in mean value δ, the 92 catchments were also divided into two groups, denoted as gδ(S)(catchments with significant change in δ) and the gδ(NS) groups (catchments with nonsignificant change in δ).
As illustrated in Table 5 and Fig. 10, 77 of 92 catchments were found to experience a significantly increased change in the mean value δ after the change point, while no catchment went through a significantly decreased pattern after the change point. The nonsignificant change in the mean value δ occurred in 15 studied catchments. The significant increase in the mean value δ indicated the increased mean ACWSC after the change point due to the long-term meteorological drought, resulting in even less runoff (on average) than the historical relationship suggested. In other words, the low runoff caused by the reduced rainfall was expected as the previous rainfall–runoff relationship showed, and the increase in the ACWSC may imply an even lower runoff generation rate than expected.

Figure 10Comparison of catchment characteristics between the groups of catchments with significant and nonsignificant changes in mean value δ, i.e., the gδ(S) and gδ(NS) groups.
Figure 10 presents the comparison of catchment features between the gδ(S) and gδ(NS) groups. There was a significant difference in the mean (median) estimate of the catchment area, AWHC of the subsoil, Ks of the subsoil, mean slope and slope range between these two groups, with their difference ratio reaching 50.3 % (33.8 %), 34.2 % (54.4 %), 20.6 % (57.1 %), 38.8 % (91.1 %) and 24.4 % (37.4 %), respectively. In the other words, the gδ(S) group had a notably smaller catchment area, Ks of the subsoil, mean slope and slope range, and larger AWHC of the subsoil than the gδ(NS) group. Moreover, there was a significant difference in the median estimate of the Ks of the topsoil between the two groups, with the difference ratio reaching 29.6 %; however, it was nonsignificant in the mean estimate of the Ks of topsoil.
4.3.2 Association analysis of factors
Figure 11 presents the Pearson correlation between the change in amplitude α of θ1 with nine catchment features and 24 climate variables that are listed in Table 4. A positive association was identified between the absolute change in amplitude α and two catchment features (i.e., mean elevation and Ks of subsoil), while a negative relationship was found between the former and other catchment features (see Fig. 11a). Similarly, the relative change in amplitude α was positively associated with only one catchment feature, i.e., the AWHC of the topsoil (see Fig. 11b). However, no strong correlation was found between the change in amplitude α (including both absolute and relative changes) and both catchment features. Figure 11c and d illustrate the possible correlations between the changes (absolute and relative changes) in the amplitude α of the ACWSC and 24 climate variables. Generally, a weak positive correlation was found between the absolute change in amplitude α and all climate variables, with the highest correlation coefficient (CC) reaching 0.203, which occurred with the B6 feature (i.e., Cv of monthly runoff). Similarly, there was no strong correlation between the relative change in amplitude α and all climate variables (see Fig. 11d), with the highest CC only reaching 0.19, which occurred with the B17 feature (i.e., the mean annual potential evapotranspiration). Since no strong correlation was found between the variation in the amplitude α and a single factor, we speculated that the potential change in the variation range of the ACWSC after the change point was the result of the combination of various catchment properties and climate characteristics.
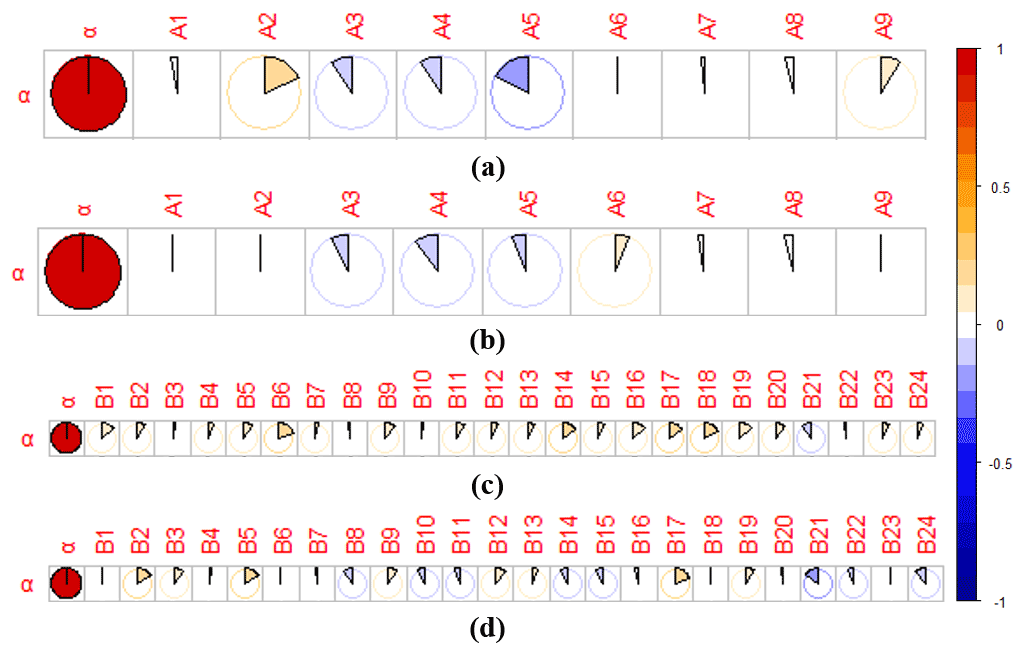
Figure 11Pearson correlation coefficient between the variation in the amplitude α with multiple catchment features and climate variables. (a) Correlation between the absolute variation in amplitude α and catchment features; (b) correlation between the relative variation in amplitude α and catchment features; (c) correlation between the absolute variation in amplitude α and absolute variation in climate variables; (d) correlation between the relative variation in amplitude α and relative variation in climate variables.
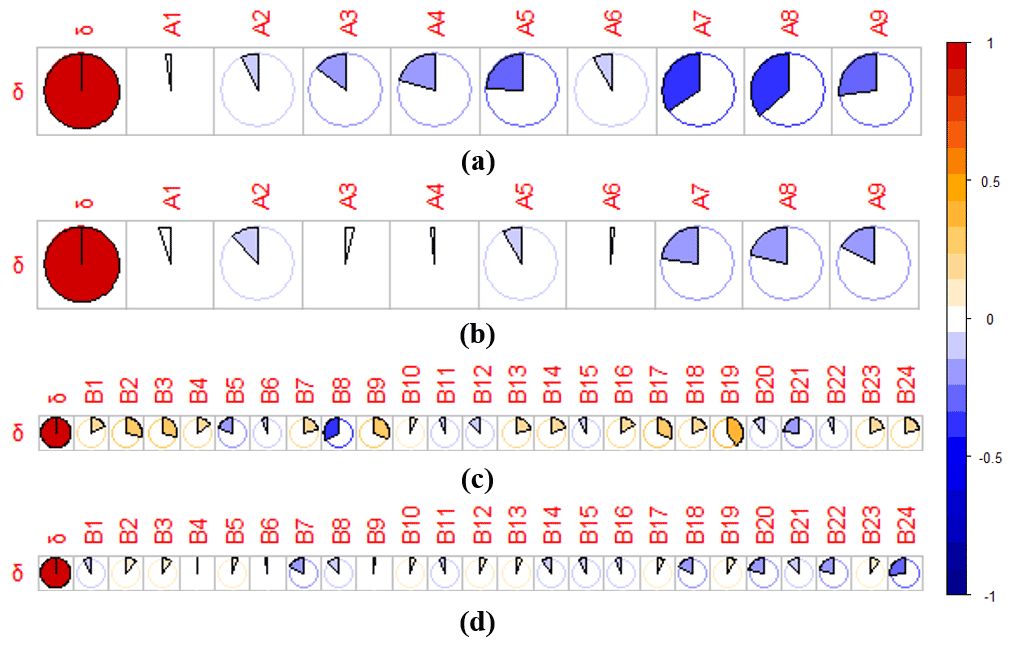
Figure 12Pearson correlation coefficient between the variation in the mean value δ with multiple catchment features and climate variables. (a) Correlation between the absolute variation in mean value δ and catchment features; (b) correlation between the relative variation in mean value δ and catchment features; (c) correlation between the absolute variation in mean value δ and absolute variation in climate variables; (d) correlation between the relative variation in mean value δ and relative variation in climate variables.
Figure 12 illustrates the Pearson correlation between the changes (absolute change and relative change) in the mean value δ of the ACWSC and catchment features between the periods before and after the change point. The absolute change in the mean value δ was negatively correlated with both catchment features (see Fig. 12a), with the highest CC reaching −0.362, which occurred with the Ks of topsoil, subsequently followed by the AWHC of the subsoil (CC = −0.341), the Ks of the subsoil (CC = −0.267), and the forest percentage (CC = −0.242). Similar to Fig. 12a, the relative change in the mean value δ was negatively correlated with most of the catchment features (Fig. 12b), except for A3 (slope range) and A8 (AWHC of topsoil), with the largest CC reaching -0.362, which occurred with the Ks of topsoil, followed by AWHC of the subsoil (CC = −0.341), and forest coverage (CC = −0.242). It is obvious that the soil- and forest-related features had the strongest relationship with the relative change in the mean value δ among both catchment features. The potential reasons may be that the water-holding capacities of various soil types were different due to the dissimilarity of void and adhesion in different soil types, which directly affected the ability of the catchment to absorb and store water, thereby influencing the magnitude of the ACWSC of the catchment (Leblanc et al., 2009). Furthermore, the coverage of various forest percentages would affect the water-holding capacity and water assumption ability (Fohrer et al., 2005), resulting in potential changes in the ACWSC. Figure 12c and d illustrate the association between the changes (absolute and relative change) in the mean value δ and 24 climate variables before and after the change point. As Fig. 12c indicates, the absolute change in the mean value δ had positive correlations with B19 (annual aridity index, CC = 0.421), followed by B9 (mean summer precipitation, CC = 0.306), while it had negative correlations with B8 and B21. Figure 12d shows that the relative change in the mean value δ had the largest negative correlation with B24 (annual base flow ratio, CC = −0.279), followed by B20 (mean annual runoff index, CC = −0.215). No correlation (CC < 0.2) was found in the relative change of the mean value δ with other climate variables.
In total, the gα(S) and gδ(S) groups had a significantly smaller catchment area than those of the gα(NS) and gδ(NS) groups, indicating the reduced possibility that the ACWSC would change significantly (including changes in both amplitude α and mean value δ) along with the increased catchment area. Furthermore, the catchments with a smaller hydraulic conductivity of the soil may be more prone to change in statistical significance to experience a significant variation in the average level of the ACWSC during a prolonged meteorological drought.
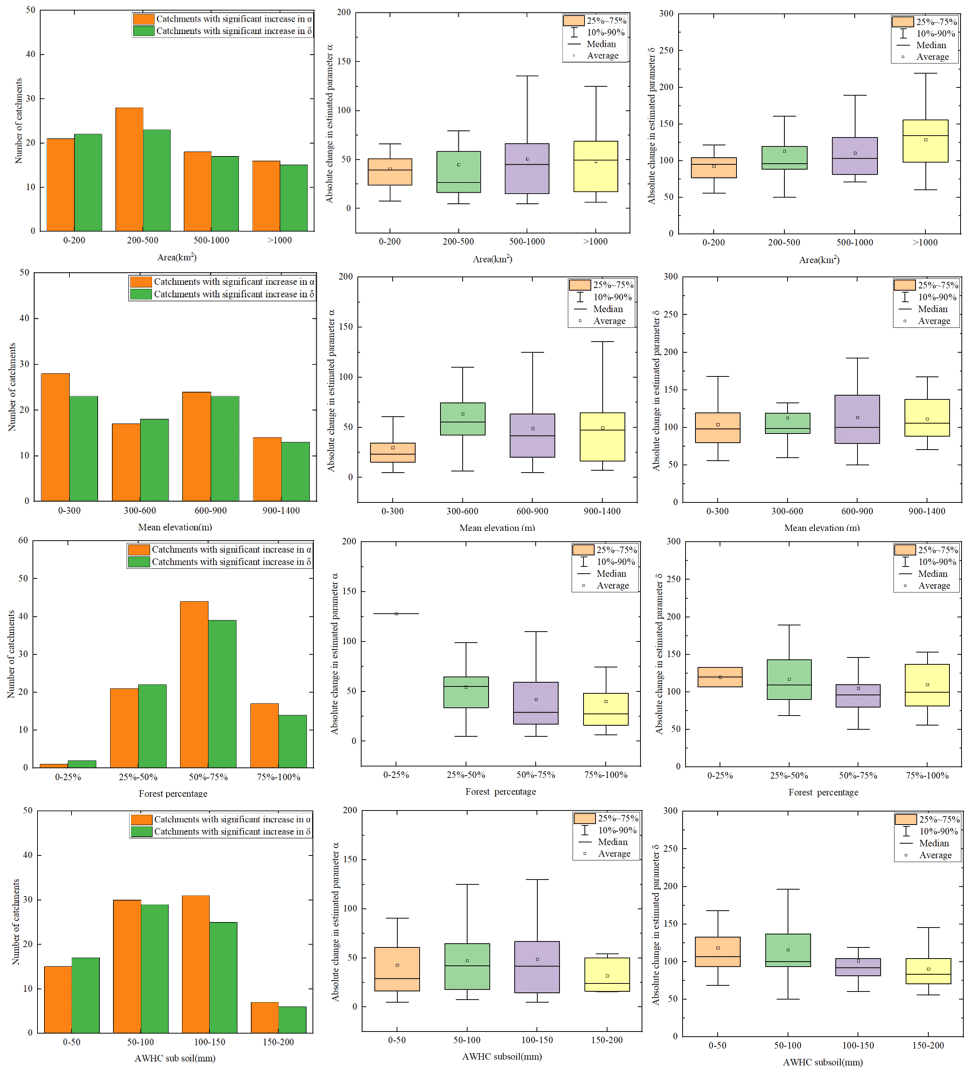
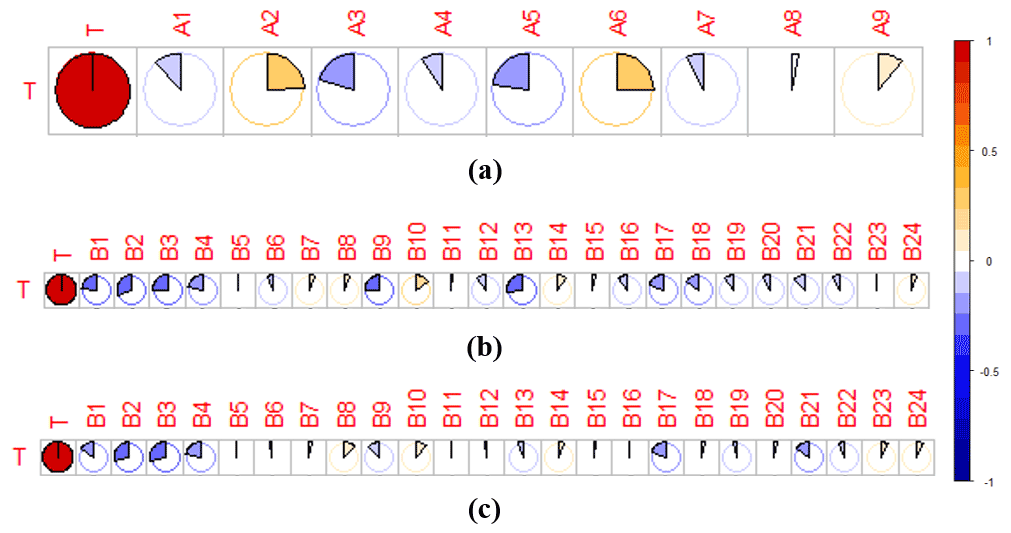
Figure 14Pearson correlation coefficient between the response time with catchment features and variation in climate variables before and after the change point. (a) Correlation between the response time and catchment features; (b) correlation between the response time and absolute change in climate variables; (c) correlation between the response time and relative change in climate variables.
4.3.3 Trend analysis in the significantly changed group
As our findings in Table 5 show, most of the studied catchments experienced a significantly increased variation after the change point, thesα(IS) and sδ(IS) subsets of catchments were further used as typical samples for the trend analysis between the variation in the ACWSC and certain characteristics. According to the results in Sect. 4.3.1 and 4.3.2, four catchment properties, i.e., catchment area, mean elevation, forest coverage, and soil characteristics, were adopted for the trend analysis. As illustrated in Fig. 13, the absolute changes in α and δ both show an increasing trend with the increase in catchment area, the catchment group with the mean elevation within the interval of [300, 600] had the largest absolute change in both the amplitude α and mean value δ among all groups with different elevation interval, implying the potentially most suitable elevation range for the occurrence of the variation of ACWSC. Furthermore, the decreased variation in the estimated value of α and δ was identified along with the increase in the forest coverage of catchments. In addition, Fig. 13 indicates that the changes in α and δ were both negatively associated with the increase in forest coverage percentage of the catchment, implying the positive contribution of high forest coverage to the potential change in the ACWSC during the meteorological drought. A similar relationship was observed in changes of δ with the AWHC subsoil.
4.4 Factors for the response time of catchments
The Pearson CC between the response time with both catchment features and climate variables is presented in Fig. 14. Positive correlations were identified between the response time with A6 (AWHC of the topsoil, CC = 0.249) and A2 (mean elevation, CC = 0.239), while a negative correlation was found between the response time and A5 (forest coverage, CC = −0.225). The potential reasons for this finding may be that the larger ACWSC indicated a higher ability of the soil to retain water and make it more sufficiently available for plant use, thus resulting in an increased response time in the catchment (Lawes et al., 2009; Leenaars et al., 2018). Moreover, the increased catchment elevation may promote changes in forest architecture (i.e., decreases in tree stature and stem diameter; trends in stem deformation; hard, thick, and smaller leaves) and enhance the dominant position of plants with less water assumption (Lenoir et al., 2008; Oke and Thompson, 2015), and thus relatively enlarge the response time. In addition, a persistent decline in the groundwater level and storage was observed in catchments of southeastern Australia (Leblanc et al., 2009), resulting in the gradual reduction of the interactions between the surface water and groundwater (Van Lanen et al., 2013). Thus, the increased forest coverage of the catchment may result in larger water demand for the ecosystem (Adams et al., 2012), and therefore caused a shorter response time of the ACWSC to the meteorological drought.
As for the relationship between the response time and the climate variables mentioned in Table 4, the absolute variations in many climate variables (i.e., B1–B4, B9, B13, B17) had negative correlations with the response time (Fig. 14b), with their CC between 0.20 and 0.31. The highest CC in Fig. 14b was 0.31, which was reached with B2 (mean daily potential evapotranspiration). As shown in Fig. 14c, the response time was negatively correlated with the absolute change in B2 (mean daily potential evapotranspiration), B3 (mean Tmax), and B13 (mean summer runoff), with the CC being −0.313, −0.263, and −0.27, respectively. It should also be noted that only a weak association was identified between the response time and these climate variables. In addition, no positive correlation (CC > 0.2) was identified between the response time with the absolute and relative changes of both climate variables.
Similarly, the potential connections between the response time and several catchment properties were further analyzed in the significantly changed subsets. As shown in Fig. 15, negative associations were found between the length of response time with the size of the catchment area and forest coverage. Furthermore, the catchment group with the mean elevation within the interval of [300, 600] had the smallest response time within all range groups of catchments.

5.1 Possible reasons for different changes in the ACWSC
The results showed that most catchments were identified to have an increasing trend in both the amplitude α and the mean value δ of the ACWSC after a prolonged meteorological drought. According to our findings, soil type and forest coverage are the variables most related to the ACWSC. The soil water-holding capacities of various soil types were different due to the dissimilarity of void and adhesion in different soil types, which directly affects the ability of the catchment to absorb/store water, thereby affecting the ACWSC of the catchment. Saft et al. (2015) showed that the annual rainfall–runoff relationships of many catchments changed in southeastern Australia during the millennium drought (1997–2009). The prolonged meteorological drought led to the continuous decrease of the groundwater level as well as a significant change in soil properties. Leblanc's study of southeastern Australia showed that only 2 years after the 2001 drought, soil moisture and surface water storage lost 80 and 12 km3, respectively, and the rapid drying up reached near-steady low levels (Leblanc et al., 2009). Years of drought led to an almost complete drying up of surface water resources, and the hydrological drought continued even after rainfall resumed. In addition, the soil types in the study area include silt loam, loam, silt, sand, sandy loam, clay and loamy sand, among which silt loam accounts for more than 45 % of the total study area (Pan et al., 2020). Moreover, the silt loam possessed a strong field capacity and large adhesion property. The silt loam may maintain the original soil structure state even if the soil pore space increases due to the declined groundwater level, which may partly explain the increase in the ACWSC of the catchments.
Furthermore, the variation of forest coverage and composition would affect the water-holding capacity and water assumption ability, resulting in potential changes in the ACWSC. Previous studies (Fensham et al., 2009; Allen et al., 2010) showed that the increased frequency, duration of drought, and heat stress associated with climate change are strong factors contributing to changes in vegetation dynamics that may fundamentally alter forest composition and structure in many areas. Drought-induced vegetation dieback was more likely to occur in regions with relatively high densities of local woody cover. Adams et al. (2012) combined the extensive literature on the ecohydrological effects of tree harvesting with existing studies to propose a new and relevant hypothesis. For most forests, evapotranspiration would be dramatically reduced after the significant dieback of the tree cover due to drought. According to Pan et al. (2020), the main land use types throughout the study area are evergreen broadleaf forest, grassland, woodland, and cropland. As the evergreen broadleaf forest and woodland occupied most of the study region, the notable loss of tree cover caused by the prolonged meteorological drought may dramatically reduce the evapotranspiration in catchments. Catchments with large coverage of evergreen broadleaf forest processed the large water demand per unit area (Adams et al., 2012). For comparison, the water consumption of catchments with other land use types (grassland and farmland) was less, and their drought resistance ability was relatively stronger. It can be hypothesized that in catchments with large coverage of vegetation, the occurrence of a prolonged drought may intensify the competition for water demand between different varieties of vegetation, promoting the survival of the vegetation types with less water consumption but with higher water adoption ability. Therefore, the catchments with high forest cover may lead to an increase in the ACWSC.
5.2 Limitations of the hydrological model
The GR4J model was used to address the response of the ACWSC to prolonged meteorological drought. The model processes a relatively simple structure with relatively low requirements for input data, and it has been widely used in the rainfall–runoff simulation for small and medium-sized catchments (Demirel et al., 2013; Sezen and Partal, 2019; Kunnath-Poovakka and Eldho, 2019). However, the GR4J model is implemented subject to restrictions and limitations due to the inadequate description of the runoff generation and flow confluence processes in large catchments (e.g., larger than 10 000 km2). Conceptual models usually consider the entire catchment to be one entity, then use empirical functional relationships or conceptual simulations to describe the runoff generation and flow confluence processes, and consequently adopt certain parameters with physical meanings to characterize the inhomogeneity of the spatial distribution of catchment characteristics. It has been argued that conceptual lumped rainfall–runoff models are far from being able to tackle the challenging problem of assessing the impacts of land use or forest variation. The GR4J model lacks a physical foundation but seems to best detect changes in a basin behavior (Perrin et al., 2003).
According to Westra et al. (2014), θ1 is the most sensitive parameter in the GR4J model and was therefore used to represent the ACWSC in this study. The sine function was used to reflect the periodic change in the ACWSC. Further studies are necessary to explore the impacts of different forms of functions on the identification and simulation of the periodic variation of the ACWSC.
This study focused on the response of the ACWSC to a long-term meteorological drought and asymptotic climate change systematically based on the hydrological simulation method. First, the time-varying parameter (the most sensitive model parameter in the adopted GR4J model) was derived to reflect the ACWSC periodic and abrupt variations in drought and non-drought periods. Second, the change points and varying patterns of the ACWSC during the transformation from non-drought to drought periods were analyzed based on the Bayesian change point analysis with multiple evaluation criteria. Finally, a variety of catchment features and climate characteristics were used to explore the possible relationship between these variables and the temporal variation characteristics of the ACWSC. Catchments that suffered from the prolonged meteorological drought in southeast Australia were selected as the case study. The main conclusions are summarized as follows:
-
The increase in ACWSC amplitude change was observed in catchments during the prolonged drought period, and significant shifts in the mean value of the ACWSC were detected in catchments.
-
The average response time of the ACWSC for all 92 catchments with significant changes was 641.3 d. Specifically, the response time in 27 and 17 catchments fell within the ranges of 800–1000 and 600–800 d, respectively.
-
The ACWSC changed significantly in the catchments with small areas, low elevations, small slope ranges, large forest coverage, and high soil water-holding capacities.
In this study, the response characteristics of the ACWSC to the prolonged meteorological drought in southeastern Australia were analyzed. It was found that the catchment response time and mode are significantly different. However, only the correlations between the changes in parameter θ1, response time, and single-factor catchment features and climate variables were considered in this study. Subsequent studies could be conducted by combining data from multiple sources to carry out multifactor regression analysis. Nevertheless, this study could enhance our understanding of the variations in catchment properties under climate change.
Codes and data sets that were used for all analyses are available from the authors upon request.
All the authors helped to conceive and design the analysis. JT and ZP performed the analysis and wrote the paper. SG, JW, JY and YZ contributed to the writing of the paper and made comments.
The contact author has declared that none of the authors has any competing interests.
Publisher's note: Copernicus Publications remains neutral with regard to jurisdictional claims in published maps and institutional affiliations.
This study was supported by the National Natural Science Foundation of China (Grant No. U20A20317) and the National Key Research and Development Program of China (2021YFC3200303). The numerical calculations were done on the supercomputing system in the Supercomputing Center of Wuhan University. The authors would like to thank the editor and anonymous reviewers for their comments, which helped improve the quality of the paper.
This study was supported by the National Natural Science Foundation of China (grant no. U20A20317) and the National Key Research and Development Program of China (grant not. 2021YFC3200303).
This paper was edited by Markus Hrachowitz and reviewed by two anonymous referees.
Abbaspour, K. C., Yang, J., Maximov, I., Siber, R., Bogner, K., Mieleitner, J., Zobrist, J., and Srinivasan, R.: Modelling hydrology and water quality in the pre-alpine/alpine Thur watershed using SWAT, J. Hydrol., 333, 413–430, https://doi.org/10.1016/j.jhydrol.2006.09.014, 2007.
Adams, H. D., Luce, C. H., Breshears, D. D., Allen, C. D., Weiler, M., Hale, V. C., Smith, A. M. S., and Huxman, T. E.: Ecohydrological consequences of drought- and infestation-triggered tree die-off: insights and hypotheses, Ecohydrology, 5, 145–159, https://doi.org/10.1002/eco.233, 2012.
Ajami, N. K., Duan, Q. Y., and Sorooshian, S.: An integrated hydrologic Bayesian multimodel combination framework: Confronting input, parameter, and model structural uncertainty in hydrologic prediction, Water Resour. Res., 43, W01403, https://doi.org/10.1029/2005wr004745, 2007.
Allen, C. D., Macalady, A. K., Chenchouni, H., Bachelet, D., McDowell, N., Vennetier, M., Kitzberger, T., Rigling, A., Breshears, D. D., Hogg, E. H., Gonzalez, P., Fensham, R., Zhang, Z., Castro, J., Demidova, N., Lim, J. H., Allard, G., Running, S. W., Semerci, A., and Cobb, N.: A global overview of drought and heat-induced tree mortality reveals emerging climate change risks for forests, Forest Ecol. Manage., 259, 660-684, https://doi.org/10.1016/j.foreco.2009.09.001, 2010.
Bayat, B., Nasseri, M., and Zahraie, B.: Identification of long-term annual pattern of meteorological drought based on spatiotemporal methods: evaluation of different geostatistical approaches, Nat. Hazards, 76, 515–541, https://doi.org/10.1007/s11069-014-1499-3, 2015.
Bouaziz, L. J. E., Aalbers, E. E., Weerts, A. H., Hegnauer, M., Buiteveld, H., Lammersen, R., Stam, J., Sprokkereef, E., Savenije, H. H. G., and Hrachowitz, M.: Ecosystem adaptation to climate change: the sensitivity of hydrological predictions to time-dynamic model parameters, Hydrol. Earth Syst. Sci., 26, 1295–1318, https://doi.org/10.5194/hess-26-1295-2022, 2022.
Brigode, P., Oudin, L., and Perrin, C.: Hydrological model parameter instability: A source of additional uncertainty in estimating the hydrological impacts of climate change?, J. Hydrol., 476, 410–425, https://doi.org/10.1016/j.jhydrol.2012.11.012, 2013.
Cahill, N., Rahmstorf, S., and Parnell, A. C.: Change points of global temperature, Environ. Res. Lett., 10, 084002, https://doi.org/10.1088/1748-9326/10/8/084002, 2015.
Carlin, B. P., Gelfand, A. E., and Smith, A. F. M.: Hierarchical bayesian-analysis of changepoint problems, J. R. Stat. Soc. C., 41, 389–405, https://doi.org/10.2307/2347570, 1992.
Carrer, G. E., Klaus, J., and Pfister, L.: Assessing the Catchment Storage Function Through a Dual-Storage Concept, Water Resour. Res., 55, 476–494, https://doi.org/10.1029/2018wr022856, 2019.
Changnon, D. and Gensini, V. A.: Changing Spatiotemporal Patterns of 5- and 10-Day Illinois Heavy Precipitation Amounts, 1900–2018, J. Appl. Meteorol. Clim., 58, 1523–1533, https://doi.org/10.1175/jamc-d-18-0335.1, 2019.
Chawla, I. and Mujumdar, P. P.: Isolating the impacts of land use and climate change on streamflow, Hydrol. Earth Syst. Sci., 19, 3633–3651, https://doi.org/10.5194/hess-19-3633-2015, 2015.
Chen, Q. H., Chen, H., Wang, J. X., Zhao, Y., Chen, J., and Xu, C. Y.: Impacts of Climate Change and Land-Use Change on Hydrological Extremes in the Jinsha River Basin, Water, 11, 1398, https://doi.org/10.3390/w11071398, 2019.
Coron, L., Andreassian, V., Perrin, C., Lerat, J., Vaze, J., Bourqui, M., and Hendrickx, F.: Crash testing hydrological models in contrasted climate conditions: An experiment on 216 Australian catchments, Water Resour. Res., 48, W05552, https://doi.org/10.1029/2011wr011721, 2012.
Costa, M. H., Botta, A., and Cardille, J. A.: Effects of large-scale changes in land cover on the discharge of the Tocantins River, Southeastern Amazonia, J. Hydrol., 283, 206–217, https://doi.org/10.1016/s0022-1694(03)00267-1, 2003.
Das, S., Das, J., and Umamahesh, N. V.: Identification of future meteorological drought hotspots over Indian region: A study based on NEX-GDDP data, Int. J. Climatol., 41, 5644–5662, https://doi.org/10.1002/joc.7145, 2021.
Demirel, M. C., Booij, M. J., and Hoekstra, A. Y.: Effect of different uncertainty sources on the skill of 10 day ensemble low flow forecasts for two hydrological models, Water Resour. Res., 49, 4035–4053, https://doi.org/10.1002/wrcr.20294, 2013.
Deng, C., Liu, P., Guo, S. L., Li, Z. J., and Wang, D. B.: Identification of hydrological model parameter variation using ensemble Kalman filter, Hydrol. Earth Syst. Sci., 20, 4949–4961, https://doi.org/10.5194/hess-20-4949-2016, 2016.
Deng, C., Liu, P., Wang, D. B., and Wang, W. G.: Temporal variation and scaling of parameters for a monthly hydrologic model, J. Hydrol., 558, 290–300, https://doi.org/10.1016/j.jhydrol.2018.01.049, 2018.
Fensham, R. J., Fairfax, R. J., and Ward, D. P.: Drought-induced tree death in savanna, Global Change Biol., 15, 380–387, https://doi.org/10.1111/j.1365-2486.2008.01718.x, 2009.
Fohrer, N., Haverkamp, S., and Frede, H. G.: Assessment of the effects of land use patterns on hydrologic landscape functions: development of sustainable land use concepts for low mountain range areas, Hydrol. Process., 19, 659–672, https://doi.org/10.1002/hyp.5623, 2005.
Gao, H., Hrachowitz, M., Schymanski, S. J., Fenicia, F., Sriwongsitanon, N., and Savenije, H. H. G.: Climate controls how ecosystems size the root zone storage capacity at catchment scale, Geophys. Res. Lett., 41, 7916–7923, https://doi.org/10.1002/2014gl061668, 2014.
Huang, S. Z., Li, P., Huang, Q., Leng, G. Y., Hou, B. B., and Ma, L.: The propagation from meteorological to hydrological drought and its potential influence factors, J. Hydrol., 547, 184–195, https://doi.org/10.1016/j.jhydrol.2017.01.041, 2017.
Hughes, J. D., Petrone, K. C., and Silberstein, R. P.: Drought, groundwater storage and stream flow decline in southwestern Australia, Geophys. Res. Lett., 39, L03408, https://doi.org/10.1029/2011gl050797, 2012.
Hunt, B. G.: Multi-annual dry episodes in Australian climatic variability, Int. J. Climatol., 29, 1715–1730, https://doi.org/10.1002/joc.1820, 2009.
Jeremiah, E., Marshall, L., Sisson, S. A., and Sharma, A.: Specifying a hierarchical mixture of experts for hydrologic modeling: Gating function variable selection, Water Resour. Res., 49, 2926–2939, https://doi.org/10.1002/wrcr.20150, 2013.
Jung, I. W., Moradkhani, H., and Chang, H.: Uncertainty assessment of climate change impacts for hydrologically distinct river basins, J. Hydrol., 466, 73–87, https://doi.org/10.1016/j.jhydrol.2012.08.002, 2012.
Kumar, A., Panda, K. C., Nafil, M., and Sharma, G.: Identification of meteorological drought characteristics and drought year based on rainfall departure analysis, J. Appl. Sci. Tech., 39, 51–59, 2020.
Kundu, S., Khare, D., and Mondal, A.: Individual and combined impacts of future climate and land use changes on the water balance, Ecol. Eng., 105, 42–57, https://doi.org/10.1016/j.ecoleng.2017.04.061, 2017.
Kunnath-Poovakka, A. and Eldho, T. I.: A comparative study of conceptual rainfall-runoff models GR4J, AWBM and Sacramento at catchments in the upper Godavari river basin, India, J. Earth Syst. Sci., 128, 1–15, https://doi.org/10.1007/s12040-018-1055-8, 2019.
Kusangaya, S., Warburton, M. L., van Garderen, E. A., and Jewitt, G. P. W.: Impacts of climate change on water resources in southern Africa: A review, Phys. Chem. Earth, 67–69, 47–54, https://doi.org/10.1016/j.pce.2013.09.014, 2014.
Lawes, R. A., Oliver, Y. M., and Robertson, M. J.: Integrating the effects of climate and plant available soil water holding capacity on wheat yield, Field Crop. Res., 113, 297–305, https://doi.org/10.1016/j.fcr.2009.06.008, 2009.
Leblanc, M. J., Tregoning, P., Ramillien, G., Tweed, S. O., and Fakes, A.: Basin-scale, integrated observations of the early 21st century multiyear drought in southeast Australia, Water Resour. Res., 45, W04408, https://doi.org/10.1029/2008wr007333, 2009.
Leenaars, J. G., Claessens, L., Heuvelink, G. B., Hengl, T., González, M. R., van Bussel, L. G., and Cassman, K. G.: Mapping rootable depth and root zone plant-available water holding capacity of the soil of sub-Saharan Africa, Geoderma, 324, 18–36, https://doi.org/10.13140/RG.2.1.3950.9209, 2018.
Le Moine, N., Andreassian, V., and Mathevet, T.: Confronting surface- and groundwater balances on the La Rochefoucauld-Touvre karstic system (Charente, France), Water Resour. Res., 44, W03403, https://doi.org/10.1029/2007wr005984, 2008.
Lenoir, J., Gégout, J. C., Marquet, P. A., de Ruffray, P., and Brisse, H.: A significant upward shift in plant species optimum elevation during the 20th century, Science, 320, 1768–1771, https://doi.org/10.1016/j.idairyj.2006.12.007, 2008.
Lin, B. Q., Chen, X. W., Yao, H. X., Chen, Y., Liu, M. B., Gao, L., and James, A.: Analyses of landuse change impacts on catchment runoff using different time indicators based on SWAT model, Ecol. Indicat., 58, 55–63, https://doi.org/10.1016/j.ecolind.2015.05.031, 2015.
McNamara, J. P., Tetzlaff, D., Bishop, K., Soulsby, C., Seyfried, M., Peters, N. E., Aulenbach, B. T., and Hooper, R.: Storage as a metric of catchment comparison, Hydrol. Process., 25, 3364–3371, https://doi.org/10.1002/hyp.8113, 2011.
Melsen, L., Teuling, A., Torfs, P., Zappa, M., Mizukami, N., Clark, M., and Uijlenhoet, R.: Representation of spatial and temporal variability in large-domain hydrological models: case study for a mesoscale pre-Alpine basin, Hydrol. Earth Syst. Sci., 20, 2207–2226, https://doi.org/10.5194/hess-20-2207-2016, 2016.
Nepal, S., Chen, J., Penton, D. J., Neumann, L. E., Zheng, H. X., and Wahid, S.: Spatial GR4J conceptualization of the Tamor glaciated alpine catchment in Eastern Nepal: evaluation of GR4JSG against streamflow and MODIS snow extent, Hydrol. Process., 31, 51–68, https://doi.org/10.1002/hyp.10962, 2017.
Nicholls, N.: The changing nature of Australian droughts, Climatic Change, 63, 323–336, https://doi.org/10.1023/B:CLIM.0000018515.46344.6d, 2004.
Nijzink, R., Hutton, C., Pechlivanidis, I., Capell, R., Arheimer, B., Freer, J., Han, D., Wagener, T., McGuire, K., Savenije, H., and Hrachowitz, M.: The evolution of root-zone moisture capacities after deforestation: a step towards hydrological predictions under change?, Hydrol. Earth Syst. Sci., 20, 4775–4799, https://doi.org/10.5194/hess-20-4775-2016, 2016.
Oke, O. A. and Thompson, K. A.: Distribution models for mountain plant species: the value of elevation, Ecol. Model., 301, 72–77, https://doi.org/10.1016/j.ecolmodel.2015.01.019, 2015.
Pan, Z. K., Liu, P., Gao, S. D., Cheng, L., Chen, J., and Zhang, X. J.: Reducing the uncertainty of time-varying hydrological model parameters using spatial coherence within a hierarchical Bayesian framework, J. Hydrol., 577, 123927, https://doi.org/10.1016/j.jhydrol.2019.123927, 2019a.
Pan, Z. K., Liu, P., Gao, S. D., Xia, J., Chen, J., and Cheng, L.: Improving hydrological projection performance under contrasting climatic conditions using spatial coherence through a hierarchical Bayesian regression framework, Hydrol. Earth Syst. Sci., 23, 3405–3421, https://doi.org/10.5194/hess-23-3405-2019, 2019b.
Pan, Z. K., Liu, P., Xu, C. Y., Cheng, L., Tian, J., Cheng, S. J., and Xie, K.: The influence of a prolonged meteorological drought on catchment water storage capacity: a hydrological-model perspective, Hydrol. Earth Syst. Sci., 24, 4369–4387, https://doi.org/10.5194/hess-24-4369-2020, 2020.
Patil, S. D. and Stieglitz, M.: Comparing Spatial and temporal transferability of hydrological model parameters, J. Hydrol., 525, 409–417, https://doi.org/10.1016/j.jhydrol.2015.04.003, 2015.
Perrin, C., Michel, C., and Andreassian, V.: Improvement of a parsimonious model for streamflow simulation, J. Hydrol., 279, 275–289, https://doi.org/10.1016/s0022-1694(03)00225-7, 2003.
Potter, N. J., Petheram, C., and Zhang, L.: Sensitivity of streamflow to rainfall and temperature in south-eastern Australia during the Millennium drought, in: 19th International Congress on Modelling and Simulation (MODSIM), December 2011, Perth, Australia, 3636–3642, WOS:000314989303087, 2011.
Saft, M., Western, A. W., Zhang, L., Peel, M. C., and Potter, N. J.: The influence of multiyear drought on the annual rainfall–runoff relationship: An Australian perspective, Water Resour. Res., 51, 2444–2463, https://doi.org/10.1002/2014wr015348, 2015.
Saft, M., Peel, M. C., Western, A. W., and Zhang, L.: Predicting shifts in rainfall-runoff partitioning during multiyear drought: Roles of dry period and catchment characteristics, Water Resour. Res., 52, 9290–9305, https://doi.org/10.1002/2016wr019525, 2016.
Sezen, C. and Partal, T.: The utilization of a GR4J model and wavelet-based artificial neural network for rainfall-runoff modelling, Water Supply, 19, 1295–1304, https://doi.org/10.2166/ws.2018.189, 2019.
Shen, M. X., Chen, J., Zhuan, M. J., Chen, H., Xu, C. Y., and Xiong, L. H.: Estimating uncertainty and its temporal variation related to global climate models in quantifying climate change impacts on hydrology, J. Hydrol., 556, 10–24, https://doi.org/10.1016/j.jhydrol.2017.11.004, 2018.
Singh, C., Wang-Erlandsson, L., Fetzer, I., Rockstrom, J., and van der Ent, R.: Rootzone storage capacity reveals drought coping strategies along rainforest-savanna transitions, Environ. Res. Lett., 15, 124021, https://doi.org/10.1088/1748-9326/abc377, 2020.
Siriwardena, L., Finlayson, B. L., and McMahon, T. A.: The impact of land use change on catchment hydrology in large catchments: The Comet River, Central Queensland, Australia, J. Hydrol., 326, 199–214, https://doi.org/10.1016/j.jhydrol.2005.10.030, 2006.
Thiemann, M., Trosset, M., Gupta, H., and Sorooshian, S.: Bayesian recursive parameter estimation for hydrologic models, Water Resour. Res., 37, 2521–2535, https://doi.org/10.1029/2000wr900405, 2001.
Tian, J., Guo, S. L., Deng, L. L., Yin, J. B., Pan, Z. K., He, S. K., and Li, Q. X.: Adaptive optimal allocation of water resources response to future water availability and water demand in the Han River basin, China, Sci. Rep., 11, 1–18, https://doi.org/10.1038/s41598-021-86961-1, 2021.
Tu, J.: Combined impact of climate and land use changes on streamflow and water quality in eastern Massachusetts, USA, J. Hydrol., 379, 268–283, https://doi.org/10.1016/j.jhydrol.2009.10.009, 2009.
van Dijk, A., Beck, H. E., Crosbie, R. S., de Jeu, R. A. M., Liu, Y. Y., Podger, G. M., Timbal, B., and Viney, N. R.: The Millennium Drought in southeast Australia (2001–2009): Natural and human causes and implications for water resources, ecosystems, economy, and society, Water Resour. Res., 49, 1040–1057, https://doi.org/10.1002/wrcr.20123, 2013.
Van Lanen, H. A. J., Wanders, N., Tallaksen, L. M., and Van Loon, A. F.: Hydrological drought across the world: impact of climate and physical catchment structure, Hydrol. Earth Syst. Sci., 17, 1715–1732, https://doi.org/10.5194/hess-17-1715-2013, 2013.
Vrugt, J. A., Gupta, H. V., Bouten, W., and Sorooshian, S.: A Shuffled Complex Evolution Metropolis algorithm for optimization and uncertainty assessment of hydrologic model parameters, Water Resour. Res., 39, 1201, https://doi.org/10.1029/2002wr001642, 2003.
Westra, S., Thyer, M., Leonard, M., Kavetski, D., and Lambert, M.: A strategy for diagnosing and interpreting hydrological model nonstationarity, Water Resour. Res., 50, 5090–5113, https://doi.org/10.1002/2013wr014719, 2014.
Yandell, B. S.: Kernel Smoothing, Technometrics, 38, 75–76, 1996.
Zeng, L., Xiong, L. H., Liu, D. D., Chen, J., and Kim, J. S.: Improving Parameter Transferability of GR4J Model under Changing Environments Considering Nonstationarity, Water, 11, 10.3390/w11102029, 2019.
Zhang, Y. Q., Viney, N., Frost, A., Oke, A., Brooks, M., Chen, Y., and Campbell, N.: Collation of Australian modeller's streamflow dataset for 780 unregulated Australian catchments, CSIRO: Water for a healthy country national research flagship, CSIRO, 115 pp., https://doi.org/10.4225/08/58b5baad4fcc2, 2013.