the Creative Commons Attribution 4.0 License.
the Creative Commons Attribution 4.0 License.
 | 27 Sep 2022
Global assessment of subnational drought impact based on the Geocoded Disasters dataset and land reanalysis
Yohei Sawada
Despite the importance of a link between hydrometeorological drought hazards and their socioeconomic impact, the link at a subnational level has yet to be evaluated due to the lack of precise subnational information on disaster locations. Using the newly developed Geocoded Disasters (GDIS) dataset, we examined whether the subnational socioeconomic drought impact information in GDIS could be represented by hydrometeorological hazards quantified from soil moisture in ERA5-Land during 1964–2018. We found that the socioeconomic drought impacts shown in GDIS were generally represented by drought hazards quantified from ERA5-Land soil moisture. Our comparison between GDIS and ERA5-Land could benefit the quantification of vulnerability to drought, and we found that sub-Saharan Africa and South Asia were vulnerable to drought, while North America and Europe were less vulnerable to drought. Both GDIS and ERA5-Land indicated that the Horn of Africa, northern China, and western India were drought-prone areas. Since it is difficult for national-level analyses to accurately identify the locations of drought-prone areas, especially in large countries such as China and India, our analysis clarifies the importance of the use of subnational disaster information.
- Article
(2717 KB) - Full-text XML
-
Supplement
(1432 KB) - BibTeX
- EndNote


Drought is one of the costliest natural disasters, with cascading impacts on multiple socioeconomic sectors (Mishra and Singh, 2010). Wilhite and Glantz (1985) proposed a conceptual model of drought propagation from natural hydrometeorological hazards defined by physical characteristics (e.g. precipitation, soil moisture, or streamflow) to socioeconomic drought impacts (e.g. crop yield loss, water shortages, or health problems). The propagation from the natural hydrometeorological hazards to the socioeconomic impact can be affected by many regional vulnerability factors, such as infrastructure and economic, social, or cultural assets (e.g. Fuchs et al., 2019; Lavell et al., 2012; UNDP, 2004; Wilhite and Glantz, 1985). To understand this drought propagation, a subnational-level disaster analysis is necessary, rather than aggregated national-level disaster analyses (Rosvold and Buhaug, 2021a). How historical drought events evolved from natural hydrometeorological hazards to socioeconomic drought impacts at a subnational level needs to be analysed to improve regional drought mitigation measures.
Several studies have analysed the link between natural hydrometeorological hazards and socioeconomic drought impacts to quantify the regional characteristics of historical drought events. Disaster databases such as the Emergency Events Database (EM-DAT; Guha-Sapir et al., 2022), the European Drought Impact Report Inventory (EDII; Stahl et al., 2016), and the U.S. Drought Impact Reporter (US DIR; Wilhite et al., 2007), as well as newspaper information (de Brito et al., 2020), have been used as reference data for historical socioeconomic impacts. Bachmair et al. (2016) used EDII to estimate the thresholds of hydrometeorological drought indices at which socioeconomic droughts occur in Germany and UK at a subnational level. Noel et al. (2020) compared the U.S. Drought Monitor (USDM; Svoboda et al. 2002), a weekly map depicting severity and spatial extent of drought, with US DIR at the state level. Although EDII and US DIR contain detailed disaster impact information at a subnational level and are useful for quantifying the link between hydrometeorological hazards and socioeconomic impacts, they do not cover the entire globe. EM-DAT is a global database and has been extensively used for the international comparison of disaster risks and vulnerability (e.g. Jägermeyr and Frieler, 2018; Shen and Hwang, 2019; Tschumi and Zscheischler, 2020). Although some studies used text-based disaster locations (i.e. names of affected provinces, districts, and towns) in EM-DAT to perform the subnational-scale analyses, they simply evaluated the applicability of a drought index for the specific regional events (e.g. Bayissa et al., 2018; Lu et al., 2019) and for global events in a short period of time (2010–2015; Sánchez et al., 2018). The subnational impact information of the disaster database has not been fully used to quantify the link between hydrometeorological drought hazards and socioeconomic impacts on a global scale. In addition, regional vulnerability against drought events has not been quantified by using such databases on a global scale.
Instead of the disaster databases, agricultural production or remotely sensed vegetation dynamics have also been used to assess the impact of drought on society. Udmale et al. (2020) compared cereal production with drought indices such as Standardized Precipitation Index (SPI; McKee et al., 1993) and Standardized Precipitation Evaporation Index (SPEI; Vicente-Serrano et al., 2010) in India. Kim et al. (2019) examined the vulnerability of cereal production to drought on a country scale using a global crop model. Chen et al. (2020) quantified the impact of droughts on vegetation growth for different biome types and climate regimes by comparing SPEI and a vegetation index. Although agricultural production and vegetation dynamics are available globally and easy to quantify, there are some problems with using them as the reference data of socioeconomic drought impacts. Agricultural production can be affected by factors other than drought, and it can capture aggregated information on large events (Bachmair et al., 2016). It is unclear whether socioeconomic drought impacts are associated with a decline in vegetation growth. It is ideal to base the socioeconomic drought impact on a disaster database since it directly shows events in which the society has actually suffered from drought.
The link between natural hydrometeorological hazards and socioeconomic drought impact at a subnational level has yet to be globally evaluated. The major obstacle is a lack of accurate information of socioeconomic drought impacts at subnational scales (Bachmair et al., 2016). Recently, a global dataset of geocoded disaster locations, the Geocoded Disasters (GDIS), has been developed (Rosvold and Buhaug, 2021a). Although EM-DAT contains information about the location of disasters, the data are in the form of text-based information, and some events have incomplete information about their locations, which is not suitable for comprehensive geospatial analyses. GDIS is the geocoded database based on the EM-DAT location information, with some manual validations, and provides geographic information system (GIS) polygons of affected administrative units. GDIS can be a useful tool to globally assess the link between natural hydrometeorological hazards and socioeconomic drought impact with precise locations at a subnational level.
This study aims to examine the link between natural hydrometeorological hazards and the subnational socioeconomic drought impact shown in GDIS. As a natural hydrometeorological hazard, we used drought indices generated from soil moisture simulated by land reanalysis, i.e. ERA5-Land (Muñoz Sabater, 2019, 2021). First, we examined whether the GDIS drought events were generally represented by the drought indices quantified from ERA5-Land. Then, we quantified the levels of drought indices associated with GDIS drought events in different geographical regions which could benefit the quantification of vulnerability to drought. Finally, we compared the global spatial distribution of drought-prone areas in GDIS with those quantified from ERA5-Land.
2.1 ERA5-Land
To calculate drought indices, ERA5-Land soil moisture data were used. Wilhite and Glantz (1985) mentioned that soil moisture plays an important role in the drought propagation since it affects both agricultural and hydrological aspects of drought (see also Sawada, 2018). Many drought monitoring systems have also used soil moisture as one of the most important variables (e.g. USDM, Svoboda et al., 2002; the German drought monitor, Zink et al., 2016; InterSucho in Czech Republic and Slovakia, Trnka et al., 2020).
We used monthly averaged data from 1950 to 2020. The original spatial resolution of 0.1∘ was upscaled to 0.25∘ to reduce the data volume by using a remapping function of the Climate Data Operator (CDO) software version 2.0.0 (Schulzweida, 2021). This spatial resolution is relatively high compared to previous global-scale drought studies (e.g. Hanel et al., 2018; Herrera-Estrada et al., 2017; Mocko et al., 2021; Sawada, 2018).
We used the first (0–7 cm), second (7–28 cm), and third (28–100 cm) layers of soil moisture in ERA5-Land to generate drought indices. Since previous works used soil moisture from the top 1 m to 1–2 m soil depths as root zone soil moisture (e.g. Almendra-Martín et al., 2021; Hanel et al., 2018; Herrera-Estrada et al., 2017; Mocko et al., 2021), we also used the top 1 m (0–100 cm) soil moisture data. For the top 1 m soil moisture, we calculated the weighting average of soil moisture in the first, second, and third layers according to their thicknesses.
2.2 GDIS
GDIS (Rosvold and Buhaug, 2021b) can be downloaded from https://doi.org/10.7927/zz3b-8y61. GDIS is generated based on EM-DAT. A natural disaster is recorded into EM-DAT if at least one of the following criteria is fulfilled: 10 or more people are dead, 100 or more people are affected, and there is a declaration of a state of emergency and a call for international assistance (Guha-Sapir et al., 2022).
In total, 282 drought events from 1964 to 2018 were analysed. Each drought event is distinguished based on the EM-DAT database's event identifier (disasterno). In EM-DAT, disaster events are uniquely distinguished by the combination of an eight-digit disaster code and a three-digit country code. In contrast, GDIS uses only the eight-digit disaster code, which it has in common with EM-DAT, and assigns the same identifier to a disaster event even if it spreads over multiple countries. In the case of extensive drought events, such as ones induced by El Niño–Southern Oscillation (ENSO), it is not reasonable to treat distant countries with the same event identifier. In this study, the event classification of the original EM-DAT was adopted so that events with the same disaster code that spread over multiple countries in GDIS were analysed as a separate event for each country. Originally there were 433 drought events in GDIS, and 282 events that met the following criteria were used in this study: (1) the drought period is longer than or equal to 2 months, and (2) the GDIS event area is larger than or equal to 50 grid cells in the upscaled ERA5-Land. We did not analyse flash droughts which occurred in periods shorter than 2 months. The effective resolution of the phenomena that can be represented by a numerical simulation model is several times larger than the original size of computational grids (Skamarock, 2004), so that events with a small extent relative to the grid spacing were neglected in this study. GDIS itself does not have drought period information, namely when the event starts and ends. The drought period information was added to GDIS via EM-DAT database's event identifiers. EM-DAT shows only the event year and provides no information on the start and/or end month for some drought events. In such cases, we applied January as the start and December as the end of the event. GDIS provides affected spatial geometry in the form of GIS polygons of administrative units. Administrative units with the same event identifier (disasterno) were treated as one GDIS event area (see Fig. 2 for an example). Sánchez et al. (2018) treated one drought event per one administrative unit. However, this event classification depends on the fineness of the division of administrative units (e.g. Thailand, where administrative units are very finely divided, has more than 50 events during 2010–2015 in Sánchez et al., 2018), which affects the results of drought detection skill. Therefore, we treated administrative units with the same event identifier as one drought event, following the EM-DAT classification.
2.3 Other supporting data
To show the levels of drought indices associated with GDIS drought events by geographical regions, we used the classification of the World Bank geographical regions.
As a proxy of exposure data, we used the Moderate Resolution Imaging Spectroradiometer (MODIS) Land Cover Climate Modeling Grid (CMG; MCD12C1) version 6 data product (Friedl and Sulla-Menashe, 2015). This land cover product has 17 classes. The temporal resolution is yearly, and we used the latest, 2020, data. The original spatial resolution is 0.05∘, and we resampled it to 0.25∘ with the nearest-neighbour approach.
3.1 Drought indices
We used two drought indices, the Drought Area Percentage (DAP) and the Standardized Deficit Index (SDI), to evaluate the severity of the hydrometeorological drought hazard in ERA5-Land. For the soil moisture data in each grid cell, percentiles were first calculated for each calendar month separately during 1950–2020. After the percentiles were calculated, only data during the period with the GDIS drought events (1964–2018) were used in all subsequent steps of this study. We used the longer period of original ERA5-Land data (1950–2020) to calculate percentiles than the study period (1964–2018) to yield more robust percentile values. The 20th percentile was taken as a threshold for defining a drought at each grid cell (Sheffield and Wood, 2011; Hanel et al., 2018). DAP is the maximum percentage of the area where soil moisture is below the 20th percentile threshold within the GDIS event area during the GDIS drought period. The higher percentage, the more severe the hydrometeorological hazard. DAP has been used as a drought index in many studies (e.g. Sánchez et al. 2018; Udmale et al. 2020).
DAP is a snapshot of the long-lasting drought phenomenon and does not include the cumulative effects of the long-lasting drought. The other limitation of DAP is that it could be affected by the size of the GDIS event area because DAP tends to be small in large-event areas. In addition to DAP, we developed a new drought indicator, called SDI, which accounts for the cumulative effects of drought and is less influenced by the size of the GDIS event area. First, a deficit volume, a cumulative deviation below the 20th percentile threshold, was calculated for each grid cell. Then, we summed up the maximum annual deficit volume per grid cell in each GDIS event area, which is defined as the annual maximum deficit volume in the GDIS event area. The cumulative effect of the movement of drought areas can be considered by calculating the annual maximum value for each grid before averaging the values within the GDIS event area. Finally, the annual maximum deficit volume in the GDIS event area was standardized, dividing each year's annual maximum deficit volume by the mean of the annual maximum deficit volume over the period (1964–2018). The higher the SDI, the more severe the hydrometeorological hazard, and the value of 1 is the standard annual maximum drought event. The standardization makes it possible to compare the different events across space and time, even if the size of the GDIS event area is quite different. Hanel et al. (2018) calculated SDI for each grid cell. We extended this methodology to evaluate the drought index representative in the GDIS event area.
3.2 Evaluation of the drought indices by GDIS
To evaluate whether the GDIS drought events are generally represented by the drought indices quantified from ERA5-Land, we tested whether the drought indices during the GDIS drought period were distinguishable from those during the whole period (1964–2018). We applied a bootstrap random resampling method to show the distributions of drought indices for the whole period. For DAP, we set a 12-month moving window, which is approximately the mean of the drought duration in GDIS, and extracted the maximum percentage in each window for each GDIS event. From these assemblies, we extracted DAP randomly with 1000 replications. For SDI, we extracted SDI randomly with 1000 replications from the whole study period. We used a two-sample Kolmogorov–Smirnov (K–S) test (Massey, 1951) to quantify the difference of the distributions of drought indices during the GDIS drought period and the whole period. If the p value of K–S test is smaller than 0.01, then the hypothesis that two distributions follow the same distribution is rejected at 1 % significance level. Due to the difference in the sample size (i.e. the drought period is 282, and the whole period by a bootstrap random resampling method is 1000), the distributions were normalized, namely that the densities sum to 1, prior to the comparison. We recognized that the GDIS drought events are generally represented by the drought indices quantified from ERA5-Land if the median of the drought index during the GDIS drought periods is higher than that of the whole period and the two distributions of the drought index are not statistically the same.
3.3 Regional levels of drought indices associated with GDIS drought events
The levels of hydrometeorological drought indices associated with drought events shown in GDIS are different in different regions. Vulnerability could explain these differences (Delbiso et al. 2017; Gasparrini et al. 2015; Tschumi and Zscheischler, 2020). Note that vulnerability is not the only explanation for these differences; exposure is another factor that influences the link between hazards and impact (Visser et al., 2014; see also Sect. 5). Since we did not directly include exposure, we recognized these differences as the proxy of vulnerability. Following Bachmair et al. (2016) and Tschumi and Zscheischler (2020), the levels of SDI which are associated with drought events in GDIS were quantified and analysed. The levels of SDI were stratified by geographical regions in order to understand the distribution of the proxy of vulnerability in each region.
3.4 Global drought frequency analysis by drought clustering
We analysed whether drought-prone areas identified by drought indices are globally consistent with those found in GDIS. We applied the drought clustering method (Andreadis et al., 2005) to search for the spatially contiguous areas (or clusters) under drought at each time step. In this drought clustering, we assume that drought occurs over a reasonably large spatial area driven by a large-scale climate process (Sheffield and Wood, 2011). We used the processing code developed by Herrera-Estrada and Diffenbaugh (2020).
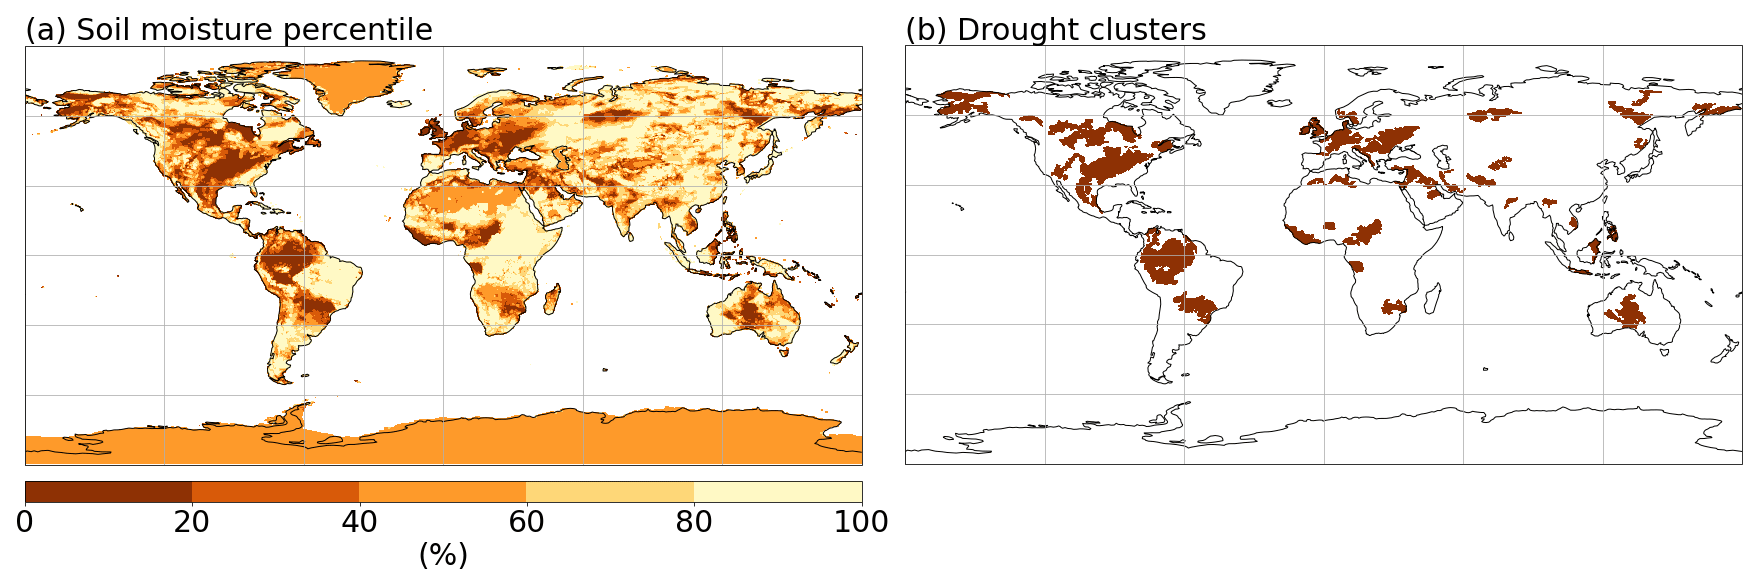
Figure 1Demonstration of drought clustering. (a) Global map of soil moisture percentile for the root zone layer's soil moisture in January 1964. (b) Drought clusters, spatially contiguous areas under drought (below the 20th percentile), are extracted from panel (a). A 2D median filter is applied prior to drought clustering, which causes slight differences when compared with (a).
After the percentiles are calculated in each grid cell, a 2D median filter is applied to each sample of monthly global data to smooth out small-scale noise. Contiguous areas under drought (soil moisture below the 20th percentile in this study) are aggregated into clusters at each time step. Following Herrera-Estrada and Diffenbaugh (2020), we analysed clusters that reach a maximum area of at least 100 000 km2 (approximately 120 grid cells in the upscaled ERA5-Land) to focus on large-scale droughts. For a sensitivity analysis of this size of drought clusters, see Sect. S1 and Fig. S1 in the Supplement. The location of the cluster centroid is detected at each time step using the weighting average of the cluster's location with the intensity values of the cluster grid cells. Droughts whose centroids fell within the barren or sparsely vegetated areas, based on MODIS land cover, were masked out of the cluster analysis due to the little or no exposure (i.e. population and assets; e.g. Carrão et al., 2016; Herrera-Estrada et al., 2017). We confirmed that there were no drought events in GDIS which were fully included within the barren or sparsely vegetated areas. Figure 1 demonstrates this drought clustering. The cluster centroid shows the area that experiences higher drought displacement, and we made an upscaled map of cluster centroids from the original spatial resolution of 0.25 to 2.5∘. For a sensitivity analysis of this upscaled resolution, see Sect. S2 and Fig. S2 and also see Andreadis et al. (2005) for details about the clustering method.
We visualized the socioeconomic drought-prone areas by overlaying all the polygons of the GDIS. We compared the regional drought frequencies in GDIS with the number of drought cluster centroids by ERA5-Land. We examined whether hydrometeorological drought-prone areas are consistent with those found in GDIS.
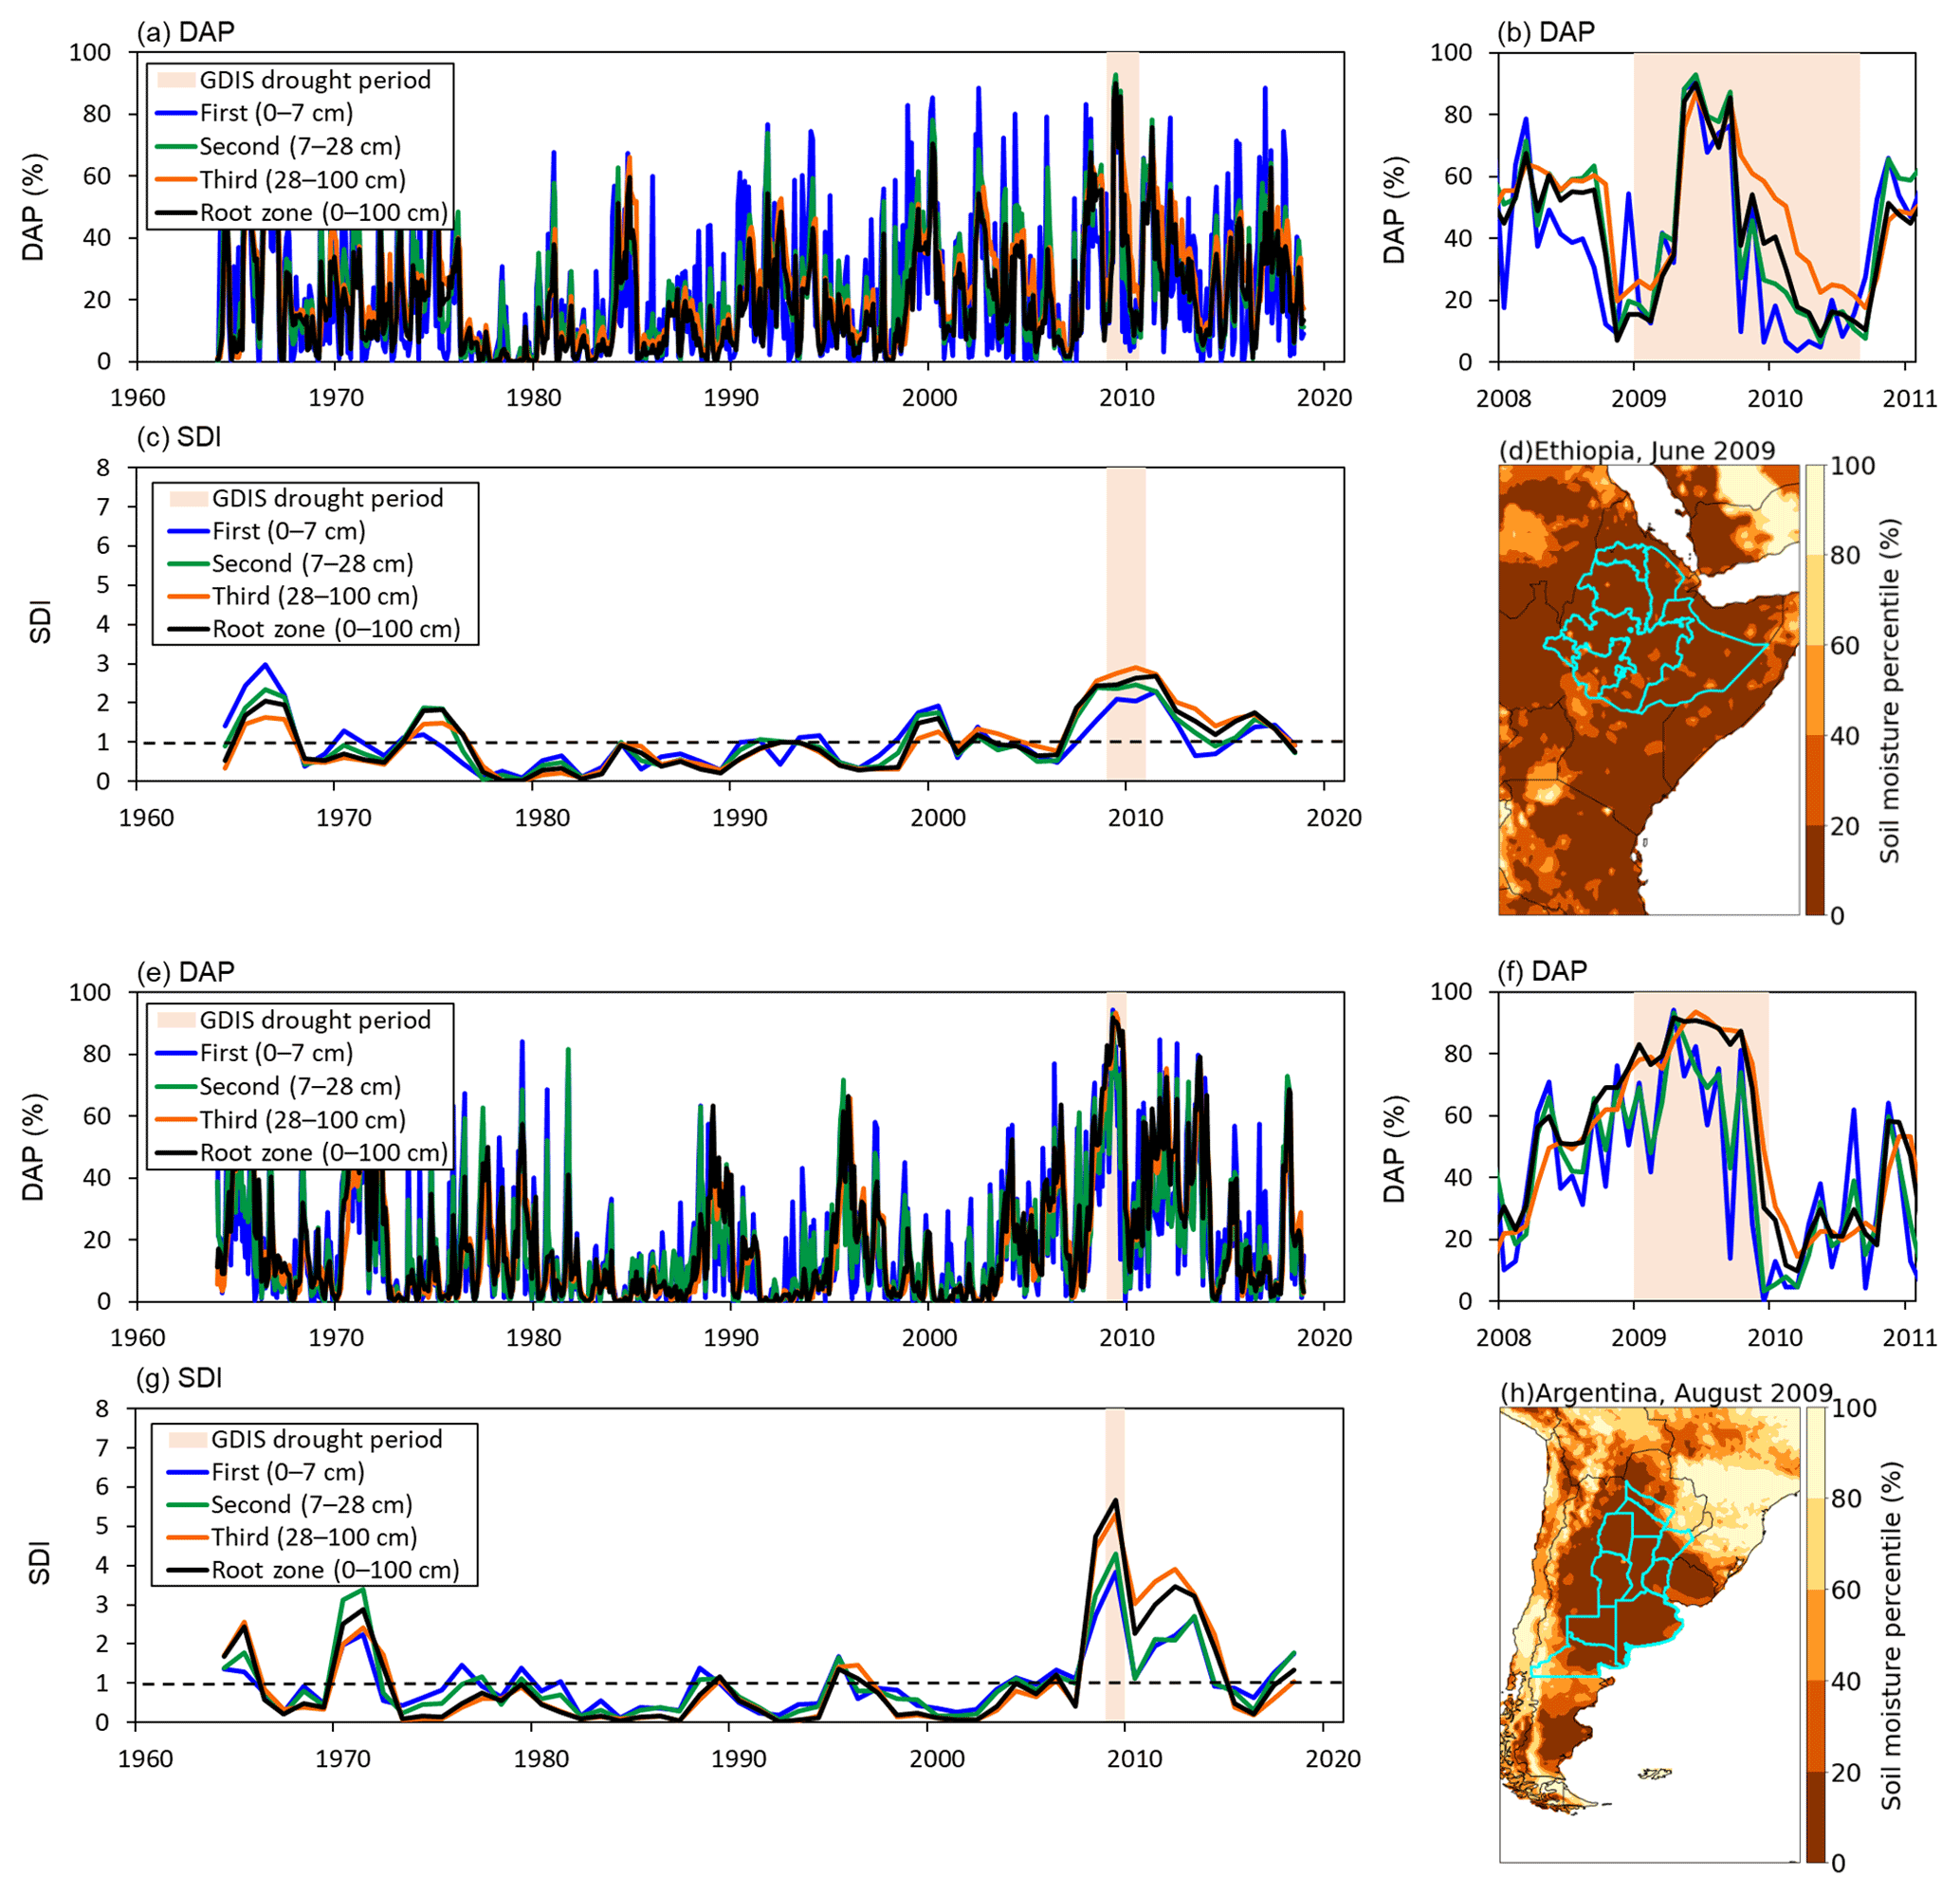
Figure 2Demonstration of drought indices in different soil layers for the drought events in Ethiopia in 2009 (a–d) and Argentina in 2009 (e–h). (a, e) DAP, where the red band shows the GDIS drought period and each coloured line shows the values in each soil layer (first – blue, second – green, third – orange, and root zone – black). (b, f) The enlarged view of DAP around the GDIS drought period. (c, g) SDI, where the legends are the same as DAP (a, e), and the grey dotted line shows the value of 1 (the mean of SDI over the study period). (d, h) The GDIS drought area of this event, where the black line shows the country border, and the light blue line shows the affected administrative units shown in GDIS. GDIS provides GIS polygons of the administrative units, and administrative units with the same event identifier (disasterno) were treated as one GDIS event area, i.e. the assembly of each light blue administrative unit. The soil moisture percentile is generated from the root zone layer's soil moisture, as an example.
4.1 The performance of drought indices for detecting the drought
Figure 2 demonstrates DAP and SDI for the drought events in Ethiopia and Argentina in 2009. For both drought indices, higher values indicate a more severe drought. Figure 2a and e show that DAPs in the first and second soil layers respond to the rainfall deficit more quickly than the deep soil layers. During the GDIS drought period, all layers show high DAPs, and the third layer has been experiencing a high DAP for a long time. DAPs in the first and second layer are sometimes high outside of the GDIS drought period. The root zone (0–100 cm) layer generally follows the third layer's fluctuations, though the root zone is positioned between the second and third layers during the GDIS drought period in the Ethiopia case. Figure 2c and g show that SDIs fluctuate less when compared with DAPs. This is because the SDI considers the cumulative effect. During the GDIS drought period, all layers show high SDIs, and the differences between the GDIS drought period and the non-drought period stand out more prominently compared with DAP. The third layer shows the highest SDI during the GDIS drought period, especially in Argentina case, reflecting the consistently high DAP during the GDIS drought period. The root zone (0–100 cm) layer generally follows the third layer's fluctuations.
Figures 3 and 4 reveal that ERA5-Land-based drought indices can distinguish the GDIS drought period from the whole period. The value above the violin plot shows the difference of the median values in the GDIS drought period and the whole period. In Fig. 3, DAP during the GDIS drought periods is significantly higher (p < 0.01) than that of the whole period in all soil layers. Note that the samples in the whole period shown in Fig. 3 include those during the GDIS drought period. In addition, severe drought events unreported in GDIS may also be included. The difference in the median values of DAP in the GDIS drought period and the whole period is largest in the third layer (28–100 cm) case. In Fig. 4, SDI during the GDIS drought period is significantly higher than that of the whole period in all soil layers, as we also found in DAP. Although the second, third, and root zone soil layers show the similar distributions, the difference of the median values of SDI in the GDIS drought period and the whole period is largest in the root zone (0–100 cm) case. Both of the drought indices based on ERA5-Land can generally represent the GDIS drought events. Note that although we confirmed a general link between drought hazards and the GDIS drought events, some GDIS events could not be explained by our indices based on the anomaly of soil moisture. We will use SDI for the regional comparison shown below because SDI is a standardized indicator which allows the comparison between the different events across space and time, even if the size of the GDIS event area is substantially different.
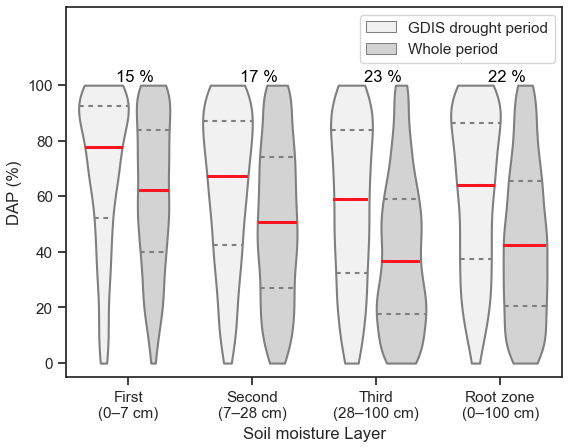
Figure 3Comparison of DAP between the GDIS drought period and the whole period. The red line shows the median value, and grey dotted lines show the 25th and 75th percentile values of each distribution. The value above the violin plot shows the difference in the median values in the GDIS drought period and the whole period.
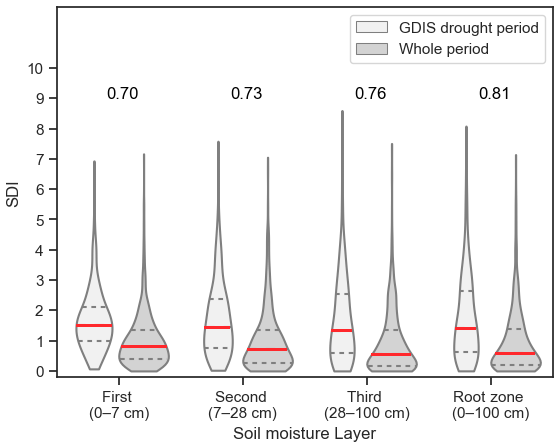
Figure 4Comparison of SDI between the GDIS drought period and the whole period. The red line shows the median value, and grey dotted lines show the 25th and 75th percentile values of each distribution. The value above the violin plot shows the difference in the median values in the GDIS drought period and the whole period.
4.2 Regional levels of drought indices associated with GDIS drought events
Figure 5 shows the distribution of the root zone layer's soil-moisture-based SDI stratified by geographical regions. The colour of the figure shows the average soil moisture over the study period. Sub-Saharan Africa and South Asia have many small SDI events associated with the GDIS-identified drought, while North America and Europe have a large number of large SDI events. Having many small SDI events indicates that less severe hydrometeorological droughts have caused serious socioeconomic impacts, meaning that the regions are vulnerable to drought. On the other hand, the regions with many large SDI events can be recognized as regions less vulnerable to drought. Thus, sub-Saharan Africa and South Asia are vulnerable to drought, while North America and Europe are less vulnerable to drought. Sub-Saharan Africa, which is vulnerable to drought, shows lower water availability. This regional characteristic of the proxy of vulnerability to drought can be found when SDI is generated by soil moisture in different soil layers (not shown). Note that the Middle East and North Africa were excluded from the analysis because the sample size was too small (n = 4).
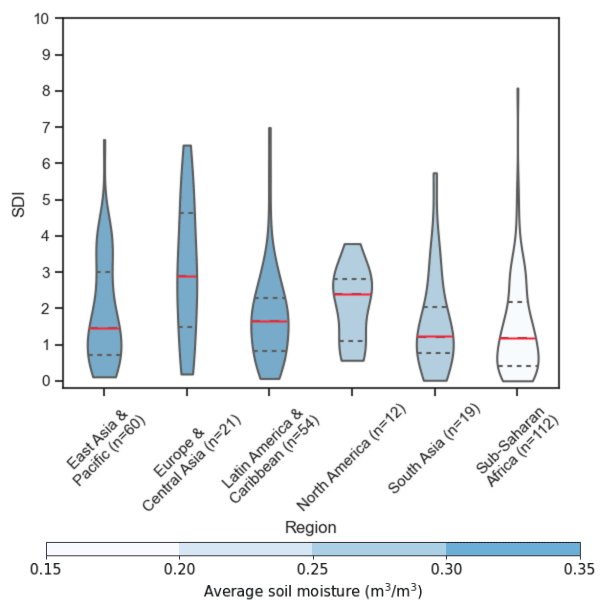
Figure 5Comparison of the root zone SDI by geographical regions. The red line shows the median value, and grey dotted lines show the 25th and 75th percentile values of each distribution. The colour shows the average soil moisture over the study period (1964–2018).

Figure 6The number of drought events based on GDIS. (a) Global map, with a magnified view of (b) the Horn of Africa, (c) Mozambique, (d) China, and (e) India.
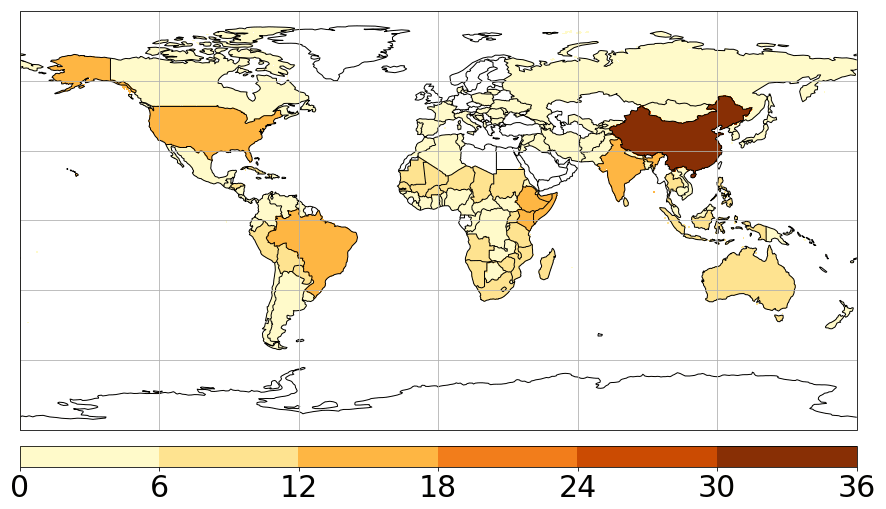
Figure 7The number of drought events based on EM-DAT.
4.3 Global drought frequency analysis by drought clustering
Figure 6 shows the number of drought events at a subnational level during 1964–2018 based on GDIS. It shows that the Horn of Africa, Mozambique, northern China, and western India are socioeconomic drought-prone areas. Each region is magnified in Fig. 6b to e. Figure 7 shows the number of drought events on the aggregated national level during the same period based on EM-DAT. Although we can see that the number of drought events is high in China, there is little information about the regional differences in drought-prone areas.
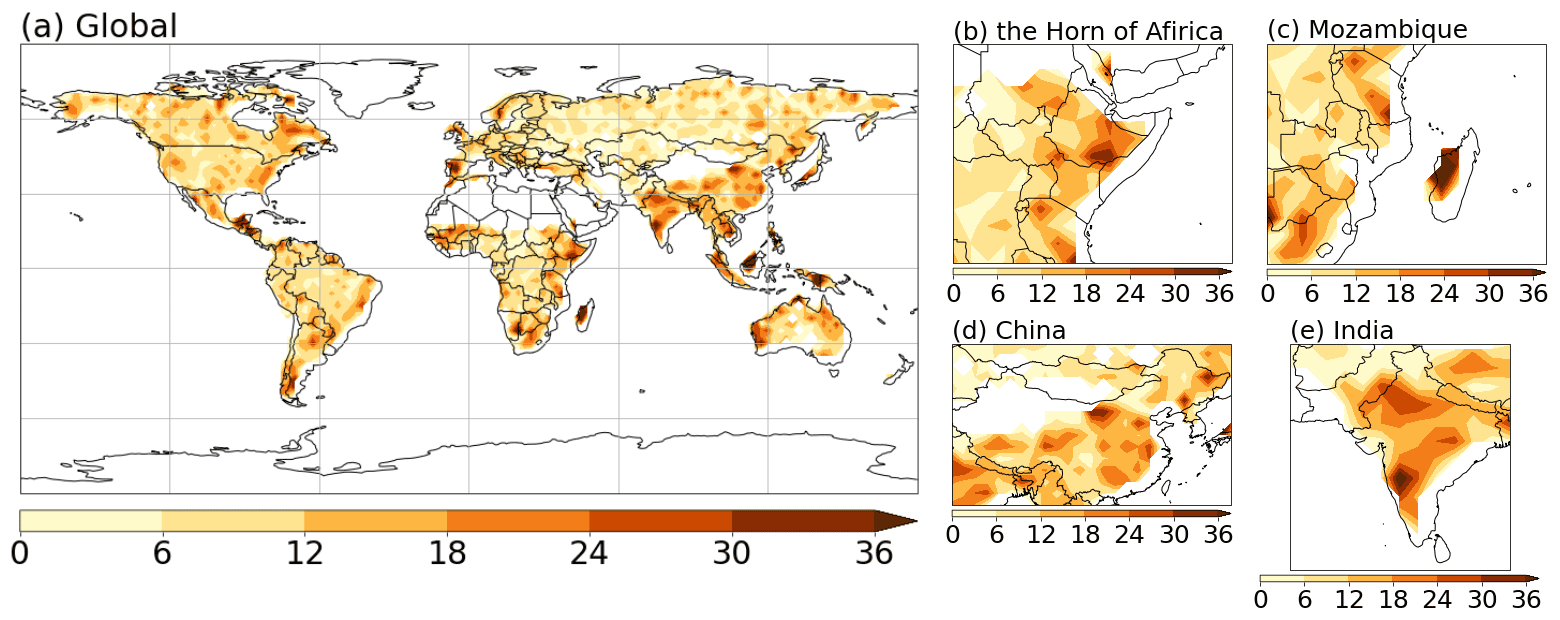
Figure 8The number of drought cluster centroids based on ERA5-Land. (a) Global map, with a magnified view of (b) the Horn of Africa, (c) Mozambique, (d) China, and (e) India.
This distribution of drought-prone areas in GDIS can be reproduced by ERA5-Land. Figure 8 shows the number of the drought cluster centroids upscaled to 2.5∘, based on drought clusters from ERA5-Land third layer's soil moisture. Drought-prone areas quantified from ERA5-Land soil moisture (Fig. 8) are consistent with those listed in GDIS (Fig. 6). The Horn of Africa, northern China, and western India can also be recognized as drought-prone areas by ERA5-Land-based drought clusters. Mozambique cannot be identified as a drought-prone area in ERA5-Land. Note that the number of the drought cluster centroids (Fig. 8) would be larger than the number of drought events in GDIS (Fig. 6). The number of drought events in GDIS is counted as one event even if a GDIS event lasts several months. On the other hand, the number of drought cluster centroids is counted in every monthly time step. Several clusters may be contained simultaneously in a large GDIS drought area. ERA5-Land identifies some drought-prone areas which are not included in GDIS, such as Namibia, Indonesia, and Spain. Also see the Supplement for a sensitivity analysis with the different thresholds of the size of drought clusters (Fig. S1) which show that drought-prone areas found in GDIS cannot be reproduced by ERA5-based drought-prone areas when we use drought clusters that have too small or large thresholds. The locations of drought-prone areas are almost the same when drought clusters are generated by soil moisture in different soil layers (Fig. S3). The drought-prone areas are most distinguishable from their surroundings in the third layer case.
In previous studies, the verification of subnational drought events by hydrometeorological data has been insufficient. There are some works only on the specific regions (e.g. Bayissa et al., 2018; Lu et al., 2019) or for a short period of time (Sánchez et al., 2018) due to the lack of precise subnational information on disaster locations. Using the latest subnational disaster database, GDIS, this study was able to cover a large number of drought events compared to previous studies. In Sánchez et al. (2018), the criterion for the detection of drought events was that more than one-third of the area was under drought. However, the size of the drought event area could affect the criterion, and the threshold of one-third is rather subjective. By defining the standardized drought index, this study uniformly and objectively showed the representation of subnational drought information by ERA5-Land soil moisture, even if the size of the event differs.
The comparison of SDI associated with GDIS drought events across regions benefits the quantification of vulnerability to drought in each region. We confirmed that sub-Saharan Africa and South Asia were vulnerable to drought, while North America and Europe were less vulnerable to drought. Tschumi and Zscheischler (2020) also showed smaller climate anomalies in less developed countries associated with EM-DAT disasters, meaning that less developed countries were vulnerable to natural hazards, as shown in Fig. 5. Previous studies have shown that a higher gross domestic product (GDP) per capita is associated with a lower vulnerability to natural hazards (e.g. Kim et al., 2019; Tanoue et al., 2016). North America and Europe are high-income countries, and these previous works support our findings. There are global vulnerability indices such as the WorldRiskIndex (Welle and Birkmann, 2015), INFORM index (Marin-Ferrer et al., 2017), and ND-GAIN (Chen et al. 2015), which combine socioeconomic factors such as economic level, infrastructure level, and education level. These indices have also indicated that sub-Saharan Africa and South Asia are vulnerable, while North America, Europe, Australia, and Japan are less vulnerable to natural hazards (Birkmann et al., 2021, 2022; Garschagen et al., 2021). The reason why the low-income countries are vulnerable to drought could be the lack of drought mitigation measures (dams, irrigation systems, early warning systems, etc.), as pointed out in previous studies (e.g. Lavell et al., 2012; Stringer et al., 2020; UNEP, 2018). As shown in Fig. 5, sub-Saharan Africa, which is vulnerable to drought, showed lower water availability. It may be another reason for the difficulty in managing the drought hazards in sub-Saharan Africa.
GDIS, a subnational-level disaster locations dataset, has enabled us to understand drought-prone areas on a finer scale than the previous global-scale analyses. EM-DAT is generally a national-level database with limited subnational disaster information. Shen and Hwang (2019) compared the frequency of disaster occurrence in EM-DAT at the national level and pointed out that frequent areas of disasters were large or populated countries. GDIS provides more detailed information about drought-prone areas, especially in large countries such as China and India. We successfully clarified that there was considerable heterogeneity in the drought-prone areas within the country.
There were some inconsistencies between hydrometeorological drought-prone areas in ERA5-Land and socioeconomic drought-prone areas in GDIS. Mozambique is a socioeconomic drought-prone area in GDIS, which cannot be identified as a drought-prone area in ERA5-Land. Madagascar, which is geographically closer to Mozambique, is a drought-prone area in ERA5-Land. The performance of ERA5-Land in simulating soil moisture might affect these inconsistencies. In contrast, there were some hydrometeorological drought-prone areas in ERA5-Land which were not included in the socioeconomic drought-prone areas in GDIS (e.g. Spain, Namibia, and Indonesia). Spain, a European country, is less vulnerable to drought, as shown in Fig. 5 (two events were observed in Spain, and their average SDI was 4.3). In Namibia, a lack of exposure makes socioeconomic droughts less likely to occur. When assessing the socioeconomic impact, the presence of the exposure should also be considered (Visser et al., 2014). Namibia has an extremely low population density throughout the country (less than 1 person per km2 in 2020; Gridded Population of the World (GPW) version 4.11; Doxsey-Whitfield et al., 2015). Similarly, the region in the west of Australia and central and eastern Russia do not have socioeconomic droughts in GDIS due to their low population density. In Indonesia, the absolute amount of rainfall is so high that the relatively low soil moisture may not cause socioeconomic drought. Kim et al. (2019) reported that there was no clear correlation between drought severity and yields reduction in areas where the average annual precipitation is more than 900 mm. Indonesia is one of the rainiest regions on the globe, with more than 2700 mm annual precipitation (FAO, 2022). Despite these individual circumstances, our results showed that socioeconomic drought-prone areas in GDIS were generally consistent with hydrometeorological drought-prone areas in ERA5-Land (the Horn of Africa, northern China, and western India), indicating that the reanalysis product can be utilized to show the potential of socioeconomic drought impact.
The consistency between hydrometeorological drought-prone areas in ERA5-Land and socioeconomic drought-prone areas in GDIS shows that spatially large hydrometeorological droughts (we analysed at least 100 000 km2) typically lead to impacts as shown in GDIS. Although the drought frequency defined by simulated soil moisture is the same everywhere at the grid level (we set the 20th percentile as a drought threshold), there was considerable heterogeneity in the spatially large drought-prone areas (Fig. 8). There are some factors that contribute to the emergence of drought-prone areas, such as the El Niño Southern Oscillation (ENSO), La Niña, Intertropical Convergence Zone (ITCZ), monsoon, land–atmosphere coupling, and anticyclones (Christian et al., 2021). La Niña affects the Horn of Africa, northern China, and western India and has caused severe drought impacts (Funk, 2011; Jain et al., 2021). Ummenhofer et al. (2011) clarified the effect of the El Niño–Indian monsoon relationship on drought in western India. Spatiotemporally large events such as La Niña might cause a drought to persist, which leads to drought impacts as shown in GDIS. However, the drought factors are complex, and much future work is needed to reveal the mechanism of the emergence of drought-prone areas.
Although various reanalysis products have been developed, and their validations have been conducted by comparing them with Earth observation data (e.g. Muñoz-Sabater et al., 2021; Reichle et al., 2017; Rodell et al., 2004), few studies have examined the validation in terms of the disaster occurrence. Sawada (2018) compared the areas identified as drought from a reanalysis product with the disaster records from EM-DAT but only at a country-scale. As seen in Fig. 7, national-level information does not provide accurate views of disaster locations, so that it is insufficient for validation data. The use of subnational disaster databases such as GDIS opens the door to validate reanalysis products in terms of the disaster occurrence.
Although there are many variables for quantifying hydrometeorological droughts, we showed that soil moisture could represent the GDIS drought events in time and space. In the comparison of the soil layers, deep layers (i.e. the third layer, 28–100 cm, and root zone layer, 0–100 cm) were affected for a longer period, which made SDI tend to be higher than that of the first (0–7 cm) and second (7–28 cm) layers during drought. In drought clustering, the drought-prone areas were most distinguishable from their surroundings in the third-layer case. Sawada and Koike (2016) used land reanalysis products to confirm that drought propagates from surface to root zone (5–100 cm) soil moisture and then to vegetation and showed that root zone soil moisture and vegetation were good indices to represent the prolonged drought impact in the case of the Horn of Africa drought (2010–2011). In this study, we confirmed that many of the serious drought events such as those listed in GDIS were the events that were associated with the soil moisture deficit not only at the surface layer but also down to the root. Many drought studies have used root zone soil moisture, and our study has reinforced its validity. Hao and Singh (2015) suggested that a single drought index is insufficient to capture different impact types of droughts (water shortage, famine, wildfire, etc.). Several studies have tried to develop a new combined drought index based on several hydrometeorological variables (e.g. precipitation and soil moisture) to express socioeconomic drought impact by using random forest models (e.g. Bachmair et al., 2016; Hobeichi et al., 2022). We used the percentile soil moisture, the deviation from the normal condition, to quantify drought following many previous studies (e.g. Sheffield and Wood, 2011; Hanel et al., 2018). However, the inconsistency for Indonesia between hydrometeorological drought-prone areas and drought-prone areas found in GDIS implies that the drought in extremely wet regions might not be well represented. It means that our drought quantification method based on relative values of soil moisture cannot accurately consider the amount of regularly available water resources. An alternative way to quantify drought is to use an absolute soil moisture value, but it is not straightforward to quantify drought events by absolute soil moisture values. The thresholds of drought impact occurrences in absolute values are different in different regions because ecosystems/societies have adapted to the water availability in their region. This means that a unified drought analysis across multiple regions is difficult to develop based on absolute values of soil moisture. The other limitation is the biases of absolute values of soil moisture in reanalysis products. Many climate studies have used relative values rather than absolute values because biases in climate models are less important in relative values (Liu and Key, 2016). Further studies are needed for the variable selection and drought indices according to the type of drought, which will lead to more accurate representation of socioeconomic drought impact by hydrometeorological variables.
The relationship between hazards and impact is much more complex than addressed in this study. Many studies have revealed the nonlinear relationships between the drought severity and the reduction in vegetation growth (e.g. Chen et al. 2020; Meyer et al., 2014), where damage increases suddenly when the drought severity exceeds a certain critical threshold. On the other hand, de Brito et al. (2020) reported that there was a linear relationship between the drought severity and the number of drought articles as a proxy of socioeconomic drought impacts. In addition, drought is a long-lasting disaster, and there is a time lag between hazards and impact, so that the period of hydrometeorological drought is not necessarily consistent with the period considered as a disaster in EM-DAT. Some studies have revealed that the impacts of drought last even after the hydrometeorological drought ends (e.g. Shahbazbegian and Bagheri, 2010). Yokomatsu et al. (2020) analysed the impact of the drought in terms of the economic development after the drought. In any case, further analyses are needed to focus on the chronological correspondence to drought hazards.
The limitation of the quantification of the proxy of vulnerability in this study is that we only captured the static conditions over time. We do not reveal which factors (e.g. infrastructure, economic, social, or cultural assets) contribute to the vulnerability. Vulnerability to disasters is complex and dynamic. For example, people's water demand could dynamically change after experiencing drought events (Gonzales and Ajami, 2017). Improved irrigation scheduling (Cao et al., 2019) and dam operation (Wu et al., 2018) based on forecasts could reduce the drought damage. Exposure is another important factor that influences the link between hazards and impact (Visser et al., 2014). The inconsistency between hydrometeorological drought-prone areas in ERA5-Land and drought-prone areas found in GDIS in Namibia implies that the quantification of exposure is necessary to strengthen the analysis in our study. It is necessary to identify what has been damaged (people, crops, forests, etc.) to quantify exposure. However, EM-DAT provides no information about impact types (water shortage, famine, wildfire, etc.) in many drought events, which inhibits the identification of what has been damaged. Like vulnerability, exposure is complex and dynamic. For example, the level of exposure is affected by changes in crop growing with the seasons (Bodner et al., 2015). To improve our analysis on vulnerability shown in Sect. 4.2, detailed analyses on the complex and dynamic nature of both vulnerability and exposure are necessary.
The major limitation of this study is the incompleteness of the drought impact data. Although GDIS enables subnational drought analysis, GDIS only covers about 60 % of droughts in EM-DAT due to vague or unknown location names in EM-DAT (Rosvold and Buhaug, 2021a). Note that even EM-DAT does not cover all disasters. Moreover, EM-DAT and GDIS have insufficient quantitative impact information. EM-DAT provides no information about the amount of damage in multiple drought events. There is a lot of uncertainty in the amount of damage because it is difficult to quantify indirect damages of drought (e.g. Yokomatsu et al., 2020). Although we excluded GDIS drought events shorter than 2 months from our analysis, some of the analysed events might be shorter than 2 months. This is because we applied January as the start and December as the end of the event if the start and/or end months of events shown in EM-DAT were unclear. Although GDIS is a pioneering work to achieve the detailed analysis of the relationship between hydrometeorological drought hazards and socioeconomic impact of drought in a global scale, which we performed in this paper, there is much room for the improvement of the global disaster database, such as including detailed and quantifiable damage information by following the approaches of EDII and US DIR.
We evaluated how the subnational socioeconomic drought impact information shown in GDIS could be reproduced by the natural hydrological drought indices generated by the reanalysis product, ERA5-Land. We confirmed that the reanalysis product represented the socioeconomic drought impacts in GDIS at a statistically significant level. Our comparison between GDIS and ERA5-Land could benefit the quantification of vulnerability to drought, and we showed that sub-Saharan Africa and South Asia were vulnerable to drought, while North America and Europe were less vulnerable to drought. We analysed the global spatial distribution of drought frequency, and we found that socioeconomic drought-prone areas in GDIS were generally consistent with hydrometeorological drought-prone areas expressed by ERA5-Land-based soil moisture deficit (the Horn of Africa, northern China, and western India). The use of subnational disaster information, such as GDIS, makes it possible to identify socioeconomic drought-prone areas on a finer scale and can contribute to the validation of reanalysis products.
The drought clustering Python code can be downloaded at https://github.com/julherest/drought_clusters (Herrera-Estrada, 2020). The ERA5-Land dataset can be downloaded at https://doi.org/10.24381/cds.68d2bb30 (Muñoz Sabater, 2019, 2021). The GDIS dataset can be downloaded at https://doi.org/10.7927/zz3b-8y61 (Rosvold and Buhaug, 2021b). The EM-DAT database can be viewed at https://www.emdat.be/ (Guha-Sapir et al., 2022). The World Bank's geographical regions can be viewed at https://datatopics.worldbank.org/world-development-indicators/the-world-by-income-and-region.html (World Bank, 2022). The MODIS land cover data can be downloaded at https://doi.org/10.5067/MODIS/MCD12C1.006 (Friedl and Sulla-Menashe, 2015). The gridded population of the world can be downloaded at https://doi.org/10.7927/H49C6VHW (CIESIN, 2018). The global map of FAO's annual average precipitation can be viewed at the World Bank website https://data.worldbank.org/indicator/ag.lnd.prcp.mm?msclkid=215b9959b08711ec944832810373c8aa&view=map (FAO, 2022).
The supplement related to this article is available online at: https://doi.org/10.5194/hess-26-4707-2022-supplement.
YS and YK designed the experiments and YK carried them out. YK prepared the paper with contributions from YS. YS acquired the funding.
The contact author has declared that neither of the authors has any competing interests.
Publisher's note: Copernicus Publications remains neutral with regard to jurisdictional claims in published maps and institutional affiliations.
We thank Jakob Zscheischler and Mariana Madruga de Brito, for their constructive comments. This work has been supported by JAXA (grant nos. ER2GWF102 and ER3AMF106), JSPS KAKENHI (grant no. 21H01430), and the Katsu Kimura Research Award.
This research has been supported by the Japan Aerospace Exploration Agency (grant nos. ER2GWF102 and ER3AMF106), the Japan Society for the Promotion of Science (grant no. 21H01430) and the Katsu Kimura Research Award.
This paper was edited by Rohini Kumar and reviewed by Mariana Madruga de Brito and Jakob Zscheischler.
Almendra-Martín, L., Martínez-Fernández, J., González-Zamora, A., Benito-Verdugo, P., and Herrero-Jiménez, C. M.: Agricultural Drought Trends on the Iberian Peninsula: An Analysis Using Modeled and Reanalysis Soil Moisture Products, Atmosphere, 12, 236, https://doi.org/10.3390/atmos12020236, 2021.
Andreadis, K. M., Clark, E. A., Wood, A. W., Hamlet, A. F., and Lettenmaier, D. P.: Twentieth-century drought in the conterminous United States, J. Hydrometeorol., 6, 985–1001, https://doi.org/10.1175/JHM450.1, 2005.
Bachmair, S., Svensson, C., Hannaford, J., Barker, L. J., and Stahl, K.: A quantitative analysis to objectively appraise drought indicators and model drought impacts, Hydrol. Earth Syst. Sci., 20, 2589–2609, https://doi.org/10.5194/hess-20-2589-2016, 2016.
Bayissa, Y., Maskey, S., Tadesse, T., van Andel, S. J., Moges, S., van Griensven, A., and Solomatine, D.: Comparison of the Performance of Six Drought Indices in Characterizing Historical Drought for the Upper Blue Nile Basin, Ethiopia, Geosciences, 8, 81, https://doi.org/10.3390/geosciences8030081, 2018.
Birkmann, J., Feldmeyer, D., McMillan, J. M., Solecki, W., Totin, E., Roberts, D., Trisos, C., Jamshed, A., Boyd, E., and Wrathall, D.: Regional clusters of vulnerability show the need for transboundary cooperation, Environ. Res. Lett., 16, 094052, https://doi.org/10.1088/1748-9326/ac1f43, 2021.
Birkmann, J., Jamshed, A., McMillan, J. M., Feldmeyer, D., Totin, E., Solecki, W., Ibrahim, Z. Z., Roberts, D., Kerr, R. B., Poertner, H. O., Pelling, M., Djalante, R., Garschagen, M., Filho, W. L., Guha-Sapir, D., and Alegria, A.: Understanding human vulnerability to climate change: A global perspective on index validation for adaptation planning, Sci. Total Environ., 803, 150065, https://doi.org/10.1016/j.scitotenv.2021.150065, 2022.
Bodner, G., Nakhforoosh, A., and Kaul, H. P.: Management of crop water under drought: a review, Agron. Sustain. Dev., 35, 401–442, https://doi.org/10.1007/s13593-015-0283-4, 2015.
Cao, J. J., Tan, J. W., Cui, Y. L., and Luo, Y. F.: Irrigation scheduling of paddy rice using short-term weather forecast data, Agr. Water Manage., 213, 714–723, https://doi.org/10.1016/j.agwat.2018.10.046, 2019.
Carrão, H., Naumann, G., and Barbosa, P.: Mapping global patterns of drought risk: An empirical framework based on sub-national estimates of hazard, exposure and vulnerability, Global Environ. Chang., 39, 108–124, https://doi.org/10.1016/j.gloenvcha.2016.04.012, 2016.
Chen, C., Noble, I., Hellmann, J., Coffee, J., Murillo, M., and Chawla, N.: University of Notre Dame Global Adaptation Index Country Index Technical Report, University of Notre Dame, South Bend, USA, 2015.
Chen, Z. F., Wang, W. G., Yu, Z. B., Xia, J., and Schwartz, F. W.: The collapse points of increasing trend of vegetation rain-use efficiency under droughts, Environ. Res. Lett., 15, https://doi.org/10.1088/1748-9326/abb332, 2020.
Christian, J., I., Basara, J. B., Hunt, E. D., Otkin, J. A., Furtado, J. C., Mishra, V., Xiao, X., and Randall, R. M.: Global distribution, trends, and drivers of flash drought occurrence, Nat. Commun., 12, 6330, https://doi.org/10.1038/s41467-021-26692-z, 2021.
CIESIN – Center for International Earth Science Information Network Columbia University: Gridded Population of the World, Version 4 (GPWv4): Population Density, Revision 11, NASA Socioeconomic Data and Applications Center (SEDAC) [data set], https://doi.org/10.7927/H49C6VHW, 2018.
de Brito, M. M., Kuhlicke, C., and Marx, A.: Near-real-time drought impact assessment: a text mining approach on the 2018/19 drought in Germany, Environ. Res. Lett., 15, 1040a9, https://doi.org/10.1088/1748-9326/aba4ca, 2020.
Delbiso, T. D., Altare, C., Rodriguez-Llanes, J. M., Doocy, S., and Guha-Sapir, D.: Drought and child mortality: a meta-analysis of small-scale surveys from Ethiopia, Sci. Rep.-UK, 7, 2212, https://doi.org/10.1038/s41598-017-02271-5, 2017.
Doxsey-Whitfield, E., MacManus, K., Adamo, S. B., Pistolesi, L., Squires, J., Borkovska, O., and Baptista, S. R.: Taking advantage of the improved availability of census data: a first look at the gridded population of the world, version 4, Pap. Appl. Geogr., 1, 226–234, https://doi.org/10.1080/23754931.2015.1014272, 2015.
FAO – Food and Agriculture Organization: Average precipitation in depth, the World Bank [data set], https://data.worldbank.org/indicator/ag.lnd.prcp.mm?msclkid=215b9959b08711ec944832810373c8aa&view=map, last access: 25 September 2022.
Friedl, M. and Sulla-Menashe, D.: MCD12C1 MODIS/Terra+Aqua Land Cover Type Yearly L3 Global 0.05Deg CMG V006, NASA Earth Observing System Data and Information System (EOSDIS) [data set], https://doi.org/10.5067/MODIS/MCD12C1.006, 2015.
Fuchs, S., Keiler, M., Ortlepp, R., Schinke, R., and Papathoma-Kohle, M.: Recent advances in vulnerability assessment for the built environment exposed to torrential hazards: Challenges and the way forward, J. Hydrol., 575, 587–595, https://doi.org/10.1016/j.jhydrol.2019.05.067, 2019.
Funk, C.: We thought trouble was coming, Nature, 476, 7, https://doi.org/10.1038/476007a, 2011.
Garschagen, M., Doshi, D., Reith, J., and Hagenlocher, M.: Global patterns of disaster and climate risk-an analysis of the consistency of leading index-based assessments and their results, Climatic Change, 169, 11, https://doi.org/10.1007/s10584-021-03209-7, 2021.
Gasparrini, A., Guo, Y., Hashizume, M., Lavigne, E., Zanobetti, A., Schwartz, J., Tobias, A., Tong, S., Rocklov, J., Forsberg, B., Leone, M., De Sario, M., Bell, M. L., Guo, Y.-L. L., Wu, C., Kan, H., Yi, S.-M., Zanotti Stagliorio Coelho, M. de S., Nascimento Saldiva, P. H., Honda, Y., Kim, H., and Armstrong, B.: Mortality risk attributable to high and low ambient temperature: a multicountry observational study, Lancet, 386, 369–375, https://doi.org/10.1016/S0140-6736(14)62114-0, 2015.
Gonzales, P. and Ajami, N.: Social and Structural Patterns of Drought-Related Water Conservation and Rebound, Water Resour. Res., 53, 10619–10634, https://doi.org/10.1002/2017wr021852, 2017.
Guha-Sapir, D., Below, R., and Hoyois, P. H.: EM-DAT: International Disaster Database, Université Catholique de Louvain, Brussels, Belgium, http://www.emdat.be, last access: 31 March 2022, 2022.
Hanel, M., Rakovec, O., Markonis, Y., Maca, P., Samaniego, L., Kysely, J., and Kumar, R.: Revisiting the recent European droughts from a long-term perspective, Sci. Rep.-UK, 8, 9499, https://doi.org/10.1038/s41598-018-27464-4, 2018.
Hao, Z. C. and Singh, V. P.: Drought characterization from a multivariate perspective: A review, J. Hydrol., 527, 668–678, https://doi.org/10.1016/j.jhydrol.2015.05.031, 2015.
Herrera-Estrada, J. E.: Drought_clusters, GitHub repository [code], https://github.com/julherest/drought_clusters (last access: 25 September 2022), 2020.
Herrera-Estrada, J. E. and Diffenbaugh, N. S.: Landfalling Droughts: Global Tracking of Moisture Deficits From the Oceans Onto Land, Water Resour. Res., 56, e2019WR026877, https://doi.org/10.1029/2019wr026877, 2020.
Herrera-Estrada, J. E., Satoh, Y., and Sheffield, J.: Spatiotemporal dynamics of global drought, Geophys. Res. Lett., 44, 2254–2263, https://doi.org/10.1002/2016gl071768, 2017.
Hobeichi, S., Abramowitz, G., Evans, J. P., and Ukkola, A.: Toward a Robust, Impact-Based, Predictive Drought Metric, Water Resour. Res., 58, e2021WR031829, https://doi.org/10.1029/2021wr031829, 2022.
Jägermeyr, J. and Frieler, K.: Spatial variations in crop growing seasons pivotal to reproduce global fluctuations in maize and wheat yields, Sci. Adv., 4, eaat44517, https://doi.org/10.1126/sciadv.aat4517, 2018.
Jain, S., Mishra, S. K., Anand, A., Salunke, P., and Fasullo, J. T.: Historical and projected lowfrequency variability in the Somali Jet and Indian Summer Monsoon, Clim. Dynam., 56, 749–765, https://doi.org/10.1007/s00382-020-05492-z, 2021.
Kim, W., Iizumi, T., and Nishimori, M.: Global Patterns of Crop Production Losses Associated with Droughts from 1983 to 2009, J. Appl. Meteorol. Clim., 58, 1233–1244, https://doi.org/10.1175/jamc-d-18-0174.1, 2019.
Lavell, A., Oppenheimer, M., Diop, C., Hess, J., Lempert, R., Li, J. P., Muir-Wood, R., Myeong, S., Moser, S., Takeuchi, K., Cardona, O. D., Hallegatte, S., Lemos, M., Little, C., Lotsch, A., and Weber, E.: Climate Change: New Dimensions in Disaster Risk, Exposure, Vulnerability, and Resilience, in: Managing the Risks of Extreme Events and Disasters to Advance Climate Change Adaptation: Special Report of the Intergovernmental Panel on Climate Change, edited by: Field, C. B., Barros, V., Stocker, T. F., Dahe, Q., Dokken, D. J., Ebi, K. L., Mastrandrea, M. D., Mach, K. J., Plattner, G. K., Allen, S. K., Tignor, M., and Midgley, P. M., Cambridge University Press, Cambridge, UK/New York, 25–64, https://doi.org/10.1017/CBO9781139177245.004, 2012.
Liu, Y. and Key, J. R.: Assessment of Arctic Cloud Cover Anomalies in Atmospheric Reanalysis Products Using Satellite Data, J. Climate, 29, 6065–6083, https://doi.org/10.1175/JCLI-D-15-0861.1, 2016.
Lu, J., Jia, L., Zhou, J., Zheng, C., and Hu, G.: Adaptablity of Six Global Drought Indices Over China, in: IEEE International Geoscience and Remote Sensing Symposium (IGARSS), Yokohama, JAPAN, 28 July–2 August 2019, 9922–9925, https://doi.org/10.1109/IGARSS.2019.8899184, 2019.
Marin-Ferrer, M., Vernaccini, L., and Poljanšek, K.: Index for Risk Management – INFORM: Concept and Methodology, Version 2017, Joint Research Center of European Commission, Luxembourg, 2017.
Massey, F. J.: The Kolmogorov-Smirnov Test for Goodness of Fit, J. Am. Stat. Assoc., 46, 68–78, https://doi.org/10.2307/2280095, 1951.
McKee, T. B., Doesken, N. J., and Kleist, J.: The relationship of drought frequency and duration to time scales, Preprints, in: 8th Conference on Applied Climatology, Climatology, Anaheim, California, 17–22 January 1993, 179–184, 1993.
Meyer, E., Aspinwall, M. J., Lowry, D. B., Palacio-Mejía, J. D., Logan, T. L., Fay, P. A., and Juenger, T. E.: Integrating transcriptional, metabolomic, and physiological responses to drought stress and recovery in switchgrass (Panicum virgatum L.), BMC genomics, 15, 1–15, https://doi.org/10.1186/1471-2164-15-527, 2014.
Mishra, A. K. and Singh, V. P.: A review of drought concepts, J. Hydrol., 391, 204–216, https://doi.org/10.1016/j.jhydrol.2010.07.012, 2010.
Mocko, D. M., Kumar, S. V., Peters-Lidard, C. D., and Wang, S. G.: Assimilation of Vegetation Conditions Improves the Representation of Drought over Agricultural Areas, J. Hydrometeorol., 22, 1085–1098, https://doi.org/10.1175/JHM-D-20-0065.1, 2021.
Muñoz Sabater, J.: ERA5-Land monthly averaged data from 1981 to present, Copernicus Climate Change Service (C3S) Climate Data Store (CDS) [data set], https://doi.org/10.24381/cds.68d2bb30, 2019.
Muñoz Sabater, J.: ERA5-Land monthly averaged data from 1950 to 1980, Copernicus Climate Change Service (C3S) Climate Data Store (CDS) [data set], https://doi.org/10.24381/cds.68d2bb30, 2021.
Muñoz-Sabater, J., Dutra, E., Agustí-Panareda, A., Albergel, C., Arduini, G., Balsamo, G., Boussetta, S., Choulga, M., Harrigan, S., Hersbach, H., Martens, B., Miralles, D. G., Piles, M., Rodríguez-Fernández, N. J., Zsoter, E., Buontempo, C., and Thépaut, J.-N.: ERA5-Land: a state-of-the-art global reanalysis dataset for land applications, Earth Syst. Sci. Data, 13, 4349–4383, https://doi.org/10.5194/essd-13-4349-2021, 2021.
Noel, M., Bathke, D., Fuchs, B., Gutzmer, D., Haigh, T., Hayes, M., Podebradska, M., Shield, C., Smith, K., and Svoboda, M.: Linking Drought Impacts to Drought Severity at the State Level, B. Am. Meteorol. Soc., 101, 1312–1321, https://doi.org/10.1175/bams-d-19-0067.1, 2020.
Reichle, R. H., Draper, C. S., Liu, Q., Girotto, M., Mahanama, S. P. P., Koster, R. D., and De Lannoy, G. J. M.: Assessment of MERRA-2 Land Surface Hydrology Estimates, J. Climate, 30, 2937–2960, https://doi.org/10.1175/jcli-d-16-0720.1, 2017.
Rodell, M., Houser, P. R., Jambor, U., Gottschalck, J., Mitchell, K., Meng, C. J., Arsenault, K., Cosgrove, B., Radakovich, J., Bosilovich, M., Entin, J. K., Walker, J. P., Lohmann, D., and Toll, D.: The global land data assimilation system, B. Am. Meteorol. Soc., 85, 381–394, https://doi.org/10.1175/bams-85-3-381, 2004.
Rosvold, E. L. and Buhaug, H.: GDIS, a global dataset of geocoded disaster locations, Sci. Data, 8, 61, https://doi.org/10.1038/s41597-021-00846-6, 2021a.
Rosvold, E. L. and Buhaug, H.: Geocoded Disasters (GDIS) Dataset, NASA Socioeconomic Data and Applications Center (SEDAC) [data set], https://doi.org/10.7927/zz3b-8y61, 2021b.
Sánchez, N., González-Zamora, Á., Martínez-Fernández, J., Piles, M., and Pablos, M.: Integrated remote sensing approach to global agricultural drought monitoring, Agr. Forest Meteorol., 259, 141–153, https://doi.org/10.1016/j.agrformet.2018.04.022, 2018.
Sawada, Y.: Quantifying Drought Propagation from Soil Moisture to Vegetation Dynamics Using a Newly Developed Ecohydrological Land Reanalysis, Remote Sens.-Basel, 10, 1197, https://doi.org/10.3390/rs10081197, 2018.
Sawada, Y. and Koike, T.: Towards ecohydrological drought monitoring and prediction using a land data assimilation system: A case study on the Horn of Africa drought (2010–2011), J. Geophys. Res.-Atmos., 121, 8229–8242, https://doi.org/10.1002/2015jd024705, 2016.
Schulzweida, U.: CDO User Guide (Version 2.0.0), Zenodo [software], https://doi.org/10.5281/zenodo.5614769, 2021.
Shahbazbegian, M., and Bagheri, A.: Rethinking assessment of drought impacts: a systemic approach towards sustainability, Sustain. Sci., 5, 223–236, https://doi.org/10.1007/s11625-010-0110-4, 2010.
Sheffield, J. and Wood, E. F.: Drought: past problems and future scenarios, 1st Edition, Routledge, London, UK, https://doi.org/10.4324/9781849775250, 2011.
Shen, G. Q. and Hwang, S. N.: Spatial-Temporal snapshots of global natural disaster impacts Revealed from EM-DAT for 1900–2015, Geomat. Nat. Haz. Risk, 10, 912–934, https://doi.org/10.1080/19475705.2018.1552630, 2019.
Skamarock, W. C.: Evaluating mesoscale NWP models using kinetic energy spectra, Mon. Weather Rev., 132, 3019–3032, https://doi.org/10.1175/mwr2830.1, 2004.
Stahl, K., Kohn, I., Blauhut, V., Urquijo, J., De Stefano, L., Acácio, V., Dias, S., Stagge, J. H., Tallaksen, L. M., Kampragou, E., Van Loon, A. F., Barker, L. J., Melsen, L. A., Bifulco, C., Musolino, D., de Carli, A., Massarutto, A., Assimacopoulos, D., and Van Lanen, H. A. J.: Impacts of European drought events: insights from an international database of text-based reports, Nat. Hazards Earth Syst. Sci., 16, 801–819, https://doi.org/10.5194/nhess-16-801-2016, 2016.
Stringer, L. C., Fraser, E. D. G., Harris, D., Lyon, C., Pereira, L., Ward, C. F. M., and Simelton, E.: Adaptation and development pathways for different types of farmers, Environ. Sci. Policy, 104, 174–189, https://doi.org/10.1016/j.envsci.2019.10.007, 2020.
Svoboda, M., LeComte, D., Hayes, M., Heim, R., Gleason, K., Angel, J., Rippey, B., Tinker, R., Palecki, M., Stooksbury, D., Miskus, D., and Stephens, S.: The drought monitor, B. Am. Meteorol. Soc., 83, 1181–1190, https://doi.org/10.1175/1520-0477-83.8.1181, 2002.
Tanoue, M., Hirabayashi, Y., and Ikeuchi, H.: Global-scale river flood vulnerability in the last 50 years, Sci. Rep.-UK, 6, 36021, https://doi.org/10.1038/srep36021, 2016.
Trnka, M., Hlavinka, P., Možný, M., Semerádová, D., Štěpánek, P., Balek, J., Bartošová, L., Zahradníček, P., Bláhová, M., Skalák, P., Farda, A., Hayes, M., Svoboda, M., Wagner, W., Eitzinger, J., Fischer, M., and Žalud, Z.: Czech Drought Monitor System for monitoring and forecasting agricultural drought and drought impacts, Int. J. Climatol., 40, 5941–5958, https://doi.org/10.1002/joc.6557, 2020.
Tschumi, E. and Zscheischler, J.: Countrywide climate features during recorded climate-related disasters, Climatic Change, 158, 593–609, https://doi.org/10.1007/s10584-019-02556-w, 2020.
Udmale, P., Ichikawa, Y., Ning, S. W., Shrestha, S., and Pal, I.: A statistical approach towards defining national-scale meteorological droughts in India using crop data, Environ. Res. Lett., 15, 094090, https://doi.org/10.1088/1748-9326/abacfa, 2020.
Ummenhofer, C. C., Sen Gupta, A., Li, Y., Taschetto, A. S., and England, M. H.: Multi-decadal modulation of the El Nino-Indian monsoon relationship by Indian Ocean variability, Environ. Res. Lett., 6, 034006, https://doi.org/10.1088/1748-9326/6/3/034006, 2011.
UNDP: Reducing Disaster Risk: A Challenge for Development, United Nations Development Programme (UNDP), New York, USA, 2004.
UNEP: The Adaptation Gap Report 2018, United Nations Environment Programme (UNEP), Nairobi, Kenya, 2018.
Vicente-Serrano, S. M., Beguería, S., and López-Moreno, J. I.: A Multiscalar Drought Index Sensitive to Global Warming: The Standardized Precipitation Evapotranspiration Index, J. Climate, 23, 1696–1718, https://doi.org/10.1175/2009jcli2909.1, 2010.
Visser, H., Petersen, A. C., and Ligtvoet, W.: On the relation between weather-related disaster impacts, vulnerability and climate change, Climatic Change, 125, 461–477, https://doi.org/10.1007/s10584-014-1179-z, 2014.
Welle, T. and Birkmann, J.: The World Risk Index – An Approach to Assess Risk and Vulnerability on a Global Scale, J. Extr. Even., 02, 1550003, https://doi.org/10.1142/S2345737615500037, 2015.
Wilhite, D. A. and Glantz, M. H.: Understanding: the drought phenomenon: the role of definitions, Water Int., 10, 111–120, https://doi.org/10.1080/02508068508686328, 1985.
Wilhite, D. A., Svoboda, M. D., and Hayes, M. J.: Understanding the complex impacts of drought: A key to enhancing drought mitigation and preparedness, Water Resour. Manag., 21, 763–774, https://doi.org/10.1007/s11269-006-9076-5, 2007.
World Bank: World by Income and Region, World Bank [data set], https://datatopics.worldbank.org/world-development-indicators/the-world-by-income-and-region.html, last access: 25 September 2022.
Wu, J. F., Liu, Z. Y., Yao, H. X., Chen, X. H., Chen, X. W., Zheng, Y. H., and He, Y. H.: Impacts of reservoir operations on multi-scale correlations between hydrological drought and meteorological drought, J. Hydrol., 563, 726–736, https://doi.org/10.1016/j.jhydrol.2018.06.053, 2018.
Yokomatsu, M., Ishiwata, H., Sawada, Y., Suzuki, Y., Koike, T., Naseer, A., and Cheema, M. J. M.: A multi-sector multi-region economic growth model of drought and the value of water: A case study in Pakistan, Int. J. Disast. Risk Re., 43, 101368, https://doi.org/10.1016/j.ijdrr.2019.101368, 2020.
Zink, M., Samaniego, L., Kumar, R., Thober, S., Mai, J., Schäfer, D., and Marx, A.: The German drought monitor, Environ. Res. Lett., 11, 074002, https://doi.org/10.1088/1748-9326/11/7/074002, 2016.