the Creative Commons Attribution 4.0 License.
the Creative Commons Attribution 4.0 License.
 | 22 Sep 2022
Future snow changes and their impact on the upstream runoff in Salween
Chenhao Chai
Deliang Chen
Jing Zhou
Hu Liu
Jingtian Zhang
Yuanwei Wang
Ruishun Liu
Understanding the hydrological processes related to snow in global mountainous regions under climate change is necessary for achieving regional water and food security (e.g., the United Nation's Sustainable Development Goals 2 and 6). However, the impacts of future snow changes on the hydrological processes in the high mountains of the “Third Pole” are still largely unclear. In this study, we aimed to project future snow changes and their impacts on hydrology in the upstream region of the Salween River (USR) under two shared socioeconomic pathway (SSP) scenarios (SSP126 and SSP585) using a physically based cryosphere–hydrology model. We found that the climate would become warmer (0.2 ∘C per decade under SSP126 and 0.7 ∘C per decade under SSP585) and wetter (5 mm per decade under SPP126 and 27.8 mm per decade under SSP585) in the USR in the future under these two SSPs. In this context, the snowfall, snow cover, snow water equivalent, and snowmelt runoff are projected to exhibit significant decreasing trends during 1995–2100, and the decreases are projected to be most prominent in summer and autumn. The future (2021–2100) snowmelt runoff is projected to significantly increase in spring compared with the reference period (1995–2014), which would benefit the availability of water resources in the growing season. The annual total runoff would significantly increase in all of the future periods due to increased rainfall, which would increase the availability of water resources within the basin, but the high peak flow that occurs in summer may cause rain flooding with short duration and high intensity. Compared with the reference period (the contribution of snowmelt runoff to the total runoff was determined to be 17.5 %), the rain- and snow-dominated pattern of runoff would shift to a rain-dominated pattern after the near term (2021–2040) under SSP585, whereas it would remain largely unchanged under SSP126. Climate change would mainly change the pattern of the snowmelt runoff, but it would not change the annual hydrograph pattern (dominated by increased rainfall). These findings improve our understanding of the responses of cryosphere–hydrological processes under climate change, providing valuable information for integrated water resource management, natural disaster prevention, and ecological environmental protection at the Third Pole.
- Article
(8378 KB) - Full-text XML
-
Supplement
(1981 KB) - BibTeX
- EndNote


Snow, a key component of the cryosphere, is widely distributed in high mountainous regions around the world, which are particularly sensitive to climate change; thus, it is an important indicator of regional climate change (Nepal et al., 2021; Pulliainen et al., 2020). The snowpack can store a large amount of solid precipitation in the cold season and can melt in the warm season. Accordingly, it not only has a strong effect on the regional hydrological cycle (Huning and AghaKouchak, 2020; Musselman et al., 2021) but also provides abundant water resources for industry, agriculture, and residents in basins as well as supporting about one-sixth of the world's population (Yan et al., 2022; Barnett et al., 2005). In addition, snow cover (SC) affects the radiation balance and the thermal regime of the underlying ground due to the high albedo of snow, thereby changing the regional energy balance and, in turn, affecting regional climate (Jia et al., 2021; You et al., 2020; Henderson et al., 2018; Xiao et al., 2017). Changes in snowfall, snow storage, and snowmelt under climate change would not only change the total annual and seasonal runoff at mountain outlets but would also affect and change mountain glaciers and the availability of water resources in downstream regions (Immerzeel et al., 2020; Li et al., 2019). These factors may increase the frequency, intensity, and range of natural disasters and may further threaten the security of the water supply, flood/drought control, and ecological security in downstream areas (Qin et al., 2020; Biemans et al., 2019). Therefore, an in-depth understanding of the impact of climate change on the snow-related hydrological regime in mountainous areas is crucial to regional ecological protection, water resource management, disaster prevention, and sustainable socioeconomic development (Nepal et al., 2014; Biemans et al., 2019; Yao et al., 2019; Tang et al., 2019; Viviroli et al., 2020; Qi et al., 2020).
Over the last few decades, the Tibetan Plateau (TP) has experienced intense warming, which has exceeded the global warming rate (IPCC, 2019). In addition, precipitation has also exhibited an increasing trend in the central TP and a decreasing trend in the southern and eastern TP under climate warming (Chen et al., 2015). Moreover, several studies have predicted that the TP will continue to warm in the future, accompanied by increased precipitation, especially in the monsoon-controlled regions, with an increased frequency and intensity of extreme events (Panday et al., 2015; Sanjay et al., 2017). These influences not only change the spatiotemporal distribution and magnitude of precipitation but also alter several of the key variables (e.g., solid precipitation) that drive snow occurrence and development as well as the variables (e.g., radiation and temperature) that control snow ablation (Hock et al., 2019). Yao et al. (2019) and Bibi et al. (2018) reported that the melting of the snowpack, especially in low- and mid-elevation areas (because more of the precipitation occurs as rainfall in these regions), has accelerated in recent decades on the TP, which has increased the instability and uncertainty of the inter-annual and seasonal runoff and will cause future changes in the spatiotemporal pattern and availability of water resources in the TP river basins (Tang et al., 2019; Immerzeel et al., 2010; Kraaijenbrink et al., 2021). Previous studies have assessed several snow variables (e.g., snowfall, snow storage, SC, and snowmelt) and the hydrological processes related to snow under climate change on the TP based on in situ observations and land surface snow–hydrology models (Bian et al., 2020; Xu et al., 2017; Barnhart et al., 2016; Su et al., 2016). However, the impact of future snow changes on runoff is still unclear due to a lack of reliable data. Moreover, most of these models did not fully consider the physical processes of snow accumulation and ablation (Wang et al., 2017; Liu et al., 2018). Therefore, a comprehensive cryosphere–hydrological model and high-quality forcing datasets are urgently needed to improve our understanding of snow-related hydrological processes on the TP in order to better support the sustainable development of this region.
To better understand the effect of snow changes on runoff on the TP under climate change, the upstream region of Salween River (USR) was selected as the study area for the present work. The USR is located in the alpine region of the TP and Hengduan Mountains, which has a complex underlying surface and is very sensitive to climate change (Liu et al., 2017; Chen et al., 2020). Moreover, as a transboundary river with great influence, the reasonable utilization and coordination of water resources in the Salween Basin have received a great deal of attention from relevant countries and organizations worldwide (Yao et al., 2012). Previous studies have shown that the complex underlying surface, ecosystem, and hydrological processes of the basin have undergone intense changes in recent years, which have gradually changed the total water resources and runoff within the basin, further affecting the rationing and allocation of water resources and hydropower development (Liu et al., 2017; Fan and He, 2012; Luo et al., 2017; Hong and He, 2019). However, the working conditions in the USR are very difficult due to the complexity of the topography and the harsh environment, which has resulted in an irregular and relatively sparse distribution of national meteorological stations in the basin. In addition, due to a lack of continuous snow and hydrological observations in the basin resulting from strict national data policies, it is difficult to quantify and reveal the mechanisms of snow-related hydrological processes and verify the results of numerical simulations (Wang et al., 2021). Moreover, the precipitation and snow products used in previous studies have low accuracy and poor applicability in this basin and are often insufficient for the analysis of trends due to the short periods of the records. These factors have seriously restricted our understanding of snow-related hydrological processes and the development and utilization of water resources in this basin (Mao et al., 2019; Liu et al., 2016; Ding et al., 2015).
Previous studies have used simple statistical methods to study the variations in the historical runoff in the USR based on observation data from individual sites; the dry season and annual runoff have been found to exhibit an increasing trend as a result of the increase in precipitation and meltwater (glacier and snow), wherein the precipitation contributes the most (Zhang et al., 2007; You et al., 2008; Yao et al., 2012; Cuo et al., 2014; Luo et al., 2016; Liu et al., 2017; Zhang et al., 2019). However, these studies did not separate glacier melt and snowmelt, consider the corresponding physical processes, nor predict future changes in runoff and its components. In addition, Su et al. (2016), Lutz et al. (2014), Zhao et al. (2019), and Khanal et al. (2021) used hydrological models to predict the future runoff on the TP, and they all found that the future runoff would exhibit an increasing trend; however, there are great uncertainties in the meltwater contribution and seasonal variations in these models. This may be due to the different descriptions of the cryospheric processes used in these models and the large differences in the driving datasets used. Moreover, these studies did not consider the intermediate snow change processes, which may lead to a partial understanding of snow and hydrological processes.
The main objective of this study was to simulate the changes in the snow-related hydrological processes in the USR on the southeastern TP, China. First, based on meteorological observation data, we evaluated the performance of four reanalysis precipitation products and selected the most reliable products. Second, we constructed a distributed cryosphere–hydrological model of the USR basin, namely the Water and Energy Budget-based Distributed Hydrological Model with improved Snow and Frozen ground processes (WEB-DHM-sf) (Wang et al., 2009a, b, 2010, 2016, 2017), and evaluated its performance using observed discharge and remote sensing data (land surface temperature, LST, Moderate Resolution Imaging Spectroradiometer, MODIS, SC). Third, we used WEB-DHM-sf driven by a Coupled Model Intercomparison Project Phase 6 (CMIP6) global climate model (GCM) to predict the changes in the snowfall, snow cover, snow water equivalent (SWE), total snowmelt, snowmelt runoff, and total runoff during different periods under the following different shared socioeconomic pathway (SSP) scenarios:
-
SSP126, which is a combination of the RCP2.6 low-emission scenario and the SSP1 sustainable socioeconomic pathway, representing low vulnerability, low mitigation pressure, and low radiative forcing (2.6 W m−2);
-
SSP585, which is a combination of the RCP8.5 high-emission scenario and the SSP5 fossil fuel development pathway and is the only SSP that can achieve an anthropogenic radiative forcing of 8.5 W m−2 by 2100, representing the worst development pathway.
We also further analyzed the impact of the snow changes on runoff.
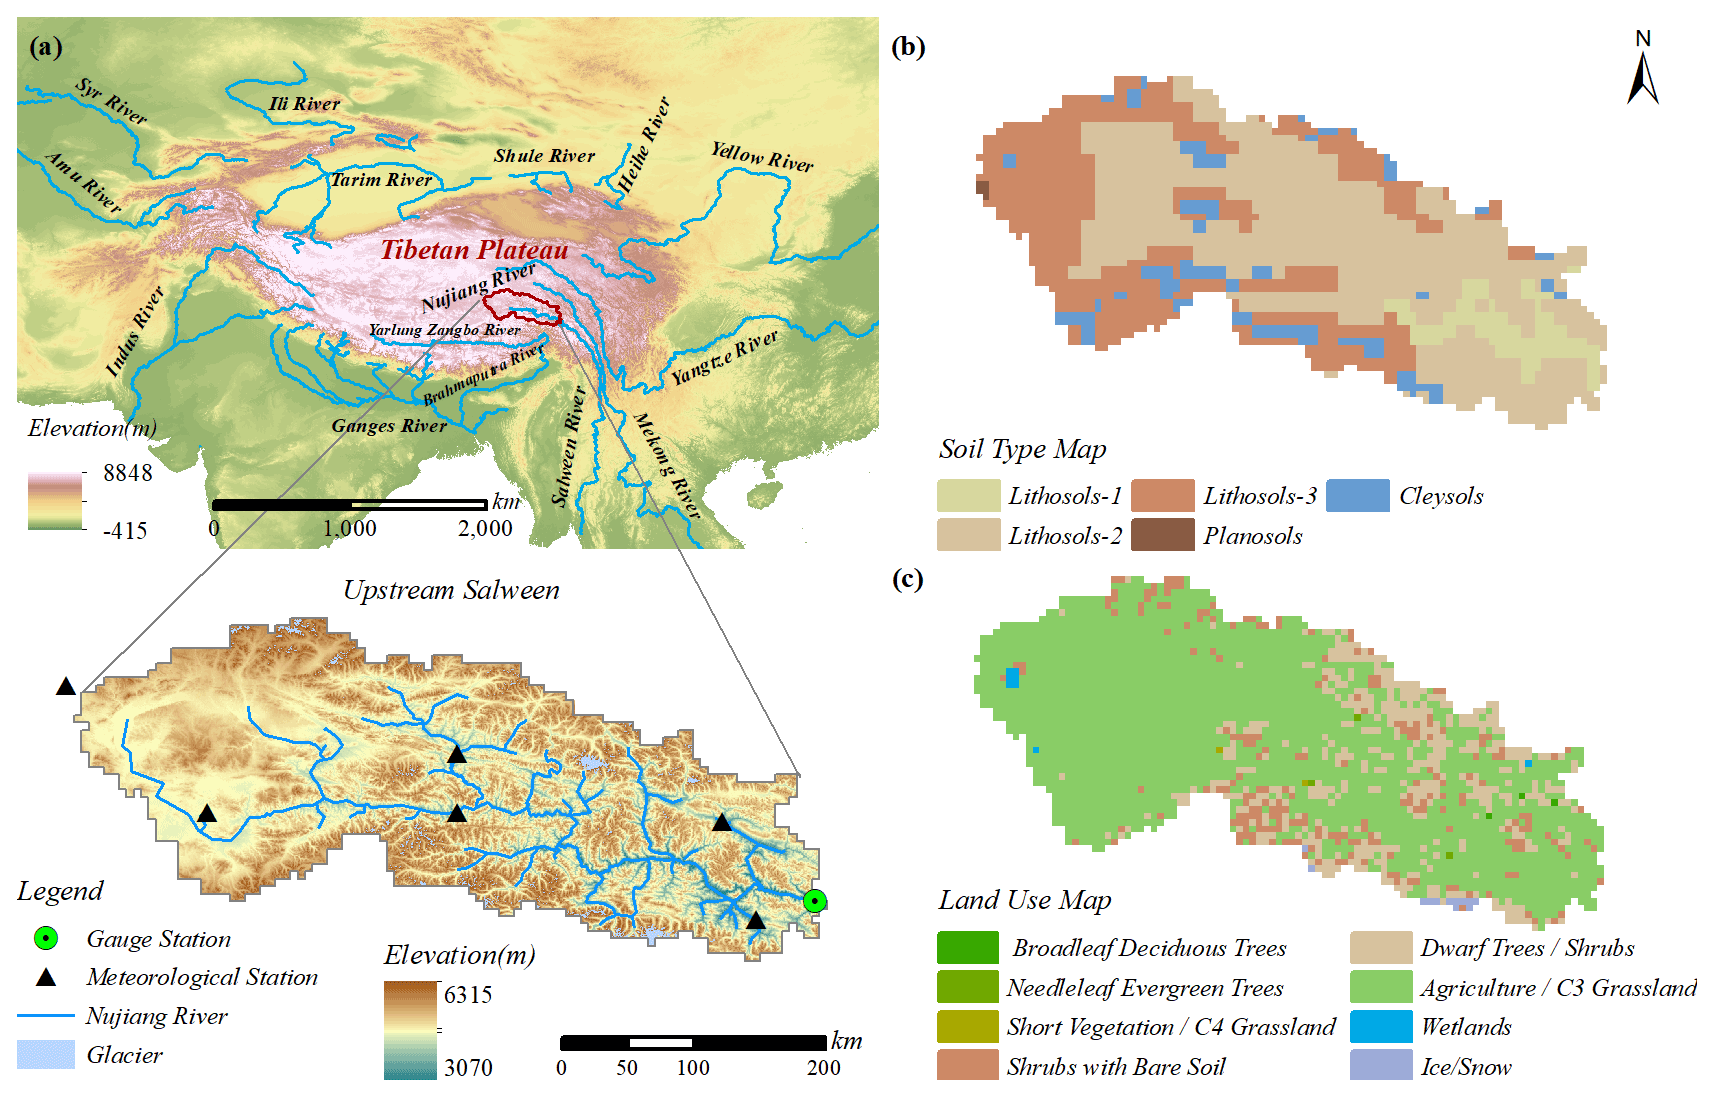
Figure 1(a) The topography and distribution of meteorological and hydrological stations, (b) soil type, and (c) land use types in the upstream region of the Salween River (USR) basin.
The Salween River, also known as the Nujiang River in China, is a free-flowing international river, and it is also an important strategic hydropower and water resource reserve area in Southeast Asia (Lu et al., 2021). It originates from the southern foot of the Tanggula Mountains on the Tibetan Plateau in China, flows across Myanmar and Thailand from north to south, and finally flows into the Andaman Sea (He, 2004). In China, its length and basin areas are 2013 km and 137 800 km2, respectively (Guo, 1985). The basin above Jiayuqiao (JYQ) station is called the USR, with an average elevation and area of 4800 m and 72 975 km2, respectively (Fig. 1a). This region is a typical alpine mountainous zone and is controlled by the westerlies and the South Asian monsoon. The precipitation in the area is mainly concentrated from May to October (wet season). The temperature and precipitation are highly dependent on elevation and exhibit significant spatial heterogeneity (Mao et al., 2019). Therefore, this region is also sensitive to climate change (Liu et al., 2017). The snow depth exhibited a significant decreasing trend in the USR during 2000–2018. The maximum monthly snow depth occurred in December–January, and the lowest monthly snow depth occurred in July–August (Yan et al., 2021). The annual mean fraction of snow cover was about 50 % during 2001–2014, and it was mainly distributed at 4000–6000 m (Li et al., 2017). The area covered by glaciers was greater than 800 km2, accounting for 1.2 % of the entire basin. The soil was mainly Lithosol soil, followed by frozen soil, and a small amount of Planosol soil (Fig. 1b). The vegetation types were mainly agriculture/C3 grassland, with some shrubs (Fig. 1c).
3.1 Distributed cryosphere–hydrological model
WEB-DHM-sf has been further improved compared with the first version of the Water and Energy Budget-based Distributed biosphere Hydrological Model (WEB-DHM; Wang et al., 2009a, b), which coupled and improved the three-layer energy balance snow module of the Simplified Simple Biosphere 3 (SSib3) model (Shrestha et al., 2010) and the empirical frozen soil parameterization scheme (Wang et al., 2010). The three-layer snow module divides the snow pack (at each model grid) into layers, with snow depths of greater than 5 cm being divided into three layers and shallower depths being regarded as single-layer snow. It considers the energy exchange between the snow layers and the influences of the incidence angle of the solar radiation and the age of the snow on the snow albedo. Therefore, this model can describe the physical processes of snow in detail, including the phase transition, compaction, albedo, temperature, and melt runoff of each layer. Thus, we can obtain the SC, snowfall, SWE, snowmelt, and other variables from the model outputs (Shrestha et al., 2014). The frozen ground processes are characterized by the frozen soil hydrothermal transfer parametrization scheme, in which the thermal conductivity scheme used is the Johansen scheme (Wang et al., 2017). In both snow parameterization schemes, enthalpy is used instead of temperature to establish the energy equation or as a new predictive variable, which reduces the uncertainty when calculating the latent heat released by the changes in the water phase and also enhances the stability of the model (Wang et al., 2017; Song et al., 2020). In this version of the model, glaciers are considered to be snow with a thickness of 100 m (the details of this model have been described by Wang et al., 2016, and Shrestha et al., 2010, 2014). Due to the continuous improvements in recent years, this model can better describe the cryospheric–hydrological processes in the alpine region, and it has been verified to have a good performance in several basins in the TP (Liu et al., 2018; Qi et al., 2019, 2022; Zhong et al., 2020; Wang et al., 2021; Zhou et al., 2022), especially in areas where observations are very scarce. In addition, the outputs of the model can be verified using multisource data, such as in situ observations and satellite remote sensing data. Therefore, this model was used in this study to analyze the impact of the snow changes on the runoff with a temporal resolution of 1 h and a spatial resolution of 5 km.
3.2 Data
3.2.1 Meteorological forcing data
The meteorological forcing data included the near-surface air temperature, total precipitation, downward shortwave and longwave radiation, wind speed, surface pressure, and specific humidity. For the historical period (1995–2014), except for the precipitation data, the data for the meteorological variables were obtained from the China Meteorological Forcing Dataset (CMFD), which has a high spatiotemporal resolution (3 h and 0.1∘) from 1979 to 2018 and has been widely used in hydrometeorological research because of its good applicability (He et al., 2020). To better evaluate the applicability of four reanalysis precipitation products – the European Centre for Medium-Range Weather Forecasts (ECMWF) fifth-generation reanalysis data product (ERA5), the Global Land Data Assimilation System (GLDAS) product, version 2 of the Modern-Era Retrospective Analysis for Research and Applications (MERRA-2) product, and the Multi-Source Weighted-Ensemble Precipitation (MSWEP) product (Beck et al., 2017) – in the USR, we mainly used several statistical indices to evaluate the products based on the meteorological observation data in this work, including correlation coefficients (CCs), mean bias (MB), and the root-mean-square error (RMSE). Moreover, the probability of detection (POD), the false alarm ratio (FAR), the missing alarm rate (MAR), and the critical success index (CSI) were calculated to check the capture capability of rainfall events from reanalysis products (Ebert et al., 2007; Tian et al., 2009). It can be seen from Figs. S1 and S2 that, except for GLDAS, the statistical indicators of other precipitation products are relatively consistent; however if the international exchange station is excluded (Naqu and Dingqing), ERA5 and MSWEP have good performance (CC is about 0.5). In addition, ERA5 has a higher POD (average of about 0.97) and a lower FAR (average of about 0.44) as a whole, which is also shown in the CSI (average of about 0.56), implying that ERA5 has better characterization of rainfall events. Therefore, we selected ERA5 based on its 1 h and 0.25∘ resolutions from 1979 to the present, its better spatiotemporal distribution, and the fact that it has been widely used in hydrological simulations of high mountainous regions (Hersbach et al., 2020; Yang et al., 2021). The projected climate forcing variables used in the hydrological model were obtained from the Inter-Sectoral Impact Model Intercomparison Project 3b (ISIMIP3b) (Lange and Büchner, 2021), of which four GCMs (GFDL-ESM4, IPSL-CM6A-LR, MPI-ESM1-2-HR, and MRI-ESM2-0) that have a consistent experimental protocol (historical, SSP126, and SSP585) and atmospheric climate variables (spatial and temporal resolutions of 0.5∘ and 1 d, respectively) were selected as the model input. The ISIMIP3BASD (v2.4.1) method was used for the bias adjustment and statistical downscaling of these variables to ensure their consistency with the long-term statistics of the observation reference dataset, i.e., W5E5 v2.0 (WFDE5 v0.1 over land merged with ERA5 over the ocean) (Lange, 2019, 2021a, b; Cucchi et al., 2020). To maintain the relative and absolute trends in these variables during the historical and future periods at the basin scale, we further corrected these variables on the monthly scale using the delta method (a simple linear bias correction method), which has been widely used and can effectively avoid a large model bias (Cuo et al., 2011; Su et al., 2016); the reader is referred to the bias correction methods in the Supplement for details. The historical and future meteorological forcing data were interpolated to the model's resolution (5 km) via bilinear interpolation. The time downscaling method used for the daily forcing data was consistent with that used by Song et al. (2020).
3.2.2 Digital elevation model, soil, land use, vegetation, and glacier data
A digital elevation model (DEM) was used to extract the basin's boundary and calculate the topographic parameters. The DEM was the National Aeronautics and Space Administration (NASA) Shuttle Radar Topography Mission (SRTM) DEM with a spatial resolution of 90 m. The soil type and land use maps with a spatial resolution of 1 km used to calculate the soil hydraulic parameters and land use types were obtained from the Food and Agriculture Organization (FAO, 2003) and the U.S. Geological Survey (USGS) (Fig. 1a, b), respectively. The fraction of photosynthetically active radiation (FPAR) and the leaf area index (LAI) used to calculate the vegetation dynamics were downloaded from the Global Land Surface Satellite (GLASS) datasets, both with respective temporal and spatial resolutions of 8 d and 0.05∘ (Xiao et al., 2014). The second glacier inventory of China was provided by the National Tibetan Plateau Data Center (Guo et al., 2015). These data were resampled to the model's resolution (5 km).
3.2.3 Observation data
The daily observed discharge data at the outlet (JYQ) of the USR basin were obtained from the National Hydrology Almanac of China and were used to calibrate and validate the hydraulic parameters of the hydrological model during 1981–1987. There are six meteorological stations within the basin. Among them, Naqu and Dingqing stations are the international exchange stations (Fig. 1a). The meteorological observation data used to evaluate the precipitation products were obtained from the China Meteorological Administration (CMA). The land surface temperature (LST) data were obtained from the MODIS and MOD11A2 products, with respective spatial and temporal resolutions of 1 km and 8 d from 2001 to 2018 (Wan et al., 2014). The SC data were obtained from an improved Terra–Aqua MODIS snow cover and Randolph Glacier Inventory 6.0 combined product (MOYDGL06∗) for high-mountain Asia with respective temporal and spatial resolutions of 8 d and 500 m from 2002 to 2018, which can be accessed from PANGAEA (Sher and Amrit, 2019).
3.3 Model evaluation criteria
The evaluation criteria used to evaluate the performance of the hydrological model outputs (e.g., discharge, LST, and snow cover) mainly included the Nash–Sutcliffe coefficient (NSE), the Kling–Gupta coefficient (KGE), the correlation coefficient (CC), mean bias (MB), root-mean-square error (RMSE), and relative bias (RB). The NSE and KGE can complement each other and make the evaluation more reasonable (Gupta et al., 2009). The equations used to calculate these evaluation criteria are as follows:
Here, Simi is the simulated value at time i; Obsi is the observed values at time i; n is the number of samples; and δsim are the mean value and standard deviation of the simulated values, respectively; and and δobs are the mean value and standard deviation of the observed values, respectively. The closer the values of NSE, KGE, and CC are to one, the better the simulation. The closer the values of MB, RMSE, and RB are to zero, the better the simulation.
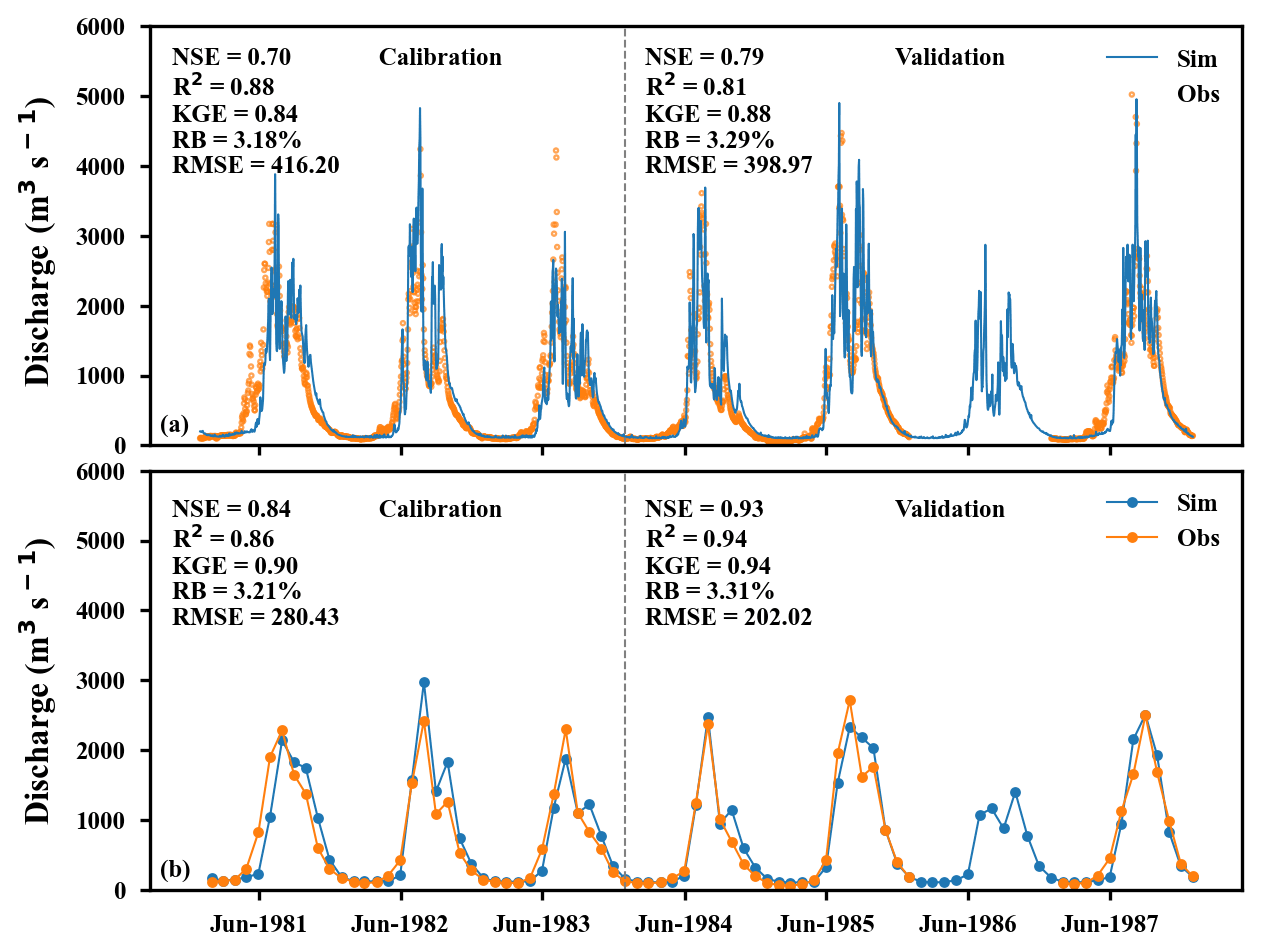
Figure 2Simulated and observed (a) daily and (b) monthly discharges at Jiayuqiao (JYQ) station from 1981 to 1987. The calibration and validation periods were 1981–1983 and 1984–1987, respectively.
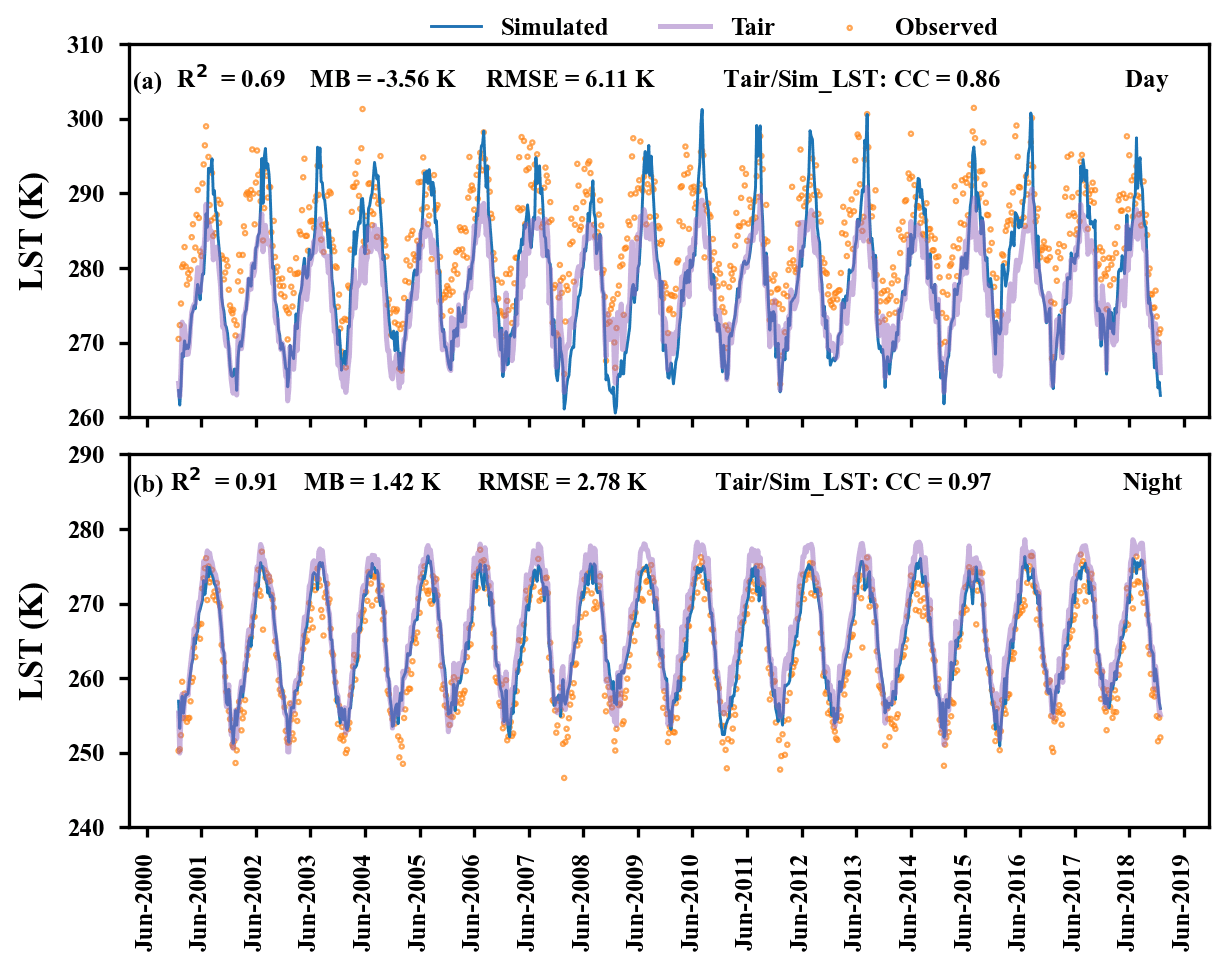
Figure 3Simulated (a) daytime and (b) nighttime 8 d land surface temperature (LST) compared to MODIS satellite observations, averaged over the USR basin during 2001–2018. Here, the input air temperature (Tair) has been compared with simulated LST (purple line).
4.1 Model calibration and validation
4.1.1 Model calibration and validation using observed discharge
First, the model parameters were calibrated using the daily observed discharge data measured at JYQ station from 1981 to 1983, which mainly included the following soil hydraulic parameters: the saturated soil moisture content (θs=0.48), the residual soil moisture content (θr=0.07), the hydraulic conductivity anisotropy ratio (anik = 2.17), the van Genuchten parameter (α=0.014, n=2.385), the saturated hydraulic conductivity for soil surface (Ksat1=141.45 mm h−1), the saturated hydraulic conductivity for unsaturated areas (Ksat2=21.22 mm h−1), and the hydraulic conductivity for an unconfined aquifer (Kg=0.7 mm h−1). Then, the daily observed discharge data for 1984–1987 (observations for 1986 were missing) were used to validate the calibrated hydrological model. The results are shown in Fig. 2. The time series of the simulated discharge matched the observations during 1981–1987 well and can capture the daily and monthly changes in the observed discharge, especially in the dry season. The values of the evaluation criteria during the calibration and validation period were determined to be as follows: 0.7 (NSE), 0.75 (R2), 0.84 (KGE), and 3.18 % (RB) for calibration, and 0.79 (NSE), 0.81 (R2), 0.88 (KGE), and 3.29 % (RB) for validation (Fig. 2a). The monthly simulated and observed discharge were in better agreement during the peak flow (Fig. 2b), accurately reproducing the inter-annual and intra-annual variations in the discharge at JYQ station, although there were overestimates and underestimates during the wet seasons in some years.
4.1.2 Model validation using LST
Due to the lack of observed discharge data from 1988 to the present, remote sensing data (MODIS LST and snow cover) were used to further validate the performance of the hydrological model at the basin scale. Figure 3 shows the comparison of the results for the basin-averaged time series between the simulated and MODIS LST values at daytime (10:30 LT, local time) and nighttime (22:30 LT) during 2001–2018. The results show that the simulated LST is in good agreement with the MODIS LST at daytime (R2=0.69) and nighttime (R2=0.91). The simulated nighttime LST has a higher R2 value and lower MB value, but the RMSE is better than that of the daytime LST, which indicates that the LST is mainly affected by the incoming solar radiation and land surface absorption during the daytime and is affected very little at night.
From the perspective of the spatial distribution patterns (Fig. 4), the simulated multiyear seasonal average LST during the daytime and nighttime were similar to those of the MODIS LST from 2001 to 2018. Similarly, the simulated nighttime LST was better than the simulated daytime LST. The basin-average value of simulated seasonal LST during the nighttime was closer to the MODIS LST (December–January–February, DJF: MB K; June–July–August, JJA: MB = −1.07 K; March–April–May, MAM: MB K; September–October–November, SON: MB K) than that at daytime, and the simulated seasonal LST during the daytime was underestimated in winter (MB K), spring (MB K), and autumn (MB K), and it was slightly overestimated in summer (MB = 0.86 K). The reason for this difference between the daytime and nighttime LST simulations may be that the complex interactions of the surface energy balance during daytime are also one of the reasons that the simulated LST at the nighttime is closer to MODIS LST than that at daytime. The LST is controlled by solar radiation absorbed by the surface canopy and the ground during daytime, and these factors lead to greater uncertainty in the simulated daytime LST, whereas the solar radiation can be ignored at nighttime, and the LST is mainly affected by the downward longwave radiation (Xue et al., 2013; Zhou et al., 2015; Zhong et al., 2021). In addition, the complex terrain and strong convective activities (clouds) in the USR basin may also affect the accuracy of satellite observations (clouds and terrain may lead to increased missing observations) and the reanalysis products (complex terrain may lead to lapse rate errors in reanalysis products and affect temperature calculations).
4.1.3 Model validation using MOYDGL06∗ SC
The fraction of simulated snow-covered area (FSCA) was also verified using the MOYDGL06∗ FSCA data at the basin scale from 2003 to 2019 at 8 d and monthly temporal scales (Fig. 5). As shown in Fig. 5a, there was a good correlation between the simulated 8 d FSCA and the MOYDGL06∗ 8 d FSCA (CC = 0.73). It can be seen from Fig. 5b that the simulated FSCA was overestimated, except for in October and November, especially in summer (by almost 100 %). Of course, this could reflect the intra-annual changes in the MOYDGL06∗ FSCA values at the basin scale. Figure 5c illustrates the good agreement between the simulated and MOYDGL06∗ FSCA at a monthly temporal scale during 2003–2018 (R2=0.56), which generally reflects the inter-annual changes in the MOYDGL06∗ FSCA in the USR basin.
As can be seen from Figs. 6 and S3, the simulated SC reproduced the spatial distribution of the seasonal evolution of the SC in the USR basin, and it also captured the snow ablation (April–August) and accumulation (September–March) processes well. Moreover, the simulated SC also reflected the rapid melting of snow after 2 June and the rapid accumulation of snow after 8 October, but there was a difference on some days – that is, the SC was overestimated in the high mountains in summer and underestimated in the low valleys in winter. If the uncertain grids in MOYDGL06∗ were considered (red grids), the difference would be smaller. The differences in some months may partly be caused by the bias in the forcing data, especially the biases in the temperature and precipitation. In addition, the resolution of MOYDGL06∗ (500 m) is not consistent with that of the hydrological model (5 km), which may also lead to differences in the calculation of the average SC for the entire basin.
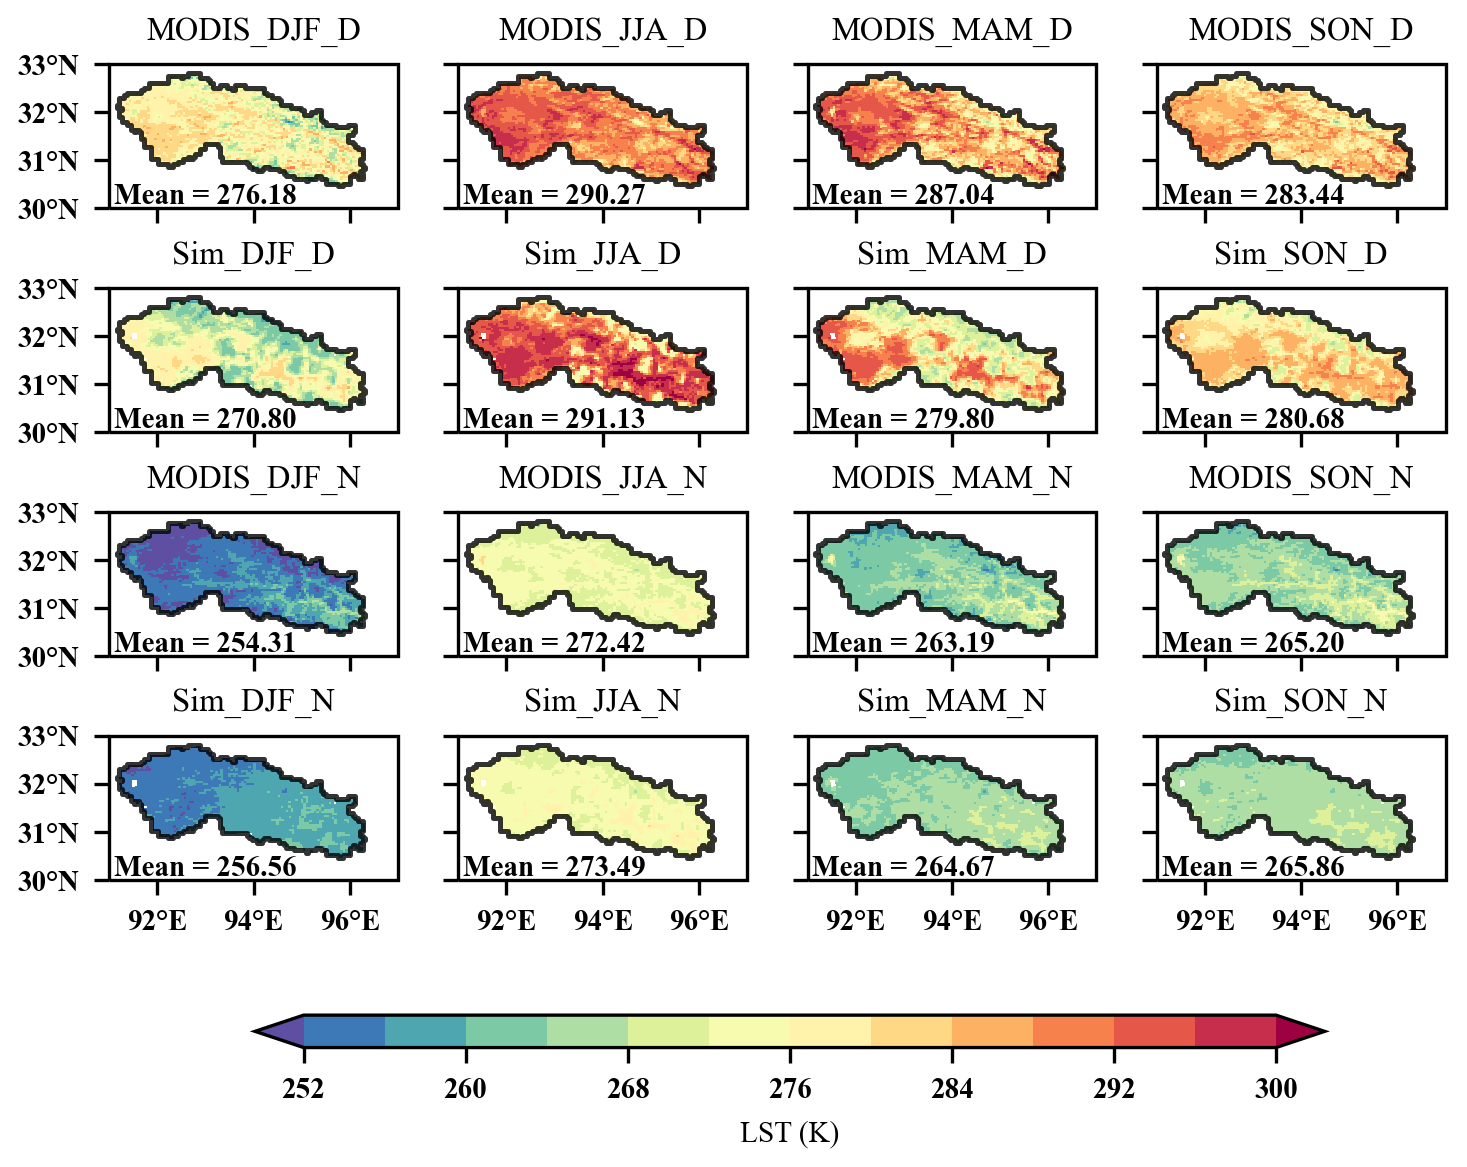
Figure 4Comparison of the spatial distributions of the land surface temperature (LST) simulation and MODIS data for the USR basin from 2001 to 2018 at daytime (first and second rows) and nighttime (third and fourth rows). From left to right, the columns show winter (DJF), summer (JJA), spring (MAM), and autumn (SON).
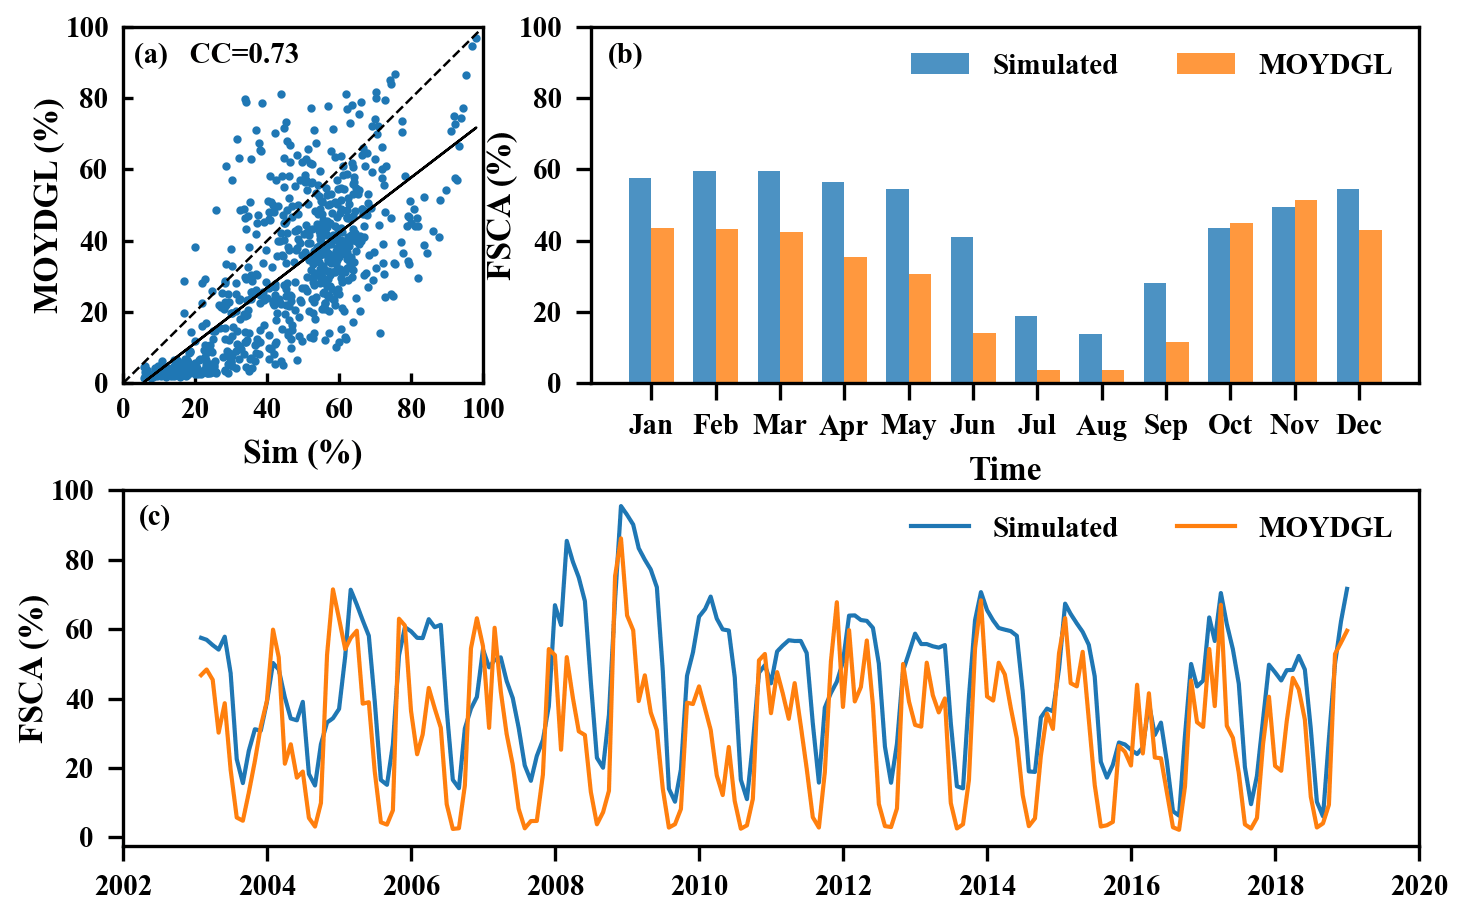
Figure 5Comparison of the simulated fraction of the snow-covered area (FSCA) and the MOYDGL06∗ time series in the USR basin for the (a) 8 d FSCA, (b) multiyear mean monthly FSCA, and (c) variations in the monthly FSCA during 2003–2018.
Overall, the verification results show that the simulation results of the hydrological model are reasonable and can be used to simulate the historical and future snow and hydrological processes in the USR basin.
4.2 Future climate change
4.2.1 Evaluation of projected precipitation and temperature
Due to the systematic bias and coarse spatial resolution of the GCM, there was great uncertainty in using it directly to drive the hydrological model at the basin scale (Zhang et al., 2016; Liu et al., 2018). Thus, it was necessary to evaluate these data before conducting the hydrometeorological analysis. Four GCM datasets with bias adjustment conducted using the delta method were used as the meteorological forcing data to drive the WEB-DHM-sf hydrological model; the results are shown in Fig. 7. Although the simulated values of the single GCM in the wet season were overestimated (GFDL-ESM4 and IPSL-CM6A-LR) or underestimated (MPI-ESM1-2-HR and MRI-ESM2-0), the daily simulated discharge of each GCM was relatively consistent with the inter-annual variations in the observations during 1981–1987 (Fig. 7a). Moreover, the daily hydrograph curve of the multi-GCM ensemble mean (MEM) reproduced the discharge at JYQ well, with reasonable NSE (0.61), KGE (0.77), R2 (0.64), and RB (−9.62 %) values. The monthly hydrograph curve of the MEM and observed data exhibit a good overall agreement (NSE = 0.78, KGE = 0.77, R2=0.79, and RB = −9.7 %) during 1981–1987 (Fig. 7b), and the intra-annual changes in the discharge at JYQ station were captured. In summary, the MEM was better than the single GCM; thus, the MEM was used in the analysis of the snow-related hydrological processes in the USR basin.
4.2.2 Projected changes in temperature and precipitation
As shown in Table S1, the temperature exhibits significant growth trends under SSP126 (0.2 ∘C per decade) and SSP585 (0.7 ∘C per decade) during 1995–2100. It also shows a consistently increasing trend during the different periods, except in the long term for SSP126 (during which time a slightly significant decrease occurs). In addition, precipitation also exhibits growth trends throughout the entire study period under SPP126 (5 mm per decade) and SSP585 (27.8 mm per decade) as well as an increasing trend in the near term, midterm, and long term, except during the reference period when it exhibited an obvious decreasing trend (−5.8 mm per decade for SSP126 and −9 mm per decade for SSP585). The climate in the USR generally undergoes a warming and wetting trend in the future under these scenarios. For the different periods, both the warming and wetting trend of the basin gradually slow down under SSP126, whereas they become much stronger under SSP585.
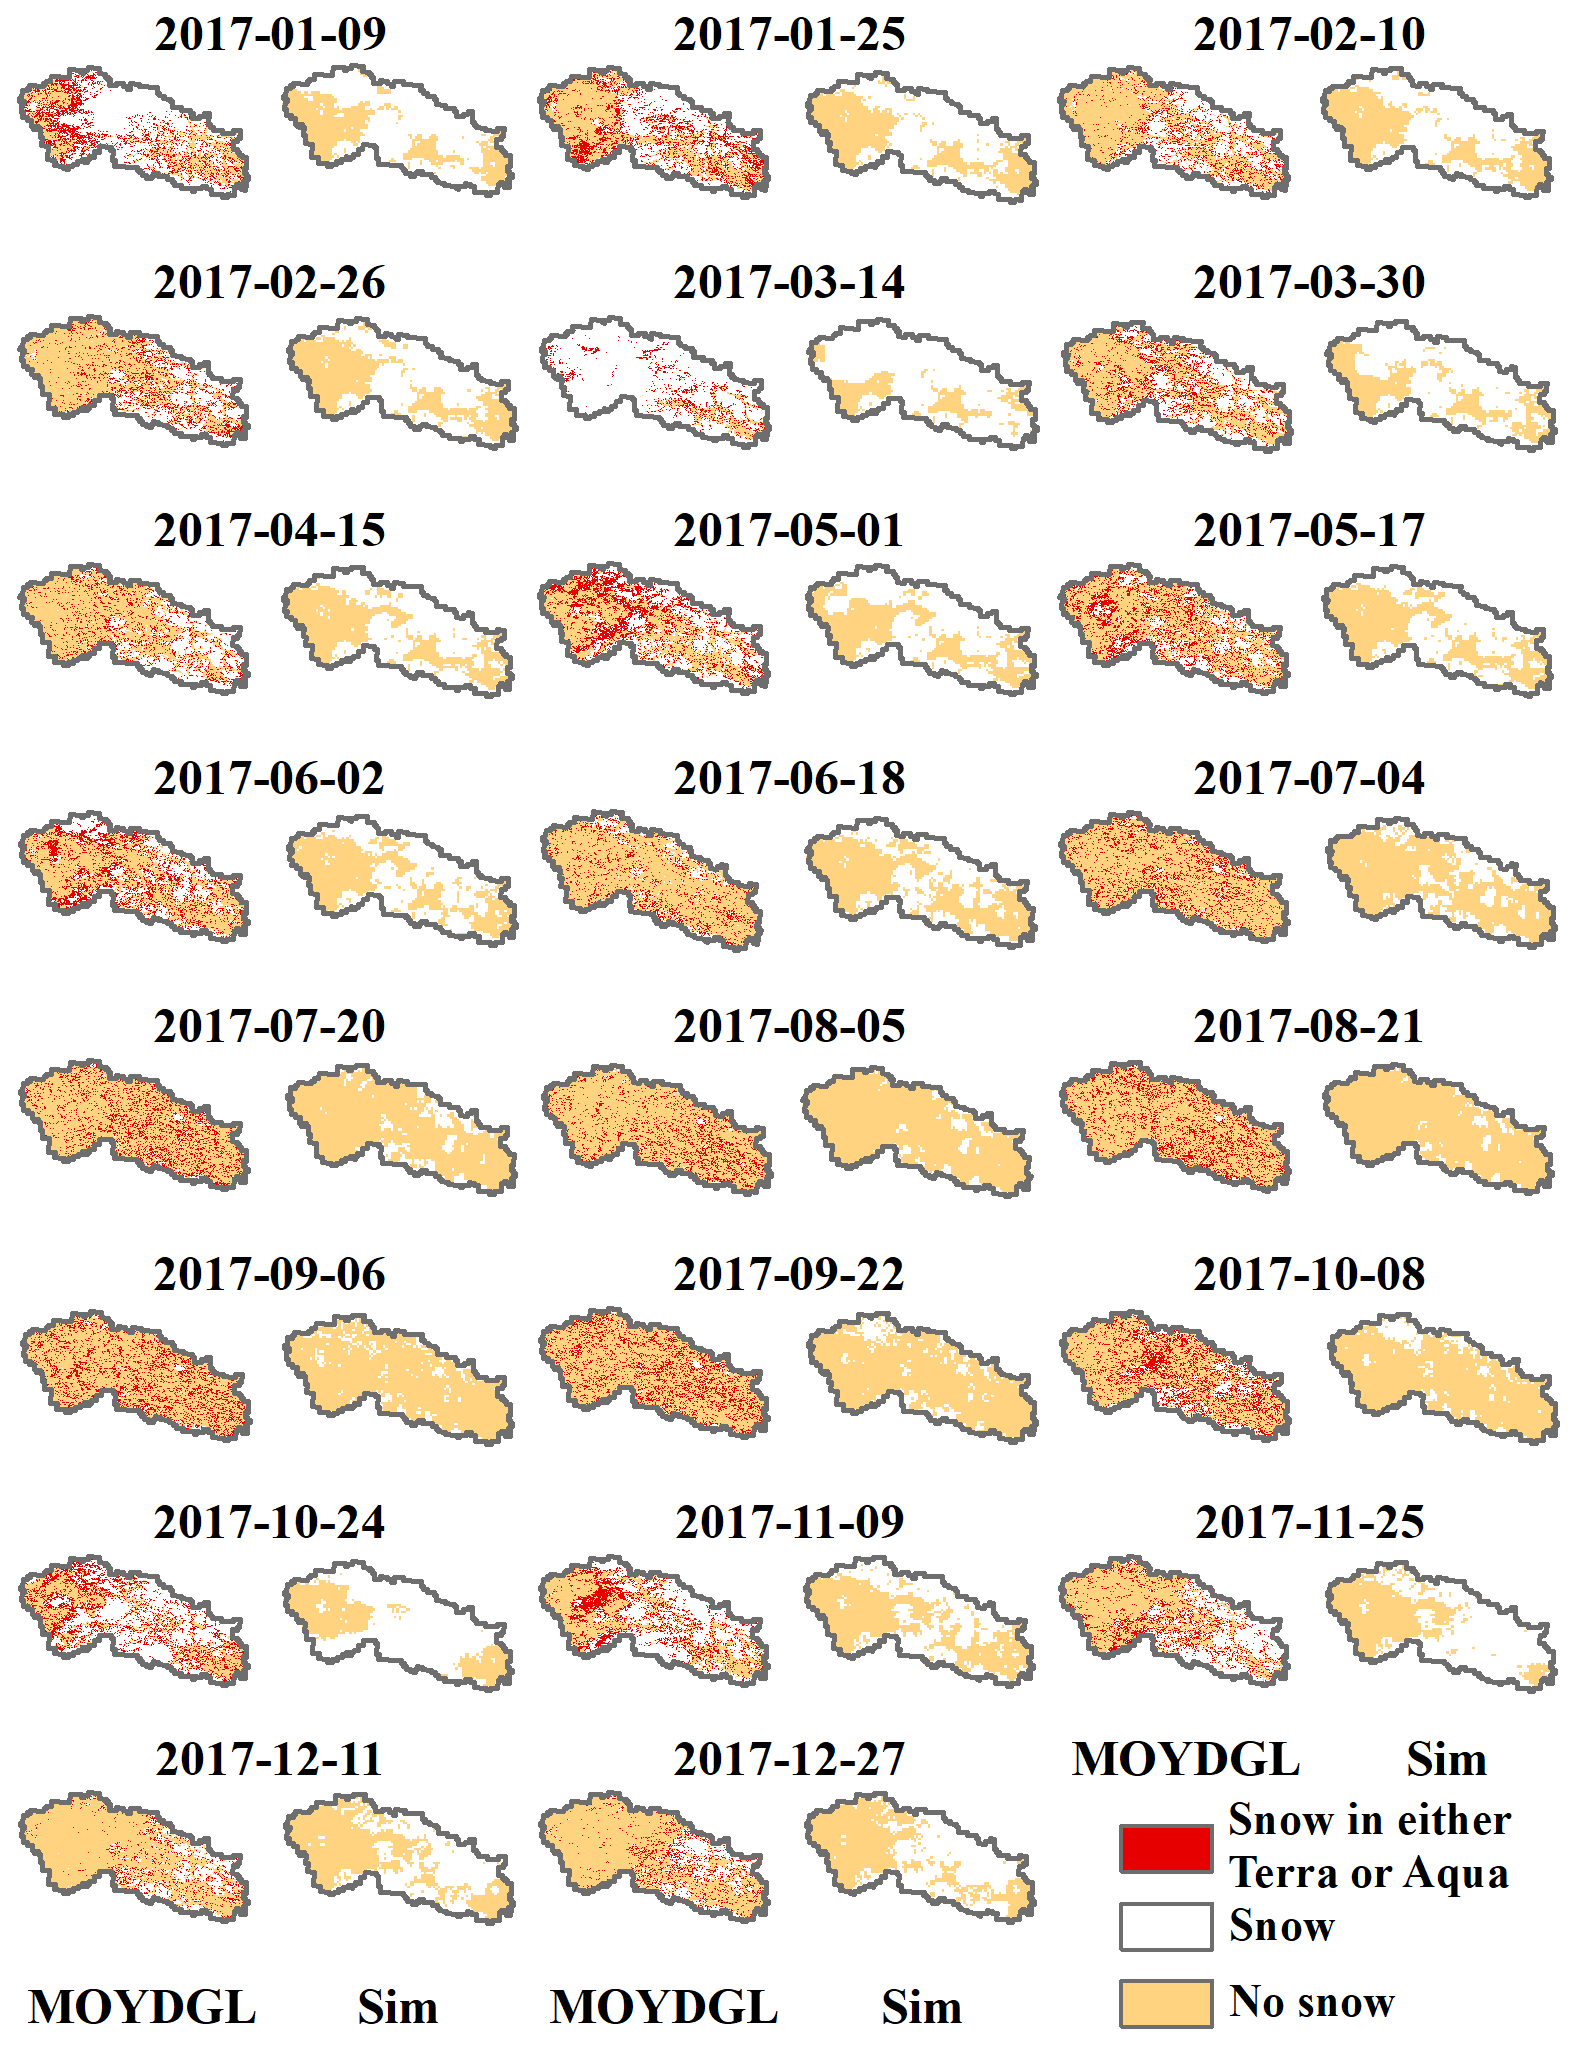
Figure 6Comparison of the MODIS 8 d snow cover product (MOYDGL06*) and the simulated 8 d snow cover in the USR basin in 2017; the time interval used is 16 d.
Figure 8 and Table S2 show the relative changes in the annual precipitation and mean annual temperature in the USR during 1995–2100, with 1995–2014 as the baseline, under SSP126 and SSP585. Compared with the reference period, the warming amplitude increases in the near, mid- and long-term periods, but the rate of increase slows down and does not exceed 2 ∘C at the end of this century under SSP126. However, warming exceeds 2 ∘C in the future in the midterm and reaches about 6 ∘C by the end of this century under SSP585 (Fig. 8a). The annual precipitation increases by 4.64 %–5.57 % under SSP126 and by 1.34 %–26.99 % under SSP585 during the different periods (Fig. 8b).
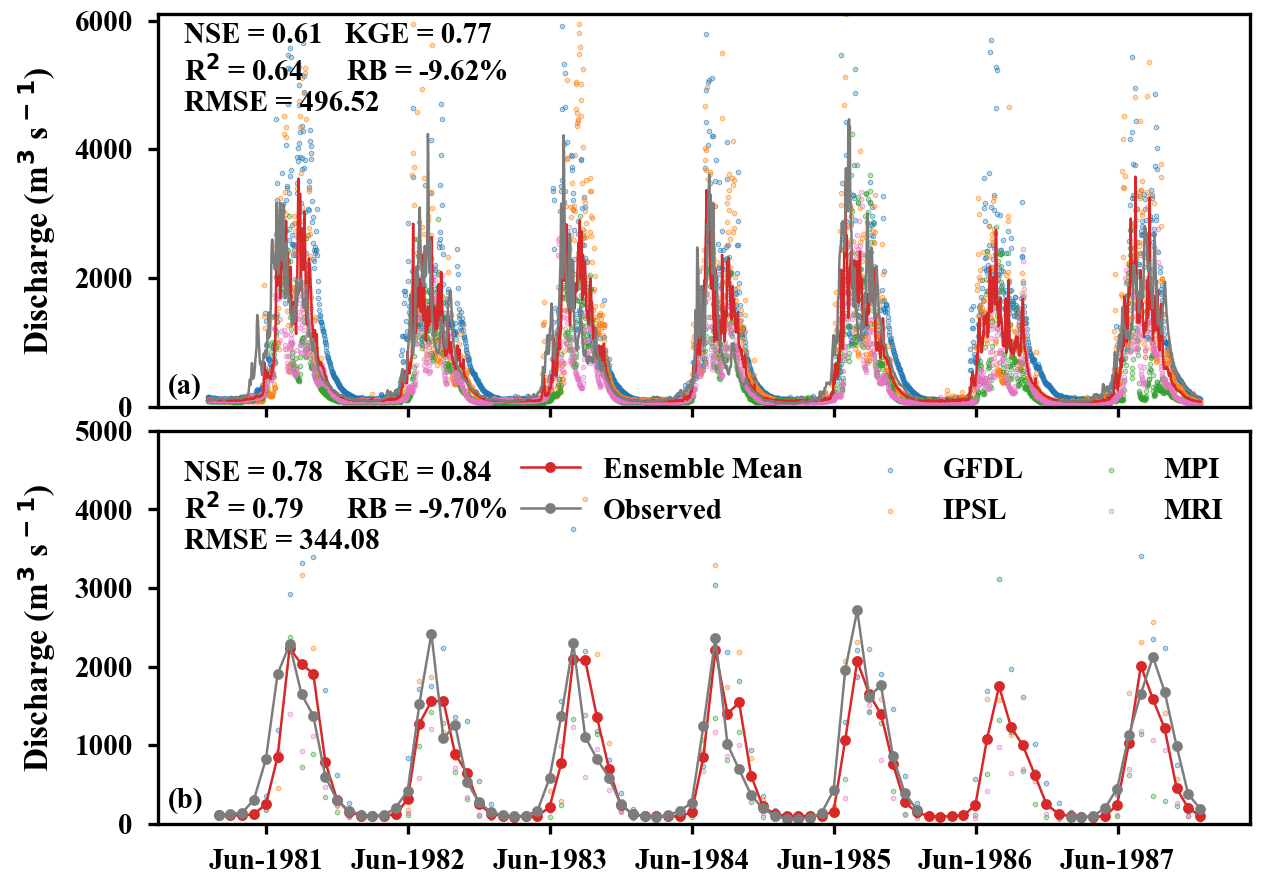
Figure 7Comparison of simulated discharge of four GCMs and the observed discharge at JYQ station during 1981–1987. The red line is the multi-GCM ensemble mean discharge, and the gray line is the observed data on (a) daily and (b) monthly timescales.
The seasonal cycles of the projected temperature and precipitation in the USR exhibit different changes under different scenarios (Fig. 9). Intense warming occurs in all of the seasons under SSP126 and SSP585. Compared with the reference period, the changes in the seasonal warming rates for each period are relatively small under SSP126, but these changes are greater under SSP585, with a distinct gradient. The warming rates during each season do not exceed 2 ∘C in the near term, and the smallest change occurs in spring under all of the scenarios; however, it exceeds 4 ∘C in the long term under SSP585 (Fig. 9a, b). As can be seen from Fig. 9c and d, the precipitation in the other periods (compared to the reference period) is projected to increase from April to September and to decrease from October to March under all of the SSPs, and its growth amplitude gradually increases from the near term to the long term. The above results indicate that the USR is a typical monsoon region that will become warmer and wetter in the monsoon season and warmer and dryer in the non-monsoon season in the future.
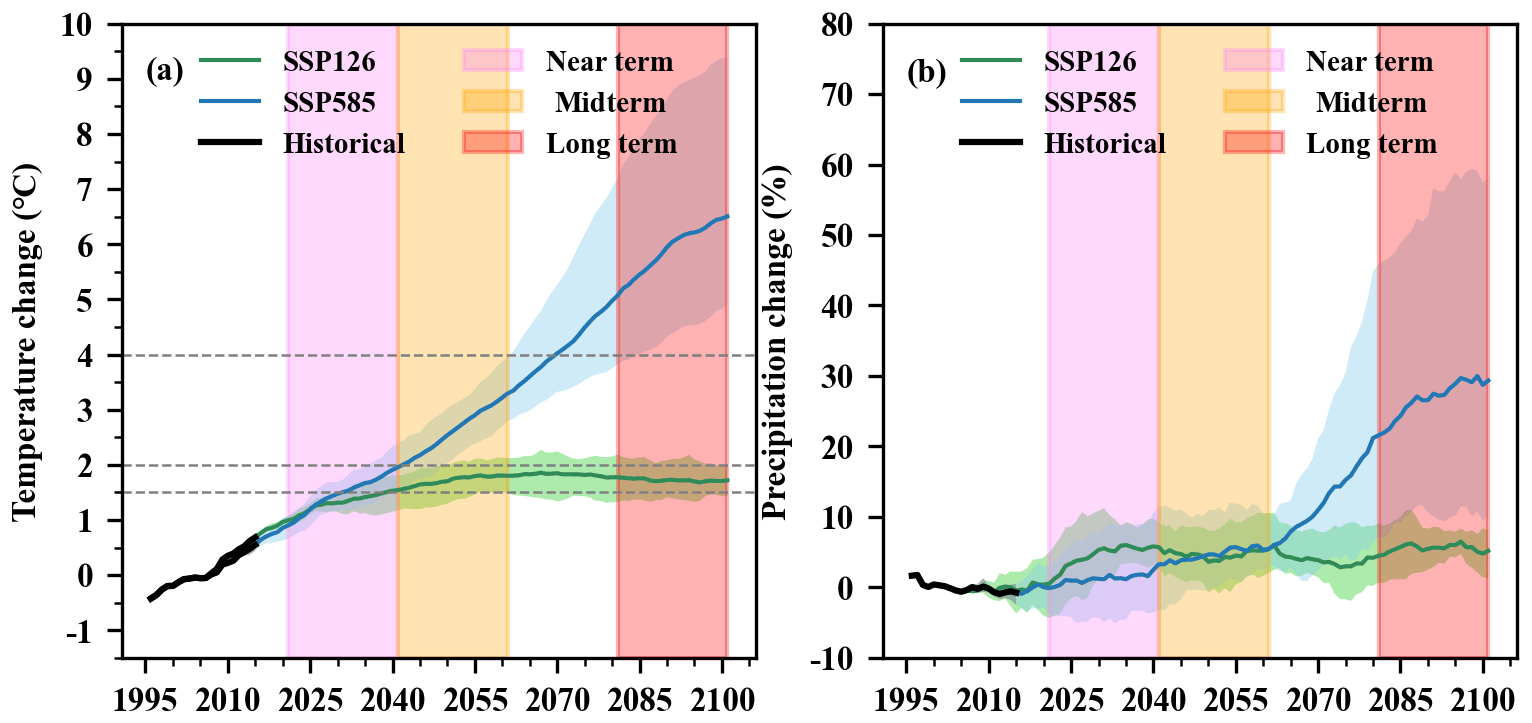
Figure 8Relative changes in the annual precipitation and mean annual temperature from 1995 to 2100. The black, blue, and green lines represent the precipitation and temperature during the reference period (1995–2014) and under the CMIP6 SSP585 (2015–2100) and SSP126 (2015–2100) scenarios, respectively. The rectangular shaded areas are the near-term (pink: 2021–2040), midterm (yellow: 2041–2060), and long-term (red: 2081–2100) periods. The shading around the lines represents the interquartile range of the data, and the upper and lower ranges are 95 % and 5 %, respectively.
4.3 Snow-related hydrological response to climate change
4.3.1 Changes in snowfall
There is a significant decreasing trend in the annual snowfall and the snow / precipitation ratio (Snow / Pre) in the USR under all of the SSPs during 1995–2100 (Fig. 10a, b). The rate of decrease in snowfall under SSP585 (−13.6 mm per decade) is much faster than that under SSP126 (−4.2 mm per decade). In the near term, snowfall is projected to decrease by more than 13 % under SSP126 and by 16 % under SSP585. By the end of the century, snowfall is reduced to about 118 mm under SSP585, which is less than half of the snowfall in the reference period, while snowfall decreases by approximately 16 % under SSP126. Similarly, Snow / Pre exhibits changes similar to those of the snowfall, and Snow / Pre is projected to decrease to approximately 10 % under SSP585 and to 20 % under SSP126 by the end of the century.
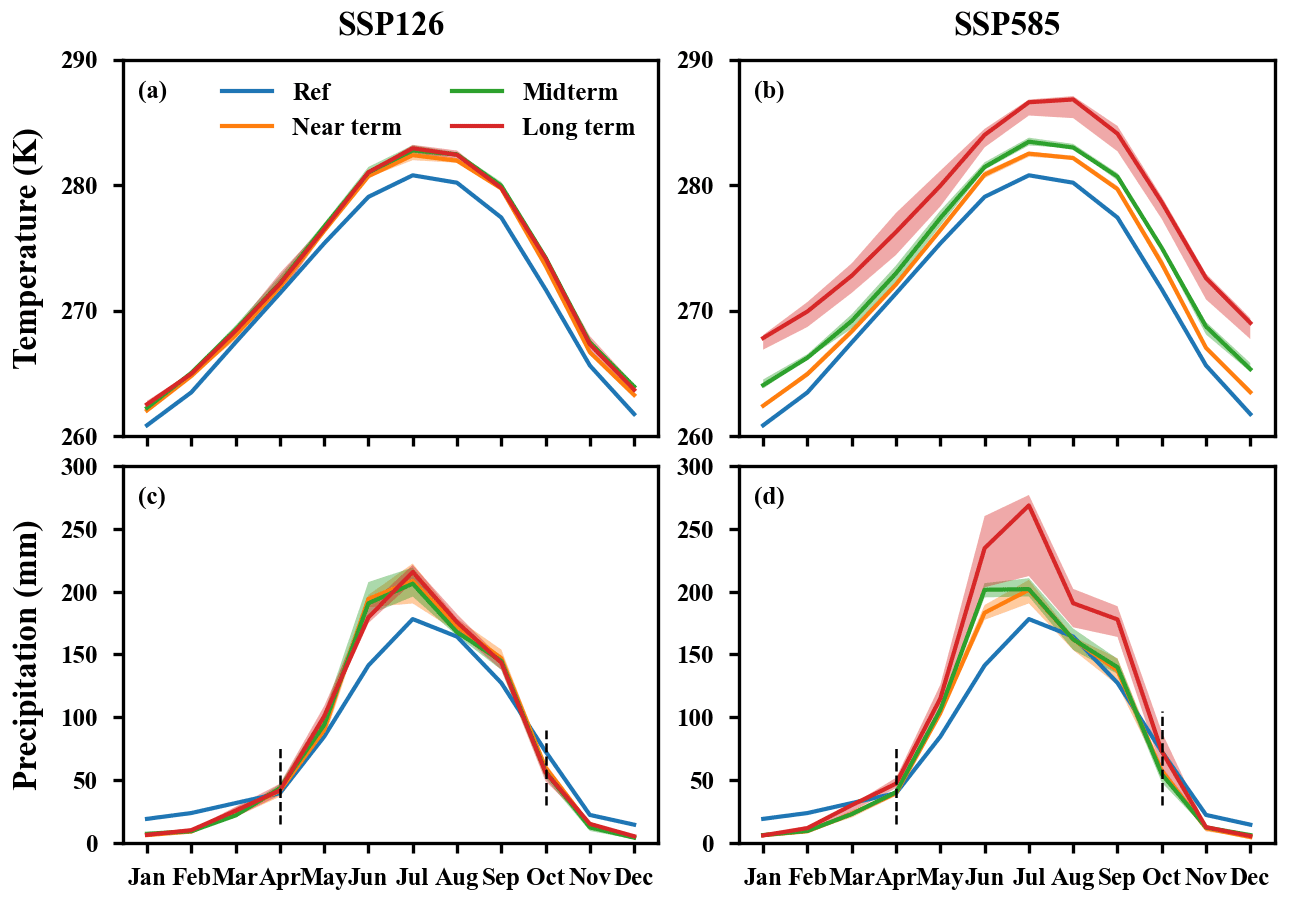
Figure 9Seasonal changes in the temperature and precipitation in the reference period, the near term, the midterm, and the long term under (a, c) SSP126 and (b, d) SSP585. The shading around the lines represents the interquartile range of the data, and the upper and lower ranges are 95 % and 5 %, respectively. The dotted lines in panels (c) and (d) show that the precipitation in April and October during future periods is higher than that in the reference period.
Figure 10c and d show the changes in the monthly snowfall and rainfall at the basin scale. The rainfall mainly occurs from May to October (monsoon season), accounting for more than 70 % of the total annual precipitation, and the changes in rainfall and the pattern of rainfall in the future are similar to those of the total precipitation. However, snowfall exhibits a distinct bimodal pattern, with the first peak appearing in May (accounting for about 21 % of the annual snowfall) and the second occurring in October (accounting for about 14 % of the annual snowfall). Snowfall is projected to decrease by less than 10 % from November to April compared with the reference period, and there will likely be no snowfall in July and August after the midterm. Moreover, the projected Snow / Pre exhibits a consistent decrease in all of the months compared with the reference period (Fig. 10e, f). Further analysis of the seasonal variations in snowfall revealed that snowfall would be the heaviest in spring, and it is projected to decrease by about 30 % (1 %) under SSP585 (SSP126) by the end of the century. The largest reduction in snowfall occurs in the summer and autumn seasons under all of the SSPs, and it is likely to decrease by approximately 85 % (44 %) and 60 % (21 %) in these respective seasons under SSP585 (SSP126) by the end of the century (Table 1). The above results indicate that precipitation in the USR is less likely to occur in the form of snow in the future under climate warming.
Table 1Changes and trends in seasonal snowfall in the USR basin during different periods under SSP126 and SSP585 compared to the reference period (1995–2014).
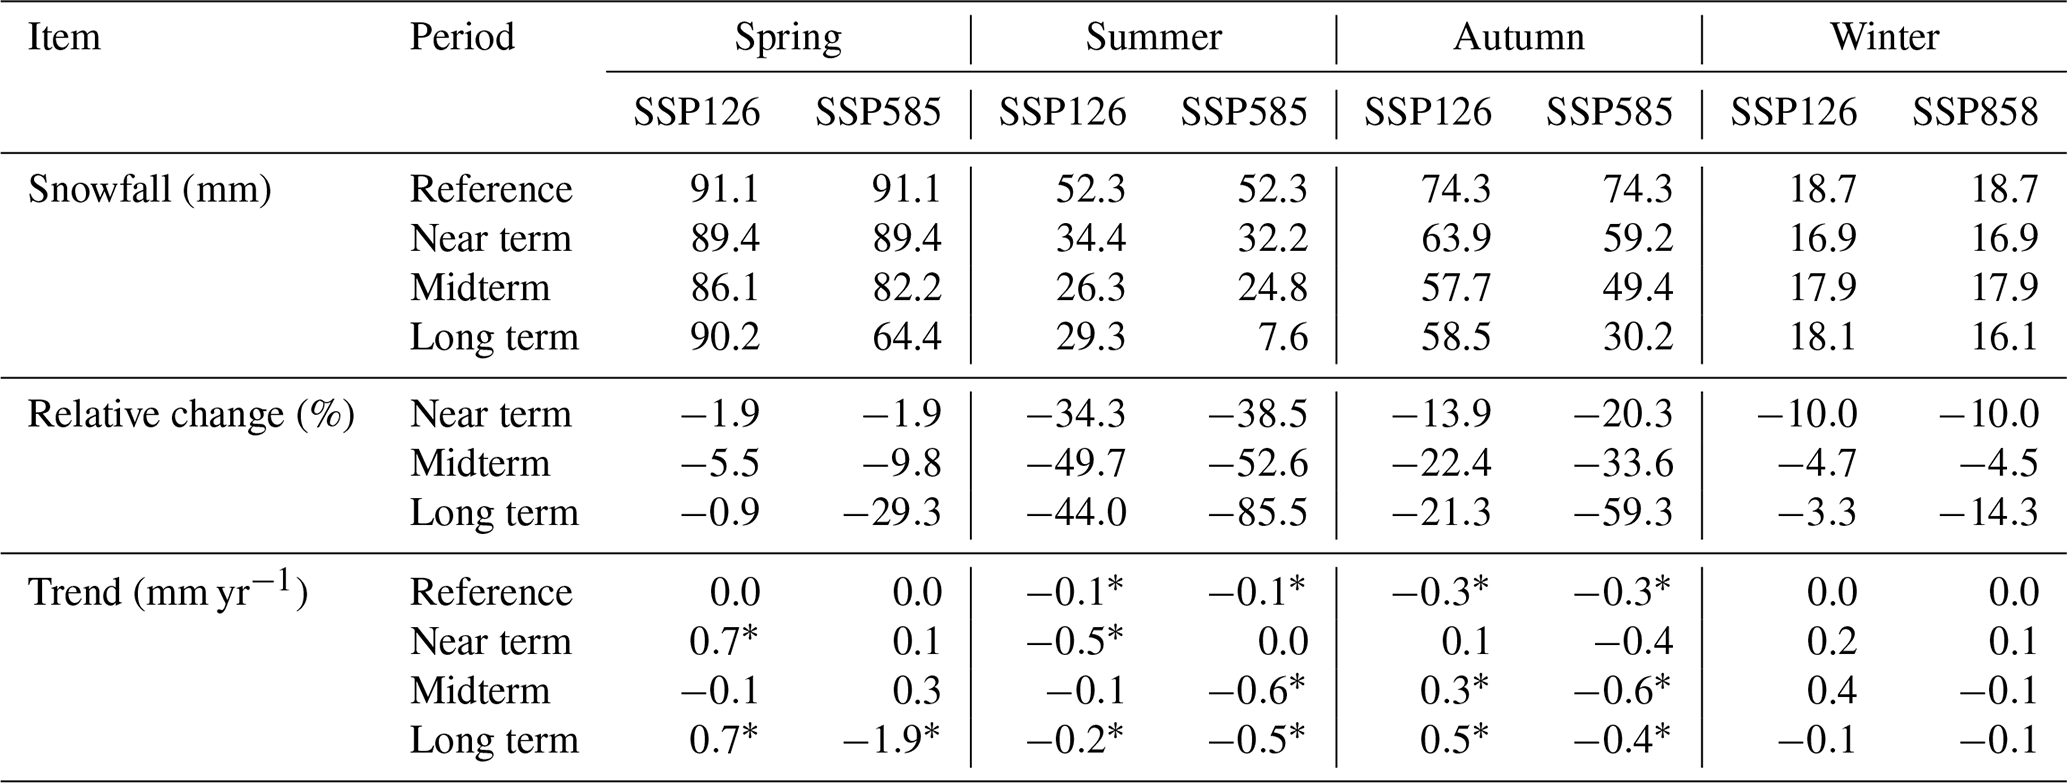
“∗” represents a p value of less than 0.05.
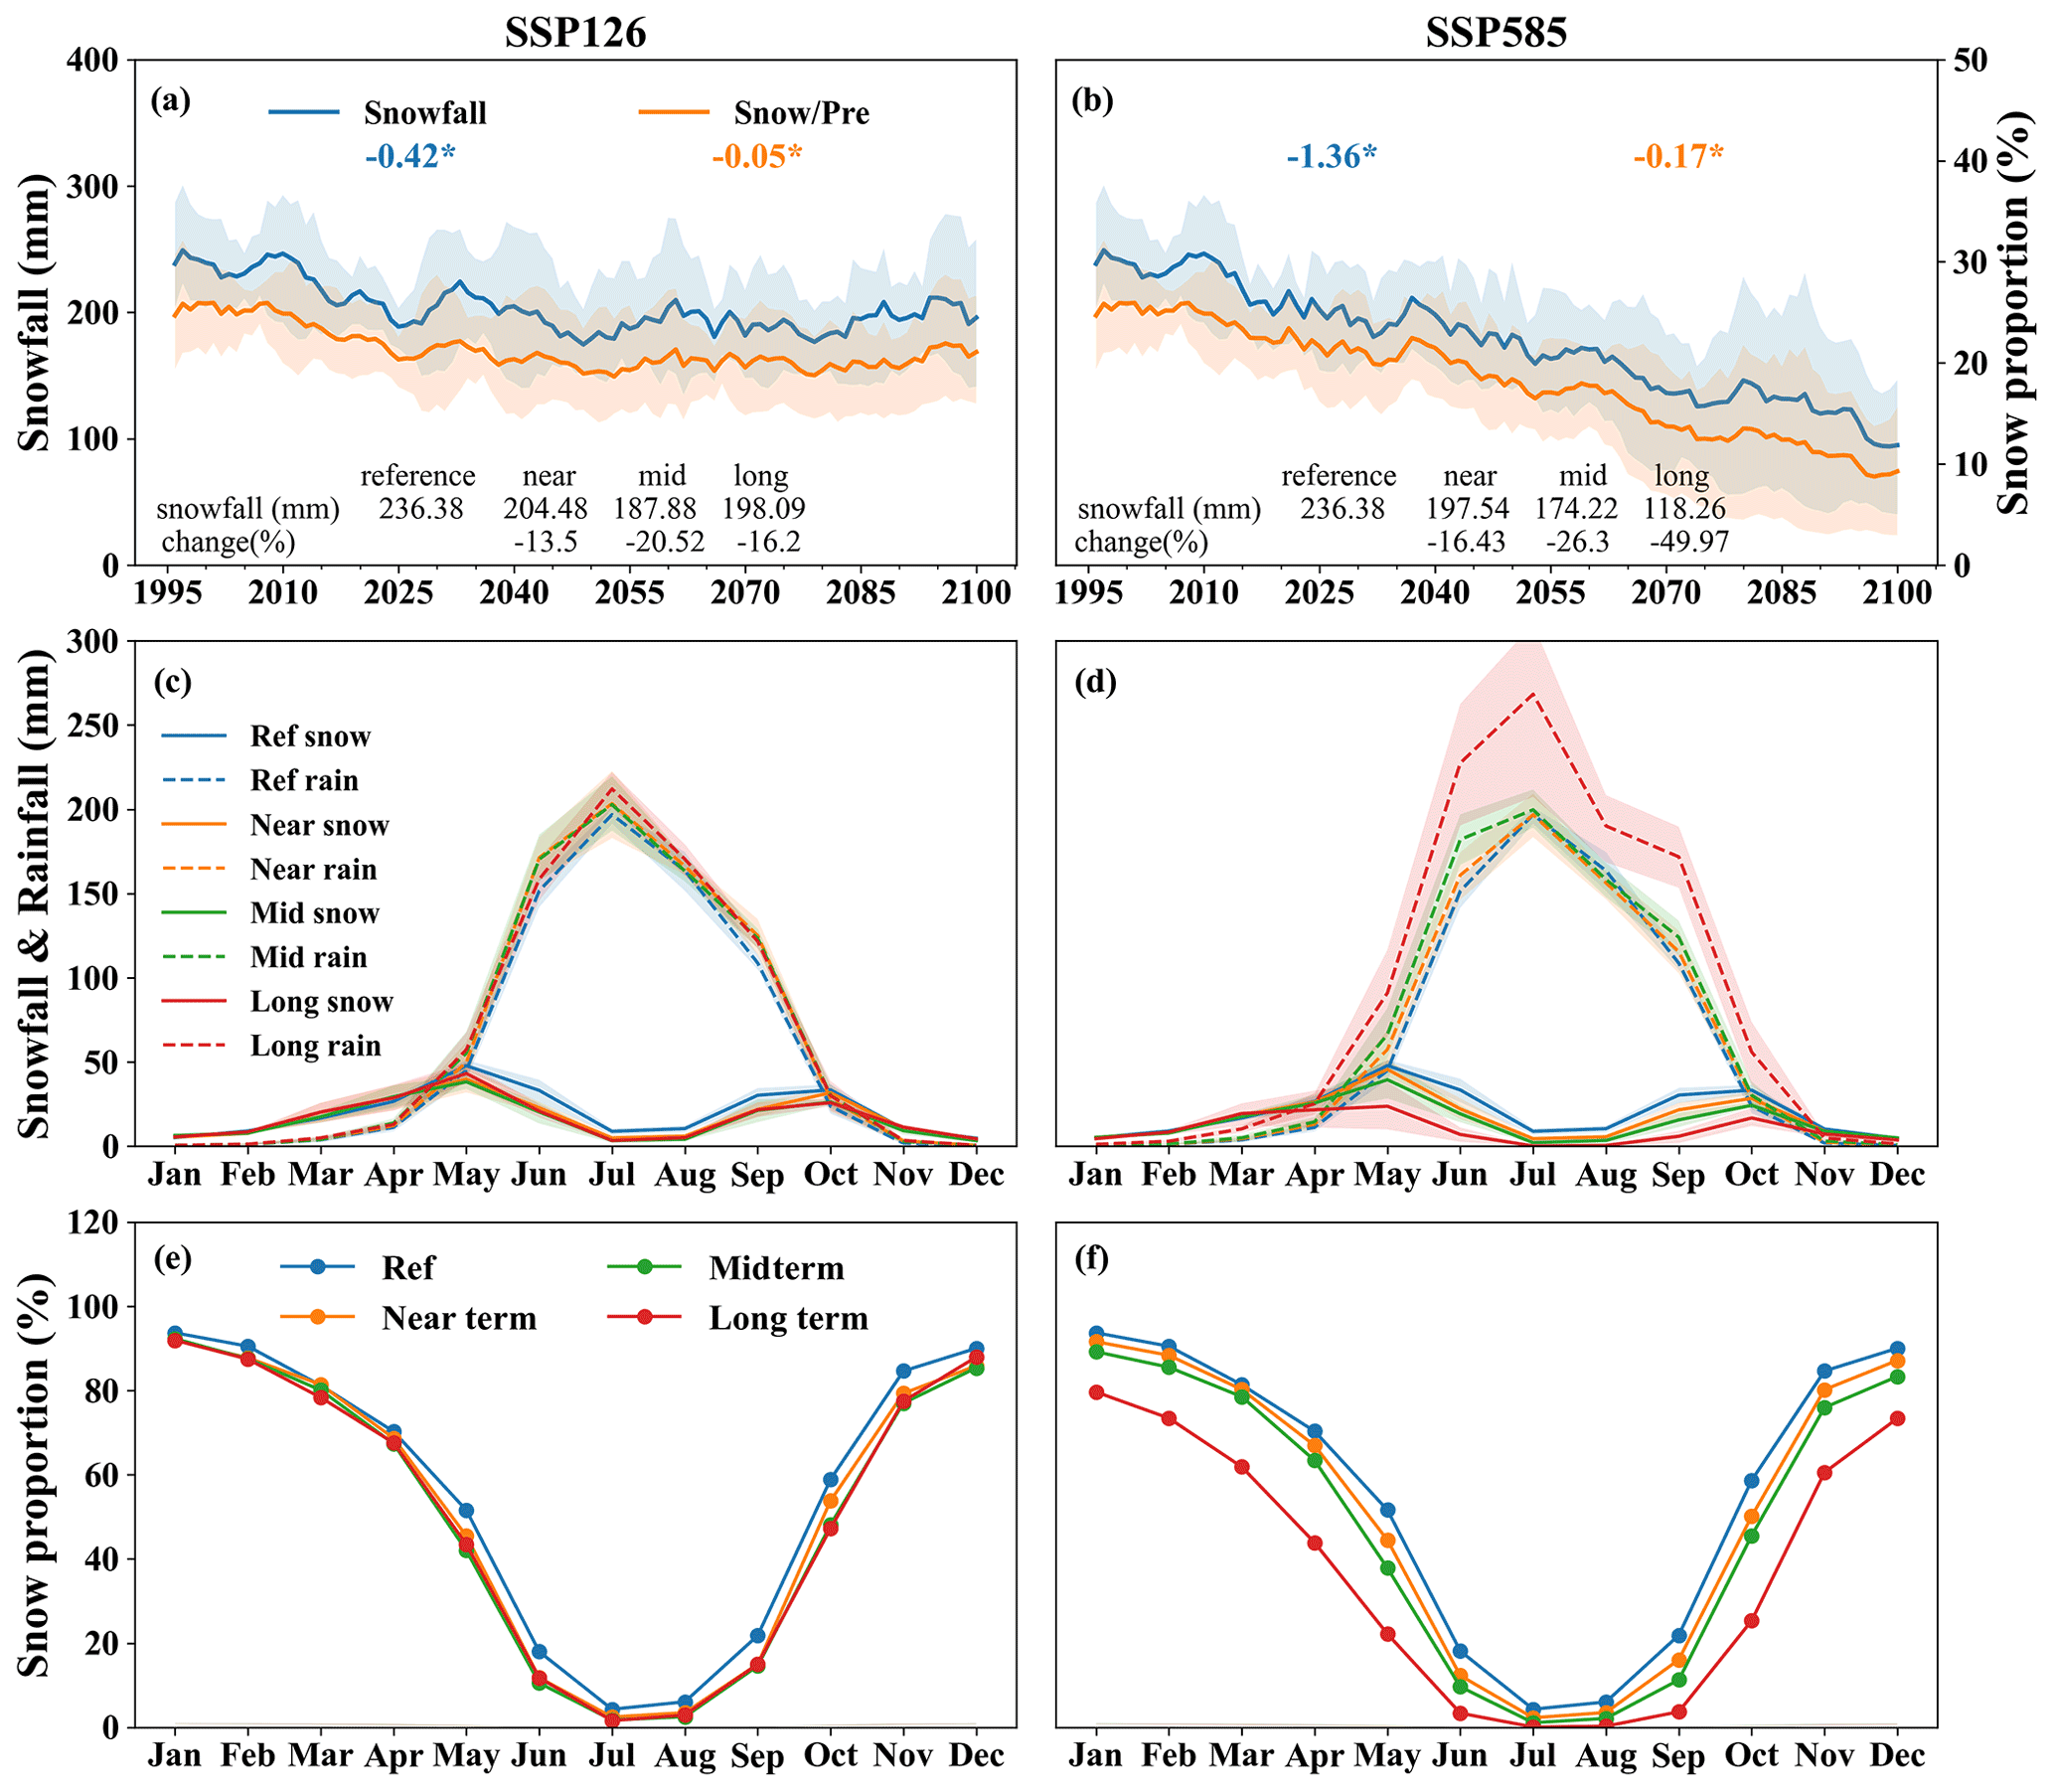
Figure 10Snowfall changes and changes in the snowfall / precipitation ratio (Snow / Pre): (a, b) annual changes in snowfall and the proportion of snowfall, (c, d) seasonal changes in snowfall and rainfall, and (e, f) the ratio of snowfall to total precipitation at seasonal scales in the USR basin during different periods under SSP126 and SSP585 compared to the reference period. The shading around the lines represents the interquartile range of the data, and the upper and lower ranges are 95 % and 5 %, respectively. “∗” represents a p value of less than 0.05 and indicates that the trend is statistically significant.
4.3.2 Changes in FSCA
The trends and relative changes in the annual FSCA at the basin scale under the different SSPs during 1995–2100 are shown in Fig. S4 and Table S3. The annual FSCA exhibits a significantly decreasing trend at the basin scale during 1995–2100, and this trend is more obvious under SSP585 (−0.42 % yr−1). Compared with the reference period, the annual FSCA is projected to increase by 4.9 % in the near term and to decrease by 8.59 % and 2.77 % in the midterm and long term, respectively, under SSP126. In contrast, the annual FSCA is projected to drastically decrease under SSP585, and it will be less than 40 % by the end of the century according to this scenario compared with the reference period. Moreover, it should be noted that the SC will continue to decrease from the near term to the midterm under SSP126, but it will begin to increase in the long term, which is significantly different from the pattern under SSP585. This indicates that future SC in the USR will decrease further under climate warming, and the severe warming projected under SSP585 would cause the SC to melt rapidly.

Figure 11Changes in the monthly and seasonal FSCA in the USR basin during different periods under SSP126 and SSP585 compared to the reference period: (a, b) decadal FSCA changes and (c, d) FSCA changes in different periods, and (e, f) variations in seasonal FSCA during 1995–2100. The shading around the lines in panels (a)–(d) represents the interquartile range of the data, and the upper and lower ranges are 95 % and 5 %, respectively. The numbers in panels (e) and (f) represent the trends of the corresponding lines (the same color); “∗” represents a p value of less than 0.05 and denotes that the trend is statistically significant; and the rectangular shaded areas indicate the near term (pink), midterm (yellow), and long term (red).
The results obtained from the analysis of the monthly-scale decadal FSCA from 1995 to the 2090s are shown in Fig. 11a and b. Figure 11 shows that the cycle of accumulation and ablation of the FSCA increases gradually from September to March and decreases rapidly from April to August. Under SSP585, the FSCA is projected to decrease in almost all months. However, the FSCA increases in June–November and decrease in December–April under SSP126. This pattern also occurs for the monthly-scale FSCA during the different periods (Fig. 11c, d). Similarly, the changes in the FSCA are more pronounced under SSP585 than under SSP126. For example, compared with the reference period, the FSCA becomes snow-free from July to September by the end of the century under SSP585.

Figure 12Change in the monthly fraction of snow-covered area (FSCA) in the different elevation bands and periods under SSP126 and SSP585 compared to the reference period. The shading around the lines represents the interquartile range of the data, and the upper and lower ranges are 95 % and 5 %, respectively.
Table 2Changes in the seasonal SWE in the USR basin under SSP126 and SSP585 compared to the reference period (1995–2014).
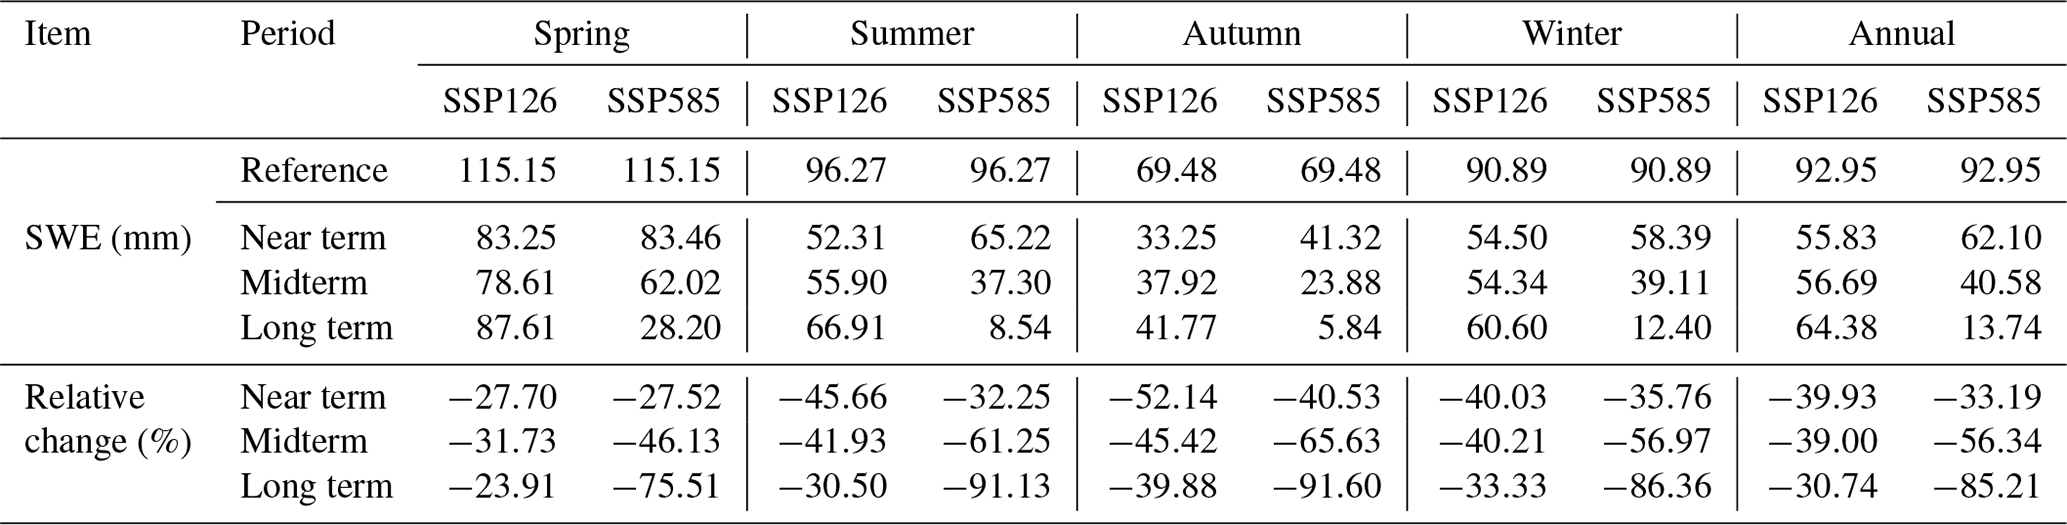
Figure 11e and f and Table S4 present the change trends in the seasonal FSCA, i.e., in spring (MAM), summer (JJA), autumn (SON), and winter (DJF). The results show that there is a decrease in all of the seasons during 1995–2100, but the decrease is more significant in winter and spring. Compared with the reference period, the FSCA is projected to decrease most (by about 61 % on average) in winter and spring under SSP585. Even under SSP126, the FSCA will decrease by about 15 % on average in winter and spring. However, there are differences between SSP126 and SSP585 in summer and autumn. From the near term to the long term, the FSCA is projected to increase in summer and autumn under SSP126, but this would not offset the large losses in spring and winter. This shows that the reduction in the SC in winter and spring would cause a reduction in the annual SC, which may further lead to a decrease in the snow storage in the basin, thereby affecting the amount of snowmelt during the ablation period.
From the perspective of different elevations, the SC is mainly distributed at middle–high elevations (≥4500 m), accounting for about 44 % of the basin area during the reference period, whereas less than 7 % of the SC is located at low elevations (<4500 m) (Table S3, Fig. 12). During 1995–2100, the annual FSCA at all elevations (3500–6000 m) significantly decreases under all of the SSPs, except in the area above 5500 m a.s.l. under SSP126, where no change occurs (Fig. S4). Further analysis revealed that the rate of decrease in the FSCA is faster at middle–high elevations (4500–5500 m) than at low elevations. However, the magnitude of the decrease in the FSCA is much greater at low elevations than at middle–high elevations in all of the periods compared with the reference period. For example, the FSCA in the low-elevation areas is projected to decrease by about 78 % under SSP585 and by 14 % under SSP126 by the end of the century. This illustrates that the amount of SC lost at middle–high elevations will be much greater than that lost at low elevations throughout the 21st century, but the response of the SC to climate warming at low elevations will more rapid and pronounced.

Figure 13Seasonal changes in the SWE in the USR basin during different periods under SSP126 and SSP585 compared to the reference period.
Further statistical analysis of the monthly-scale FSCA at all elevations during all of the periods revealed that there is a consistent decrease in the FSCA at all elevations compared with the reference period (1995–2014), except in areas with elevations of 4500–5500 m a.s.l. in the near term under SSP126 (Table S3, Fig. 12). Under all of the SSPs, the FSCA at middle–high elevations (≥4500 m) is projected to decrease in almost all months from the midterm to the long term. At low elevations (<4500 m), the FSCA decreases by approximately 25 % from December to April under SSP126 by the end of the century, whereas there is a slight increase in the FSCA during June–November (with no snow cover in July and September). However, the FSCA is projected to decrease by approximately 80 % in almost all months under SSP585 by the end of the century. Moreover, the decrease in the FSCA is more pronounced in winter and spring at low elevations than at high elevations under all of the SSPs, and it further strengthens towards the end of the century. Remarkably, we found that the snowmelt starts earlier at high elevations than at low elevations under SSP585 by the end of the century. This was confirmed at elevations of 4500–5500 m a.s.l., where the starting time of the decrease in the FSCA shifts from May to March, and it continues until the end of August Correspondingly, the FSCA in this elevation range also decreases by more than 60 %. In addition, there is almost no snow at elevations below 5000 m from July to September, and the snow is very sparse and broken at high elevations. For all of the SSPs, the projected climate would not be conducive to the occurrence and development of SC.

Figure 14Changes in the snowmelt in the USR basin during the different periods under SSP126 and SSP585 compared to the reference period: comparison of snowmelt runoff (SR) and total runoff at the basin outlet under (a–e) SSP126 and (e–h) SSP585, and comparison of snowmelt runoff and total melt (snowmelt runoff and snowmelt that seeps into the soil) under (i–l) SSP126 and (m–p) SSP58.
4.3.3 Changes in SWE
Figure 13 and Table 2 show the monthly- and seasonal-scale changes in the SWE in the different periods under SSP126 and SSP585. Compared with the reference period, the SWE is projected to decrease by about 39 % in the near term and midterm, and it slightly rebounds in the long term (about 31 %) under SSP126. However, there is a clear decrease in the SWE from the near term to the long term under SSP585, and the SWE decreases by more than 85 % by the end of the century. Similarly, the characteristics of the abovementioned changes are also reflected in the seasonal changes in the SWE (Fig. 13c, d). The SWE in the USR is the highest in spring and the lowest in autumn. Further analysis of the data revealed that the SWE decreases in all of the seasons and all of the periods under all of the SSPs, and the largest decrease occurs in summer and autumn, with a decrease of more than 91 % (30 %) under SSP585 (SSP126) by the end of the century. Furthermore, the peak in the SWE shifts from June to May under SSP585 by the middle of the century, and the SWE is almost zero from July to September. However, this does not occur under SSP126. Moreover, it can be seen that the peak in the SWE after the near term shifts from June to May under SSP585, whereas it remains in June under SSP126, and the peak value of the SWE weakens after the reference period.
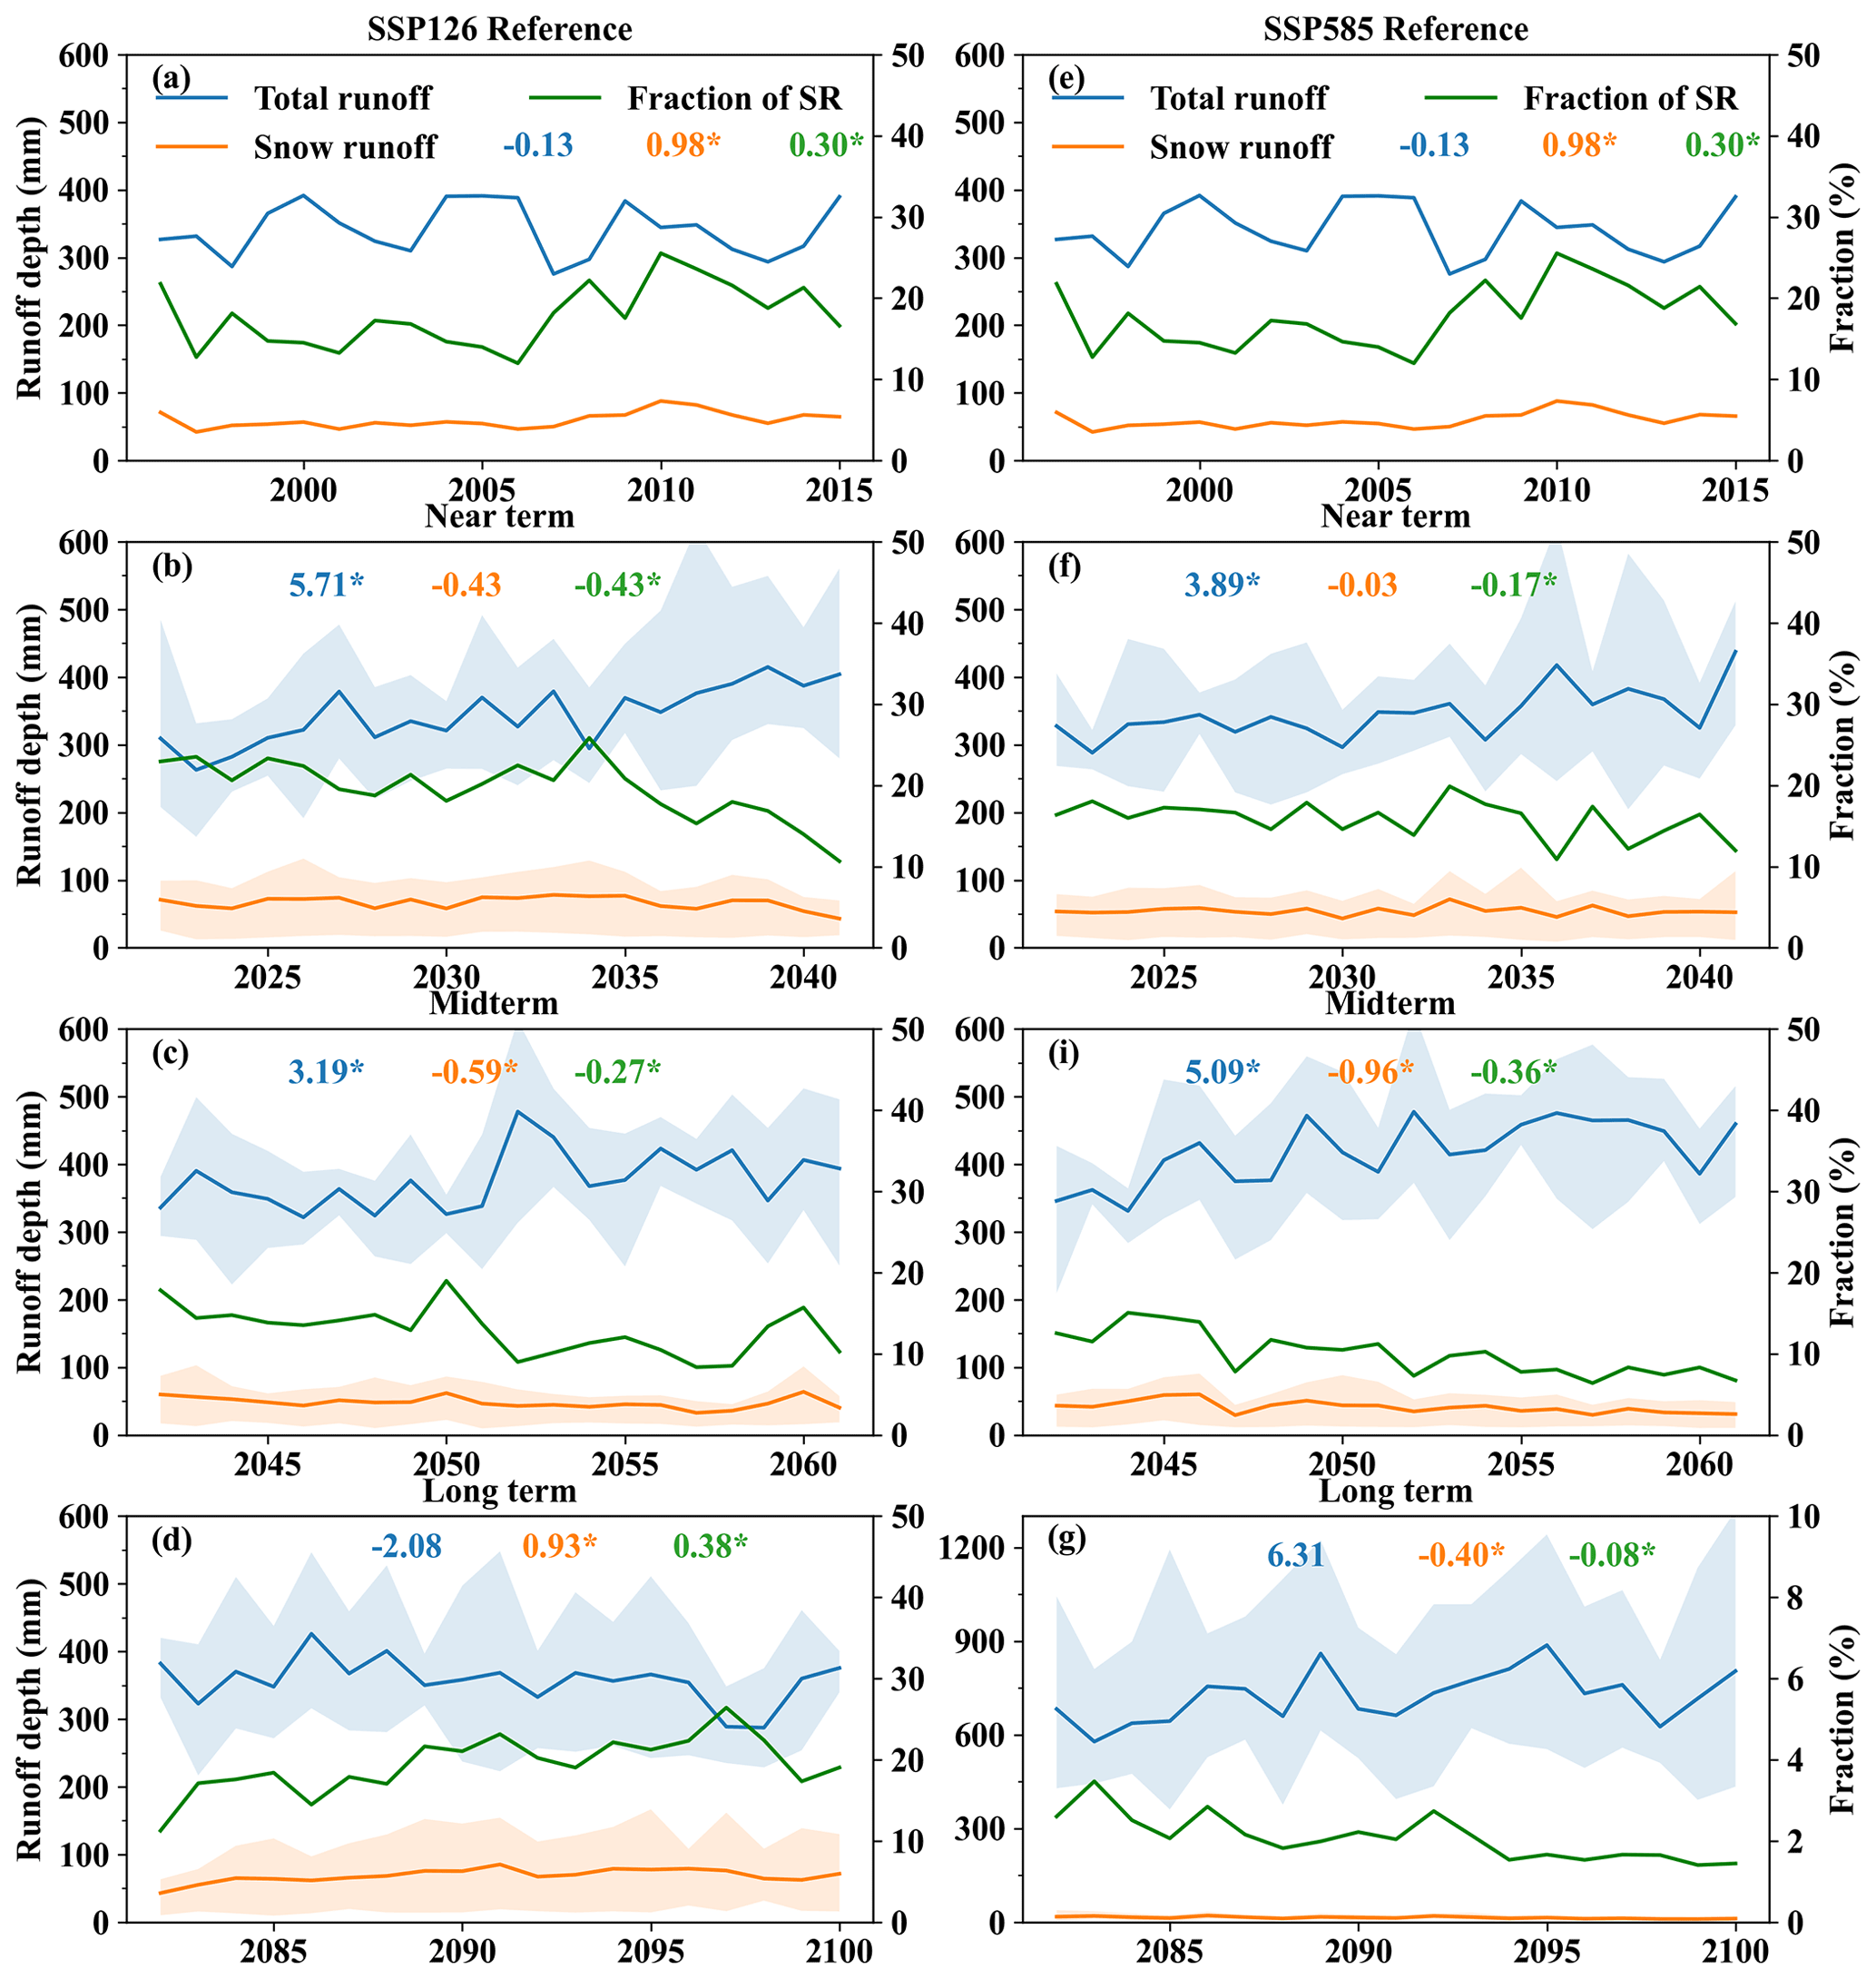
Figure 15Changes in the total runoff (blue line) and snowmelt runoff (orange line) during the different periods under SSP126 (a–b) and SSP585 (i–l). The green line is the percentage of snowmelt runoff in total runoff. The numbers represent the trends of the corresponding lines (the same color). “∗” represents a p value of less than 0.05 and denotes that the trend is statistically significant. The shaded band around the line denotes the interquartile range, and the upper and lower ranges are 95 % and 5 %, respectively.
4.3.4 Changes in snowmelt and the snowmelt runoff
The trends in the annual total runoff, total snowmelt, and snowmelt runoff during 1995–2100 are shown in Fig. S5. The total runoff increases under all of the SSPs, and it is faster under SSP585 (4.4 mm yr−1) than under SSP126 (0.31 mm yr−1). However, the total snowmelt, including the snowmelt runoff and snowmelt that seeps into the soil, significantly decreases under SSP585 (−1.04 mm yr−1) and SSP126 (−0.34 mm yr−1). The snowmelt runoff changes very slightly and insignificantly under SSP126, whereas it significantly decreases (0.56 mm yr−1) under SSP585. During the reference period, the snowmelt runoff (0.1 mm yr−1) and its contribution to the total runoff significantly increased (0.3 % yr−1), but the total runoff exhibited a nonsignificant downward trend (−0.13 mm yr−1). The trends in the total runoff, snowmelt runoff, and the contribution of snowmelt runoff in the midterm and long term are the inverse of those during the reference period under all of the SSPs, except in the long term under SSP126 (Fig. 15). This indicates that the snowmelt and snowmelt runoff likely peak in the near term (2021–2041).
Table S5 presents the changes in the annual total runoff, total snowmelt, and snowmelt runoff from the near term to the long term under SSP126 and SSP585. In the near term, the total runoff slightly increases under SSP126 (1.07 %) and SSP585 (1.40 %). In the midterm, the total runoff increases by twice as much under SSP585 (22.86 %) compared with SSP126 (10.4 %). By the end of the century, the total runoff is projected to increase by 112.29 % under SSP585 compared with the reference period (341.0 mm), whereas there is only a small increase under SSP126 (4.7 %). The total snowmelt consistently decreases from the near term to the long term under all of the SSPs. The reduction in the snowmelt remains below 20 % under SSP126, whereas it decreases by 22.5 % and 43.01 % in the midterm and the long term under SSP585, respectively. The snowmelt runoff increases in the near term and long term and decreases in the midterm (by −20.3 %) under SSP126, while the snowmelt runoff decreases significantly from the near term to the long term under SSP585, and the projected decrease is about 75 % in the long term.
The intra-annual changes in the total runoff are very similar to those of the precipitation, and the hydrograph remains largely consistent in all periods under SSP126 and SSP585, with 60 % of the annual total runoff occurring in summer and the peak flow occurring in July (Fig. 14a–h). There is a very obvious change in the total snowmelt – that is, the peak snowmelt shifts from July to June after the reference period (Fig. 14i–p). The snowmelt runoff in summer is the largest compared with the other seasons, accounting for about 65 %–85 % of the annual snowmelt runoff, and it sharply increases in May, with a peak in June (Fig. 14i–p). From Table 3, compared with the reference period, it can be seen that there is a consistent decrease in the spring and winter total runoff in the future periods under all of the SSPs, except in the long term for SSP585, whereas total runoff increases in summer and autumn in all of the periods. The snowmelt consistently increases in winter and spring in the future periods under all of the SSPs, whereas it markedly decreases in summer and autumn. Similarly, the snowmelt runoff in spring is projected to increase in all of the periods under all of the SSPs, whereas it decreases in summer and autumn, except in the near term and long term under SSP126.
Table 3Changes in the seasonal total runoff, snowmelt, and snowmelt runoff in the USR basin under SSP126 and SSP585 compared to the reference period (1995–2014).
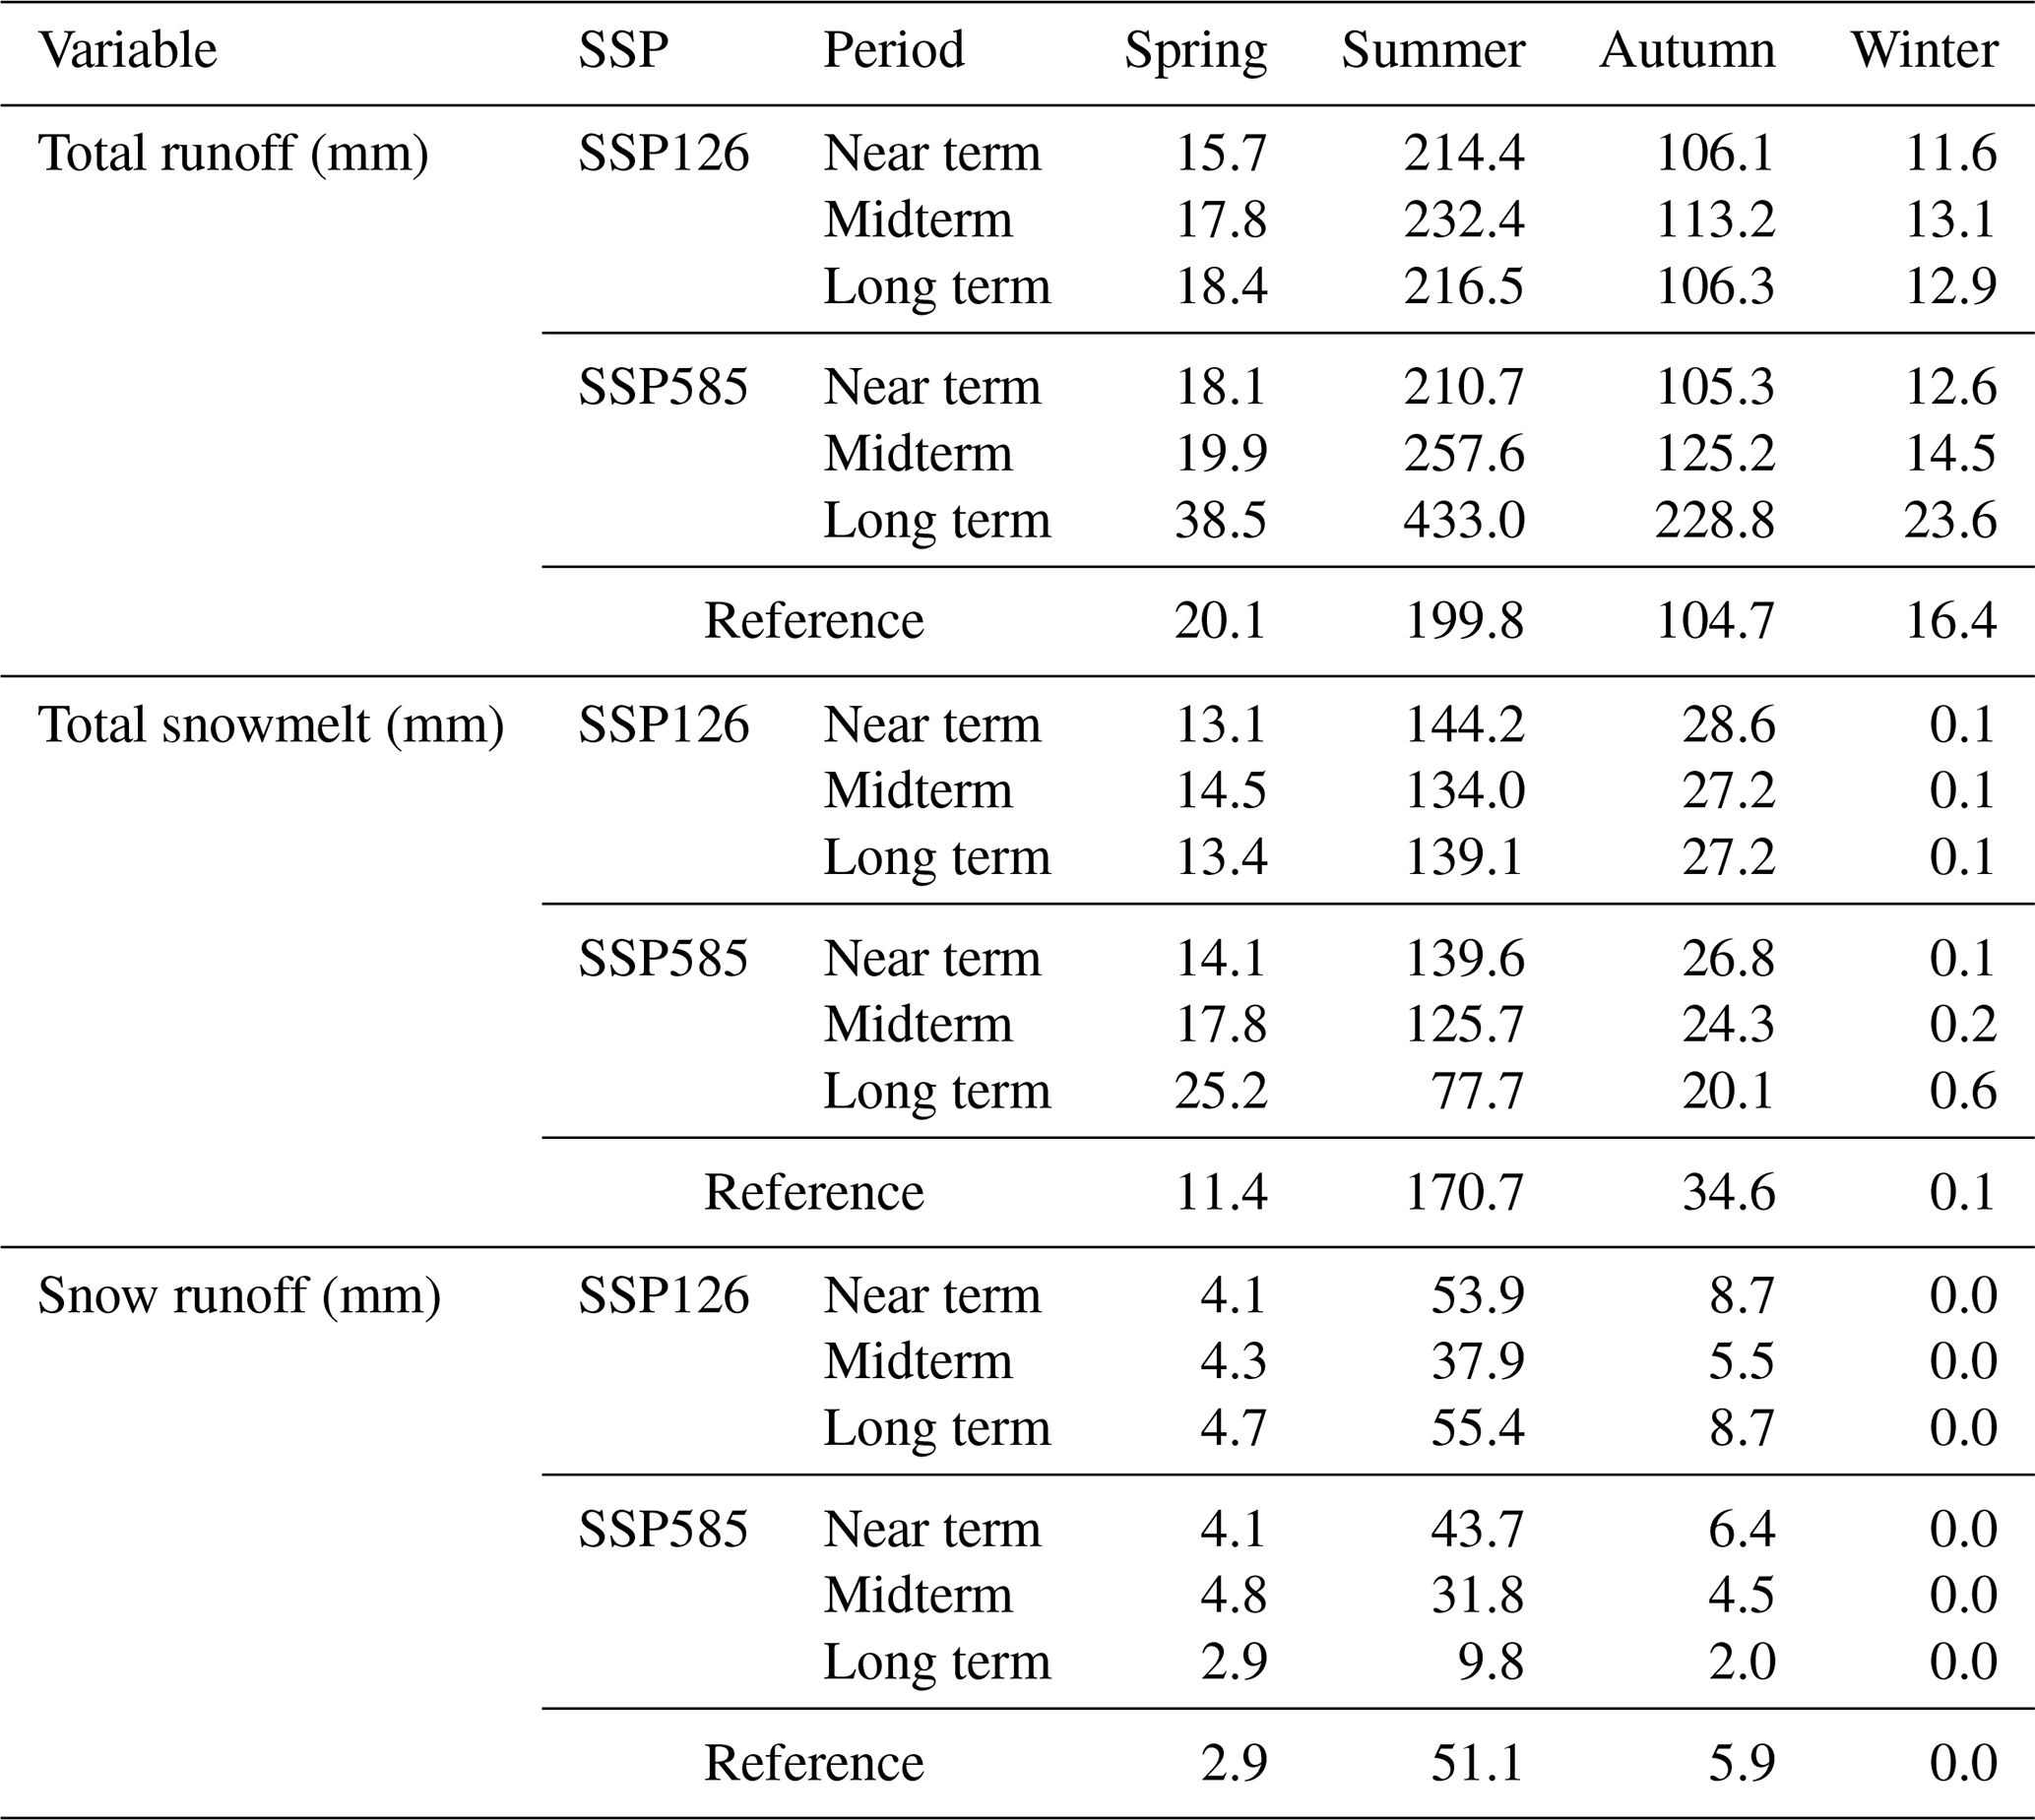
Table S6 and Fig. 15 show the contributions of the multiyear average and seasonal snowmelt runoff to the annual total runoff (SR / TR) in all of the periods under SSP126 and SSP585. The SR / TR was about 17.6 % in the reference period, and this value reaches about 19 % by the end of the century under SSP126. However, the SR / TR constantly decreases in all periods under SSP585, reaching about 2 % by the end of this century. Compared with the reference period, the SR / TR in spring was projected to increase in all of the periods, except in the long term under SSP585. Although the SR in summer contributes the most to the TR at the annual scale, the spring SR contributed the most to the spring TR at the seasonal scale, which is more obvious after the midterm under all of the SSPs due to climate warming. (Table S7). At the monthly scale (Fig. 14a–h), the SR / TR was the largest in June during the reference period, while it gradually shifted to May after the near term under SSP585 and SSP126. In short, the abovementioned results indicate that change in the SR under all of the SSPs is not the primary reason for the increase in the annual total runoff, but its contribution cannot be ignored.
5.1 Impacts of snow changes on runoff
According to the climate projections of the two SSPs, the future climate of the USR basin will become warmer and wetter, leading to a continuous reduction in the snowfall and accelerated melting of the SC during 2021–2100. In addition, the reduction in the annual snowfall and SC will be greater under SSP585 than under SSP126. Moreover, it was found that there are inconsistencies in the seasonal fluctuations of the simulated result in the different periods under SSP126 and SSP585. For example, the summer and autumn SC increases in all of the periods under SSP126 compared with the reference period, but it significantly decreases under SSP585. Moreover, a snow-free summer would likely occur in the long term under SSP585. The above phenomena were also reflected in the snow storage, snowmelt, and snowmelt runoff. This is mainly due to the differences in the GCM models – that is, the warming rate of SSP58 is stronger than that of SSP126 during 1995–2100 (Fig. 8). Although SSP126 includes warming in the different periods, it has very stable changes in temperature and precipitation. SSP585, in contrast, is accompanied by strong warming and significant precipitation from the near term to the long term, which prompts a shift from more solid precipitation to liquid precipitation in each season, resulting in dramatic decreases in the snowfall, SC, and snow storage (Figs. 9, 10; Table 1).
In addition, significant differences in the response of the SC to climate warming are predicted in the different elevation ranges, and it was found that the SC in the low-elevation regions (<4500 m) will be more susceptible to climate warming than that at middle–high elevations. This is because the temperature and precipitation variations are mainly dependent on an elevation gradient. Under the same temperature increase, the warming rate would be faster in the low-elevation areas than in the middle- to high-elevation areas, particularly in areas below 4000 m a.s.l. on the TP. This is more likely to cause a large amount of snowfall to be converted into rainfall and increase the melting, which would result in a significant decrease in the amount of snowfall (Hock et al., 2019; Marty et al., 2017; Kapnick et al., 2014), especially in spring when more snowfall would occur. Moreover, the decrease in the SC in the low-elevation areas will also increase the absorption of solar radiation by the surface, increasing the surface temperature and further melting the snow (Scherrer et al., 2012). However, the response to the increase in temperature will be slower in the high-elevation areas than in the low-elevation areas, which would result in more precipitation in the high-elevation areas due to the effect of terrain uplift; thus, there would be a correspondingly greater amount of snowfall (Hock et al., 2019). This change pattern would remain at lower elevations until the end of the century; however, in the long term, under SSP585, the SC in high-elevation areas would also be greatly reduced under the effect of the large increase in temperature, and the ablation time of the SC would also be 1–2 months earlier than during the reference period. This is because the warming rate would slow down by the end of the century under SSP126, whereas the sharp temperature increase would be more intense in the long term under SSP585 (Fig. 8, Table S1).
For both SSPs, the increase in the temperature leads to a reduction in the snow storage over the projected period, resulting in a continued reduction in the total snowmelt and further causing a reduction in the snowmelt runoff, particularly in the cold season (Figs. 13, S4, S5). We found that, in the projected period, the spring and winter snowmelt and snowmelt runoff increase compared with the reference period, especially in May (Fig. S6), Moreover, the reduction in the spring snowfall leads to a reduction in the amount of snowpack that can be stored in the spring. These factors are the reasons why the meltwater and runoff in the summer are greatly reduced during the projected periods. However, the increased snowmelt in spring would cause an increase in the snowmelt runoff, which would make up for the reduction in the total runoff in spring to a certain extent and would play an important role in alleviating the drought before the monsoon period (Table S7, S8). Although the precipitation increases in autumn, the amount of snowfall is very limited due to the influence of the increase in temperature, which results in a decrease in the snowmelt and snowmelt runoff in autumn during the projected period (a significant decrease under SSP585 and a weak balance under SSP126) (Table S8, Fig. S6). Hock et al. (2019) and Nepal et al. (2021) pointed out a similar pattern of snowpack meltwater in alpine regions, and they attributed this pattern to increased rainfall due to the increase in temperature. During the projected period, the peak snowmelt in the USR shifts from July to June, but the pattern of the total runoff differs from that of the snowmelt. The total runoff still peaks in July (Figs. 14a–d and 15a–d), which is mainly influenced by the monsoon precipitation (Figs. 9 and 10c–d). Thus, the annual hydrological curve remains unchanged in the future. This finding is consistent with that of Su et al. (2016), who reported that the runoff patterns of rivers in monsoon regions would remain stable in the future. We also found that the proportion of snowmelt runoff to snowmelt would continue to decrease. In addition to climate warming, another possible explanation for this is that most of the snowmelt infiltrates into the soil and is stored in the snowpack, and it can also evaporate during runoff according to the calculations of the WEB-DHM-sf model. Under future climate warming and a continuous increase in precipitation, in view of the very small glacial area in the basin (<3 %), the influence of the snow on the hydrological processes in the basin would weaken, and precipitation would be the dominant factor affecting the runoff changes in the future (Fig. 10c, d).
5.2 Comparison with other studies
Although there are some differences in the driving data, models, and periods used in previous studies, the overall trends and patterns in the snow variables and runoff in the USR are still comparable and consistent. In this study, it was found that the total runoff exhibited an insignificant decreasing trend (−0.13 mm yr−1) during the reference period, which is consistent with the recent findings of Yang et al. (2021). However, there are inconsistencies with several previous studies based on site observations that have reported a decrease in the total runoff, which is mainly due to the difference in the study periods. For example, our results also show that the total runoff increased during 1981–2018 (Fig. S7). The total runoff would also increase, which is consistent with the results of Lutz et al. (2014), Su et al. (2016), Zhao et al. (2019), and Khanal et al. (2021) for the projected period. A similar distribution pattern and seasonal changes in the SC were reported by Kraaijenbrink et al. (2021), who also found that the SC would decrease the most at low elevations in summer and winter. They argued that the shallow SC in elevated regions is more susceptible to warming, and the rapid reduction in the snowpack would lead to a shorter snow season, which would also cause a decrease in the albedo and would eventually form an elevation-dependent warming feedback cycle. The inter-annual and seasonal changes in the future snowmelt runoff are also very similar to the predictions of previous studies (Su et al., 2016; Zhao et al., 2019; Khanal et al., 2021; Kraaijenbrink et al., 2021). All of these studies found that the snowmelt would decrease and advance to spring, although there may be differences in a certain period. This can mainly be explained by the shift in the snow and rain as well as the increased snow melting rate due to warming as well as the decrease in the snowfall in the USR. The contribution of the snowmelt runoff to the total runoff during the reference period was about 17.6 %, which is between the values of 13.4 % (Yang et al., 2021) and 28.3 % (Lutz et al., 2014) reported in previous studies. This is largely due to the differences in the forcing data and hydrological model used to describe the physical snow-related processes. The contribution of the snowmelt runoff to the total runoff under SSP585 is consistent with previous studies that predicted significant decreases (Su et al., 2016; Zhao et al., 2019; Khanal et al., 2021). We also concluded that the snowmelt runoff would be important but would not be the main factor controlling the changes in the total runoff in the basin.
5.3 Uncertainties and limitations
The main uncertainties and limitations of this study were as follows. Very limited observed runoff data (for only 6 years) were used in the calibration and validation of the model. The lack of long-term runoff observations may cause uncertainties in the simulation results for the other periods. The SSP245 scenario, which is closer to the current state of development, was not considered here due to data limitations. Although ERA5 precipitation data were better than the other products in terms of the temporal and spatial distributions, most studies have pointed out that this product overestimates the precipitation during the monsoon period in high mountains (Yang et al., 2021; Khanal et al., 2021). The ERA5 product was evaluated at a single point, and the historical forcing data were not corrected. Although this effect could be reduced through model parameter calibration, it would inevitably lead to the overestimation of variables such as snow cover and runoff. For example, Khanal et al. (2021) pointed out that the cold bias in the ERA5 (even after bias correction) is the main cause of the overestimation of the winter snow cover, but an insufficient description of the snow sublimation and other physical mechanisms in the model may also lead to excessive snow cover. In addition, although the climate model data selected in the study can reflect the uncertainty range of all of the GCM datasets, there is still some uncertainty at the basin scale. Moreover, a simple bias correction method was used to conduct a secondary correction of the GCM based on the ERA5, which only ensured the consistency of the relative change trend; it did not improve the accuracy of the future predictions of the meteorological variables, such as the precipitation and temperature frequency distribution and seasonal variations, which may cause some uncertainty in the simulation results (Khanal et al., 2021; Zhao et al., 2019; Su et al., 2016). Therefore, to improve our understanding of the effects of the synergistic changes in the cryospheric components under climate change on the hydrological processes in high mountainous areas, it is necessary to enhance our understanding of the related hydrological processes through in situ experiments and to calibrate more reliable parameters to further improve the physical processes in the model.
In addition, the spatial resolution of the model has an important effect on the snow hydrological simulation in high mountainous regions with complex environments (Etchevers et al., 2001). Here, the accuracy of snow hydrological simulation between the model resolutions of 3 and 5 km was compared. The NSE, R2, KGE, RB, and RMSE values between the simulated and observed discharge at the basin outlet during 1981–1987 based on the 3 km model resolution were 0.82, 0.8, 0.87, −7.93 %, and 346.12 m3 s−1, respectively (Fig. S8a). It is shown that the accuracy of simulated discharge based on the 3 km resolution is slightly improved at the basin outlet compared with that of the 5 km model resolution. Meanwhile, the 8d and monthly FSCA of former was slightly improved at the basin scale compared with that of the latter according to the R2, which is improved from 0.73 (8d) and 0.56 (monthly) to 0.74 and 0.59, respectively (Fig. S9a and c and Fig. 5a and c). Overall, the improvement was not obvious between the 3 km resolution and the 5 km resolution, which may be due to the following reasons: the model (WEB-DHM-sf) used in this study considers sub-grid parameterizations – that is, a model grid consists of a set of geometrically symmetrical hillslopes that are the basic hydrological units (BHUs) of the model. The topography parameters (slope and length) of the hillslope in each model grid can be calculated by a fine DEM with a 90 m resolution (Wang et al., 2009a). The sub-grid parameterization scheme can enable more detailed characterization of basin topography information such as slope, aspect, sky view factor, and elevation (Etchevers et al., 2001), thereby retaining the important information of topography-induced spatial variation in forcing inputs (e.g., the solar radiation, albedo, precipitation, and wind), which would reduce simulation bias caused by model resolution (Winstral et al., 2014; Sohrabi et al., 2019). Furthermore, the original resolution of the forcing data input to the model was above 10 km. Downscaling from low resolution to high resolution (3 and 5 km) through interpolation cannot improve the accuracy of the variables that affect the snow hydrological simulation, as coarse-scale data cannot transfer more effective information to the interpolated fine-scale data by downscaling the scale (Sohrabi et al., 2019). Nevertheless, this does not mean that it is not important to improve the model resolution, and the model resolution suitable for a specific watershed should be selected according to the characteristics of the watershed, the snow hydrological model used, and the accuracy of the forcing data.
In this study, we used multisource reanalysis data and four GCMs under two different SSPs to drive a validated cryosphere–hydrological model (WEB-DHM-sf) in order to analyze the impact of future snow changes on runoff in the USR basin. The main conclusions of this study are as follows:
-
From 1995 to 2100, the annual average temperature in the USR is projected to significantly increase under SSP126 (0.2 ∘C per decade) and SSP585 (0.7 ∘C per decade). The annual precipitation is also projected to significantly increase under SSP126 (5 mm per decade) and SSP585 (27.8 mm per decade). According to these simulations, the climate of the USR will become warmer and wetter in the future. On the seasonal scale, the temperature will significantly increase in all of the seasons, while the precipitation would increase in summer and autumn and decrease in the winter and spring. In the future, the USR is projected to become warmer and wetter during the monsoon season and warmer and drier during the non-monsoon season.
-
From the perspective of the entire study period, the annual and seasonal snowfall in the basin will significantly decrease, i.e., by 13 %–16 % in the near term and 16 %–49 % in the long term. Overall, the snowfall will also decrease in all of the seasons, with the greatest decrease occurring in summer and autumn, i.e., by 44 %–85 % and 21 %–59 % in the abovementioned respective seasons by the end of the century. The decrease in snowfall will directly affect the changes in the snow cover. The snow cover in the low-elevation areas will decrease significantly due to the warming, especially in winter and spring. Melting will also accelerate in the middle- to high-elevation areas due to the increase in temperature under SSP585, especially in the long term, and the ablation of snow will shift from May to March. A large amount of snowpack is melting in the USR, which will further lead to a continuous reduction in snow storage. Compared with the reference period, the snow storage in the USR in the future will exhibit negative growth in terms of both annual average (a >30 % decrease under SSP126 and an 85 % decrease under SSP585) and seasonal (a >30 % decrease in summer and autumn under SSP126 and a 90 % decrease under SSP585) changes. Thus, based on our simulations, climate warming will lead to unfavorable development of snow in the basin.
-
During the reference period, the contribution of the snowmelt runoff to the total runoff was about 17.6 %. Under the large temperature increase scenario, this contribution will become continuously smaller in the future and be about 2 % by the end of the century, leading to changes in the total runoff from a snow- and rain-dominated pattern to a rain-dominated pattern. Under the SSPs, the snow–rain runoff pattern would be maintained. The annual total runoff in the USR will increase significantly in the future, which will also increase the availability of water resources in the basin. At the seasonal scale, the total runoff will decrease in winter and spring and increase in summer and autumn, but the total annual hydrograph will remain unchanged. The increasing peak runoff may increase the risk of flooding in the future. The snowmelt runoff will significantly decrease, except in the long term under SSP126, and the meltwater peak will advance to June, with the largest proportion occurring in May. The increase in the spring snowmelt will make up for the reduction in the spring total runoff caused by the reduction in rainfall, thereby ensuring the availability of water resources in the basin during the growing season in the spring and alleviating the spring drought to a certain extent. The advance in the snowmelt will also lead to a decline in snowmelt in summer and change the pattern of snowmelt runoff in this season. These changes will have some impacts on the availability of water resources, ecosystem, and agriculture in high mountainous regions. As such, to reduce the risk of summer rain floods and spring droughts, it would be necessary to actively adjust the water resource allocation scheme to adapt to the impacts of climate change.
The data used in this paper and their respective sources are as follows: CMFD and the second glacier inventory dataset of China, version 1.0 (http://data.tpdc.ac.cn/en/, last access: 9 September 2022, Yang and He, 2019); ERA5 (https://cds.climate.copernicus.eu/#!/home, last access: 9 September 2022, Hersbach et al., 2019); GLDAS (https://search.earthdata.nasa.gov/, last access: 9 September 2022, Beaudoing et al., 2020); MERRA-2 (https://search.earthdata.nasa.gov/, last access: 9 September 2022, Global Modeling and Assimilation Office, 2015); MODIS LST (https://search.earthdata.nasa.gov/, last access: 9 September 2022, Wan et al., 2015); MSWEP (http://www.gloh2o.org/, last access: 9 September 2022, Beck et al, 2019); ISIMIP 3b data (https://data.isimip.org/, last access: 9 September 2022, Lange and Büchner, 2021a); the DEM (https://srtm.csi.cgiar.org/, last access: 9 September 2022, Jarvis et al., 2008); land use maps (https://doi.org/10.5066/F7GB230D, last access: 9 September 2022, Earth Resources Observation and Science Center, 1997); soil data (https://data.apps.fao.org/map/catalog/srv/eng/catalog.search#/metadata/446ed430-8383-11db-b9b2-000d939bc5d8, last access: 9 September 2022, Food and Agriculture Organization of United Nations, 2003); LAI and FPAR (http://www.geodata.cn/thematicView/GLASS.html, last access: 9 September 2022, Liang, 2015); meteorological observation data (http://data.cma.cn/, last access: 9 September 2022, China Meteorological Administration, 2022); and MOYDGL06∗ (https://doi.org/10.1594/PANGAEA.901821, last access: 9 September 2022, Muhammad, 2020).
The supplement related to this article is available online at: https://doi.org/10.5194/hess-26-4657-2022-supplement.
CC and LW designed the research and organized the text. CC analyzed data and wrote the manuscript. JZ, HL, and JZ provided technical guidance. LW, DC, JZ, YW, and TC provided suggestions and reviewed the manuscript.
The contact author has declared that none of the authors has any competing interests.
Publisher's note: Copernicus Publications remains neutral with regard to jurisdictional claims in published maps and institutional affiliations.
This research was supported by the Strategic Priority Research Program of the Chinese Academy of Sciences (grant no. XDA19070301), the National Natural Science Foundation of China (grant nos. 41988101 and 92047301), and the Second Tibetan Plateau Scientific Expedition and Research Program (STEP; grant no. 2019QZKK020604). We sincerely thank Hylke E. Beck, who generously provided the MSWEP 2.8 precipitation datasets.
This research has been supported by the Strategic Priority Research Program of the Chinese Academy of Sciences (grant no. XDA19070301), the National Natural Science Foundation of China (grant nos. 41988101 and 92047301), and the Second Tibetan Plateau Scientific Expedition and Research Program (STEP; grant no. 2019QZKK020604).
This paper was edited by Hongkai Gao and reviewed by two anonymous referees.
Barnett, T. P., Adam, J. C., and Lettenmaier, D. P.: Potential impacts of a warming climate on water availability in snow-dominated regions, Nature, 438, 303–309, https://doi.org/10.1038/nature04141, 2005.
Barnhart, T. B., Molotch, N. P., Livneh, B., Harpold, A. A., Knowles, J. F., and Schneider, D.: Snowmelt rate dictates streamflow, Geophys. Res. Lett., 43, 8006–8016, https://doi.org/10.1002/2016GL069690, 2016.
Beaudoing, H., Rodell, M., and NASA/GSFC/HSL: GLDAS Noah Land Surface Model L4 3 hourly 0.25×0.25∘ V2.1, Greenbelt, Maryland, USA, Goddard Earth Sciences Data and Information Services Center (GES DISC), [data set], https://doi.org/10.5067/E7TYRXPJKWOQ (last access: 9 September 2022), 2020.
Beck, H. E., Wood, E. F., Pan, M., Fisher, C. K., Miralles, D. M., van Dijk, A. I. J. M., McVicar, T. R., and Adler, R. F.: MSWEP V2 global 3hourly 0.1∘ precipitation: methodology and quantitative assessment, GloH2O, [data set], http://www.gloh2o.org/mswx/ (last access: 9 September 2022), 2019.
Bian, Q., Xu, Z., Zheng, H., Li, K., Liang, J., Fei, W., Shi, C., Zhang, S., and Yang, Z.: Multiscale Changes in Snow Over the Tibetan Plateau During 1980–2018 Represented by Reanalysis Data Sets and Satellite Observations, J. Geophys. Res.-Atmos., 125, e2019JD031914, https://doi.org/10.1029/2019JD031914, 2020.
Bibi, S., Wang, L., Li, X. P., Zhou, J., Chen, D. L., and Yao, T. D.: Climatic and associated cryospheric, biospheric, and hydrological changes on the Tibetan Plateau: a review, Int. J. Climatol., 38, 1–17, https://doi.org/10.1002/joc.5411, 2018.
Biemans, H., Siderius, C., Lutz, A. F., Nepal, S., Ahmad, B., Hassan, T., von Bloh, W., Wijngaard, R. R., Wester, P., Shrestha, A. B., and Immerzeel W. W.: Importance of snow and glacier meltwater for agriculture on the Indo-Gangetic Plain, Nat. Sustain., 2, 594–601, https://doi.org/10.1038/s41893-019-0305-3, 2019.
Beck, H. E., van Dijk, A. I. J. M., Levizzani, V., Schellekens, J., Miralles, D. G., Martens, B., and de Roo, A.: MSWEP: 3-hourly 0.25∘ global gridded precipitation (1979–2015) by merging gauge, satellite, and reanalysis data, Hydrol. Earth Syst. Sci., 21, 589–615, https://doi.org/10.5194/hess-21-589-2017, 2017.
Chen, D. L., Xu, B. Q. Yao, T. D., Guo, Z. T., Cui, P., Chen, F. H., Zhang, R. H., Zhang, X. Z., Zhang, Y. L., Fan, J. Hou, Z. Q., and Zhang, T. H.: Assessment of past, present and future environmental changes on the Tibetan Plateau, Chin. Sci. Bull., 60, 3025–3035, https://doi.org/10.1360/N972014-01370, 2015.
China Meteorological Administration: Hourly observations from ground weather stations in China, National Meteorological Science Data Center, [data set], http://data.cma.cn/data/cdcdetail/dataCode/A.0012.0001.html, last access: 9 September 2022.
Cuo, L., Zhang, Y. X., Zhu, F., and Liang, L. Q.: Characteristics and changes of streamflow on the Tibetan Plateau: A review, J. Hydrol.-Reg. Stud., 2, 49–68, https://doi.org/10.1016/j.ejrh.2014.08.004, 2014.
Chen, Y. P., Gagen, M. H., Chen, F., Zhang, H. L., Shang, H. M., and Xu, H. F.: Precipitation variations recorded in tree rings from the upper Salween and Brahmaputra River valleys, China. Ecol. Indi., 113, 106189, https://doi.org/10.1016/j.ecolind.2020.106189, 2020.
Cucchi, M., Weedon, G. P., Amici, A., Bellouin, N., Lange, S., Müller Schmied, H., Hersbach, H., and Buontempo, C.: WFDE5: bias-adjusted ERA5 reanalysis data for impact studies, Earth Syst. Sci. Data, 12, 2097–2120, https://doi.org/10.5194/essd-12-2097-2020, 2020.
Cuo, L., Beyene, T. K., Voisin, N., Su, F. G., Lettenmaier, D. P., Alberti, M., and Richey, J. E.: Effects of mid-twenty-first century climate and land cover change on the hydrology of the Puget Sound basin, Washington, Hydrol. Proc., 25, 1729–1753, https://doi.org/10.1002/hyp.7932, 2 011.
Ding, Y. J., Zhang, S. Q., Wu, J. K., Zhao, Q. D., Li, X. Y., and Qin, J.: Recent progress on studies on cryospheric hydrological processes changes in China, Adv. Water Sci., 31, 690–702, https://doi.org/10.14042/j.cnki.32.1309.2020.05.006, 2020.
Ding, J., Yan, H., Xue, S., Feng, J., and Chen, Z.: Study on cooperative development of water resources for international rivers in Southeast Asia, J. Water Resour, 26, 97–102, https://doi.org/10.11705/j.issn.1672-643X.2015.02.018, 2015.
Earth Resources Observation and Science Center: A global land cover database primarily derived from 1992 to 1993 1-km AVHRR data, The U.S. Geological Survey's (USGS), [data set], https://doi.org/10.5066/F7GB230D (last access: 9 September 2022), 1997.
Etchevers, P., Durand, Y., Habets, F., Martin, E., and Noilhan, J.: Impact of spatial resolution on the hydrological simulation of the Durance high-Alpine catchment, France, Ann. Glaciol., 32, 87–92, https://doi.org/10.3189/172756401781819337, 2001.
Fan, H. and He, D. M.: Regional climate and its change in the Nujiang River basin, Acta Geogr. Sin., 67, 621–630, https://doi.org/10.11821/xb201205005, 2012.
FAO: Digital soil map of the world and derived soil properties, Land and Water Digital Media Series Rev. 1, United Nations Food and Agriculture Organization CD-ROM, 2003.
Food and Agriculture Organization of United Nations, Land and Water Develepment Division: Digital soil map of the world and derived soil properties, FAO, [data set], https://data.apps.fao.org/map/catalog/srv/eng/catalog.search#/metadata/446ed430-8383-11db-b9b2-000d939bc5d8, (last access: 9 September 2022), 2003.
Global Modeling and Assimilation Office (GMAO): MERRA-2 tavg1_2d_flx_Nx: 2d,1-Hourly,Time-Averaged,Single-Level,Assimilation,Surface Flux Diagnostics V5.12.4, Greenbelt, MD, USA, Goddard Earth Sciences Data and Information Services Center (GES DISC), [data set], https://doi.org/10.5067/7MCPBJ41Y0K6, (last access: 9 September 2022), 2015.
Guo, J. H. (Eds.): Hydrogeography of western Sichuan and northern Yunnan, Scientific Publishing (China), BeiJing, China, 1985.
Guo, W. Q., Liu, S. Y., Xu, L., Wu, L. Z., Shangguan, D. H., Yao, X. J., Wei, J. F., Bao, W. J., Yu, P. C., Liu, Q., and Jiang, Z. L.: The second Chinese glacier inventory: data, methods and results, J. Glaciol., 61, 357–372, https://doi.org/10.3189/2015JoG14J209, 2015.
Gupta, H. V., Kling, H., Yilmaz, K. K., and Martinez, G. F.: Decomposition of the mean squared error and NSE performance criteria: Implications for impr oving hydrological modelling, J. Hydrol., 377, 80–91, https://doi.org/10.1016/j.jhydrol.2009.08.003, 2009.
He, J., Yang, K., Tang, W., Lu, H., Qin, J., Chen, Y., and Li, X.: The first high-resolution meteorological forcing dataset for land process studies over China, Sci. Data, 7, 25, https://doi.org/10.1038/s41597-020-0369-y, 2020.
Hersbach, H., Bell, B., Berrisford, P., Biavati, G., Horányi, A., Muñoz Sabater, J., Nicolas, J., Peubey, C., Radu, R., Rozum, I., Schepers, D., Simmons, A., Soci, C., Dee, D., and Thépaut, J.-N.: ERA5 hourly data on single levels from 1959 to present. Copernicus Climate Change Service (C3S) Climate Data Store (CDS), [data set], https://doi.org/10.24381/cds.adbb2d47 (last access: 9 September 2022), 2019.
He, D., Zhao, W., and Feng, Y.: Research progress of international rivers in China, J. Geogr. Sci. 14, 21–28, https://doi.org/10.1007/BF02841103, 2004.
Henderson, G. R., Peings, Y., Furtado, J. C., and Kushner, P. J.: Snow-atmosphere coupling in the Northern Hemisphere, Nat. Clim. Change, 8, 954–963, https://doi.org/10.1029/2011GL048049, 2018.
Hersbach, H., Bell, B., Berrisford, P., Hirahara, S., Horányi, A., Muñoz-Sabater, J., et al.: The ERA5 global reanalysis, Q. J. Roy. Meteor. Soc., 146, 1999–2049, https://doi.org/10.1002/qj.3803, 2020.
Hock, R., Rasul, G., Adler, C., Cáceres, B., Gruber, S., Hirabayashi, Y., Jackson, M., Kääb, A., Kang, S., Kutuzov, S., Milner, A., Molau, U., Morin, S., Orlove, B., and Steltzer, H.: High Mountain Areas, in: IPCC Special Report on the Ocean and Cryosphere in a Changing Climate, edited by: Pörtner, H.-O., Roberts, D. C., Masson-Delmotte, V., Zhai, P., Tignor, M., Poloczanska, E., Mintenbeck, K., Alegría, A., Nicolai, M., Okem, A., Petzold, J., Rama, B., Weyer, N. M., https://www.ipcc.ch/srocc/chapter/chapter-2/ (last access: 9 September 2022), 2019.
Hong, M. and He S.: Spatial and Temporal Change of Rainfall in Nujiang Basin in Recent 50 Years, Res. Soil Water Conser., 26, 248–252, https://doi.org/10.13869/j.cnki.rswc.2019.03.036, 2019.
Huning, L. S. and AghaKouchak, A.: Global snow drought hot spots and characteristics, P. Natl. Acad. Sci. USA, 117, 19753–19759, https://doi.org/10.1073/pnas.1915921117, 2020.
Immerzeel, W. W., Lutz, A. F., Andrade, M., Bahl, A., Biemans, H., Bolch, T., Hyde, S., Brumby, S., Davies, B.J., Elmore, A. C., Emmer, A., Feng, M., Fernandez, A., Haritashya, U., Kargel, J. S., Koppes, M., Kraaijenbrink, P. D. A., Kulkarni, A. V., Mayewski, P. A., Nepal, S., Pacheco, P., Painter, T. H., Pellicciotti, F., Rajaram, H., Rupper, S., Sinisalo, A., Shrestha, A. B., Viviroli, D., Wada, Y., Xiao, C., Yao, T., and Baillie, J. E. M.: Importance and vulnerability of the world's water towers, Nature, 577, 364–369, https://doi.org/10.1038/s41586-019-1822-y, 2020.
Immerzeel, W. W., Van Beek, L. P., and Bierkens, M. F. P.: Climate change will affect the Asian water towers, Science, 328, 1382–1385, https://doi.org/10.1126/science.1183188, 2010.
IPCC, 2019: IPCC Special Report on the Ocean and Cryosphere in a Changing Climate, edited by: Pörtner, H.-O., Roberts, D. C., Masson-Delmotte, V., Zhai, P., Tignor, M., Poloczanska, E., Mintenbeck, K., Alegrie, A., Nicolai, M., Okem, A., Petzold, J., Rama, B., and Weyer, N. M., IPCC, https://www.ipcc.ch/report/srocc/ (last access: 9 September 2022), 2019.
Jarvis, A., Reuter, H. I., Nelson, A., and Guevara, E.: Hole-filled SRTM for the globe Version 4, available from the CGIAR-CSI SRTM 90m Database, [data set], http://srtm.csi.cgiar.org, (last access: 9 September 2022), 2008.
Jia, X., Zhang, C., Wu, R. G., and Qian, Q. F.: Influence of Tibetan Plateau autumn snow cover on interannual variations in spring precipitation over southern China, Clim. Dynam., 56, 767–782, https://doi.org/10.1007/s00382-020-05497-8, 2021.
Kraaijenbrink, P. D. A., Stigter, E. E., Yao, T. D., and Immerzeel, W. W.: Climate change decisive for Asia's snow meltwater supply, Nat. Clim. Chang., 1, 591–597, https://doi.org/10.1038/s41558-021-01074-x, 2021.
Khanal, S., Lutz, A. F., Kraaijenbrink, P. D. A., van den Hurk, B., Yao, T., and Immerzeel, W. W.: Variable 21st century climate change response for rivers in High Mountain Asia at seasonal to decadal time scales, Water Resour. Res., 57, e2020WR029266, https://doi.org/10.1029/2020WR029266, 2021.
Kapnick, S., Delworth, T., Ashfaq, M., Malyshev, S., and Milly, P. C. D.: Snowfall less sensitive to warming in Karakoram than in Himalayas due to a unique seasonal cycle, Nat. Geosci., 7, 834–840, https://doi.org/10.1038/ngeo2269, 2014.
Lange, S. and Büchner, M.: ISIMIP3b bias-adjusted atmospheric climate input data (v1.1). ISIMIP Repository, [data set], https://doi.org/10.48364/ISIMIP.842396.1 (last access: 9 September 2022), 2021.
Li, H., Li, X., Yang, D., Wang, J., Gao, B., Pan, X., Zhang, Y., and Hao, X.: Tracing snowmelt paths in an integrated hydrological model for understanding seasonal snowmelt contribution at basin scale, J. Geophys. Res.-Atmos., 124, 8874–8895, https://doi.org/10.1029/2019JD030760, 2019.
Li, W., Guo, W., Qiu, B., Xue, Y., Hu, P., and Wei, J.: Influence of Tibetan Plateau snow cover on East Asian atmospheric circulation at medium-range time scales, Nat. Commun., 9, 4243, https://doi.org/10.1038/s41467-018-06762-5, 2018.
Liang, S. L.: The Global Land Surface Satellite (GLASS) Product Suite, National Earth System Science Data Center, National Science & Technology Infrastructure of China, [data set], https://doi.org/10.12041/geodata.GLASS_LAI_MODIS(0.05D).ver1.db (last access: 9 September 2022), 2015.
Lutz, A., Immerzeel, W. W., Shrestha, A. B., and Bierkens, M. F. P.: Consistent increase in High Asia's runoff due to increasing glacier melt and precipitation, Nat. Clim. Change, 4, 587–592, https://doi.org/10.1038/nclimate2237, 2014.
Liu, S., Ding W., Mo X. G., Wang S., Liu C., Luo X., He D., Bajracharya, S. R., Shrestha, A., and Agrawal, N. K.: Climate Change and Its Impact on Runoff in Lancang and Nujiang River Basins, Adv. Clim. Change Res., 13, 356–365, 2017.
Luo, X., He, D. M., Ji, X. Lu, Y., and Li, Y.: Low Flow Variations in the Middle and Upper Nujiang River Basin and Possible Responds to Climate Change in Recent 50 Years, Acta Geogr. Sin., 36, 107–113, https//doi.org/10.13249/j.cnki.sgs.2016.01.013, 2016.
Liu, C., Bai, P., Wang, Z., Liu S., and Liu, X. M.: Study on prediction of ungaged basins case study on the Tibetan Platea, J. Hydra. Eng., 47, 272–282, https://doi.org/10.13243/j.cnki.slxb.20150925, 2016.
Liu, S., Yan, D., Wang, H., Qin, T., Wen, B., and Lu, Y.: Separation of snowfall from precipitation and its evolution trend and reasons analysis in upper reaches of Nujiang River Basin, J. Hydra. Eng., 49, 254–262, https//doi.org/10.13243/j.cnki.slxb.20160789, 2018.
Liu, W., Wang, L., Sun, F., Li, Z., Wang, H., Liu, J., Yang, T., Zhou, J., and Qi, J.: Snow hydrology in the upper Yellow River basin under climate change: A land surface modeling perspective. J. Geophys. Res-Atmos., 123, 12676–12691, https://doi.org/10.1029/2018JD028984, 2018.
Li, C., Su, F., Yang, D., Tong, K., Meng, F., and Kan, B.: Spatiotemporal variation of snow cover over the Tibetan Plateau based on MODIS snow product, 2001–2014, Int. J. Climatol., 38, 708–728, https://doi.org/10.1002/joc.5204, 2017.
Lange, S. and Büchner, M.: ISIMIP3b bias-adjusted atmospheric climate input data (v1.1), ISIMIP Repository, https://doi.org/10.48364/ISIMIP.842396.1, 2021a.
Lange, S.: Trend-preserving bias adjustment and statistical downscaling with ISIMIP3BASD (v1.0), Geosci. Model Dev., 12, 3055–3070, https://doi.org/10.5194/gmd-12-3055-2019, 2019.
Lange, S.: ISIMIP3BASD v2.5.0, Zenodo, https://doi.org/10.5281/zenodo.4686991, 2021b.
Lange, S., Menz, C., Gleixner, S., Cucchi, M., Weedon, G. P., Amici, A., Bellouin, N., Schmied, H. M., Hersbach, H., Buontempo, C., and Cagnazzo, C.: WFDE5 over land merged with ERA5 over the ocean (W5E5 v2.0), https://doi.org/10.48364/ISIMIP.342217, 2021c.
Muhammad, S.: Improved daily MODIS TERRA/AQUA Snow and Randolph Glacier Inventory (RGI6.0) data for High Mountain Asia (2002–2019), PANGAEA [data set], https://doi.org/10.1594/PANGAEA, (last access: 9 September 2022), 2020.
Musselman, K. N., Addor, N., Vano, J. A., and Molotch, N. P.: Winter melt trends portend widespread declines in snow water resources, Nat. Clim. Change, 11, 418–424, https://doi.org/10.1038/s41558-021-01014-9, 2021.
Mao, R. J., Wang, L., Zhou, J., Liu, X. P., Qi, J., and Zhong, X. Y.: Evaluation of Various Precipitation Products Using Ground-Based Discharge Observation at the Nujiang River Basin, China, Water, 11, 2308, https://doi.org/10.3390/w11112308, 2019.
Muhammad, S. and Thapa, A.: An improved Terra–Aqua MODIS snow cover and Randolph Glacier Inventory 6.0 combined product (MOYDGL06∗) for high-mountain Asia between 2002 and 2018, Earth Syst. Sci. Data, 12, 345–356, https://doi.org/10.5194/essd-12-345-2020, 2020.
Marty, C., Tilg, A., and Jonas, T.: Recent Evidence of Large-Scale Receding Snow Water Equivalents in the European Alps, J. Hydrometeorol., 18, 1021–1031, https://doi.org/10.1175/JHM-D-16-0188.1, 2017.
Nepal, S., Flügel, W. A., and Shrestha, A. B.: Upstream-downstream linkages of hydrological processes in the Himalayan region, Ecol. Proc., 3, 1–16, https://doi.org/10.1186/s13717-014-0019-4, 2014.
Nepal, S., Khatiwada, K. R., Pradhananga, S., Kralisch, S., Samyn, D., Bromand, M. T., Jamal, N., Dildar, M., Durrani, F., Rassouly F., Azizi, F., Salehi, W., Malikzooi, R., Krause, P., Koirala, S., and Chevallier, P.: Future snow projecteds in a small basin of the Western Himalaya, Sci. Total Environ., 795, 148587, https://doi.org/10.1016/j.scitotenv.2021.148587, 2021.
Pulliainen, J., Luojus, K., Derksen, C., Mudryk, L., Lemmetyinen, J., Salminen, M., Ikonen, J., Takala, M., Cohen, J., Smolander, T., and Norberg, J.: Patterns and trends of Northern Hemisphere snow mass from 1980 to 2018, Nature, 581, 294–298, https://doi.org/10.1038/s41586-020-2258-0, 2020.
Panday, P. K., Thibeault, J., and Frey, K. E.: Changing temperature and precipitation extremes in the Hindu Kush-Himalayan region: an analysis of CMIP3 and CMIP5 simulations and projecteds, Int. J. Climatol., 35, 3058–3077, https://doi.org/10.1002/joc.4192, 2015.
Qin, Y., Abatzoglou, J. T., Siebert, S., Huning, L. S., AghaKouchak, A., Mankin, J. S., Hong, C., Tong, D., Davis, S. J., and Mueller, N. D.: Agricultural risks from changing snowmelt, Nat. Clim. Change, 10, 459–465, https://doi.org/10.1038/s41558-020-0746-8, 2020.
Qi, J., Wang, L., Zhou, J., Song, L., Li, X. P., and Zeng, T.: Coupled Snow and Frozen Ground Physics Improves Cold Region Hydrological Simulations: An Evaluation at the upper Yangtze River Basin (Tibetan Plateau), J. Geophys. Res.-Atmos., 124, 12985–13004, https://doi.org/10.1029/2019JD031622, 2019.
Qi, W., Feng, L., Yang, H., and Liu, J.: Warming winter, drying spring and shifting hydrological regimes in Northeast China under climate change, J. Hydrol., 606, 127390, https://doi.org/10.1016/j.jhydrol.2021.127390, 2022.
Qi, W., Feng, L., Liu, J., and Yang, H.: Snow as an important natural reservoir for runoff and soil moisture in Northeast China. J. Geophys. Res.-Atmos., 125, e2020JD033086, https://doi.org/10.1029/2020JD033086, 2020.
Shrestha, M., Wang, L., Koike, T., Xue, Y., and Hirabayashi, Y.: Improving the snow physics of WEB-DHM and its point evaluation at the SnowMIP sites, Hydrol. Earth Syst. Sci., 14, 2577–2594, https://doi.org/10.5194/hess-14-2577-2010, 2010.
Shrestha, M., Wang, L., Koike, T., Tsutsui, H., Xue, Y., and Hirabayashi, Y.: Correcting basin-scale snowfall in a mountainous basin using a distributed snowmelt model and remote-sensing data, Hydrol. Earth Syst. Sci., 18, 747–761, https://doi.org/10.5194/hess-18-747-2014, 2014.
Sanjay, J., Krishnan, R., Shrestha, A. B., Rajbhandari, R., and Ren, G. Y.: Downscaled climate change projecteds for the Hindu Kush Himalayan region using CORDEX South Asia regional climate models, Adv. Clim. Change Res., 8, 185–198, https://doi.org/10.1016/j.accre.2017.08.003, 2017.
Su, F., Zhang L., Ou, T., Chen, D., Yao, T., and Tong, K.: Hydrological response to future climate changes for the major upstream river basins in the Tibetan Plateau, Global Planet. Change, 136, 82–95, https://doi.org/10.1016/j.gloplacha.2015.10.012, 2016.
Song, L., Wang, L., Li, X. P., Zhou, J., Luo, D. L., Jin, H. J., Qi, J., Zeng, T., and Yin, Y. Y.: Improving permafrost physics in a distributed cryosphere-hydrology model and its evaluations at the upper Yellow River Basin, J. Geophys. Res-Atmos., 125, e2020JD032916, https://doi.org/10.1029/2020JD032916, 2020.
Scherrer, S. C., Ceppi, P., Croci-Maspoli, M., and Appenzeller, C.: Snow-albedo feedback and Swiss spring temperature trends, Theor. Appl. Climatol., 110, 509–516, https://doi.org/10.1007/s00704-012-0712-0, 2012.
Sohrabi, M. M., Tonina, D., Benjankar, R.,Kumar, M., Kormos, P., Marks, D. and Luce, C.: On the role of spatial resolution on snow estimates using a process-based snow model across a range of climatology and elevation, Hydrol. Proc., 33, 1260–1275, https://doi.org/10.1002/hyp.13397, 2019.
Tang, Q. H., Cuo, L., Su, F. G., Liu, X. C., Sun, H., Ding, J., Wang, L., Leng, G. Y., Zhang, Y. Q., Sang, Y. F., Fang, H. Y., Zhang, S. F., Han, D. M., Liu, X. M., He, L., Xu, X. M., Tang, Y., and Chen, D. L.: Streamflow change on the Qinghai-Tibet Plateau and its impacts, Chin. Sci. Bull., 64, 2807–2821, https://doi.org/10.1360/TB-2019-0141, 2019.
Tang, Q. H., Liu, X. C., Zhou, Y. Y., Wang, J., and Yun, X. B.: Cascading Impacts of Asian Water Tower Change on Downstream Water Systems, Bull. Chin. Acad. Sci., 34, 1306–1312, https://doi.org/10.16418/j.issn.1000-3045.2019.11.013, 2019.
Viviroli, D., Kummu, M., Meybeck, M., Kallio, M., and Wada, Y.: Increasing dependence of lowland populations on mountain water resources, Nat. Sustain., 3, 917–928, https://doi.org/10.1038/s41893-020-0559-9, 2020.
Wan, Z.: New refinements and validation of the collection-6 MODIS land-surface temperature/emissivity product, Remote Sens. Environ., 140, 36–45, https://doi.org/10.1016/j.rse.2013.08.027, 2014.
Wan, Z., Hook, S., and Hulley, G.: MYD11A2 MODIS/Aqua Land Surface Temperature/Emissivity 8-Day L3 Global 1 km SIN Grid V006, NASA EOSDIS Land Processes DAAC [data set], https://doi.org/10.5067/MODIS/MYD11A2.006 (last access: 9 September 2022), 2015.
Wang, L., Sun, L. T., Shrestha, M., Li, X. P., Liu, W. B., Zhou, J., Yang, K., Lu, H., and Chen, D. L.: Improving snow process modeling with satellitebased estimation of near-surface-air-temperature lapse rate, J. Geophys. Res.-Atmos., 121, 12005–12030, https://doi.org/10.1002/2016JD025506, 2016.
Wang, L., Yao, T. D., Chai, C. H., Cuo, L., Su, F. G., Zhang, F., Yao, Z., Zhang, Y. S., Li, X. P., Qi, J., Hu, Z. D., Liu, J. S., and Wang, Y. W.: TP-River: Monitoring and Quantifying Total River Runoff from the Third Pole, B. Am. Meteorol. Soc., 102, 948–965, https://doi.org/10.1175/BAMS-D-20-0207.1, 2020.
Wang, L., Koike, T., Yang, K., Jackson, T. J., Bindlish, R., and Yang, D. Development of a distributed biosphere hydrological model and its evaluation with the Southern Great Plains Experiments (SGP97 and SGP99), J. Geophys. Res., 114, D08107, https://doi.org/10.1029/2008JD010800, 2009a.
Wang, L., Koike, T., Yang, K., and Yeh, J. F.: Assessment of a distributed biosphere hydrological model against streamflow and MODIS land surface temperature in the upper Tone River Basin, J. Hydrol., 377, 21–34, https://doi.org/10.1016/j.jhydrol.2009.08.005, 2009b.
Wang, L., Koike, T., Yang, K., Jin, R., and Li, H.: Frozen soil parameterization in a distributed biosphere hydrological model, Hydrol. Earth Syst. Sci., 14, 557–571, https://doi.org/10.5194/hess-14-557-2010, 2010.
Wang, L., Zhou, J., Qi, J., Sun, L., Yang, K., Tian, L., Lin, Y., Liu, W., Shrestha, M., Xue, Y., Koike, T., Ma, Y., Li, X., Chen, Y., Chen, D., Piao, S., and Lu, H.: Development of a land surface model with coupled snow and frozen soil physics, Water Resour. Res., 53, 5085–5103, https://doi.org/10.1002/2017WR020451, 2017.
Winstral, A., Marks, D., and Gurney, R: Assessing the Sensitivities of a Distributed Snow Model to Forcing Data Resolution, J. Hydrometeorol., 15, 1366–1383, https://doi.org/10.1175/JHM-D-13-0169.1, 2014.
Xiao, L., Che, T., Chen, L., Xie, H., and Dai, L.: Quantifying Snow Albedo Radiative Forcing and Its Feedback during 2003–2016, Remote Sens., 9, 883, https://doi.org/10.3390/rs9090883, 2017.
Xu, W., Ma, L., Ma, M., Zhang, H., and Yuan, W.: Spatial-temporal variability of snow cover and depth in the Qinghai-Tibetan Plateau, J. Climate, 30, 1521–1533, https://doi.org/10.1175/JCLI-D-15-0732.1, 2017.
Xiao, Z., Liang, S., Wang, J., Chen, P., Yin, X., Zhang, L., and Song, J.: Use of general regression neural networks for generating the GLASS Leaf Area Index Product from Time Series MODIS Surface Reflectance, IEEE T. Geosci. Remote, 52, 209–223, https://doi.org/10.1109/TGRS.2013.2237780, 2014.
Xue, B., Wang, L., Yang, K., Tian, L., Qin, J., Chen, Y., Zhao, L., Ma, Y., Koike, T., Hu, Z., and Li, X.: Modeling the land surface water and energy cycles of a mesoscale watershed in the central Tibetan Plateau during summer with a distributed hydrological model, J. Geophys. Res.-Atmos, 118, 8857–8868, https://doi.org/10.1002/jgrd.50696, 2013.
Yan, D., Ma, N., and Zhang, Y.: Development of a fine-resolution snow depth product based on the snow cover probability for the Tibetan Plateau: Validation and spatial-temporal analyses, J. Hydrol., 604, 127027, https://doi.org/10.1016/j.jhydrol.2021.127027, 2022.
You, Q., Wu, T., Shen, L., Pepin, N., Zhang, L., Jiang, Z., Wu, Z., Kang, S., and AghaKouchak, A.: Review of snow cover variation over the Tibetan Plateau and its influence on the broad climate system, Earth-Sci. Rev., 201, 103043, https://doi.org/10.1016/j.earscirev.2019.103043, 2020.
Yao, T., Xue, Y., Chen, D., Chen, F., Thompson, L., Cui, P., Koike, T., Lau, W. K., Lettenmaier, D., Mosbrugger, V., Zhang, R., Xu, B., Dozier, J., Gillespie, T., Gu, Y., Kang, S., Piao, S., Sugimoto, S., Ueno, K., Wang, L., Wang, W., Zhang, F., Sheng, Y., Guo, W., Yang, X., Ma, Y., Shen, S. S. P., Su, Z., Chen, F., Liang, S., Liu, Y., Singh, V. P., Yang, K., Yang, D., Zhao, X., Qian, Y., Zhang, Y., and Li, Q.: Recent Third Pole's rapid warming accompanies cryospheric melt and water cycle intensification and interactions between monsoon and environment: Multidisciplinary approach with observations, modeling, and analysis, B. Am. Meteorol. Soc., 100, 423–444, https://doi.org/10.1175/BAMS-D-17-0057.1, 2019.
Yao, T., Wu, G., Xu, B., Wang, W., Gao, J., and An, B.: Asian Water Tower Change and Its Impacts, Bull. Chin. Acad. Sci., 34, 1203–1209, https://doi.org/10.16418/j.issn.1000-3045.2019.11.003, 2019.
Yao, Z., Duan, R., and Liu, Z.: Changes in Precipitation and Air Temperature and Its Impacts on Runoff in the Nujiang River basin, Resour. Sci., 34, 202–210, 2012.
You, W., Wu, X., and Guo, Z.: Transboundary flow change features of the Nujiang river in the longitudinal range gorge region, Mount. Res., 26, 22–28, https://doi.org/10.3969/j.issn.1008-2786.2008.01.005, 2008.
Yang, K. and He, J.: China meteorological forcing dataset (1979–2018), National Tibetan Plateau Data Center, [data set], https://doi.org/10.11888/AtmosphericPhysics.tpe.249369.file, (last access: 9 September 2022), 2019.
Yang, F., Lu, H., Yang, K., Huang, G., Li, Y., Wang, W., Lu, P., Tian, F., and Huang, Y.: Hydrological characteristics and changes in the Nu-Salween River basin revealed with model-based reconstructed data, J. Mt. Sci., 18, 2982–3002, https://doi.org/10.1007/s11629-021-6727-1, 2021.
Yang, Y., Wen, B., Yan, Y., Niu, Y., Dai, Y., Li, M., and Gong, X.: Partitioning the contributions of cryospheric change to the increase of streamflow on the Nu river, J. Hydrol., 598, 126330, https://doi.org/10.1016/j.jhydrol.2021.126330, 2021.
Zhao, Q., Wang, J., Gao, H., Zhang, S., Zhao, C., Xu, J., Han, H., and Shangguan D.: Projecting climate change impacts on hydrological processes on the Tibetan Plateau with model calibration against the glacier inventory data and observed streamflow, J. Hydrol., 573, 60–81, https://doi.org/10.1016/j.jhydrol.2019.03.043, 2019.
Zhang, W., Xiao, Z., Zheng, J., and Ren, J.: Long-term variation characteristics of Nujiang River discharge and its response to climate change, Chin. Sci. Bull., 52, 135–141, https://doi.org/10.1007/s11434-007-7019-z, 2007.
Zhong, X., Wang, L., Zhou, J., Li, X., and Wang, Y.: Precipitation Dominates Long-Term Water Storage Changes in Nam Co Lake (Tibetan Plateau) Accompanied by Intensified Cryosphere Melts Revealed by a Basin-Wide Hydrological Modelling, Remote Sens-Base, 12, 1926, https://doi.org/10.3390/rs12121926, 2020.
Zhou, J., Wang, L., Zhong, X., Yao, T., Qi, J., Wang, Y., and Xue, Y.: Quantifying the major drivers for the expanding lakes in the interior Tibetan Plateau, Sci. Bull., 67, 474–478, https://doi.org/10.1016/j.scib.2021.11.010, 2021.