the Creative Commons Attribution 4.0 License.
the Creative Commons Attribution 4.0 License.
 | 14 Sep 2022
Characterizing basin-scale precipitation gradients in the Third Pole region using a high-resolution atmospheric simulation-based dataset
Yaozhi Jiang
Hua Yang
Yingying Chen
Jing Sun
Yuan Yang
Yan Wang
Altitudinal precipitation gradient plays an important role in the interpolation of precipitation in the Third Pole (TP) region, where the topography is very complex but in situ data are very sparse. This study proves that the altitude dependence of precipitation in the TP can be reasonably reproduced by a high-resolution atmospheric simulation-based dataset called ERA5_CNN. The precipitation gradients, including both absolute (APGs) and relative gradients (RPGs), for 388 sub-basins of the TP above 2500 m a.s.l. are calculated based on the ERA5_CNN. Results show that most sub-basins have positive precipitation gradients, and negative gradients are mainly found along the Himalayas, the Hengduan Mountains and the western Kunlun. The annual APG and RPG averaged across all sub-basins of the TP are 0.05 mm d−1 × 100 m−1 and 4.25 % × 100 m−1, respectively. The values of the APG are large in wet seasons but small in dry seasons, while the RPG shows opposite variations. Further analyses demonstrate that the RPGs have negative correlations with relative humidity but positive correlations with wind speed, likely because dry air tends to reach saturation at high altitudes, while stronger wind can bring more humid air to high altitudes. In addition, we find that precipitation gradients tend to be positive at small spatial scales compared to those at large scales, mainly because local topography plays a vital role in determining precipitation distribution at small scales. These findings on the spatiotemporal variations of precipitation gradients provide useful information for interpolating precipitation in the TP region.
- Article
(5224 KB) - Full-text XML
-
Supplement
(646 KB) - BibTeX
- EndNote


Gridded precipitation is a key input for many hydrological and ecological models when applied to regional studies. Typically, the spatial distribution of precipitation in a region can be obtained by interpolating the in situ data. In regions with flat terrain and dense rain gauge networks, different interpolation methods (e.g. Thiessen polygons, inverse distance weighting, kriging) can result in similar distributions of precipitation. In mountainous regions, precipitation has great spatial heterogeneity, and sparse rain gauges with limited spatial representativeness make the interpolation of precipitation challenging in these regions. Relations between precipitation and other environmental factors (e.g. topography and vegetation) play an important role in the interpolation of precipitation, especially in mountainous regions. Among the many environmental factors, altitude has a significant impact on the distribution of precipitation. Several widely used interpolation models have taken altitude as a covariant, such as PRISM (Daly et al., 1997) and ANUSPLIN (Hutchinson, 1991). Therefore, quantifying the precipitation gradient is greatly important in mountainous regions.
As the main source of many large rivers in Asia, the Third Pole (TP) is a typical mountainous region in the world characterized by complex terrain and high altitude. Rain gauges in the TP are sparse and usually located in lowland areas, where the weather conditions are much different from those at high altitudes (Chen et al., 2012; Daly et al., 2002). Therefore, interpolating in situ data to data-sparse high altitudes is essential for hydrometeorological studies in this region, as reported in many previous studies that take the precipitation gradient into account in hydrological modelling results in better simulations (Immerzeel et al., 2014; Wang et al., 2018b; Zhang et al., 2015). Currently, studies on the altitude dependence of precipitation are mostly in the eastern TP (Cuo and Zhang, 2017; Guo et al., 2016) and some sub-regions, such as the Himalayas (Ouyang et al., 2020; Salerno et al., 2015; Yang et al., 2018), the Qilian Mountains (Chen et al., 2018; Wang et al., 2018a), the Yarlung Tsangpo River basin (Sun and Su, 2020) and the Hengduan Mountains (Yu et al., 2018). Moreover, the altitudinal precipitation gradients obtained in these studies are usually based on rain gauge data, which may misrepresent the precipitation gradient due to the poor representativeness of rain gauges. For most parts of the TP, particularly the central and western TP, the precipitation gradient remains unknown. In addition, the precipitation gradient may vary with different seasons and years due to the changes in weather and meteorological conditions, and the temporal variability of the precipitation gradient in the TP has not been investigated yet.
In previous studies, satellite precipitation products have also been used to calculate the precipitation gradient in the TP (Liu et al., 2011). However, satellite products tend to contain large uncertainties and are less accurate in complex-terrain regions (Derin and Yilmaz, 2014; Henn et al., 2018; Shen et al., 2014; Xu et al., 2017). In the western TP, where solid precipitation dominates, the satellite products cannot reproduce the actual spatial variability of precipitation (Li et al., 2020). Therefore, obtaining the precipitation gradient based on satellite products seems to be undesirable in these regions.
Recently, high-resolution atmospheric simulations have made great progress in the TP and its surroundings, and many atmospheric simulation-based precipitation datasets have been arising (Maussion et al., 2014; Pan et al., 2012; Y. Wang et al., 2020; Zhou et al., 2021). The atmospheric simulations are constrained by a set of physical processes and thus can well represent the influence of topography on precipitation distribution when integrated with high resolution (Lundquist et al., 2019; Y. Wang et al., 2018). Previous studies have demonstrated the potential of atmospheric simulations (especially convective-permitting simulations) in capturing the spatial variability of precipitation in the TP. For example, Zhou et al. (2021) found that the dynamically downscaled precipitation of ∼ 3 km horizontal resolution has high correlations with observations in the TP. Gao et al. (2020) found that a convective-permitting simulation could better reproduce the precipitation distribution and further result in better snow cover simulation than satellite-based products in the southeastern TP. Similar results were also reported in the Himalayas (Collier and Immerzeel, 2015; Ouyang et al., 2021) and western TP (Pritchard et al., 2019). These studies indicate that high-resolution atmospheric simulations can be alternative sources for obtaining the precipitation gradient in the TP, particularly in regions like the western TP with almost no rain gauges located.
Therefore, the main objective of this study is to obtain the altitudinal precipitation gradient for different sub-basins of the TP based on a high-resolution atmospheric simulation-based dataset, which can be used for assisting interpolation of in situ data, especially in regions where rain gauges are sparse. In addition, some studies observed remarkable seasonal variations in precipitation gradient (Li and Fu, 1984; Putkonen, 2004; Wulf et al., 2010; Zhao et al., 2011), which implies that precipitation gradient can be related to weather conditions. However, very limited work has been done to investigate their relationships. Therefore, this study also investigates the relations between precipitation gradients and two meteorological factors (i.e. humidity and wind speed) to explore whether these factors can provide potential auxiliary information for adjusting the precipitation gradient in a region.
2.1 Precipitation datasets
The dataset used to quantify the precipitation gradients is produced by Jiang et al. (2021). It covers the whole TP and is generated by combining the ERA5 reanalysis (Hersbach et al., 2020) with the high-resolution simulated precipitation produced by Zhou et al. (2021). Three main steps are involved in producing this dataset. First, a short-term high-resolution WRF (Weather Research and Forecasting Model; Skamarock et al., 2008) simulation with a horizontal resolution of ∘ is conducted, and the short-term simulation covers 2 representative years (2013 and 2018). Second, the precipitation from ERA5 is corrected with the high-resolution simulated precipitation using a CDF (cumulative distribution function) matching method. Third, the high-resolution simulation is resampled to the spatial resolution of ERA5, and a convolutional neural-network-based model is trained using the resampled precipitation as the input and the original high-resolution simulated precipitation as the target, and then the corrected ERA5 precipitation is downscaled to a resolution of ∘ using the trained model. This downscaled precipitation shows similar performance in describing the spatial variability of precipitation in the WRF simulations produced by Zhou et al. (2021), while it has a wide temporal coverage spanning 39 years from 1980 to 2018, which allows us to investigate the interannual variations of precipitation gradients in the TP. For convenience, this downscaled precipitation is called ERA5_CNN hereafter. Previous evaluation of this dataset showed that it is skilful in reflecting spatial variability of precipitation, and its bias has been much reduced compared to other analysis data. Nevertheless, it still overestimates the precipitation amount in the TP (Jiang et al., 2021).
This study also investigates the performance of IMERG (Integrated Multi-satellite Retrievals for Global Precipitation Measurement; Huffman et al., 2019) and HAR V2 (High Asia Refined Analysis version 2; X. Wang et al., 2020) in reflecting the altitude dependence of precipitation and compares it to that from ERA5_CNN. IMERG is the latest generation of global satellite-based precipitation products. The final run version of IMERG V06 with a horizontal resolution of 0.1∘ is used in this study, which has applied gauge observations to correct the satellite estimates. HAR V2 is produced by dynamically downscaling the ERA5 reanalysis using the WRF model. It also covers the whole TP but has a coarser horizontal resolution (10 km) than ERA5_CNN.
Observations from six rain gauge networks are used in this study. Five rain gauge networks with relatively high density but covering small sub-regions of the TP are used to validate the altitude dependence of precipitation in these gridded datasets at small spatial scales. Details about the five rain gauge networks are given in Table 1 and their distributions are shown in Fig. 1. In addition, the network from the CMA (China Meteorological Administration) is also used in this study, which covers a large area of the TP but has scarce gauge density. Therefore, this network is used for quantifying the bias in ERA5_CNN in the TP.
Table 1Basic information about the six rain gauge networks used in this study.
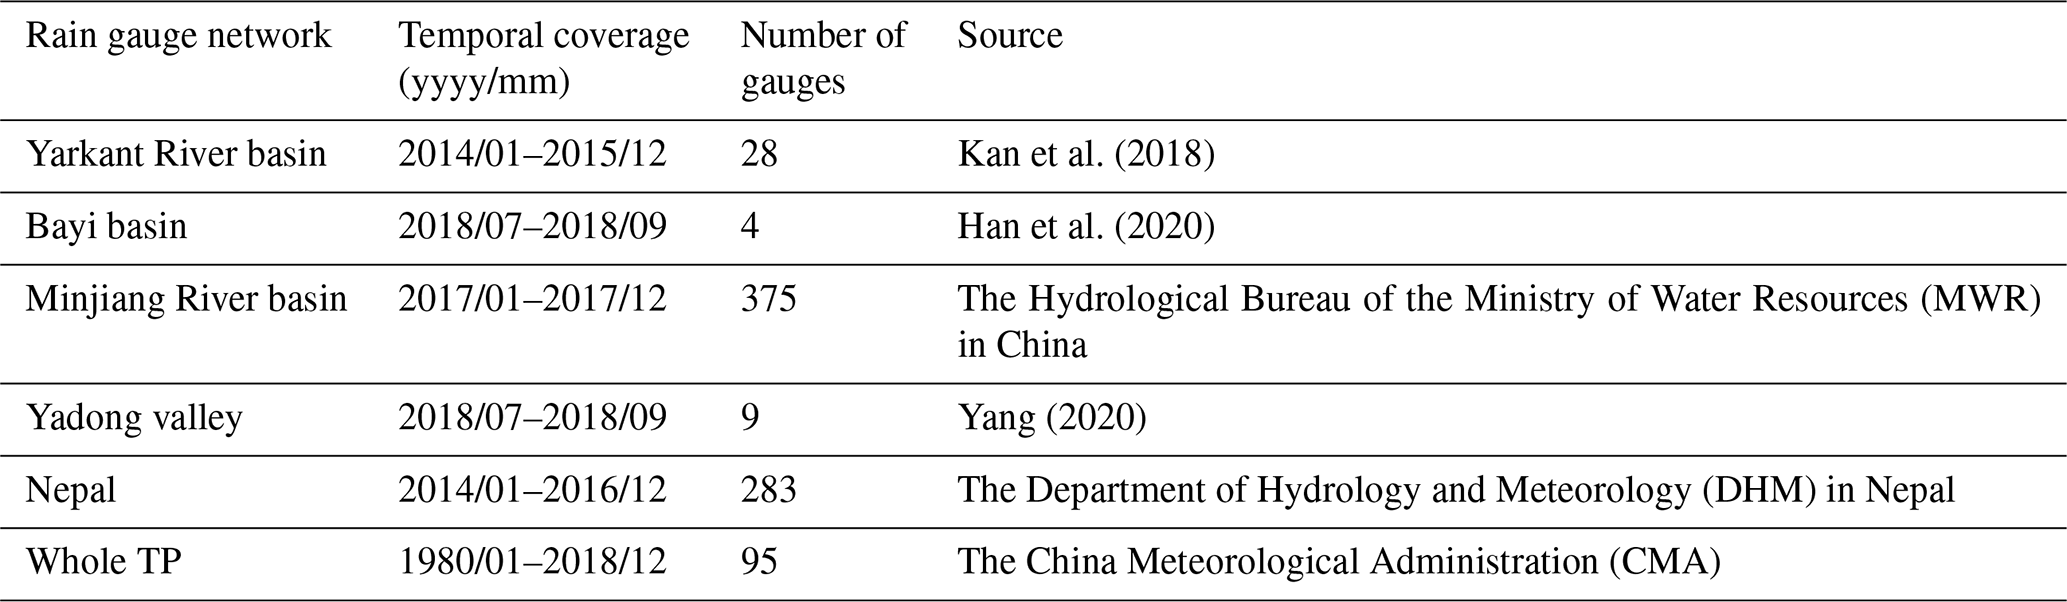
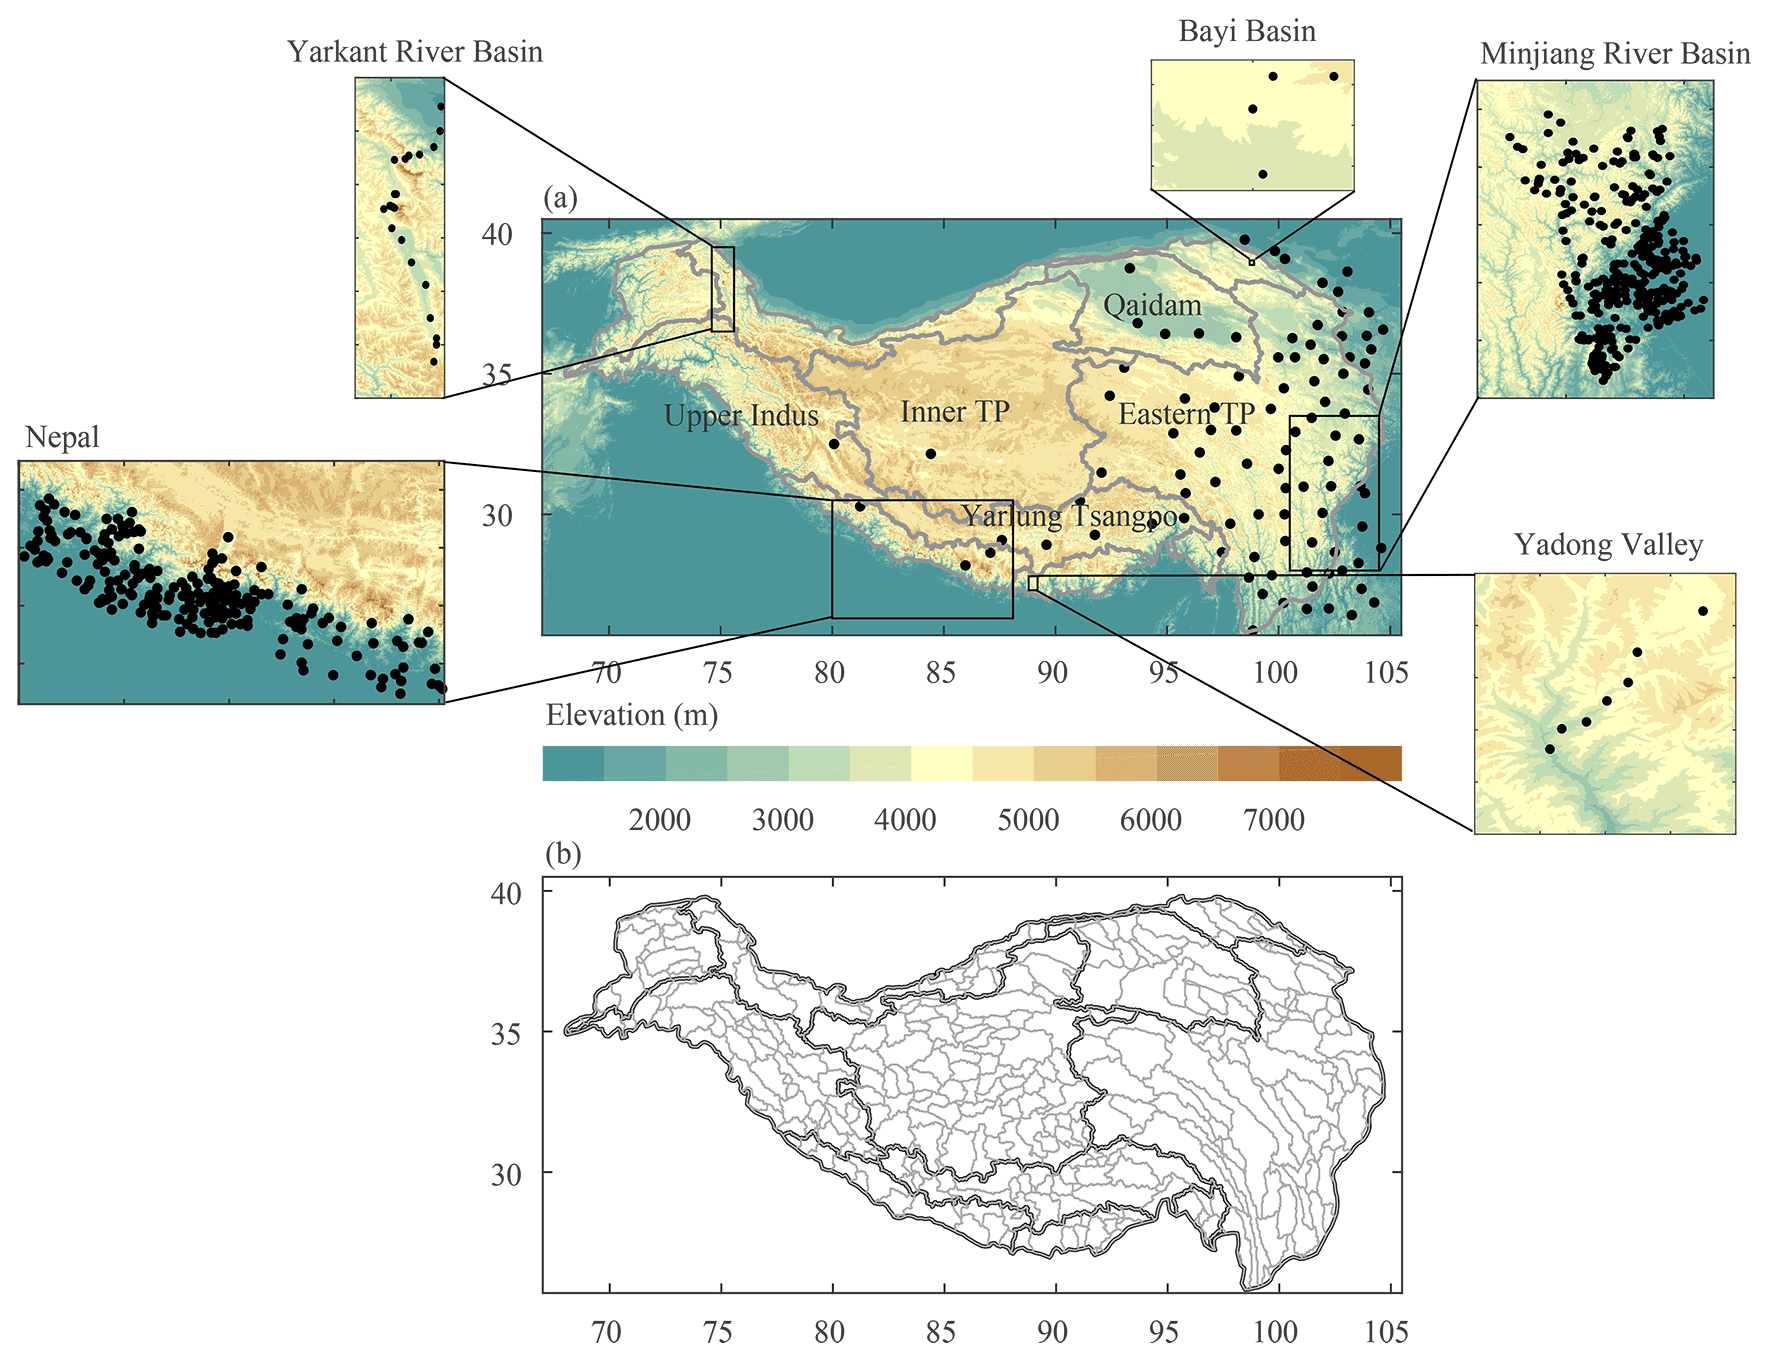
Figure 1(a) Topography of the Third Pole (TP) region and the boundaries of five sub-regions of the TP, along with the distribution of the five rain gauge networks. The black points represent the rain gauges. (b) The boundaries of the 388 sub-basins in the TP. Fig. 1b shows the area above 2500 m a.s.l. The boundaries of the TP and the five sub-regions are derived from Zhang (2019).
2.2 Other datasets
The elevation data used in this study are from the NASA Shuttle Radar Topographic Mission (SRTM), which provides global digital elevation model (DEM) data at a resolution of 90 m. The 90 m DEM is resampled to ∘ by averaging the elevations of all 90 m grids within a ∘ grid to match the horizontal resolution of the precipitation data.
The ERA5 reanalysis data of near-surface humidity and wind speed are also used to explore the relations between precipitation gradients and meteorological factors.
The precipitation gradients are calculated based on a linear regression between precipitation and altitudes, which can be expressed as follows:
where P is average precipitation (mm d−1) for a specific period, H is altitude (100 m), a is the absolute precipitation gradient (APG; mm d−1 × 100 m−1) within a specific region, and b is the intercept of the regression equation. In this study, the regression equation is fitted in 388 sub-basins of the TP above the 2500 m a.s.l. contour. The geometries of the 388 sub-basins (shown in Fig. 1b) are obtained from the HydroATLAS database (Linke et al., 2019), which provides 12 nested levels of sub-basins for the global one. The level-6 sub-basins are applied in this study and these sub-basins have areas ranging from 2.91 km2 to 120 135.00 km2. The relatively small sizes of these sub-basins can ensure that the grids used to fit the equations are dominated by similar prevailing winds. Moreover, the basin-scale precipitation gradient is easier to be applied for hydrological applications than the gridded precipitation gradient. The value of the precipitation gradient for a sub-basin is given only when the following three principles are met.
-
The number of grids within the sub-basin should not be less than 10.
-
The standard deviation of altitude within the sub-basin should not be less than 50 m.
-
The p value of the Student's t test for the regression equation should be less than 0.05.
Although the ERA5_CNN shows good performance in representing the spatial variability of precipitation, it has a systematic bias in the TP (Jiang et al., 2021). Therefore, the relative precipitation gradient (RPG, % × 100 m−1) is also presented in this study. The RPG is calculated as follows:
where a is the absolute precipitation gradient from Eq. (1) and is the basin-average precipitation. To calculate the RPG, should be greater than 0.1 mm d−1.
To quantify the bias of ERA5_CNN, both absolute bias (Abias) and relative bias (Rbias) are used in this study, calculated as follows.
where Mi and Oi are the precipitation from ERA5_CNN and in situ data, respectively, and n is the number of samples.
In addition, the coefficient of variation (CV) is used to quantify the spatiotemporal variability of variables, which is defined as follows in this study:
where σ and |μ| are the standard deviation and absolute mean of a series of samples, respectively. The CV is dimensionless. The closer the CV value is to zero, the smaller the dispersion is.
4.1 Validation of the altitude dependence of precipitation
The altitude dependence of precipitation from ERA5_CNN is compared to that from rain gauge data in the five networks mentioned in Sect. 2.1. For comparison, the altitude dependences of precipitation from two widely used precipitation datasets, i.e. IMERG and HAR V2, are also investigated.
In the Yarkant River basin (Fig. 2a), all datasets reproduce the observed local precipitation maxima at 2400–2800 m a.s.l. Nevertheless, remarkable differences exist in these datasets. HAR V2 has the highest spatial correlation (0.93) with rain gauge data but presents a sharp precipitation gradient above 4000 m a.s.l. ERA5_CNN also shows a similar altitude dependence of precipitation to gauge data but yields another local precipitation maximum at 1600–2000 m a.s.l., leading to a smaller correlation of 0.67. IMERG slowly changes with altitude with the lowest correlation of 0.22.
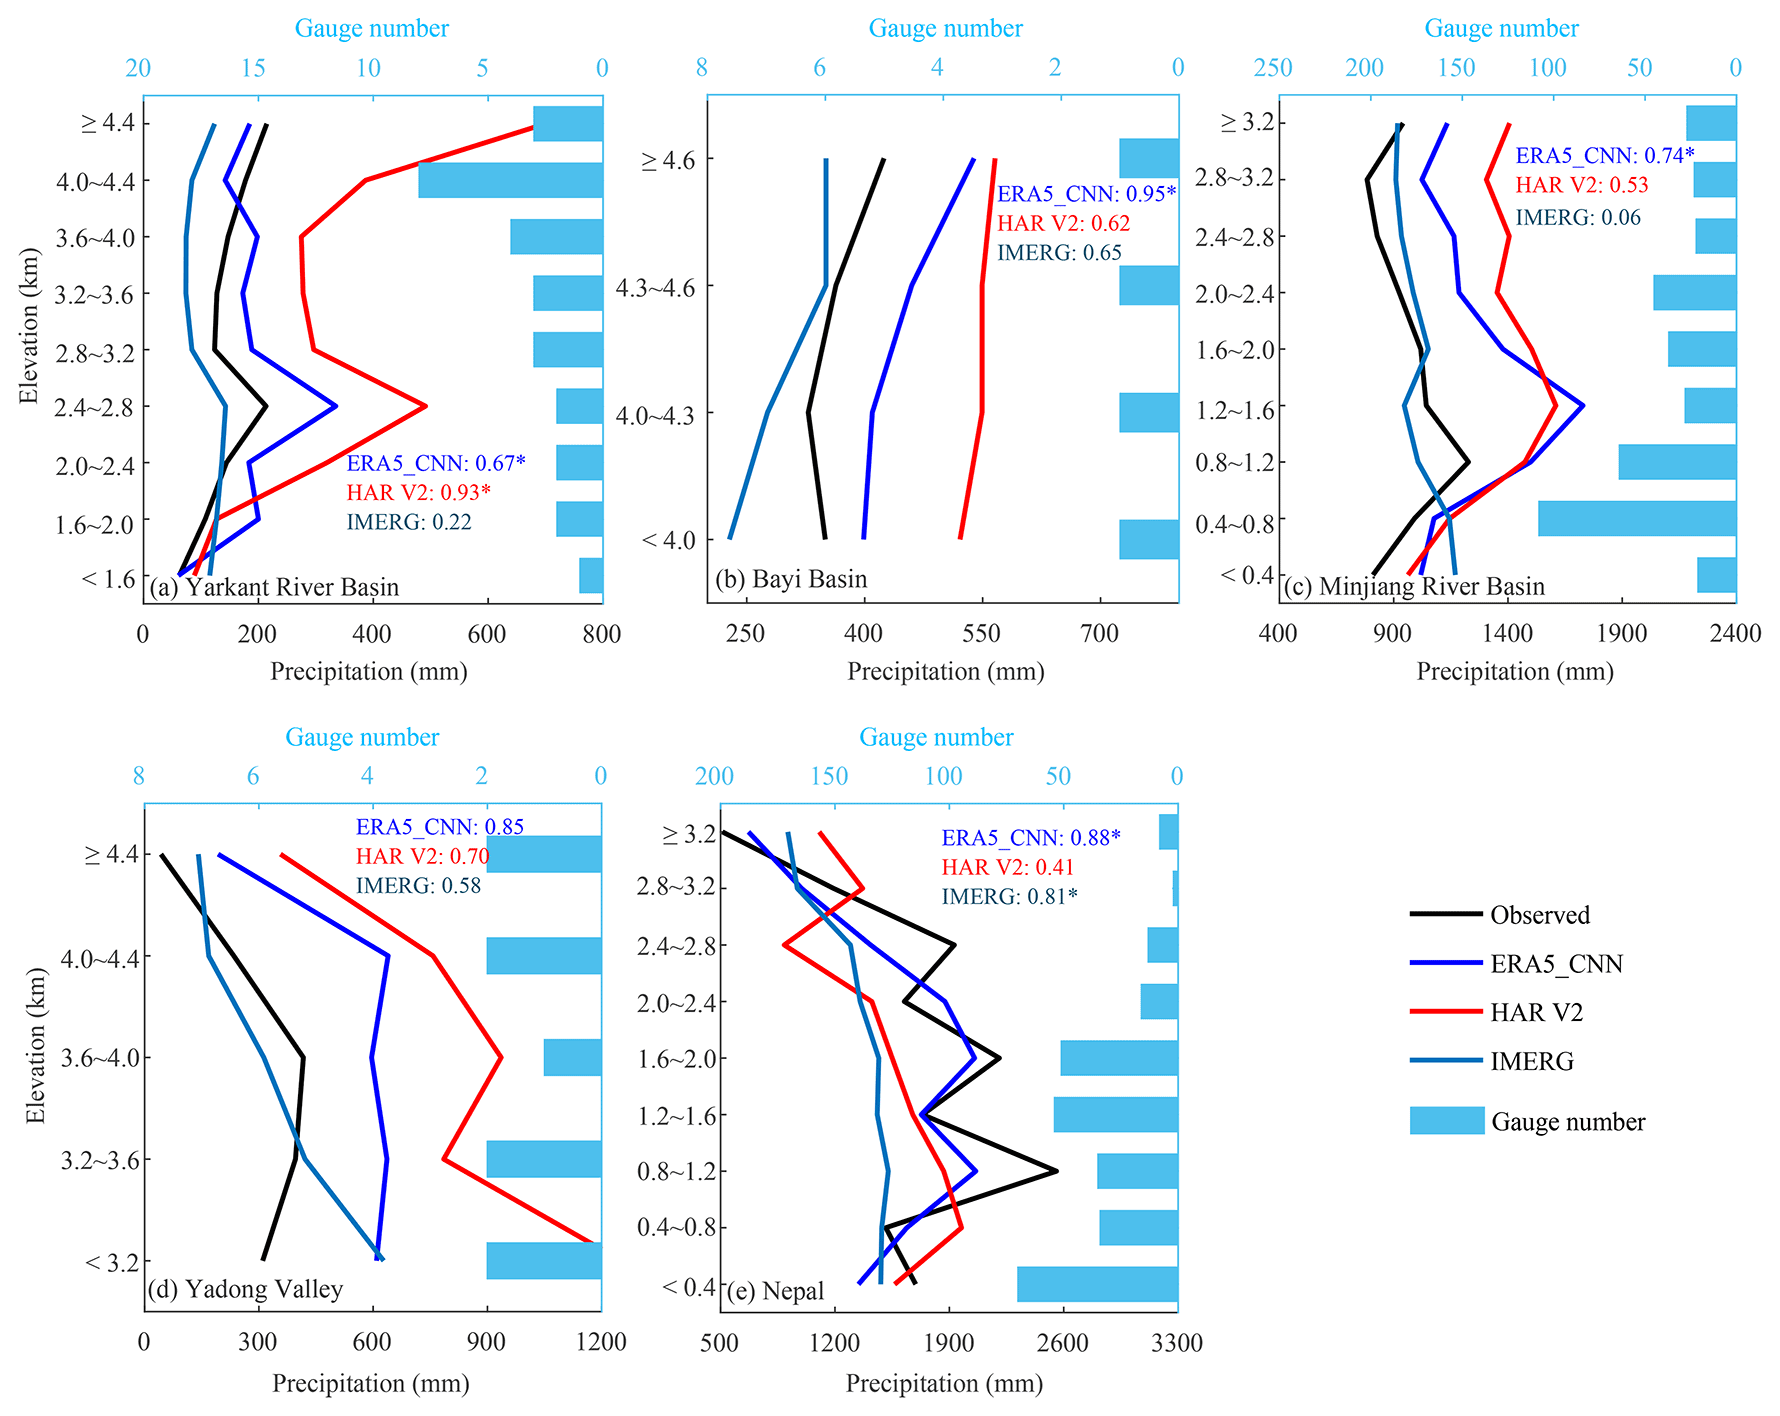
Figure 2Comparison between the altitude dependence of precipitation from ERA5_CNN, IMERG and HAR V2 and that from rain gauge data in five networks. The lines show the average precipitation amount in each altitude zone and the bars denote the number of rain gauges in each zone. The numbers in the figures give the spatial correlations of the precipitation amount between the rain gauge data and precipitation products. The “*” represents the correlation that is significant at the 95 % confidence level.
In the Bayi basin (Fig. 2b), ERA5_CNN shows the most consistent pattern with rain gauge data with a correlation of 0.95, although it generally overestimates precipitation. In terms of the other two datasets, precipitation from IMERG decreases with altitude above 4600 m a.s.l., while precipitation from HAR V2 has a similar magnitude at all altitudes.
In the Minjiang River basin, Fig. 2c shows that precipitation from rain gauge data increases with altitude below 1200 m a.s.l., then decreases with altitude between 1200 and 3200 m a.s.l., and then rises again above 3200 m a.s.l. ERA5_CNN overestimates precipitation in this basin, but it shows the most similar altitude dependence to rain gauge data and has the highest correlation of 0.74. HAR V2 also generally reproduces the observed pattern but changes slowly with altitude above 1600 m a.s.l, yielding a smaller correlation of 0.53. However, precipitation from IMERG changes little with altitudes in the Minjiang River basin.
In the Yadong valley (Fig. 2d), ERA5_CNN firstly increases slowly and then decreases sharply with altitude and has a spatial correlation of 0.85 with gauge data, although it has a higher altitude of precipitation maximum than rain gauge data. Precipitation from HAR V2 also shows a similar pattern to that of rain gauge data above 3600 m a.s.l. but a different pattern below 3600 m a.s.l. In contrast, the altitude dependence of precipitation from IMERG is opposite to the observed one in the Yadong valley.
In Nepal (Fig. 2e), the precipitation amount from rain gauge data shows large fluctuations among different altitude bands. Generally, it increases with altitude below 2000 m a.s.l. and then decreases beyond this altitude level. It can be found that ERA5_CNN can better represent the altitude dependence of observed precipitation than the other two products (the spatial correlations with gauge data for ERA5_CNN, HAR V2 and IMERG are 0.88, 0.41 and 0.81, respectively), particularly in reproducing the great fluctuation of precipitation.
Overall, the high-resolution atmospheric simulation-based ERA5_CNN can reasonably represent the altitude dependence of precipitation in the TP and generally shows better performance than the widely used IMERG and HAR V2. Therefore, it is used to quantify the spatial and temporal variability of RPGs in the TP.
4.2 Spatial patterns of precipitation gradients
Figure 3a shows the spatial distribution of the correlations between annual average precipitation from 1980 to 2018 and altitudes in each sub-basin. As shown in Fig. 3a, there are strong correlations between precipitation and altitude in many sub-basins, with absolute correlations larger than 0.50 in about 55 % of the sub-basins, and the correlations are significant at the 95 % confidence level in most sub-basins. Therefore, it is feasible to interpolate precipitation based on precipitation gradients in the TP.
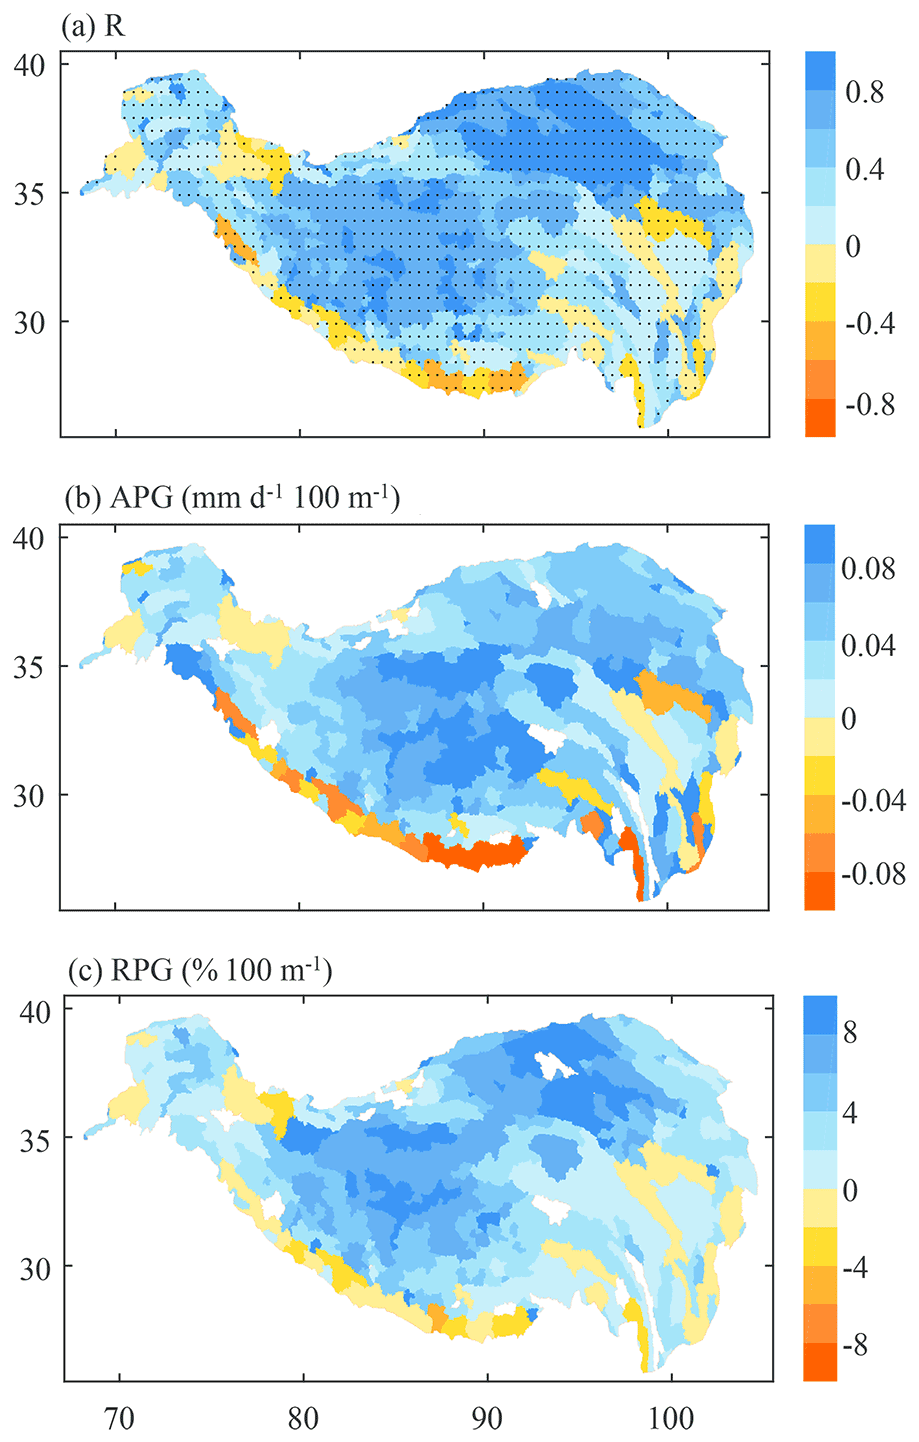
Figure 3Spatial distribution of (a) correlations between the annual average precipitation and altitude for all grids within each basin, (b) absolute precipitation gradients (APGs, precipitation change per 100 m altitude difference) and (c) relative precipitation gradients (RPGs, APGs divided by basin-average precipitation). The APGs and RPGs are calculated based on annual precipitation averaged from 1980 to 2018. The dots in Fig. 3a represent the correlations significant at the 95 % confidence level. In Fig. 3b and c, the sub-basins with weak relationships between precipitation and altitude or no data value of RPG are filled with white.
Generally, at the annual scale, most sub-basins (about 81 % of the total) in the TP have a positive APG, and the sub-basins with negative APGs are mainly distributed in the Himalayas, the Hengduan Mountains on the eastern edge of the TP and the western Kunlun in the north-western TP, resulting in an average APG across all the sub-basins of 0.05 mm d−1 × 100 m−1. As shown in Fig. 3b and Table 2, a large positive APG mainly occurs in the inner TP, with an average value of 0.07 mm d−1 × 100 m−1, followed by the eastern TP (covering the Yellow, Yangtze, Lancang and Nu River basins) (0.06 mm d−1 × 100 m−1), the Yarlung Tsangpo River basin and the Qaidam basin (0.05 mm d−1 × 100 m−1), and the upper Indus has the smallest APG of 0.04 mm d−1 × 100 m−1. In some specific regions, such as the Qilian Mountains (Wang et al., 2009; Han et al., 2020) and some small basins in the southern TP (Wang et al., 2018b; Zeng et al., 2021; Zhang et al., 2015), where the observed precipitation generally increases with altitude, our study reports consistent results. Notably, most sub-basins along the Himalayas show large negative APGs. This is also consistent with previous studies (Andermann et al., 2011; Bookhagen and Burbank, 2006; Chen et al., 2020; Salerno et al., 2015; Tang et al., 2018), which have demonstrated that there is a shape decrease in precipitation above 2500 m a.s.l. in this region.
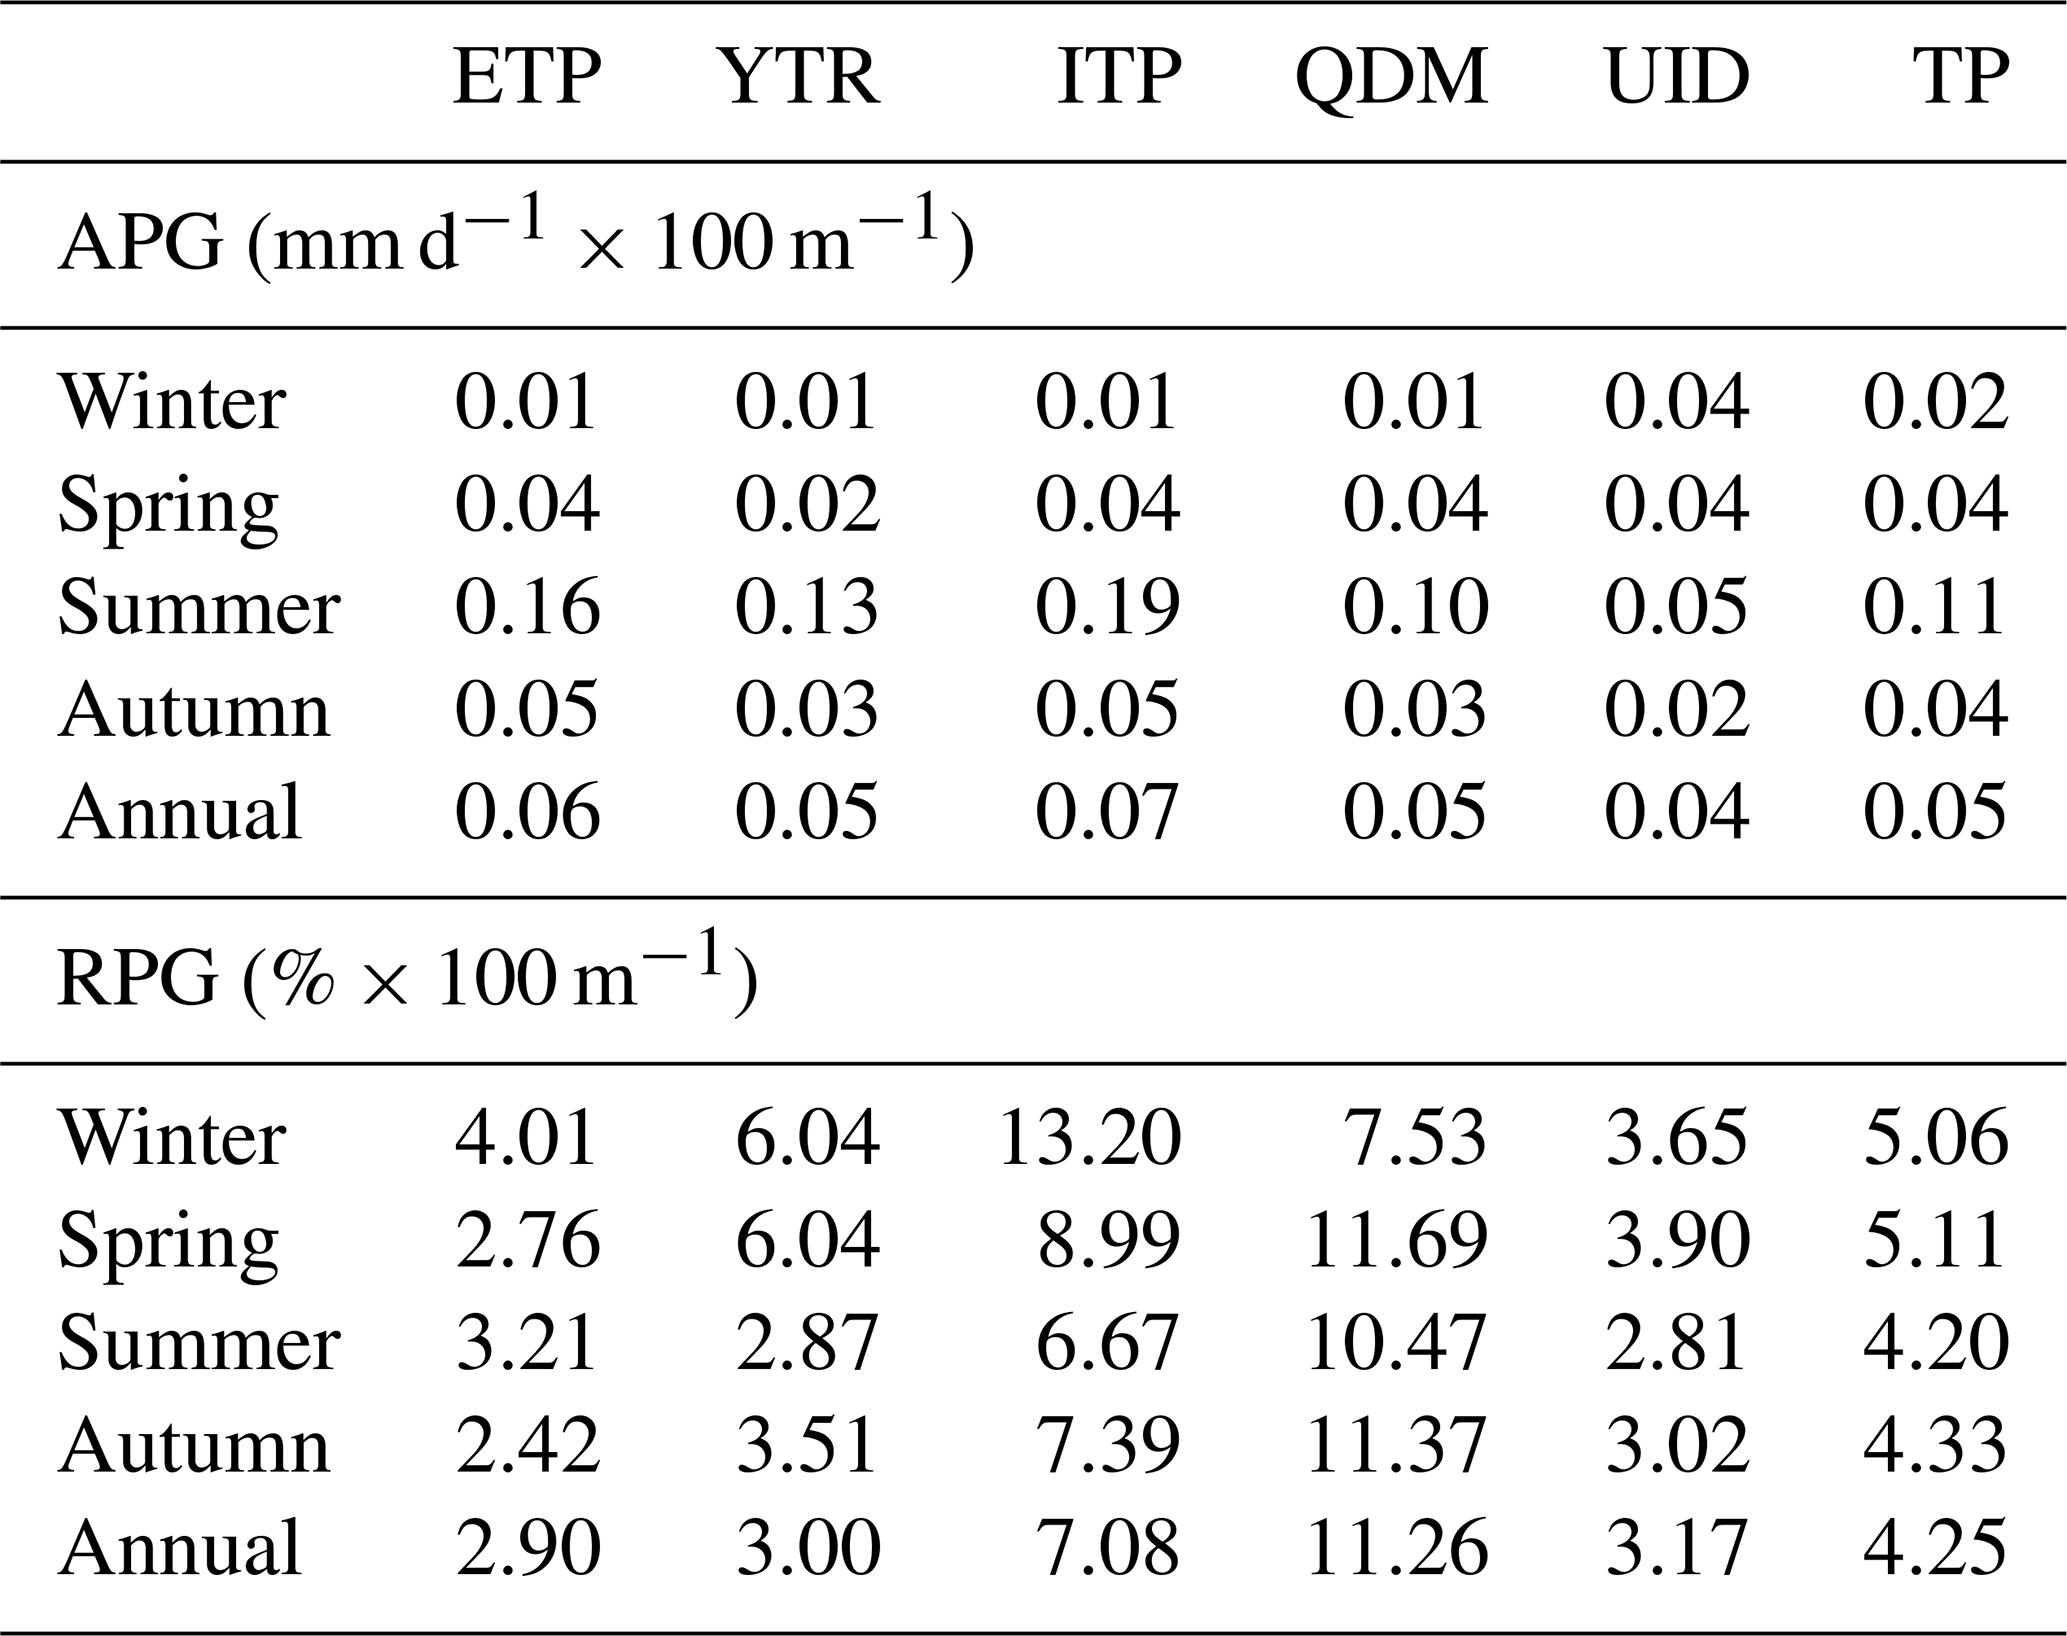
Table 2The APG and RPG averaged across the sub-basins within the five sub-regions and the whole TP with respect to different seasons. ETP: eastern TP; YTR: Yarlung Tsangpo River basin; ITP: inner TP; QDM: Qaidam basin; UID: upper Indus.
As shown in Fig. 3c, the annual RPG generally has a similar spatial pattern to APG but shows large values in the Qaidam basin. The average RPG across all the sub-basins of the TP is 4.25 % × 100 m−1. However, the RPGs show great spatial variability, ranging from −5.23 % × 100 m−1 to more than 20.00 % × 100 m−1. Quantitatively, the average RPGs within five sub-regions of the TP are shown in Table 2. The Qaidam basin has the largest value of 11.26 % × 100 m−1, followed by the inner TP with a value of 7.08 % × 100 m−1 and then the upper Indus with a value of 3.17 % × 100 m−1. The Yarlung Tsangpo River basin and the eastern TP have RPGs of 3.00 % × 100 m−1 and 2.90 % × 100 m−1, respectively. Generally, the spatial pattern of RPG shown in our study is in agreement with the result of Guo et al. (2016), which pointed out that large precipitation gradients are mainly in the Qaidam basin but small in the Hengduan Mountains in the south-eastern TP.
4.3 Temporal variation of precipitation gradients
4.3.1 Seasonal patterns
The APG and RPG at each basin are also calculated based on the seasonal average precipitation and presented in Figs. 4 and 5 to explore the seasonality of the precipitation gradient.
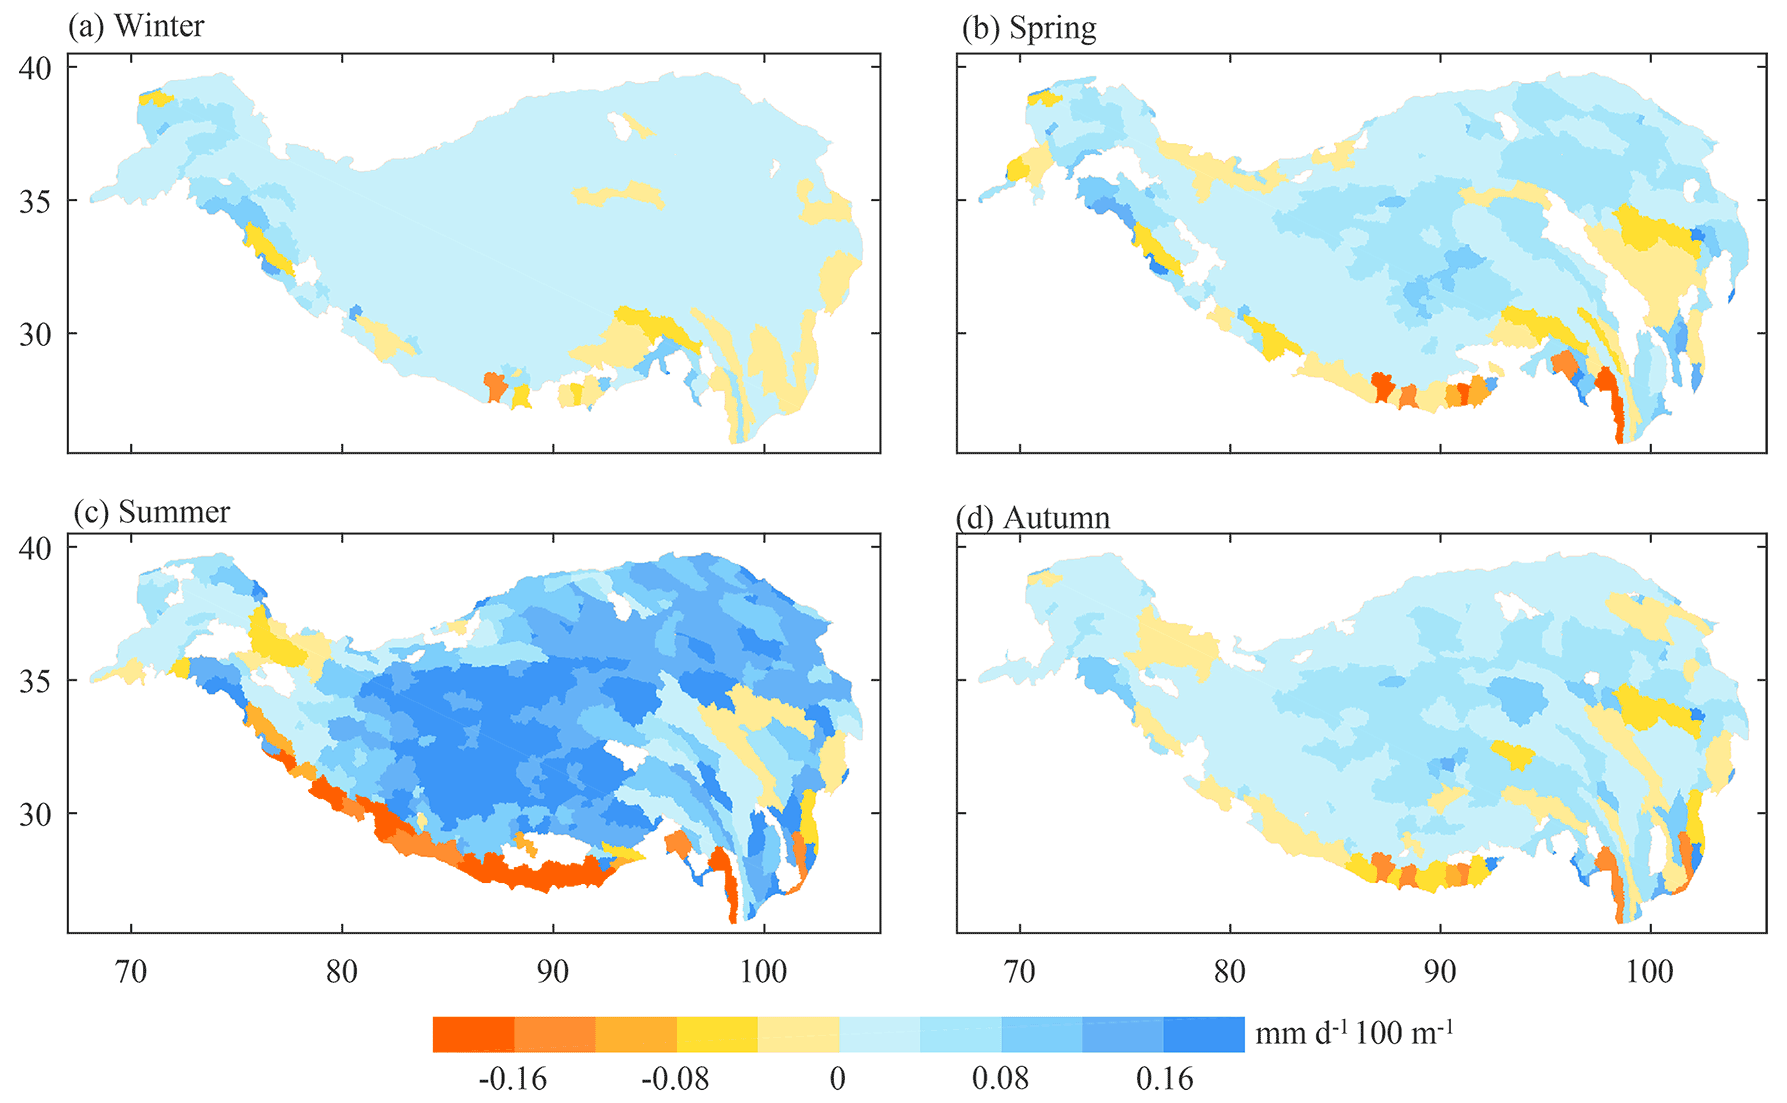
Figure 4Spatial distribution of APGs in (a) winter (December to February), (b) spring (March to May), (c) summer (June to August) and (d) autumn (September to November). The APGs are calculated based on seasonal precipitation averaged from 1980 to 2018. The sub-basins with weak relationships between precipitation and altitude are filled with white.

Figure 5Same as Fig. 4 but for RPGs. The sub-basins with weak relationships between precipitation and altitude or no data value of RPG are filled with white.
As shown in Fig. 4 and Table 2, the absolute values of APG in summer are remarkably larger than those in other seasons, with an averaged value across all sub-basins in the TP of 0.11 mm d−1 × 100 m−1, while they are 0.02 mm d−1 × 100 m−1 in winter and 0.04 mm d−1 × 100 m−1 in spring and autumn. Such a seasonal pattern is not surprising because a large precipitation amount tends to result in a large value of APG and vice versa. Figure 5 shows the spatial distribution of RPG in the four seasons. In winter, precipitation in some sub-basins is very small; therefore, the RPG is not calculated in these basins and is masked with white. Unlike APGs, RPGs in spring and autumn are larger than those in summer, which is especially true in the central TP. In winter, although many sub-basins are masked as no data, most of the remaining sub-basins have the largest RPG among the four seasons. Table 2 shows that the values of RPG averaged across all the sub-basins in the TP are 5.06 % × 100 m−1 in winter, 5.11 % × 100 m−1 in spring, 4.20 % × 100 m−1 in summer and 4.33 % × 100 m−1 in autumn.
In particular, remarkable seasonal variation in the precipitation gradient (both APG and RPG) can be found in the Himalayas. In winter, most of the sub-basins in this region have a positive precipitation gradient; however, it can be seen from Figs. 4c and 5c that this region is dominated by negative gradients in summer. In spring (Figs. 4b and 5b) and autumn (Figs. 4d and 5d), the western Himalayas have a positive gradient and the eastern Himalayas have a negative gradient. This phenomenon was also observed by Wulf et al. (2010), who found that in the north-western Himalayas the precipitation gradients are reversed between winter and summer, as well as by Putkonen (2004), who reported that in the Nepal Himalayas monsoon precipitation maximum occurs at an altitude of about 3000 m a.s.l., while precipitation continuously increases with altitude in dry seasons.
In summary, the precipitation gradient (including both APG and RPG) in the TP shows great seasonal variation, and it may be desirable to interpolate seasonal or monthly precipitation with precipitation gradients calculated at the corresponding season or month, especially in the Himalayas.
4.3.2 Interannual variations
The CV and trend for annual APG and RPG during 1980–2018 are calculated for each sub-basin of the TP. As shown in Fig. 6a and b, the CV values for both APG and RPG in most sub-basins are less than 0.2, implying low interannual variability of the precipitation gradient. Figure 6c shows that APG has a positive trend in most sub-basins, especially in the inner TP, which was also reported by Guo et al. (2016), who used in situ data to characterize the precipitation gradients in the TP. Such a pattern of precipitation gradient trend is mainly because the TP has overall become wetter in recent decades, especially in the central and northern TP (Sun et al., 2020; X. Wang et al., 2018; Yang et al., 2014). In contrast, RPG does not show a positive trend at most sub-basins, and its trend in fewer basins is significant at the 95 % confidence level. The average value of the RPG trend across all sub-basins is −0.0042 % × 100 m−1 yr−1. Therefore, RPG is less sensitive to the climatic change in precipitation amount, and the RPG obtained in a certain period is expected to be more representative than APG when applying for precipitation interpolation under climate change.
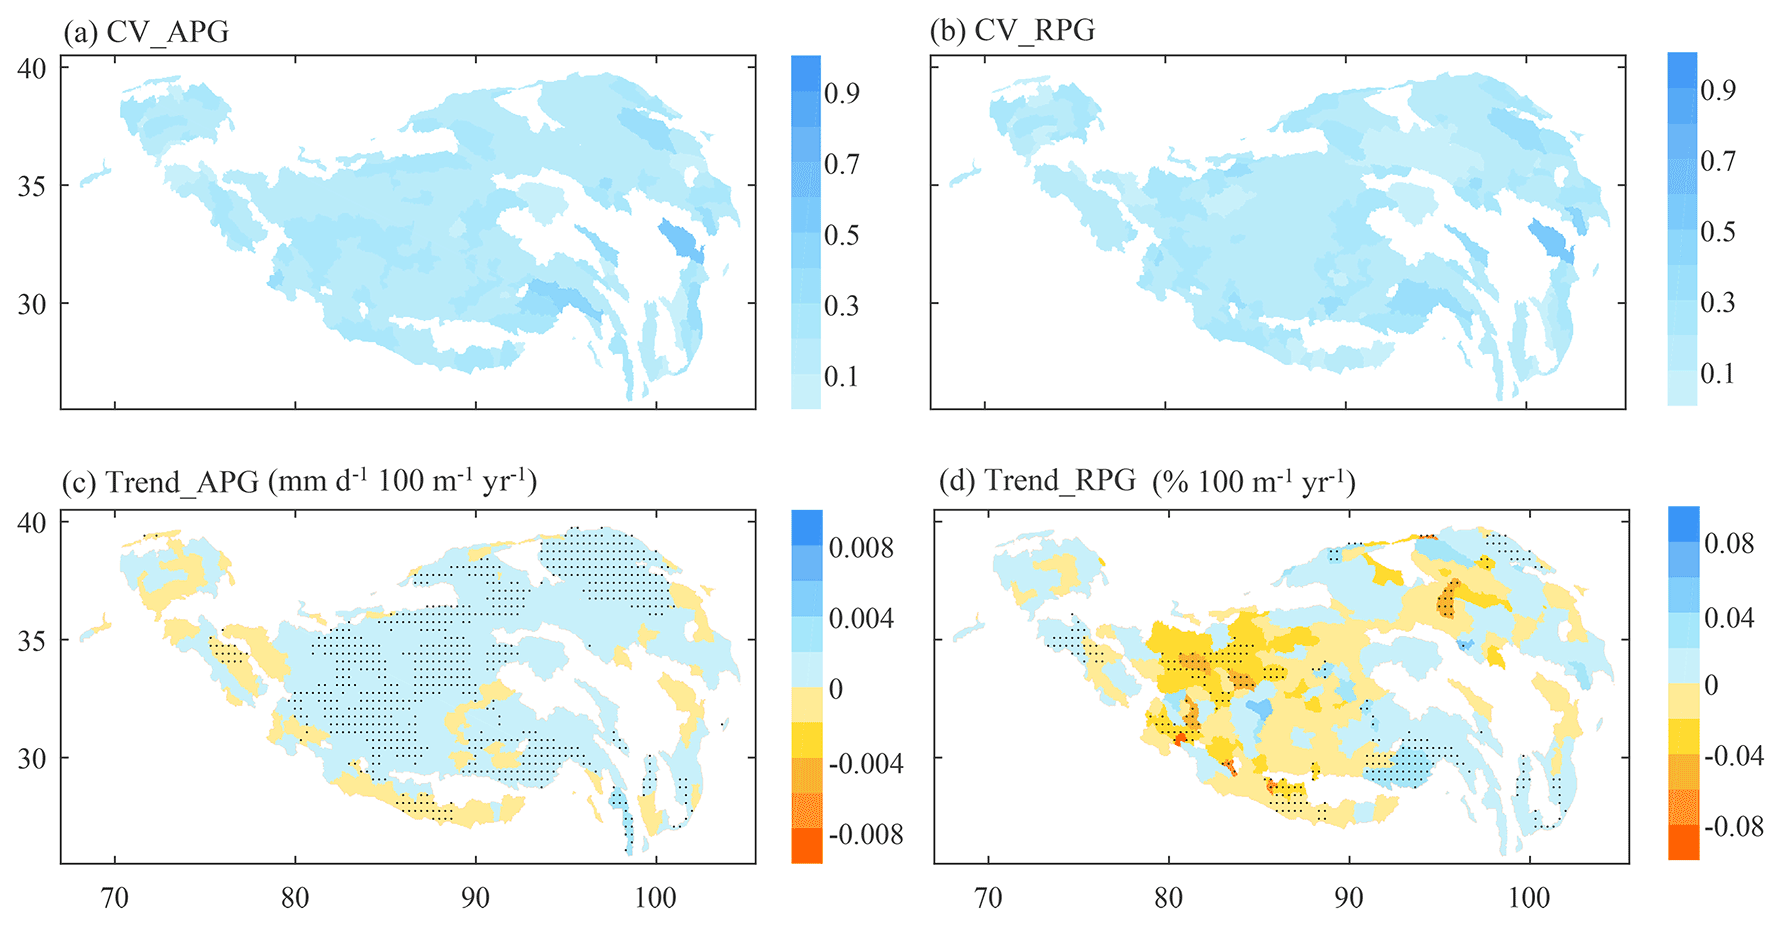
Figure 6Spatial distribution of (a) and (b) the coefficient of variation (CV) and (c) and (d) the trend for annual APGs and RPGs during 1980–2018. The dots in panels (c) and (d) represent a trend significant at the 95 % confidence level. The CV and trend are calculated only for sub-basins without missing APG or RPG during 1980–2018.
5.1 Uncertainties in APGs and RPGs
This study uses the atmospheric simulation-based ERA5_CNN to characterize the precipitation gradients in the TP. However, the ERA5_CNN has biases in the TP, leading to uncertainties in the calculated APGs and RPGs. Figure 7 shows the Abias and Rbias of annual precipitation from ERA5_CNN during 1980–2018 at the locations of CMA stations. It can be found that ERA5_CNN generally overestimates precipitation in the TP, with Abias ranging from −365.99 mm yr−1 to more than 1500.00 mm yr−1 and Rbias ranging from about −30.00 % to more than 150.00 %. This result is similar to previous works that demonstrated an overall wet bias in atmospheric simulation in the TP (Gao et al., 2015; Y. Wang et al., 2020; Zhou et al., 2021). According to the definition of APG and RPG, if Abias is spatially homogeneous (i.e. the ERA5_CNN has the same absolute value of overestimation or underestimation at all locations in a region), the slopes of the regression line derived from ERA5_CNN and rain gauge data are the same because these two lines are parallel (as shown in Fig. S1a); if Rbias is uniform in space (i.e. the ERA5_CNN has the same percentage of overestimation or underestimation), the calculated RPG is consistent with that from rain gauge data because both APG and the basin-average precipitation in Eq. (2) have the same percentage of bias, which is also illustrated in Fig. S1b. By comparing Fig. 7a and b, we can find that Rbias is more homogeneous than Abias (the CV value for all CMA stations is 1.24 for Rbias, while it is 1.59 for Abias). In this case, it is expected that RPG derived from the ERA5_CNN will be closer to the observed one than APG and will be more appropriate for interpolating rain gauge data.
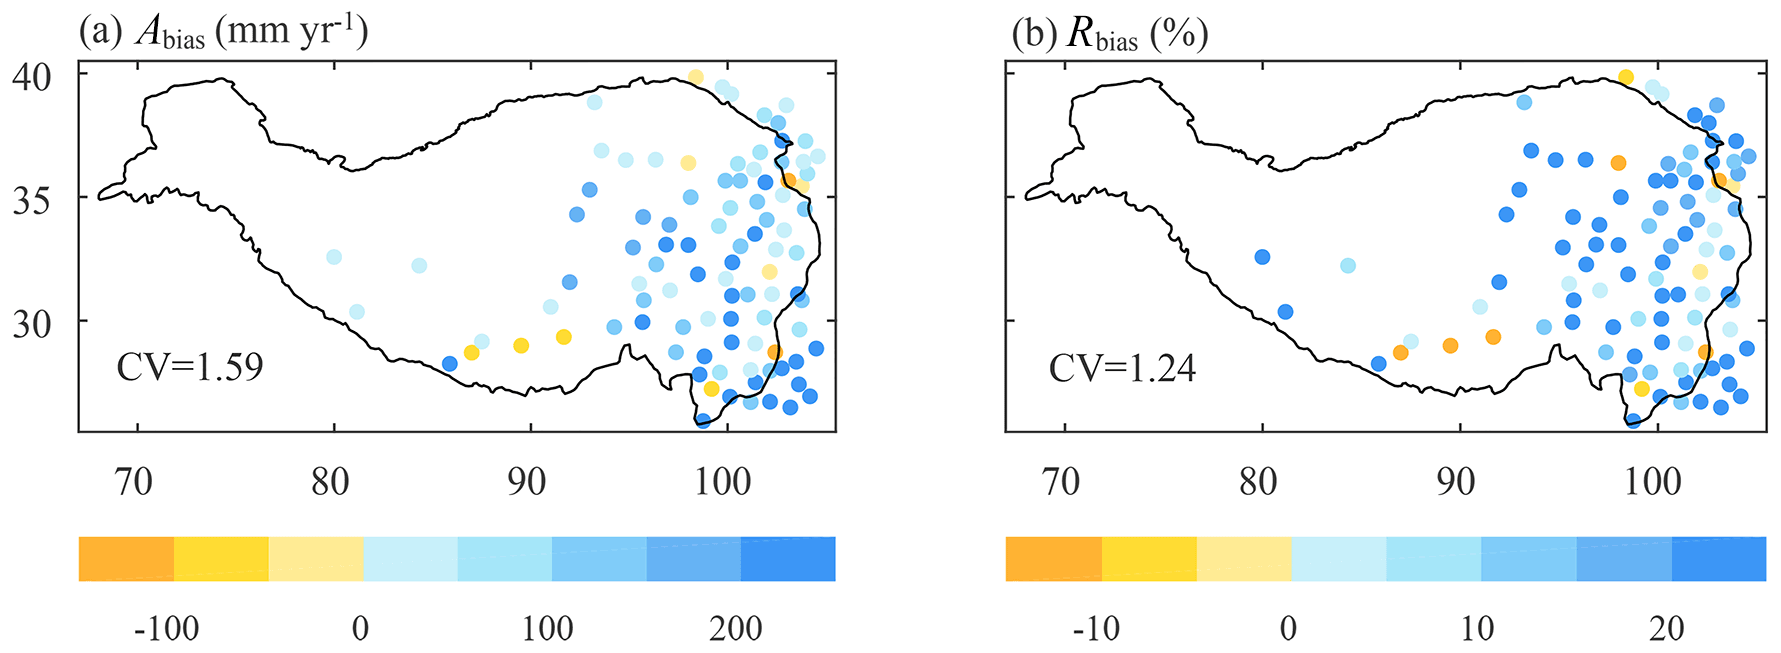
Figure 7Spatial distribution of (a) absolute bias (Abias) and (b) relative bias (Rbias) for annual precipitation from ERA5_CNN during 1980–2018 at stations of the China Meteorological Administration.
Nevertheless, the Rbias still has great spatial variability. Given the complexity of biases in ERA5_CNN, we recommend comparing the APG and the RPG and selecting the better one for specific applications.
5.2 Relations between precipitation gradients and relative humidity and wind speed
Previous works mainly focused on the influence of static topographic parameters (e.g. altitude, slope, aspect and exposure) on precipitation gradient (Basist et al., 1994; Diodato, 2005; Sevruk, 1997; Singh et al., 1995). However, Sect. 4 shows that precipitation gradients are likely related to meteorological conditions. Therefore, this section discusses the possible factors that may influence the spatiotemporal variations of the precipitation gradient. The near-surface relative humidity and wind speed are selected as the potential factors because they should be the indicators of mass and dynamic conditions for the formation of precipitation, respectively. Given that the magnitude of APG is likely to be influenced by precipitation amount (as shown in Fig. 4) and the RPG is more informative, this section only discusses the relations between the RPG and the two meteorological factors.
Our results show that large RPG mainly occurs in the Qaidam basin and inner TP characterized by dry air conditions. In addition, RPG has larger values in winter and spring than in summer. Similar results have been reported in the Himalayas (Putkonen, 2004), the Xinjiang region (Zhao et al., 2011) and the Qinling Mountains (Li and Fu, 1984), which found that the altitude with precipitation maximum in dry seasons is higher than that in wet seasons. These results indicate that there may be a close relationship between RPG and the humidity of air mass. Therefore, the relationships between annual average relative humidity and annual RPG are investigated in the whole TP and its five sub-regions. As shown in Fig. 8, there is a good linear relationship () between relative humidity and RPG when considering all the sub-basins in the TP (Fig. 8a). In terms of each sub-region, the negative correlation between relative humidity and RPG is relatively small in the Yarlung Tsangpo River basin (Fig. 8c) and the inner TP (Fig. 8d), while it is larger than 0.5 in the other three sub-regions (Figs. 8b, e and f). Overall, the RPG generally decreases with increasing relative humidity in all sub-regions, indicating that precipitation tends to occur at lower altitudes when the relative humidity is larger, which is easy to understand because air masses with lower humidity tend to be saturated after a higher uplift.
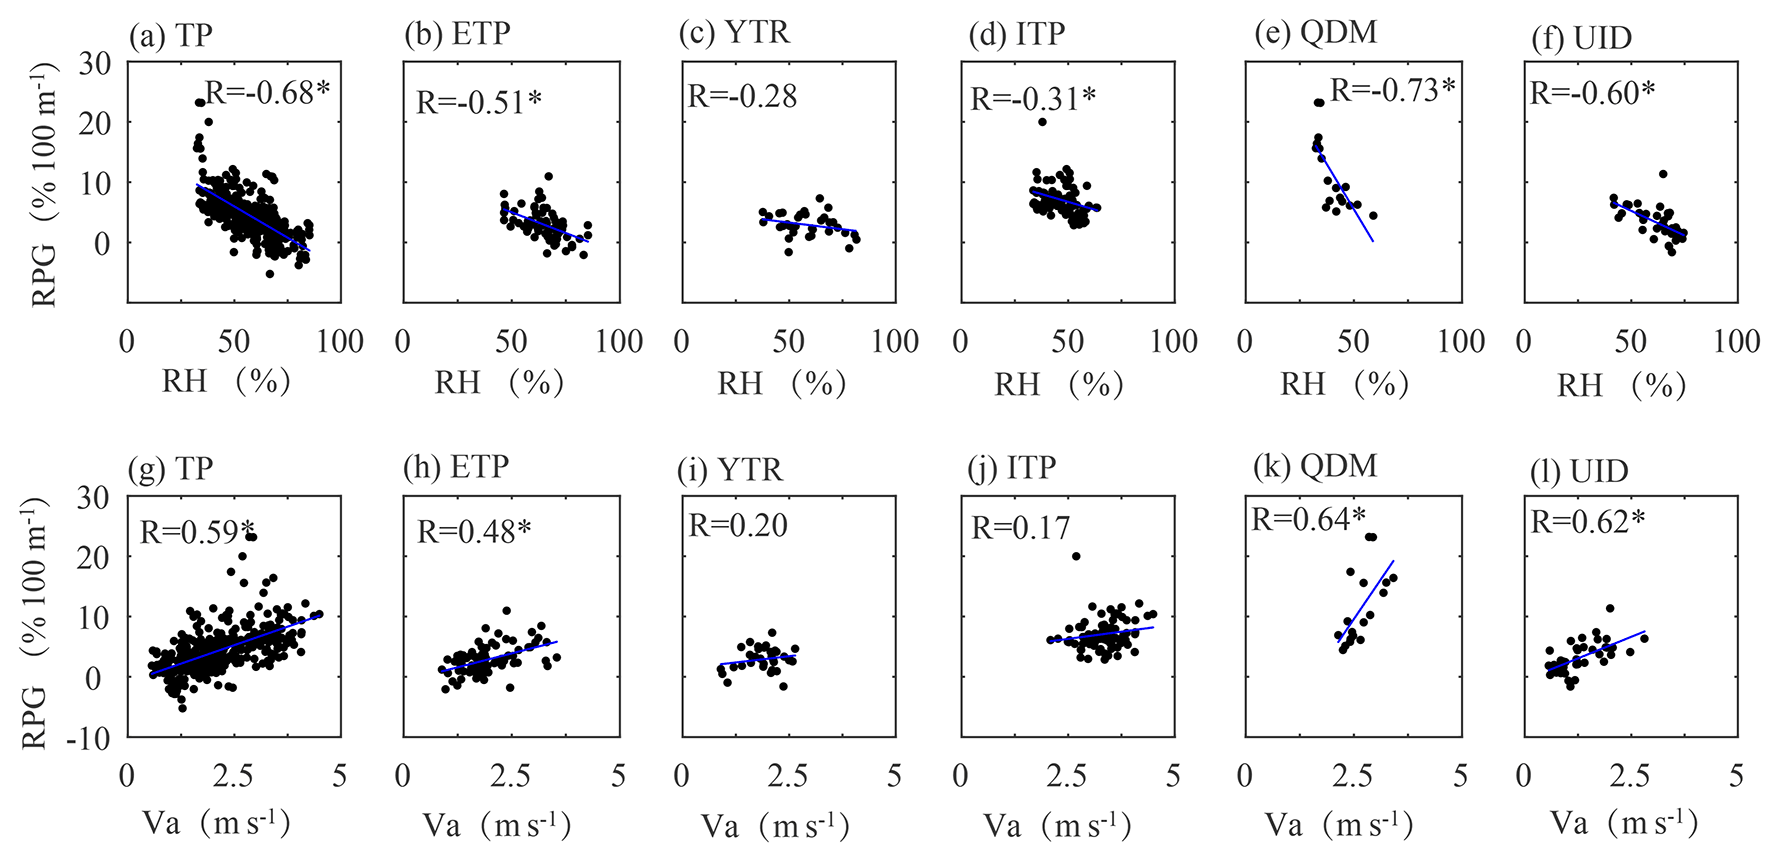
Figure 8Relationships between annual RPGs and (a–f) basin-average relative humidity (RH) and (g–l) wind speed (Va) in different sub-regions of the TP. ETP: eastern TP; YTR: Yarlung Tsangpo River basin; ITP: inner TP; QDM: Qaidam basin; UID: upper Indus.
The relations between near-surface wind speed and RPG were also tested (Fig. 8g–l). It can be found that three sub-regions have high positive correlations (R > 0.45) between RPG and wind speed, and the Yarlung Tsangpo River basin and the inner TP have lower positive correlations (R= 0.20 and 0.17, respectively). The correlation coefficient for the whole TP is as high as 0.59, indicating RPG increases with increasing wind speed. The positive correlations between precipitation gradient and wind speed reported in this study have also been demonstrated in previous studies. For example, Johansson and Chen (2003) found that precipitation in Sweden increases with increasing wind speed on the upwind side of mountains. Hill (1983) also confirmed that wind direction and wind speed could have great impacts on the distribution of precipitation enhancement in mountainous regions. Moist air blocked by upwind barriers usually leads to enhanced precipitation on the windward slopes, which is one of the main mechanisms of orographic precipitation in mountainous regions (Houze, 2012; Roe, 2005). Thus, the strong wind tends to bring more moisture to high altitudes and further results in precipitation enhancement at high altitudes. That is why strong wind tends to result in larger positive precipitation gradients.
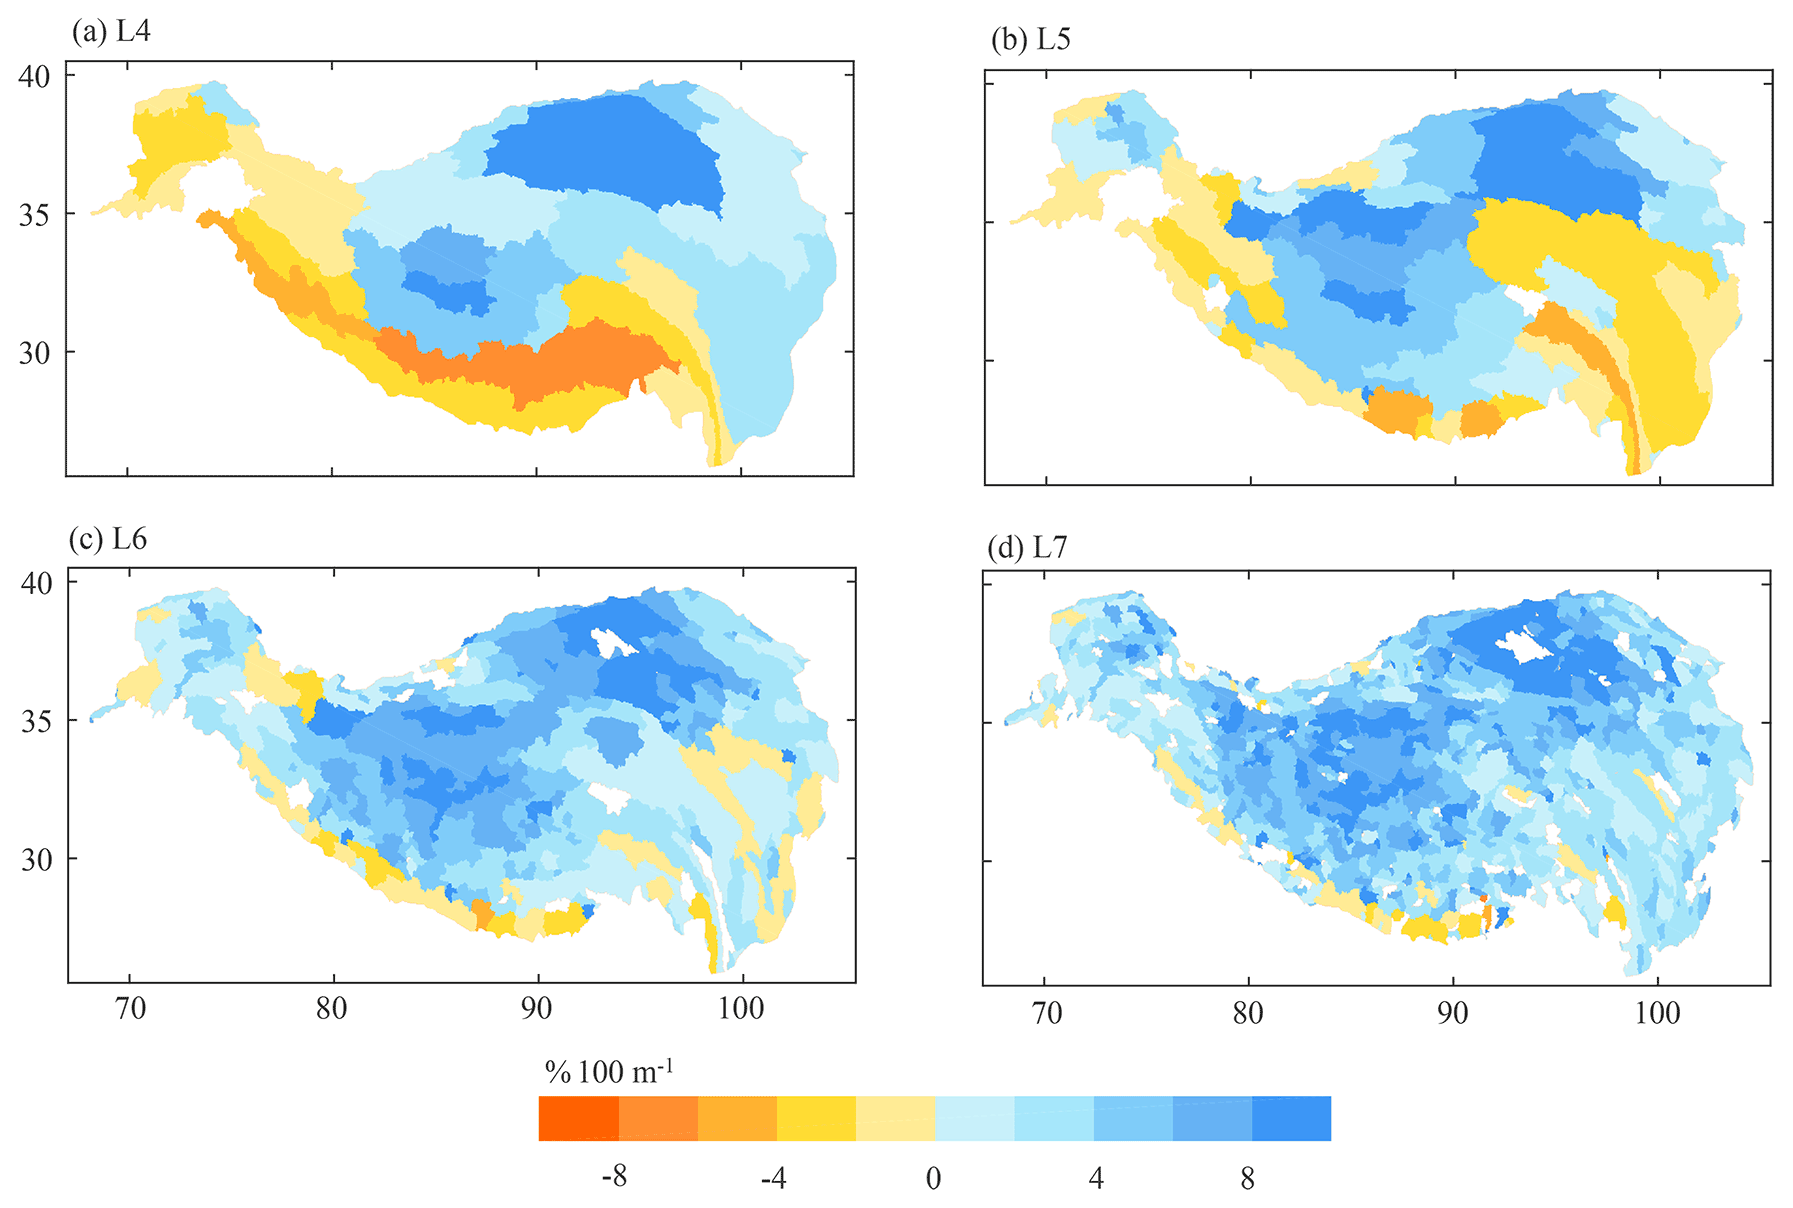
Figure 9Spatial distribution of annual RPGs calculated at four sub-basin levels. The spatial scales of sub-basins (i.e. the sub-basin area) generally decrease from L4 to L7.
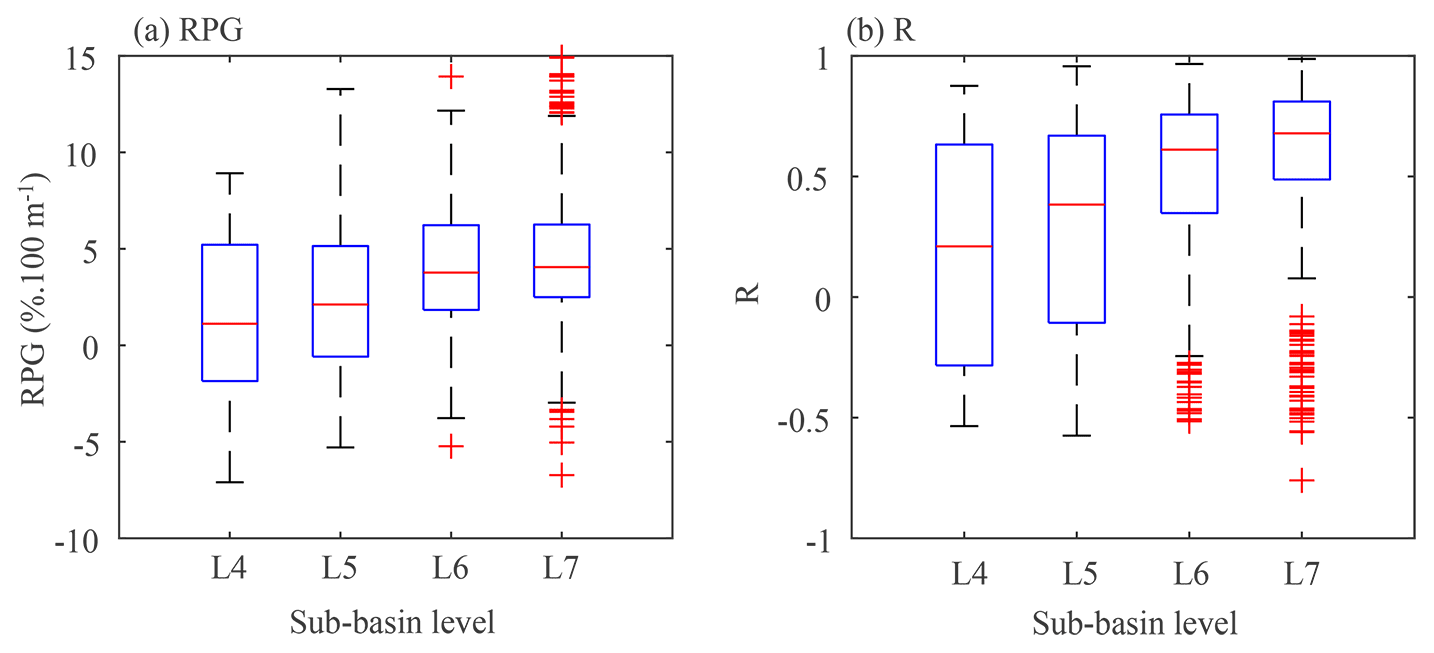
Figure 10Comparison of (a) RPGs and (b) the correlations between precipitation and altitude calculated at different sub-basin levels. Each box represents the distribution of RPGs or correlations of all the sub-basins over the TP. The red line shows the median value of RPGs. The bottom and top edges of the box represent the 25th and 75th percentiles, respectively. The whiskers represent the extreme value. The red sign “+” shows the RPGs beyond the extreme value.
5.3 Impact of spatial scale on the estimation of precipitation gradients
In this study, the precipitation gradient is fitted using all grids with a specific sub-basin; therefore, the estimated precipitation gradient is likely to be spatial-scale-dependent. Accordingly, we investigate and compare precipitation gradients at different spatial scales by calculating the precipitation gradients based on four sub-basin levels provided by the HydroATLAS database. Figure 9 shows the spatial distribution of the annual RPG calculated at different sub-basin levels (a lower sub-basin level has a larger spatial scale). The results of APG are similar to those of RPG and are thus not shown. It can be seen that RPGs calculated at different spatial scales differ greatly, especially in the southern and eastern TP, where the topography is complex. For example, the RPGs are negative in the southern TP when calculated for large river basins (Fig. 9a), while they tend to be positive in sub-basins of these large river basins. This is similar to the results of Sun and Su (2020), who reported that precipitation overall decreases with increasing altitude in the Yarlung Tsangpo River basin but shows the opposite variation in some small sub-basins. Taking the TP as a whole, we can find that the values of RPG increase from L4 to L6 and remain relatively stable after L6 (Fig. 10a). In addition, the correlations between precipitation and altitude tend to be larger at smaller spatial scales (Fig. 10b). This indicates that precipitation variations at large scales are more controlled by large-scale atmospheric circulations but at small scales are more dependent on local topography.
In this study, the altitudinal precipitation gradient in the TP is investigated at the basin scale using a high-resolution atmospheric simulation-based precipitation dataset, and its spatiotemporal variability is analysed.
The performance of the high-resolution atmospheric simulation-based dataset in describing the altitude dependence of precipitation is firstly validated using observations from five rain gauge networks. The results show that this dataset can reasonably reproduce the observed altitude dependence of precipitation and generally performs better than the widely used IMERG and HAR V2 in the TP.
Both absolute precipitation gradient (APG) and relative precipitation gradient (RPG) for annual and seasonal average precipitation are calculated for 388 sub-basins of the TP. Most sub-basins of the TP have positive precipitation gradients, and negative gradients are mainly distributed in the Himalayas, the Hengduan Mountains and the western Kunlun. The APGs are less than −0.05 mm d−1 × 100 m−1 in the central and eastern Himalayas but greater than 0.06 mm d−1 × 100 m−1 in most sub-basins of the central TP. Meanwhile, the annual RPGs range from about −5.00 % × 100 m−1 in the Himalayas to more than 20.00 % × 100 m−1 in the Qaidam basin. In particular, both APG and RPG show large values in the inner TP. The seasonal variations of APG correspond to the seasonal variability of precipitation amount, with APG larger in wet seasons but smaller in dry seasons. However, the RPG has opposite seasonal variations.
The variations in precipitation gradient are related to meteorological conditions. Analyses show that the RPGs decrease with increasing relative humidity but increase with increasing wind speed. The relationships between RPGs and the two factors are strong, with absolute correlations greater than 0.50 for both factors when taking all sub-basins in the TP into account. The strong correlations suggest that relative humidity and wind speed can be potential indicators to adjust RPG regionally.
In addition, our results show that the precipitation gradient in the TP is spatial-scale-dependent. The precipitation gradients are positive in the northern TP but negative in the southern TP at larger spatial scales; however, they tend to be positive at smaller spatial scales, even in the southern TP. As the spatial scale decreases, the precipitation gradient first increases and then remains relatively stable. This is because the impact of large-scale atmospheric circulations on precipitation distribution is reduced and topography is the key determinant at a small scale, highlighting the importance of calculating precipitation gradient at a relatively small spatial scale.
In summary, our study presents the spatiotemporal variability of the precipitation gradient in the TP, which can be used as a reference for assisting precipitation interpolation. Nevertheless, uncertainties still exist (as shown in Sect. 5.1). Further works are expected to evaluate the accuracy of the obtained precipitation gradients in the TP, which requires reliable observations, e.g. high-quality radar observations or high-density rain gauge networks.
All codes used to produce the results are available upon request to the authors. The high-resolution atmospheric simulation-based precipitation dataset that supports this study is available upon request from the authors. Precipitation gradients (including both APGs and RPGs) for 388 sub-basins of the TP are provided in the Supplement.
The supplement related to this article is available online at: https://doi.org/10.5194/hess-26-4587-2022-supplement.
YJ proposed the idea and carried out the analysis. KY conceived the idea, provided supervision and acquired financial support. YJ, KY, HY, HL, YC, XZ, JS, YY and YW participated in the discussion and design of this study and contributed to writing and editing the paper.
The contact author has declared that none of the authors has any competing interests.
Publisher’s note: Copernicus Publications remains neutral with regard to jurisdictional claims in published maps and institutional affiliations.
This article is part of the special issue “Hydrological response to climatic and cryospheric changes in high-mountain regions”. It is not associated with a conference.
This is a contribution no. 12 to CORDEX-FPS-CPTP. The dataset of the boundaries of the TP and its five sub-regions used in this study is provided by the National Tibetan Plateau Data Center (http://data.tpdc.ac.cn/en/data/dff6b437-90a1-4729-8140-faafc544860f/, last access: 12 September 2022).
This research has been supported by the Strategic Priority Research Program of the Chinese Academy of Sciences (grant no. XDA2006010201), the National Science Foundation of China (grant no. 41905087) and the NSFC Basic Science Center for Tibetan Plateau Earth System (grant no. 41988101).
This paper was edited by Yue-Ping Xu and reviewed by two anonymous referees.
Andermann, C., Bonnet, S., and Gloaguen, R.: Evaluation of precipitation data sets along the Himalayan front, Geochem. Geophy. Geosy., 12, Q07023, https://doi.org/10.1029/2011GC003513, 2011.
Basist, A., Bell, G. D., and Meentemeyer, V.: Statistical Relationships between Topography and Precipitation Patterns, J. Climate, 7, 1305–1315, https://doi.org/10.1175/1520-0442(1994)007<1305:SRBTAP>2.0.CO;2, 1994.
Bookhagen, B. and Burbank, D. W.: Topography, relief, and TRMM-derived rainfall variations along the Himalaya, Geophys. Res. Lett., 33, L08405, https://doi.org/10.1029/2006GL026037, 2006.
Chen, H., Yuan, W., Li, J., and Yu, R.: A possible cause for different diurnal variations of warm season rainfall as shown in station observations and TRMM 3B42 data over the southeastern Tibetan plateau, Adv. Atmos. Sci., 29, 193–200, https://doi.org/10.1007/s00376-011-0218-1, 2012.
Chen, R., Han, C., Liu, J., Yang, Y., Liu, Z., Wang, L., and Kang, E.: Maximum precipitation altitude on the northern flank of the Qilian Mountains, northwest China, Hydrol. Res., 49, 1696–1710, https://doi.org/10.2166/nh.2018.121, 2018.
Chen, Y., Sharma, S., Zhou, X., Yang, K., Li, X., Niu, X., Hu, X., and Khadka, N.: Spatial performance of multiple reanalysis precipitation datasets on the southern slope of central Himalaya, Atmos. Res., 250, 105365, https://doi.org/10.1016/j.atmosres.2020.105365, 2020.
Collier, E. and Immerzeel, W. W.: High-resolution modeling of atmospheric dynamics in the Nepalese Himalaya, J. Geophys. Res.-Atmos., 120, 9882–9896, https://doi.org/10.1038/175238c0, 2015.
Cuo, L. and Zhang, Y.: Spatial patterns of wet season precipitation vertical gradients on the Tibetan Plateau and the surroundings, Sci. Rep.-UK, 7, 1–10, https://doi.org/10.1038/s41598-017-05345-6, 2017.
Daly, C., Taylor, G., and Gibson, W.: The Prism approach to mapping precipitation and temperature, in: Proceedings of the 10th AMS Conf. Appl. Climatol. Amer. Meteor Soc., Reno, NV, 20–23 October, 1–4, 1997.
Daly, C., Gibson, W. P., Taylor, G. H., Johnson, G. L., and Pasteris, P.: A knowledge-based approach to the statistical mapping of climate, Clim. Res., 22, 99–113, https://doi.org/10.3354/cr022099, 2002.
Derin, Y. and Yilmaz, K. K.: Evaluation of multiple satellite-based precipitation products over complex topography, J. Hydrometeorol., 15, 1498–1516, https://doi.org/10.1175/JHM-D-13-0191.1, 2014.
Diodato, N.: The influence of topographic co-variables on the spatial variability of precipitation over small regions of complex terrain, Int. J. Climatol., 25, 351–363, https://doi.org/10.1002/joc.1131, 2005.
Gao, Y., Xu, J., and Chen, D.: Evaluation of WRF mesoscale climate simulations over the Tibetan Plateau during 1979–2011, J. Climate, 28, 2823–2841, https://doi.org/10.1175/JCLI-D-14-00300.1, 2015.
Gao, Y., Chen, F., and Jiang, Y.: Evaluation of a convection-permitting modeling of precipitation over the Tibetan Plateau and its influences on the simulation of snow-cover fraction, J. Hydrometeorol., 21, 1531–1548, https://doi.org/10.1175/JHM-D-19-0277.1, 2020.
Guo, X., Wang, L., and Tian, L.: Spatio-temporal variability of vertical gradients of major meteorological observations around the Tibetan Plateau, Int. J. Climatol., 36, 1901–1916, https://doi.org/10.1002/joc.4468, 2016.
Han, C., Wang, L., Chen, R., Liu, Z., Liu, J., Yang, Y., and Lv, H.: Precipitation observation network and its data application in the alpine region of Qilian Mountains, Resources Science, 42, 1987–1997, https://doi.org/10.18402/resci.2020.10.15, 2020 (in Chinese).
Henn, B., Newman, A. J., Livneh, B., Daly, C., and Lundquist, J. D.: An assessment of differences in gridded precipitation datasets in complex terrain, J. Hydrol., 556, 1205–1219, https://doi.org/10.1016/j.jhydrol.2017.03.008, 2018.
Hersbach, H., Bell, B., Berrisford, P., Hirahara, S., Horányi, A., Muñoz-Sabater, J., Nicolas, J., Peubey, C., Radu, R., Schepers, D., Simmons, A., Soci, C., Abdalla, S., Abellan, X., Balsamo, G., Bechtold, P., Biavati, G., Bidlot, J., Bonavita, M., De Chiara, G., Dahlgren, P., Dee, D., Diamantakis, M., Dragani, R., Flemming, J., Forbes, R., Fuentes, M., Geer, A., Haimberger, L., Healy, S., Hogan, R.J., Hólm, E., Janisková, M., Keeley, S., Laloyaux, P., Lopez, P., Lupu, C., Radnoti, G., de Rosnay, P., Rozum, I., Vamborg, F., Villaume, S., and Thépaut, J. N.: The ERA5 global reanalysis, Q. J. R. Meteor. Soc., 146, 1999–2049, https://doi.org/10.1002/qj.3803, 2020.
Hill, F. F.: The use of average annual rainfall to derive estimates of orographic enhancement of frontal rain over England and Wales for different wind directions, J. Climatol., 3, 113–129, https://doi.org/10.1002/joc.3370030202, 1983.
Houze, R. A.: Orographic Effects on Precipitating Clouds, Rev. Geophys., 50, 1–47, https://doi.org/10.1029/2011RG000365, 2012.
Huffman, G., Bolvin, D., Nelkin, E., and Tan, J.: Integrated Multi-satellite Retrievals for GPM (IMERG) Technical Documentation, NASA, https://docserver.gesdisc.eosdis.nasa.gov/public/project/GPM/IMERG_doc.06.pdf (last access: 11 September 2022), 2019.
Hutchinson, M. F.: The application of thin plate smoothing splines to continent-wide data assimilation, edited by: Jasper, J. D., BMRC Research Report No. 27, Data Assimilation Systems, 104–113, 1991.
Immerzeel, W. W., Petersen, L., Ragettli, S., and Pellicciotti, F.: The importance of observed gradients of air temperature and precipitation for modeling runoff from a glacierized watershed in the Nepalese Himalayas, Water Resour. Res., 50, 2212–2226, https://doi.org/10.1002/2013WR014506, 2014.
Jiang, Y., Yang, K., Shao, C., Zhou, X., Zhao, L., and Chen, Y.: A downscaling approach for constructing high-resolution precipitation dataset over the Tibetan Plateau from ERA5 reanalysis, Atmos. Res., 256, 105574, https://doi.org/10.1016/j.atmosres.2021.105574, 2021.
Johansson, B. and Chen, D.: The influence of wind and topography on precipitation distribution in Sweden: Statistical analysis and modelling, Int. J. Climatol., 23, 1523–1535, https://doi.org/10.1002/joc.951, 2003.
Kan, B., Su, F., Xu, B., Xie, Y., Li, J., and Zhang, H.: Generation of High Mountain Precipitation and Temperature Data for a Quantitative Assessment of Flow Regime in the Upper Yarkant Basin in the Karakoram, J. Geophys. Res.-Atmos., 123, 8462–8486, https://doi.org/10.1029/2017JD028055, 2018.
Li, D., Yang, K., Tang, W., Li, X., Zhou, X., and Guo, D.: Characterizing precipitation in high altitudes of the western Tibetan plateau with a focus on major glacier areas, Int. J. Climatol., 40, 1–14, https://doi.org/10.1002/joc.6509, 2020.
Li, Z. and Fu, B.: Characteristics of climate in Qinling Mountains, Monography of Montain Climate, Meteorological Press, Beijing, 87–96, 1984 (in Chinese).
Linke, S., Lehner, B., Ouellet Dallaire, C., Ariwi, J., Grill, G., Anand, M., Beames, P., Burchard-Levine, V., Maxwell, S., Moidu, H., Tan, F., and Thieme, M.: Global hydro-environmental sub-basin and river reach characteristics at high spatial resolution, Sci. Data, 6, 1–15, https://doi.org/10.1038/s41597-019-0300-6, 2019.
Liu, J., Chen, R., Qin, W., and Yang, Y.: Study on the vertical distribution of precipitation in mountainous regions using TRMM data, Adv. water Sci., 22, 447–454, 2011.
Lundquist, J., Hughes, M., Gutmann, E., and Kapnick, S.: Our skill in modeling mountain rain and snow is bypassing the skill of our observational networks, B. Am. Meteorol. Soc., 100, 2473–2490, https://doi.org/10.1175/BAMS-D-19-0001.1, 2019.
Maussion, F., Scherer, D., Mölg, T., Collier, E., Curio, J., and Finkelnburg, R.: Precipitation seasonality and variability over the Tibetan Plateau as resolved by the high Asia reanalysis, J. Climate, 27, 1910–1927, https://doi.org/10.1175/JCLI-D-13-00282.1, 2014.
Ouyang, L., Yang, K., Lu, H., Chen, Y., Lazhu, Zhou, X., and Wang, Y.: Ground-Based Observations Reveal Unique Valley Precipitation Patterns in the Central Himalaya, J. Geophys. Res.-Atmos., 125, e2019JD031502, https://doi.org/10.1029/2019JD031502, 2020.
Ouyang, L., Lu, H., Yang, K., Leung, L.R., Wang, Y., Zhao, L., Zhou, X., LaZhu, Chen, Y., Jiang, Y., and Yao, X.: Characterizing uncertainties in ground “truth” of precipitation over complex terrain through high-resolution numerical modeling, Geophys. Res. Lett., 48, e2020GL091950, https://doi.org/10.1029/2020gl091950, 2021.
Pan, X., Li, X., Shi, X., Han, X., Luo, L., and Wang, L.: Dynamic downscaling of near-surface air temperature at the basin scale using WRF-a case study in the Heihe River Basin, China, Front. Earth Sci., 6, 314–323, https://doi.org/10.1007/s11707-012-0306-2, 2012.
Pritchard, D. M. W., Forsythe, N., Fowler, H. J., O'Donnell, G. M., and Li, X. F.: Evaluation of upper indus near-surface climate representation by WRF in the High Asia Refined Analysis, J. Hydrometeorol., 20, 467–487, https://doi.org/10.1175/JHM-D-18-0030.1, 2019.
Putkonen, J. K.: Continuous snow and rain data at 500 to 4400 m altitude near Annapurna, Nepal, 1999–2001, Arct. Antarct. Alp. Res., 36, 244–248, https://doi.org/10.1657/1523-0430(2004)036[0244:CSARDA]2.0.CO;2, 2004.
Roe, G. H.: Orographic precipitation, Annu. Rev. Earth Pl. Sc., 33, 645–671, https://doi.org/10.1146/annurev.earth.33.092203.122541, 2005.
Salerno, F., Guyennon, N., Thakuri, S., Viviano, G., Romano, E., Vuillermoz, E., Cristofanelli, P., Stocchi, P., Agrillo, G., Ma, Y., and Tartari, G.: Weak precipitation, warm winters and springs impact glaciers of south slopes of Mt. Everest (central Himalaya) in the last 2 decades (1994–2013), The Cryosphere, 9, 1229–1247, https://doi.org/10.5194/tc-9-1229-2015, 2015.
Shen, Y., Xiong, A., Hong, Y., Yu, J., Pan, Y., Chen, Z., and Saharia, M.: Uncertainty analysis of five satellite-based precipitation products and evaluation of three optimally merged multi-algorithm products over the Tibetan Plateau, Int. J. Remote Sens., 35, 6843–6858, https://doi.org/10.1080/01431161.2014.960612, 2014.
Singh, P., Ramasastri, K. S., and Kumar, N.: Topographical influence on precipitation distribution in different ranges of western Himalayas, Hydrol. Res., 26, 259–284, https://doi.org/10.2166/nh.1995.0015, 1995.
Skamarock, W. C., Klemp, J. B., Dudhia, J., Gill, D. O., Barker, D. M., Duda, M. G., Huang, X., Wang, W., and Powers, J. G.: A Description of the Advanced Research WRF Version 3 (No. NCAR/TN–475+STR), Technical Report, University Corporation for Atmospheric Research, https://doi.org/10.5065/D68S4MVH, 2008.
Sun, H. and Su, F.: Precipitation correction and reconstruction for streamflow simulation based on 262 rain gauges in the upper Brahmaputra of southern Tibetan Plateau, J. Hydrol., 590, 125484, https://doi.org/10.1016/j.jhydrol.2020.125484, 2020.
Sun, J., Yang, K., Guo, W., Wang, Y., He, J., and Lu, H.: Why has the inner tibetan plateau become wetter since the Mid-1990s?, J. Climate, 33, 8507–8522, https://doi.org/10.1175/JCLI-D-19-0471.1, 2020.
Tang, G., Long, D., Hong, Y., Gao, J., and Wan, W.: Documentation of multifactorial relationships between precipitation and topography of the Tibetan Plateau using spaceborne precipitation radars, Remote Sens. Environ., 208, 82–96, https://doi.org/10.1016/j.rse.2018.02.007, 2018.
Wang, L., Chen, R., Song, Y., Yang, Y., Liu, J., Han, C., and Liu, Z.: Precipitation–altitude relationships on different timescales and at different precipitation magnitudes in the Qilian Mountains, Theor. Appl. Climatol., 134, 875–884, https://doi.org/10.1007/s00704-017-2316-1, 2018a.
Wang, L., Zhang, F., Zhang, H., Scott, C. A., Zeng, C., and Shi, X.: Intensive precipitation observation greatly improves hydrological modelling of the poorly gauged high mountain Mabengnong catchment in the Tibetan Plateau, J. Hydrol., 556, 500–509, https://doi.org/10.1016/j.jhydrol.2017.11.039, 2018b.
Wang, N., He, J., Jiang, X., Song, G., Pu, J., Wu, X., and Chen, L.: Study on the zone of maximum precipitation in the north slopes of the central Qilian Mountains, Journal of Glaciology and Geocryology, 31, 395–403, 2009 (in Chinese).
Wang, X., Pang, G., and Yang, M.: Precipitation over the tibetan plateau during recent decades: A review based on observations and simulations, Int. J. Climatol., 38, 1116–1131, https://doi.org/10.1002/joc.5246, 2018.
Wang, X., Tolksdorf, V., Otto, M., and Scherer, D.: WRF-based dynamical downscaling of ERA5 reanalysis data for High Mountain Asia: Towards a new version of the High Asia Refined analysis, Int. J. Climatol., 41, 1–20, https://doi.org/10.1002/joc.6686, 2020.
Wang, Y., Geerts, B., and Liu, C.: A 30-year convection-permitting regional climate simulation over the interior western United States. Part I: Validation, Int. J. Climatol., 38, 3684–3704, https://doi.org/10.1002/joc.5527, 2018.
Wang, Y., Yang, K., Zhou, X., Chen, D., Lu, H., Ouyang, L., Chen, Y., Lazhu, Wang, B.: Synergy of orographic drag parameterization and high resolution greatly reduces biases of WRF-simulated precipitation in central Himalaya, Clim. Dynam., 54, 1729–1740, https://doi.org/10.1007/s00382-019-05080-w, 2020.
Wulf, H., Bookhagen, B., and Scherler, D.: Seasonal precipitation gradients and their impact on fluvial sediment flux in the Northwest Himalaya, Geomorphology, 118, 13–21, https://doi.org/10.1016/j.geomorph.2009.12.003, 2010.
Xu, R., Tian, F., Yang, L., Hu, H., Lu, H., and Hou, A.: Ground validation of GPM IMERG and trmm 3B42V7 rainfall products over Southern Tibetan plateau based on a high-density rain gauge network, J. Geophys. Res., 122, 910–924, https://doi.org/10.1002/2016JD025418, 2017.
Yang, K.: Ground observed precipitation data in Yadong River Valley (2016–2019), National Tibetan Plateau Data Center [data set], https://doi.org/10.11888/Meteoro.tpdc.270319, 2020.
Yang, K., Wu, H., Qin, J., Lin, C., Tang, W., Chen, Y.: Recent climate changes over the Tibetan Plateau and their impacts on energy and water cycle: A review, Global Planet. Change, 112, 79–91, https://doi.org/10.1016/j.gloplacha.2013.12.001, 2014.
Yang, K., Guyennon, N., Ouyang, L., Tian, L., Tartari, G., and Salerno, F.: Impact of summer monsoon on the elevation-dependence of meteorological variables in the south of central Himalaya, Int. J. Climatol., 38, 1748–1759, https://doi.org/10.1002/joc.5293, 2018.
Yu, H., Wang, L., Yang, R., Yang, M., and Gao, R.: Temporal and spatial variation of precipitation in the Hengduan Mountains region in China and its relationship with elevation and latitude, Atmos. Res., 213, 1–16, https://doi.org/10.1016/j.atmosres.2018.05.025, 2018.
Zeng, C., Zhang, F., Wang, L., and Chen, D.: Summer precipitation characteristics on the southern Tibetan plateau, Int. J. Climatol., 41, E3160–E3177, https://doi.org/10.1002/joc.6914, 2021.
Zhang, F., Zhang, H., Hagen, S.C., Ye, M., Wang, D., Gui, D., Zeng, C., Tian, L., and Liu, J.: Snow cover and runoff modelling in a high mountain catchment with scarce data: effects of temperature and precipitation parameters, Hydrol. Process., 29, 52–65, https://doi.org/10.1002/hyp.10125, 2015.
Zhang, G.: Dataset of river basins map over the TP (2016), National Tibetan Plateau Data Center [data set], https://doi.org/10.11888/BaseGeography.tpe.249465.file, 2019.
Zhao, Y., Shi, F., Sheng, Y. Li, J., Zhao, Z., Han, M., and Yilihamu, Y.: Regional differentiation characteristics of precipitation changing with altitude in Xinjiang region in recent 50 years, Journal of Glaciology and Geocryology, 33, 1203–1213, 2011 (in Chinese).
Zhou, X., Yang, K., Ouyang, L., Wang, Y., Jiang, Y., Li, X., Chen, D., and Prein, A.: Added value of kilometer-scale modeling over the third pole region: a CORDEX-CPTP pilot study, Clim. Dynam., 57, 1673–1687, https://doi.org/10.1007/s00382-021-05653-8, 2021.