the Creative Commons Attribution 4.0 License.
the Creative Commons Attribution 4.0 License.
 | 18 Aug 2022
A multivariate-driven approach for disentangling the reduction in near-natural Iberian water resources post-1980
Amar Halifa-Marín
Miguel A. Torres-Vázquez
Enrique Pravia-Sarabia
Marc Lemus-Canovas
Pedro Jiménez-Guerrero
Juan Pedro Montávez
Although the literature still debates how several anthropogenic and natural factors have contributed to the recent streamflow decline in the Iberian Peninsula, a continuing decrease in winter precipitation (WP) has been noticed in this area since the 1980s and has been associated with large-scale atmospheric drivers. This contribution assesses the potential propagation of this WP deficit into water resource variability. For this purpose, the novel “NEar-Natural Water Inflows to REservoirs of Spain” (NENWIRES) dataset was created. The results highlight that higher decreases in winter water inflows (WWIs) are always related to WP reductions. However, while the decline in WP was strongly provoked by the enhancement of the North Atlantic Oscillation index (NAOi) during the study period, WWI reductions could not be essentially linked to the NAOi behaviour in several NENWIRES catchments. Instead, the intensification of drought conditions and forest extension promoted WWI decreases over the target area and aided in understanding why WWI reductions were generally higher than WP decreases. In summary, most humid catchments registered a WWI decline that was mainly promoted by NAOi enhancement, whereas the extension of forest and evapotranspiration increases seem to explain WWI losses in semi-arid environments. This contribution sheds light on the recent debate regarding the magnitude and drivers of water resource decline over southern European regions.
- Article
(3814 KB) - Full-text XML
-
Supplement
(2022 KB) - BibTeX
- EndNote


The Mediterranean region shows the strongest pattern of significant water resource decline in the world; thus, water planning in this area faces the challenge of securing the sustainability of natural and human systems. According to some authors, this streamflow decline is mostly the consequence of climate change (Gudmundsson et al., 2021), given the strong temperature increase and precipitation decrease in the region. However, Vicente-Serrano et al. (2019) concluded that climate trends cannot fully explain the large decreases in streamflow in southwest Europe, where land use changes and water demand from irrigation play an important additional role. Hence, given that freshwater scarcity poses one of the most incipient risks in the region, a significant improvement in knowledge on the variability of water resources and the contribution of their drivers is strongly necessary (Tramblay et al., 2020). Therefore, current studies need to shed light on water resource records and implement modelling based on multivariate approaches (Teuling et al., 2019; Massei et al., 2020).
Focusing on the Iberian Peninsula (IP), the scientific literature generally reports a streamflow decline over the last few decades (Lorenzo-Lacruz et al., 2012, and references therein). Nevertheless, the role of the physical and anthropogenic factors driving these reductions are still under debate. On the one hand, the decrease in recent winter precipitation (WP) has been robustly reported (e.g. de Luis et al., 2010; Lorenzo-Lacruz et al., 2013), with the reduction being reasonably associated with variability in the North Atlantic Oscillation index (NAOi) (e.g. Trigo et al., 2004). Nonetheless, Guerreiro et al. (2014) also pointed out abrupt WP decreases within the Tagus Basin since the late-1970s or early-1980s. Other publications have also quantified the same drastic reduction in WP in the adjoining Júcar and Guadalquivir watersheds (Gómez-Martínez et al., 2018; Halifa-Marín et al., 2021). All of these studies discussed (1) whether WP losses have shown a continuing or an abrupt decline and (2) the relationship of the WP reduction with the NAOi enhancement noticed during the last few decades (e.g. Luo and Gong, 2006; Wang et al., 2014). The lack of knowledge on this topic does not only concern the IP region, with a strong increase in streamflow also being reported in central/northern Europe at annual/seasonal (winter) scales for the same period (Stahl et al., 2010; Hannaford et al., 2013; Vicente-Serrano et al., 2019). However, although the aforementioned authors generally accepted the potential links between the NAOi and the changes in wintertime streamflow over Europe, they highlighted the importance of carrying out long-record analyses in southern Europe, where data are sparse. They suggested that more long-term series are needed to determine whether recent trends towards a decrease in run-off in that region are found in longer records and whether this fact is related to the atmospheric circulation. Despite the scarcity of long-term hydrological records, Peña-Angulo et al. (2020) recently concluded that there is no clear trend in precipitation records for the Iberian Peninsula since 1850, given that they quantified quite similar negative trends in several periods. This finding suggests that the actual decline in water resources could have precedents, despite the fact that similar NAO enhancement has not been noticed (i.e. of the same magnitude for the second half of 20th century).
On the other hand, several contributions have concluded that the streamflow decline has been exacerbated by the temperature and evapotranspiration increases in the IP (e.g. Vicente-Serrano et al., 2014). Similar conclusions have been obtained for the Mediterranean Basin (García-Ruiz et al., 2011) and Europe (Teuling et al., 2019). All of these publications have highlighted the role of a warmer climate and reforestation and afforestation processes in the evapotranspiration increase, as potential evapotranspiration (ETP) also rises in response to global warming. Peña-Angulo et al. (2021) reported that human-induced vegetation greening processes throughout the 20th century have contributed to the Iberian water resource decline (by intensifying the hydrological droughts). Moreover, according to Vicente-Serrano et al. (2019), human-induced land cover changes (e.g. afforestation/irrigation) mainly explain the streamflow decline in the IP. The role of other impacts has also been assessed, such as the construction of dams (Lorenzo-Lacruz et al., 2012), as well as the time lag in the hydrological response caused by the permeability of soils (Lorenzo-Lacruz et al., 2013).
These state-of-art findings regarding the IP show noticeable divergences regarding the importance of the anthropogenic and physical drivers modulating water resources in the region; this emphasizes the strong need for further scientific knowledge to ensure efficient water management over this target area. Uncertainties also persist with respect to the understanding of how the wintertime NAOi variability has influenced Iberian water resource changes. This is important, as it appears likely that NAOi variability may cause strong decreases in WP during particular periods, although several authors have concluded that human perturbations, not climate drivers, determined the recent streamflow variability. In addition, with respect to water planning, the occurrence of short-term decreases in water resources might severely affect the sustainability of natural and human systems (more so than gradual changes). Furthermore, the assessment of water resources needs to focus on near-natural catchments (e.g. Stahl et al., 2010; Hannaford et al., 2013; Vicente-Serrano et al., 2014) in order to reduce the uncertainties added by human-induced perturbations. As water resources depend on several factors with opposing effects, changes in the hydrological response should be analysed at small scales so that individual factors can be understood (e.g. Teuling et al., 2019). This approach allows one to fully assess the hydrological response to global change in forcings and pressures, such as potential changes in atmospheric circulation patterns and/or human perturbations. In addition, the Iberian basins are controlled by quite different climate conditions, which helps to assess these perturbations over a wide variety of hydroclimates. Therefore, this contribution aims to (1) characterize recent changes in water resources in near-natural catchments of Spain and (2) disentangle how climate and anthropogenic drivers have contributed to the magnitude of these changes.
The following list of tasks has been addressed to achieve both objectives: (1) quantification the short-term variability and changes in wintertime water inflows (WWIs) in selected reservoirs; (2) analysis of whether the NAOi plays a leading role in the changes in WWI; (3) examination of the contribution of meteorological drought conditions to WWI changes; (4) examination of the contribution of forest extension; and (5) identification of the main precursor of WWI variability in the study period. To this end, the initial working hypothesis is that the winter climate essentially controls the variability and short-term trends in water resources, whereas the impact of human perturbations is weaker in this season. However, despite the fact that vegetation is mostly active in the warm season, we expect that it can also impact the water store (e.g. soil moisture conditions and groundwater) during the winter season, which can subsequently reduce the run-off and infiltration magnitudes in the “wet season”.
2.1 Data sources
2.1.1 Spanish near-natural water inflows to reservoirs
In this study, monthly water inflows recharging the Spanish reservoir network (376 series) have been examined from October 1951 to September 2018; the series for this period of time are provided by the state institution responsible for water resource issues (CEDEX, 2022). The reader is referred to the Supplement for further information about the water inflow estimation. A total of 36 series (9.6 %) were selected, comprising the “NEar-Natural Water Inflows to REservoirs of Spain” (NENWIRES) dataset (see Table S1 in the Supplement for more details about the reservoirs selected). To identify these “near-natural” reservoirs, we verified that (1) water inflows are not affected by large perturbations, excluding those series impacted by water regulation (e.g. damming) and urban/irrigation extractions; (2) long-term series are prioritized – water inflow records must cover at least 46 years (70 %) of the study period; (3) series must provide continuous records for at least 33 years (50 %); and (4) records must not be reconstructed, and homogeneous quality controls must have been applied to series. Thus, the compiled data provide near-natural water inflow records spanning reservoirs in continental Spain (Fig. 1). In addition, the NENWIRES basins also provide information on the headwaters of the transboundary basins (Douro, Tagus, and Guadiana basins); therefore, the findings of this work properly considered the variability in water resources over most of the IP. Finally, the dimensions of NENWIRES catchments are generally small, with an average area of 929 km2, and the boundaries are provided by the Infraestructura de Datos Espaciales (IDE, 2022). The study of water inflows in near-natural reservoirs, rather than streamflow analysis, draws a more complete picture of the hydrological response in basins, as water inflow describes the balance between all inputs to the reservoir (i.e. surface and groundwater flows), including water losses from the basin, and outputs (e.g. evaporation from the water store). Furthermore, the study focuses on wintertime water inflows (WWIs), which encompass the records from December to March. This “extended season” allows one to study the contribution of snowfalls (i.e. the early snowmelt). The relevance of wintertime changes in precipitation and water resources resides in the fact that (1) it is the wet season for the recharge of most reservoirs and aquifers in the IP (Lorenzo-Lacruz et al., 2012), (2) WP shows the strongest significant decline in the region (De Luis et al., 2010), and (3) the “recent” NAOi enhancement has been reported as taking place in wintertime. Although WWI generally explains more than 50 % of the annual records in NENWIRES catchments (see Fig. S1 in the Supplement), some series (R3, 9, 20, 21, 25, 33, and 36; 19 % of the dataset) registered the peak of the hydrograph in spring or autumn (i.e. possibly promoted by Mediterranean heavy rainfalls) or late spring and early summer (i.e. possibly driven by snow accumulation/snowmelt processes). However, these hypotheses are not addressed in this contribution. Moreover, examining the role of the potential (ETP) and real (ETR) evapotranspiration increase at the seasonal (wintertime) scale, we merge different mechanisms that play very different roles in different seasons. For example, the vegetation activity is weaker in winter and the temperature is lower. Therefore, the above-mentioned mechanisms could be more relevant for the water resources in the warm seasons. Nonetheless, the potential contribution of revegetation to the hydrological response also affects the WWI variability, given its implications for infiltration and run-off processes. Hence, we assume that WWI is affected by the intensification of hydrological drought as a result of water consumption in the scenario of an extension of vegetation cover and climate warming.

Figure 1Panel (a) shows the orography of the Iberian Peninsula (IP), and panel (b) outlines the NENWIRES reservoirs grouped by Iberian hydrological basins (IHBs). In panel (a), light blue contours represent the IHB boundaries in continental Spain, and black contours outline the altitude above sea level (at 500 m intervals).
2.1.2 Climate data
The Spanish precipitation gridded dataset is provided by the Spanish Meteorological Agency (AEMET, 2022). This dataset currently encompasses the period from January 1951 to December 2020 at the daily scale, covering the Spanish territory except the Canary Islands. The number of records managed (3236 rain gauges) and the spatial resolution (∼0.05∘) of the data motivate the usage of this dataset. The Spanish Meteorological Agency also provides the temperature gridded dataset of Spain, whose interpolation manages 1800 gauges, providing the daily maximum and minimum temperature. The monthly NAOi was collected from the National Oceanic and Atmospheric Administration (NOAA), which provides a record covering the period from January 1950 to near-real time (NOAA, 2022). This index is a simplification of a large-scale atmospheric circulation pattern over the North Atlantic, which usefully helps to understand the principal moisture sources reaching the IP (e.g. Trigo et al., 2004). The positive (negative) phases of the NAO index are related to lower (higher) precipitation in the IP.
2.1.3 Soil permeability
Hydrological data collected from aquifers are not considered in this contribution. Instead, the interplay between groundwater and WWI is estimated by assessing the permeability of soils. The permeability of soils dataset, provided by the Spanish Geological Survey (IGME, 2022), classifies soils into nine (four) types (groups): (1) A1 and A2 represent alluvial deposits and colluvial soils formed by very permeable porous banks; (2) B1 and B2 represent carbonate bedrock, which is very permeable due to cracking or karstification processes; (3) C1, C2, and C3 represent well-drained volcanic soils, which are not common; and (4) D1 and D2 represent low-permeability and impermeable conditions respectively. This dataset quantifies the percentage of each type of soil in relation to the basin dimension. In this study, these types of soils are classified in four groups: A/B1 soils are very highly permeable soils (VHPS); A/B2 soils are highly permeable soils (HPS); D1 soils are low-permeability soils (LPS); and D2 soils are impermeable soils (NPS).
2.1.4 Land cover changes
The HIstoric Land Dynamics Assessment (HILDA, 2022) model reconstruction of historic land cover/use change (Fuchs et al., 2015) has been used in this work. This dataset is based on multiple harmonized and consistent data streams, including remote sensing, national inventories, aerial photographs, statistics, old encyclopedias, and historic maps, that are used to reconstruct historic land cover. The spatial resolution reaches 1 km×1 km, whereas the temporal coverage ranges from 1900 to 2010 in decadal time steps. The reconstruction provides information for six different land cover/use categories: forest, grassland, cropland, settlements/urban, water bodies, and other. Only the changes in forest cover in the NENWIRES catchments have been quantified. The gross land changes were studied by computing the sum of all area gains and losses occurring within an area and period.
2.2 Analysis procedures
Following the definition of the objectives and tasks in Sect. 1, we now clarify the procedures used to obtain the results. In order to address task 1, the trend in the magnitude of WWI throughout the study period was obtained. This trend analysis was conducted using Sen's slope test with the “sens.slope” function in R (Pohlert, 2018). To allow for a proportional discussion of trend analysis, the slope estimates were standardized (ZSS) as follows (Eq. 1):
where standardized Sen's slope (ZSS) is the coefficient between Sen's slope estimate (SS) and the mean WWI for study catchments.
Significant trend estimates are considered to have a p value>0.05, which is required in all statistical procedures in the study. Once the ZSS magnitudes were quantified, the potential propagation of the post-1980s WP sudden change into WWI was assessed (addressing the aim established in task 1). For this purpose, the most probable change in series was identified using the Pettitt homogeneity method, according to the “pettitt.test” function in R (Pohlert, 2018). Its significance was externally evaluated using a non-parametric Mann–Whitney U test via the “wilcox_test” function in R (Hothorn et al., 2019). First, the breakpoint (BP) was computed for the percentile rank series of average WWI/WP in the dataset. The conversion to percentile series was made by the “quantile” function in R (R Core Team, 2021). The average WWI/WP was quantified via the “mean” function in R (R Core Team, 2021). A similar method was applied to both variables in the catchment analysis. The relative change (RC) in WWI and WP was then quantified after the more frequent significant BP registered in the series (1979/1980). RC was calculated as follows (Eq. 2):
where RC is estimated by subtracting the average (horizontal bars) of WWI/WP during the first period (MSP1) from its average during the last period (MSP2) and standardizing by the early mean (MSP1).
In order to address task 2, the BP in the NAOi series was checked using the aforementioned methods. In addition, the correlation between WP/WWI and the NAOi was also calculated. To this end, the “cor.test” function in R was used following Pearson's method (R Core Team, 2021). Previously, the series had been detrended using the “detrend” function in R (Borchers, 2019). These correlation coefficients were related to the RC in WWI/WP (estimations based on Eq. 2) through the “lm” R function (R Core Team, 2021). This function was used to fit linear models (regression) between variables. The lm function will be used in the following analysis presented in Sect. 3. The correlation between WWI and WP was also quantified.
The above-mentioned methods allow one to identify those basins where WWI changes could not be fully explained by the NAOi/WP variability. Thus, the role of several different factors in these basins was analysed (tasks 3 and 4). First, the modulation of WWI by the magnitude of the prevailing drought conditions was evaluated. The magnitude of drought conditions is used as an estimation of soil moisture, which impacts the hydrological response (run-off and infiltration processes) in the watersheds. To this end, the wintertime drought intensity based on the previous 6/12 months (from March) is presented in Sect. 3. This required the quantification of the standardized precipitation evapotranspiration index (SPEI) (Berguería and Vicente-Serrano, 2017), which needs the estimation of ETP using the Hargreaves method. The SPEI was computed using the “spei” and “hargreaves” R functions (Berguería and Vicente-Serrano, 2017). These estimations allow one to assess the changes in ETP in relation to the temperature evolution. The most probable BP was also detected for the average SPEI series (via the pettitt.test function). Finally, the absolute change in the SPEI6 (SPEI computed for the prior 6 months) and SPEI12 (SPEI computed for the prior 12 months) post-1980 is also shown in Fig. S5 (RC in SPEI).
The potential time lag that soil permeability motivates in the hydrological response (i.e. impacts on WWI) was evaluated. The purpose of this was to evaluate the “extra” WWI registered during the most humid winters, due to higher infiltration processes (i.e. their implications for recharge of aquifers as well as groundwater flows) during persistent/heavy rainfall events. This analysis is of particular interest in limestone environments where the high permeability (e.g. soil porosity) guarantees high infiltration rates. Thus, the deviation between extreme percentiles of WWI and WP is quantified. Hence, a quantile–quantile deviation (QQD) test was calculated, as shown in Eq. (3):
where QQD is the difference between standardized WWI and WP anomalies averaged (horizontal bars) to the points over 90th percentile (). Therefore, higher QQD values show greater water generation, whether persistent/heavy rainfalls events occur (most humid winters), whereas lower (below zero) values show the opposite relationship.
In addition, the change in forest cover was assessed. In the NENWIRES catchments, forest cover also provides information on agricultural abandonment and human-induced afforestation of pastures. In the HILDA dataset, for our study period (1950–2010), a estimation per decade is available (seven time steps). Thus, we computed the average of their inter-decadal relative changes (DRC), as indicated in Eq. (4):
where the decadal cover (DC) represents the forest area in each time step, and the mean RC () is estimated by the average of inter-decadal changes (DRC). Therefore, this method allows us to evaluate the changes in the forest area throughout the entire study period (shown in Fig. S7 in the Supplement).
All of the aforementioned methods were used to disentangle how climate/human drivers contributed to the magnitude of short-term changes (i.e. the post-1980 strong reduction) in WWI and to estimate the principal precursor that promoted WWI changes in target catchments. Basically, a clustering methodology was applied via the K-means algorithm (“kmeans” function; R Core Team, 2021). Once basins were classified, indicators of studied variables were computed (the average) for each cluster.
3.1 Recent evolution of wintertime Iberian near-natural water inflows
The mean WWI ranged from 5 to 824 hm3 in the NENWIRES basins (Fig. 2a). Higher records were observed over the western and central sectors (400–800 hm3) as well as northern and southern areas (250–400 hm3). Lower WWIs were registered on the eastern and southern coasts (<250 hm3). Meanwhile, the trends ranged from −1.8 to 0.1 % yr−1 (Fig. 3b). A total of 97 % of WWI series showed decreases during the study period. WWI only increased in one basin, but this increase was not significant. The WWI decreases were significant in most of the catchments (55 %), mainly over central and eastern sectors. Moreover, significant reductions frequently occurred in the most humid basins. Thus, the results depict significant reductions in the headwater of the Tagus, Ebro, Douro, Segura, Júcar, and Miño basins (as defined in Fig. 1). These results agree with similar quantifications for IP basins in the literature (e.g. Lorenzo-Lacruz et al., 2012).

Figure 2Panel (a) shows the mean WWI, and panel (b) presents the standardized Sen's slope WWI trend estimates, computed as shown in Eq. (1) (Sect. 2.2). In panel (b), upward-pointing triangles represent a positive trend, and downward-pointing triangles represent a negative trend. In panel (a), significant estimates are indicated by a black outline. Contours of orography (black) and the IHBs of continental Spain (purple) are also shown (see Fig. 1).
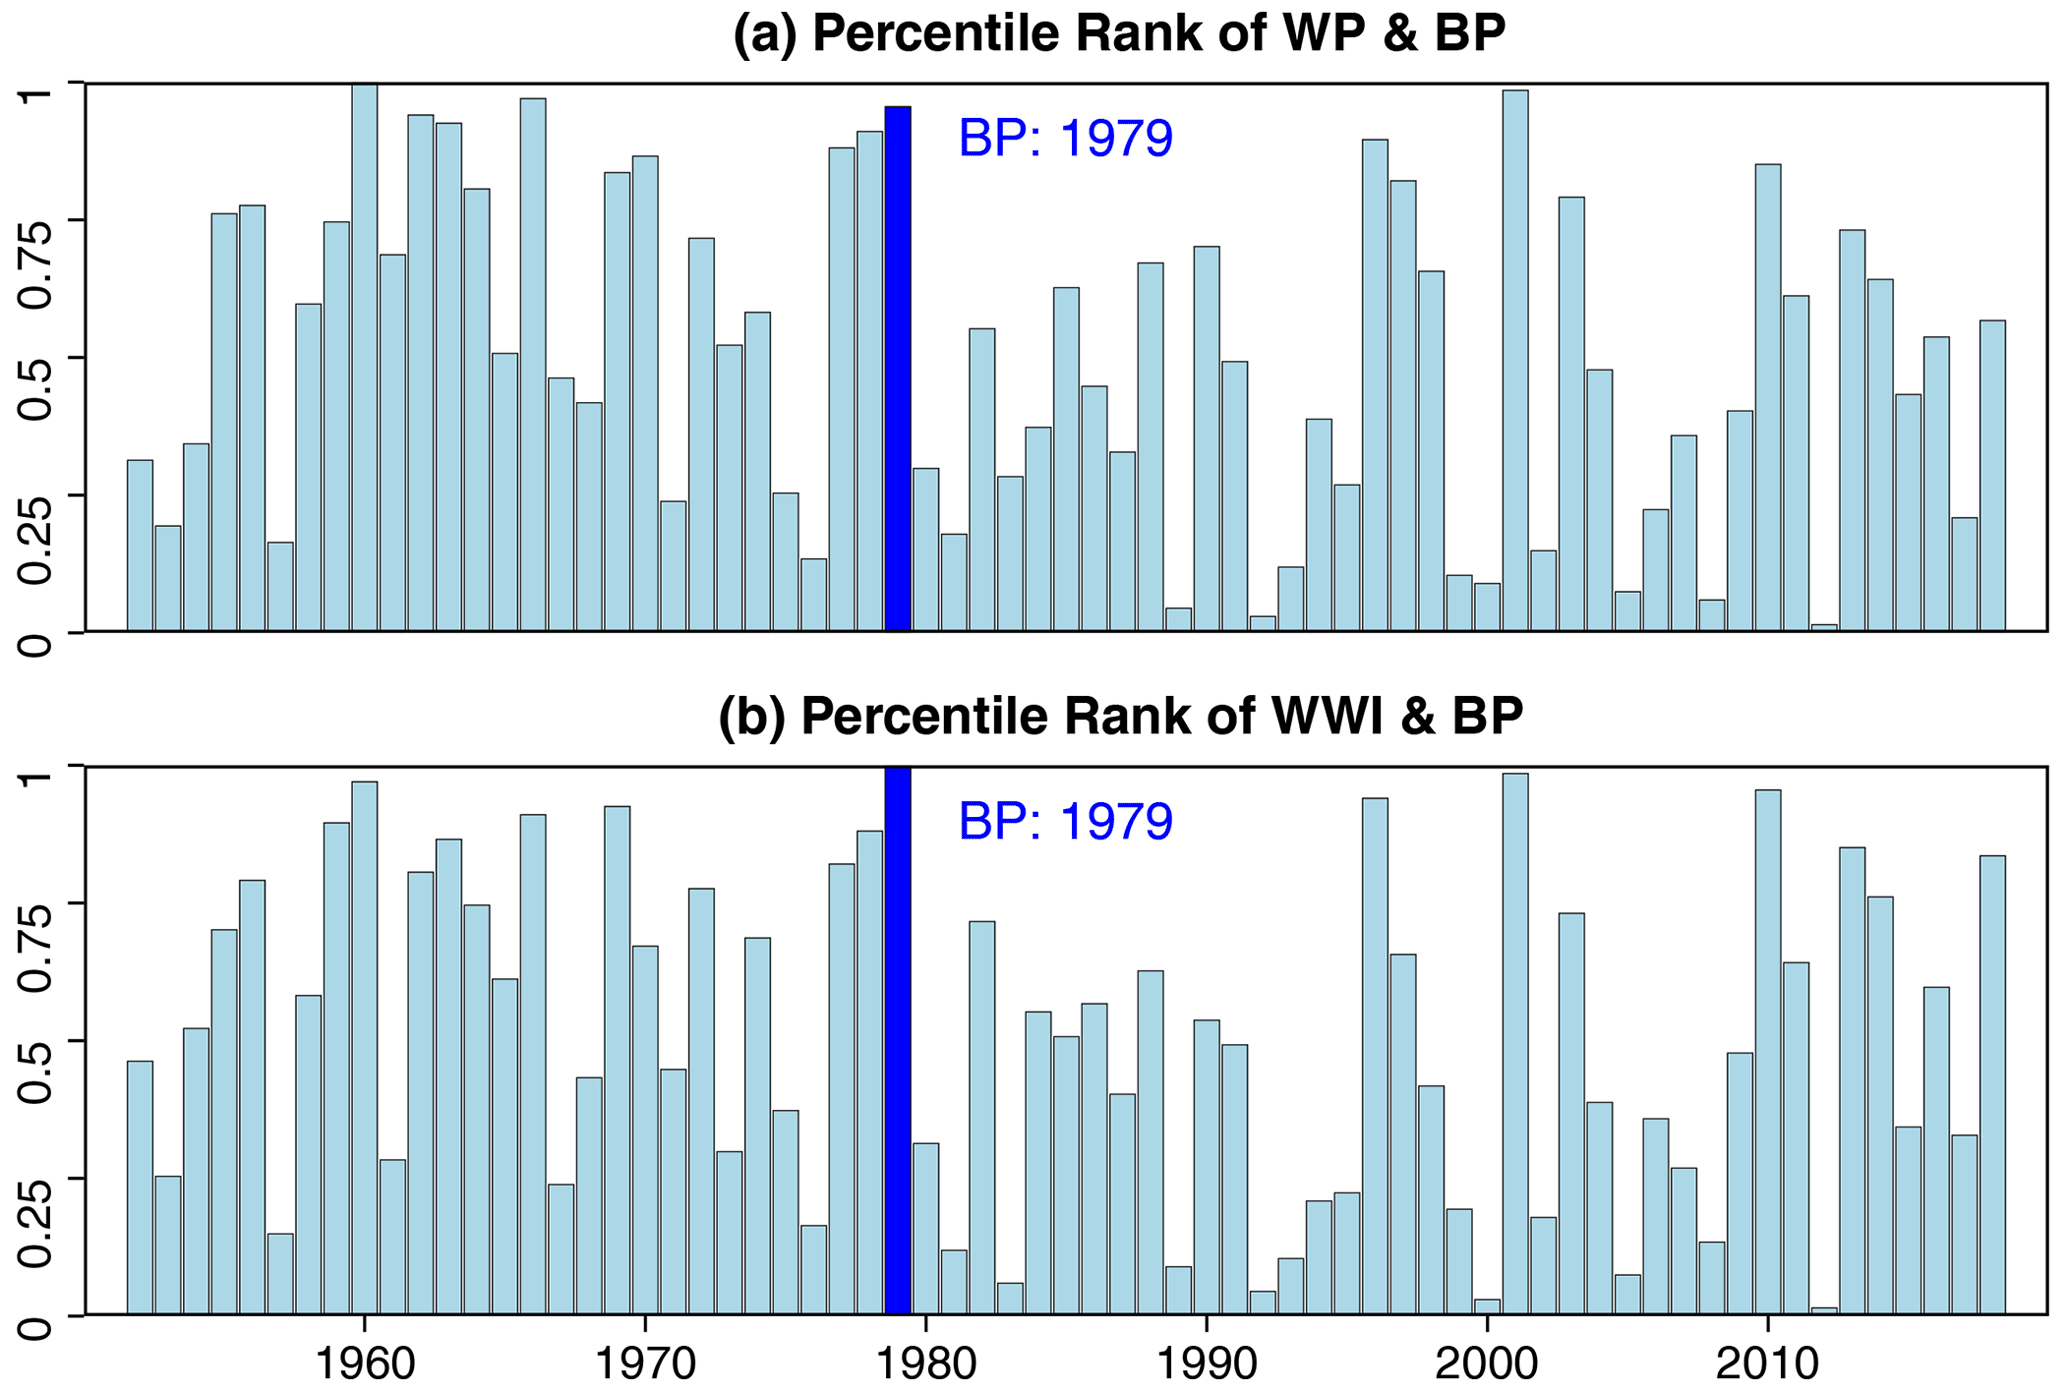
Figure 3The percentile rank of (a) average wintertime precipitation (WP) and (b) wintertime water inflows (WWIs) in the NENWIRES dataset during the period from 1952 to 2018. Vertical dark blue lines represent the most probable breakpoint (BP) detected using the Pettitt homogeneity test (Sect. 2.2).
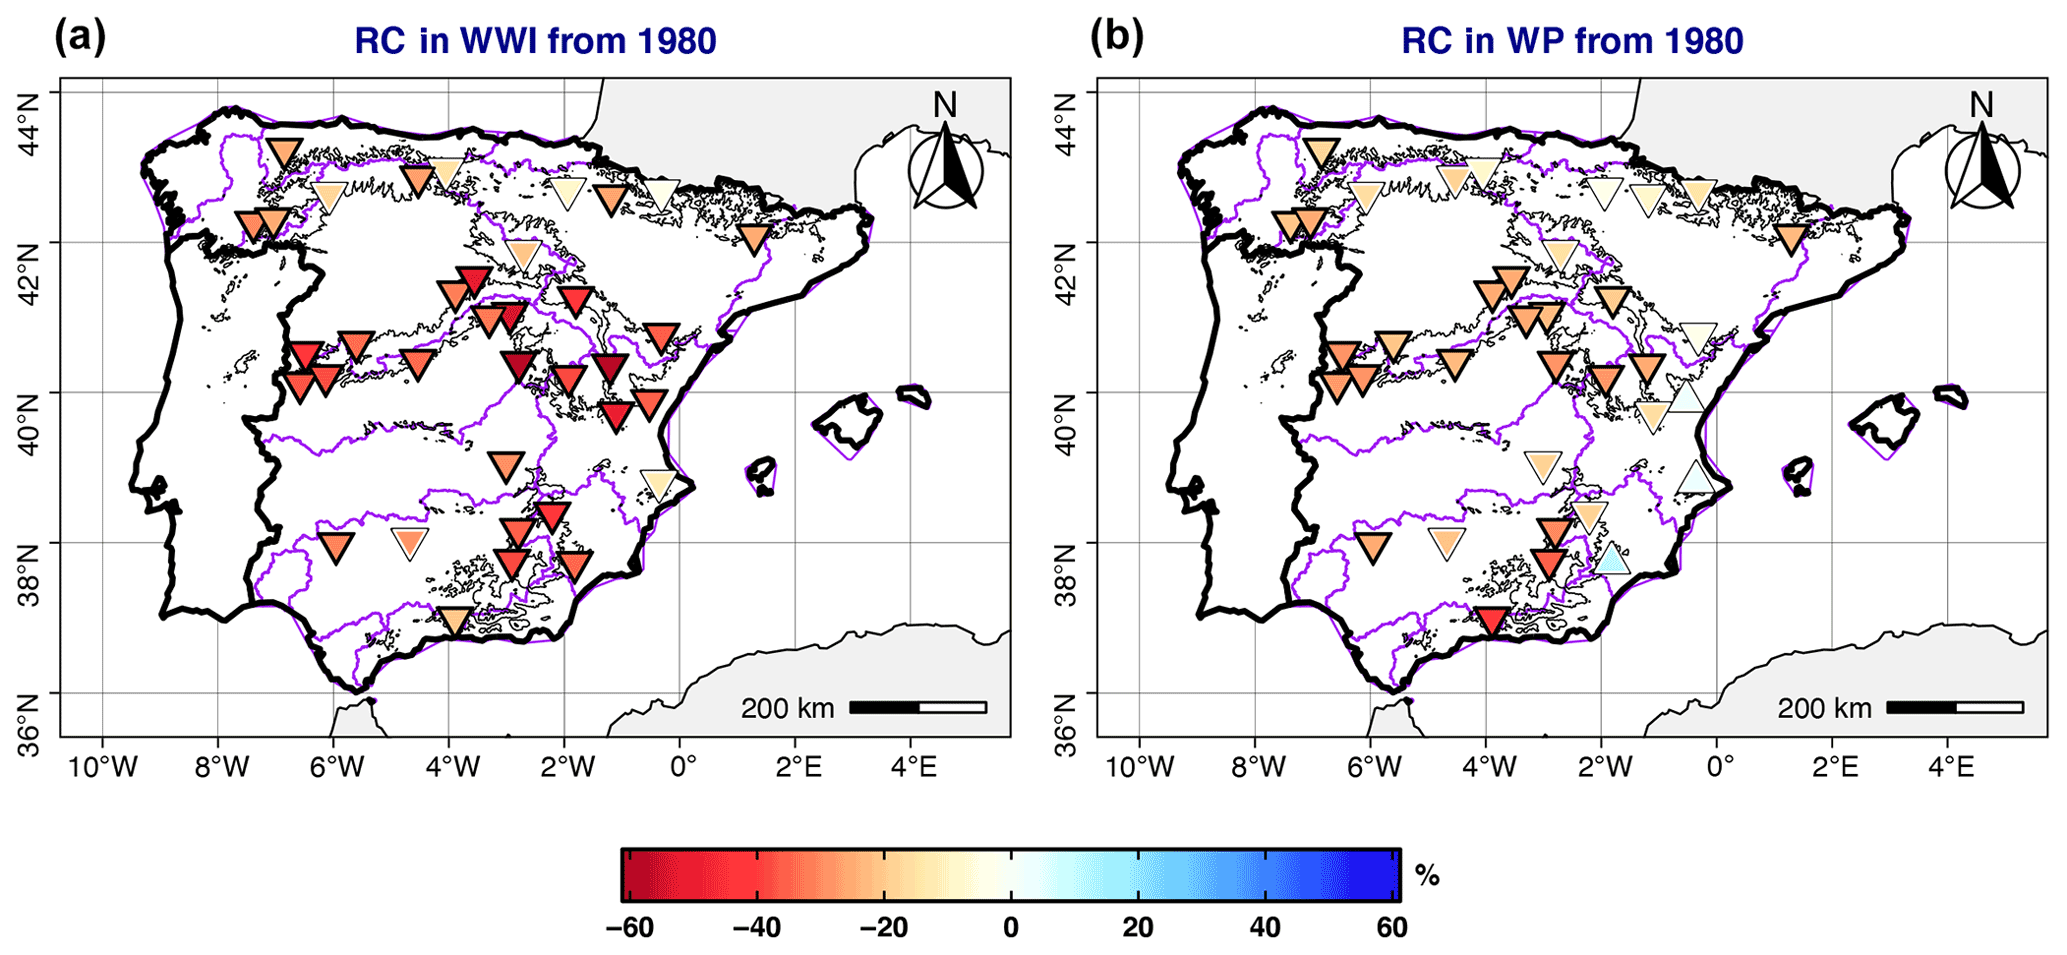
Figure 4Panel (a) outlines the relative change (RC) in WWI since 1980, and panel (b) shows the same for WP. The RC is computed as shown in Eq. (2) (Sect. 2.2). Basically, the RC analysis compares the mean during the 1980–2018 period with the mean during the former period (1952–1979). The symbols represent positive RC (upward-pointing triangle) and negative RC (downward-pointing triangle), and a black outline indicates that the estimates are significant. Contours of orography (black) and IHB for continental Spain (purple) are also shown (see Fig. 1).
3.2 Abrupt changes or trend in wintertime water inflows?
This section intends to shed some light on the question raised by Guerreiro et al. (2014) about whether WP has gradually or suddenly changed in the IP since early 1980s. The overall negative trends in WWI could obscure a strong change post-1980 (noticed in the literature). Figure 3b shows that average WWI has had a significant BP since 1979 in the NENWIRES dataset. The average WWI was 175.6 hm3 until 1979, but it has decreased by 30 % since 1980. The detection of the most probable BP for WWI was also performed at the catchment scale (Fig. S2a in the Supplement). This analysis shows that a WWI shift was detected in 1979 (41 %) as well as in 1978 (17 %) and in 1980 (14 %). Despite this, 55 % of these BP detections were significant (Fig. S2). We found a significant BP in the headwaters of the Júcar, Tagus, Segura, Guadalquivir, and Douro basins. Gómez-Martínez et al. (2018) also identified a significant BP post-1980 in annual/winter streamflow records for the Júcar headwaters, while Guerreiro et al. (2014) and Halifa-Marín et al. (2021) noticed a significant BP of WP in the western and southern IP (i.e. Tagus and Guadalquivir basins).
3.3 Does precipitation control the change in wintertime water inflows?
A similar BP analysis was conducted for the WP records. The BP detected for the average WP was found in 1979 (Fig. 3a), which matches well with the estimation for average WWI. Meanwhile, the average WP has decreased by 21 % since 1979, which represents a lower reduction than the average WWI change (∼30 %). Furthermore, a high correlation was found between both average series (0.87). For WP, the analysis at the basin scale shows that 75 % of precipitation series have a BP in 1979 (which is significant for 58 % of series), generally in the southern and western IP (Fig. S2b). However, the BP detection differed for the eastern and northern IP. These results agree with the conclusions of previous studies (Guerreiro et al., 2014; Gómez-Martínez et al., 2018; Halifa-Marín et al., 2021). In summary, it seems very likely that the reduction in precipitation provoked the WWI decrease. However, the average WP decrease was more important than the corresponding decrease in the average WWI. After characterizing the BP of WWI and WP, the RC was quantified at the basin scale for both variables since 1980 (Fig. 4).
With respect to RC, the RC in WP ranged from −40 % to 10 % (Fig. 4a), and 61 % of catchments registered a significant RC in WP. A significant RC was observed in the central areas and in the western and southern IP. Conversely, a positive RC in WP was estimated over the eastern IP. For WWI, all catchments registered losses (Fig. 4b). The RC in WWI ranged from −60 % to −3 %. Major WWI decreases were observed for the headwaters of the Tagus, Júcar, and Segura basins (central eastern IP; see Fig. 1). The magnitude of WWI losses is generally higher than the WP reductions. Moreover, WWI also decreased where WP increased post-1980. This converse pattern suggests a poor or moderate relationship between WP and WWI in several NENWIRES basins. Vicente-Serrano et al. (2019) have already evidenced the poor relationship between climate and streamflow in basins of southern Spain. The results presented here match these conclusions, given that increases (decreases) in RC were found for WP (WWI) over the southern IP. Questions arise, however, about why an abrupt decrease in WP has been registered. Hence, once could speculate about the role that the NAOi plays in WP changes. This question is analysed in the following subsection.
3.4 NAOi variability causing the post-1980 decrease in precipitation
The previous results have shown that WP and WWI have strongly decreased since the early 1980s. The scientific literature has already warned about the WP decreases in several Iberian basins, which were preliminary associated with NAOi enhancement (e.g. Trigo et al., 2004; Guerreiro et al., 2014; Gómez-Martínez et al., 2018; Halifa-Marín et al., 2021). Moreover, a significant BP in the NAOi series was detected post-1980 in this contribution (Fig. S3a in the Supplement). The average NAOi changed from −0.35 (1952–1979) to 0.38 (1980–2018). Almost identical composites of sea level pressure (SLP), geopotential height at 500 mbar (Z500), and wind speed and direction (W) between the positive (NAOi+) and negative (NAOi-) phases of the NAOi and before/after 1980 were obtained (Fig. S3b, c), which confirms that post-1980 winters generally presented NAOi+ phases. A higher frequency of NAOi+ would explain the WP declining over the IP as well as its propagation into WWI records. In fact, WP/WWI (Fig. 3) and the NAOi (Fig. S3a) have shown a significant BP since 1980. Changes in these variables post-1980 are physically coherent with the variability in the NAO. Furthermore, WP and WWI are highly correlated with the NAOi in the NENWIRES catchments (Fig. 5). The WP–NAOi correlation ranged from −0.75 to −0.1. Generally, these correlations were significant, except in the case of eastern and northern IP (see Fig. S4 in the Supplement). Higher correlations were found in those basins where BPs of WP were detected in 1979 (Fig. 7b). A strong relationship between the NAOi–WP correlation and RC in WP was also found. A significant adjusted R2 of 0.82 was quantified via linear regression between both variables, attributing the larger decreases in WP to the NAOi enhancement post-1980. Meanwhile, focusing on WWI–NAOi links, non-significant positive correlations were observed over the eastern IP (Fig. S4). In this case, correlation coefficients ranged from −0.6 to 0.2 (Fig. 5a). The NAOi–WP correlation was clearly more intense than that of NAOi–WWI. Likewise, linear regression between the WWI–NAOi correlation and RC in WWI shows a poor relationship. Therefore, the Iberian WWI abrupt reductions, understandably, depend on NAOi enhancement post-1980, whereas their magnitudes might not be essentially provoked by the WP declining. Furthermore, the NAOi shift was the principal precursor of WP decreases, especially in areas severely affected by Atlantic fronts (e.g. precipitation events coming from the Atlantic Ocean, where the NAOi influence is crucial to the precipitation regime).
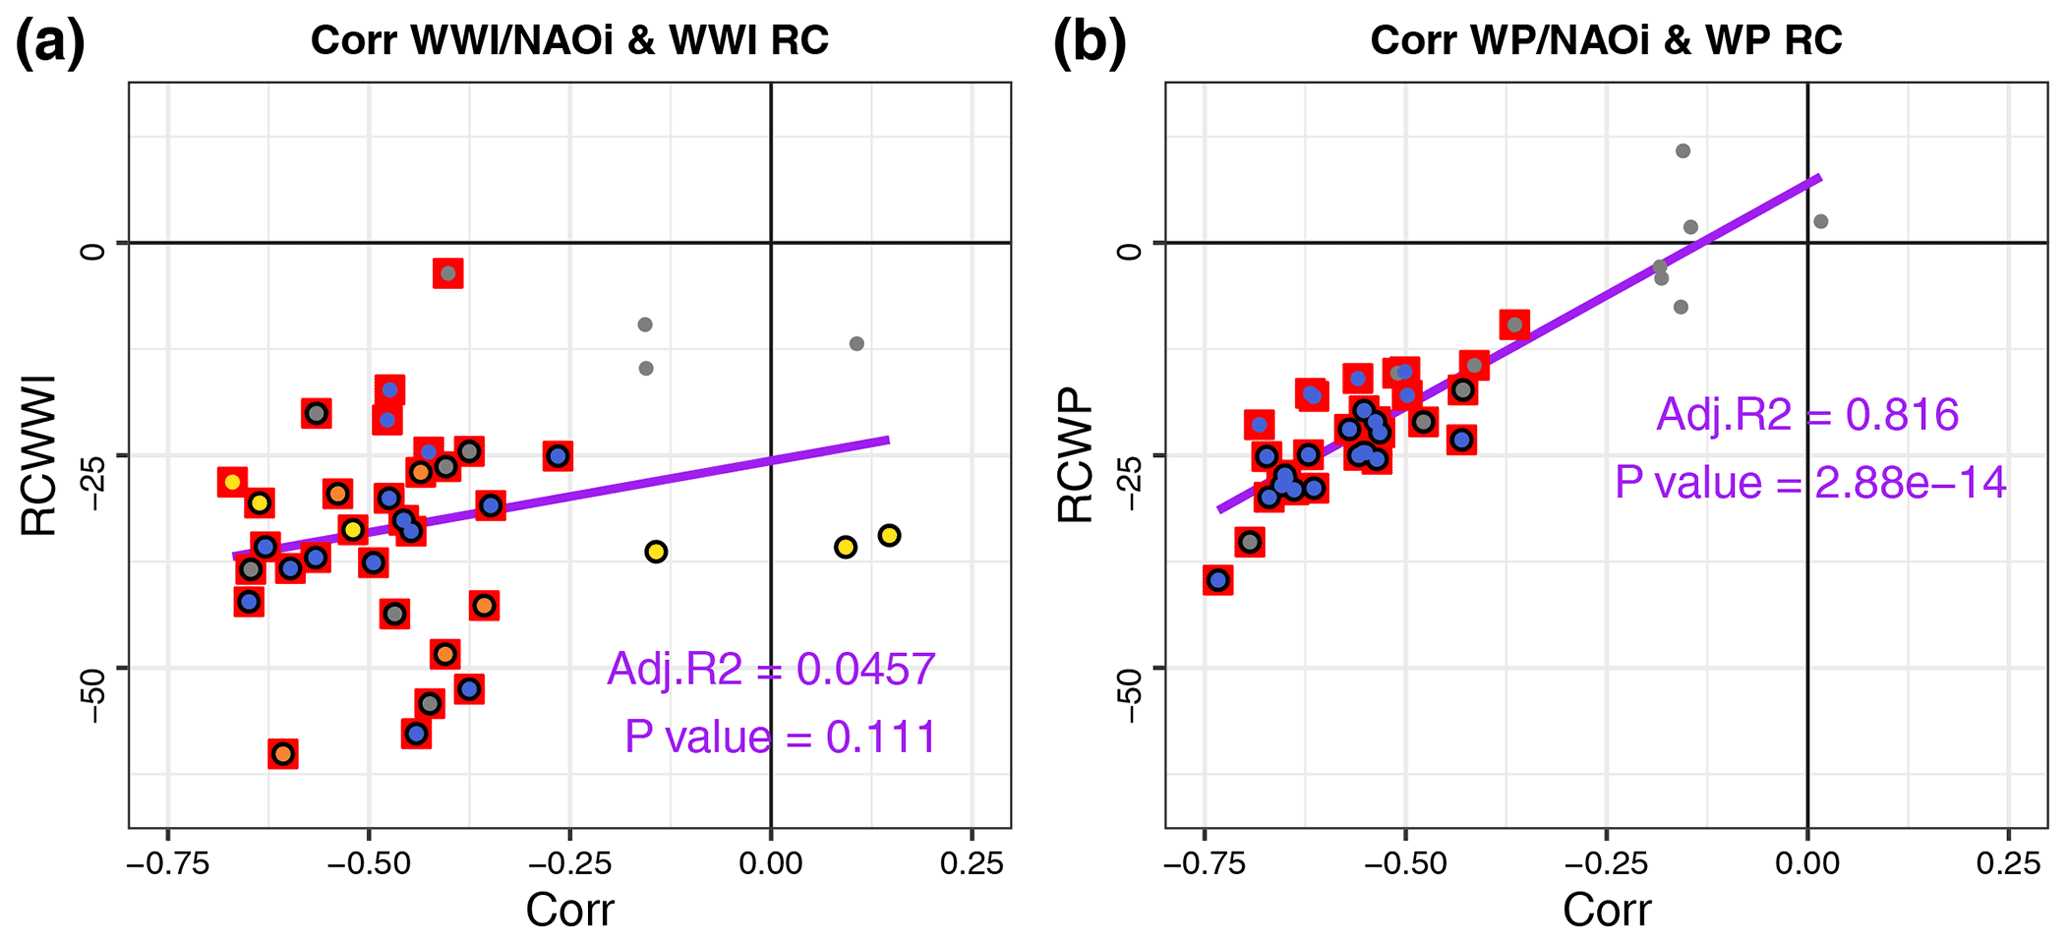
Figure 5Correlations of (a) WWI and (b) WP with NAOi (x axis) in relation to the RC in each variable (y axis). The red squares show significant correlation values; the black circles show significant RC values for each variable; and the coloured circles show the BP detected, which can be 1978 (yellow), 1979 (blue), 1980 (orange), or other (grey). The purple line and text show the linear regression coefficients.
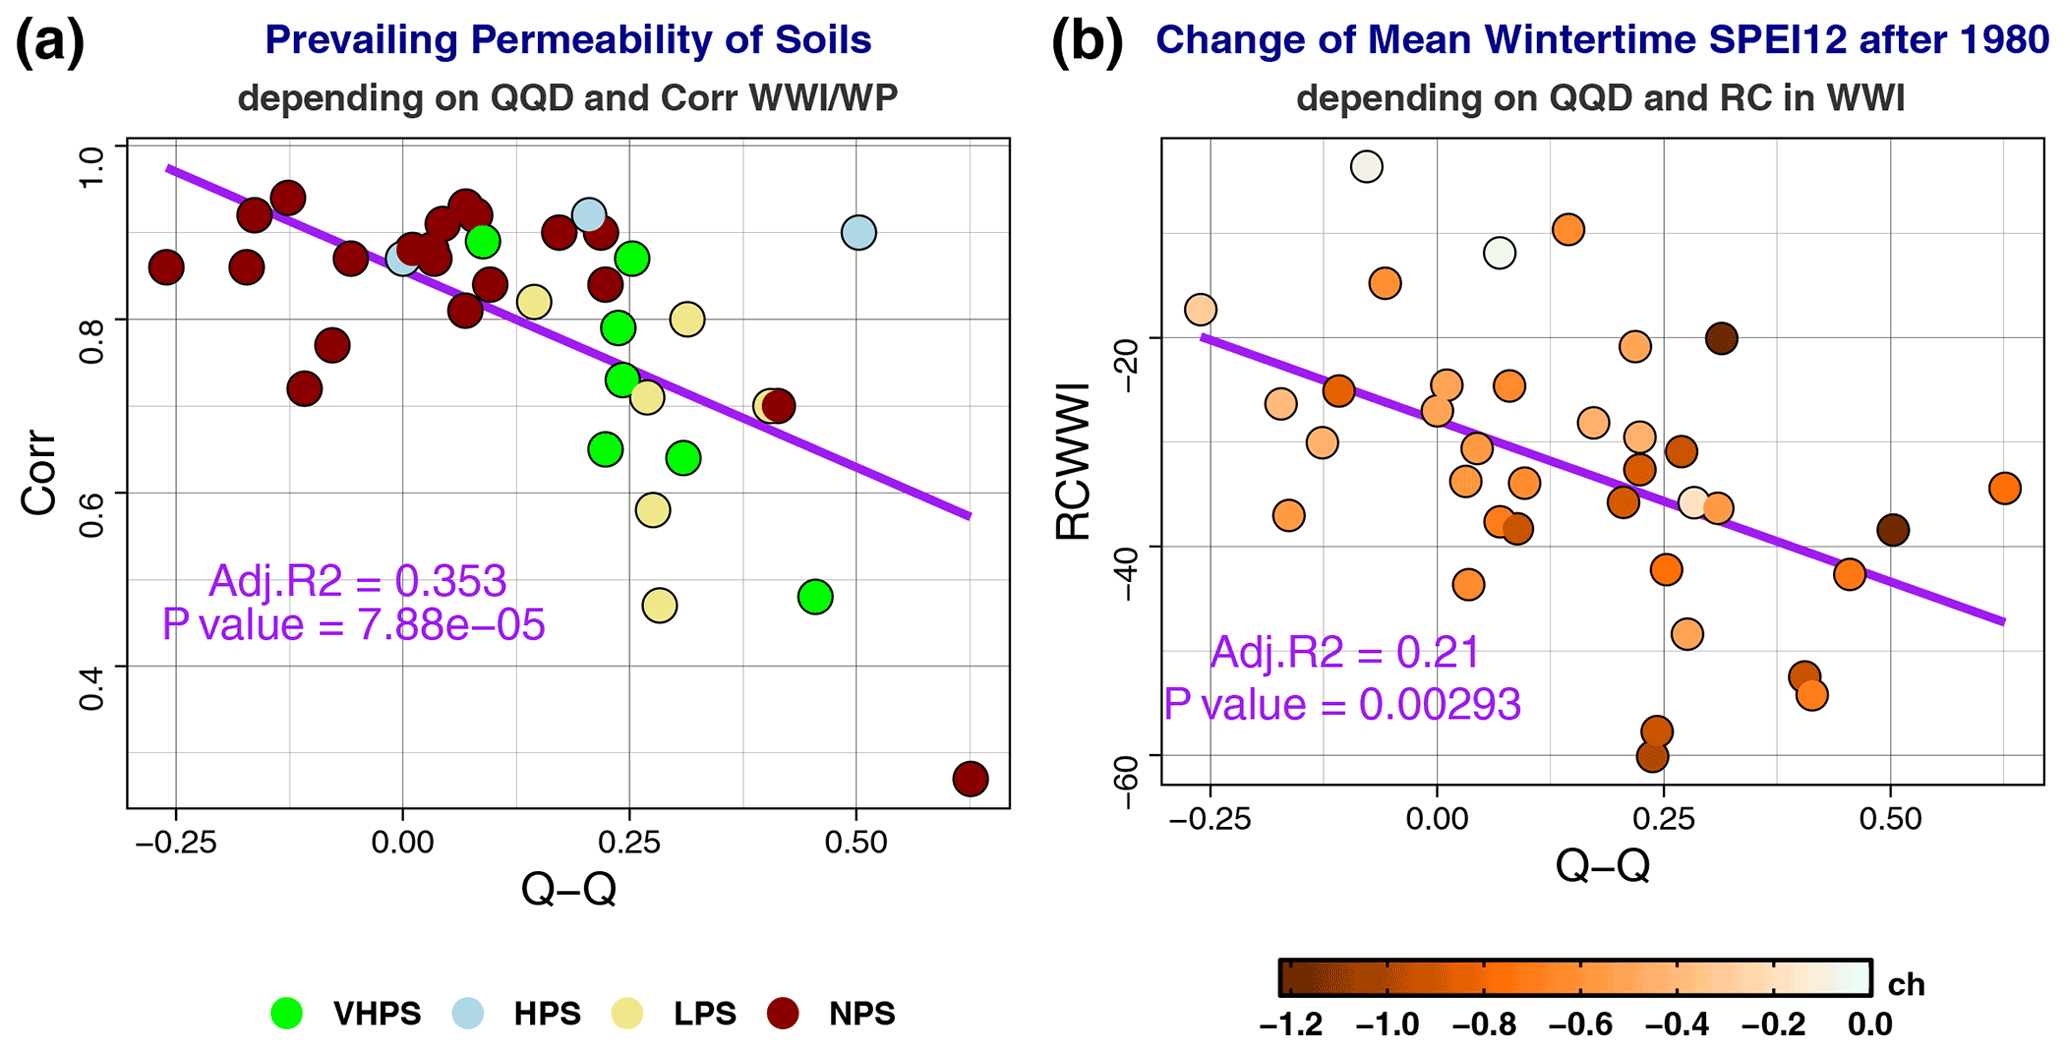
Figure 6In panel (a), symbols represent the relationship between quantile–quantile deviation (QQD; x axis) and the correlation estimated for WWI and WP (y axis); the symbols are colour-coded by the prevailing type of soil in the catchment (permeability characteristics). Soils types are defined, based on their permeability conditions, in Sect. 2.1.3. In panel (b), symbols represent links between QQD (x axis) and the RC in WWI (y axis); the symbols are colour-coded by the absolute change in mean wintertime SPEI12 before/after 1980. The purple line shows the linear regression between x–y variables, and the adjusted R2 and p values are also given.

Figure 7Scatterplot of relative changes in WP (x axis) and WWI (y axes). Symbols are colour-coded by the magnitude of several variables: (a) mean WP, (b) RC in forest cover computed following Eq. (6), (c) absolute change in SPEI12, (d) correlation between WWI and NAOi, (e) percentage of permeable soils, and (f) K-means clustering depending on the above-mentioned variables.
3.5 Propagation of prevailing drought conditions into winter water inflows
At this point, it has been depicted that several series were not driven by NAOi/WP changes (WWI declining shows an inverse/higher magnitude than WP reductions). Moreover, Vicente-Serrano et al. (2019) inferred that human-induced factors are sometimes more important that climate for understanding streamflow trends in Spain (e.g. irrigation), and Peña-Angulo et al. (2021) concluded that changes in vegetation have a strong impact on the relationship between climatic and hydrological drought over time. These conclusions infer that the assessment of the contributions of other factors to the WWI changes are required. The SPEI6/12 index was used to understand how drought conditions might impact WWI records (Sect. 2.2). The average wintertime SPEI6/12 is shown in Fig. S5 in the Supplement. The BP was detected in 1980 (SPEI12) and 1970 (SPEI6). Negative estimations clearly become more frequent in both series according to the detected BPs. For SPEI12, the BP detection agreed with the BP of the WWI/WP series. The average SPEI12 has changed from 0.37 to −0.27 since 1980. Drought conditions also prevailed in 70 % (25) of post-1980 winters. In those basins where the SPEI12 decreases (resulting in an increase in meteorological droughts conditions), WP events probably need to supply the water stress of vegetation and lower water reserves in aquifers. SPEI weakening also refers to temperature and ETP increases. The decrease in SPEI12 estimations in headwaters of Spain has previously been mentioned by the literature (Vicente-Serrano et al., 2014; Peña-Angulo et al., 2021). The mechanisms that could promote drought intensification are the decrease in cloud cover, insolation, and maximum temperature rise due to NAOi enhancement. However, further work is needed to verify this assertion. In fact, an increase in maximum temperature (∼0.9 ∘C) from 1980 is generally reported in the NENWIRES catchments (Fig. S6 in the Supplement).
On the other hand, the potential impacts on groundwater recharge/reserve due to the increase in meteorological droughts (SPEI12) have been addressed. Continental Spain shows a wide variety of soils, with permeable soils prevailing over the central and eastern IP and impermeable soils prevailing over the western IP (Fig. S7). Permeable soils exceed 80 % of the soil types present in southeastern catchments, where limestone soils are abundant. Conversely, impermeable soils reach 100 % of the soil types present over the western IP. Therefore, the relationship between soil permeability and the WP–WWI correlation was assessed (Fig. 6a). These correlation coefficients ranged from 0.3 to 0.9. Generally, WP and WWI are highly correlated (0.8–0.9) where impermeable soils prevail. It is well known that correlation between WP and WWI is more intense within impermeable basins because the run-off response is instantaneous (Lorenzo-Lacruz et al., 2013, and references therein). Conversely, some permeable watersheds have registered poor correlation between WP and WWI. After the WP–WWI correlation was estimated, the QQD (Eq. 3, Fig. 6) was quantified (the reader is referred to Sect. 2.2 for further information about QQD quantification). A significant adjusted R2 above 0.35 is found in the linear regression analysis between QQD and the WWI–WP correlation. Thus, the role of permeable soils with respect to generating higher WWI was mostly proved during humid winters (Fig. 6a). Although QQD showed negative estimates over the northern and western IP (impermeable soils), positive estimates have been found in the eastern and southern IP (highly permeable catchments).
The spatial patterns of QQD and the WWI–WP correlation are shown in Fig. S7. These results can be summarized as follows: (1) porous watersheds can infiltrate a larger volume of water; (2) extreme WP events in the region are characterized by the persistence of rainy days, even for several weeks, caused by atmospheric blocking in northern Europe/the Atlantic (e.g. the persistence of the NAO phase); (3) this persistent rain (i.e. saturated soils) allows higher water accumulation in aquifers; and (4) this water store generates an underground baseline flow connection to surface run-off. Therefore, the response between WP and WWI anomalies is higher in relation to common/dry winters. The response between WP and WWI anomalies is higher in relation to common/dry winters. This time-lag effect probably depends on the hydrological response, water yield, and the capacity of aquifers to store water. A significant adjusted R2 above 0.2 between QQD and the RC in WWI is found (Fig. 6b). Figure 6b also shows that the intensification of prevailing drought conditions (SPEI12) post-1980 was higher in those basins that registered higher RCs in the WWI decreases and a higher QQD. These results suggest that those basins, where the groundwater reserve highly contributes to WWI, have been affected by the increase in droughts conditions in the previous winter months (see the RC in water inflows and precipitation computed for warm seasons in Fig. S8 in the Supplement). There, higher reductions in WWI than WP post-1980 are physically consistent due to the implications of drought intensification for the hydrological response, especially under permeable conditions (where WWI also depends on groundwater reserve/flow). Future work should be devoted to further research this assertion. In brief, the results presented here suggest that changes in infiltration have influenced the WWI reductions, given that the prevailing soil moisture content has decreased as a result of precipitation losses at the annual scale (i.e. the previous seasons).
3.6 Does vegetation greening amplify the water inflows decline?
In the NENWIRES catchments, the extension of forest cover has generally been registered from 1950 to 2010 (Fig. S9b in the Supplement). The RC in forest cover ranged from −12 % to 15 %. Forest areas extended in 67 % of the catchments during the study period (vegetation greening), whereas forest cover did not really extend over the northern and southeastern IP. It should be noted that this study concerns the “extension” of forest cover, but its density is not evaluated. This can cause disagreement with previous studies that also found an extension of forest cover in the northern IP (e.g. García-Ruiz et al., 2011). In addition, vegetation greening was limited where forest already exceeded 80 % of the watershed dimension in 1950 (Fig. S9a). Several basins already had an extensive forest cover in 1950, especially in the northern IP; therefore, gains of forest cover mostly occurred in the semi-arid basins during the study period (Fig. 7a, b), where lower mean WP is recorded. Meanwhile the most humid basins generally registered stability or a slight reduction in forest cover. The fact that a higher dimension of forest cover impacts ETR and run-off has been shown by previous publications (e.g. Teuling et al., 2019). Thus, it is reasonable to assume that vegetation greening has contributed to exacerbating the WWI decrease in NENWIRES catchments, especially in semi-arid environments. This assertion agrees with the results of Peña-Angulo et al. (2021), who confirmed the implications of forest extension with respect to the occurrence of hydrological droughts more intense than simultaneous meteorological droughts. However, Peña-Angulo et al. (2021) do not discriminate between basins based on their precipitation regime. Therefore, the results shown here warn of potential evapotranspiration gains as a consequence of vegetation greening (e.g. extension of forest), which coexists with temperature rise.
One of the main results of this contribution is that a higher magnitude of WWI reductions is found in relation to WP losses, leading to the assumption that WP was not the only cause of the WWI decline. Hence, this study evaluated how several causes have contributed to sudden losses of Iberian WWI since 1980. To understand how each of the above-mentioned causes modulates WWI changes, K-means clustering was conducted. The analysis shows catchments where WWI changes are explained by similar mechanisms/factors (Fig. 7f and Fig. S10b in the Supplement). Four clusters that differed with respect to the contribution of each precursor are identified (Table S2 in the Supplement). Cluster 1 (C1) comprised 11.1 % of dataset and was associated with basins that were well differentiated from other NENWIRES basins. These basins (1) registered a lower mean WP (164.7 mm yr−1), (2) had the most important extension of forest cover, (3) registered a very poor WWI–NAOi correlation, (4) presented a lower intensification of droughts (SPEI12 decrease), (5) had highly permeable soils, and (6) showed a higher magnitude of WWI reductions in relation to WP losses (−32.4 %). It seems that the WP losses and forest extension drove the higher magnitude of WWI reductions in those basins. The ETP is assumed to increase due to forest extension, although SPEI12 quantifications showed no change in intensity since 1980. Therefore, although the WP does not change significantly, WWI decreased by 29.6 % due to the increase in outputs affecting the water yield. However, hydrological modelling is needed to confirm this assertion.
Cluster 2 (C2) comprises the 16.7 % of basins where (1) the mean WP is 355.2 mm yr−1, (2) permeable soils are abundant (70.1 %), (3) the WWI is highly correlated with NAOi, (4) the SPEI12 severely decreased, (5) forest cover extent increased by 2.5 %, and (6) WWI reduced more than WP (−10.8 %). WWI changes are seemingly provoked by NAOi enhancement, whereas the magnitude of the reduction was intensified by the amplification of permanent meteorological droughts since 1980, which affected to the groundwater reserves, given that C2 generally consists of permeable soils. Clearly, the extension of forest area also contributes to the decrease in WWI, as suggested for C1 basins; however, in the case of C2, forest extension was less important.
Cluster 3 (C3) includes 27.7 % of catchments where (1) the mean WP is 232.4 mm yr−1, (2) permeable soils are less frequent (40.5 %), (3) WWI is correlated with NAOi (−0.4), (4) the SPEI12 decreased by 0.9 since 1980, (5) the extension of forest cover is important (4.7 %), and (6) WWI decreased more than WP (−17.5 %). In this group of basins, the higher reduction in WWI is driven by the same processes as for C2, but C3 registered higher intensification of SPEI12 (the duration of meteorological droughts) and a larger extension of forest area. Inversely, the influence of NAOi is less important for C3. Moreover, the RC in WP was weaker.
Finally, Cluster 4 (C4) comprises 44.4 % of basins. Most humid basins are grouped into C4, where (1) the mean WP is 445.2 mm yr−1; (2) soils are mainly impermeable; (3) WWI is highly correlated with NAOi (−0.5); (4) the SPEI12 decreased by 0.5; (5) forest cover does not change (−0.1); and (6) WWI changed more than WP (−7.1), although the magnitude of change was almost similar for both variables. Clearly, WWI changes in the C4 basins were driven by NAOi enhancement and the amplification of meteorological droughts. Moreover, given that C4 basin are generally impermeable, the groundwater reserve cannot supply the decrease in surface run-off during dry events.
This contribution mainly focused on disentangling the WWI reduction post-1980, echoing the call made in Halifa-Marín et al. (2021), in order to assess the potential propagation of short-term changes in WP records into water resource variability. Therefore, the main findings of this contribution can be summarized as follows:
-
The NENWIRES dataset was created to analyse the recent evolution of near-natural Iberian water inflows draining to reservoirs in headwater catchments. We identify a significant reduction in the WWI that is related to a sudden change after 1980 for most of basins. This change agrees with the BP reported for WP by other authors and reconfirmed in this contribution. This allows one to analyse the changes reported here as the differences between two periods (1952–1979 and 1980–2018).
-
The decrease in WP is the main driver of the decline in WWI. However, a higher magnitude of WWI losses compared with WP reductions has been generally quantified. These extra water losses are believed to depend on the extension of vegetation and the moisture content of soils (e.g. its permeability characteristics), which, in turn, also differed between the variety of climate conditions (e.g. precipitation regimes).
-
A strong reduction in WWI has been observed in a set of semi-arid catchments, where WP slightly increased and where the NAOi does not exert an important influence. Those basins (grouped in the C1 cluster) are characterized by permeable soils, which are affected by the most important extension of vegetation. Thus, it is assumed that this vegetation greening in semi-arid environments, where water storage of soils is abundant, has provoked significant evapotranspiration increases. Consequently, those water losses have decreased the WWI records. Similar assertions are concluded for catchments classified in the C3 cluster, where WP is promoted by the NAOi influence, although they also are semi-arid environments. C3 catchments registered the higher decreases in WWI.
-
Another set of the most humid catchments (C4 cluster) is characterized by impermeable soils and unchanged vegetation cover. In these basins, the magnitude of WWI and WP reductions is quite similar. Meanwhile, the WP of catchments grouped into the C2 cluster is characterized by a strong influence from the NAOi and the extension of vegetation. Therefore, higher reductions in WWI are observed in relation to C4 catchments.
These assertions allow for the conclusion that higher mean precipitation (i.e. winter/annual) induces a minor role of evapotranspiration/infiltration losses into water resource changes. Nonetheless, water generation in semi-arid catchments is widely affected by those losses, which can play a main role that is as important as the decrease in precipitation.
The conclusions to this contribution confirm that the initial hypothesis was inaccurate, as WWI changes essentially do not depend on climate in the set of NENWIRES catchments. Short-term changes (i.e. sudden decreases in water resources) do not impact water planning in the same way as gradual changes; therefore, policies adapted to this short-term mode of climate variability are recommended. The findings presented here consequently encourage the development of a deeper knowledge of NAOi predictability under a warmer climate as well as the implementation of high-resolution modelling considering the water losses due to vegetation extension and soil moisture content, especially in semi-arid environments where the availability of freshwater is crucial. It should be noted that the accuracy of the caveats presented here depends on the intrinsic uncertainties in datasets used. In addition, a source of error in the BP estimation could be caused by missing values in several WWI series; however, we identified a significant BP from 1978 to 1980 in both full series and series with some missing values, which shows a robust geographical pattern. As concluded by Peña-Angulo et al. (2020) for precipitation, other short-term changes in water resources (e.g. due to abrupt decreases/increases in precipitation) have been registered since 1850, but this does not reduce our interest in understanding the post-1980s drop in hydroclimate series in the IP, even if it is mostly due to internal variability in the climate system. Indeed, the interplay of these short-term hydroclimate changes and the warmer climate still are unknown.
The NENWIRES dataset is available from the corresponding author upon request. Moreover, all datasets used in this contribution (assets) are publicly available from the following sources: the Spanish catchments boundaries dataset can be accessed at https://www.miteco.gob.es/es/cartografia-y-sig/ide/descargas/agua/cuencas-y-subcuencas.aspx (IDE, 2022); the HILDA (HIstoric Land Dynamics Assessment) dataset can be accessed at https://www.wur.nl/en/Research-Results/Chair-groups/Environmental-Sciences/Laboratory-of-Geo-information-Science-and-Remote-Sensing/Models/Hilda/HILDA-data-downloads.htm (HILDA, 2022); the North Atlantic Oscillation index is available from https://www.cpc.ncep.noaa.gov/products/precip/CWlink/pna/nao.shtml (NOAA, 2022); the NCEP/NCAR Reanalysis 1 climate data are available from https://psl.noaa.gov/data/gridded/data.ncep.reanalysis.html (PSL-NOAA, 2022); the permeability of soils dataset can be accessed at http://mapas.igme.es/Servicios/default.aspx#IGME_Permeabilidad_1M (IGME, 2022); the observational monthly water inputs series are available from https://ceh.cedex.es/anuarioaforos/demarcaciones.asp (CEDEX, 2022); and the Spanish precipitation/temperature gridded dataset can be accessed at http://www.aemet.es/es/serviciosclimaticos/cambio_climat/datos_diarios?w=2 (AEMET, 2022). These datasets are also referred to in the main text.
The supplement related to this article is available online at: https://doi.org/10.5194/hess-26-4251-2022-supplement.
AH-M conceived the original idea and designed the overall study. AH-M, EP-S, and MT-V developed the NENWIRES dataset. AH-M and JPM performed the analysis. All co-authors contributed to the interpretation of the results. AH-M led the writing of the paper, with contributions from PJ-G and JPM.
The contact author has declared that none of the authors has any competing interests.
Publisher's note: Copernicus Publications remains neutral with regard to jurisdictional claims in published maps and institutional affiliations.
This article is part of the special issue “Hydrological cycle in the Mediterranean (ACP/AMT/GMD/HESS/NHESS/OS inter-journal SI)”. It is not associated with a conference.
The authors thank the reviewers and the editor of the paper for their valuable contributions and fruitful discussions.
This research has been supported by the ECCE project (grant no. PID2020-115693RB-I00) of the Ministerio de Ciencia e Innovación/Agencia Estatal de Investigación (MCIN/AEI/10.13039/501100011033/). Amar Halifa-Marín is grateful for his predoctoral contract (FPU18/00824) with the Ministerio de Ciencia, Innovación y Universidades of Spain. Enrique Pravia-Sarabia acknowledges his predoctoral contract with the ACEX project. Marc Lemus-Canovas is grateful for his predoctoral contract (FPU17/02166) with the Ministerio de Ciencia, Innovación y Universidades of Spain.
This paper was edited by Erwin Zehe and reviewed by Adriaan J. (Ryan) Teuling, Sergio Martín Vicente Serrano, and one anonymous referee.
AEMET: Precipitation/Temperature Gridded [data set], https://www.aemet.es/es/serviciosclimaticos/cambio_climat/datos_diarios?w=2, last access: 9 August 2022.
Beguería, S., Vicente-Serrano, S. M., and Beguería, M. S.: Package `spei'. Calculation of the Standardised Precipitation-Evapotranspiration Index, CRAN [Package], https://cran.r-project.org/web/packages/SPEI/index.html (last access: 20 October 2021), 2017.
Borchers, H. W.: Package `pracma', Practical Numerical Math Functions, CRAN [Package], https://CRAN.R-project.org/package=pracma (last access: 20 October 2021), 2019.
CEDEX: Spanish Hydrological Repository [data set], https://ceh.cedex.es/anuarioaforos/demarcaciones.asp, last access: 9 August 2022.
de Luis, M., Brunetti, M., González-Hidalgo, J. C., Longares, L. A., and Martin-Vide, J.: Changes in seasonal precipitation in the Iberian Peninsula during 1946–2005, Global Planet. Change, 74, 27–33, https://doi.org/10.1016/j.gloplacha.2010.06.006, 2010.
Fuchs, R., Herold, M., Verburg, P. H., Clevers, J. G. P. W., and Eberle, J.: Gross Changes in Reconstructions of Historic Land Cover/Use for Europe between 1900 and 2010, Glob. Change Biol., 21, 299–313, https://doi.org/10.1111/gcb.12714, 2015.
García-Ruiz, J. M., López-Moreno, J. I., Vicente-Serrano, S. M., Lasanta–Martínez, T., and Beguería, S.: Mediterranean water resources in a global change scenario, Earth-Sci. Rev., 105, 121–139, https://doi.org/10.1016/j.earscirev.2011.01.006, 2011.
Gómez-Martínez, G., Pérez-Martín, M. A., Estrela-Monreal, T., and del-Amo, P.: North Atlantic Oscillation as a Cause of the Hydrological Changes in the Mediterranean (Júcar River, Spain), Water Resour. Manag., 32, 2717–2734, https://doi.org/10.1007/s11269-018-1954-0, 2018.
Gudmundsson, L., Boulange, J., Do, H. X., Gosling, S. N., Grillakis, M. G., Koutroulis, A. G., Leonard, M., Liu, J., Schmied, H. M., Papadimitriou, L., Pokhrel, Y., Seneviratne, S., Satoh, Y., Thiery, W., Westra, S., Zhang, X., and Zhao, F.: Globally observed trends in mean and extreme river flow attributed to climate change, Science, 371, 1159–1162, https://doi.org/10.1126/science.aba3996, 2021.
Guerreiro, S. B., Kilsby, C. G., and Serinaldi, F.: Analysis of time variation of rainfall in transnational basins in Iberia: Abrupt changes or trends?, Int. J. Climatol., 34, 114–133, https://doi.org/10.1002/joc.3669, 2014.
Halifa-Marín, A., Lorente-Plazas, R., Pravia-Sarabia, E., Montávez, J. P., and Jiménez-Guerrero, P.: Atlantic and Mediterranean influence promoting an abrupt change in winter precipitation over the southern Iberian Peninsula, Atmos. Res., 253, 105485, https://doi.org/10.1016/j.atmosres.2021.105485, 2021.
Hannaford, J., Buys, G., Stahl, K., and Tallaksen, L. M.: The influence of decadal-scale variability on trends in long European streamflow records, Hydrol. Earth Syst. Sci., 17, 2717–2733, https://doi.org/10.5194/hess-17-2717-2013, 2013.
HILDA: HIstoric Land Dynamics Assessment Dataset [data set], https://www.wur.nl/en/Research-Results/Chair-groups/Environmental-Sciences/Laboratory-of-Geo-information-Science-and-Remote-Sensing/Models/Hilda.htm, last access: 9 August 2022.
Hothorn, T., Winell, H., Hornik, K., van de Wiel, M. A., and Zeileis, A.: Package `coin', Conditional Inference Procedures in a Permutation Test Framework, CRAN [Package], https://CRAN.R-project.org/package=coin (last access: 20 October 2021), 2019.
IDE: Spanish Catchment Boundaries [data set], https://www.miteco.gob.es/es/cartografia-y-sig/ide/descargas/agua/cuencas-y-subcuencas.aspx, last access: 9 August 2022.
IGME: Mid-Resolution Permeability of Soils [data set], http://mapas.igme.es/Servicios/default.aspx#IGME_Permeabilidad_1M, last access: 9 August 2022.
Lorenzo-Lacruz, J., Vicente-Serrano, S. M., López-Moreno, J. I., Morán-Tejeda, E., and Zabalza, J.: Recent Trends in Iberian Streamflows (1945–2005), J. Hydrol., 414–415, 463–475, https://doi.org/10.1016/j.jhydrol.2011.11.023, 2012.
Lorenzo-Lacruz, J., Vicente-Serrano, S. M., González-Hidalgo, J. C., López-Moreno, J. I., and Cortesi, N.: Hydrological drought response to meteorological drought in the Iberian Peninsula, Clim. Res., 58, 117–131, https://doi.org/10.3354/cr01177, 2013.
Luo, D. and Gong, T.: A possible mechanism for the eastward shift of interannual NAO action centers in last three decades, Geophys. Res. Lett., 33, L24815, https://doi.org/10.1029/2006GL027860, 2006.
Massei, N., Kingston, D. G., Hannah, D. M., Vidal, J.-P., Dieppois, B., Fossa, M., Hartmann, A., Lavers, D. A., and Laignel, B.: Understanding and predicting large-scale hydrological variability in a changing environment, Proc. IAHS, 383, 141–149, https://doi.org/10.5194/piahs-383-141-2020, 2020.
NOAA: The North Atlantic Oscillation Index [data set], https://www.cpc.ncep.noaa.gov/products/precip/CWlink/pna/nao.shtml, last access: 9 August 2022.
Peña-Angulo, D., Vicente-Serrano, S. M., Domínguez-Castro, F., Murphy, C., Reig, F., Tramblay, Y., Trigo, R. M., Luna, M. Y., Turco, M., Noguera, I., Aznárez-Balta, M., Garcia-Herrera, R., Tomas-Burguera, M., and El Kenawy, A.: Long-term precipitation in Southwestern Europe reveals no clear trend attributable to anthropogenic forcing, Environ. Res. Lett., 15, 094070, https://doi.org/10.1088/1748-9326/ab9c4f, 2020.
Peña-Angulo, D., Vicente-Serrano, S. M., Domínguez-Castro, F., Noguera, I., Tomas-Burguera, M., López-Moreno, J. I., Lorenzo-Lacruz, J., and El Kenawy, A.: Unravelling the role of vegetation on the different trends between climatic and hydrologic drought in headwater catchments of Spain, Anthropocene, 36, 100309, https://doi.org/10.1016/j.ancene.2021.100309, 2021.
Pohlert, T.: Package `trend', Non-parametric Trend Tests and Change-Point Detection, CRAN [Package], https://CRAN.R-project.org/package=trend (last access: 20 October 2021), 2018.
PSL-NOAA: NCEP/NCAR Reanalysis 1 climate data, https://psl.noaa.gov/data/gridded/data.ncep.reanalysis.html, last access: 9 August 2022.
R Core Team: A language and environment for statistical computing, R Foundation for Statistical Computing, https://rdrr.io/r/base/base-package.html, last access: 20 October 2021.
Stahl, K., Hisdal, H., Hannaford, J., Tallaksen, L. M., van Lanen, H. A. J., Sauquet, E., Demuth, S., Fendekova, M., and Jódar, J.: Streamflow trends in Europe: evidence from a dataset of near-natural catchments, Hydrol. Earth Syst. Sci., 14, 2367–2382, https://doi.org/10.5194/hess-14-2367-2010, 2010.
Teuling, A. J., de Badts, E. A. G., Jansen, F. A., Fuchs, R., Buitink, J., Hoek van Dijke, A. J., and Sterling, S. M.: Climate change, reforestation/afforestation, and urbanization impacts on evapotranspiration and streamflow in Europe, Hydrol. Earth Syst. Sci., 23, 3631–3652, https://doi.org/10.5194/hess-23-3631-2019, 2019.
Tramblay, Y., Llasat, M. C., Randin, C., and Coppola, E.: Climate change impacts on water resources in the Mediterranean, Reg. Environ. Change, 20, 83, https://doi.org/10.1007/s10113-020-01665-y, 2020.
Trigo, R. M., Pozo-Vázquez, D., Osborn, T. J., Castro-Díez, Y., Gámiz-Fortis, S., and Esteban-Parra, M. J.: North Atlantic oscillation influence on precipitation, river flow and water resources in the Iberian Peninsula, Int. J. Climatol., 24, 925–944, https://doi.org/10.1002/joc.1048, 2004.
Vicente-Serrano, S. M., Lopez-Moreno, J. I., Beguería, S., Lorenzo- Lacruz, J., Sanchez-Lorenzo, A., García-Ruiz, J. M., Azorín-Molina, C., Morán-Tejeda, E., Revuelto, J., Trigo, R., Coelho, F., and Espejo, F.: Evidence of increasing drought severity caused by temperature rise in southern Europe, Environ. Res. Lett., 9, 044001, https://doi.org/10.1088/1748-9326/9/4/044001, 2014.
Vicente-Serrano, S. M., Peña-Gallardo, M., Hannaford, J., Murphy, C., Lorenzo-Lacruz, J., Dominguez-Castro, F., López-Moreno, J. I., Berguería, S., Noguera, I., Harrigan, S., and Vidal, J. P.: Climate, irrigation, and land cover change explain streamflow trends in countries bordering the 100 northeast Atlantic, Geophys. Res. Lett., 46, 10821–10833, https://doi.org/10.1029/2019GL084084, 2019.
Wang, Y. H., Magnusdottir, G., Stern, H., Tian, X., and Yu, Y.: Uncertainty estimates of the EOF-derived North Atlantic Oscillation, J. Climate, 27, 1290–1301, https://doi.org/10.1175/JCLI-D-13-00230.1, 2014.