the Creative Commons Attribution 4.0 License.
the Creative Commons Attribution 4.0 License.
 | 28 Jul 2022
Changes in nonlinearity and stability of streamflow recession characteristics under climate warming in a large glaciated basin of the Tibetan Plateau
Jiarong Wang
Man Gao
Qi Hu
Jintao Liu
The accelerated climate warming in the Tibetan Plateau after 1997 has profound consequences in hydrology, geography, and social wellbeing. In hydrology, the change in streamflow as a result of changes in dynamic water storage that originated from glacier melt and permafrost thawing in the warming climate directly affects the available water resources for societies of the most populated nations in the world. In this study, annual streamflow recession characteristics are analyzed using daily climate and hydrological data during 1980–2015 in the Yarlung Zangbo River basin (YRB) of the southern Tibetan Plateau. The recession characteristics are examined in terms of = − aQb and the response/sensitivity of streamflow to changes in groundwater storage. Major results show that climate warming has significantly increased the nonlinearity of the response (b) and streamflow stability [log(a)] in most subbasins of the YRB. These changes in the recession characteristics are attributed to the opposite effects of increases in the available water storage and recession timescale on the recession. Climate warming has increased subbasin water storage considerably due to more recharge from accelerated glacier melting and permafrost thawing after 1997. Meanwhile, the enlarged storage lengthens recession timescales and thereby decreases the sensitivity of discharge to storage. In the recession period when recharge diminished, increased evaporation and the decreased buffering effect of frost soils under warmer temperatures accelerate the initial recession of streamflow. By contrast, enlarged storage and lengthened recession timescales slow down the recession. While reservoir regulations in some basins have helped reduce and even reverse some of these climate warming effects, this short-term remedy can only function before the solid water storage is exhausted should the climate warming continue.
- Article
(8608 KB) - Full-text XML
- BibTeX
- EndNote


The warming rates of air temperature in high latitudes and high altitudes are greater than the rate of change in global average near-surface air temperature (e.g., Pepin et al., 2015). The greater climate warming has accelerated glacier melting and permafrost thawing in cold alpine regions, causing significant glacier and permafrost retreats (e.g., Yao et al., 2004, 2007) and landscape alternations (e.g., Niu et al., 2019). These changes undoubtedly alter the hydrodynamics of streamflow and groundwater storage in the alpine regions and their downstream tributaries (Bense et al., 2012; Walvoord and Striegl, 2007; Walvoord and Kurylyk, 2016; Li et al., 2018; Wang et al., 2018; Yi et al., 2021). A recent study of Wang et al. (2021) has shown that such changes have also caused changes in the precipitation–streamflow relationship. The societal impacts of these changes are profound because they redefine freshwater availability and its seasonality for populations of billions in the downstream tributaries (e.g., Cuo et al., 2014; Zhang et al., 2013; Wang et al., 2020).
Many studies have found that the compound effects of glacier and permafrost retreats in the past few decades have reshaped the groundwater flow and hydrological cycle (e.g., Bring et al., 2016; Forster et al., 2014; Ji et al., 2020; Walvoord and Kurylyk, 2016). The accelerated glacier melting and permafrost thawing have increased the soil active layer thickness (ALT) and therefore enlarged groundwater storage and allowed the exchange of surface water and groundwater (Xu et al., 2017; Forster et al., 2014; Ji et al., 2020). Such an exchange further alters streamflow composition in arctic catchments (Chang et al 2008; Walvoord and Kurylyk, 2016; Bring et al., 2016) and in the northeastern and southern Tibetan Plateau (TP; Li et al., 2018; Wang et al., 2018; Yi et al., 2021).
In those catchments, changes in groundwater storage and the subsurface moisture profile due to permafrost retreat could reroute subsurface flow paths during low flows (Koch et al., 2014; Payn et al., 2012). The thickened ALT allows infiltration through the previously permafrost layer into aquifers and thus increases the recharge in permafrost basins. It has been reported that the permafrost loss in the past decades has enhanced regional groundwater circulation (shortening its timescale) with more discharge to stream flows (Ji et al., 2020; Walvoord et al., 2012). As an example, the baseflow in the source region of the Yangtze River increased at a rate of 1.35 mm a−1 during 1962–2012, following the annual temperature rise of 1.32 ∘C (Yi et al., 2021) and 1.09 mm a−1 during 1979–2013 in glacierized basins in the TP, with its annual temperature rise of 0.98 ∘C (Lin et al., 2020). Walvoord and Striegl (2007) found that the groundwater contribution to streamflow in an arctic basin increased by 0.7 %–0.9 % per year from the 1950s to 2005, following its annual temperature rise of 1.24 ∘C during that period.
The effects of these changes in water budget and subsurface moisture profile on hydrographs are complicated in high altitude/frozen areas. The increase in ALT could reduce the buffering effect of soils on streamflow variability and thereby increase the baseflow recession rate (Lyon et al., 2009; Lyon and Destouni, 2010; Brutsaert and Hiyama, 2012). On the other hand, the increase in ALT enlarges groundwater storage and subsequently strengthens aquifer regulations on groundwater flow and slows the recession rate (Lin et al., 2020; Mao and Wang, 2016). These effects on the recession rate can result in the strongly nonlinear behavior of streamflow in time and space.
During periods of little or no precipitation, the baseflow recession ( vs. Q, where Q is discharge) is typically described by a power law = − aQb (Brutsaert and Nieber, 1977; Tallaksen, 1995). The depletion of baseflow in relation to the parameters a and b contains valuable information concerning storage properties and aquifer characteristics of basins (Tallaksen, 1995). The recession-scale parameter a is a function of the hydraulic and geometric properties of the aquifer of a basin and can be used as a proxy for determining the effective depth of permafrost in frozen areas (Lyon and Destouni, 2010). The parameter b as reflected in the concavity of the hydrograph or the nonlinearity of recession (Dralle et al., 2017) is a function of boundary conditions to describe the equivalent water depth profile of an aquifer (Brutsaert and Nieber, 1977; Tashie et al., 2020). So, b can be interpreted as a measure of the diversity of water transport timescales throughout various parts of a catchment (Harman et al., 2009). Therefore, the variations in a and b in time and space can describe recession characteristics of a basin (e.g., Brutsaert and Nieber, 1977; Kirchner, 2009).
For the effects of a and b on the recession characteristics, Tashie et al. (2019) defined log(a) as the stability of streamflow and b as recession nonlinearity. For individual events, an increase in the relative value of a between events indicates decreased streamflow stability, while an increase in b indicates increased nonlinearity. Changes in the recession characteristics in time reflect their vulnerability to climatic and anthropogenic forcings (Berghuijs et al., 2016; Brooks et al., 2015; Buttle, 2018). Streamflow stability, log(a), has a significant seasonal cycle in over 99 % of the basins in the continental United States (Tashie et al., 2020). Moistening climate in catchments could increase the diversity of flow paths and the nonlinear relationships between storage/recharge and discharge (Brutsaert and Nieber, 1977; Hinzman et al., 2020). In cold climate regions, reduced glacier size can lead to considerable amplification of the seasonality of streamflow (Juen et al., 2007; Vuille et al., 2008). Hinzman et al. (2020) reported a widespread increase in the nonlinearity of recessions in northern Sweden due to climate warming. In addition, they found that this nonlinearity is significantly higher in warm winters than in cold winters. These analyses were performed under the assumption that a and b are effectively decorrelated. However, because changes in a in time are dependent on discharge Q, log(a) may be strongly correlated with b in individual events (Dralle et al. 2015; Biswal, 2021). Dralle et al. (2015) proposed a rescaling technique that eliminates the scale dependence of fitted power law parameters. Biswal (2021) selected the median of the values of b in individual events as the fixed b value and used it to find the event values of a.
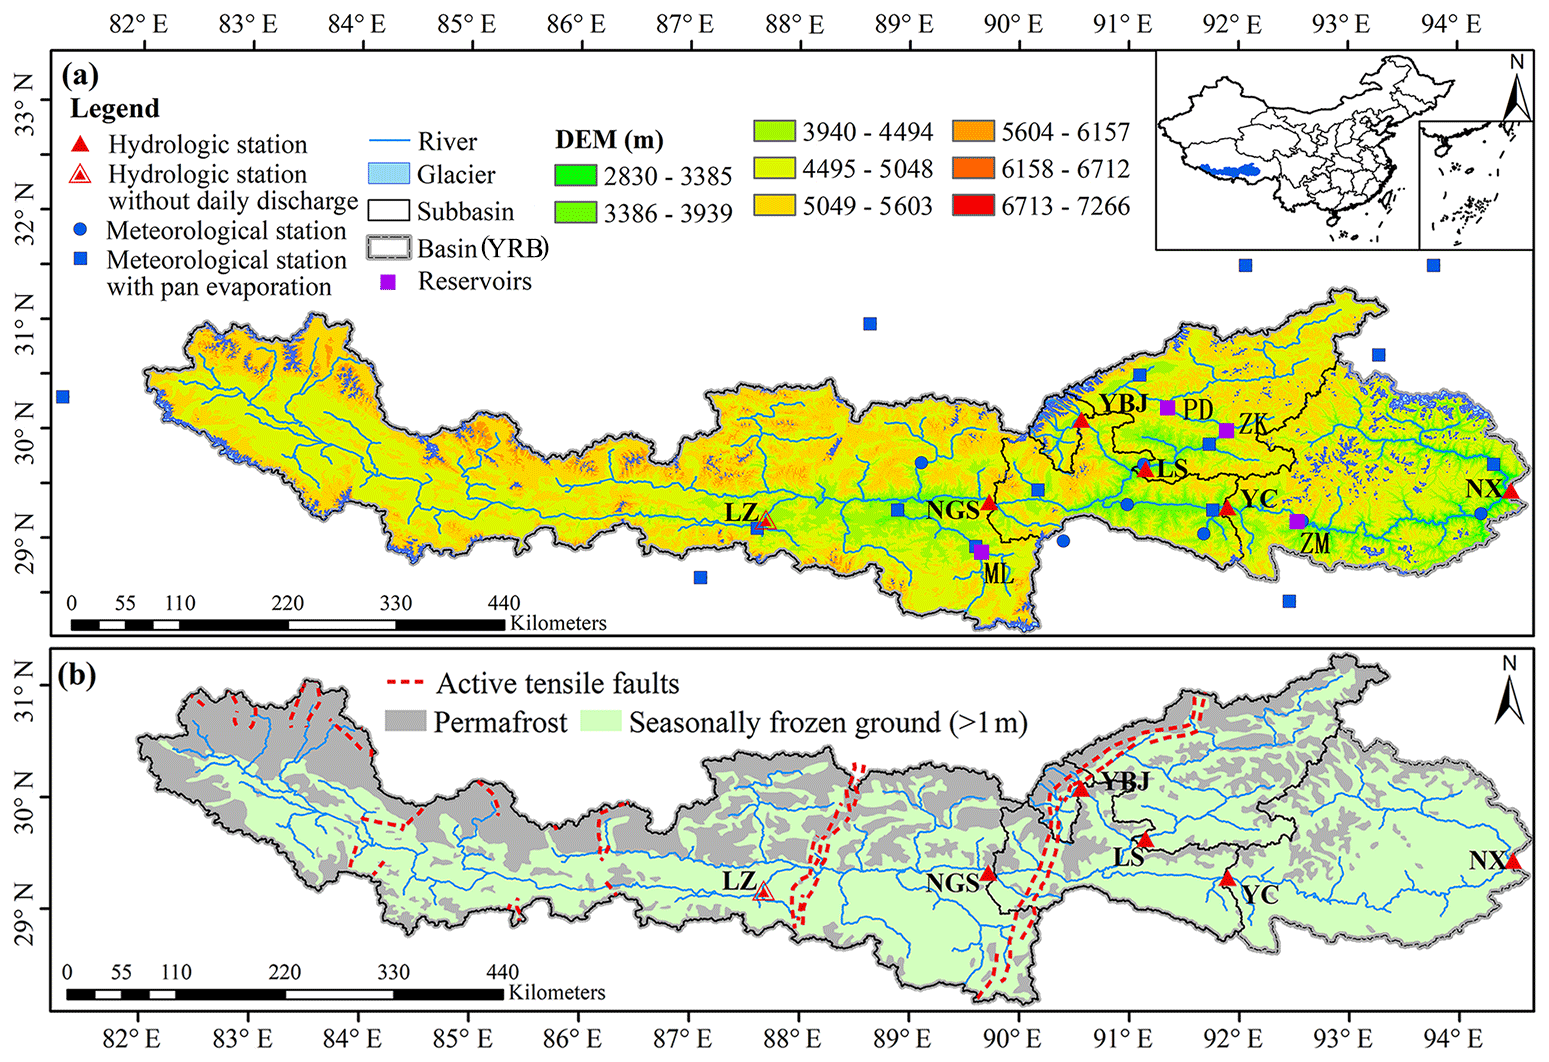
Figure 1(a) Geographical location of the Yarlung Zangbo River basin (YRB; the entire basin is above the hydrological station of Nuxia) and its five subbasins (NGS for Nugesha, YC for Yangcun, NX for Nuxia, YBJ for Yangbajain, and LS for Lhasa) from upstream to downstream. (b) Distributions of permafrost and seasonally frozen ground in 2012 and active tensile faults (the red dotted lines).
In the southern TP, the Yarlung Zangbo River basin (YRB; Fig. 1a) has decades of observations and offers an opportunity to estimate variations in the recession characteristics of streamflow in glaciated areas of TP. Using those data, some recent studies have shown that the climate of the area has become warmer and wetter from 1980–2015 (e.g., Wang et al., 2021). Climate warming has reduced the buffering effect of glacial and permafrost on streamflow, leading to catchment property change with a shorter streamflow response time to precipitation (Wang et al., 2021). These changes must have affected streamflow recession characteristics.
The objective of this study is to investigate temporal and spatial variations in streamflow recession characteristics driven by climate and landscape changes in the glaciated basin of the YRB. The changes in these characteristics are examined using comparisons and contrasts of streamflow recessions indifferent subbasins and time periods according to the power law. To describe the temporal variability in the recession characteristics under climate warming, the decorrelation method by Dralle et al. (2015) is used to obtain a recession parameter a′ independent of b from individual recessions over the period of 1980–2015. Then, the a′ and b are regressed with mean temperature in recession periods for each subbasin of YRB. A sensitivity analysis reveals the effect of climate warming on the recession parameters, recession rates, and storage/recharge–discharge relations of different subbasins of YRB. They show the extent of the nonlinearity in the variation of the streamflow recessions in this glaciated basin of TP.
The YRB (28.2–31.2∘ N, 82.0–94.9∘ E) is the largest river basin in TP (Fig. 1). The main stem of YRB is formed by major suture zones in southern TP from the collision of the Indian plate and the Eurasian plate. The modern YRB flows along the suture from the west to the east before bending to the south at the eastern Himalayan syntaxes with an average west–east gradient of about 2.63 ‰ (Fig. 1a; Tan et al., 2021). In this study, we selected the upstream area of the great gorge of YRB (main stem about 1100 km, with an area of 2.0 × 10⁵ km2). The elevation of the study area drops drastically from 6234 m in the west to 2030 m in the east (Yao et al., 2007; Wang et al., 2021).
Climate in YRB is heavily influenced by the Indian monsoon in summer and the westerlies in winter (Ren et al., 2018; Tian et al., 2020). From the west to the east of the basin, mean annual temperature varies from −9.3 to 22.0 ∘C, and the mean annual precipitation from 300 to 1050 mm. Nearly 90 % of the annual precipitation falls during June to September. As a result, the mean annual total streamflow of the entire basin, 289.7 mm is highly unevenly distributed in seasons. The summer streamflow is derived from monsoon rainfall and glacier meltwater. Groundwater accounts for about 55 % of the annual streamflow upstream and 27 % downstream of the YRB (Yao et al., 2021).
There are four hydrological stations along the main stem of YRB, namely LZ, NGS, YC, and NX, as shown in Fig. 1a. There are two additional hydrological stations, YBJ and LS, located in the major tributaries of the Lhasa River, which originates from the Nyainqêntanglha Mountains north of the YRB (Fig. 1a). Daily streamflow data from 1980 to 2015 are available at these hydrological stations, except for LZ. Accordingly, we divide YRB into five subbasins, with three nested subbasins of NGS, YC, and NX in the main stem of YRB and two subbasins of YBJ and LS in the tributaries of the Lhasa River.
There are four main dams/reservoirs (marked by the purple squares in Fig. 1a) in the YRB above the hydrological station of NX. The reservoirs, ML, ZK, PD, and ZM (Manla, Zhikong, Pangduo, and Zangmu, respectively), were built in 1999, 2003, 2007, and 2014, respectively. The reservoirs ML, PD, and ZM are operated daily, while ZK is operated seasonally. The impact of reservoir regulations on streamflow is minor for the subbasins NGS, YC, and NX in the main stem of the YRB because the reservoirs are operated daily and affect less than 10 % of the areas of the tributaries. In the tributary of the Lhasa River, the subbasin YBJ has no reservoirs while, the subbasin LS has two reservoirs, PD and ZK, which have impacts on streamflow.
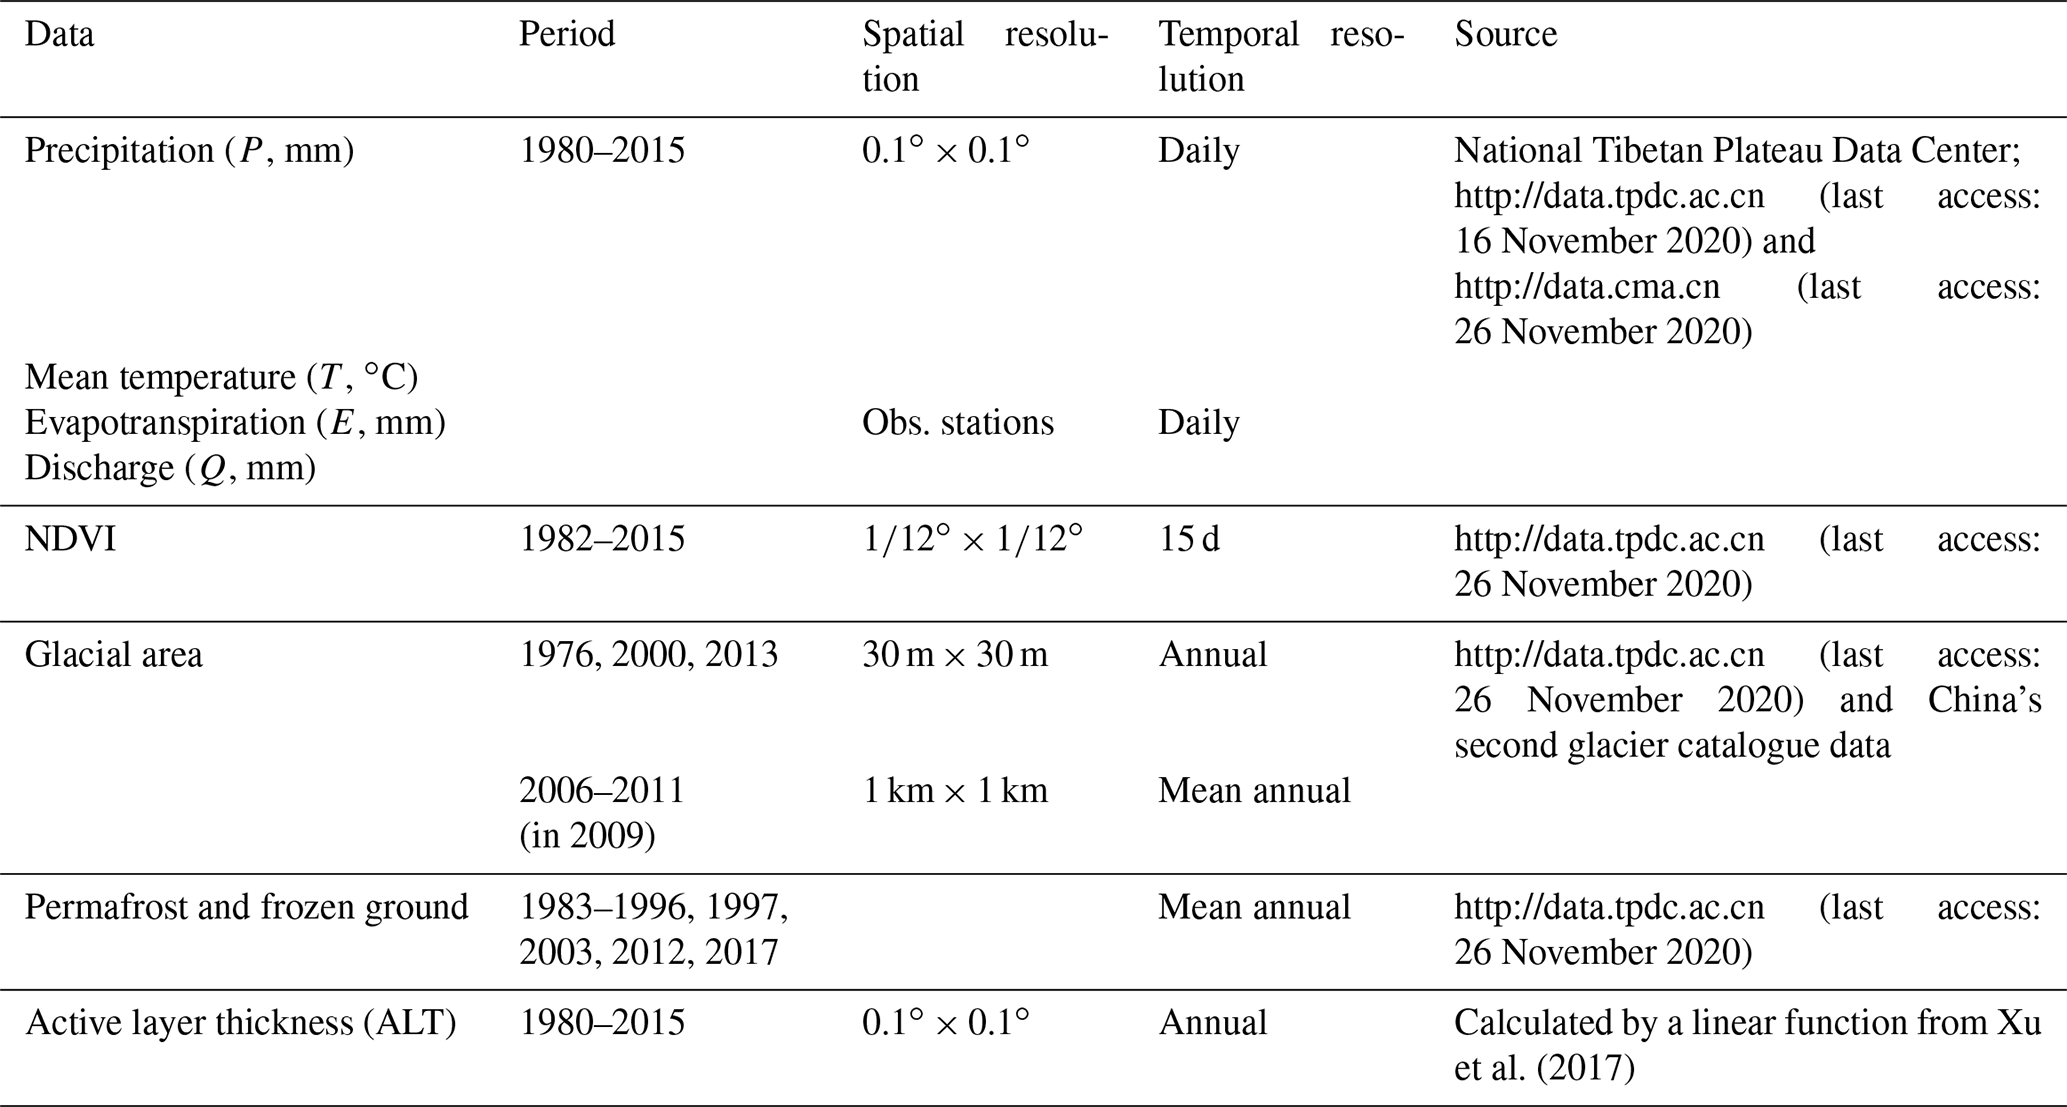
Daily gridded data (0.1∘ × 0.1∘ spatial resolution) of precipitation (P) and mean surface air temperature (T) during 1980–2015 were provided by the National Tibetan Plateau Data Center (Yang and He, 2019; He et al., 2020; http://data.tpdc.ac.cn, last access: 26 November 2020). The subbasin-averaged P and T are calculated by the geometric mean of the gridded data.
Data of the glacier area and permafrost area, and the normalized difference vegetation index (NDVI) were collected from National Tibetan Plateau Data Center (Table 1; http://data.tpdc.ac.cn, last access: 26 November 2020). Glacier areas are located at altitudes from 3370 to 6460 m above sea level (Fig. 1a). Before 2000, the glacier and permafrost area accounted for 1.88 % and 41.8 % of the YRB area, respectively. These coverage percentages have reduced significantly since 2000 (Table 2). The annual mean NDVI was calculated using the maximum value synthesis method from the Global GIMMS NDVI3g v1 dataset, with a 15 d temporal resolution and ∘ spatial resolution. The vegetation types are mainly alpine meadow, alpine steppe in the upstream (LZ), alpine shrubs and grasslands in the middle region (LZ-NGS), and alpine grassland and forest in the lower YRB (NGS-NX; Liu et al., 2014).
The annual depth of glacial melt data (G) during 1980–2015 is estimated using the degree day model (Su et al., 2015; Liu and Zhang, 2018). The calculation procedures are detailed in Wang et al. (2021). The annual ALT is estimated using a linear statistical function of the air freezing index (FIair) described in Xu et al. (2017), where FIair is calculated according to the cumulative value of daily mean temperature below 0 ∘C in a year.
After the warm season (June–September), there is little precipitation (Hayashi, 2020) in YRB, and the melting of the snow and glacier is minor due to cold temperatures (< −5 ∘C; Fig. 3). Subsequently, the flow discharge recedes from September to February of the following year. In this study, we use the daily discharge (Qt) in this recession period, which is defined as being from 1 October to 15 February of the following year, in our analysis of the recession process.
3.1 Detection of changes in annual climate and hydrological series
The Mann–Kendall (MK) method (Mann, 1945; Kendall, 1975) combines a trend-free prewhitening treatment (TFPW-MK; Yue and Wang, 2002) with a Sen slope (Sen, 1968). The TFPW-MK is used in this study to test the temporal trend of annual variations in meteorological and hydrological elements at the specified significance level of α = 0.05.
The Pettitt method is applied to detect the change point (year) of annual hydrological and meteorological variables. the Pettitt method is nonparametric and has been widely used in mutation point detection (Pettitt, 1979; Mallakpour and Villarini, 2016; Wang et al., 2021).
3.2 Streamflow recession analysis
Based on analytical solutions to the Boussinesq equation, the relationship of streamflow (Q in units of mm d−1) and streamflow change (; mm d−2) in a recession period can be expressed by the power law, as follows (Brutsaert and Nieber, 1977):
where a () and b (dimensionless) are the recession coefficients (Brutsaert and Nieber, 1977; Tashie et al., 2020).
Based on Eq. (1), the relationship between groundwater storage (S) and streamflow can be derived, as follows:
where K = (), and .
The recession timescale (τ) measures the recession rates of individual recessions (Kirchner, 2009) and is defined as follows:
From Eqs. (1)–(3), the storage sensitivity of discharge (λS) for the recession curve (Berghuijs et al., 2016) is as follows:
where λS (mm−1) is a measure of the sensitivity of instantaneous discharge values to water storage changes and indicates the fractional increase in discharge for each unit of increase in storage. The larger (or smaller) the values of a (or b) are, the more sensitive the discharge is to water storage.
Both the relationships of –Q and S–Q are linear if b=1 and nonlinear if b≠1. When b≠1, the discharge recession is as follows:
where Q0 and Qt are the initial (t=0) discharge and discharge at time t. For any specific initial discharge Q0, the larger the b is, the faster the hydrograph recession is for high discharge and the more stable the recession is for low discharge (Tashie et al., 2020).
The parameters a and b can be determined by fitting the daily observation data of ( in a log–log diagram using linear least squares regression. The fitted values of a and b are used to estimate and Qt using Eqs. (1) and (5). The accuracy of the estimated values is evaluated by the root mean square logarithmic error (RMSLE) as follows (Bekele and Nicklow, 2007):
where Qobs.(i) and Qest.(i) are the observed and estimated discharges, respectively. The terms and in Eq. (6) are derived from taking the derivatives of Eq. (1). In practice, their finite difference is determined from the observed recession segments ΔQ in time interval Δt. N in Eq. (6) is the number of data points of in individual recessions.
According to Dralle et al. (2017), by minimizing the following:
where EMAP is the absolute relative error between Qobs.i and Qest.i over the recession period, a fitting in each recession hydrograph would ensure that the estimated volume of recession discharge approaches to that of the observed recession.
To avoid recession-scale parameter dependence, we use the method of Dralle et al. (2015) and rescale the discharge Q by . The revised power law for the rescaled discharge is as follows:
where k is a constant, and is a new recession parameter independent of b. The unit of a′ is days (Dralle et al., 2015).
Furthermore, to minimize the correlation of the fitted recession exponent and log-transformed fitted recession-scale parameters for a unique value of k, we use the following equation to compute the scaling factor k, according to Bergner and Zouhar (2000), as follows:
In Eq. (9), and are the arithmetic mean of annually fitted recession exponents and the log-transformed fitted recession intercepts , respectively, and i is the number of annual values from 1980 to 2015.
3.3 Changes in recession characteristics under warming climate
In cold climate regions, recession coefficients are closely related to the thickness of the active layer in the soil profile above the permafrost layer (Bense et al., 2012; Brutsaert and Hiyama, 2012). Changes in these catchment properties depend on daily, seasonal, and annual temperature variability. For example, the transition from unfrozen to frozen ground for temperatures varying between 0 and −0.5 ∘C coincides with a reduction in hydraulic conductivity of several orders of magnitude for saturated porous media (Burt and Williams, 1976). On the other hand, when the temperature rises, the thawing front in the active soil layer moves progressively downward as summer proceeds, leading to increased water storage in the active layer. If the frozen soil beneath the thawing front is ice saturated (thus relatively impermeable), the active soil layer can function as a very shallow perched aquifer that controls streamflow response to snowmelt and summer precipitation (Carey and Woo, 2005; Yamazaki et al., 2006; Wright et al., 2009; Koch et al., 2014). To include these variations in a study, recession coefficients are considered to vary, depending on the watershed state and temperatures (Tashie et al., 2019).
In this study, the variability in the parameters a′ and b are expressed as a function of temperature (T), i.e., a′(T) and b(T) as follows:
where α and α1 are coefficients for a′(T), β and β1 are coefficients for b(T), and T is the mean surface air temperature in the recession period (Tre). These coefficients can be obtained by fitting the recession parameters of individual recession events with known Tre in each subbasin.
From Eq. (2), the temporal change in S (ΔS) can be described as follows:
Incorporating and , we can write ΔS as follows:
or
where , λb, and λQ are the sensitivity coefficients of ΔS to a′, b, and Q, respectively, and can be derived as
Because the recession parameters a′ and b are functions of T in Eq. (8), S is a function of T and Q. The change in S (ΔS) can therefore be expressed as follows:
or
where λT is the sensitivity coefficient of ΔS to T. λT can be derived as follows:
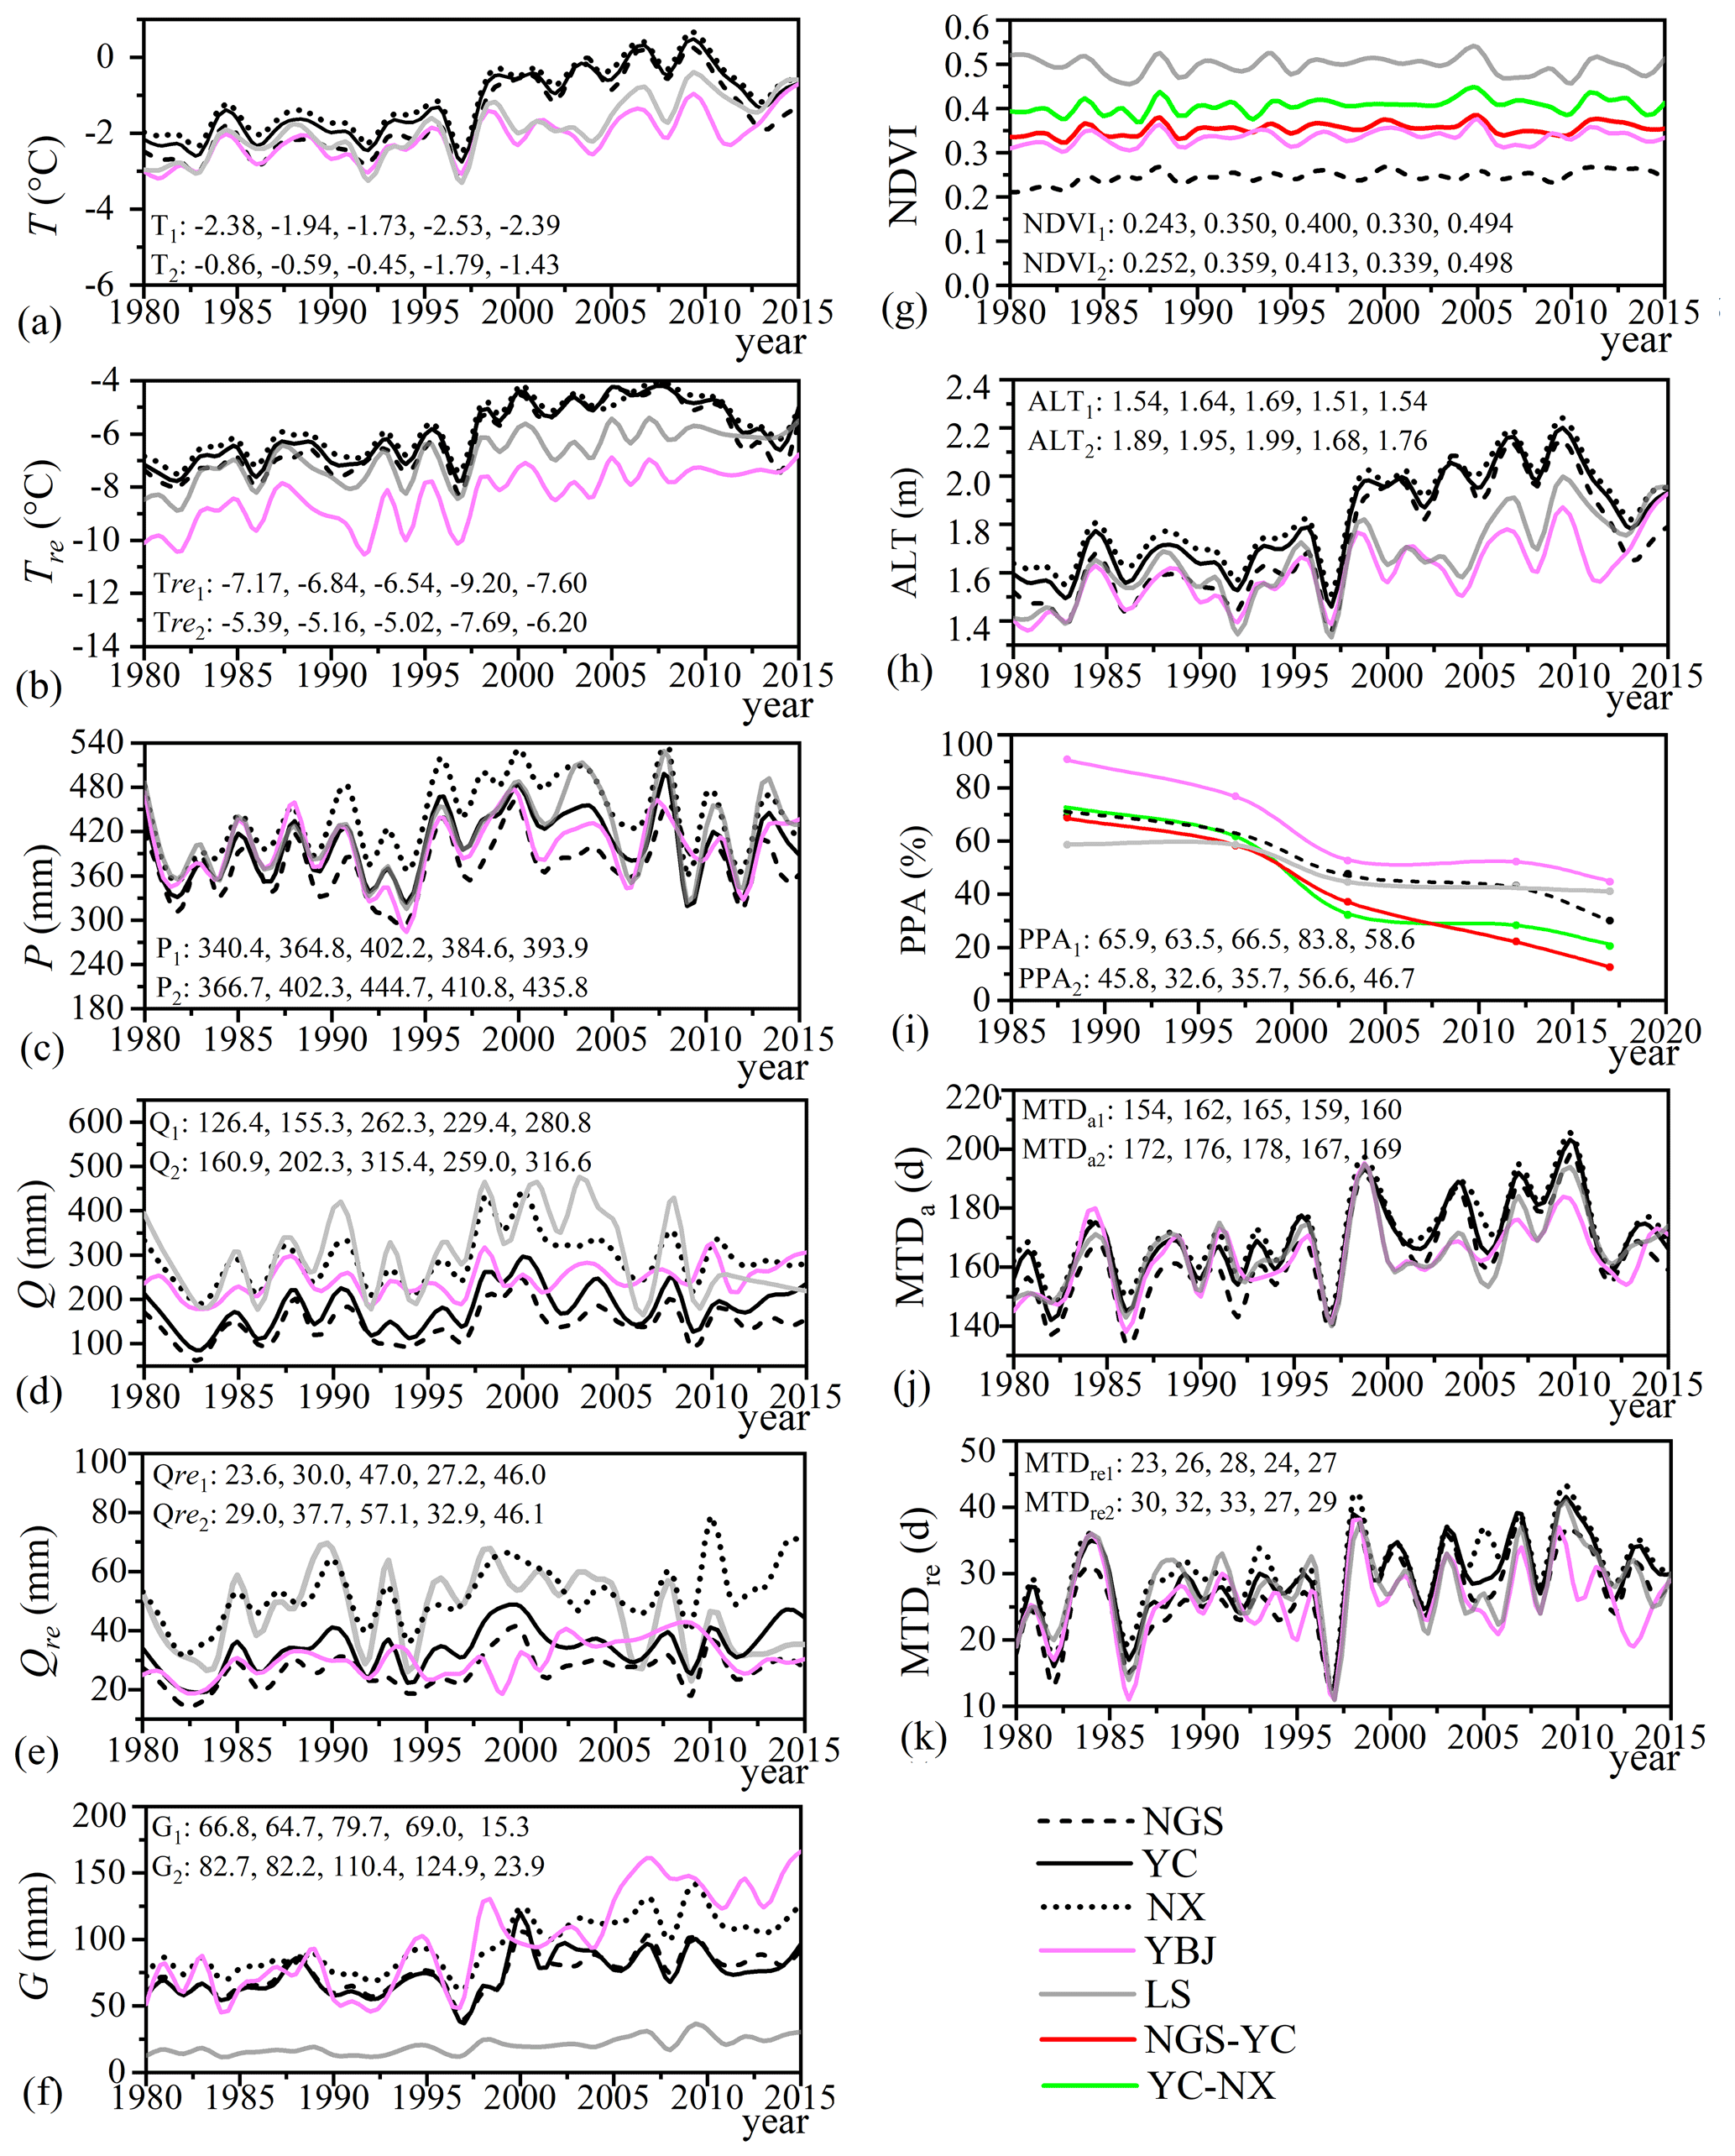
Figure 2Variations in (a) annul mean temperature (T), (b) mean temperature in a recession period (Tre), (c) precipitation (P), (d) discharge (Q), (e) discharge in a recession period (Qre), (f) glacier meltwater (G), (g) NDVI, (h) active layer thickness (ALT), (i) percentage of permafrost area (PPA), (j) the total number of days with the mean temperature above 0 ∘C in a year (MTDa), and (k) the total number of days with the mean temperature above 0 ∘C for recession period (MTDre) from 1980 to 2015 in the five subbasins. The subscripts 1 and 2 refer to the early period from 1980 to 1996 and the recent period from 1997 to 2015, respectively. NGS–YC refers to the area between the nested subbasins NGS and YC, and YC–NX is for the area of the nested subbasins YC and NX.
4.1 Spatial and temporal variations in climate and hydrological variables
4.1.1 Spatial variations
The mean values of the observed climate and hydrological variables during 1980–2015 in the subbasins have shown that the region's climate has become warmer and wetter (Fig. 2a–2c and Table 2). The wet trend is largest in the YBJ and LS subbasins. We note that the mean temperature of YBJ is lowest among the subbasins because most of its area is at higher altitudes. It has the largest fractional glacier coverage area of about 10 %. The percentage of glacier area in the other subbasins is 1.63 %, 1.52 %, 1.92 %, and 0.75 % in NGS, YC, NX, and LS subbasins, respectively. The percentage of permafrost area (PPA) ranges from 41.8 % to 47.7 % in the five subbasins.
The mean annual streamflow (Q) and streamflow in the recession period (Qre) (both in units of mm) increased (Fig. 2d and e), resulting in higher runoff coefficient Rc towards the wetter downstream of the main stem of the YRB. However, the wettest subbasins of YBJ and LS do not have the greatest discharge and high Rc, possibly because of the icy environment. The daily coefficient of variation (CV) in streamflow is higher in YBJ and LS and upstream of NGS. CV decreases towards the wetter downstream of YRB, partially because of strengthened watershed regulation as the subbasin areas increase, and the dams are included in the area of the analysis.
Table 2Summary of subbasin characteristics in the YR basin.
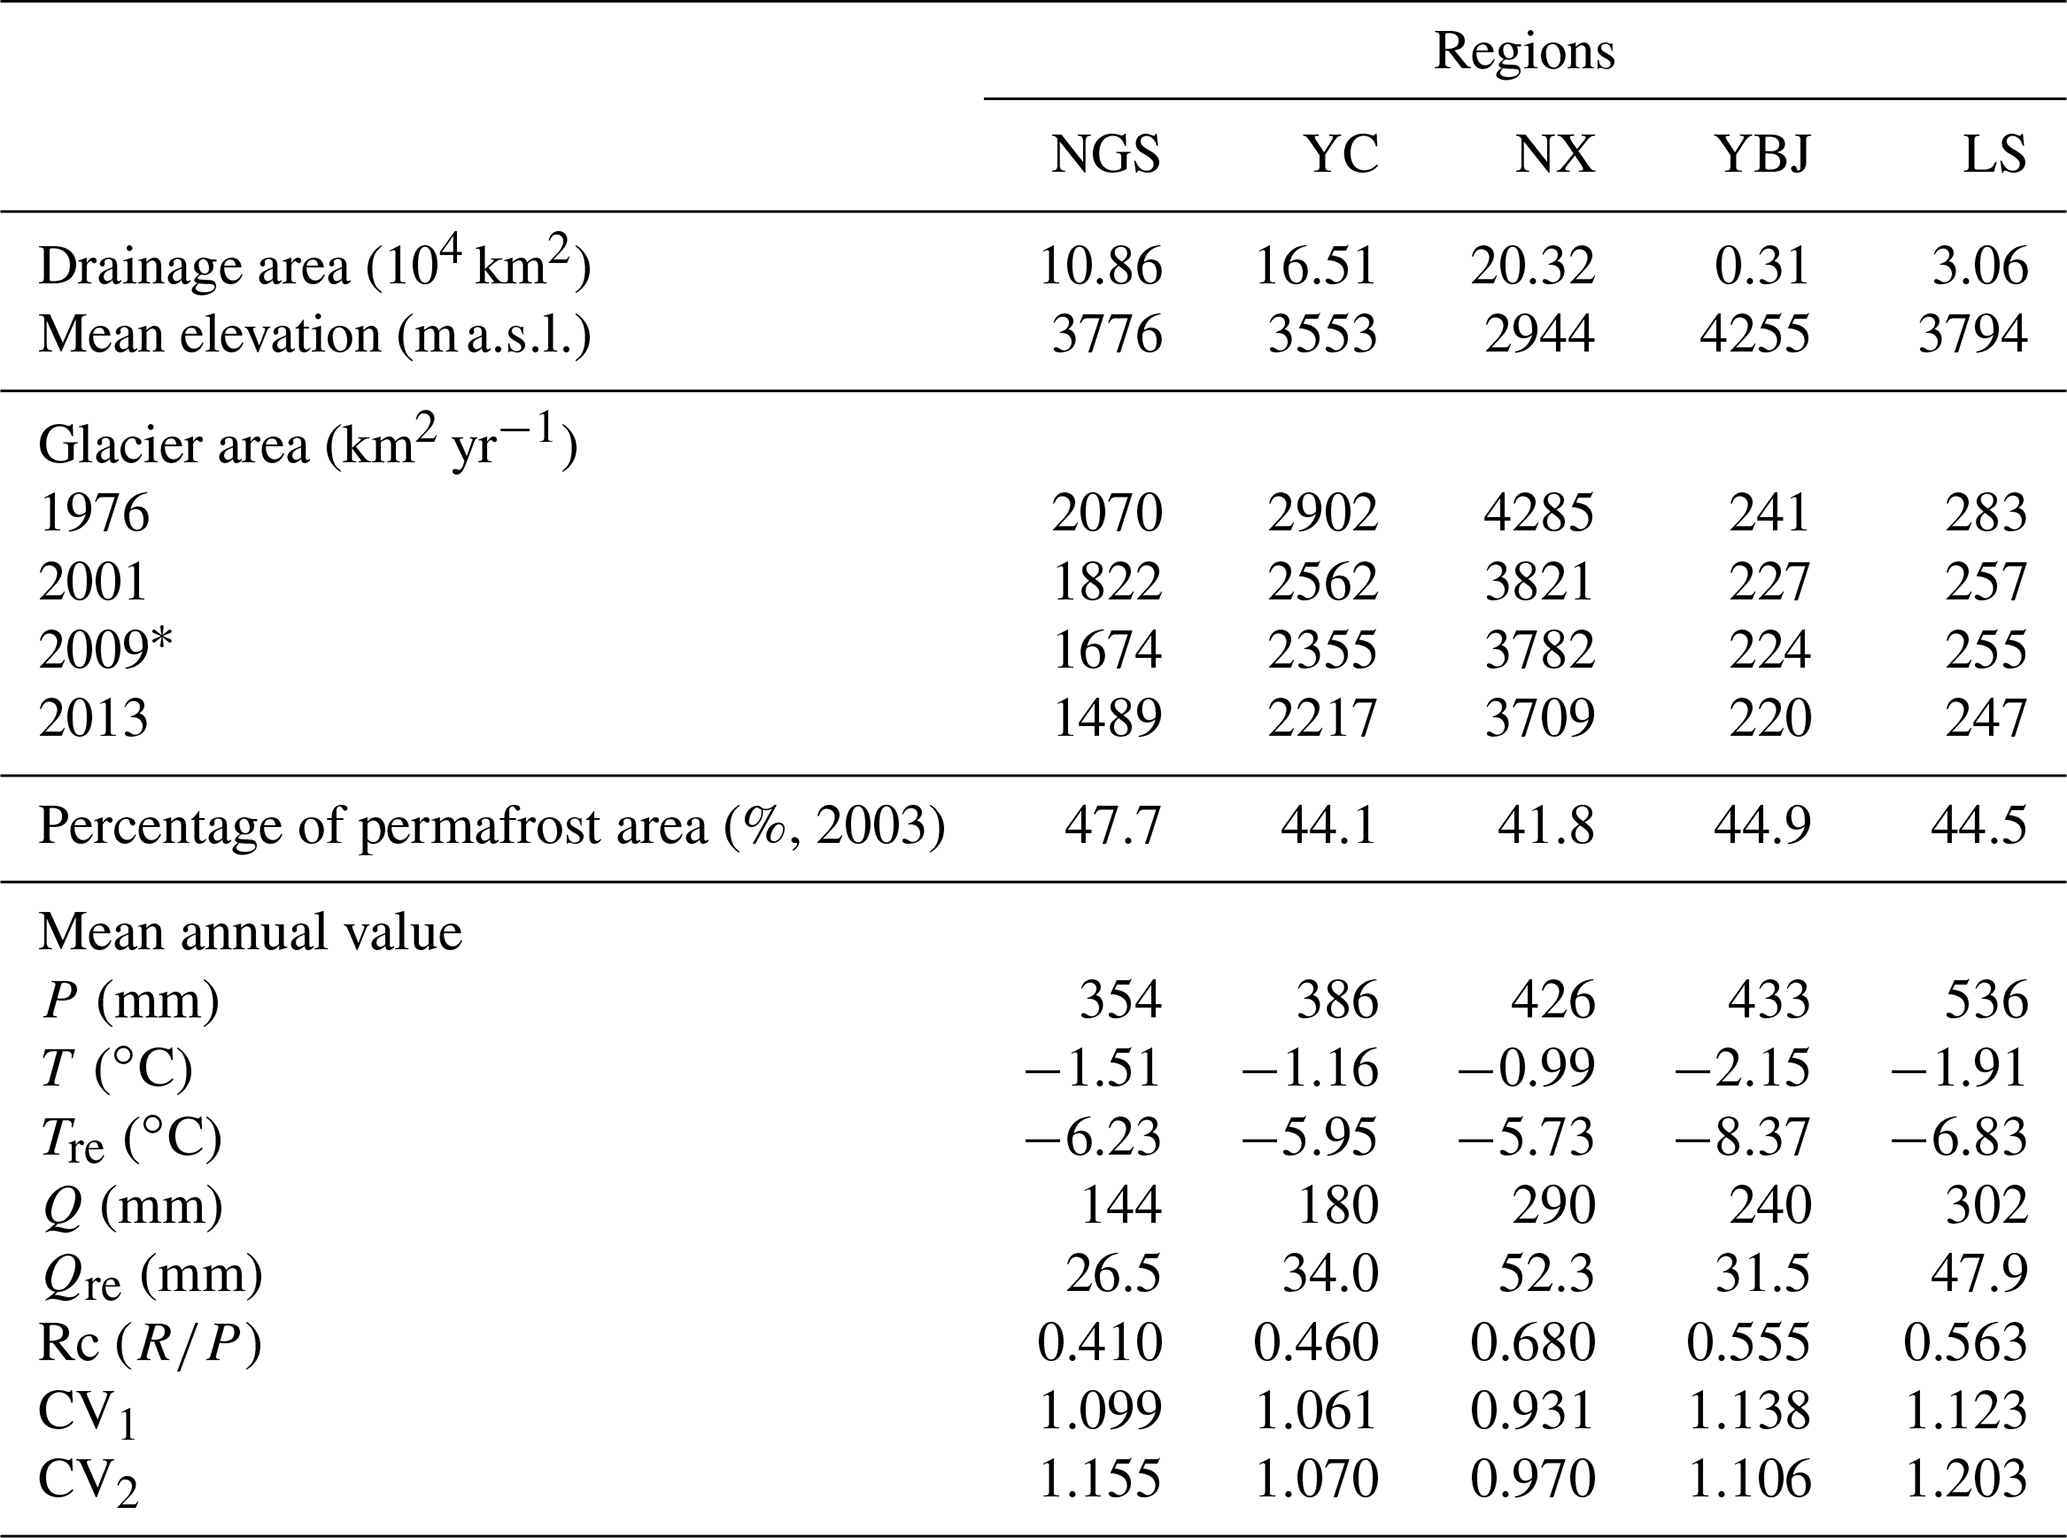
∗ Glacier area is from China's second glacier catalogue data in 2009. The mean of Aice in the years 1976 and 2001 is used as a reference value in the subperiod before 1997, and the mean of Aice in 2001, 2009, and 2013 is used as a reference value in the subperiod after 1997. The subscripts 1, and 2 represent 1980–1996 and 1997–2015, respectively.
4.1.2 Annual variations in climate and hydrological variables during 1980–2015
Figure 2a–f show variations in the observed climate and hydrological variables from 1980 to 2015. Tested by TFPW-MK, annual mean temperature (T) and temperature in the recession period (Tre) rose significantly (p < 0.05) in all subbasins of the YRB (Fig. 2a and b). Annual T rose at a rate of 0.045–0.075 for the five subbasins, which is smaller than the rate of 0.070–0.097 for annual Tre. Annual precipitation (P) also increased, and was significant (p < 0.1), in the subbasins of YC, NX, and LS, but insignificant in NGS and YBJ (Fig. 2c). Annual glacier meltwater G and the total number of days with the mean temperature above 0 ∘C in a year (MTDa) increased significantly in all subbasins (Fig. 2f and j). Meanwhile, the total number of days with the mean temperature above 0 ∘C in the recession period (MTDre) also increased, and it was significant in the main stream of the YRB (e.g., NGS, YC, and NX) and insignificant in the two subbasins of YBJ and LS (Fig. 2k). The rate of G increase is from 0.46 mm a−1 in LS to 2.86 mm a−1 in YBJ. The rate of increase in annual MTDa and MTDre is 0.48–0.82 and 0.12–0.32 d a−1, respectively, in the five subbasins. Under the warmer and wetter climate, the vegetation coverage tended to increase. The NDVI increased at a rate of 5.1−4–8.03−4 a−1 during 1980–2015 in the four subbasins YC, NX, NGS, and YBJ but decreased at a rate of −1.03−4 a−1 in LS (Fig. 2g).
Over the same period, the annual mean discharge Q and the mean discharge in the recession period Qre increased significantly, except for Qre in the LS subbasin (Fig. 2d an e). The Q increased at a rate of 1.16–1.68 mm a−1, which is higher than the rate of 0.22–0.47 mm a−1 for Qre. In contrast, Qre in LS decreased insignificantly (Fig. 2d), possibly because of initial water storage when the ZK reservoir (Fig. 1a) began operating in around 2007.
In Wang et al. (2021), a point of dramatic change was detected around 1997 by the Pettitt test for T, G, and Q and around 1995 for annual P in the subbasins of NGS, YC, and NX. In this study, the same point of change in 1997 was detected in the annual series of Tre and Qre in the NGS, YC, and NX subbasins and in the annual series of T, G, and Q in the YBJ and LS subbasins. The annual time series of Q in LS was detected to have two additional points of change in 1995 and 2005, which is possibly attributable to the increased impact of human (reservoir operation) activities (Cai et al., 2021). The point of change in 1997 has also been identified by the dramatic changes in surface conditions, i.e., the reversed NDVI trend (Fig. 2g), increased ALT (Fig. 2h), and accelerated thawing of permafrost after 1997 (Fig. 2i). Accordingly, we separate the study years from 1980–2015 into two periods, i.e., the early period from 1980 to 1996 and the recent period from 1997 to 2015.
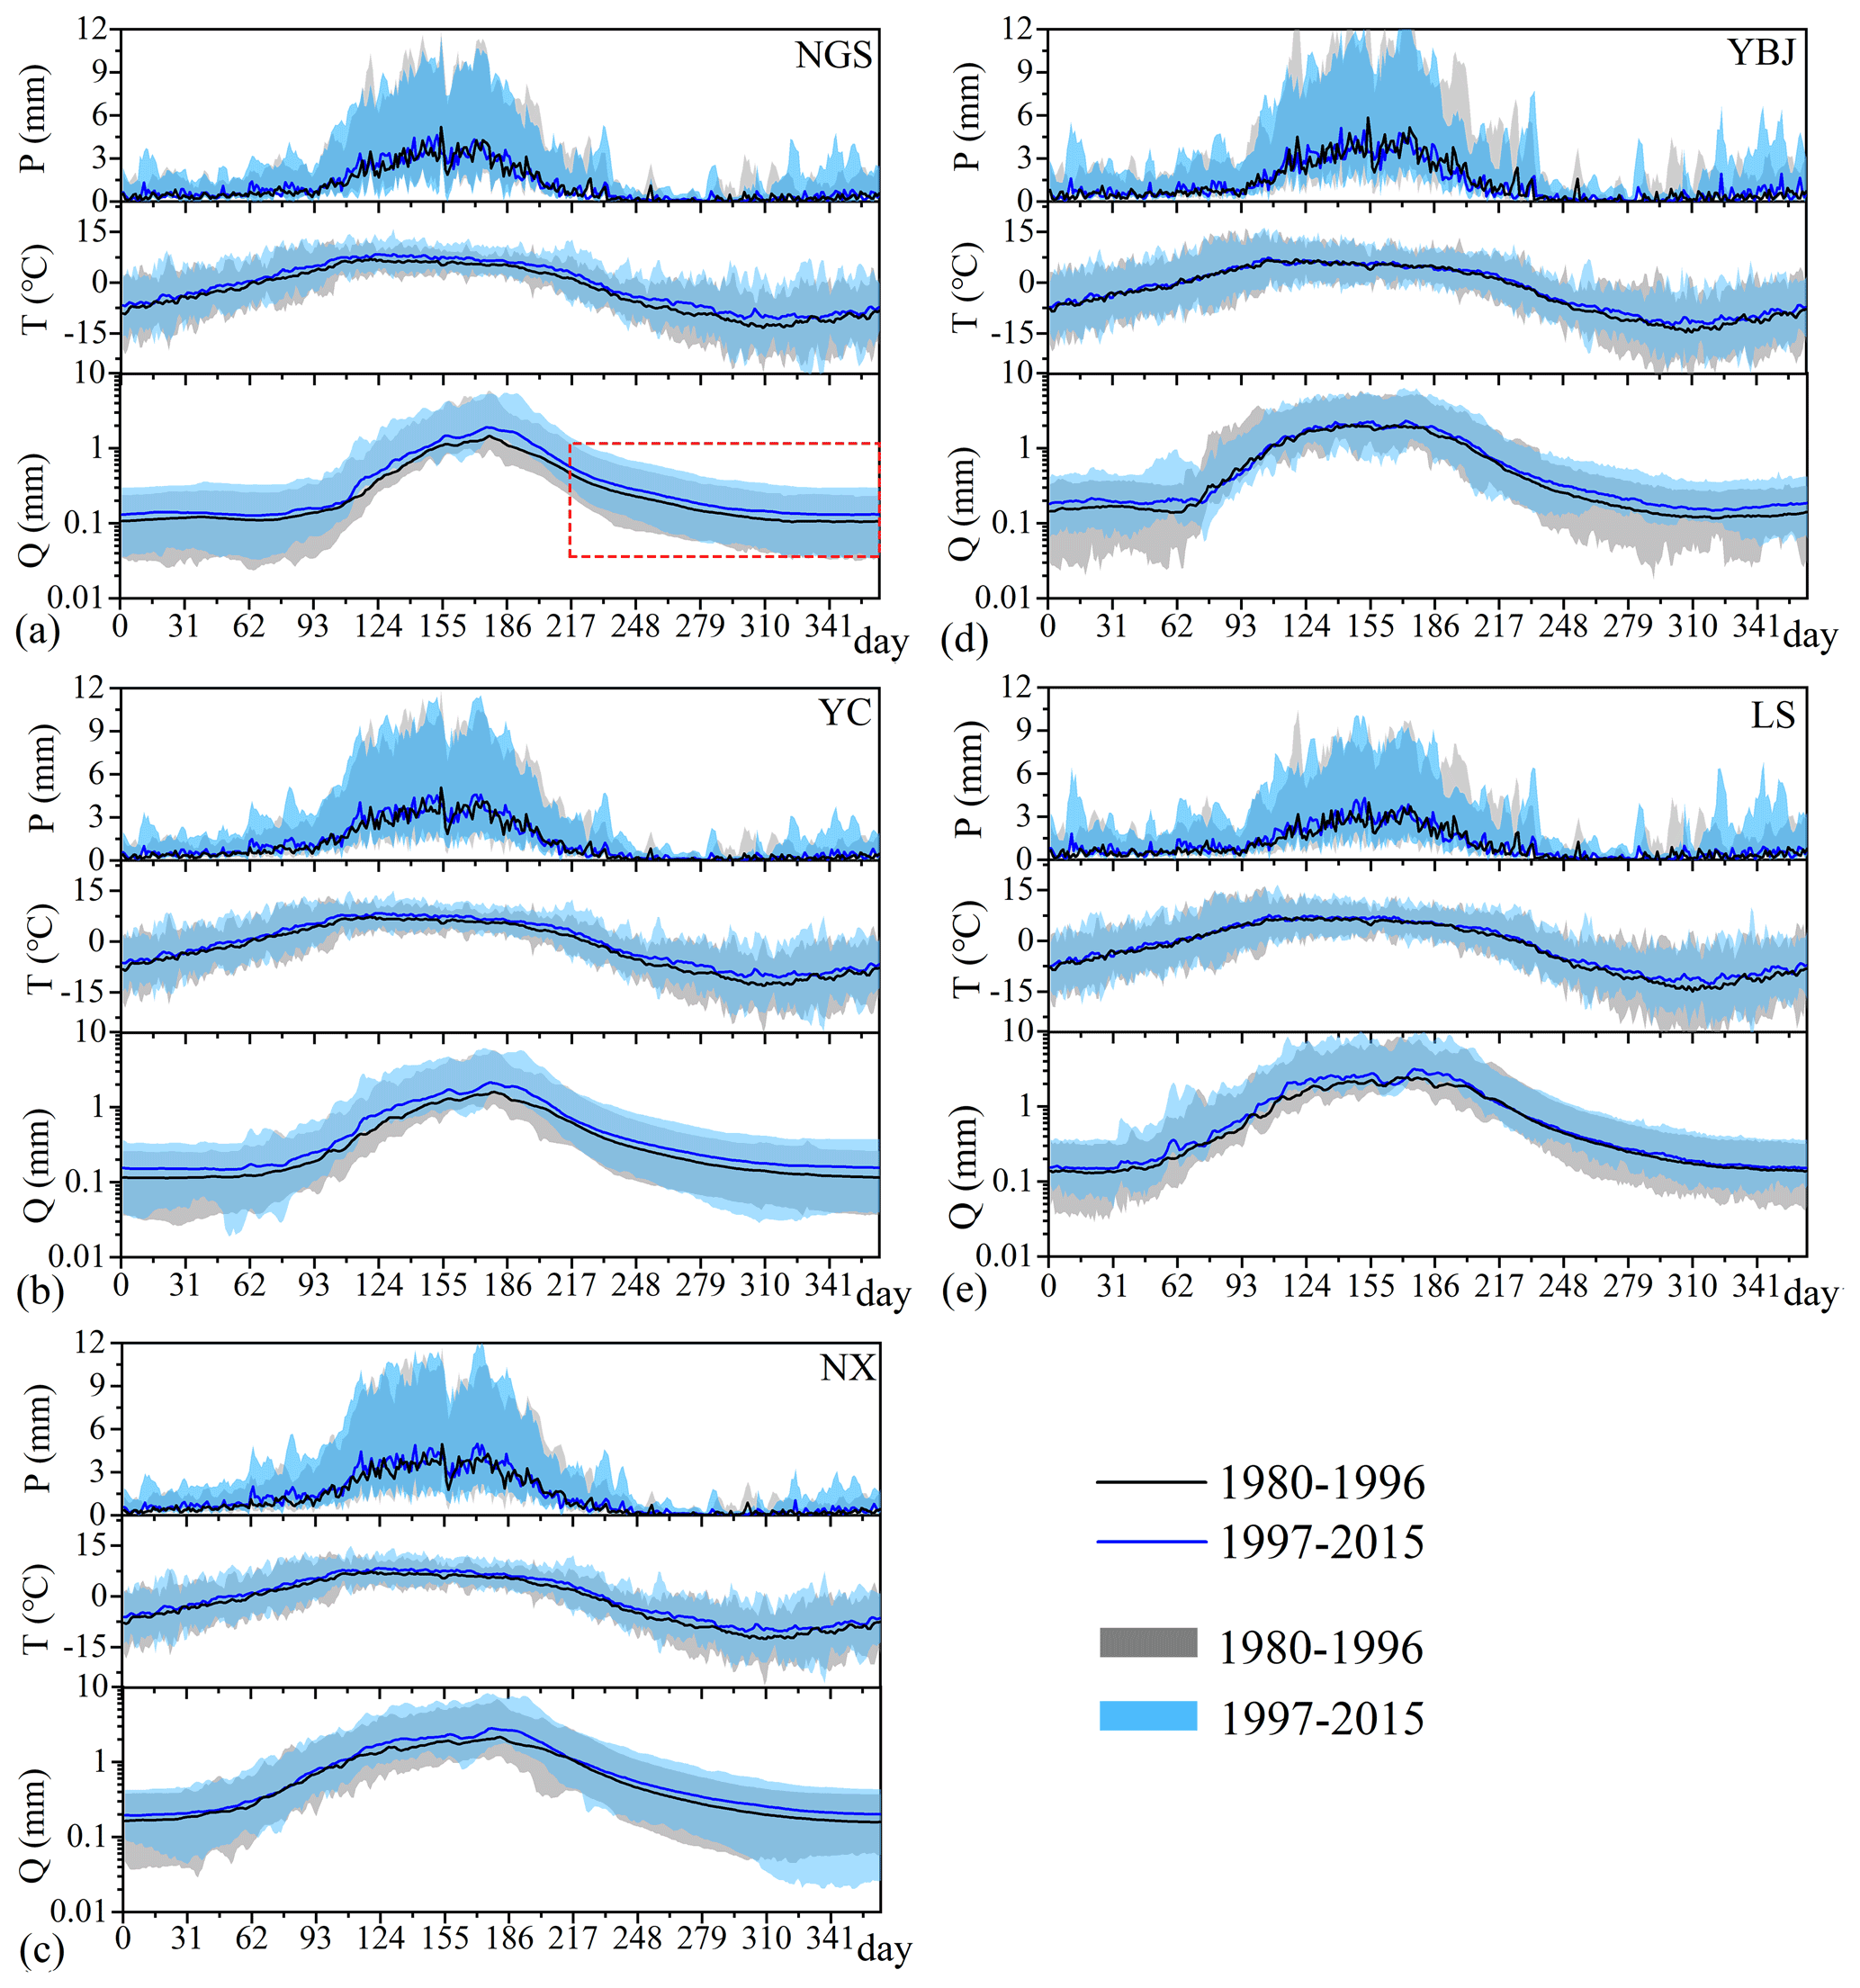
Figure 3(a–e) P, T, and Q in a hydrological year (from 1 March to 28 February of the following year) for the two periods in the five subbasins. The red dashed rectangle in (a) shows the hydrograph recession from 1 October to 15 February of the following year, and the shading shows the range of the daily variation in P, T, and Q in each period.
Climate in the recent period has changed to be markedly warmer and wetter. The mean annual P after 1997 increased by 27–46 mm or 7.9 %–10.7 % compared to that in the early period in the five subbasins. The mean annual T in the recent period is 0.75–1.52 ∘C warmer than that in the early period, and a larger rise of 1.40–1.78 ∘C was found for the mean Tre after 1997. These changes concurred at 8.6–55.9 mm or a 23.8 %–81.1 % increase in mean annual G after 1997 in the five subbasins. The mean MTDa and MTDre in the recent period is 8–18 and 2–7 d greater than that in the early period of 1980–1996, respectively. As a result, Q increased by 29.6–50.2 mm or 12.7 %–31.5 % in the recent period compared to that before 1997. This increase in Q and Qre after 1997 is much larger in the upstream subbasins NGS and YC.
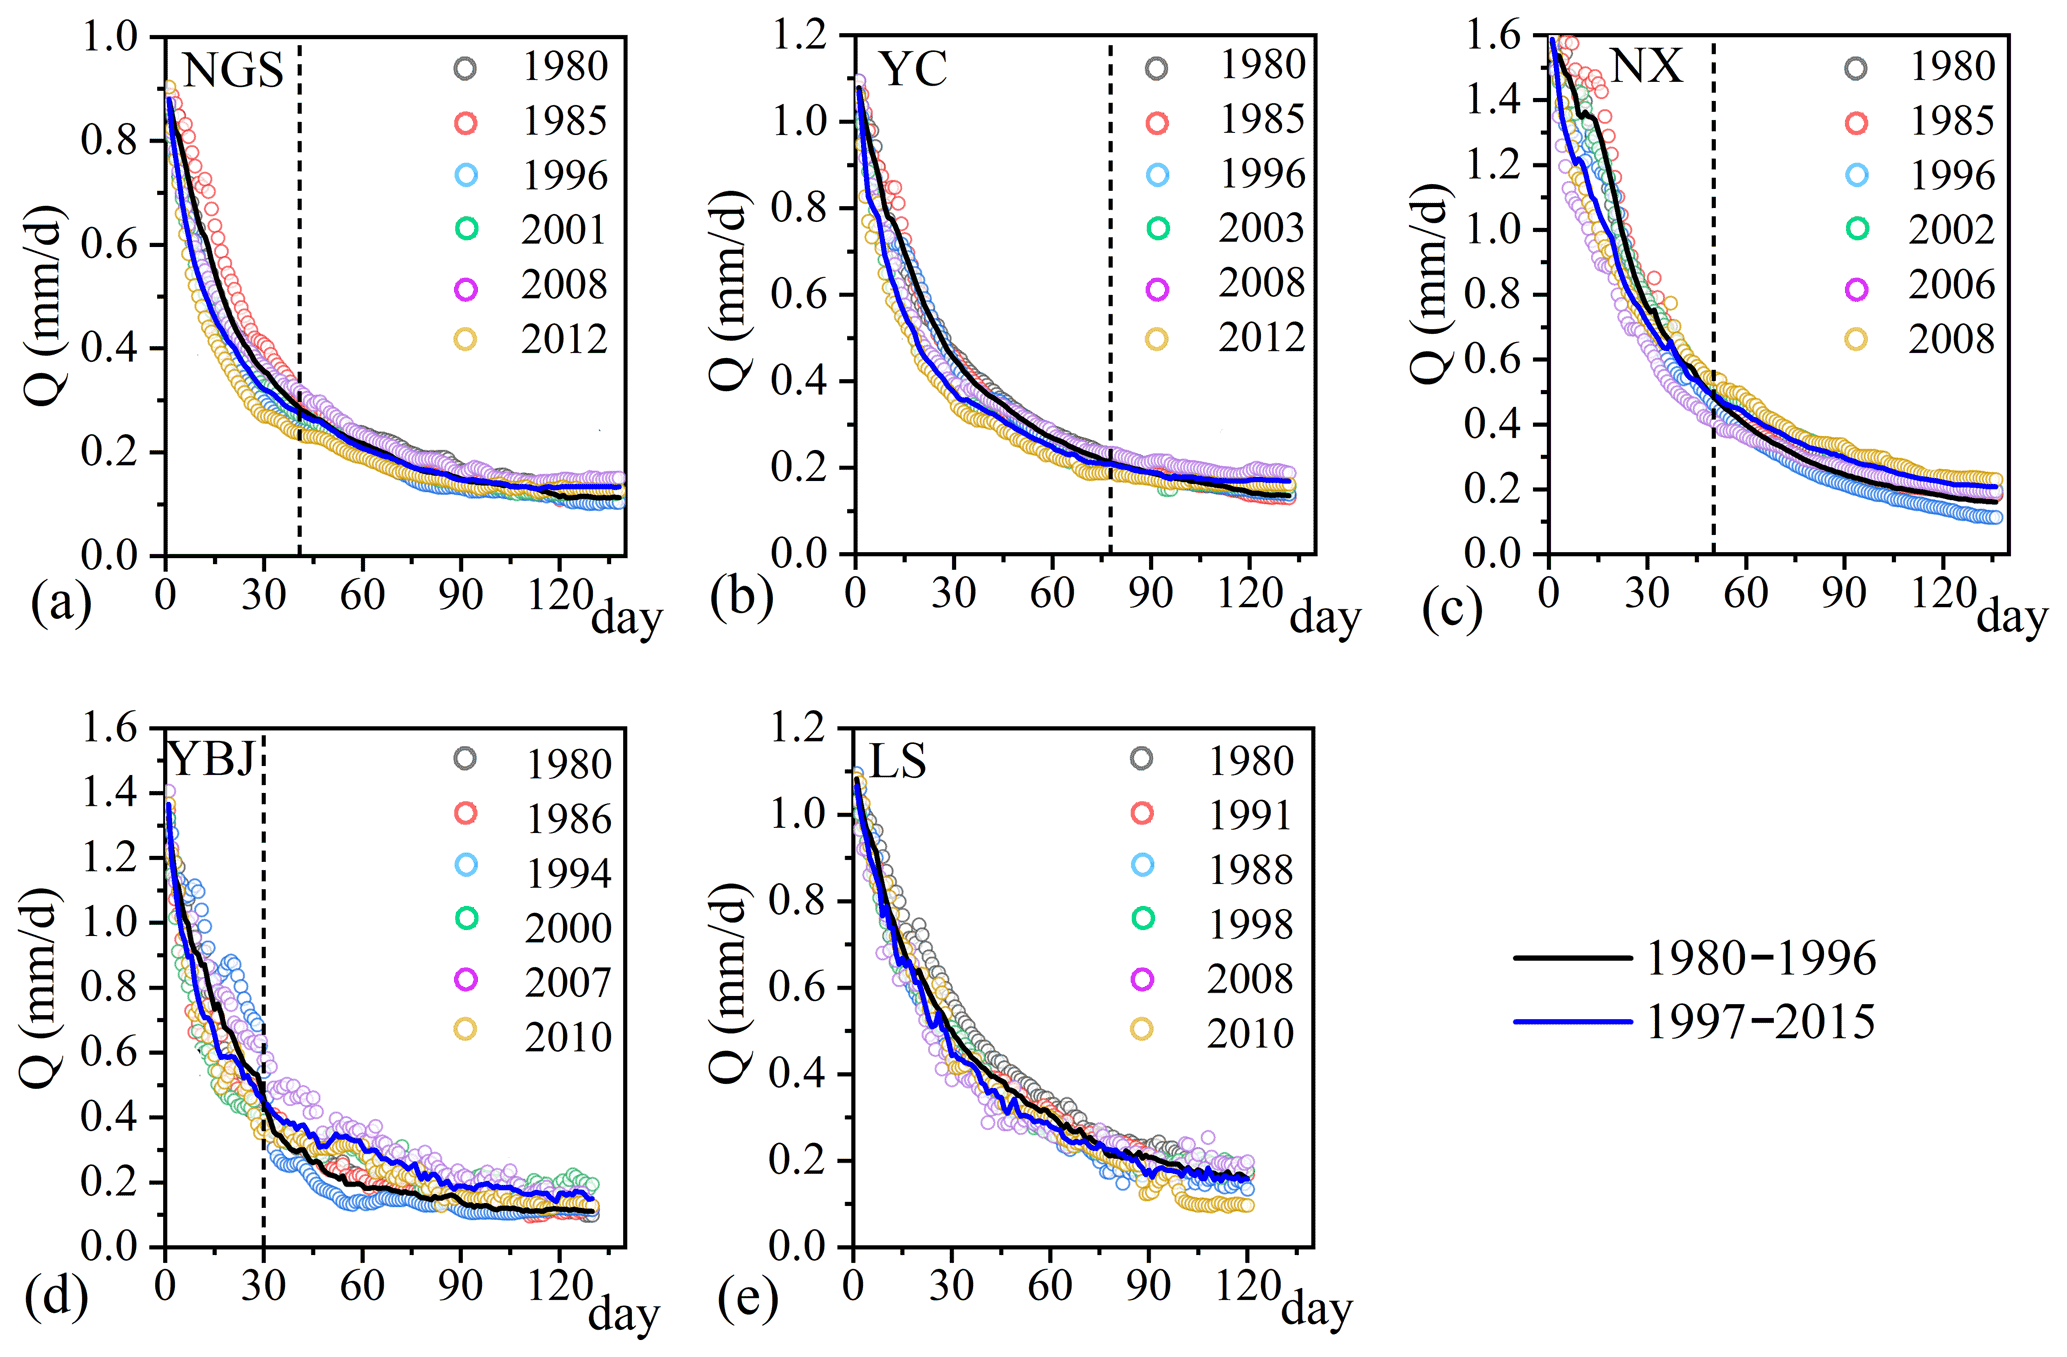
Figure 4Discharge recession for selected years with approximately the same initial discharge Q0 in each subbasin.
4.1.3 Annual recession characteristics
As shown in Fig. 3, the annual hydrographs in the five subbasins are consistent, delineating a single peak response to maximum precipitation and temperature in July–August. The statistic values of the daily discharge series in the two periods show that the mean value in the recent period exceeds that in the early period in all subbasins. Meanwhile, daily discharge variability in the recession of the annual hydrograph in the recent period is also greater than that of the early period, shown by larger CV after 1997 for most subbasins, except subbasin YBJ (Table 2).
Figure 4 further exhibits that changes in recession rates are different in the early phase and the later phase of the recession for the selected hydrographs with approximately the same initial discharge Q0 in each subbasin. In the recent period, the streamflow recedes faster in the early phase of the recession and slows down in the later phase, except for LS.
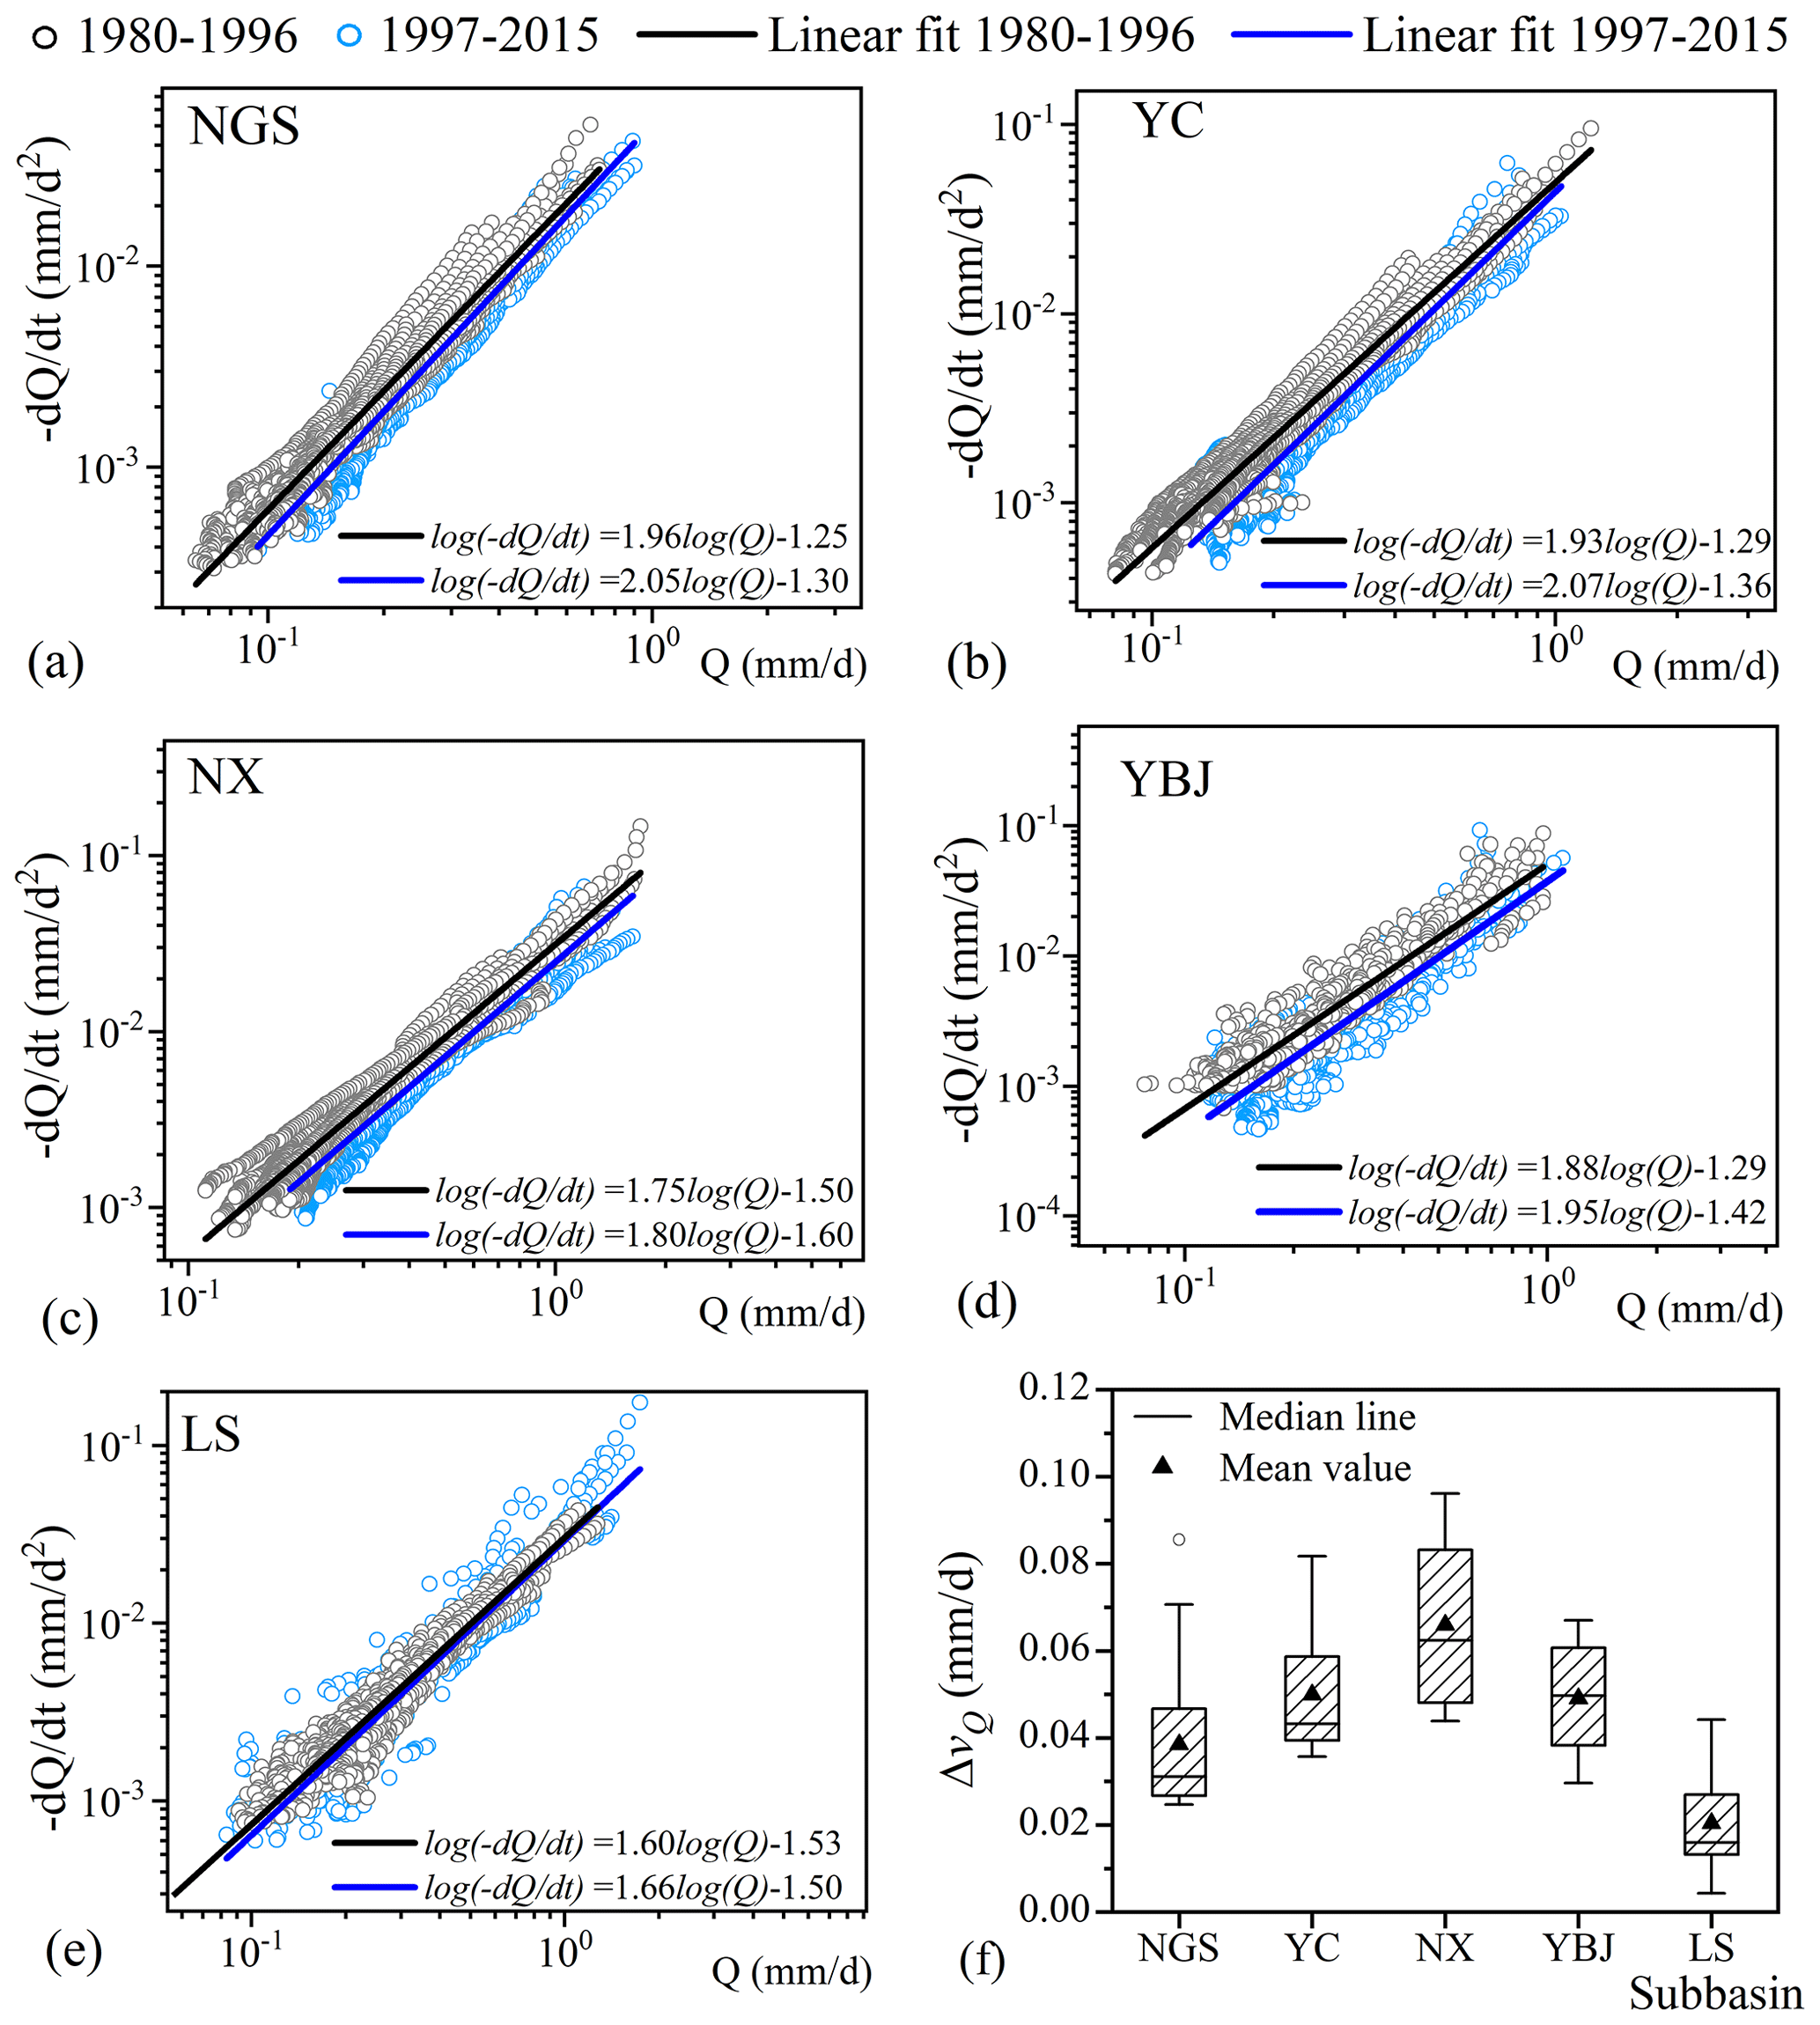
Figure 5(a–e) Plot of vs. Q in log–log diagram for each recession hydrograph during 1980–2015 and the fitting lines [] for the data points in the two periods for the five subbasins. (f) Differences in mean recession rates between the two periods (ΔvQ) estimated from the non-overlapping moving averages of the 5 d series.
The faster recessions in the recent periods are also illustrated by the regression on data points of vs. Q in the log–log diagram (Fig. 5). The fitted line of vs. Q after 1997 has a steeper slope (Fig. 5a–e) and a more negative intercept, except for LS, indicating a higher value of b and a smaller value of a for the subbasins of NGS, YC, NX, and YBJ after 1997. The increased b value and decreased a value after 1997 suggest that the recession curves tend to be more concave for these subbasins when the climate is warmer and wetter, as indicated in Fig. 4. According to the non-overlapping moving averages of the 5 d series of the recession discharge, the estimated average recession rate after 1997 [] is larger than that before 1997 [], as indicated by the positive values of in Fig. 5f.
Table 3Mean values of parameters a (), a′ (d−1) and b (dimensionless), recession coefficient K (), and recession timescale τ (d).
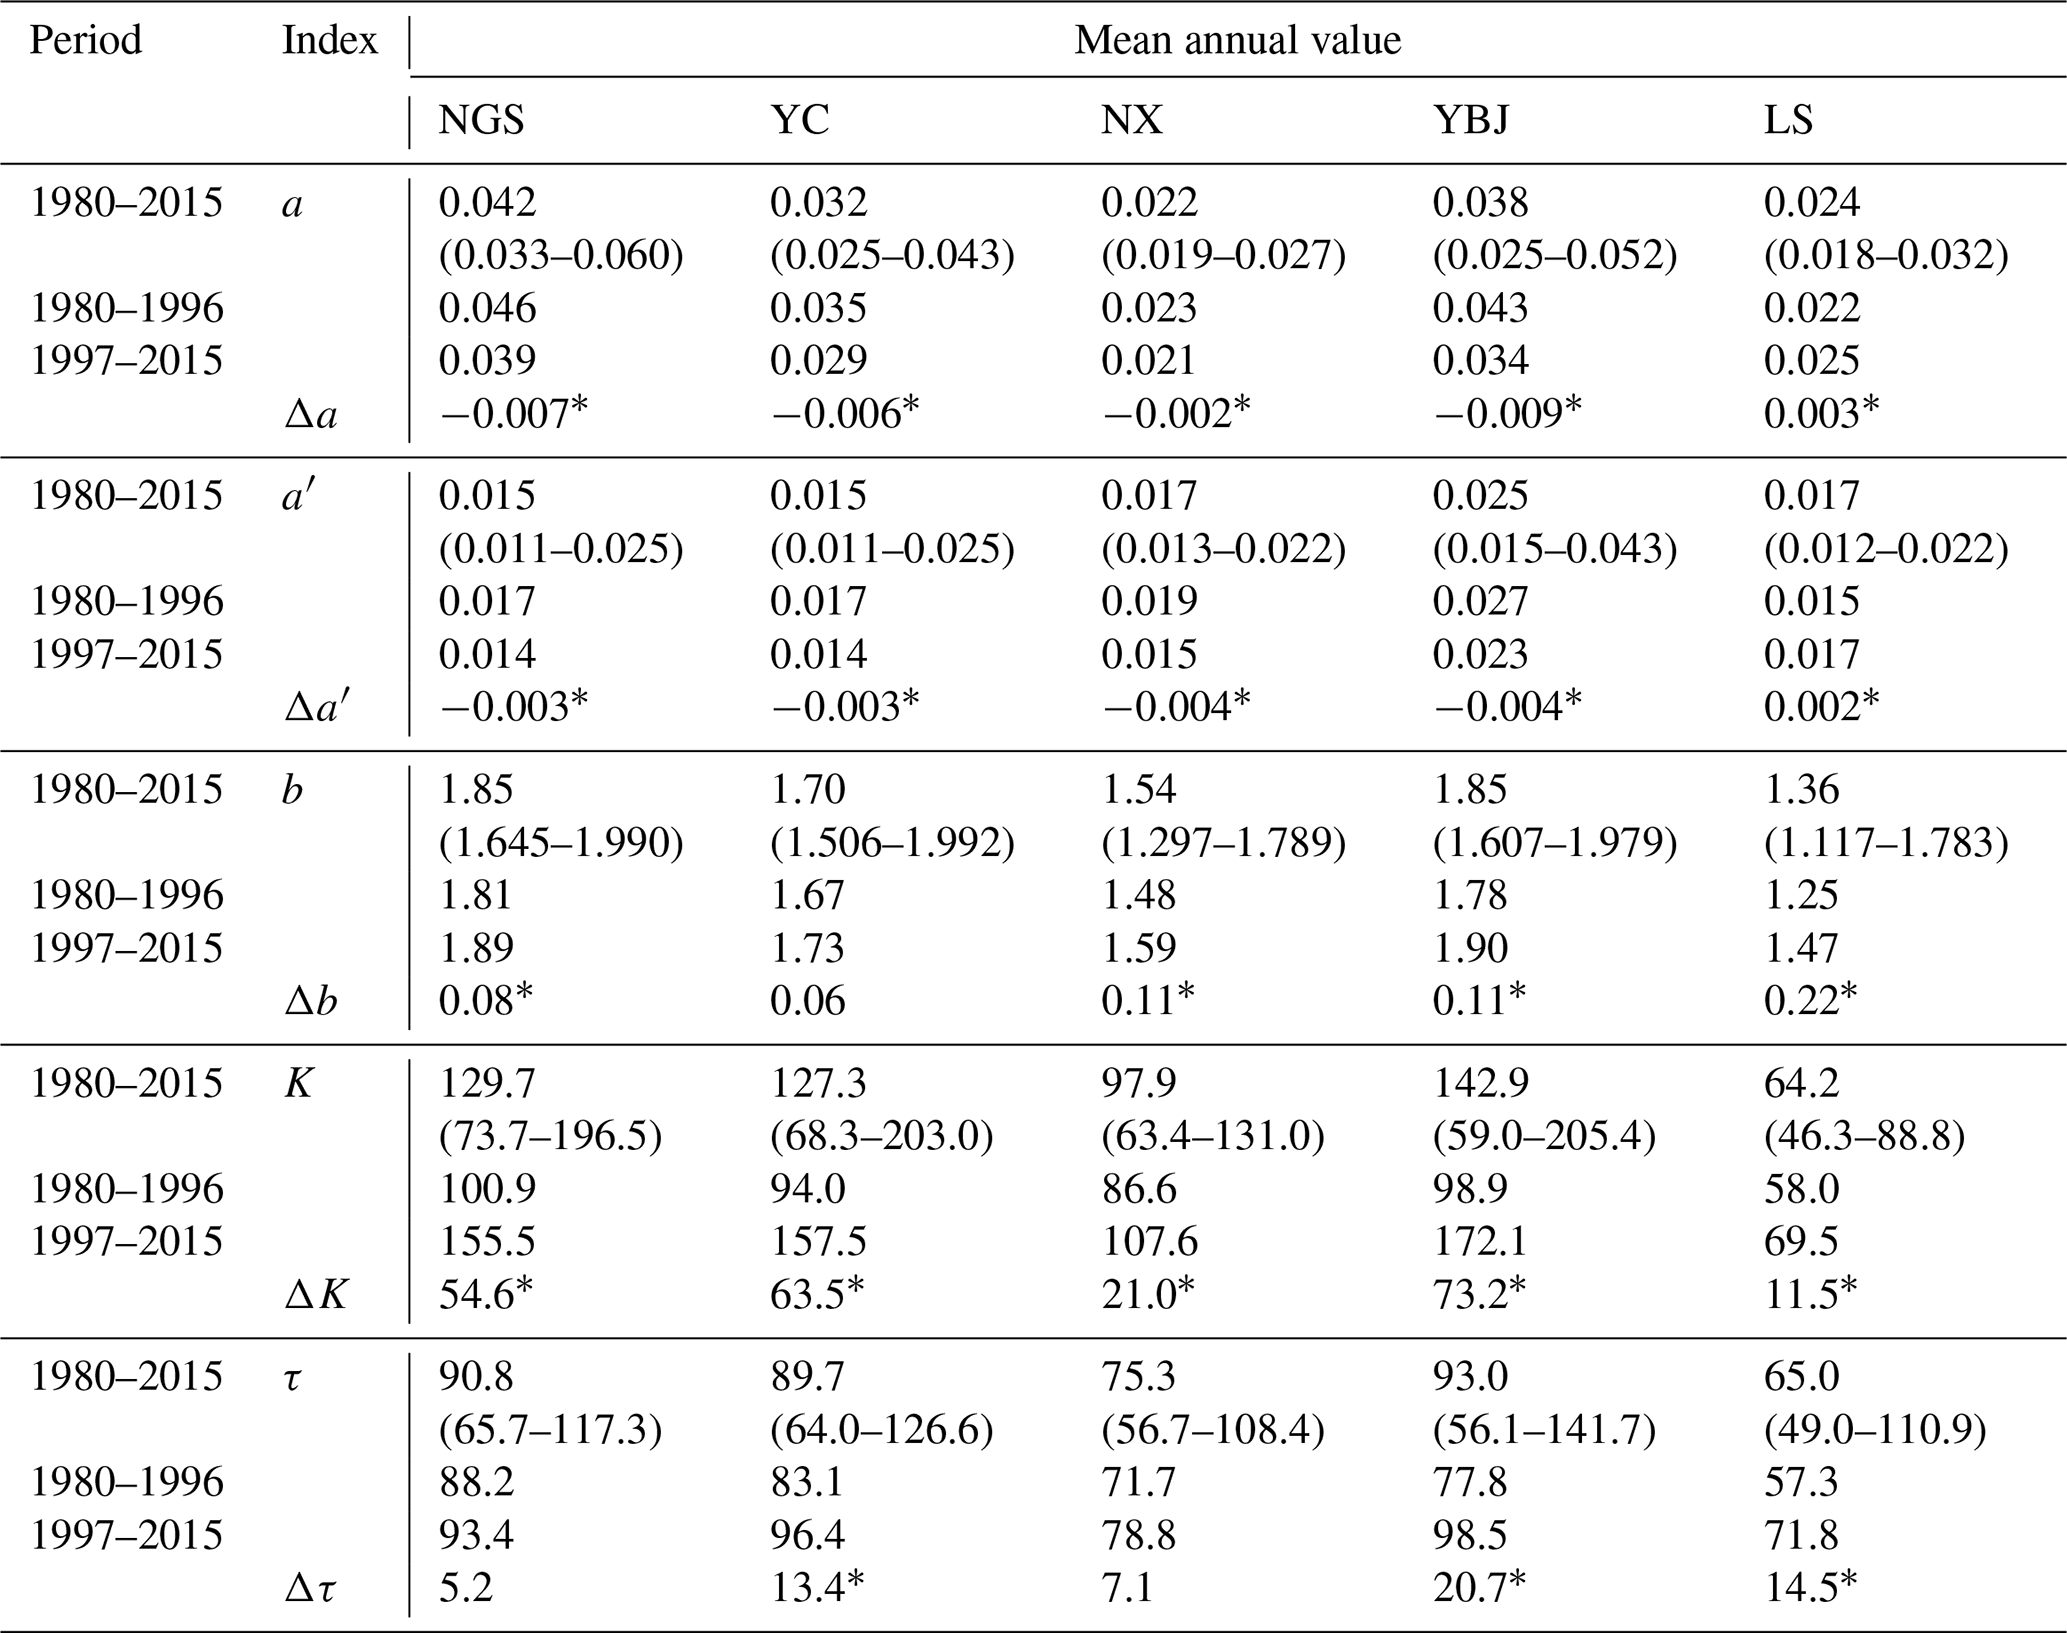
The asterisk∗ indicates the significance by the TFPW-MK test (p < 0.05). Values in parentheses refer to the range of annual value.
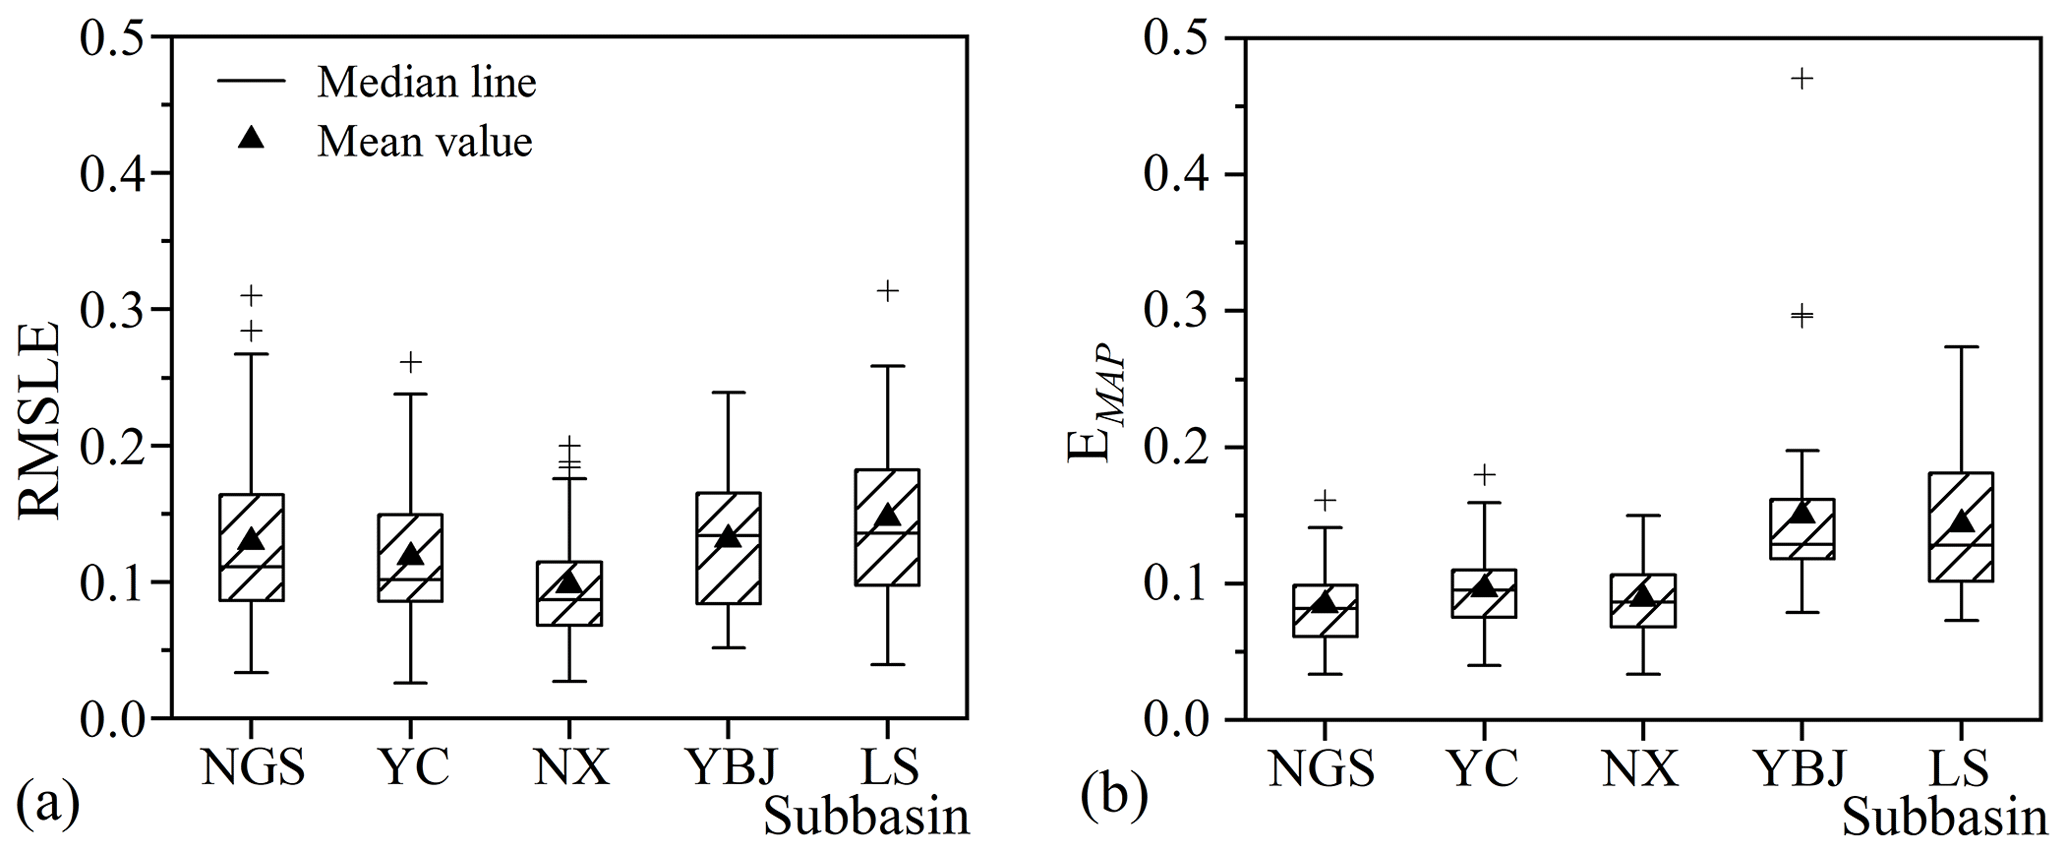
Figure 6The box plot of (a) the RMSLE of between observed and estimated discharge and (b) EMAP between annual mean observed and estimated discharge for individual recession hydrographs in each subbasin.
4.2 Estimation of the recession parameters
We used the observed hydrograph in each year and obtained the recession parameters a and b. Afterwards, a′ is calculated using the scaling factor k (0.527, 0.602, 0.740, 0.594, and 0.611 mm d−1 for NGS, YC, NX, YBJ, and LS, respectively). The results are summarized in Table 3. The mean values of annual a and a′ during 1980–2015 range from 0.022 to 0.042 and from 0.015 to 0.025 d−1, respectively, and the mean annual value of b ranges from 1.36 to 1.85 for the five subbasins. Figure 6 shows the errors of the estimated recession (RMSLE and EMAP) for the recession curve of each subbasin. Mean annual RMSLE is less than 0.15 in all subbasins. The mean annual EMAP is lower than 10 %, except in the subbasins of YBJ and LS, where EMAP is 0.15 and 0.14, respectively.
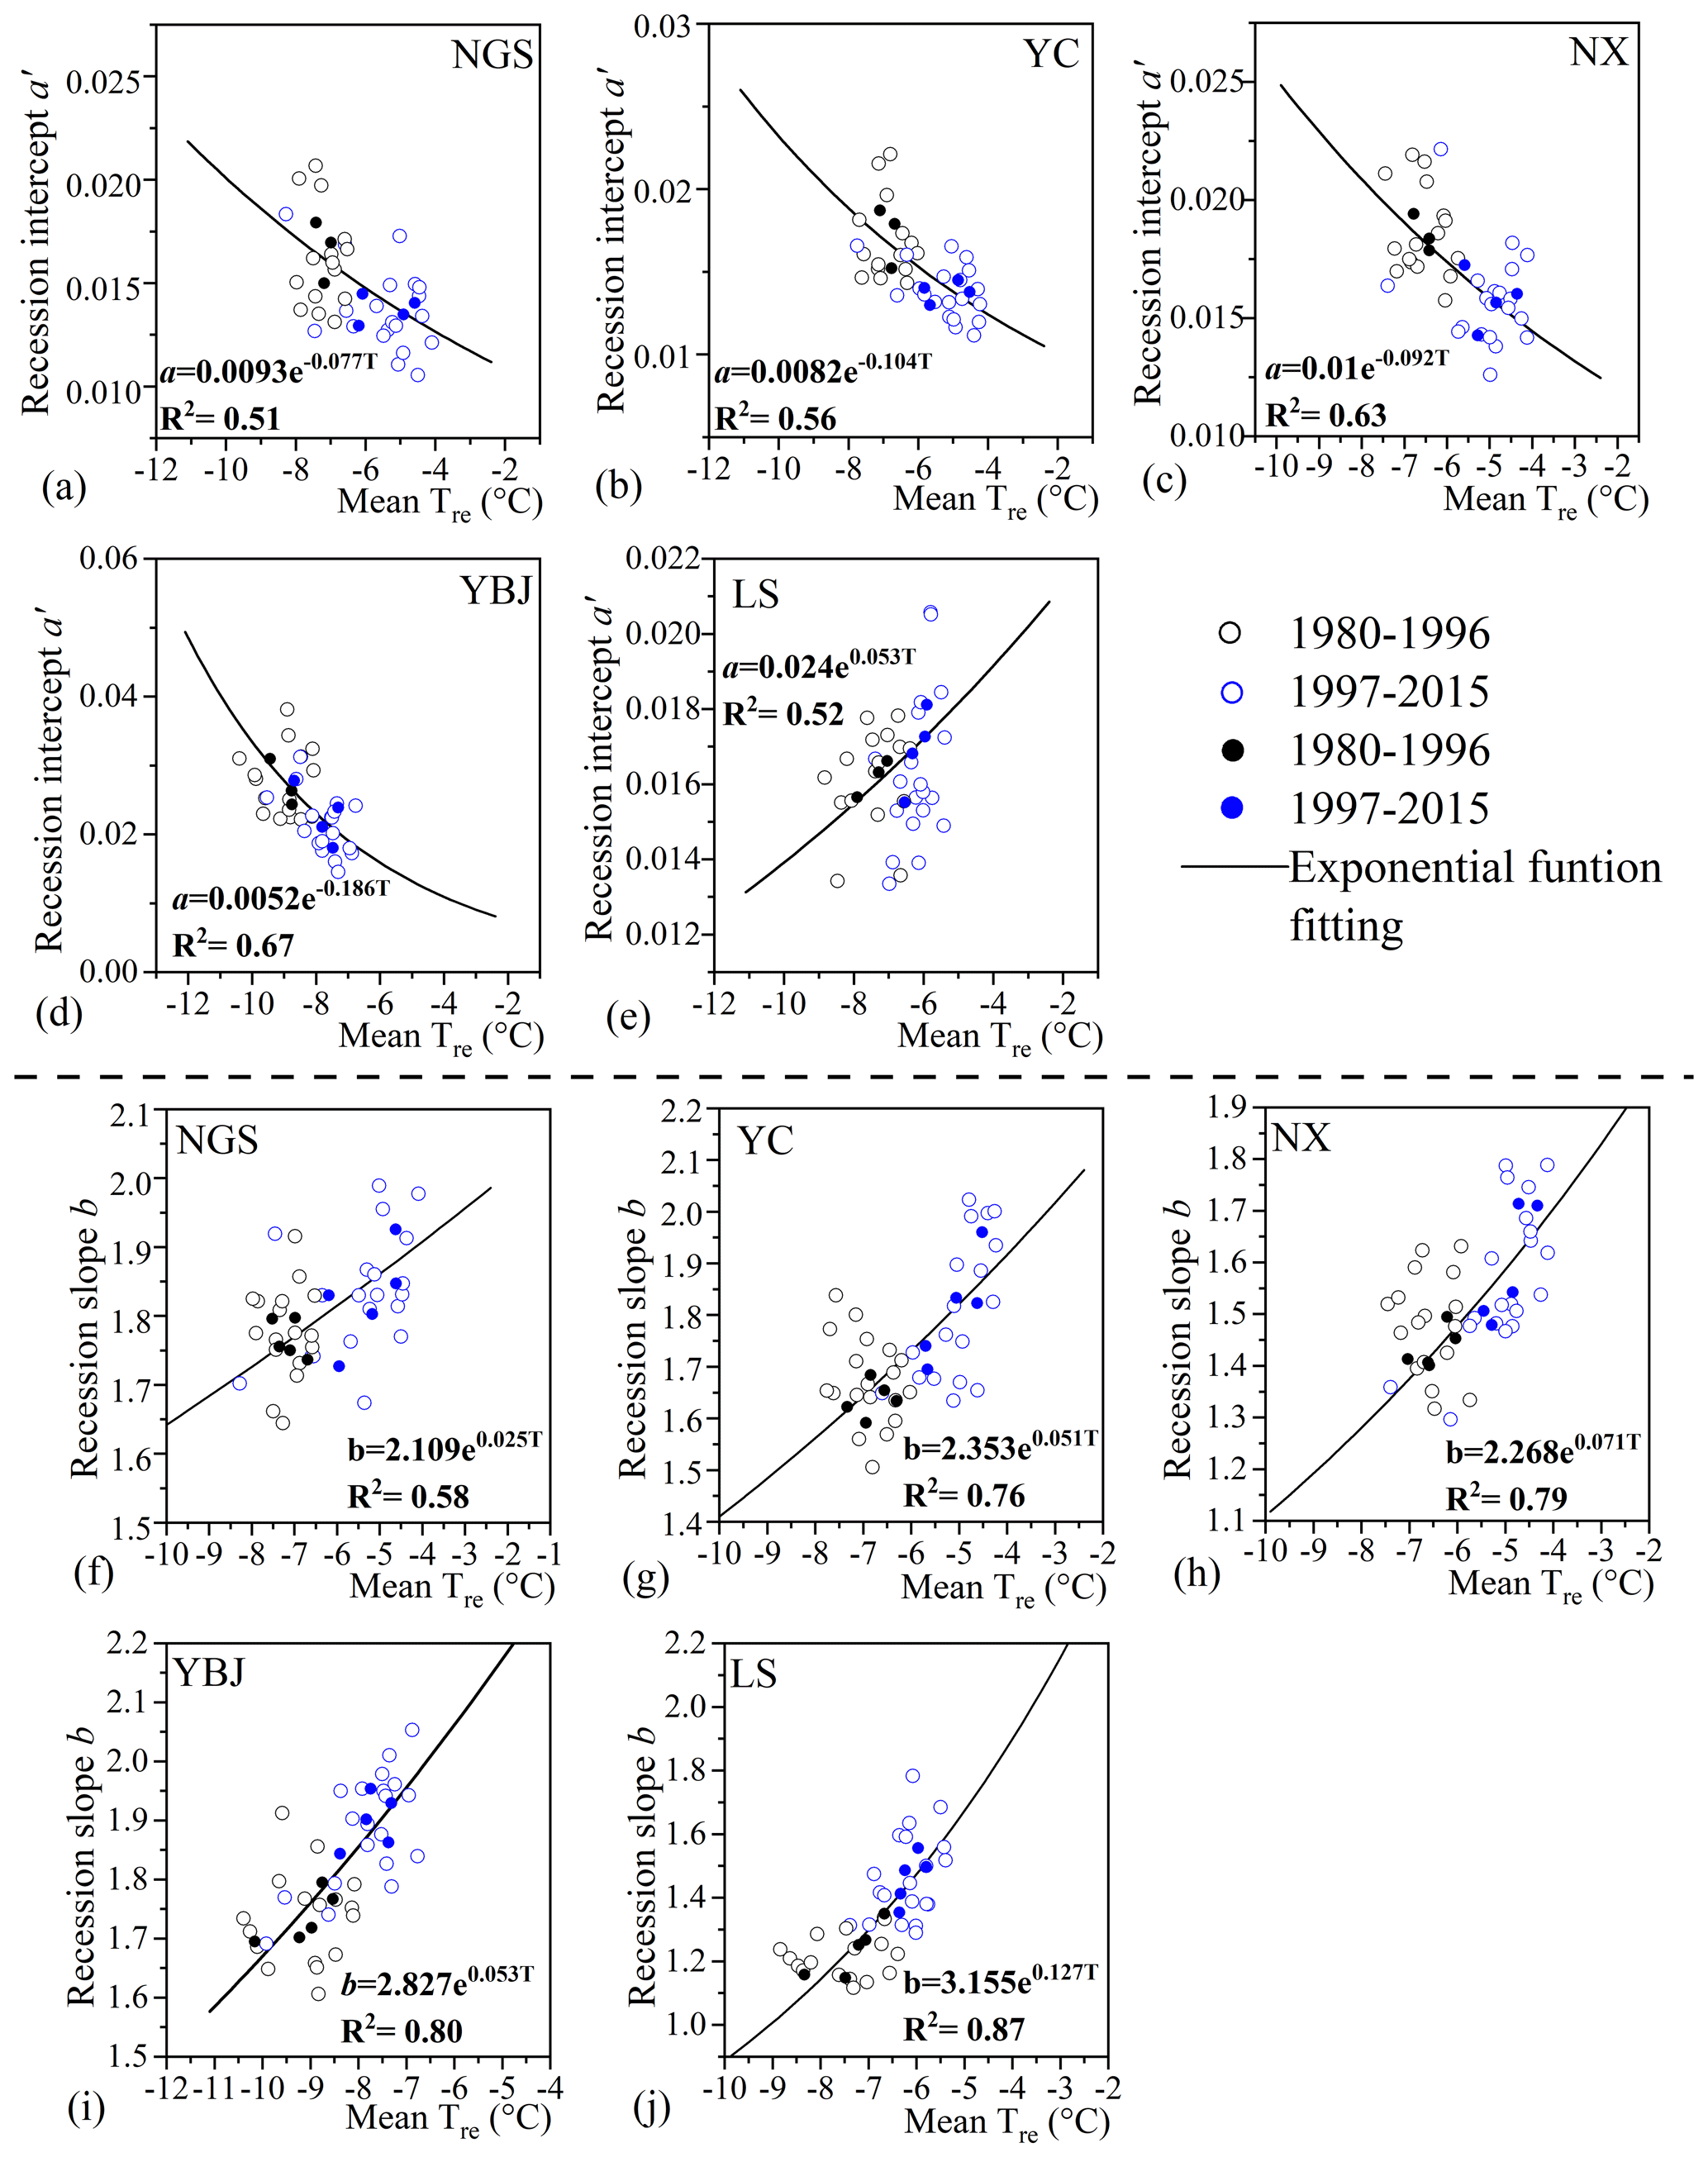
Figure 7(a–e) The exponential function of a′ with Tre for each subbasin. (f–j) Same as panels (a–e) but for recession slope b. The solid and open circles represent the 4-year average and annual value, respectively.
Figure 7 shows the relationship of the annual value and 4-year moving average value of the recession parameters a′ and b with mean surface air temperature in the recession period (Tre) in each subbasin. The exponential function between a′ or b and Tre is fitted with a high determination coefficient (R2 ranges 0.51–0.67 for a′ and 0.58–0.87 for b). These results show that a′ decreases exponentially with increasing Tre in the subbasins, except for LS, while b increases exponentially with increasing Tre in all subbasins.
For the multiyear mean values of parameters a, a′, and b in the two periods (Table 3), the mean value of a and a′ in the recent period ranges between 0.021–0.039 and 0.014–0.023 d−1, respectively, which is smaller than that in the early period when they range between 0.022–0.046 and 0.015–0.027 d−1, respectively, in the subbasins, except for LS. On the other hand, b ranges between 1.47–1.89 in the recent period, which is larger than that in the early period (1.25–1.81) for all subbasins. These results indicate that a warming and wetting climate increases the nonlinearity of the recession (b) and enhances stability of low streamflow [log(a)] for most subbasins in YRB.

Figure 8Relationship of S and Q at different values of K (a) and m (b) and combinations of K and m (c) in the two periods for subbasin YC. The different set of numbers in the blue box with a dashed line in each panel shows the K and m values and therefore the different S–Q relationships in the recent warmer period.
4.3 Change in storage–discharge relationship in warming climate
The strong sensitivity of the recession parameters of a (a′) and b to T means that a warming climate can change the nonlinear relationship of the water storage (S) and discharge/streamflow (Q) (Eq. 2). This change is shown by the increase in the recession coefficient K in the recent period (11.5–73.2 for ΔK in Table 3) and decrease in m () in Eq. (2) because b increases with the temperature (Table 3 and Fig. 7). The increase in K and decrease in m mean a lower discharge for a specific storage or a higher storage for a specific discharge in the recent warmer period. As an example, we show, in Fig. 8, the relationship of S with Q for different K and/or m between the two periods in subbasin YC. Q decreases significantly with the increase in K or decrease in m for storage S (Fig. 8a and b). The combination of the increase in K and decrease in m leads to a marked decrease in Q for storage S (Fig. 8c). Correspondingly, the recession timescale (τ = ) increases by 5.2–20.7 d in the recent warmer period in all subbasins (Table 3), especially the glaciated subbasin YBJ. The increase in τ also means an increase in storage for Q because > 0 in the recession.
Table 4The storage sensitivity of discharge (λS; mm−1) and sensitivity coefficients of recession parameters of a′ () and b (λb), T (λT), and Q (λQ) to storage changes (ΔS) during different periods for each subbasin. The values in parentheses refer to the range of annual value.
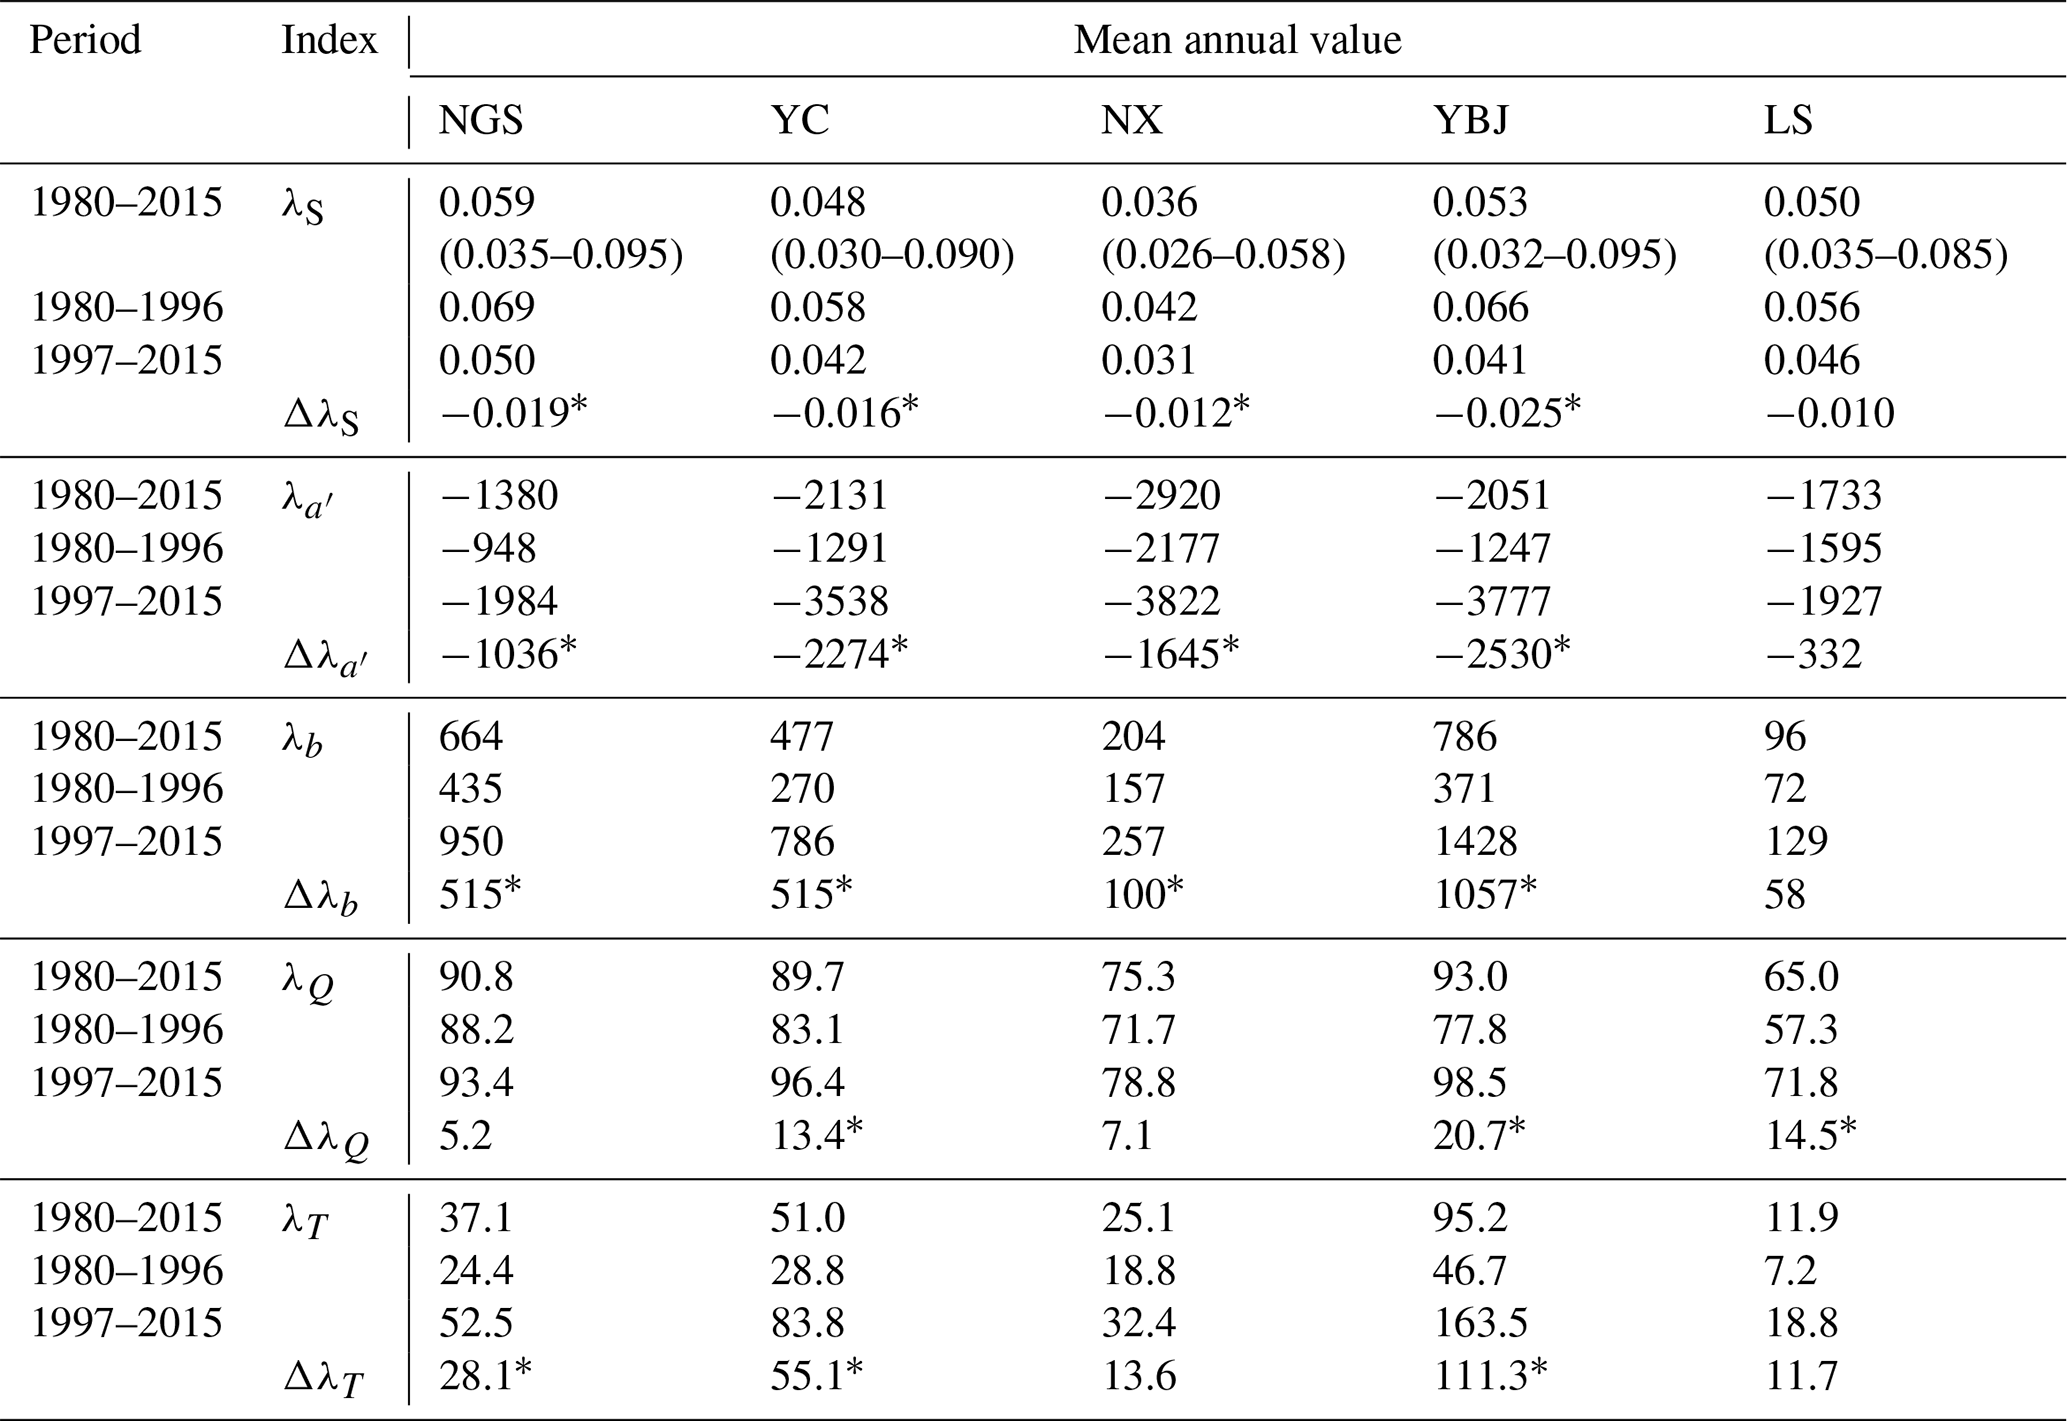
The asterisk * indicates the significance by the TFPW-MK test (p<0.05).
The lower discharge for a specific storage or higher storage for any specific discharge are further shown by the results of the storage sensitivity of the discharge (λS in Eq. 4) in Table 4. The mean value of λS during 1980–2015 ranges between 0.036 and 0.059 mm−1 for the five subbasins. These values mean that 1 mm decrease in storage only results in 3.6 %–5.9 % decrease in discharge. Thus, in a warmer climate, a unit decrease in the storage releases less water to discharge in the recession period and is supported by the decrease in λS in the recent warmer period (see the negative values of ΔλS in Table 4) and towards the warmer and wetter downstream for the main stem of YRB (from NGS to NX; see the mean annual value of λS during 1980–2015 in Table 4). This is especially so in glaciated basins, e.g., YBJ, where the decrease in λS (ΔλS in Table 4) is largest in the recent period, corresponding to the largest increase in τ. We also note that the decrease in λS (ΔλS) in LS is relatively small in the recent period, primarily because of the regulation of reservoirs on discharge.
4.4 Sensitivity of the recession parameters to storage change under climate warming
The change in the sensitivity of discharge to storage (λS) should affect the recession processes. This effect is described by the sensitivity of the recession parameters to storage change ΔS ( and λb for a′ and b, respectively). As listed in Table 4, λb is positive, while is negative in all five subbasins. The larger the negative is, the larger the positive λb would be in the recent warmer period, particularly in the glaciated subbasin of YBJ ( and Δλb in Table 4). Thus, the increase in storage in a warmer climate will correspondingly enhance the nonlinearity of recession (b) and streamflow stability [log(a)] in the YRB, as indicated in Eq. (13). This sensitivity can be weakened, however, by an anthropogenic effect (reservoir regulations), as suggested by the less sensitive result of the recession parameters of a′ and b to ΔS in LS subbasin.
Effects of climate warming on the change in the storage and streamflow recession characteristics can be further shown by the storage change ΔS in response to changes in T and Q (ΔT and ΔQ) using Eq. (16). The values of λT in Table 4 show an increase in the recent period in all subbasins, especially in YBJ and YC. Thus, the enlarged storage is largely attributed to climate warming. As expected, λT is smaller in the subbasin LS with its reservoir regulation. The values of λQ in Table 4 also become bigger in the recent warmer period in all subbasins. These changes indicate that climate warming increases storage and discharge.
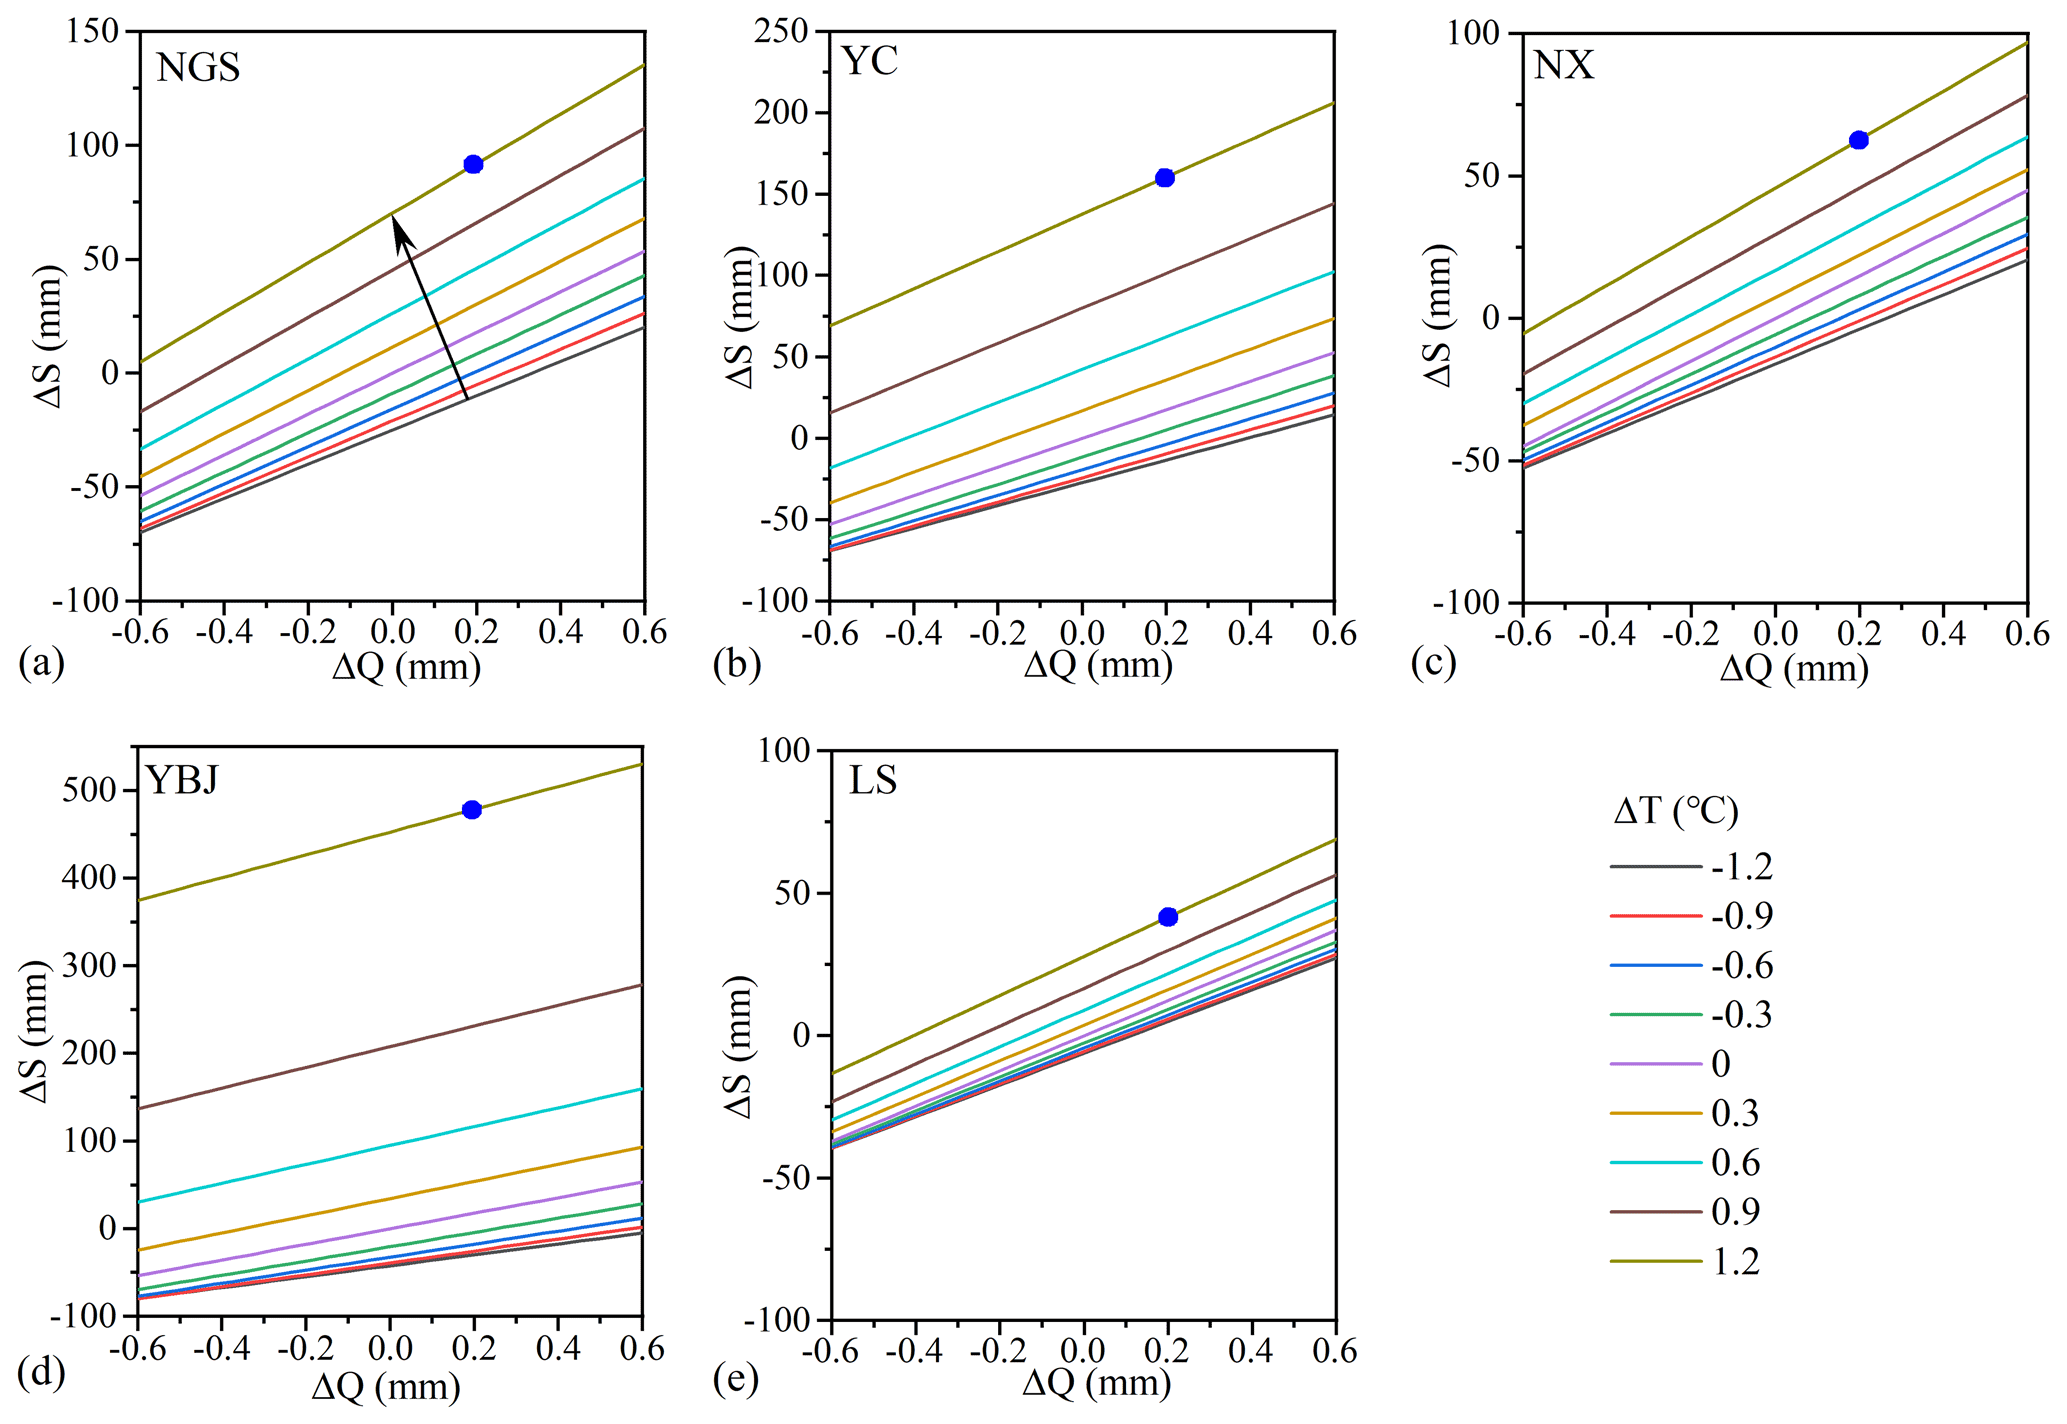
Figure 9Changes in storage ΔS in relation to changes in discharge ΔQ under different changes in temperature ΔT for each subbasin. The changes in temperature ΔT refer to the annual values relative to mean annual temperature in the recession period during 1980–2015. The solid circle refers the point of ΔS in response to 0.2 mm of ΔQ.
However, the increase in discharge ΔQ in response to the increase in storage ΔS can be quite different in response to the different rate of change in temperature ΔT in the five subbasins. According to Eq. (16), the relationship between ΔS and ΔQ for different ΔT in the five subbasins is shown in Fig. 9. As the temperature rises, ΔS becomes greater, while the greater increase in storage volume (in thawing soil layers) allows a smaller amount of water to be released as baseflow. For example, as the mean annual temperature rises by 1.2 ∘C (ΔT = 1.2 ∘C), the increase in discharge (ΔQ = 0.2 mm d−1) corresponds to a storage increase of about 92 mm in NGS, 160 mm in YC, 63 mm in NX, 42 mm in LS, and a huge increase of 478 mm in the YBJ (see the value of the ΔS vs. ΔQ in Fig. 9). These results suggest that a larger increase in water storage caused a smaller increase in baseflow in the glaciated subbasins, reflecting a buffering effect of freezing on streamflow dynamics.
When the Tre increased from the early to the recent period, from −7.17 to −5.39 ∘C in NGS, −6.84 to −5.16 ∘C in YC, −6.54 to −5.02 ∘C in NX, −9.20 to −7.69 ∘C in YBJ, and −7.60 to −6.20 ∘C in LS, the estimated water storage in terms of λTΔT in Eq. (16) increased between 15.2 and 132.6 mm for the five subbasins. These increases contribute to about 86.4 %–99.9 % of the total increase in storage ( in those subbasins. They only cause a 0.1 %–13.6 % increase in discharge in terms of in Eq. (16). This relationship varies among the five subbasins with different glaciate conditions. In the warm and wet subbasin of NX with low glacial coverage, the increase in storage (λTΔT) is relatively small (35.4 mm and 86.4 % of the total increase in storage), and the increase in discharge (λQΔQ) is relatively large (5.56 mm and 13.6 % of the total increase in storage). In the cold subbasins with high glacial coverage, climate warming causes a large increase in storage but a small increase in discharge. As an example, the YBJ subbasin has 97.3 % of the total increase in storage vs. only 2.7 % of the total increase in discharge. Again, this relationship is distorted in basins with human regulatory actions in water management. In the subbasin of LS, with strong reservoir regulations, changes in both the storage and discharge are small (e.g., 0.1 % in the total increase in storage).
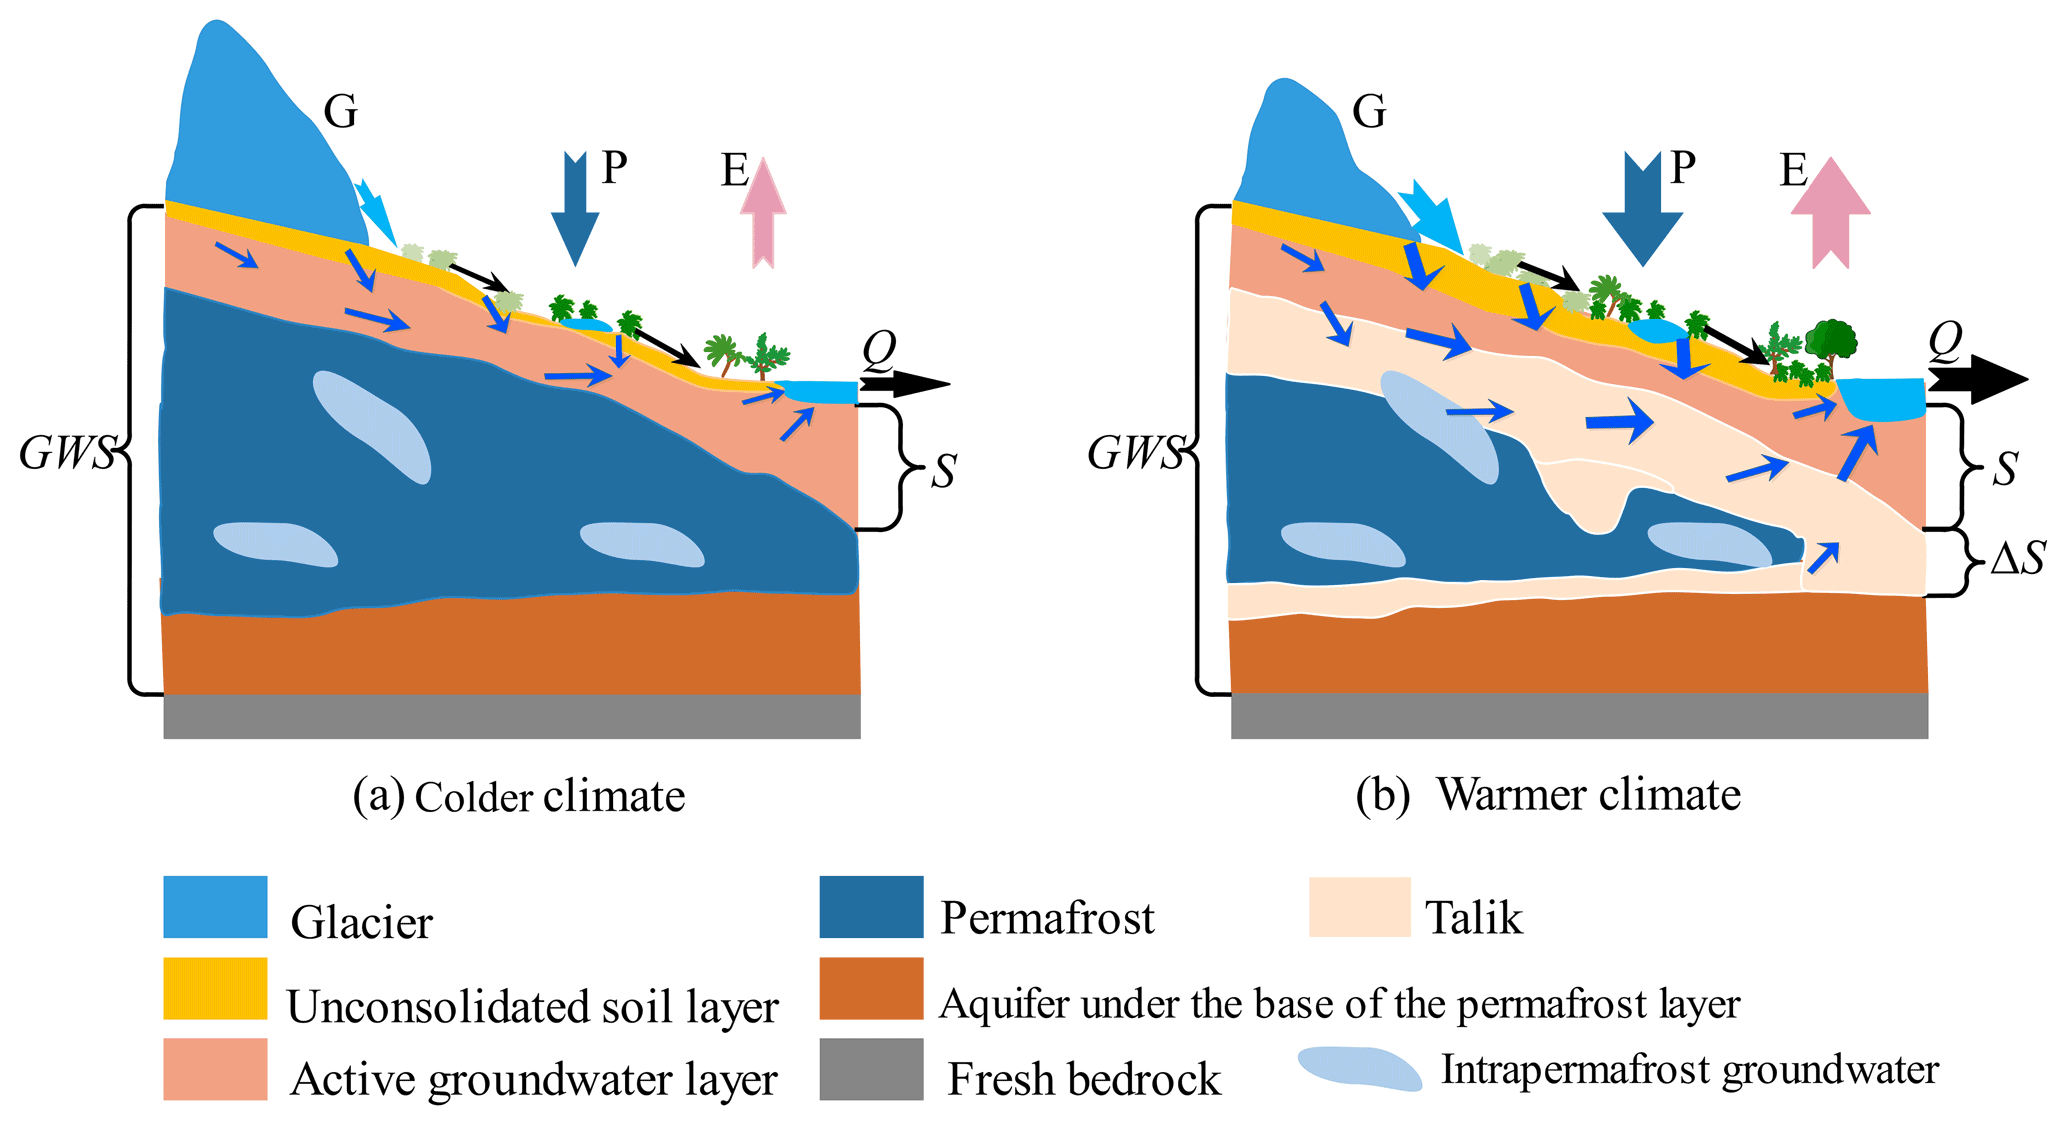
Figure 10A schematic illustration of the climate warming effect on surface conditions and the subsurface profile and hydrological variables. The larger sizes of the arrows indicate a large increase in the hydrological variables, e.g., glacier melting, precipitation, discharge, and evaporation.
Observations have shown that climate warming has accelerated glacier melting and permafrost thawing in cold climate and high-altitude regions. Subsequent changes are found in vegetation growth and the thickening of talik and active soil layer thickness. These changes have altered land surface conditions and unconsolidated soil profiles and subsurface permafrost and thereby redefined the surface and groundwater exchange and balance in those regions (Fig. 10). Our case study of YRB in southern TP shows that accelerated glacier melting and permafrost thawing during 1980–2015 have substantially increased its dynamic groundwater storage, which is defined as . These results, with the decrease in terrestrial water storage (TWS) in the southern TP, including YRB (Wang et al., 2020) in recent decades, indicate a transformation of water storage in the region from a solid form (glacier and permafrost) to a liquid volume (soil moisture, surface water in rivers/lakes, and groundwater; Fig. 10b). According to the water balance in a catchment, i.e., = , where S is regarded as the liquid volume (here, the change in S is equal to the sum of changes in soil moisture and groundwater), E is evapotranspiration, and Pr is the recharge from glacier melting, permafrost thawing, and precipitation, the increase in S infers that Pr is larger than the sum of E and Q in a study region. Because cold regions tend to have a greater coverage percentage of glacier and permafrost, glacier melting and permafrost thawing could substantially increase water storage under climate warming. Higher water storage could extend the recession period and sustain healthy annual streamflow.
Our study also shows that the increase in water storage and its effect on the annual recession of streamflow weakened towards the warmer downstream areas of YRB (with diminishing glacier melting and permafrost thawing effect). Accordingly, if the climate warming continues, the shrinking of the glacier and permafrost volume could eventually reach a point when there is not enough melting to recharge the liquid volume of water in YRB. From that point onward, steady streamflow in YRB would be in danger.
While the processes initiated by the accelerated glacier melting and permafrost thawing extend subsurface flow paths (Hinzman et al., 2020) and the streamflow recession time (τ), the increase in surface temperature and E can also increase surface water loss. According to the discharge relation = = (Kirchner, 2009), where Pr can be neglected in the recession period, a faster recession () could occur under climate warming from a faster decrease in storage () due to increasing E (Tashie et al., 2020), and a faster response of discharge to storage () could occur due to the increase in the effective hydraulic properties (Lamontagne-Hallé et al., 2018). This phenomenon has happened for the initial recession period of 1–2 months when temperature is relatively higher (see Fig. 4).
Meanwhile, the accelerated glacier melting and permafrost thawing have shortened the frost period (i.e., the prolonged MTDa and MTDre in Fig. 2j and k) and thereby increased the soil active layer thickness (ALT) for groundwater storage (Lamontagne-Hallé et al., 2018) and lengthened subsurface flow paths (Hinzman et al., 2020) and the streamflow recession time (τ). These changes weaken the sensitivity of the discharge to the storage ( = ) and slow down the recession rate (), which is found in the later recession period when temperature is relatively lower (see Fig. 4). Therefore, the competing effects from the warming climate on and in different recession phases would lead to the recession curve becoming more concave, which indicates an increase in the nonlinearity of the recession (b) and streamflow stability [log(a)] in YRB. In comparison, in the warm climate area, the effect of the storage decrease () on the recession () strengthens, and the effect of the recession timescale ( or ) on the recession weakens. As shown in Fig. 9, when temperature is higher (e.g., large and positive ΔT), hydrograph recession (negative ΔQ) is faster, along with the faster decline of storage (ΔS).
Additionally, deep circulating groundwater through macro structures, such as north–south-oriented active tensile faults (Fig. 1b), could also affect the baseflow and its recharge and discharge (Tan et al., 2021). According to studies using multi-tracer data (e.g., 2H, 3H, 18O, and Sr), modern meltwater is found to primarily maintain the rapid recharge of phreatic groundwater in alpine regions through faults and fissures (Shi et al., 2021). In the middle of the YRB (i.e., NGS–YC subbasins), changes in storage sensitivity to temperature (λTin Table 4) and recession timescale (τ) are greater than those in the upstream and downstream areas (NGS and NX subbasin, respectively). Rising temperature can greatly increase storage (Fig. 10b).
Finally, the anthropogenic effects from reservoir regulation can reduce the climate warming effect on these storage–discharge responses in the YRB. For example, in the LS subbasin, operations of two reservoirs significantly reduced the sensitivity of the recession parameters a (a′) and b to climate warming and increased streamflow stability [log(a)] (Fig. 4e). It remains questionable, however, as to how this human effort in water management in YRB would be practical/beneficial after the point when the increase in water storage from glacier and permafrost melt has exhausted the solid volume of water resources in the basin following climate warming.
Climate warming accelerated after 1997 in the Tibetan Plateau, especially in its cold and high-altitude upstream areas. Since 1997, the mean annual temperature has risen by 0.75–1.52 ∘C, and the mean temperature in the annual recession period (1 October–15 February of the following year) has risen by 1.40–1.78 ∘C in the five subbasins of the YRB. The largest rise in temperature occurred in the drier and colder subbasins in the upstream YRB. The recent strong warming has accelerated glacier melting and permafrost thawing, and thereby increased annual streamflow (12.7 %–31.5 % larger than the mean value in the early period before 1997) and streamflow in the recession period (20.9 %–25.8 % larger than before 1997) for the five subbasins, except LS where reservoir operations are active and heavily affecting the streamflow. These processes initiated by climate warming have changed the hydrological properties of subbasins considerably and altered the recession characteristics and the storage–discharge relationships.
We have found that the recession parameter a (a′) that characterizes the stability of streamflow has decreased exponentially in the subbasins, except for LS. Meanwhile, the parameter b that describes the nonlinearity of the recession to discharge has increased exponentially in all the subbasins. These results indicate that climate warming increases the nonlinearity of the recessions and enhances streamflow stability in most of the subbasins in YRB. Our sensitivity analysis further shows the decrease in the sensitivity of discharge/streamflow to storage under the warming climate. Currently, the accelerated glacier melting and permafrost thawing have recharged the system, deepening the active subsurface zone and increasing groundwater storage. Only a small fraction of the enlarged storage is released in surface streams because the increase in active water layer lengthens subsurface flow paths. These changes have also increased the recession timescale and retarded the recession in the later period, particularly in high-altitude cold climate areas. In the relatively warm climate areas downstream of the YRB, the effect of these changes is minor.
As the liquid water storage has increased greatly from melting glaciers and thawing permafrost in the YRB in the recent warming climate, the fast erosion of the solid water storage has weakened its buffering effect of the streamflow, which is becoming less stable and more vulnerable to individual intense precipitation events, such as increase in the recession rate in the initial period found in this study. There are the following two potential consequences from these changes: one is the increase in flash flooding in the trend of rising precipitation in the high-altitude subbasins where more land is exposed after the retreat of glaciers, and the other is the extreme scenario of exhaustion of the water resources in the upstream of the YRB after the buffering effect of glacier and permafrost is lost following the continued warming of the climate.
While human interference with these processes, via reservoirs and regulations, can reduce and curb these impacts of climate warming on storage–discharge relationships, recession characteristics, and streamflow in short term, as shown in the subbasin of LS, long-term strategies need to be developed to not only cope with the short-term needs but also the sustainability of water resources in the Tibetan Plateau under the threat of the continued warming that could change the entire hydrological system in this critical water source region for the one of world's most populated nations.
All codes and results developed in this work and presented/discussed in this paper are available upon request to the corresponding author. The sources of data used in this paper are listed in Table 1 and are accessible via their websites.
JW was responsible for writing the original draft and the investigation, methodology, data curation, and visualization. XC conceptualized the project, reviewed and edited the paper, conducted the formal analysis, and acquired the funding. MG developed the methodology and curated the data. QH reviewed and edited the paper. JL curated the data and validated the project.
The contact author has declared that none of the authors has any competing interests.
Publisher's note: Copernicus Publications remains neutral with regard to jurisdictional claims in published maps and institutional affiliations.
This article is part of the special issue “Hydrological response to climatic and cryospheric changes in high-mountain regions”. It is not associated with a conference.
We thank Rupp Diffendal and the two anonymous reviewers, for their valuable comments that have led to improvements in the contents and clarity of this paper. The work presented in this paper has been supported by the National Natural Science Foundation of China (NSFC; grant nos. 91747203 and 41901029) and the Second Tibetan Plateau Scientific Expedition and Research Program (STEP; Ministry of Science and Technology, MOST; grant no. 2019QZKK0207). Qi Hu's contribution has been supported by the U.S. Department of Agriculture Cooperative Research Project (grant no. NEB-38-088).
This research has been supported by the National Natural Science Foundation of China (grant nos. 91747203 and 41901029), the U.S. Department of Agriculture (grant no. NEB-38-088), and the Second Tibetan Plateau Scientific Expedition and Research Program (grant no. 2019QZKK0207).
This paper was edited by Yue-Ping Xu and reviewed by two anonymous referees.
Bekele, E. G. and Nicklow, J. W.: Multi-objective automatic calibration of SWAT using NSGA-II, J. Hydrol., 341, 165–176, https://doi.org/10.1016/j.jhydrol.2007.05.014, 2007.
Bense, V. F., Kooi, H., Ferguson, G., and Read, T.: Permafrost degradation as a control on hydrogeological regime shifts in a warming climate, J. Geophys. Res.-Earth, 117, F03036, https://doi.org/10.1029/2011JF002143, 2012.
Berghuijs, W. R., Hartmann, A., and Woods, R. A.: Streamflow sensitivity to water storage changes across Europe, Geophys. Res. Lett., 43, 1980–1987, https://doi.org/10.1002/2016GL067927, 2016.
Bergner, F. and Zouhar, G.: A new approach to the correlation between the coefficient and the exponent in the power law equation of fatigue crack growth, Int. J. Fatigue, 22, 229–230, https://doi.org/10.1016/S0142-1123(99)00123-1, 2000.
Biswal, B.: Decorrelation is not dissociation: there is no means to entirely decouple the Brutsaert–Nieber parameters in streamflow recession analysis, Adv. Water Resour., 147, 103822, https://doi.org/10.1016/j.advwatres.2020.103822, 2021.
Bring, A., Fedorova, I., Dibike, Y. B., Hinzman, L. D., Mard, J., Mernild, S. H., and Woo, M.: Arctic terrestrial hydrology: A synthesis of processes, regional effects, and research challenges, J. Geophysi. Res.-Biogeo., 121, 621–649, https://doi.org/10.1002/2015JG003131, 2016.
Brooks, P., Chorover, J., Fan, Y., Godsey, S. E., Maxwell, R. M., McNamara, J., and Tague, C.: Hydrological partitioning in the critical zone: Recent advances and opportunities for developing transferable understanding of water cycle dynamics, Water Resour. Res., 51, 6973–6987, https://doi.org/10.1002/2015WR017039, 2015.
Brutsaert, W. and Hiyama, T.: The determination of permafrost thawing trends from long-term streamflow measurements with an application in eastern Siberia, J. Geophys. Res.-Atmos., 117, D22110, https://doi.org/10.1029/2012JD018344, 2012.
Brutsaert, W. and Nieber, J. L.: Regionalized drought flow hydrographs from a mature glaciated plateau, Water Resour. Res., 13, 637–643, https://doi.org/10.1029/WR013i003p00637, 1977.
Burt, T. P. and Williams, P. J.: Hydraulic conductivity in frozen soils, Earth Surface Processes, 9, 411–416, https://doi.org/10.1002/esp.3290010404, 1976.
Buttle, J. M.: Mediating stream baseflow response to climate change: The role of basin storage, Hydrol. Process., 32, 363–378, https://doi.org/10.1002/hyp.11418, 2018.
Cai, L. C., Li, Z. W., You, Y. C., and Huang, C.: Analysis of runoff changes in Lhasa River from 1956 to 2016 and the influencing factors, J. Water Resour. Water Eng., 32, 90–96, 2021.
Carey, S. K. and Woo, M. K.: Freezing of subarctic hillslopes, Wolf Creek Basin, Yukon, Canada, Arct. Antarct. Alp. Res., 37, 1–10, https://doi.org/10.1657/1523-0430(2005)037[0001:FOSHWC]2.0.CO;2, 2005.
Chang, X., Jin, H., He, R., Yang, S., Yu, S., Lv, L., Guo, D., Wang, S., and Kang, X.: Advances in permafrost and cold regions environments studies in the Da Xing'anling (Da Hinggan) mountains, northeastern China, J. Glaciol. Geocryol., 30, 176–82, https://doi.org/10.1007/s11442-008-0201-7, 2008.
Cuo, L., Zhang, Y. X., Zhu, F. X., and Liang, L. Q.: Characteristics and changes of streamflow on the Tibetan Plateau: A review, J. Hydrol., 2, 49–68, https://doi.org/10.1016/j.ejrh.2014.08.004, 2014.
Dralle, D., Karst, N., and Thompson, S. E.: a, b careful: The challenge of scale invariance for comparative analyses in power law models of the streamflow recession, Geophys. Res. Lett., 42, 9285–9293, https://doi.org/10.1002/2015GL066007, 2015.
Dralle, D. N., Karst, N. J., Charalampous, K., Veenstra, A., and Thompson, S. E.: Event-scale power law recession analysis: quantifying methodological uncertainty, Hydrol. Earth Syst. Sci., 21, 65–81, https://doi.org/10.5194/hess-21-65-2017, 2017.
Forster, R. R., Box, J. E., van den Broeke, M. R., Miège, C., Burgess, E. W., van Angelen, J. H., Lenaerts, J. T. M., Koenig, L. S., Paden, J., Lewis, C., Gogineni, S. P., Leuschen, C., and McConnell, J. R.: Extensive liquid meltwater storage in firn within the Greenland ice sheet, Nat. Geosci., 7, 95–98, https://doi.org/10.1038/ngeo2043, 2014.
Harman, C. J., Sivapalan, M., and Kumar, P.: Power law catchment-scale recessions arising from heterogeneous linear small-scale dynamics, Water Resour. Res., 45, W12601, https://doi.org/10.1029/2008WR007392, 2009.
Hayashi, M.: Alpine Hydrogeology: The Critical Role of Groundwater in Sourcing the Headwaters of the World, Groundwater, 58, 498–510, https://doi.org/10.1111/gwat.12965, 2020.
He, J., Yang, K., Tang, W., Lu, H., Qin, J., Chen, Y., and Li, X.: The first high-resolution meteorological forcing dataset for land process studies over China, Scientific Data, 7, 25, https://doi.org/10.1038/s41597-020-0369-y, 2020.
Hinzman, A. M., Lyon, S. W., Ploum, S. W., Sjoberg, Y., van der Velde, Y.: Increasing non-linearity of the storage-discharge relationship in sub-Arctic catchments, Hydrol. Process., 34, 3894–3909, https://doi.org/10.1002/hyp.13860, 2020.
Ji, F., Fan, L., Andrews, C. B., Yao, Y., and Zheng, C.: Dynamics of seasonally frozen ground in the Yarlung Zangbo River Basin on the Qinghai-Tibet Plateau: historical trend and future projection, Environ. Res. Lett., 15, 104081, https://doi.org/10.1088/1748-9326/abb731, 2020.
Juen, I., Kaser, G., and Georges, C.: Modelling observed and future runoff from a glacierized tropical catchment (Cordillera Blanca, Peru), Global Planet. Change, 59, 37–48, https://doi.org/10.1016/j.gloplacha.2006.11.038, 2007.
Kendall, M. G.: Rank Correlation Methods, 4th edn., Charles Griffin, London, 1975.
Kirchner, J. W.: Catchments as simple dynamical systems: catchment characterization, rainfall-runoff modeling, and doing hydrology backward, Water Resour. Res., 45, W02429, https://doi.org/10.1029/2008WR006912, 2009.
Koch, J. C., Kikuchi, C. P., Wickland, K. P., and Schuster, P.: Runoff sources and flow paths in a partially burned, upland boreal catchment underlain by permafrost, Water Resour. Res., 50, 8141–8158. https://doi.org/10.1002/2014WR015586, 2014.
Lamontagne-Hallé, P., McKenzie, J. M., Kurylyk, B. L., and Zipper, S. C.: Changing groundwater discharge dynamics in permafrost regions, Environ. Res. Lett., 13, 084017, https://doi.org/10.1088/1748-9326/aad404, 2018.
Li, Z. J., Li, Z. X., Song, L. L., Ma, J. Z., and Song Y.: Environment significance and hydrochemical characteristics of suprapermafrost water in the source region of the Yangtze River, Sci. Total Environ., 644, 1141–1151, https://doi.org/10.1016/j.scitotenv.2018.07.029, 2018.
Lin, L., Gao, M., Liu, J., Wang, J., Wang, S., Chen, X., and Liu, H.: Understanding the effects of climate warming on streamflow and active groundwater storage in an alpine catchment: the upper Lhasa River, Hydrol. Earth Syst. Sci., 24, 1145–1157, https://doi.org/10.5194/hess-24-1145-2020, 2020.
Liu, J. P. and Zhang, W. C.: Spatial variability in degree-day f actors in Yarlung Zangpo River Basin, China, Journal of University of Chinese Academy of Sciences, 35, 704–711. 2018.
Liu, Z., Yao, Z., Huang, H., Wu, S., and Liu, G.: Land use and climate changes and their impacts on Runoff in the Yarlung Zangpo River Basin, China, Land Degrad. Dev., 25, 203–215, https://doi.org/10.1002/ldr.1159, 2014.
Lyon, S. W. and Destouni, G.: Changes in catchment-scale recession flow properties in response to permafrost thawing in the Yukon River basin, Int. J. Climatol., 30, 2138–2145, https://doi.org/10.1002/joc.1993, 2010.
Lyon, S. W., Destouni, G., Giesler, R., Humborg, C., Mörth, M., Seibert, J., Karlsson, J., and Troch, P. A.: Estimation of permafrost thawing rates in a sub-arctic catchment using recession flow analysis, Hydrol. Earth Syst. Sci., 13, 595–604, https://doi.org/10.5194/hess-13-595-2009, 2009.
Mallakpour, I. and Villarini, G.: A simulation study to examine the sensitivity of the Pettitt test to detect abrupt changes in mean, International Association of Scientific Hydrology Bulletin, 61, 245–254, https://doi.org/10.1080/02626667.2015.1008482, 2016.
Mann, H.: Non-parametric test against trend, Econometrical, 13, 245–259, https://doi.org/10.2307/1907187, 1945.
Mao, T. and Wang, G.: Analysis on characteristics of low-flow based on the monthly runoff recession coefficient in the Three-river headwaters region, Resources and environment in the Yangtze basin, Resour. Environ. Yangtze Basin, 25, 1150–1157, 2016.
Niu, F. J., Gao, Z. Y., Lin, Z. J., Luo, J., and Fan, X. W.: Vegetation influence on the soil hydrological regime in permafrost regions of the Qinghai–Tibet Plateau, China, Geoderma, 354, 113892, https://doi.org/10.1016/j.geoderma.2019.113892, 2019.
Payn, R. A., Gooseff, M. N., McGlynn, B. L., Bencala, K. E., and Wondzell, S. M.: Exploring changes in the spatial distribution of stream baseflow generation during a seasonal recession, Water Resour. Res., 48, 519, https://doi.org/10.1029/2011WR011552, 2012.
Pepin, N., Bradley, R. S., Diaz, H. F., Baraer, M., Caceres, E. B., Forsythe, N., Fowler, H., Greenwood, G., Hashmi, M., Liu, X. D., Miller, J. R., Ning, L., Ohmura, A., Palazzi, E., Rangwala, I., Schöner, W., Severskiy, I., Shahgedanova, M., Wang, M. B., Williamson, S. N., and Yang, D. Q.: Elevation dependent warming in mountain regions of the world, Nat. Clim. Change, 5, 424–430, https://doi.org/10.1038/nclimate2563, 2015.
Pettitt, A. N.: A non-parametric approach to the change-point problem, J. R. Stat. Soc., 28, 126–135, https://doi.org/10.2307/2346729, 1979.
Ren, W., Yao, T., and Xie, S.: Stable isotopic composition reveals the spatial and temporal dynamics of discharge in the large river of Yarlungzangbo in the Tibetan Plateau, Sci. Total Environ., 625, 373–381, https://doi.org/10.1016/j.scitotenv.2017.12.310, 2018.
Sen, P. K.: Estimates of the regression coefficient based on Kendall's tau, J. Am. Stat. Assoc., 63, 1379–1389, https://doi.org/10.1080/01621459.1968.10480934, 1968.
Shi, D., Tan, H., Chen, X., Rao, W., and Renci, B.: Uncovering the mechanisms of seasonal river–groundwater circulation using isotopes and water chemistry in the middle reaches of the Yarlungzangbo River, Tibet, J. Hydrol., 603, 127010, https://doi.org/10.1016/j.jhydrol.2021.127010, 2021.
Su, F., Zhang, L., Ou, T., Chen, D., Yao, T., Tong, K., and Qi, Y.: Hydrological response to future climate changes for the major upstream river basins in the Tibetan Plateau, Global Planet. Change, 136, 82–95, https://doi.org/10.1016/j.gloplacha.2015.10.012, 2015.
Tallaksen, L. M.: A review of baseflow recession analysis, J. Hydrol., 165, 349–370, https://doi.org/10.1016/0022-1694(94)02540-R, 1995.
Tan, H., Chen, X., Shi, D., Rao, W., Liu, J., Liu, J., Eastoe, C. J., and Wang, J.: Base flow in the Yarlungzangbo River, Tibet, maintained by the isotopically-depleted precipitation and groundwater discharge, Sci. Total Environ., 759, 143510, https://doi.org/10.1016/j.scitotenv.2020.143510, 2021.
Tashie, A., Pavelsky, T., and Emanuel, R. E.: Spatial and temporal patterns in baseflow recession in the continental United States, Water Resour. Res., 56, e2019WR026425, https://doi.org/10.1029/2019WR026425, 2020.
Tashie, A. M., Scaife, C. I., and Band, L. E.: Transpiration and subsurface controls on streamflow recession characteristics, Hydrol. Process., 33, 2561–2575, https://doi.org/10.1002/hyp.13530, 2019.
Tian, F., Xu, R., Nan, Y., Li, K., and He, Z.: Quantification of runoff components in the Yarlung Tsangpo River using a distributed hydrological model, Advances in Water Science, 31, 324–336, https://doi.org/10.14042/j.cnki.32.1309.2020.03.002, 2020 (in Chinese).
Vuille, M., Kaser, G., and Juen, I.: Glacier mass balance variability in the Cordillera Blanca, Peru and its relationship with climate and the large-scale circulation, Global Planet. Change, 62, 14–28, https://doi.org/10.1016/j.gloplacha.2007.11.003, 2008.
Walvoord, M. A. and Kurylyk, B. L.: Hydrologic impacts of thawing permafrost – A review, Vadose Zone J., 15, 1–20, https://doi.org/10.2136/vzj2016.01.0010, 2016.
Walvoord, M. A. and Striegl, R. G.: Increased groundwater to stream discharge from permafrost thawing in the Yukon River basin: Potential impacts on lateral export of carbon and nitrogen, Geophys. Res. Lett., 34, 123–134, https://doi.org/10.1029/2007GL030216, 2007.
Walvoord, M. A., Voss, C. I., and Wellman, T. P.: Influence of permafrost distribution on groundwater flow in the context of climate-driven permafrost thaw: Example from Yukon Flats Basin, Alaska, USA, Water Resour. Res., 48, 524, https://doi.org/10.1029/2011WR011595, 2012.
Wang, J., Chen, X., Hu, Q., and Liu, J.: Responses of terrestrial water storage to climate variation in the Tibetan Plateau, J. Hydrol., 584, 124652, https://doi.org/10.1016/j.jhydrol.2020.124652, 2020.
Wang, J., Chen, X., Liu, J., and Hu, Q.: Changes of precipitation-runoff relationship induced by climate variation in a large glaciated basin of the Tibetan Plateau, J. Geophys. Res.-Atmos., 126, e2020JD034367, https://doi.org/10.1029/2020JD034367, 2021.
Wang, Y. H., Yang, H. B., Gao, B., Wang, T. H., Qin, Y., and Yang, D. W.: Frozen ground degradation may reduce future runoff in the headwaters of an inland river on the northeastern Tibetan Plateau, J. Hydrol., 564, 1153–1164, https://doi.org/10.1016/j.jhydrol.2018.07.078, 2018.
Wright, N., Hayashi, M., and Quinton, W. L.: Spatial and temporal variations in active layer thawing and their implication on run-off generation in peat-covered permafrost terrain, Water Resour. Res., 45, W05414, https://doi.org/10.1029/2008WR006880, 2009.
Xu, X., Wu, Q., and Zhang, Z.: Responses of active layer thickness on the Qinghai Tibet Plateau to climate change, Journal of Glaciology and Geocryology, 39, 1–8, 2017.
Yamazaki, Y., Kubota, J., Ohata, T., Vuglinsky, V., and Mizuyama, T.: Seasonal changes in runoff characteristics on a permafrost watershed in the southern mountainous regions of eastern Siberia, Hydrol. Process., 20, 453–467, https://doi.org/10.1002/hyp.5914, 2006.
Yang, K., and He, J.: China meteorological forcing dataset (1979–2018), National Tibetan Plateau Data Center [data set], https://doi.org/10.11888/AtmosphericPhysics.tpe.249369.file, 2019.
Yao, T. D., Wang, Y. Q., Liu, S. Y., Pu, J. C., Shen, Y. P., and Lu, A. X.: Recent glacial retreat in high Asia in China and its impact on water resource in northwest China, Sci. China Ser. D, 47, 1065–1075, https://doi.org/10.1360/03yd0256, 2004.
Yao, T., Pu, J., Lu, A., Wang, Y., and Yu, W.: Recent glacial retreat and its impact on hydrological processes on the Tibetan Plateau, China, and surrounding regions, Arct. Antarct. Alp. Res., 39, 642–650, https://doi.org/10.1657/1523-0430(07-510)[YAO]2.0.CO;2, 2007.
Yao, Y., Zheng, C., Andrews, C. B., Scanlon, B. R., Kuang, X., Zeng, Z., Jeong, S.-J., Lancia, M., Wu, Y., Li, G.: Role of groundwater in sustaining northern Himalayan rivers, Geophys. Res. Lett., 48, e2020GL092354, https://doi.org/10.1029/2020GL092354, 2021.
Yi, W., Feng, Y., Liang, S., Kuang, X., Yan, D., and Wan, L.: Increasing annual streamflow and groundwater storage in response to climate warming in the Yangtze river source region, Environ. Res. Lett., 16, 084011, https://doi.org/10.1088/1748-9326/ac0f27, 2021.
Yue, S. and Wang, C. Y.: Applicability of pre-whitening to eliminate the influence of serial correlation on the Mann–Kendall test, Water Resour. Res., 38, 41–47, https://doi.org/10.1029/2001WR000861, 2002.
Zhang, D., Huang, J., Guan, X., Chen, B., and Zhang, L.: Long-term trends of perceptible water and precipitation over the Tibetan Plateau derived from satellite and surface measurements, J. Quant. Spectrosc. Ra., 122, 64–71, https://doi.org/10.1016/j.jqsrt.2012.11.028, 2013.