the Creative Commons Attribution 4.0 License.
the Creative Commons Attribution 4.0 License.
 | 22 Jul 2022
Historical droughts manifest an abrupt shift to a wetter Tibetan Plateau
Yongwei Liu
Wen Wang
Han Zhou
Lide Tian
The Tibetan Plateau (TP) plays a vital role in Asian and even global atmospheric circulation, through the interactions between land and atmosphere. It has experienced significant climate warming and spatially and temporally variant wetting over the past half century. Because of the importance of land surface status to the interactions, determining the wetting and drying of the TP from individual changes in precipitation (Prep) or temperature is difficult. Soil moisture (SM) is the water synthesis of the surface status. The persistent deficit of SM (SM drought) is more sensitive to climate change than normal SM. This study first explored the climate wetting and drying of the TP from variations in historical SM droughts over 1961–2014, with a focus on spatiotemporal patterns, long-term variations, and climate causes of summer (May–September) SM droughts based on multiple observation and reanalysis data. The results showed comparatively frequent and severe droughts in the central and southern area, particularly in the semiarid and subhumid regions. SM drought exhibited an abrupt and significant (p < 0.05) alleviation in the interior and central-west TP in the middle to late 1990s. The prominent drought alleviation indicated a hydroclimate shift to a wetter plateau, not merely steady trends as given in the literature. We demonstrated that the wetting shift was dominated by Prep over potential evapotranspiration (PET). By contrast, the in-phase trends were combined forces of Prep and PET, with increased forces of PET after the wetting shift. Furthermore, the Prep dominance was largely attributed to a phase transition of the Atlantic multi-decadal oscillation from cold to warm since the mid-1990s. The PET impacts on the wetting trends were likely dominated by solar radiation, wind speed, and vapor pressure deficit. Regionally, the wetting shift was distinct from the arid to semiarid and semiarid to subhumid climate. Such spatiotemporal changes may affect the TP's atmospheric circulation and, subsequently, the Asian monsoon and global circulation, in addition to the fragile ecosystem in the TP.
- Article
(37100 KB) - Full-text XML
-
Supplement
(2126 KB) - BibTeX
- EndNote


The Tibetan Plateau (TP), with an area of ∼ 2.5 ×10⁶ km2 and more than half at the altitude above 4000 m in central Asia, is the highest and most extensive plateau in the world (Fig. 1). It therefore has long been described as “the roof of the world” and referred to by the scientific community as “the third pole”. The TP and its surroundings contain the largest number of glaciers outside the polar regions and the largest concentration of inland lakes worldwide (Wan et al., 2016). It is also regarded as the “water tower of Asia”, which is the birthplace of dozens of major rivers in Asia (e.g., Yangtze River, Huang River, Yarlung Zangbo River, Indus River, and Ganges). The TP exerts strong thermal forcing on the atmosphere (i.e., land–atmosphere feedback) over the Asian monsoon region (Yang et al., 2014). The climate change of the TP has profound impacts on the Asian and even global climate and hydrology.
The TP has undergone significant warming over the past decades (Liu and Chen, 2000; Yao et al., 2012). The air temperature (Temp) has increased by approximately 0.35 since 1970 (Yao et al., 2019), at a warming rate of ∼ 1.5 times the global surface air temperature increase (Zhang et al., 2013; Wang et al., 2008). The magnitude of climate warming increases from south to north (Yang et al., 2011; You et al., 2016). As a consequence of the greenhouse effect along with the increased absorbed energy via the snow-albedo feedback and cloud–radiation interactions, the TP's warming is accelerated (Liu and Chen, 2000; Duan and Xiao, 2015). The increasing Temp substantially affects the plateau's hydrological cycle, and the melting of glaciers, degradation of permafrost, increasing of river discharge, and expansion of lakes are among the most prominent effects of climate warming (Cheng and Wu, 2007; Yao et al., 2012; Cuo et al., 2014; Teng et al., 2021). The increasing Temp also increases the evaporative demand and consequently tends to contribute to the climate drying or aridity of the TP (Kuang and Jiao, 2016; Yao et al., 2019). Unlike the pronounced increase in Temp, the precipitation (Prep) has not shown consistent, plateau-wide changes over the past decades (Yang et al., 2011). Although the major rain gauges and station measurements exhibited general increasing trends in Prep, the trends were variable in space and time with large heterogeneity (Yao et al., 2012; Kuang and Jiao, 2016). The Prep in the subregions is increasing (e.g., the west and central TP) in some and decreasing (e.g., the southeast TP) in others, accompanied by nonuniform changes in different seasons (Xie et al., 2010; Yang et al., 2011; Gao et al., 2014). Furthermore, the actual evapotranspiration (ET) generally follows the Prep changes under significant warming (Gao et al., 2007; Yin et al., 2013). Thus, the increase/decrease in Prep cannot effectively reflect the climate wetting/drying of the plateau. Under the significant overall warming up and variant Prep increases/decreases in space and time, the wetting and drying changes in the TP become complicated and remain unclear.
Although Prep and Temp are the focus of climate change, they cannot directly and effectively reflect the climate wetting and drying of the TP. The TP is a region with the strongest land–atmosphere coupling in the midlatitudes (Xue et al., 2017), where both Prep and Temp are insufficient to account for the impacts of the feedback from the underlying land surface to the atmosphere. Meanwhile, soil moisture (SM) is a pivotal link between the land surface and atmosphere (Wanders et al., 2014). It is also the largest storage component of Prep and radiation anomalies on land (Seneviratne et al., 2010). SM not only determines the allocation ratio of rainfall in surface flow and infiltration, but also couples with evaporation and controls the water and energy feedback from the land surface to atmosphere. Specifically, SM modulates temperature variability through evaporation cooling (i.e., SM–Temp coupling) and influences Prep through the impacts on evaporation and boundary layer thickness (i.e., SM–Prep coupling) (Koster et al., 2011). Therefore, SM changes (drying and wetting) not only affect the regional underlying incoming water and energy redistribution but also produce impacts on a large-scale or even global climate system (Koster et al., 2016). Moreover, SM anomalies can persist for months, with substantial impacts on water and energy fluxes on land. These properties make SM capable of comprehensively reflecting climate anomalies and land surface feedback (Diro and Sushama, 2017). Compared with the abnormal high or normal SM status, the abnormal low SM status (i.e., SM deficiency/drought) is more sensitive to climate change because the soil under low moisture status is more sensitive to Prep variation and has more control on evapotranspiration (Seneviratne et al., 2010). Hence, the SM deficiency (drought) with its variations could better reflect the climate wetting and drying of the TP under the coupled land and atmosphere (Lansu et al., 2020; Liu et al., 2021). However, according to our review of the literature, the climate wetting and drying of the TP has never been investigated from the perspective of variations in SM droughts. Little is known about the SM droughts of the TP, including not only the drought spatiotemporal patterns and long-term variations, but also the climatic causes behind them.
Therefore, this study investigated the climate wetting and drying of the TP from the perspective of changes in historical SM droughts over the last half century. A synthetic investigation of SM droughts was conducted to (i) understand the spatiotemporal patterns and long-term variations in SM droughts on the TP and (ii) explore the climate causes behind them. This study assessed the SM droughts in summer (May–September). This practice is to ensure the reliability of SM drought identification because SM is frozen or frozen–thawed during cold months (i.e., October–next April) on the TP. Large-scale accurate, reliable SM estimation cannot be achieved with limited knowledge of the freeze–thaw processes for both remote sensing retrieval and land surface modeling (Taylor et al., 2012; Zwieback et al., 2015; Liu et al., 2019a).
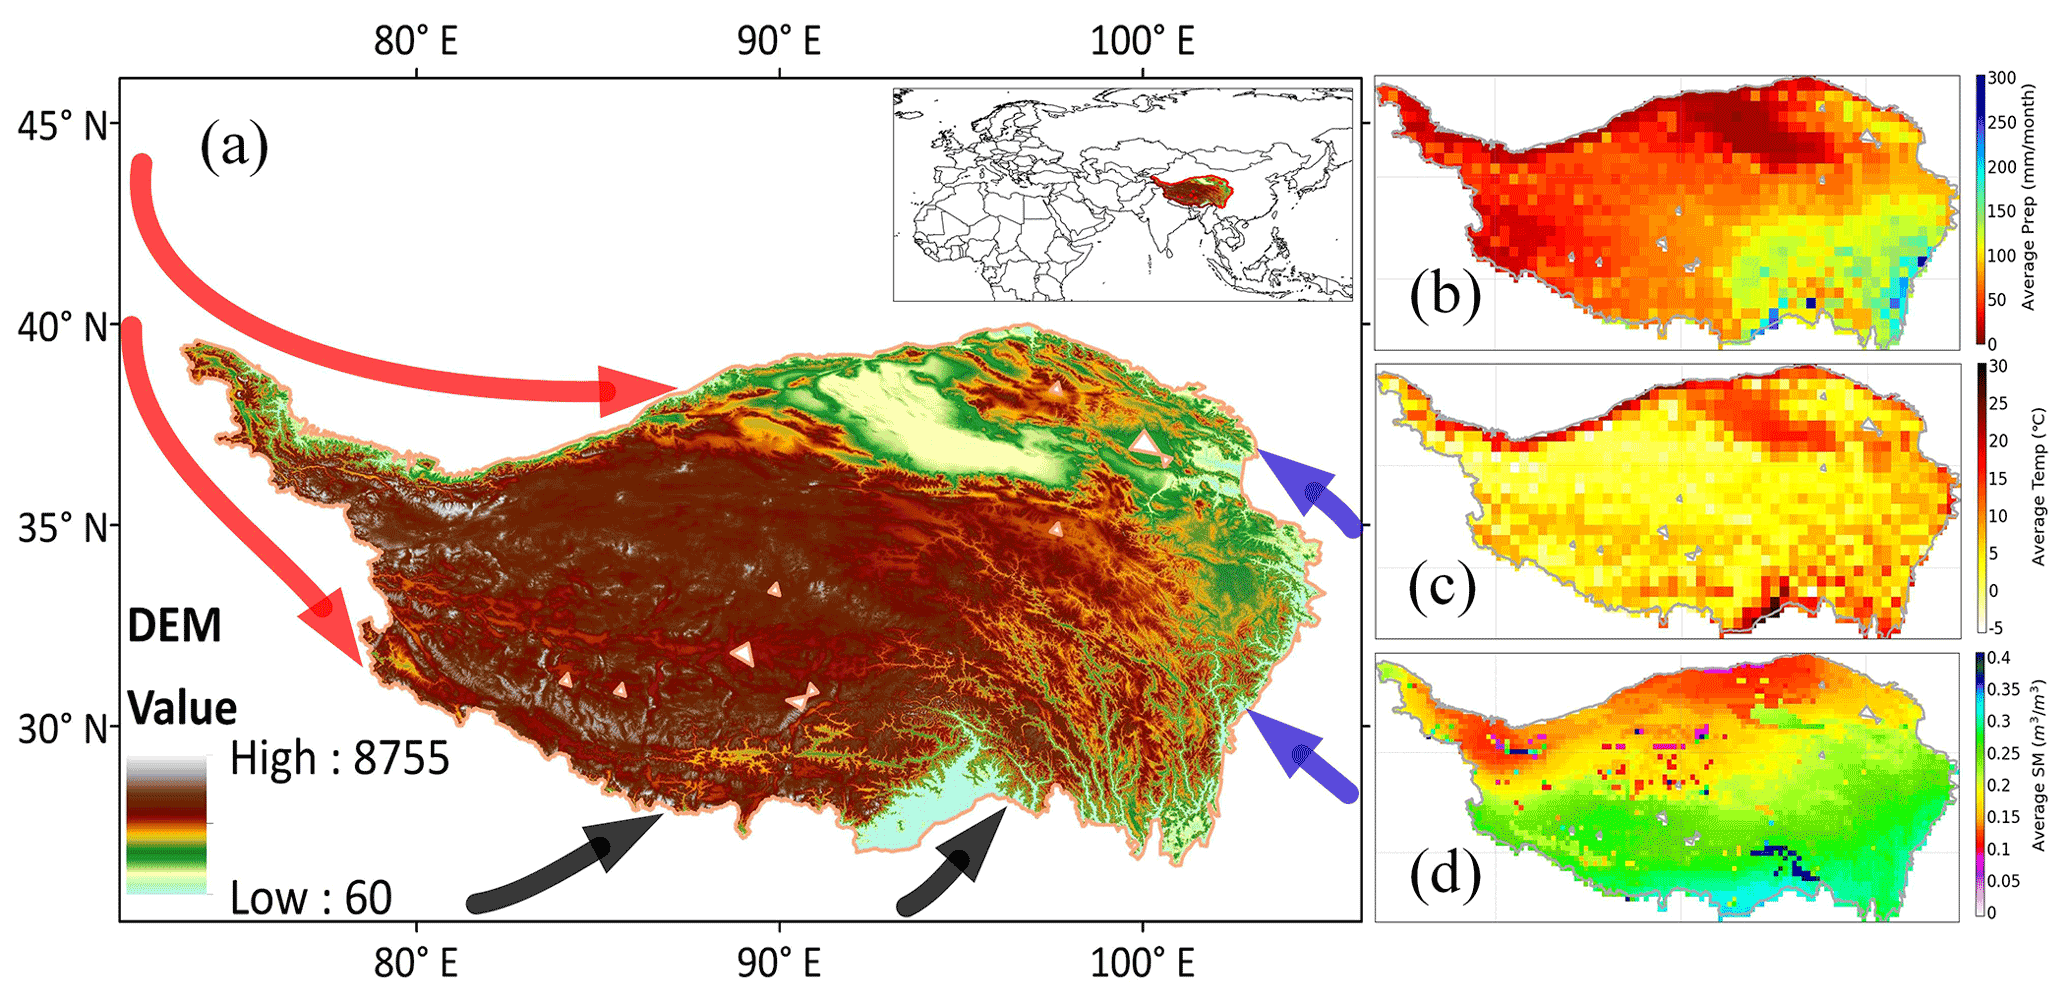
Figure 1(a) Location of the Tibetan plateau (TP) and the elevation, (b) monthly average precipitation (Prep), (c) air temperature (Temp), and (d) soil moisture (SM) over the summer period (May–September). Prep and Temp are based on the gauging interpolation data provided by the Chinese Meteorological Administration (CMA). SM is from the Noah model driven by the Global Land Data Assimilation System (GLDASv2.0/Noah) dataset with a depth of 0–10 cm. The black, red, and blue arrows represent the Indian monsoon, the westerlies, and the East Asian monsoon, respectively.
2.1 Study area
TP is the largest plateau in China and the highest in the world (Fig. 1a). The plateau is dominated by the Indian monsoon and the westerlies, with limited influence from the East Asian monsoon (Yao et al., 2012; Yang et al., 2014). The climate presents a general characteristic of low air temperature (Temp), strong solar radiation, and large spatial and temporal variability of Prep (Xie and Zhu, 2013; Xu et al., 2008). Limited by low Temp, the vegetation over most of the TP generally grows in summer (May–September) when the monthly average Temp is above 0 ∘C (Fig. S1 in the Supplement). Spatial patterns of the monthly average Prep, Temp, and SM for May–September are shown in Fig. 1b–d.
2.2 Data
To improve the reliability of the investigation, both the SM data generated by the Noah model driven by the Global Land Data Assimilation System (GLDASv2.0/Noah) and the fifth generation of the land component of the European Centre for Medium-Range Weather Forecasts atmospheric reanalysis (ERA5-Land) were used in this study. This decision is based on a large number of literature assessing the data quality of the existing SM products and the inconsistency in their results up to now, largely caused by such factors as the time period, location of in situ SM measurements, and data quality indicators in SM data evaluation (e.g., Su et al., 2011, 2021; Y. Chen et al., 2013; Zeng et al., 2015, 2022; Bi et al., 2016; Zhang et al., 2018, Q. Zhang et al., 2019; Xing et al., 2021). For example, the SM data of the TP from GLDAS Noah were verified to be better than the ESA CCI SM from the European Space Agency's Climate Change Initiative project and the global atmospheric reanalysis product of ERA-Interim from the European Centre for Medium Range Weather Forecasts in Q. Zhang et al. (2019), but the ESA CCI SM was evaluated to be better than GLDAS Noah SM in Zeng et al. (2022). Moreover, the in situ SM observations from the International Soil Moisture Network (ISMN) were used to verify the validity of the SM data from GLDASv2.0/Noah and ERA5-Land. A total of 111 ISMN soil moisture stations are available from three observation networks of NGARI, CTP-SMTMN, and MAQU, representing arid, semiarid and subhumid, and humid climate, respectively (Fig. S2 in the Supplement). GLDAS Noah and ERA5-Land simulate SM at four depths with spatial and temporal resolutions of 0.25∘ and 3 h and 0.1∘ and 1 h, respectively. In this study, the monthly resampled surface SM of 0.25∘ for GLDAS Noah and ERA5-Land SM over 1961–2014 was utilized.
Multi-elemental data of precipitation (Prep), air temperature (Temp), potential evapotranspiration (PET), surface (10 m) wind speed, downward shortwave radiation flux (Radi), vapor pressure deficit (VPD), latent heat flux, and net radiation flux were used to support the SM drought study. Prep and Temp were mainly provided by the Chinese Meteorological Administration (CMA) with a 1 month and 0.5∘ resolution. They were produced based on over 2400 national ground-based meteorological gauging stations using spatial interpolation approaches with elevation effects considered. PET, wind speed, Radi, VPD, latent heat flux, and net radiation flux were obtained from the output and forcing datasets of GLDAS Noah and ERA5-Land, respectively (Muñoz-Sabater et al., 2018; Beaudoing et al., 2019). PET, wind speed, Radi, latent heat flux, and net radiation flux were directly extracted. VPD was calculated based on the specific humidity, surface pressure, and surface (2 m) air temperature from GLDAS forcing and ERA5 reanalysis datasets. GLDASv2.0/Noah was entirely forced by the Princeton meteorological forcing dataset (Sheffield et al., 2006). This dataset was constructed by combining a suite of global observation-based datasets with the National Centers for Environmental Prediction–National Center for Atmospheric Research (NCEP-NCAR) reanalysis. Specifically, the contributing datasets used in the development of the forcing dataset comprised the NCEP-NCAR reanalysis, Climate Research Unit, Global Precipitation Climatology Project, Tropical Rainfall Measuring Mission, and the National Aeronautics and Space Administration Langley Surface Radiation Budget Project. ERA5-Land is a replay of the land component of the ERA5 climate reanalysis, forced by meteorological fields from ERA5. In addition, the Prep from China Meteorological Forcing Dataset (CMFD) (He et al., 2020) and the ET developed by Han et al. (2020, 2021) (hereafter denoted as Han ET) were incorporated in the inter-comparisons with GLDAS and ERA5 data to support the validity of SM evaluation.
To explore the climate causes of SM drought variations, the circulation indices of the Atlantic multi-decadal oscillation (AMO), the Pacific Decadal Oscillation (PDO), and the El Niño–Southern Oscillation (ENSO) (Niño 3.4) from the National Oceanic and Atmosphere Administration (NOAA) Physical Sciences Laboratory and the NOAA National Centers for Environmental Information (NCEI) were used. The monsoon circulation index of the Indian summer monsoon (ISM) (Wang et al., 2001) and the East Asian summer monsoon (EASM) (Li and Zeng, 2002) were adopted. The solar cycle was also accounted for using the solar radiation flux indices (SRF). Additionally, the ERA5 geopotential and U and V components of wind data were used in the upper air analysis. Considering the fact that changes in vegetation coverage is closely related to the changes in soil moisture (Zhong et al., 2010), the third-generation Normalized Difference Vegetation Index (NDVI) from the Advanced Very High Resolution Radiometer (AVHRR) sensors under the Global Inventory Monitoring and Modeling System (GIMMS) was incorporated in the analysis.
Drought is a sustained period of below-normal water availability (Tallaksen and Van Lanen, 2004). It has a temporally slow accumulation and spatially continuous expansion process. With the deepening of drought understanding, drought identification has expanded from a single time dimension to space–time synchronous recognition (Andreadis et al., 2005; Lloyd-Hughes, 2012; Xu et al., 2015; Herrera-Estrada et al., 2017; Zhu et al., 2019). Space–time joint identification could consider the space–time continuous property of actual droughts and reconstruct the drought development process. Therefore, it could improve the reflection of the real characteristics of droughts (e.g., the spatial position, overall severity, and duration of drought) and benefit the investigation of the climate forces of droughts (Lloyd-Hughes, 2012; Liu et al., 2021). In this study, the space–time joint identification of droughts was realized by recognizing the drought clusters (the spatially continuous regions under drought for each month) and eventually the drought events (the spatially continuous and temporally overlapped domain under drought).
3.1 Drought event identification
The space–time joint identification of drought events comprises the following steps:
-
Identification of the drought conditions for each SM grid pixel. The percentile was used as the drought indicator because of its effectiveness in many large-scale drought assessments (e.g., Herrera-Estrada et al., 2017). The monthly SM percentile on each grid was calculated from the empirical cumulative distribution function of each month (May–September) separately, based on the monthly SM from 1961 to 2014. Then, the monthly map of the SM percentile was smoothed using a 2-dimensional median filter to reduce the spatial noise. Grids with an SM percentile less than 0.15 are regarded as being under drought because it approximates the common drought metrics of the standard precipitation index value of −1.0 (Guttman, 1999).
-
Determination of the spatial continuity of grid pixels under drought. The spatially continuous grids below the drought threshold belong to one drought cluster. Drought clusters were identified using a spatial clustering method (Andreadis et al., 2005). Small clusters of less than 1.5 % of the TP area were not accounted for in case of spurious long droughts caused by tenuous spatial continuity (Liu et al., 2019b, 2021).
-
Recognition of the temporal continuity of drought clusters. The temporal links of drought clusters between adjacent months were determined according to their overlapping areas. Drought clusters with overlapping areas over 625 km2 (i.e., one grid pixel) were classified as being in the same drought event (Herrera-Estrada et al., 2017; Liu et al., 2021).
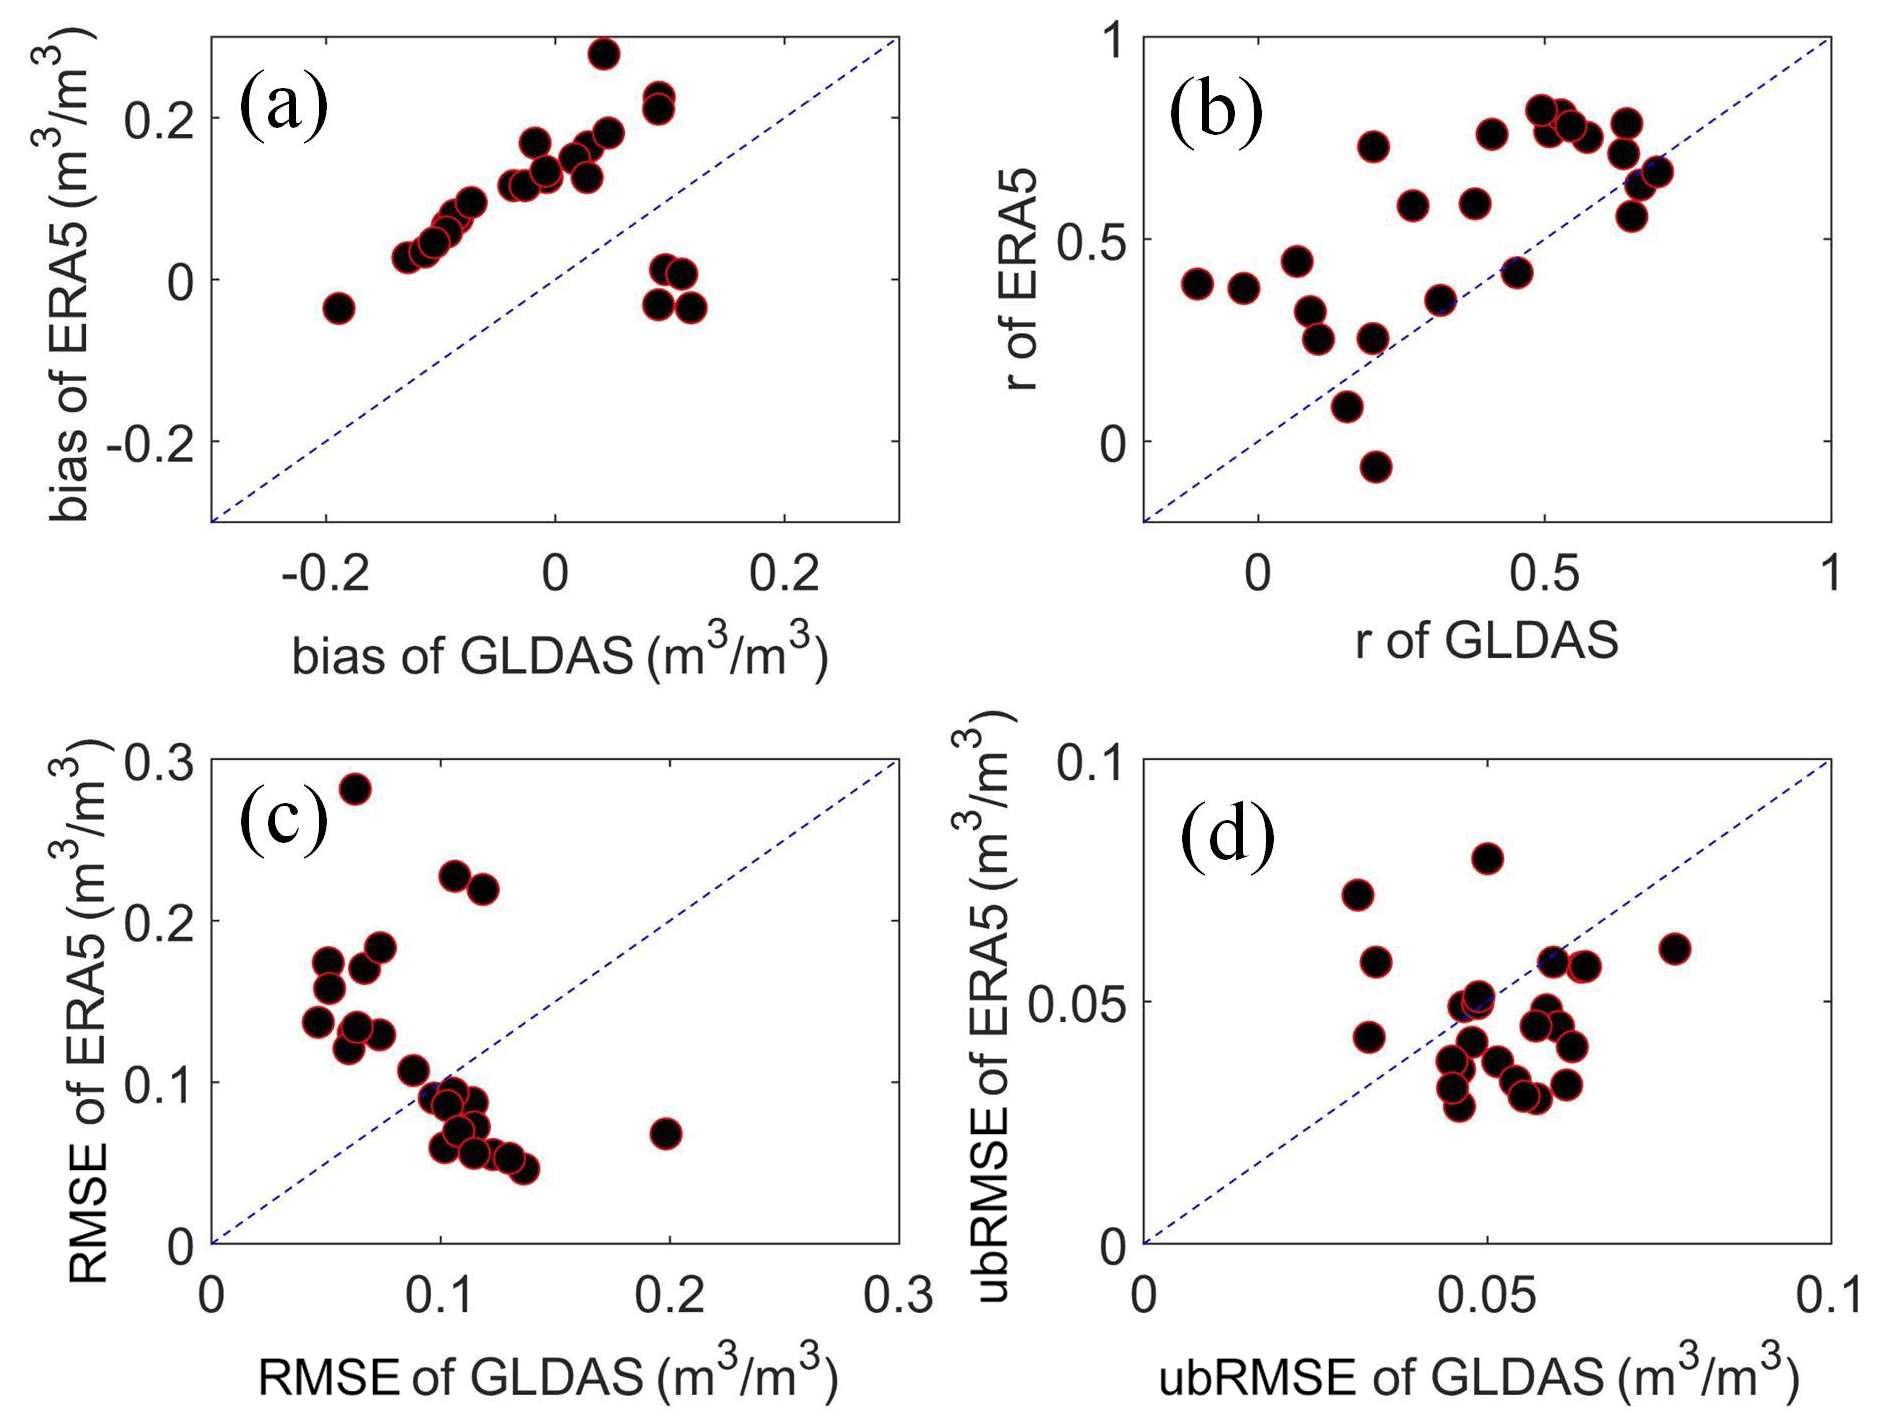
Figure 2Comparisons of the (a) bias, (b) Pearson correlation coefficient (r), (c) root mean square error (RMSE), and (d) unbiased RMSE (ubRMSE) for GLDAS and ERA5 soil moisture in the summer period of May–September over 2008–2014 based on the soil moisture measurements from the ISMN.
3.2 Drought characterization
The following drought characteristics are accounted for in the space–time joint identification of drought events in a 3-dimensional (latitude–longitude–time, 3-D) domain.
-
Drought duration. This is the time interval between the onset and the ending of one drought event.
-
Drought area. This is the total area affected by a drought in its duration.
-
Drought intensity and severity. These reflect the strength of drought and the water deficiency of one drought event, respectively. Drought intensity is represented by the value of 1.0 percentile for each grid pixel and characterized by the area average intensity of all grids within the drought cluster for each drought cluster (Herrera-Estrada et al., 2017). Drought severity can be expressed as the cumulative value of drought intensity for all grids within the space–time continuous structure of one drought event.
-
Drought cluster/event centroid. This is defined as the weighted center of the grid intensity, with the intensity value at each grid within the drought cluster/event domain as weights. For more details of the aforementioned drought identification and characterization, please refer to our previous research (Liu et al., 2021).
4.1 Validation of soil moisture data from GLDAS Noah and ERA5-Land
The validity of GLDAS and ERA5 SM was verified based on the in situ SM observations from the ISMN. The 111 ISMN stations with a data record of 2008–2014 were divided into 0.25∘ × 0.25∘ grids. Consequently, 26 measured grids in total were identified, with 5 in the arid NGARI, 12 in the semiarid and subhumid CTP-SMTMN, and 9 in the humid MAQU. The mean SM value of each grid was obtained by averaging the measurements of all stations falling within that grid pixel. The GLDAS and ERA5 monthly SM data were compared with the ISMN measurements over the summer period of May–September from 2008 to 2014 on 25 grids (one grid without measured data in NGARI).
Generally, GLDAS shows lower bias and root mean square error (RMSE) but higher unbiased RMSE (ubRMSE) and lower Pearson correlation coefficient (r) than ERA5 (Fig. 2). ERA5 SM seems more consistent with in situ observations in temporal variations than GLDAS SM during the summer period. Specifically, Fig. 3 shows that for MAQU located in the humid region, GLDAS SM performs better in bias, but ERA5 is better in r and ubRMSE. For NGARI in the arid region, ERA5 is better in bias, r, and RMSE but worse in ubRMSE than GLDAS. For CTP-SMTMN in the semiarid and subhumid region, GLDAS shows larger advantage in bias and RMSE, but ERA5 has more advantage in r and ubRMSE. ERA5 SM seems more advantageous than GLDAS in semiarid, subhumid, and humid regions without the system bias considered. Both ERA5 and GLDAS SM data present considerably higher temporal consistency with in situ measurements in the arid, semiarid, and subhumid regions than the humid region (Fig. 3). It may indicate more credibility in SM variation analysis for the arid, semiarid, and subhumid regions.
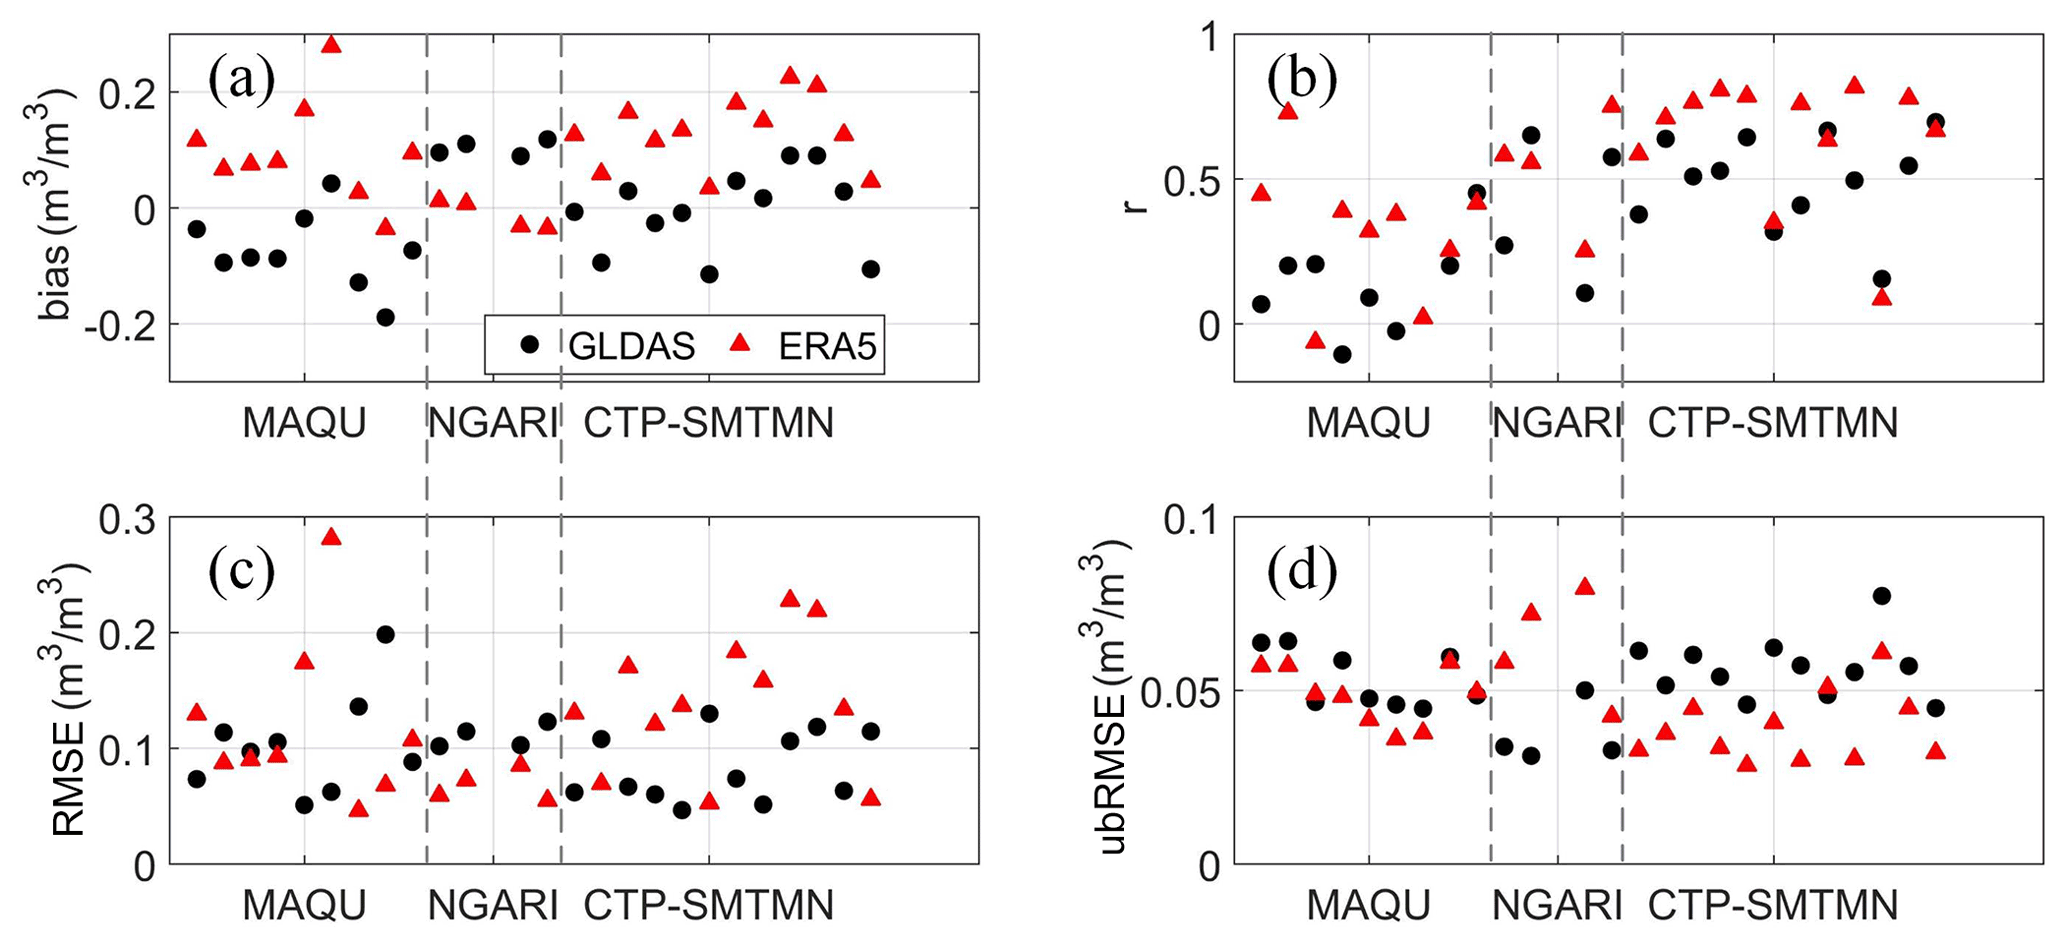
Figure 3The (a) bias, (b) Pearson correlation coefficient (r), (c) root mean square error (RMSE), and (d) unbiased RMSE (ubRMSE) for GLDAS and ERA5 soil moisture in the summer period of May–September over 2008–2014 based on the ISMN station measurements from the MAQU, NGARI, and CTP-SMTMN observation network.
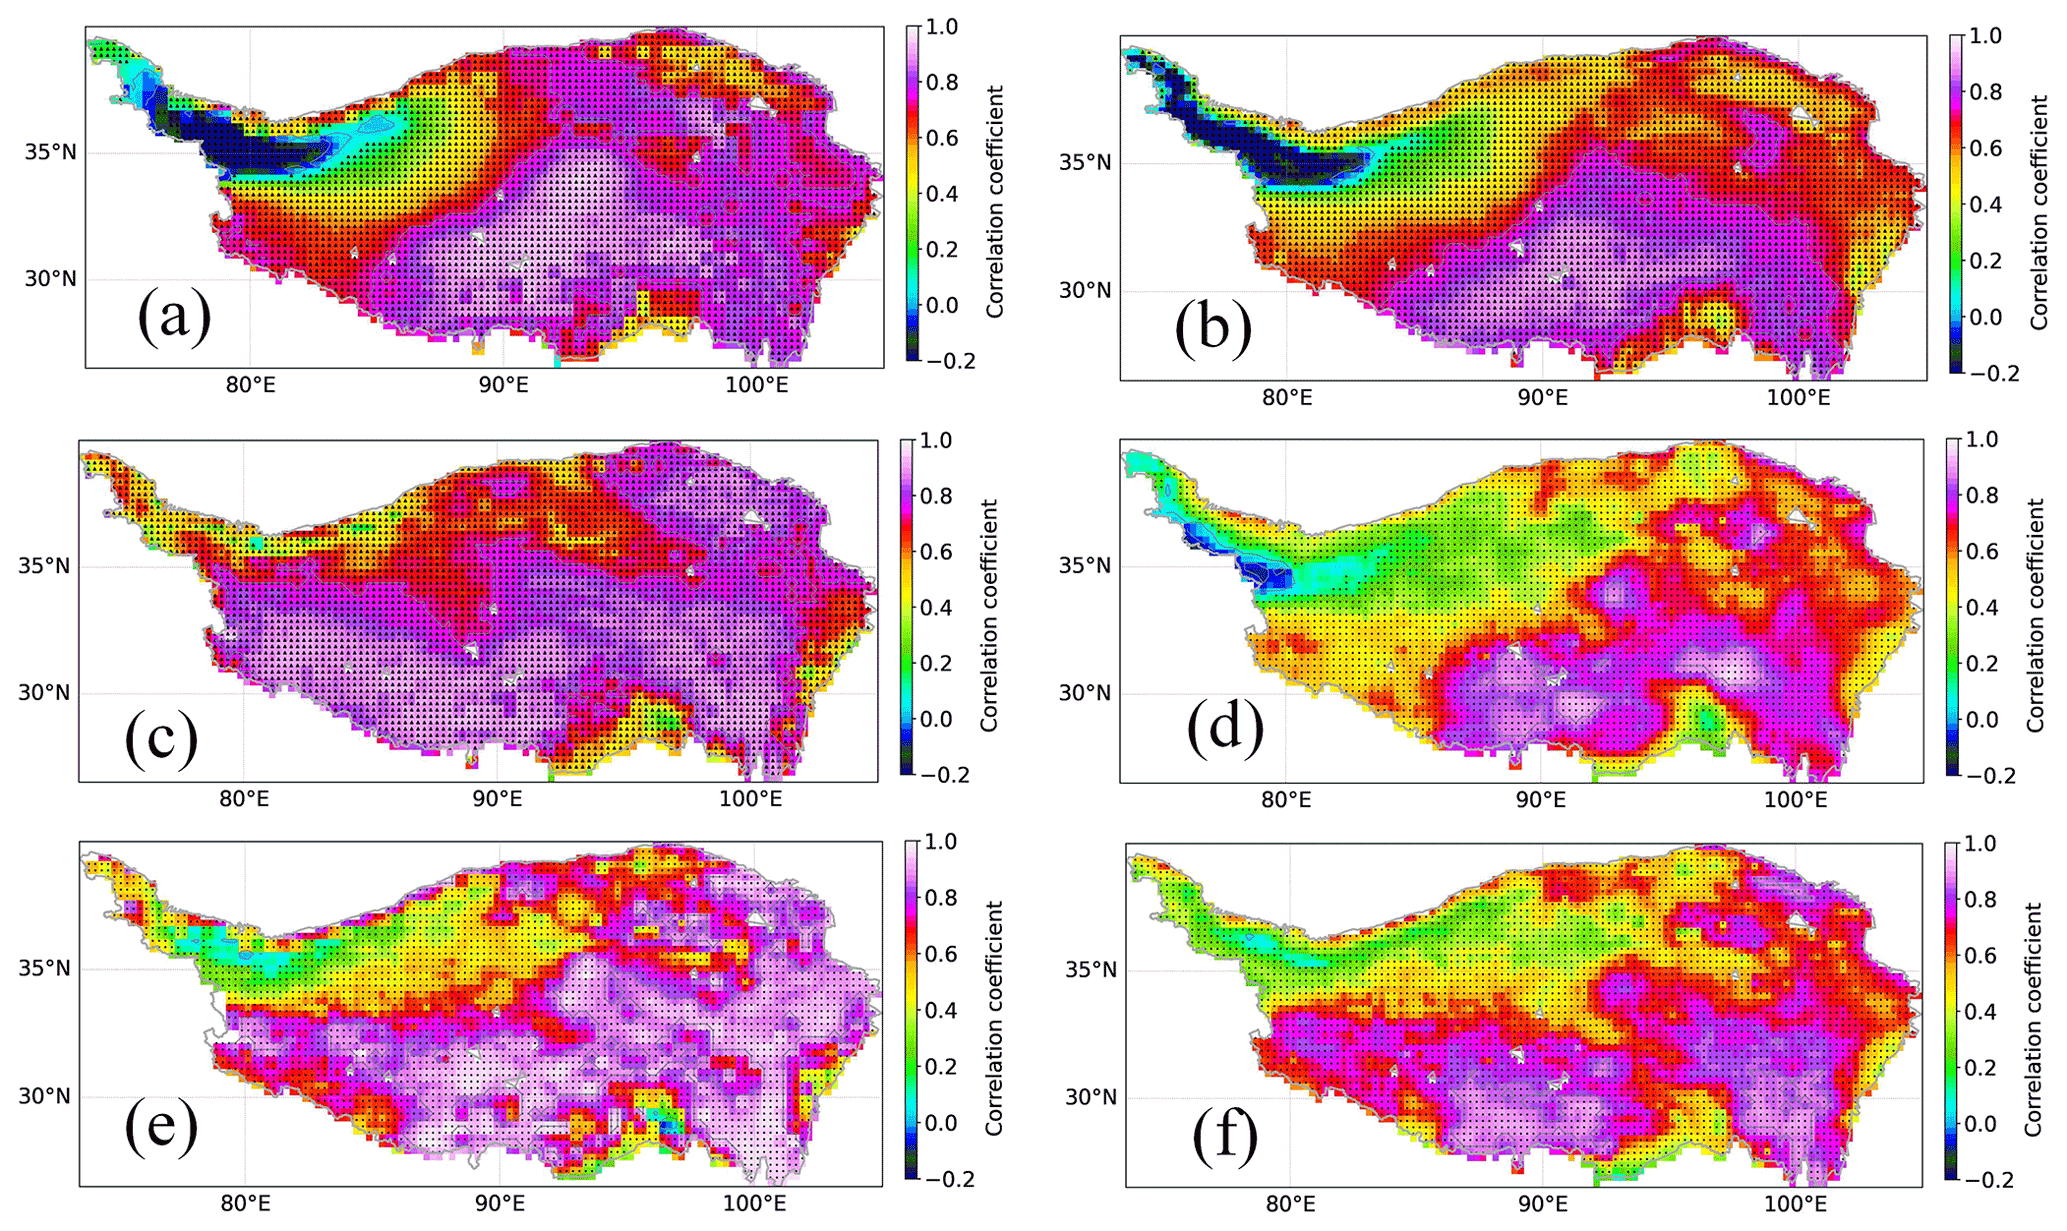
Figure 4Pearson correlation coefficient between the precipitation of (a) CMA and GLDAS, (b) GLDAS and ERA5, (c) CMA and ERA5, (d) GLDAS and CMFD, (e) CMA and CMFD, and (f) ERA5 and CMFD over the summer period of May–September. The black dots denote the significant (p < 0.05) correlations.
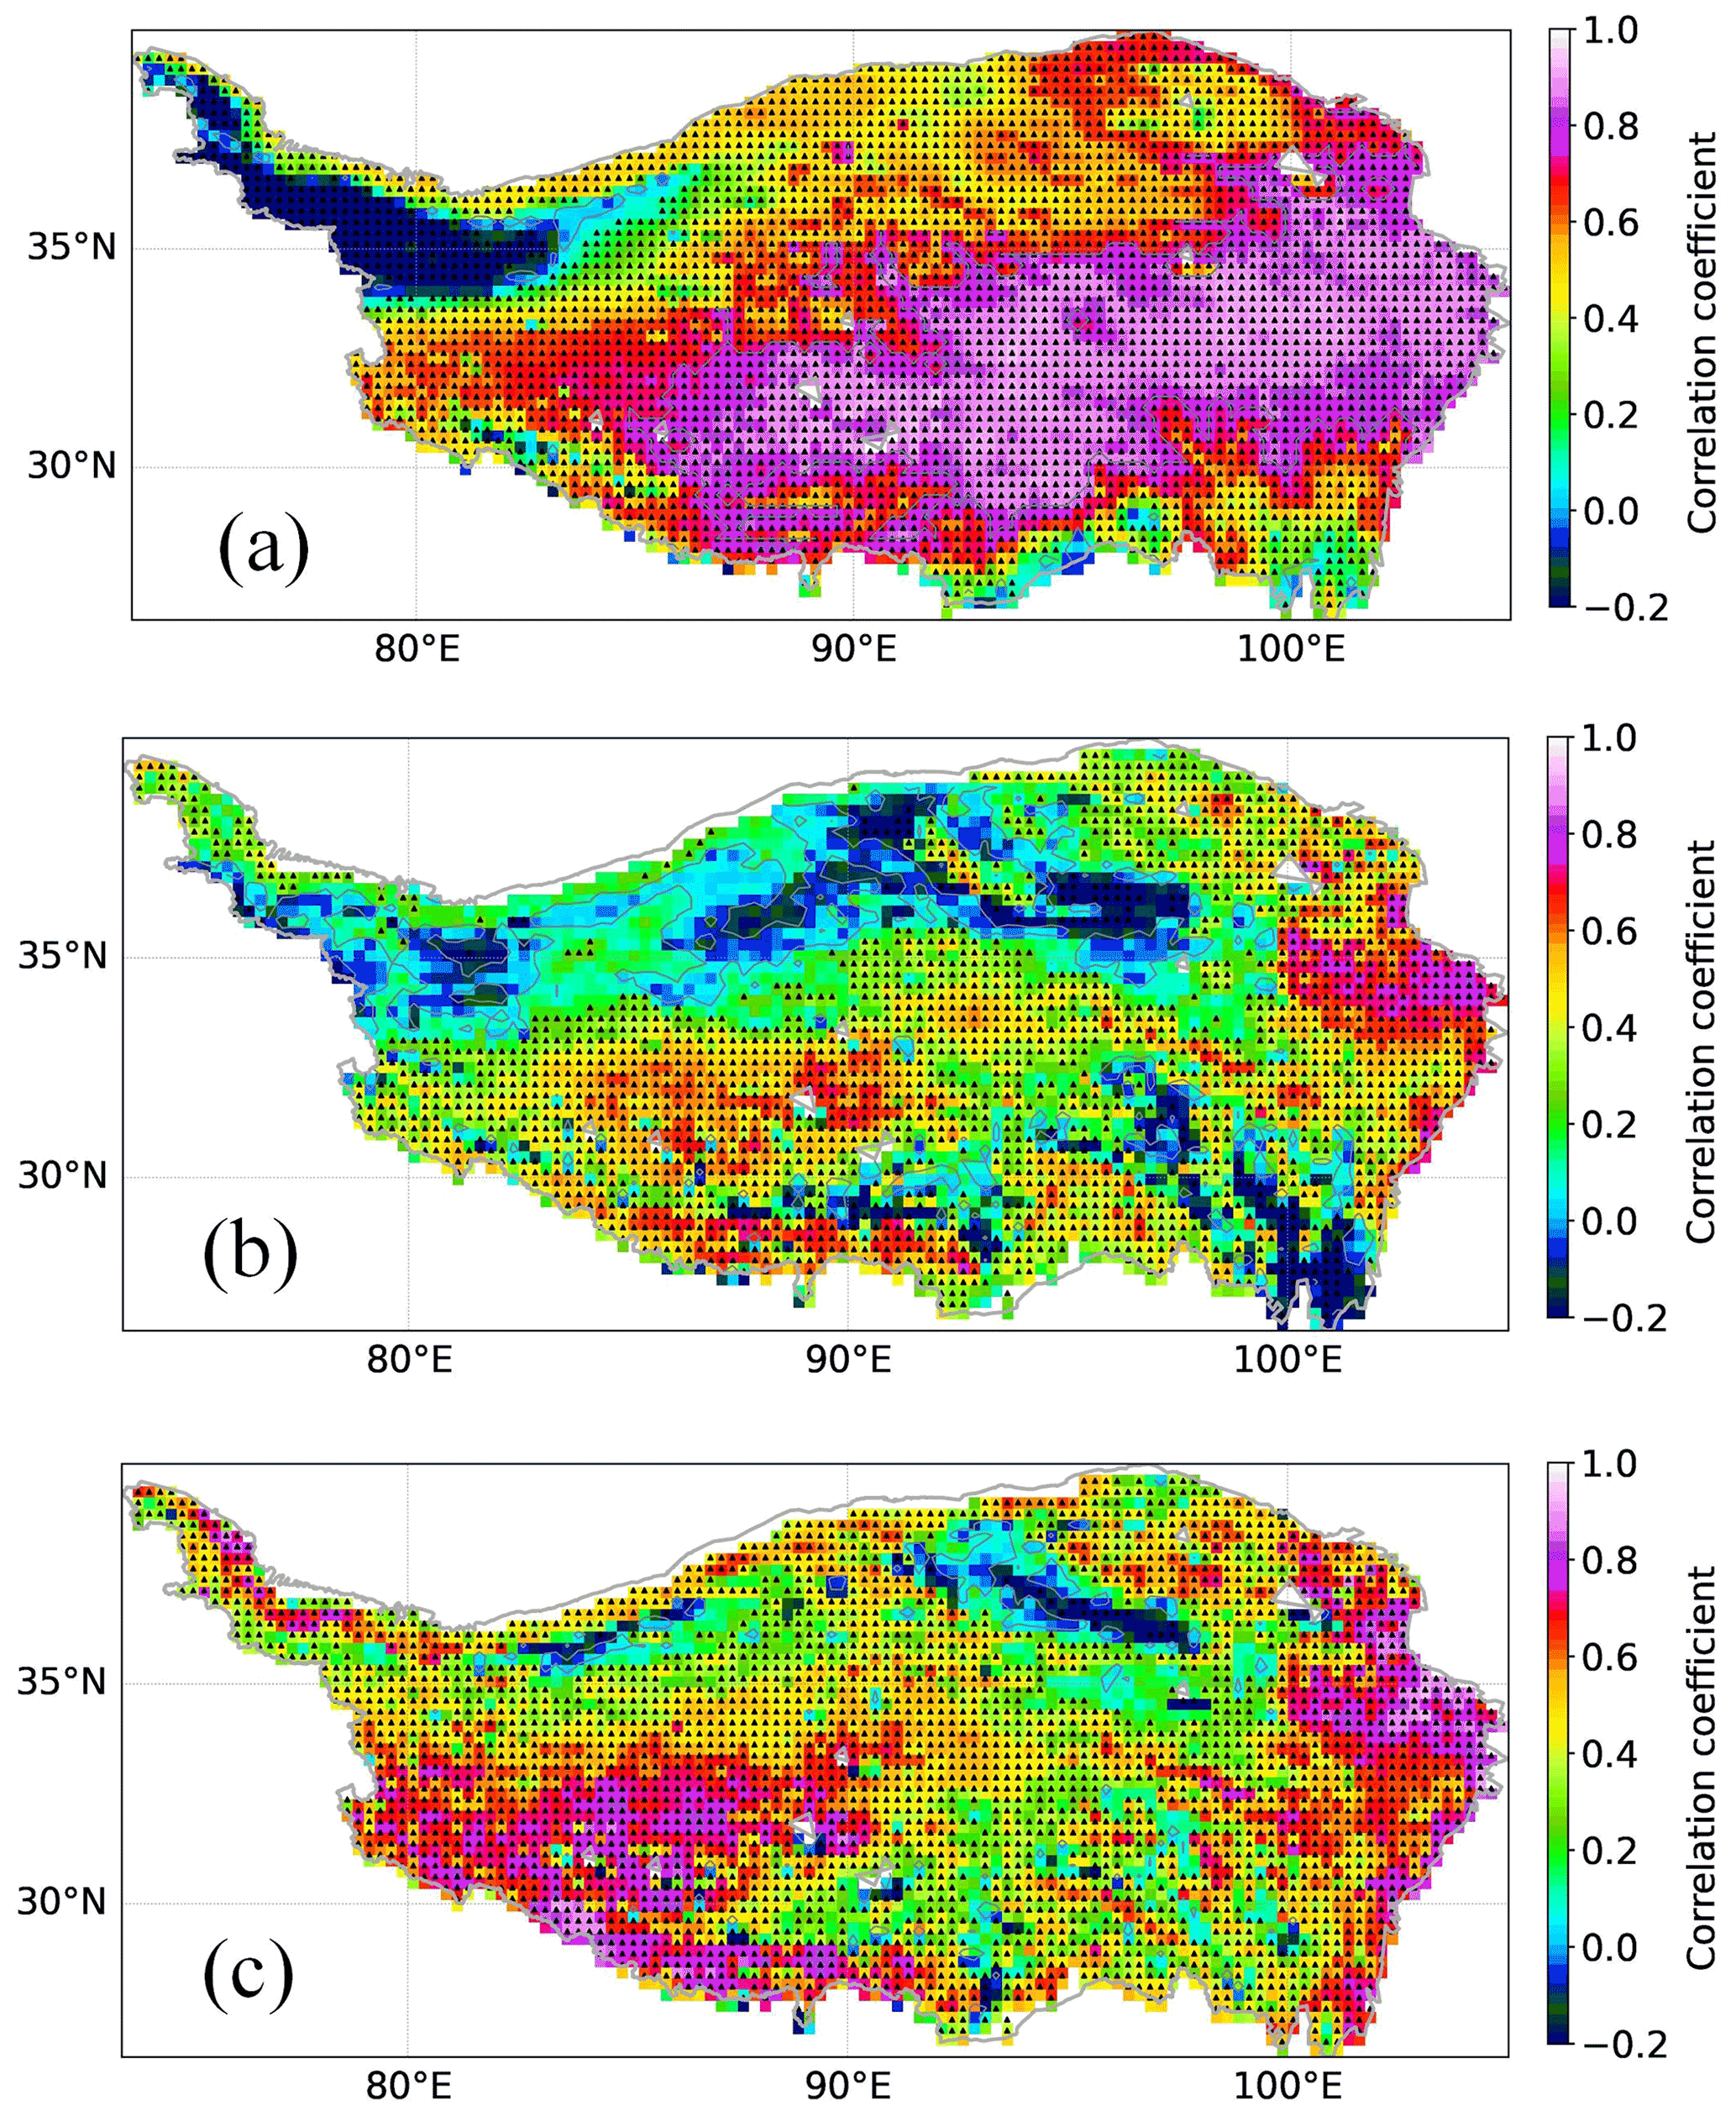
Figure 5Pearson correlation coefficient between the actual evapotranspiration of (a) GLDAS and ERA5, (b) GLDAS and Han ET, and (c) ERA5 and Han ET over the summer period of May–September.
The validity of GLDAS and ERA5 SM was also assessed from the inter-comparisons of Prep and ET considering that SM variations are largely controlled by the rainfall and evapotranspiration process (Su et al., 2018). The inter-comparison focuses on temporal consistency of different datasets based on Pearson's correlation analysis. The results show that both GLDAS and ERA5 Prep present higher temporal consistency with CMA and CMFD Prep in the south and east TP than the north and west TP (Fig. 4). Generally, ERA5 Prep has better temporal consistency with CMA and CMFD Prep than GLDAS, particularly in the southwest TP (Fig. 4 a, c, d, and f). In addition, the GLDAS and ERA5 ET has high temporal consistency in most of the TP. The inconsistency is mainly in the northwest and south fringe of the plateau (Fig. 5a). The ERA5 ET agrees better with Han ET than that of GLDAS, in particular for the southwest regions (Fig. 5b and c). The ET in the northwest, north, and southeast seems to bear larger uncertainty than other regions. The aforementioned performance of Prep and ET for GLDAS and ERA5 indicates the possibility of low credibility in SM modeling in parts of the northwest, north, and southeast TP.
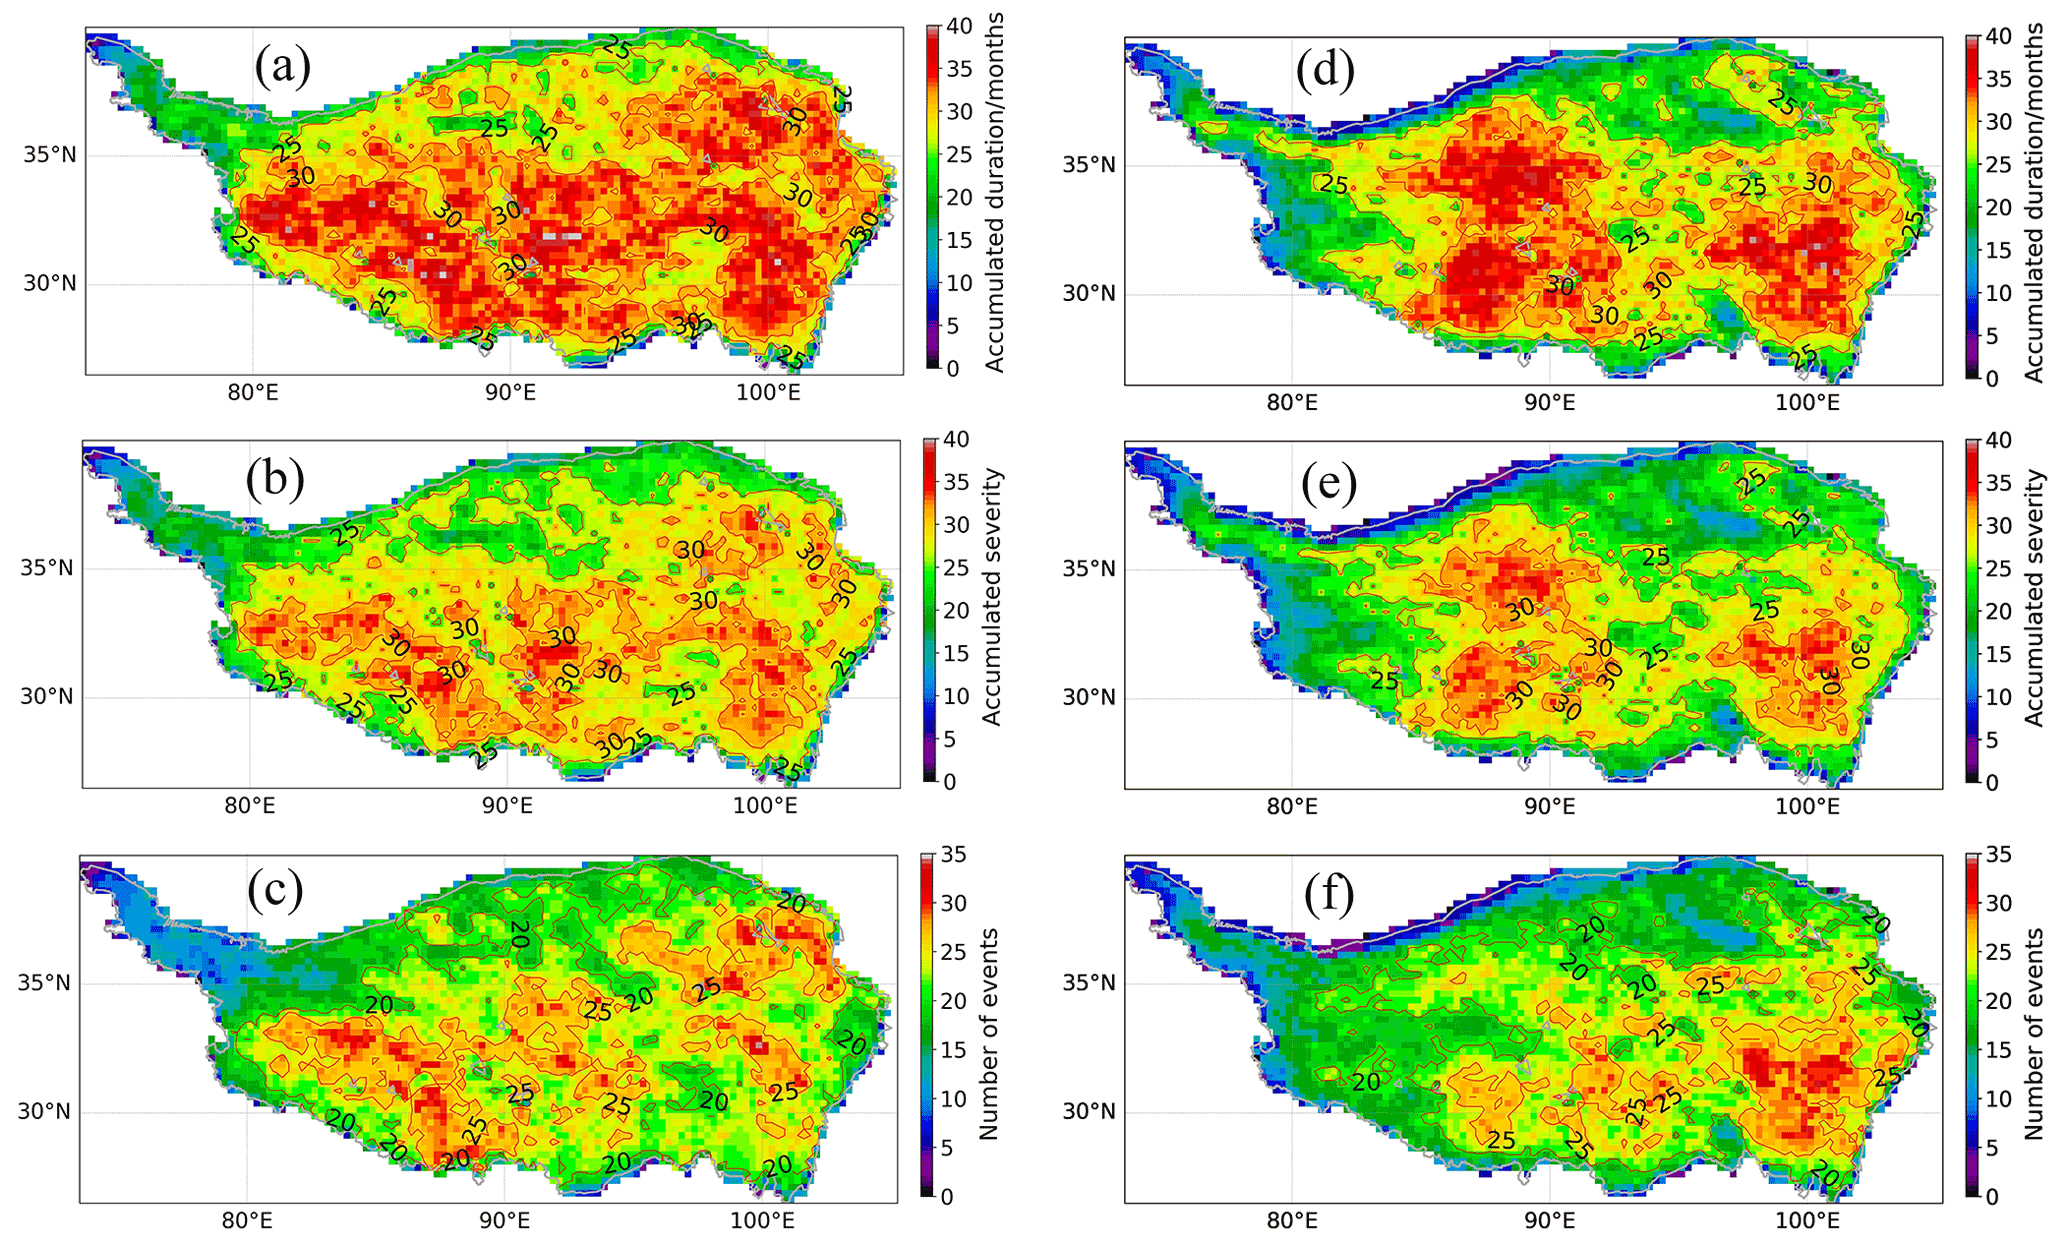
Figure 6Spatial distribution of the accumulated drought duration (a, d), severity (b, e), and number of events (c, f) for the identified soil moisture drought events in summer (May–September) over 1961–2014 in a joint space–time perspective based on GLDAS and ERA5 soil moisture.
4.2 Spatiotemporal patterns of soil moisture droughts
Based on the space–time joint identification approach, 197 and 193 drought events (consisting of 350 and 339 drought clusters, respectively) were identified on the TP based on the GLDAS and ERA5 SM, respectively, which occurred in summer (May–September) from 1961 to 2014. For the identified drought events, drought duration varies from 1 to 5 months, drought area from ∼ 0.4 to ∼ 19 (× 105) km2, and drought severity from ∼ 54 to ∼ 6276. Drought area and severity increased synergistically with the increase of drought duration (Fig. S3 in the Supplement). Spatially, the accumulated drought duration, severity, and frequency (represented by the number of drought events) presented similar spatial patterns both for the GLDAS and ERA5 SM (Fig. 6). Extensive regions, particularly the central and south TP, endured long-lasting (> 30 months), comparatively severe (> 30), and frequent (> 25 events) drought situations. The discrepancy between the GLDAS and ERA5 SM drought is mainly in the west TP (west of 85∘ E). The less severe drought situation of the west TP characterized by ERA5 seems more reliable considering the higher temporal correlation between ERA5 and in situ SM over the arid NGARI and the higher consistency between ERA5 and the inter-compared datasets (CMA, CMFD, and Han ET) in Prep and ET than GLDAS over the southwest TP (Figs. 3b, 4, and 5).
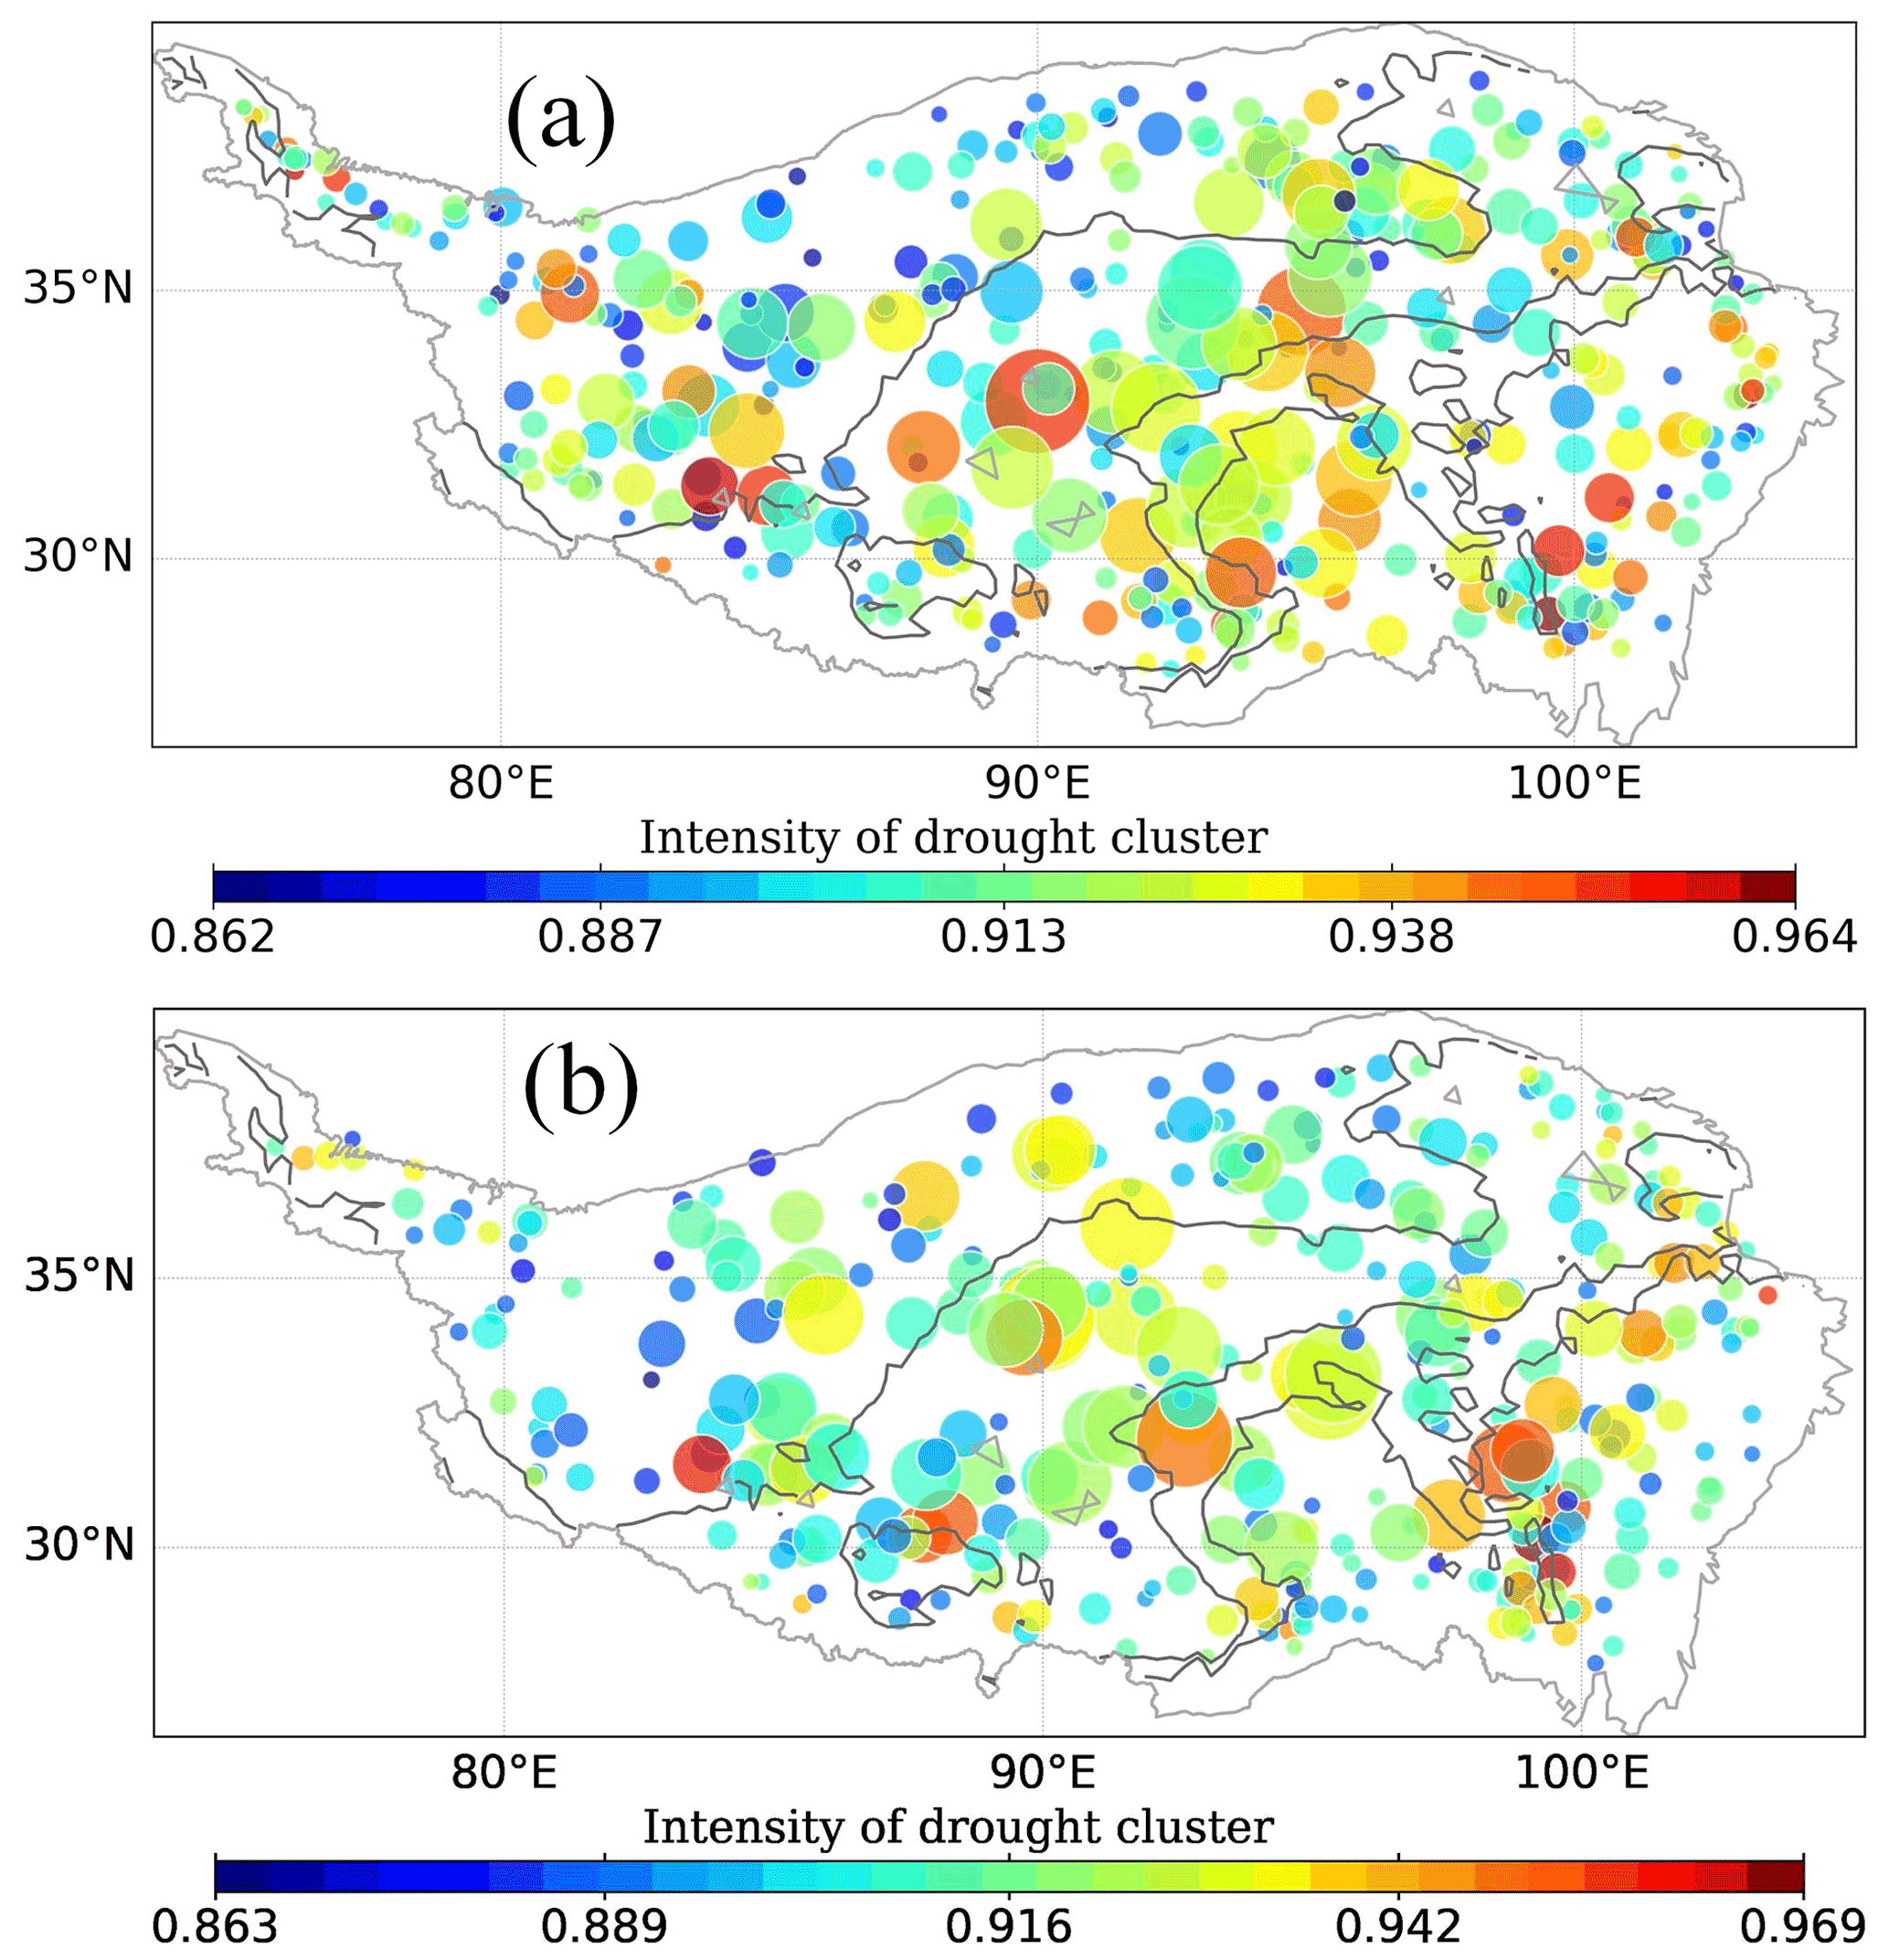
Figure 7Map of the soil moisture drought clusters for (a) GLDAS and (b) ERA5. The circle center and size represent the centroid and area of the drought cluster, respectively. The light gray lines are the dividing lines between different climate zones (the same to Fig. S4).
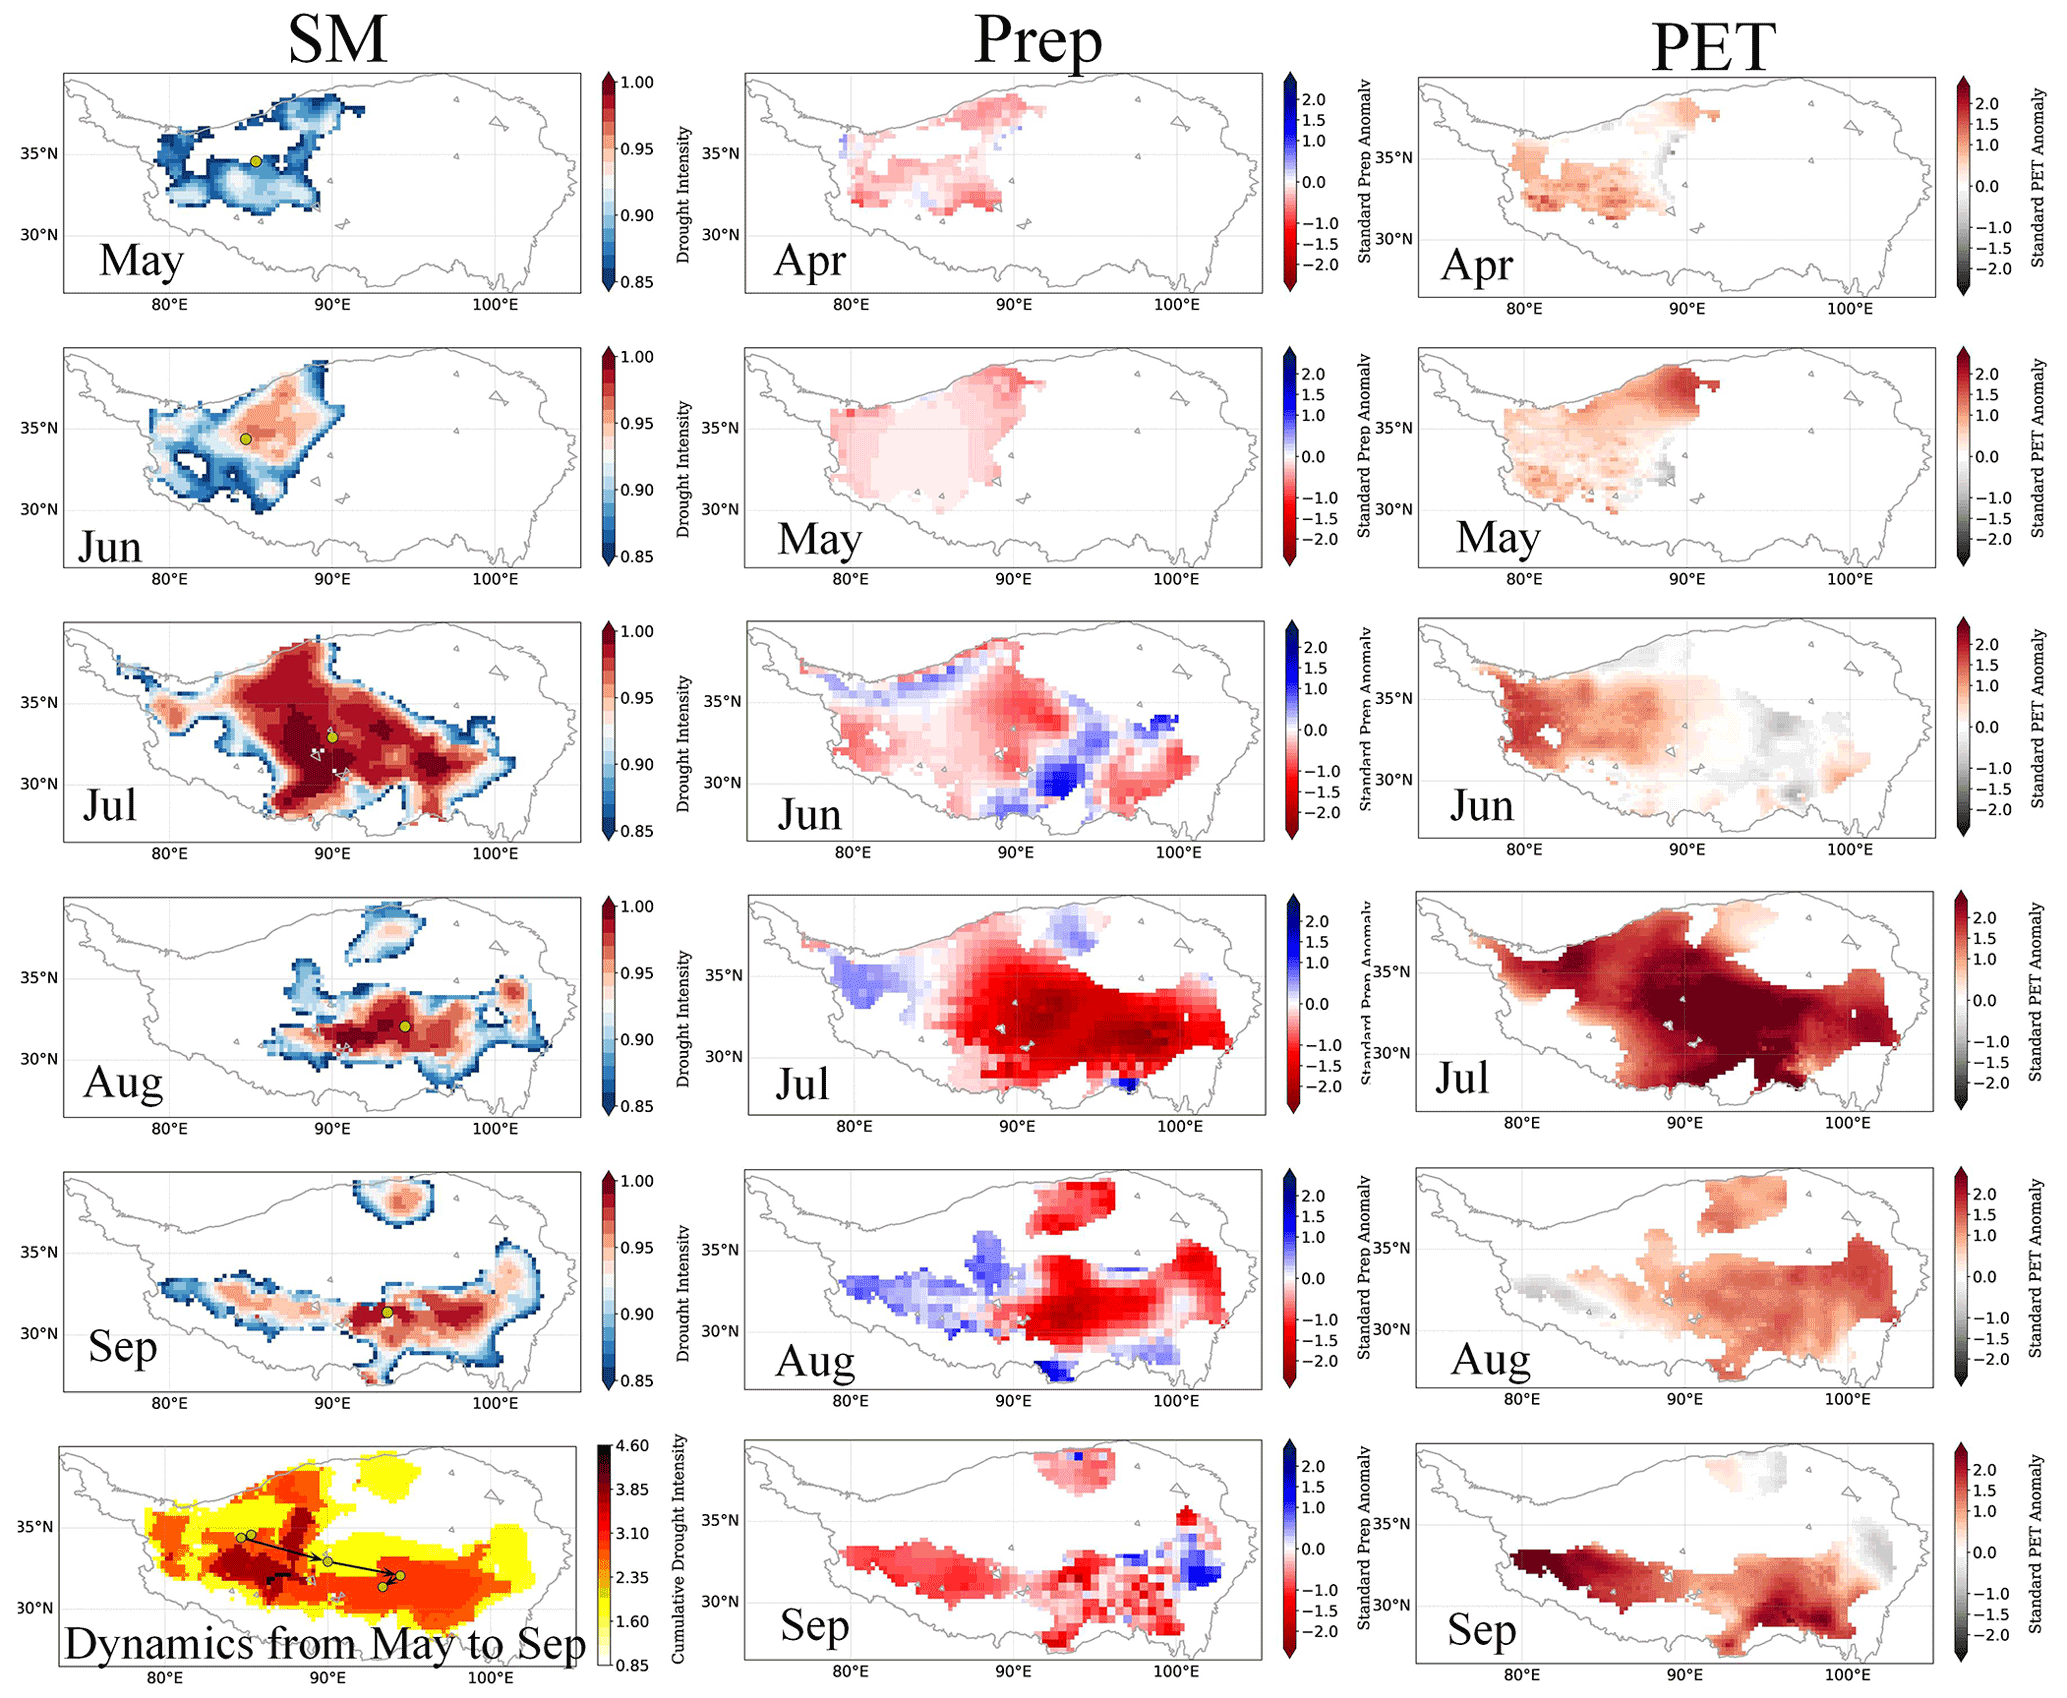
Figure 8Spatiotemporal dynamic patterns of the most severe soil moisture drought event based on GLDAS over 1961–2014 (the left column), the corresponding monthly standard anomaly maps of Prep (the middle column), and PET (the right column) before (1 month) the drought duration over the drought-cluster-affected region. For the subgraph in the left bottom marked by “Dynamics from May to Sep”, the yellow dots are the centroids of the drought clusters. The black arrow lines show the migration or evolution direction and trajectory of the drought clusters.
To obtain specific knowledge of each identified drought, a schematic map of the drought clusters characterizing their location, area, and intensity is given in Fig. 7. Most of the TP experienced SM droughts with varying intensity. Large-scale drought clusters are mainly concentrated in semiarid and subhumid regions, i.e., the wet–dry transition zone (Fig. S4 in the Supplement). The main difference for drought cluster distribution between GLDAS and ERA5 is also in areas west of 85∘ E, which is consistent with that of the drought duration, severity, and frequency (Figs. 6 and 7). Although the space–time joint identification could reshape the development process of drought, all the identified drought events with their spatiotemporal dynamic patterns can hardly be explicitly presented one by one. In this case, the most severe drought event based on GLDAS is displayed as an example (Fig. 8). Moreover, the standard anomaly of two predominant SM controlling factors in hydrological cycle, that is Prep and PET, is also present to illustrate their driving forces on SM drought. The Prep and PET monthly anomaly maps were observed 1 month before the drought occurrence, considering the time-delaying impacts of Prep and PET on SM drought (Van Loon and Van Lanen, 2012). This drought started in May 1994 in the northwest of the TP, with an area of 16 % of the TP. After 1 month growing in place, the drought cluster expanded to the southeast in July, and the drought area increased to 52 % of the TP. Then, the large drought cluster split into two clusters (small in the north and large in the south) in August, which lasted until September, with 35 % of the TP area still under drought before the freezing season. Over the 5-month duration, it swept over 73 % of the TP and became the most serious drought over 1961–2014. The initial SM drought was co-driven by the persistent negative Prep anomaly and strong PET in April. Under an arid climate in the northwestern TP, the ET was limited by SM. The abnormal drying SM will induce an abnormally low ET and a high surface temperature increase by enhancing the sensible heat flux outcoming. This feedback process aggravates the drought situation. Thus, the drought cluster grew in place until June. The southeastward expansion of drought was synergistically promoted by Prep and PET as both had significant anomalies occurring in June and July. Likewise, the drought persistence in August and September was contributed by the negative Prep anomaly combined with the strong PET capacity, particularly for the large part in the south TP.
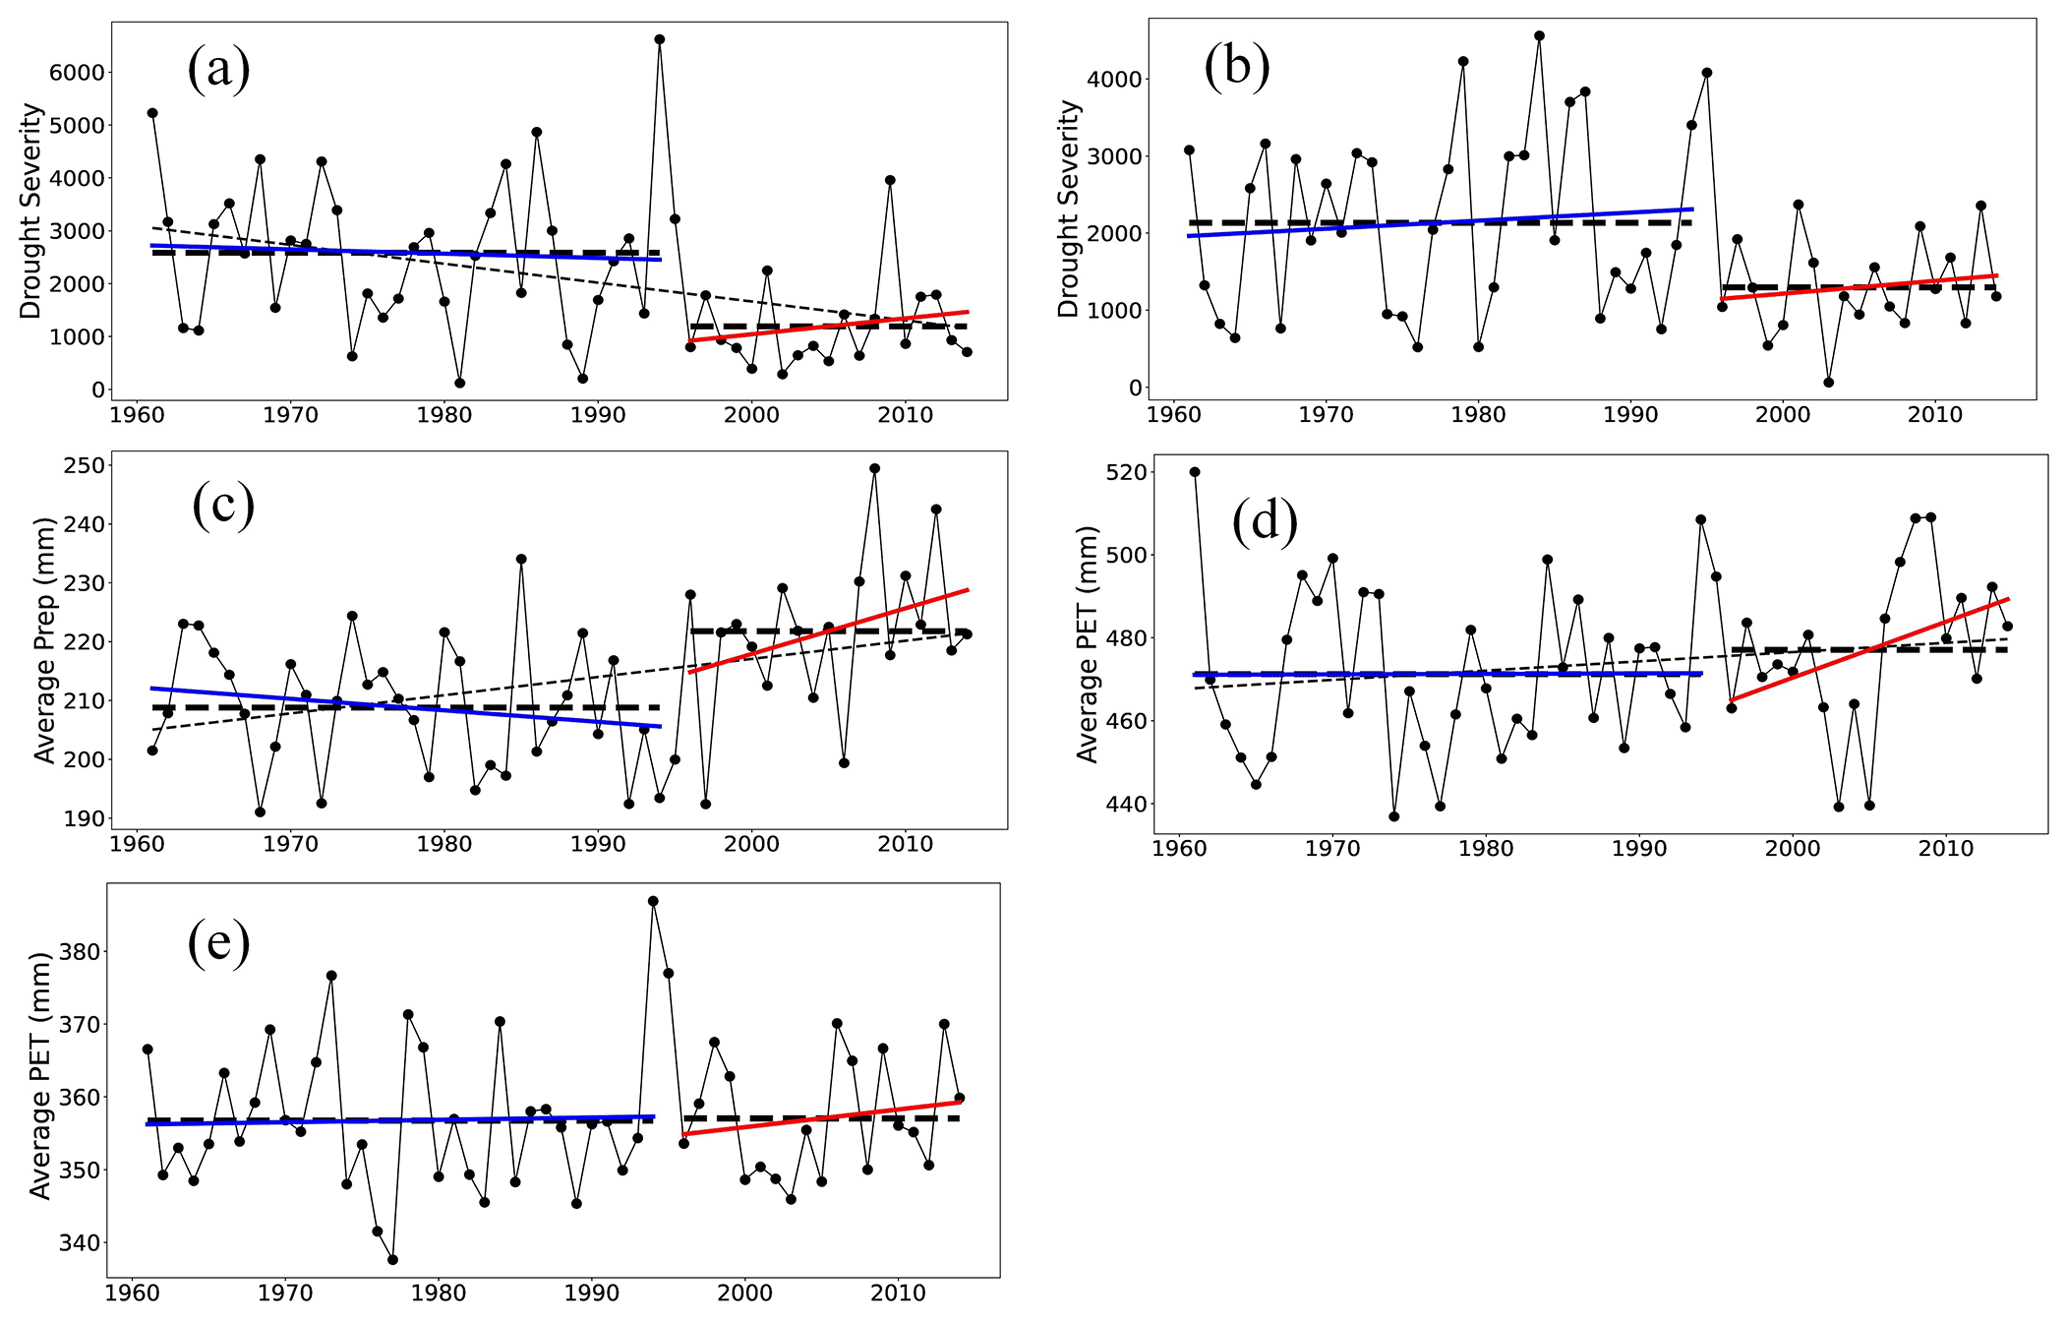
Figure 9Variations of the total annual SM drought severity for (a) GLDAS and (b) ERA5, (c) yearly average precipitation (Prep) of CMA, and potential evapotranspiration (PET) of (d) GLDAS and (e) ERA5 over the summer period (May–September) from 1961 to 2014. The dotted black lines are the average values over periods before and after the middle to late 1990s. The blue and red lines indicate the tendency for periods before and after the middle to late 1990s, respectively.
4.3 Long-term variations in soil moisture droughts
For the entire TP, SM droughts occurred almost every year over 1961–2014 (Fig. S5 in the Supplement). However, annual drought showed a significant shift of alleviation in drought severity based on GLDAS and ERA5 SM (Fig. 9a and b). The abrupt wetting shift is not only reflected in the SM drought state, but also in the average SM state, Prep, and ET (Fig. S6 in the Supplement). The abrupt shift occurred in the middle to late 1990s at the significance level of p < 0.05 based on the Pettitt diagnosis (Pettitt, 1979) (Fig. S7 in the Supplement). Support of the abrupt wetting of the TP can also be drawn from the research of Zhou et al. (2022), Sun et al. (2020), and Ma and Zhang, (2022). Figure 9a and b show that the drought of the TP did not present significant (p < 0.05) tendency before and after the shift. For further insight into the SM drought variations, two predominant controlling factors of SM dynamics, that is Prep and PET, were incorporated. Prep showed an abrupt, substantial increase after the middle to late 1990s, but the change in PET was nonsignificant (Fig. 9c–e). It indicates that Prep likely dominated the wetting shift of SM. This is also supported by the significant and relatively higher temporal consistency between the annual SM drought severity and Prep (with the partial correlation coefficient pr = −0.6 and −0.49) than PET (pr = 0.48 and 0.42) for GLDAS and ERA5. Nevertheless, the slightly enhancing SM drought after the middle to late 1990s should be mainly contributed by the increasing PET as the rising Prep would adversely alleviate the drying tendency. The partial correlation statistics also illustrate that the SM drought trend after the middle to late 1990s is mainly impacted by PET because the pr between SM drought and PET is 0.59 and 0.48, and the pr between SM drought and Prep is −0.37 and −0.36 for GLDAS and ERA5, respectively.
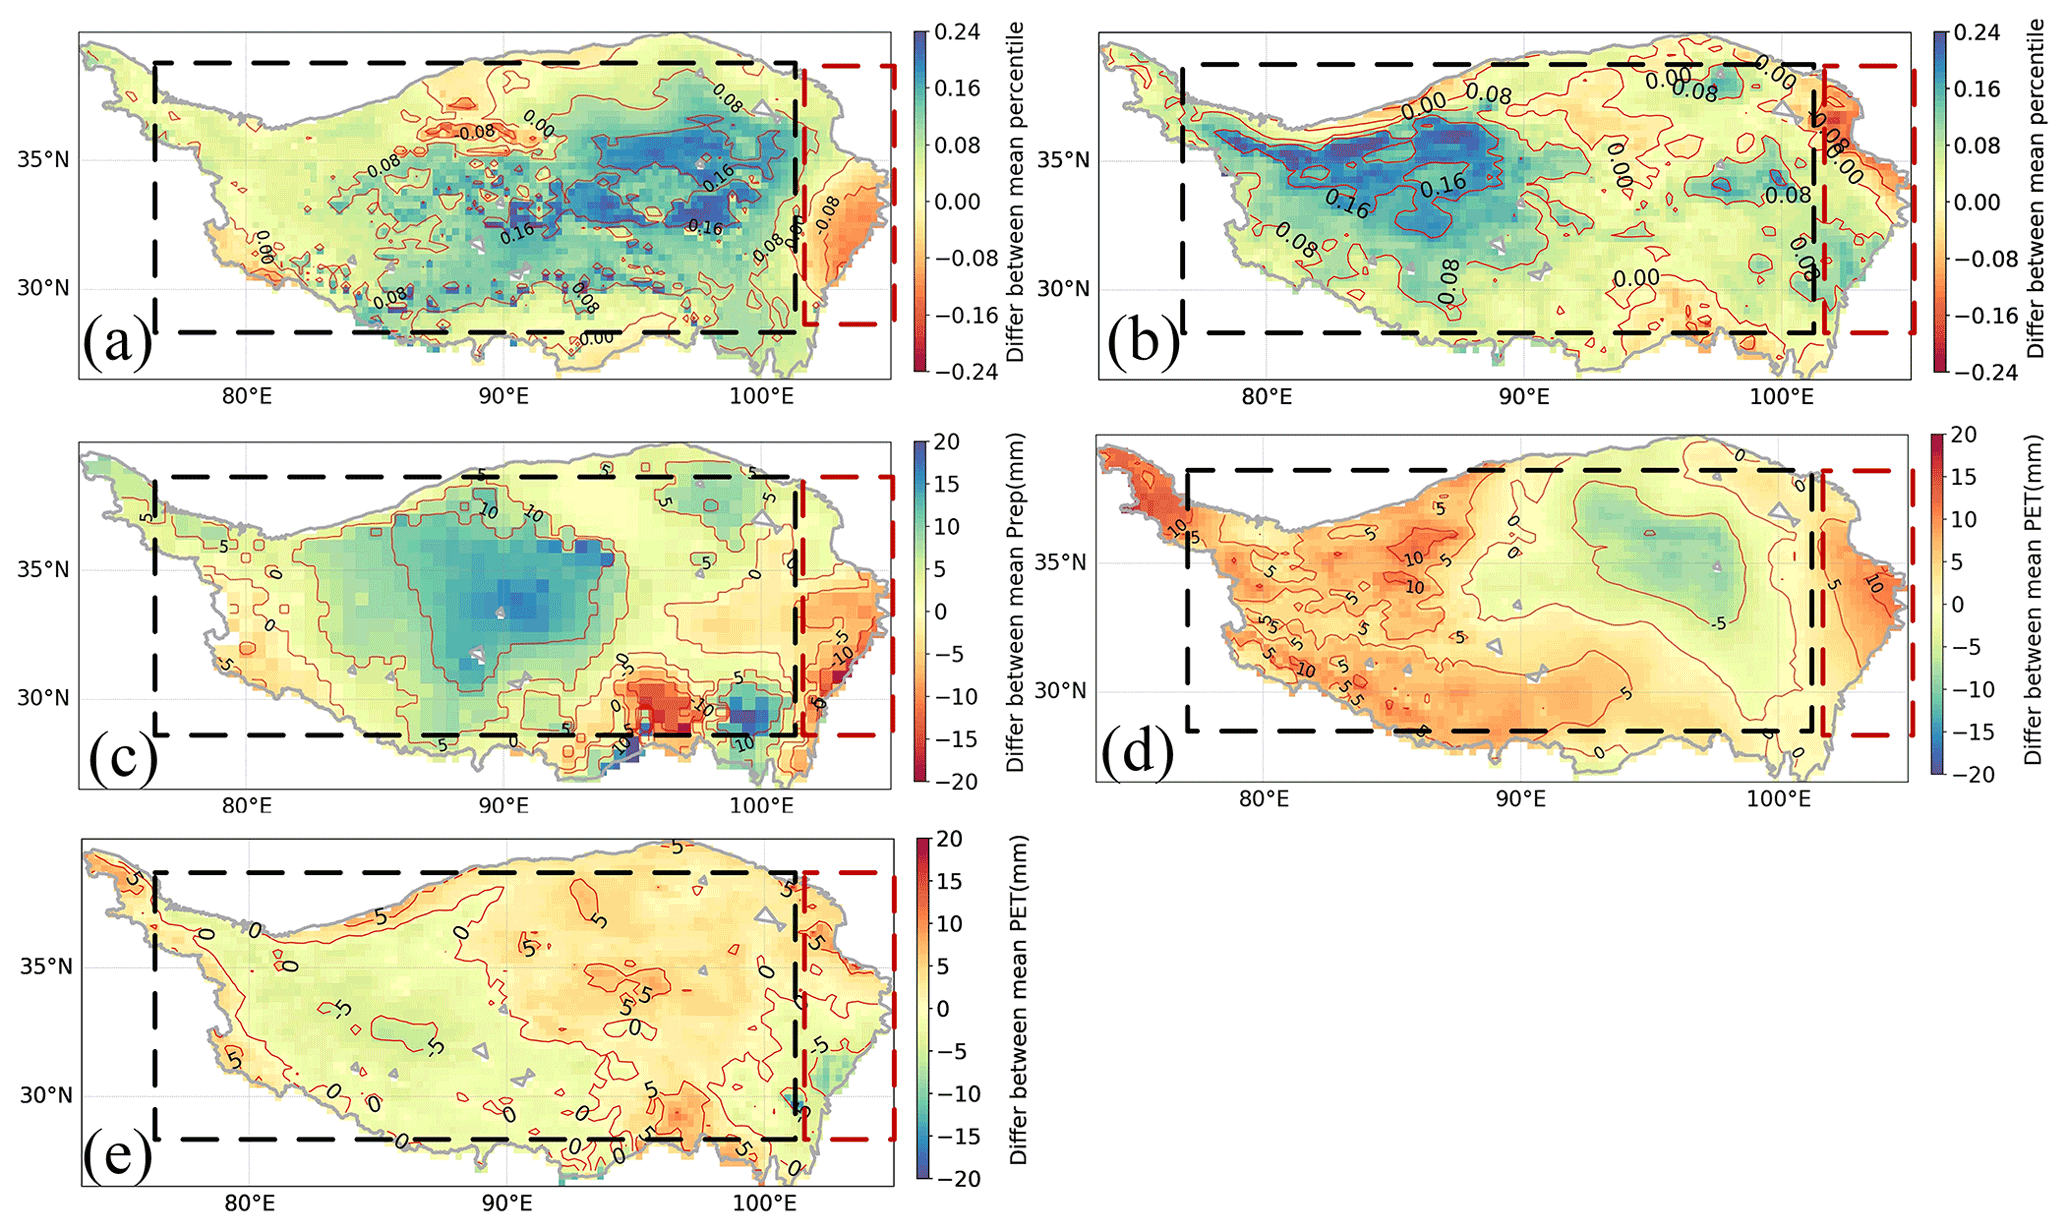
Figure 10Difference (Differ) of the average state of the SM drought for (a) GLDAS and (b) ERA5, mean Prep (c), and mean PET for (d) GLDAS and (e) ERA5 between the periods after and before the middle to late 1990s.
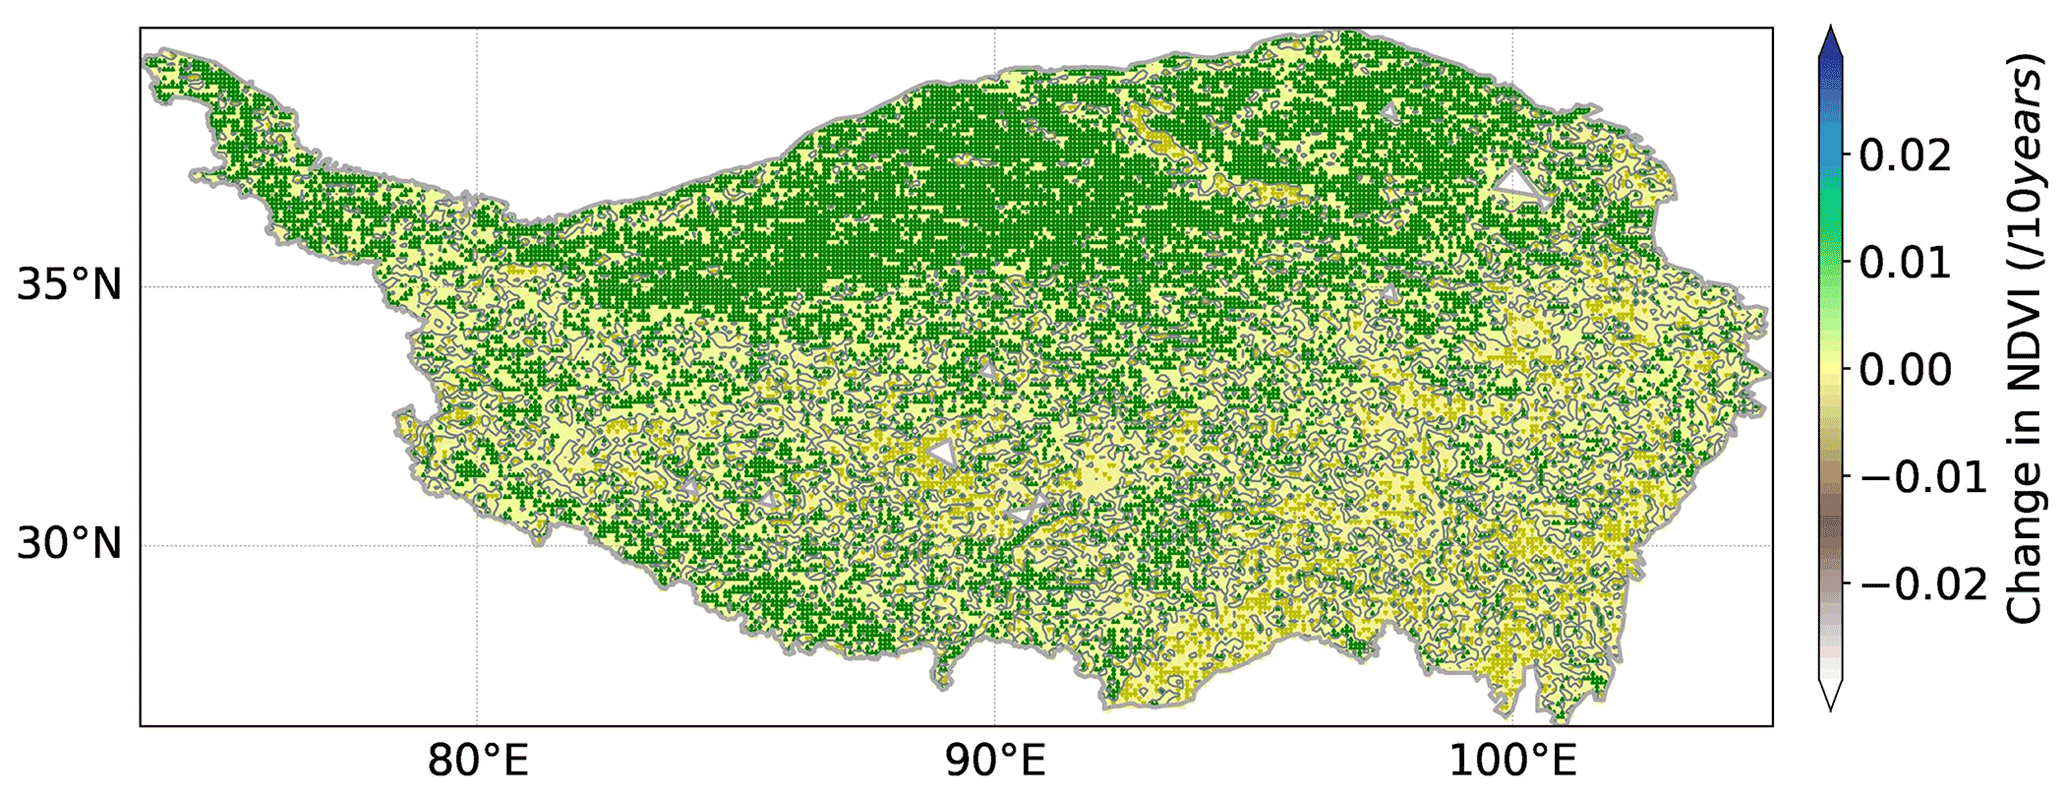
Figure 11Variations of NDVI over the summer period of May–September from 1982 to 2015 for the Tibetan Plateau. The green/brown △/▿ denotes the significant (p < 0.05) increasing/decreasing trends.
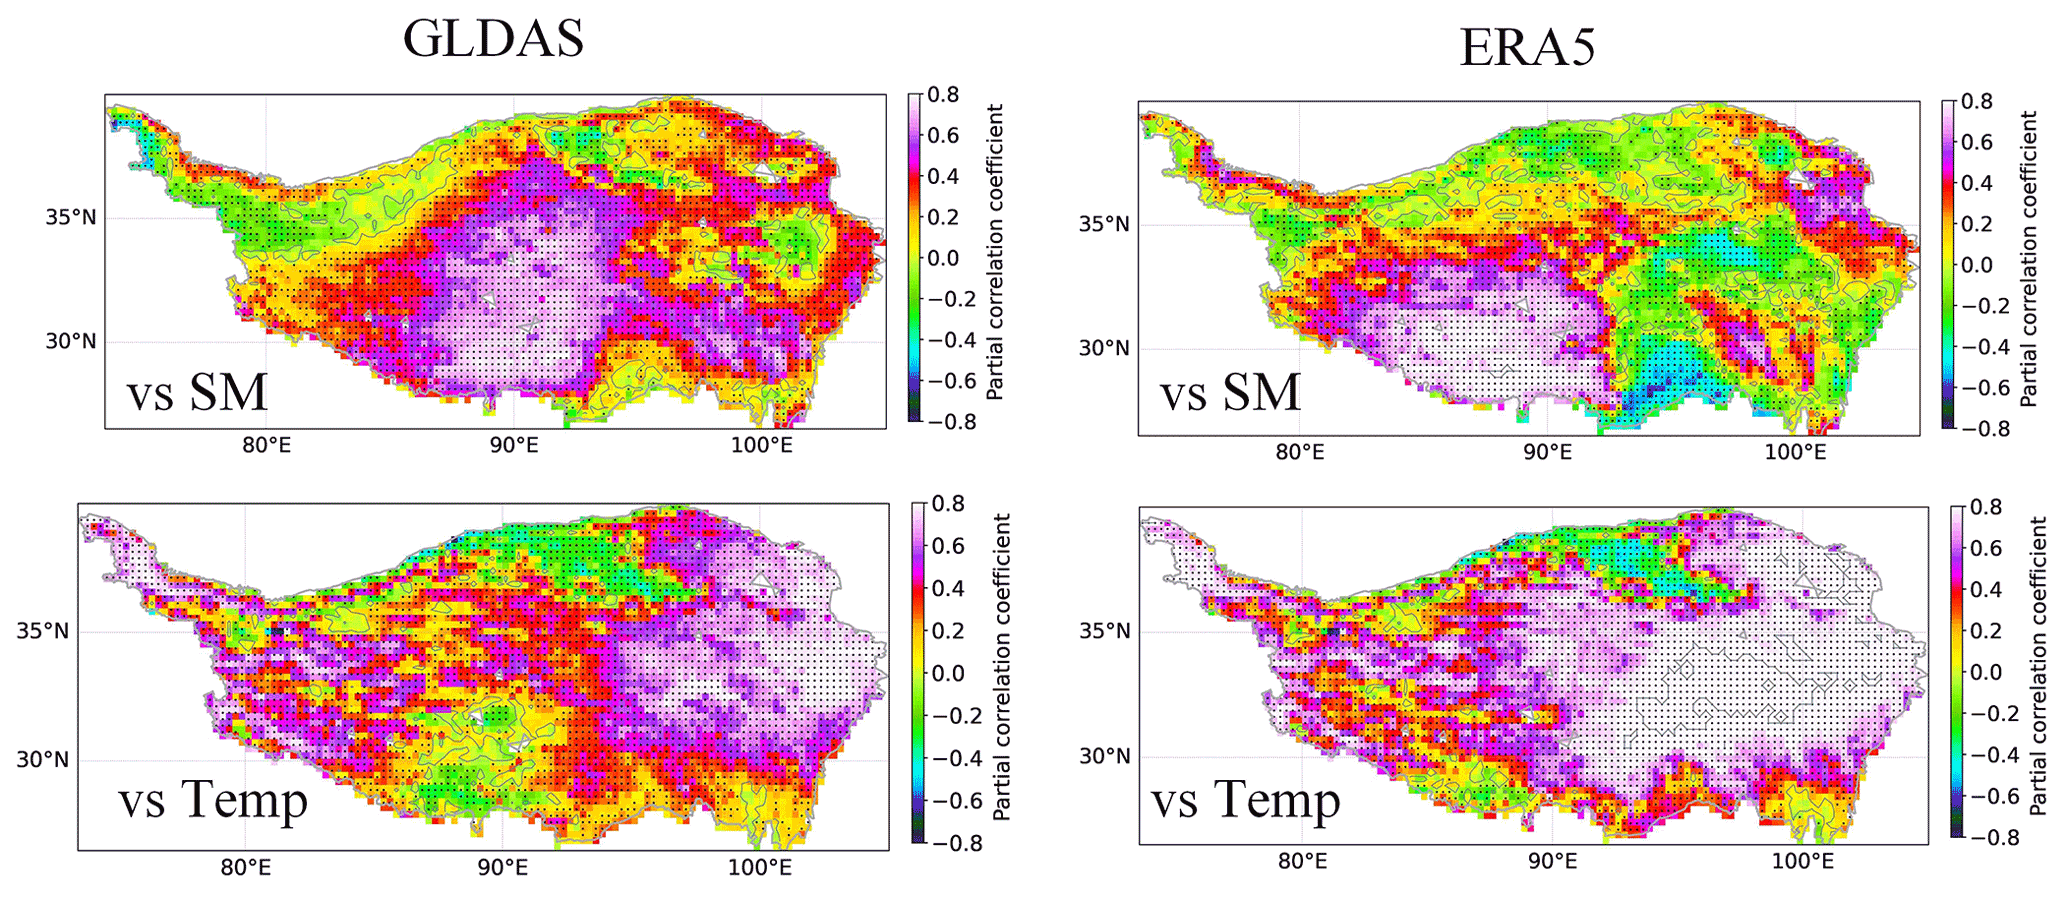
Figure 12Spatial distribution of the partial correlations between the NDVI and soil moisture (SM) or surface air temperature (Temp) over the summer period of May–September from 1982 to 2015 for GLDAS and ERA5, respectively. The black dots denote the significant correlations.
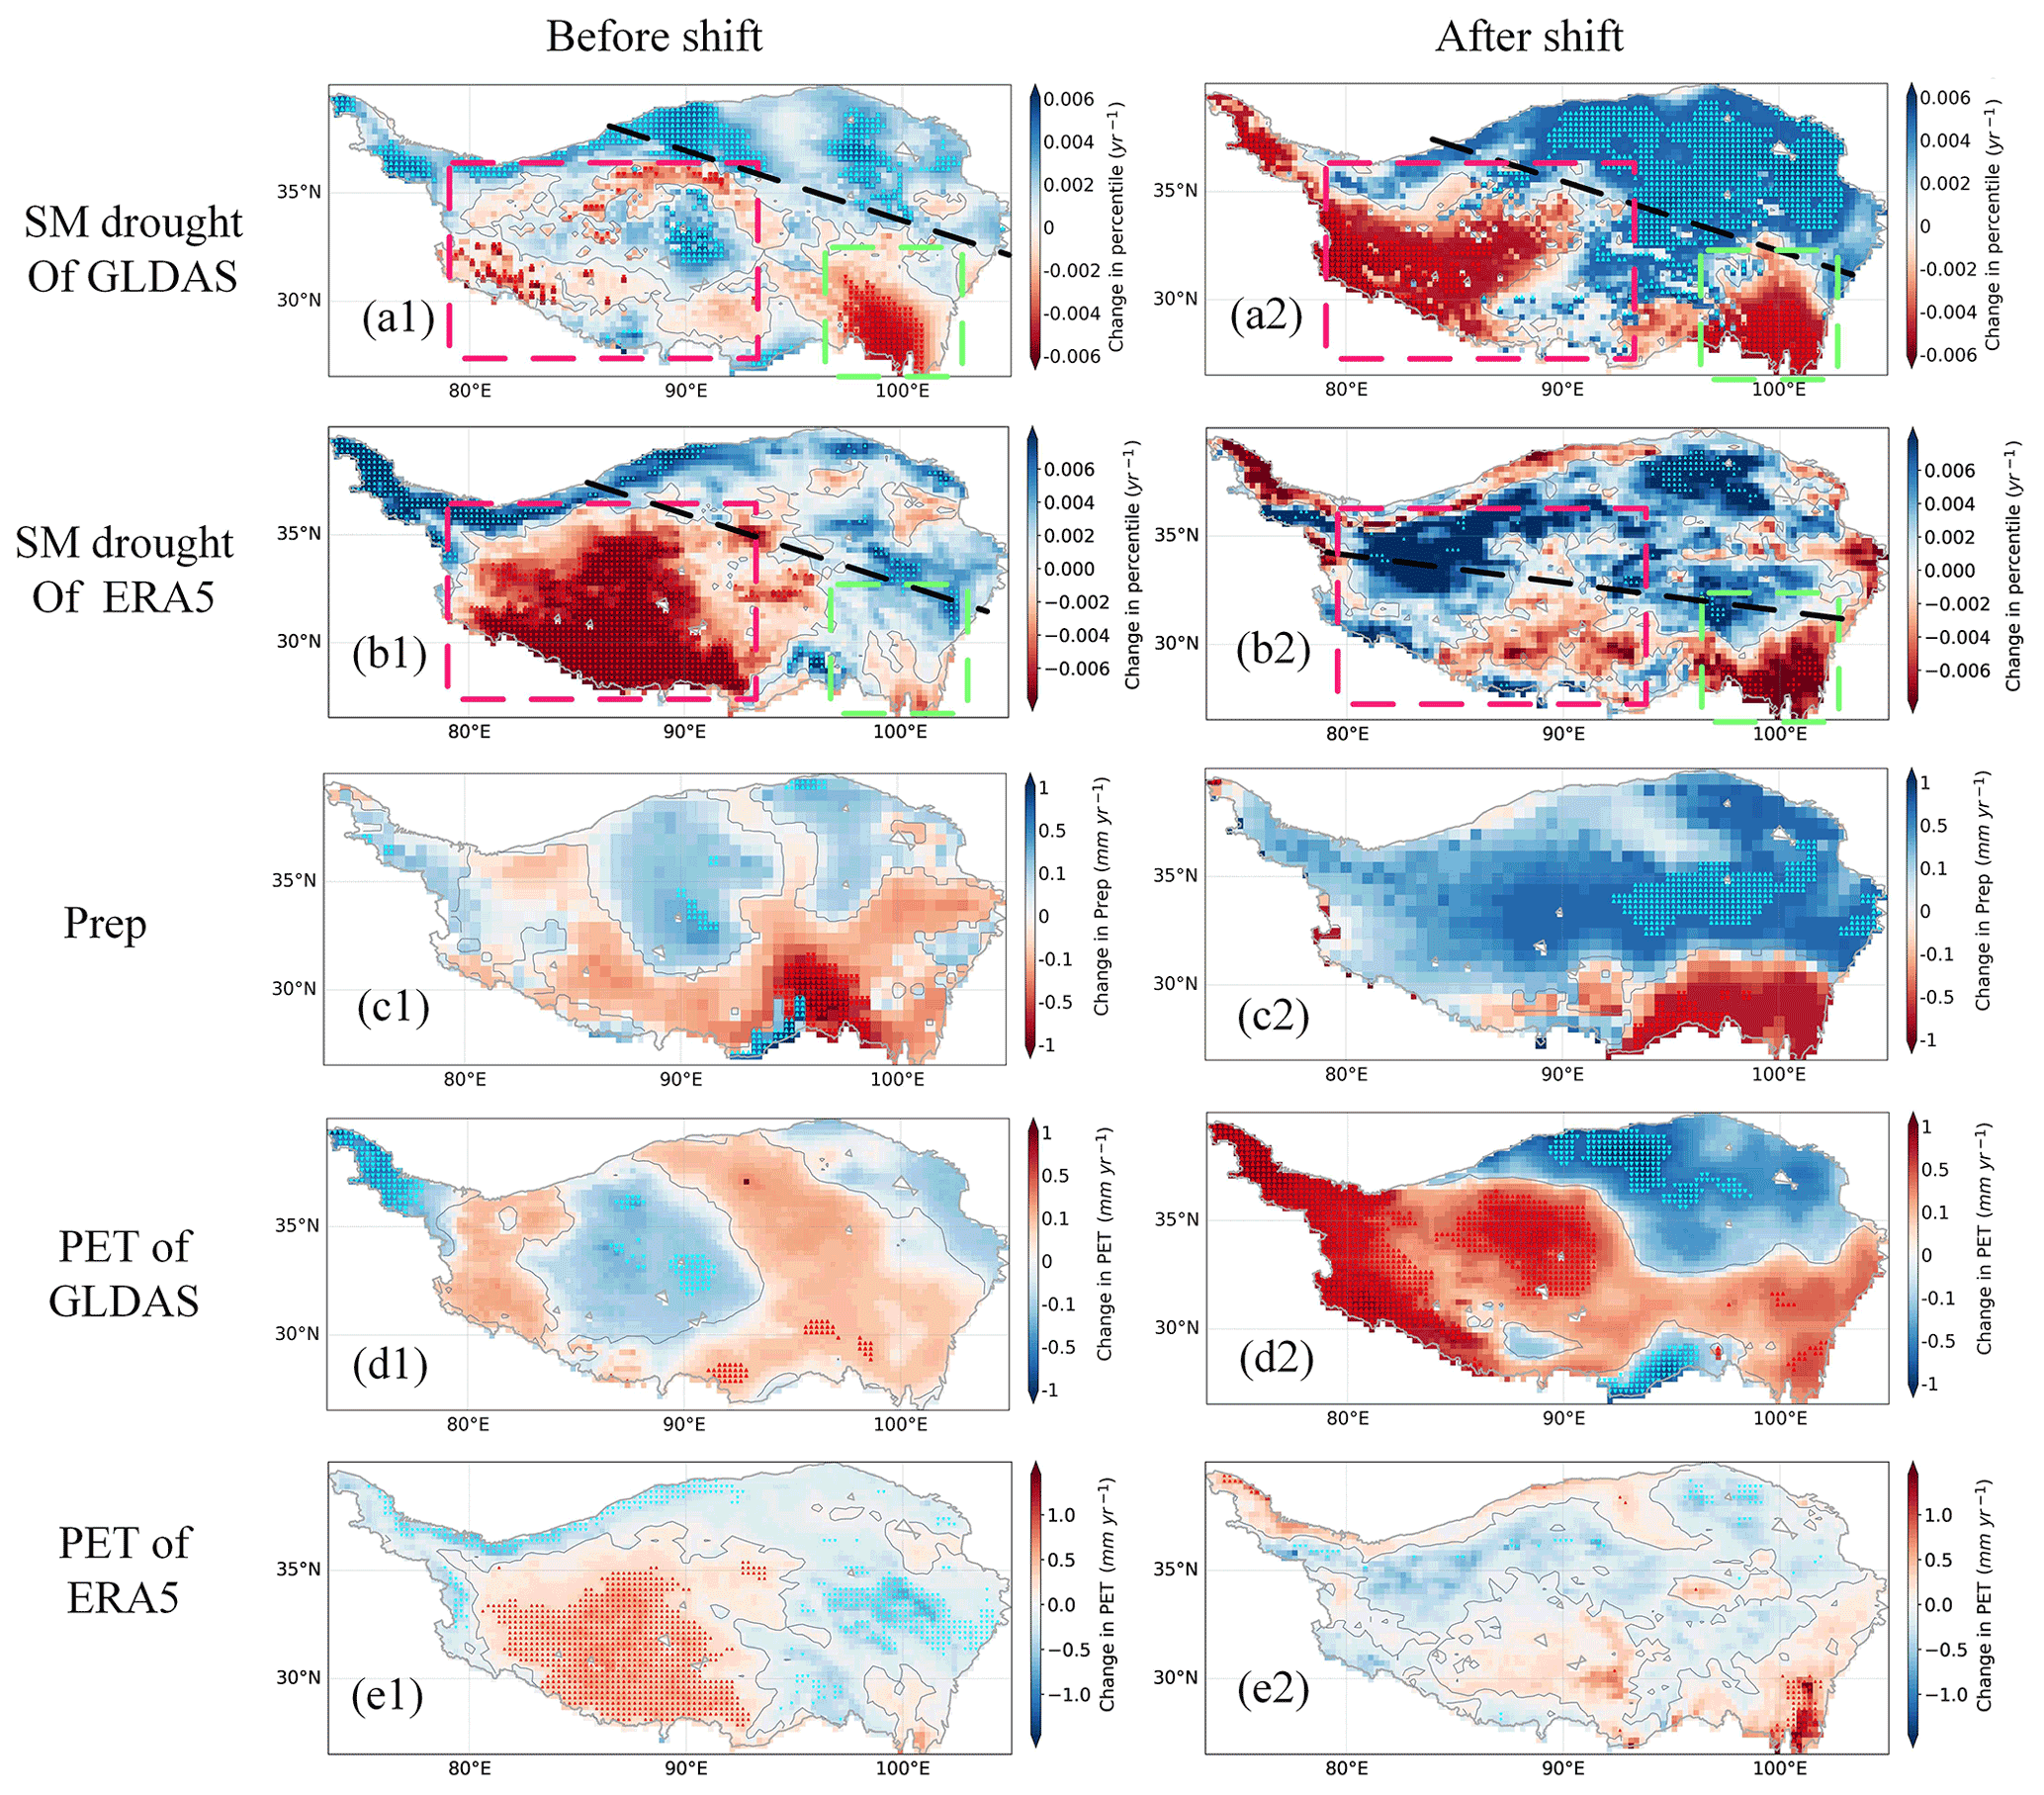
Figure 13Spatial distribution of the trends in soil moisture (SM) percentile, precipitation (Prep), and potential evapotranspiration (PET) before and after the wetting shift. Note that the △/▿ with cyan/red denotes the significant (p < 0.05) increasing/decreasing trends.
To have specific knowledge of the wetting shift of SM drought in space, the difference between the mean SM percentile after and before the middle to late 1990s is considered, together with Prep and PET (Fig. 10). The drought decrease (indicated by the increased SM percentile) occurs in most (∼ 87 % for GLDAS and ∼ 83 % for ERA5) of the TP, and the increase is in small parts of the edge region (Fig. 10a and b). The major wetting shift toward drought alleviation is mainly distributed in the central TP for GLDAS (east of the black rectangle in Fig. 10a), particularly for the semiarid and subhumid regions (Fig. S8a in the Supplement). Nevertheless, the major wetting shift is largely in the interior TP for ERA5 (west of the black rectangle in Fig. 10b), particularly for the arid and semiarid regions (Fig. S8b). The robust enhancement of SM drought is prevalent in a small part of the southeast TP for GLDAS (south of red rectangle in Fig. 10a) and the northeast TP for ERA5 (north of red rectangle in Fig. 10a) with a humid climate (Fig. S8). Moreover, the wetting shift in the central TP indicated by GLDAS is partly supported by the greening of this region (Fig. 11). However, the magnitude of wetting need to be further discussed because the greening of vegetation in the central TP is not prominent, and the greening is jointly impacted by soil moisture and temperature, with temperature dominating in the east TP (Fig. 12). The wetting shift in the interior TP indicated by ERA5 is supported by the rapidly expanded lakes in the interior TP after the middle to late 1990s, and the greening in the west TP is largely controlled by SM (Figs. 11 and 12) (Zhou et al., 2022; Yang et al., 2014). Additionally, the drought enhancement of SM for the southeast TP in GLDAS is supported by the browning of vegetation under a warming climate (Fig. 11). The abrupt drying of SM for the northeast TP in ERA5 needs further research considering the wetting and the increasing Temp as well as the leading role of Temp in vegetation variation over this region (Fig. 12).
The wetting of SM for major TP should be dominated by Prep, in particular for the interior and central-west TP (Fig. 10c). The different magnitudes of wetting shift in space, particular in the interior and central-east TP indicated by GLDAS and ERA5, are still impacted by PET (Fig. 10d and e). Specifically, the decreased PET in the central-east promoted the significant wetting shift in GLDAS, while the decreased PET in the west TP contributed the significant wetting shift of the interior TP in ERA5. However, the substantial difference of GLDAS and ERA5 in the spatial pattern of PET discrepancy indicates large uncertainty in PET estimation. For the central and west TP with an arid, semiarid, and subhumid climate, SM strongly constrains evapotranspiration variability. The large-scale significant wetting shift of SM tends to accelerate the wetting and slow down the warming up of the plateau by increasing the ET and decreasing the surface air temperature. The wetting shift may also produce impacts on the atmospheric circulation over the TP via land–atmosphere coupling. In addition, the robust enhancement of SM drought in the southeast TP is likely promoted in collaboration of the significant decline of Prep with the substantial increase of PET (red rectangle in Fig. 10c and d). The synergistically abrupt change for Prep and PET toward dryness may pose risks to the transition of the long-term climate state of this region.
After the abrupt wetting shift in the middle to late 1990s, the correlation between SM drought and Prep anomaly decreased, while that with PET increased for most of the TP, in particular for the west of the plateau (Fig. S9 in the Supplement). This suggests that after the shift in SM, the Prep (i.e., water) controlling capacity for variations in SM drought was weakened, while the PET (i.e., energy) control was intensified. This phenomenon may indicate a climate regime changing tendency of wetting over the TP. Due to the wetting shift and the associated water and energy control adjustment, the trend characteristic of SM drought was analyzed separately before and after the shift. Generally, SM drought is increasing (with decreasing SM percentile) in the southwest half of the plateau and decreasing in the northeast half in both stages based on GLDAS and ERA5 (Fig. 13a1–b2). This feature is supported by the trend pattern of both Prep and PET, in particular of PET over the later stage (Fig. 13c1–e2). Moreover, the later stage presents more evident wetting trends with a larger magnitude of SM variations and an expanded area, with significant changes compared to the prior stage (Fig. 13a1–b2). The wetting trends in the northeast half are likely contributed by the combination of Prep and PET. The primary difference between GLDAS and ERA5 is in the west TP (the region with red rectangle). The significant drying was detected by GLDAS in the later stage, while it was observed by ERA5 in the prior stage. The SM drying in the west TP seems dominated by PET, with the dominance strengthened in the later stage (Fig. 13b2, d2, and e2). This is also supported by the significant (p < 0.05) and high correlations of SM with PET but the insignificant (p > 0.05) and low correlations with Prep in the west TP (Fig. S9). However, the PET estimation in the west TP tends to bear large uncertainty due to the scarce in situ measurements there. The climate drying or wetting of the west TP needs to be further discussed. In addition, the significant drying trends in the southeast TP (emerald rectangle) are pronounced, which are likely jointly controlled by Prep and PET.
5.1 Possible linkages to the soil moisture drought shift
The SM droughts of the TP in summer (May–September) had a significant shift of alleviation in the middle to late 1990s. Our results demonstrated that Prep was the primary driver of the shift and PET the secondary. Prep variability on an inter-annual scale for summer TP is controlled by remote moisture transport driven by the general circulation of the atmosphere (Wang et al., 2017; Li et al., 2019). In summer, the TP is under the control of the ISM and westerlies, with limited influence from the EASM (Yao et al., 2012). The westerly jet stream with its position and strength can be reflected by the AMO because of their high correlations on the inter-decadal scale (Sun et al., 2020). The ISM and EASM with their strength can be largely manifested in the PDO, AMO, and ENSO due to their close relationships on the chronological scale. Considering the fact that the global sea-surface temperature can be partly impacted by solar cycles, solar cycles were also incorporated in the analysis of its influences on the circulations and Prep of the TP.
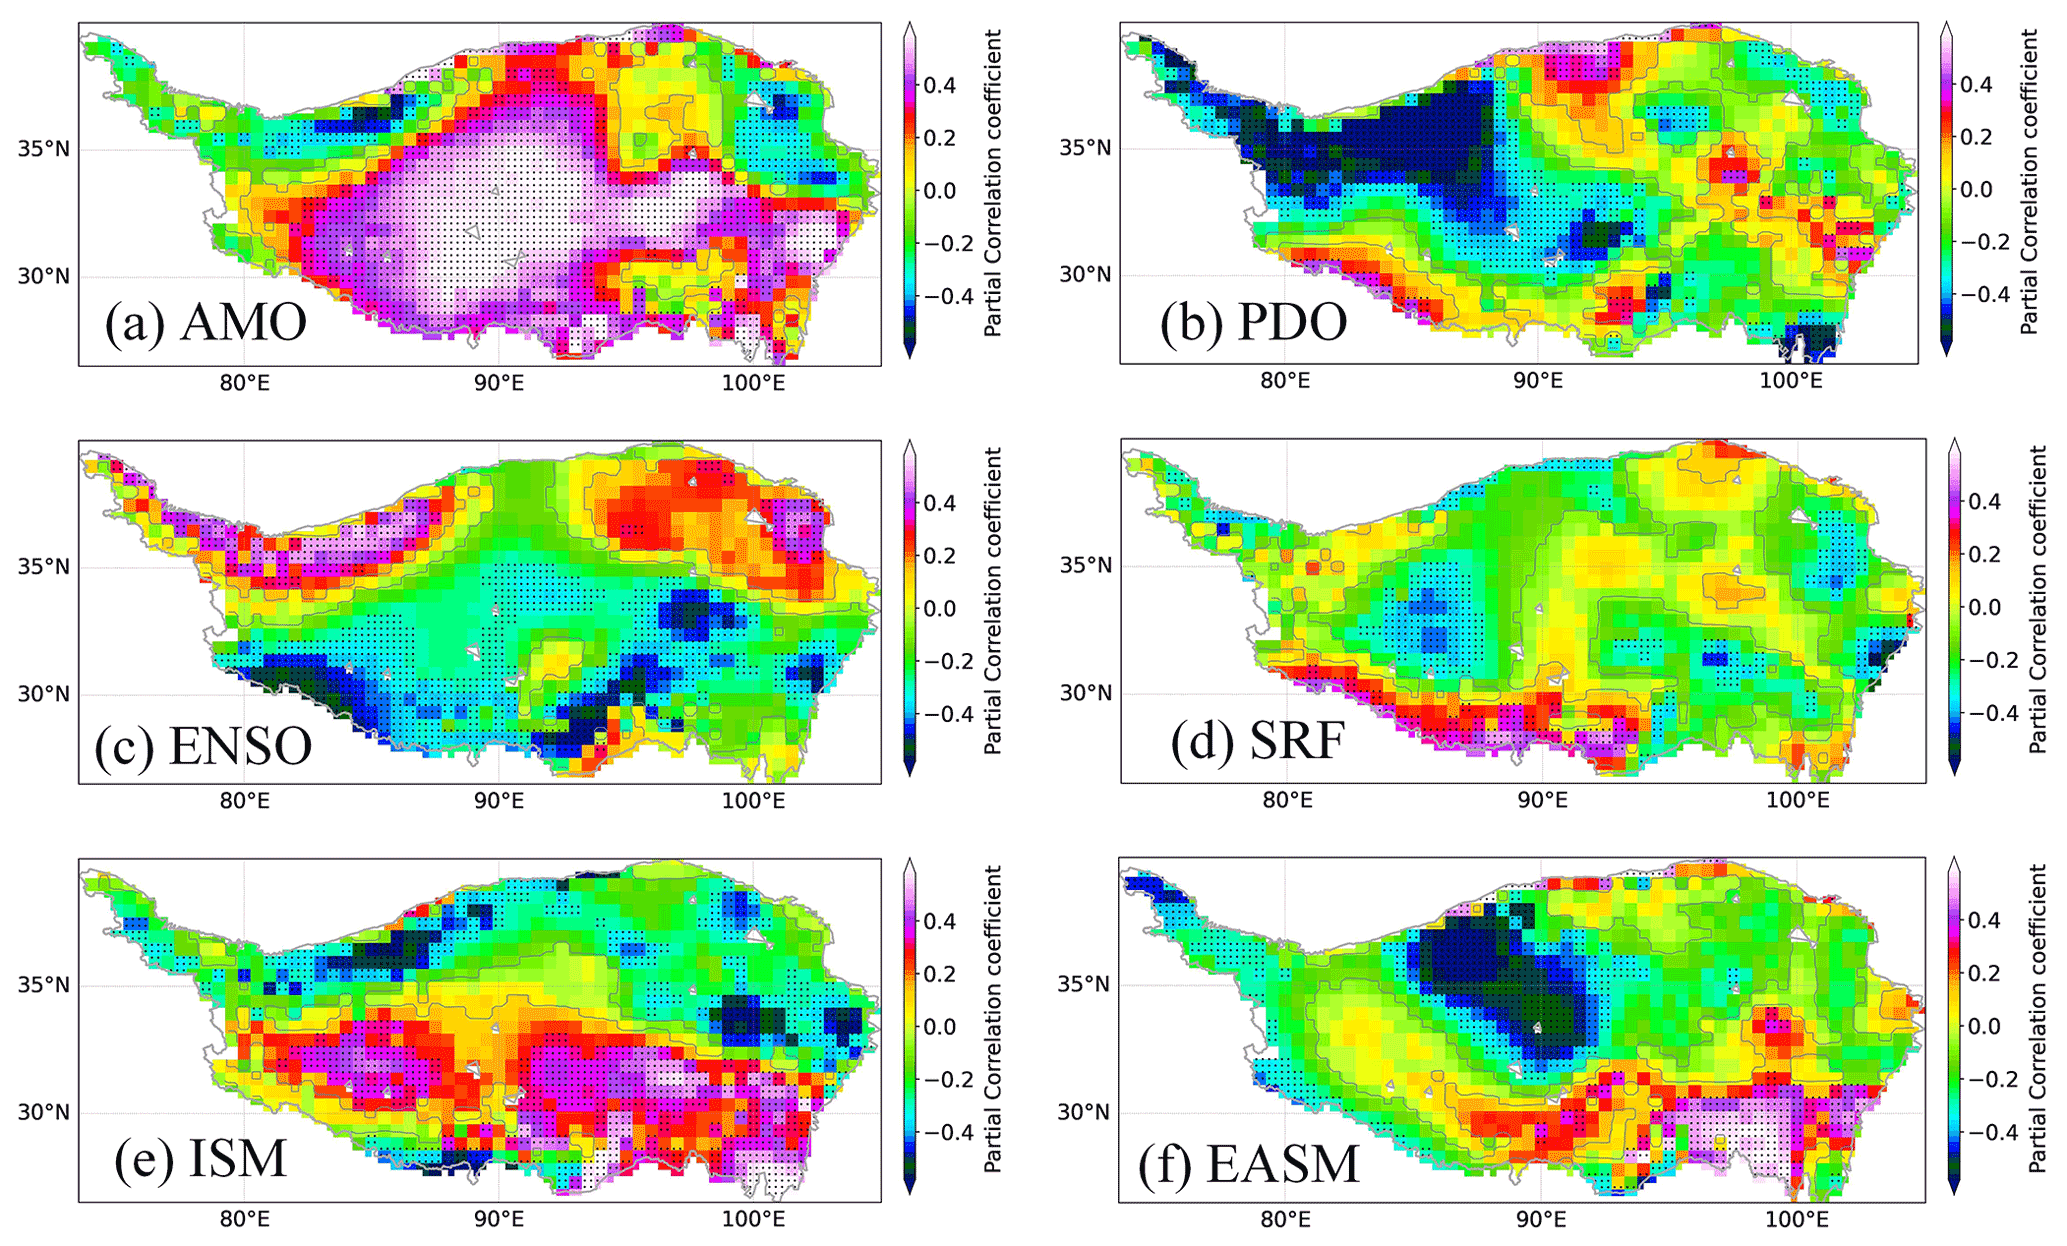
Figure 14Spatial distribution of the partial correlation coefficients between the precipitation and the (a) AMO, (b) PDO, (c) ENSO (Niño 3.4), (d) SRF, (e) EASM, and (f) ISM index on the inter-decadal scale.
The inter-decadal correlation analysis of the aforementioned circulation and monsoon indexes suggests that the EASM is significantly (p < 0.05) related to the AMO, PDO, and ENSO. The ISM is significantly correlated with the AMO and PDO. The correlation analysis based on 11-year running average statistics shows that solar circles have significant impacts on the ENSO and ISM. Due to the complex cross-impacts among the oscillation and circulation indexes and the subsequent multiple impacts on Prep, the partial correlation between these indexes and Prep was analyzed in space. The results show that the inter-decadal variations of summer Prep for the plateau are largely impacted by the AMO and PDO, while they are locally impacted by the ENSO (Fig. 14a–c). The ISM has significant positive impacts on the Prep of the south TP, while it has negative impacts on the Prep of the north TP. The EASM has positive impacts on the Prep of the southeast TP, while it has negative influences on the Prep of central north TP (Fig. 14e and f). Additionally, the solar cycles highly impacted Prep located in parts of the west and southwest plateau (Fig. 14d).
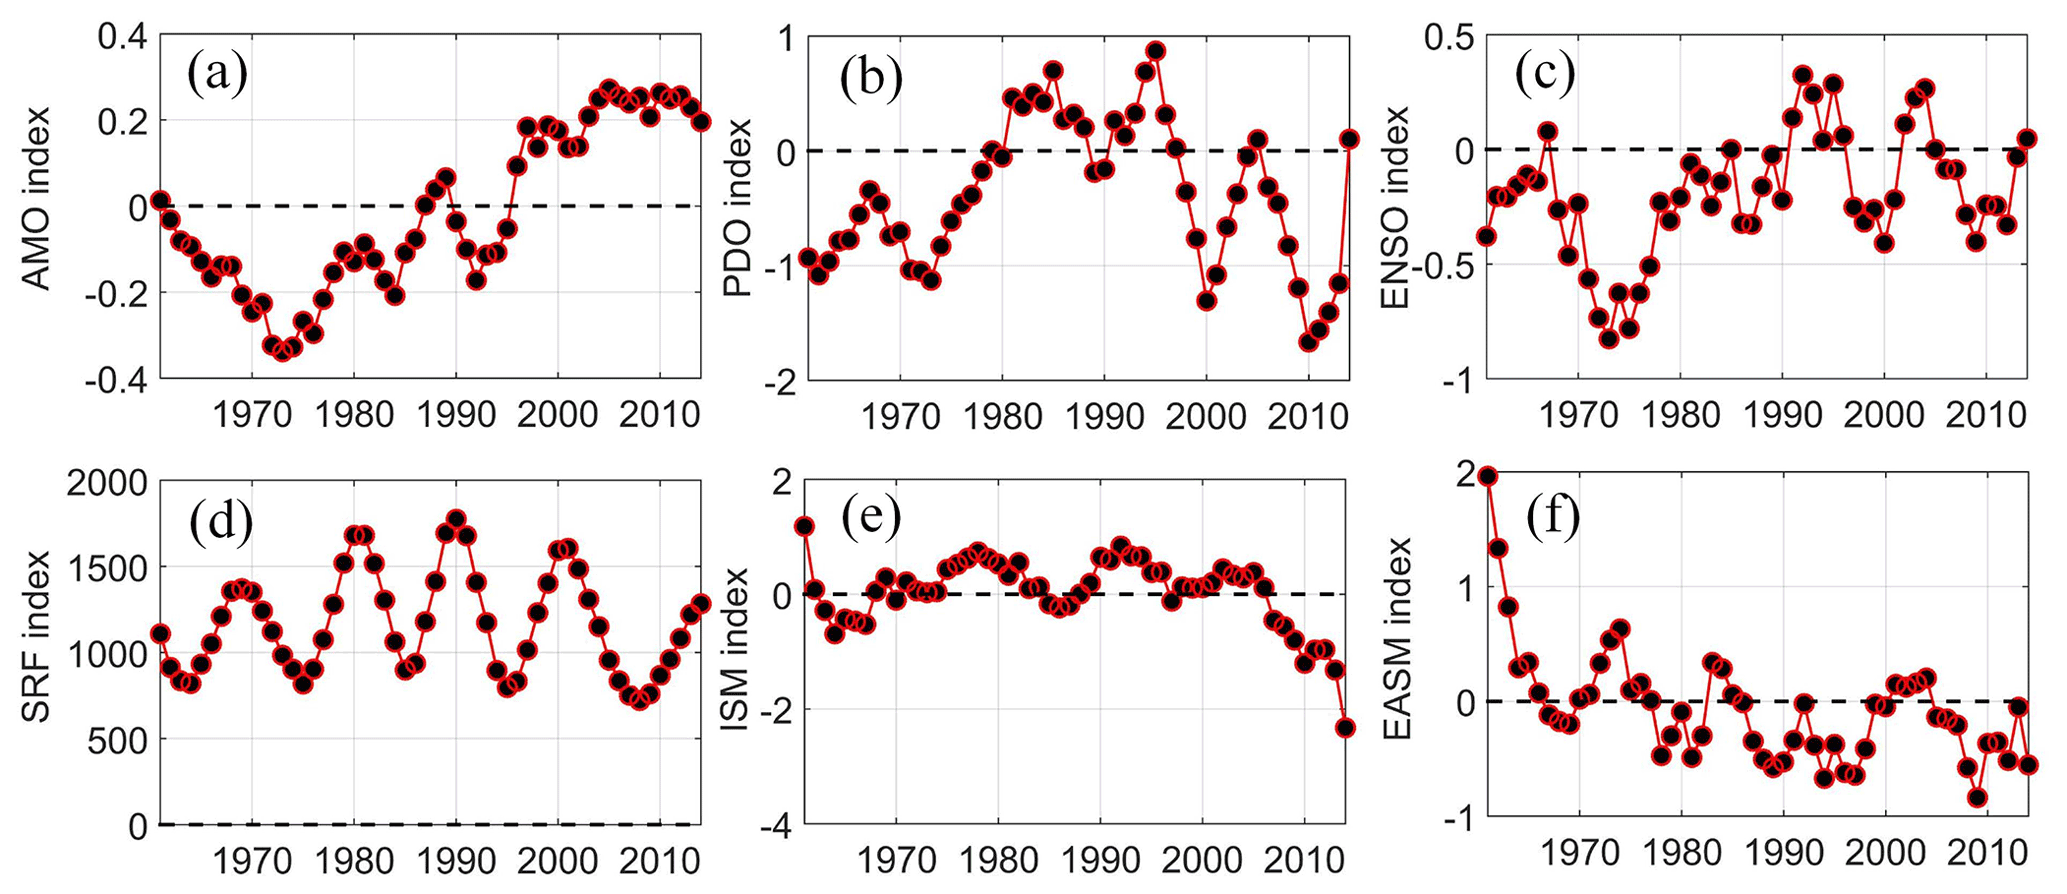
Figure 15Inter decadal variations of the (a) AMO, (b) PDO, (c) ENSO (Niño 3.4), (d) SRF, (e) ISM, and (f) EASM index for June–July–August (JJA) over 1961–2014.
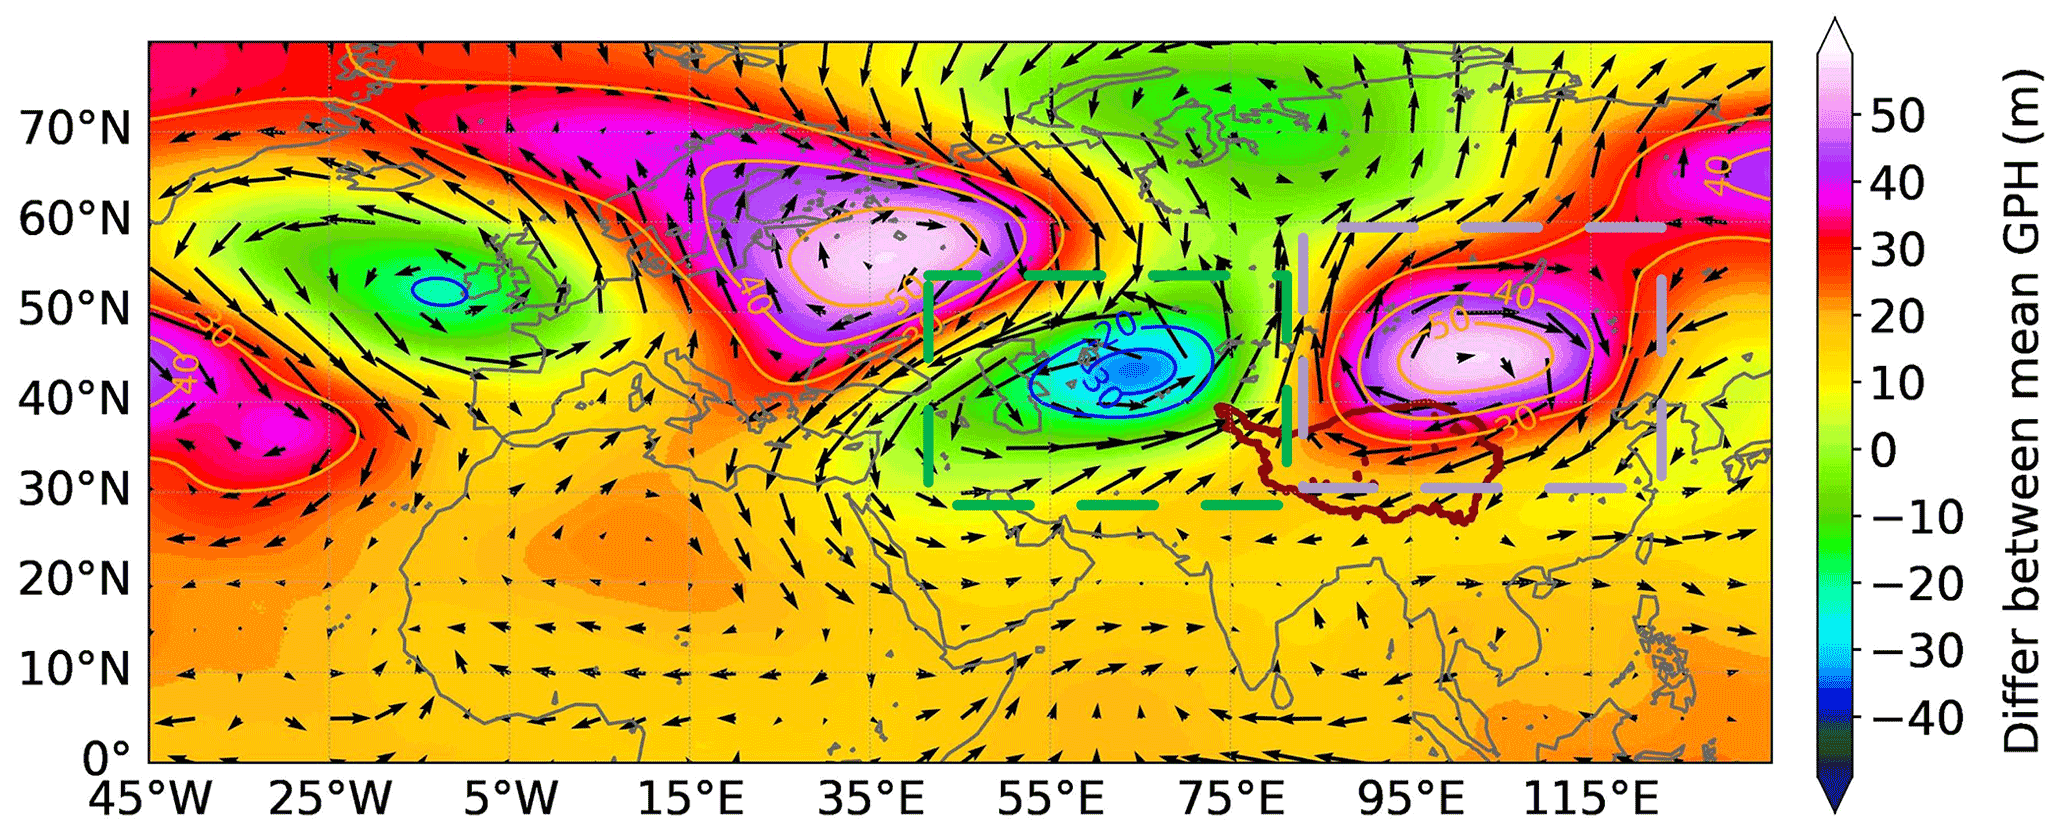
Figure 16Differences (Differ) in summer (July) geopotential height (GPH) at 200 hPa between the warm (1995–2014) and cold (1961–1994) phases of the AMO (the later stage minus the former stage). The bold red line represents the border of the TP.
The AMO has experienced a phase transition from cold (negative) to warm (positive) since the mid-1990s (Fig. 15a). In the warm phase, the AMO would induce a wave train of cyclonic and anticyclonic anomalies over Eurasia in summer (Fig. 16). These anticyclonic anomalies to the east of the TP tend to cause east wind anomalies, that is, the weakening of the westerly winds at 200 hPa near the TP (Fig. 16, gray rectangle). The weakened westerlies would reduce the water vapor transport beyond the eastern TP boundary and facilitate the convergence of water vapor (i.e., Prep formation) over the interior and central TP (Wang et al., 2017; Zhou et al., 2019). The more the moisture gathered, the more the Prep falls in this region. At the same time, the abnormal cyclone to the west of the TP promoted the northward and eastward water vapor transport imported from the southwest boundary of the TP (Fig. 16, the green rectangle), which also increased the wetting shift of the interior TP (C. Zhang et al., 2019; Sun et al., 2020). On the other hand, the phase transition of AMO from cold to warm is inclined to cause the weakening of the ISM and EASM due to the significant negative correlations between the AMO and the ISM and EASM. This impact seems more pronounced on ISM, with a significant decreasing tendency after the mid-2000s (Fig. 15e). The weakened ISM would contribute to the wetting of the north TP, while it would slow down the wetting of the central south TP through its impacts on the water vapor transport from the south boundary (Fig. 14e). The PDO seems to be mainly in its cold (negative) phase after the middle to late 1990s on the inter-decadal scale (Fig. 15b). The cold phase of PDO is characterized by a cool wedge of sea-surface ocean temperature that is lower than normal in the eastern equatorial Pacific and a warm horseshoe pattern of sea-surface temperature that is higher than normal connecting the north, west, and southern Pacific. The relatively higher sea-surface temperature is inclined to weaken the land–sea thermal contrast in summer, thus probably contributing to the weakening of the ISM and EASM (Li et al., 2010; Zhang and Zhou, 2015). The weakening EASM tends to contribute to the wetting of the interior TP and the drying of the southeast TP (Fig. 14f). In addition, the ENSO and solar cycles are probably not the main factors driving the wetting shift of the TP as no evident phase difference between the periods before and after mid-1990s to late 1990s is present in the Niño 3.4 and SRF indices (Fig. 15c and d). In addition, the supportive impacts of PET on the wetting shift of the central-east in GLDAS and the west in ERA5 largely benefited from the decreased downward solar radiation (solar dimming) and wind speed (wind stilling) (Fig. 10b, c, e, and f).
Overall, the shift variation in SM drought is likely predominantly driven by the phase transition of the AMO from cold to warm since the mid-1990s. It should also be related to the phase transition of the PDO and the weakening ISM and EASM dominated by the ocean oscillation. Additionally, the solar dimming and wind stilling are also contributors of the wetting shift.
5.2 Potential drivers for the spatial pattern of drought trends
Due to the abrupt wetting shift of SM in the middle to late 1990s, its water and energy control capability changed substantially in space over the plateau. The SM drought trends presented differences before and after the shift, with more significant wetting in the later stage. The significant wetting of SM in the northeast TP was synergistically controlled by the increasing Prep and decreasing PET (Sect. 4.3). The Prep increase is related to the positive westerly wind anomalies over the entrance of the East Asia westerly jet in the upper troposphere and the strengthened northward water vapor transport from the south and east (Wang et al., 2018; C. Zhang et al., 2019). The PET decrease is probably resulted from the decline in Radi, wind speed, and VPD (Fig. S11 in the Supplement). Wind stilling is considered to be the factor with more importance by Zhang et al. (2009). The significant drying SM after the middle to late 1990s in the western TP dominated by the increasing PET based on GLDAS is likely not a true reflection of SM. Because the PET based on the meteorological stations was decreasing in Yin et al. (2013) and Yang et al. (2014). In addition, the significant drying in the southeast TP was a combined effect of the increasing PET and decreasing Prep (Fig. 13). The increasing PET is likely dominated by the considerable increase in Temp for the southeast TP as the increase in wind speed and Radi is generally not supported (Fig. S11) (Zhang et al., 2009; Yang et al., 2014). The decreasing Prep in the southeast is probably related to the weakening of EASM and ISM, in particular for the significant weakening of the ISM (Figs. 14e, f and 15e, f). The weakening ISM may decrease the water exchange between the Asian monsoon region and the plateau (Yang et al., 2014). Thus, this phenomenon led to less Prep and drying SM in the ISM-affected southeast region (Fig. 13).
Overall, the substantial wetting in the northeast TP is probably a combination of the forces of the decreasing Radi, wind speed, and VPD and the increasing rainfall input from the west and south. However, the significant drying in the southeast TP is largely dominated by the increasing Temp and the decreasing rainfall input dominated by the weakening monsoon of the ISM under global warming.
5.3 Implications of the abrupt wetting shift of SM on TP climate
The interior and central TP experienced an abrupt wetting shift in SM over summer (May–September) in the middle to late 1990s, particularly for the arid and semiarid zones. The SM is generally dominated by water and energy from the atmosphere. At the same time, as the largest storage component of Prep and radiation anomalies on land, SM also controls the water and energy feedback from the land surface to the atmosphere by coupling with ET. The shift variations in SM tend to produce changes to the local or regional underlying incoming water and energy redistribution, that is, changes in the SM regime (Koster et al., 2016).
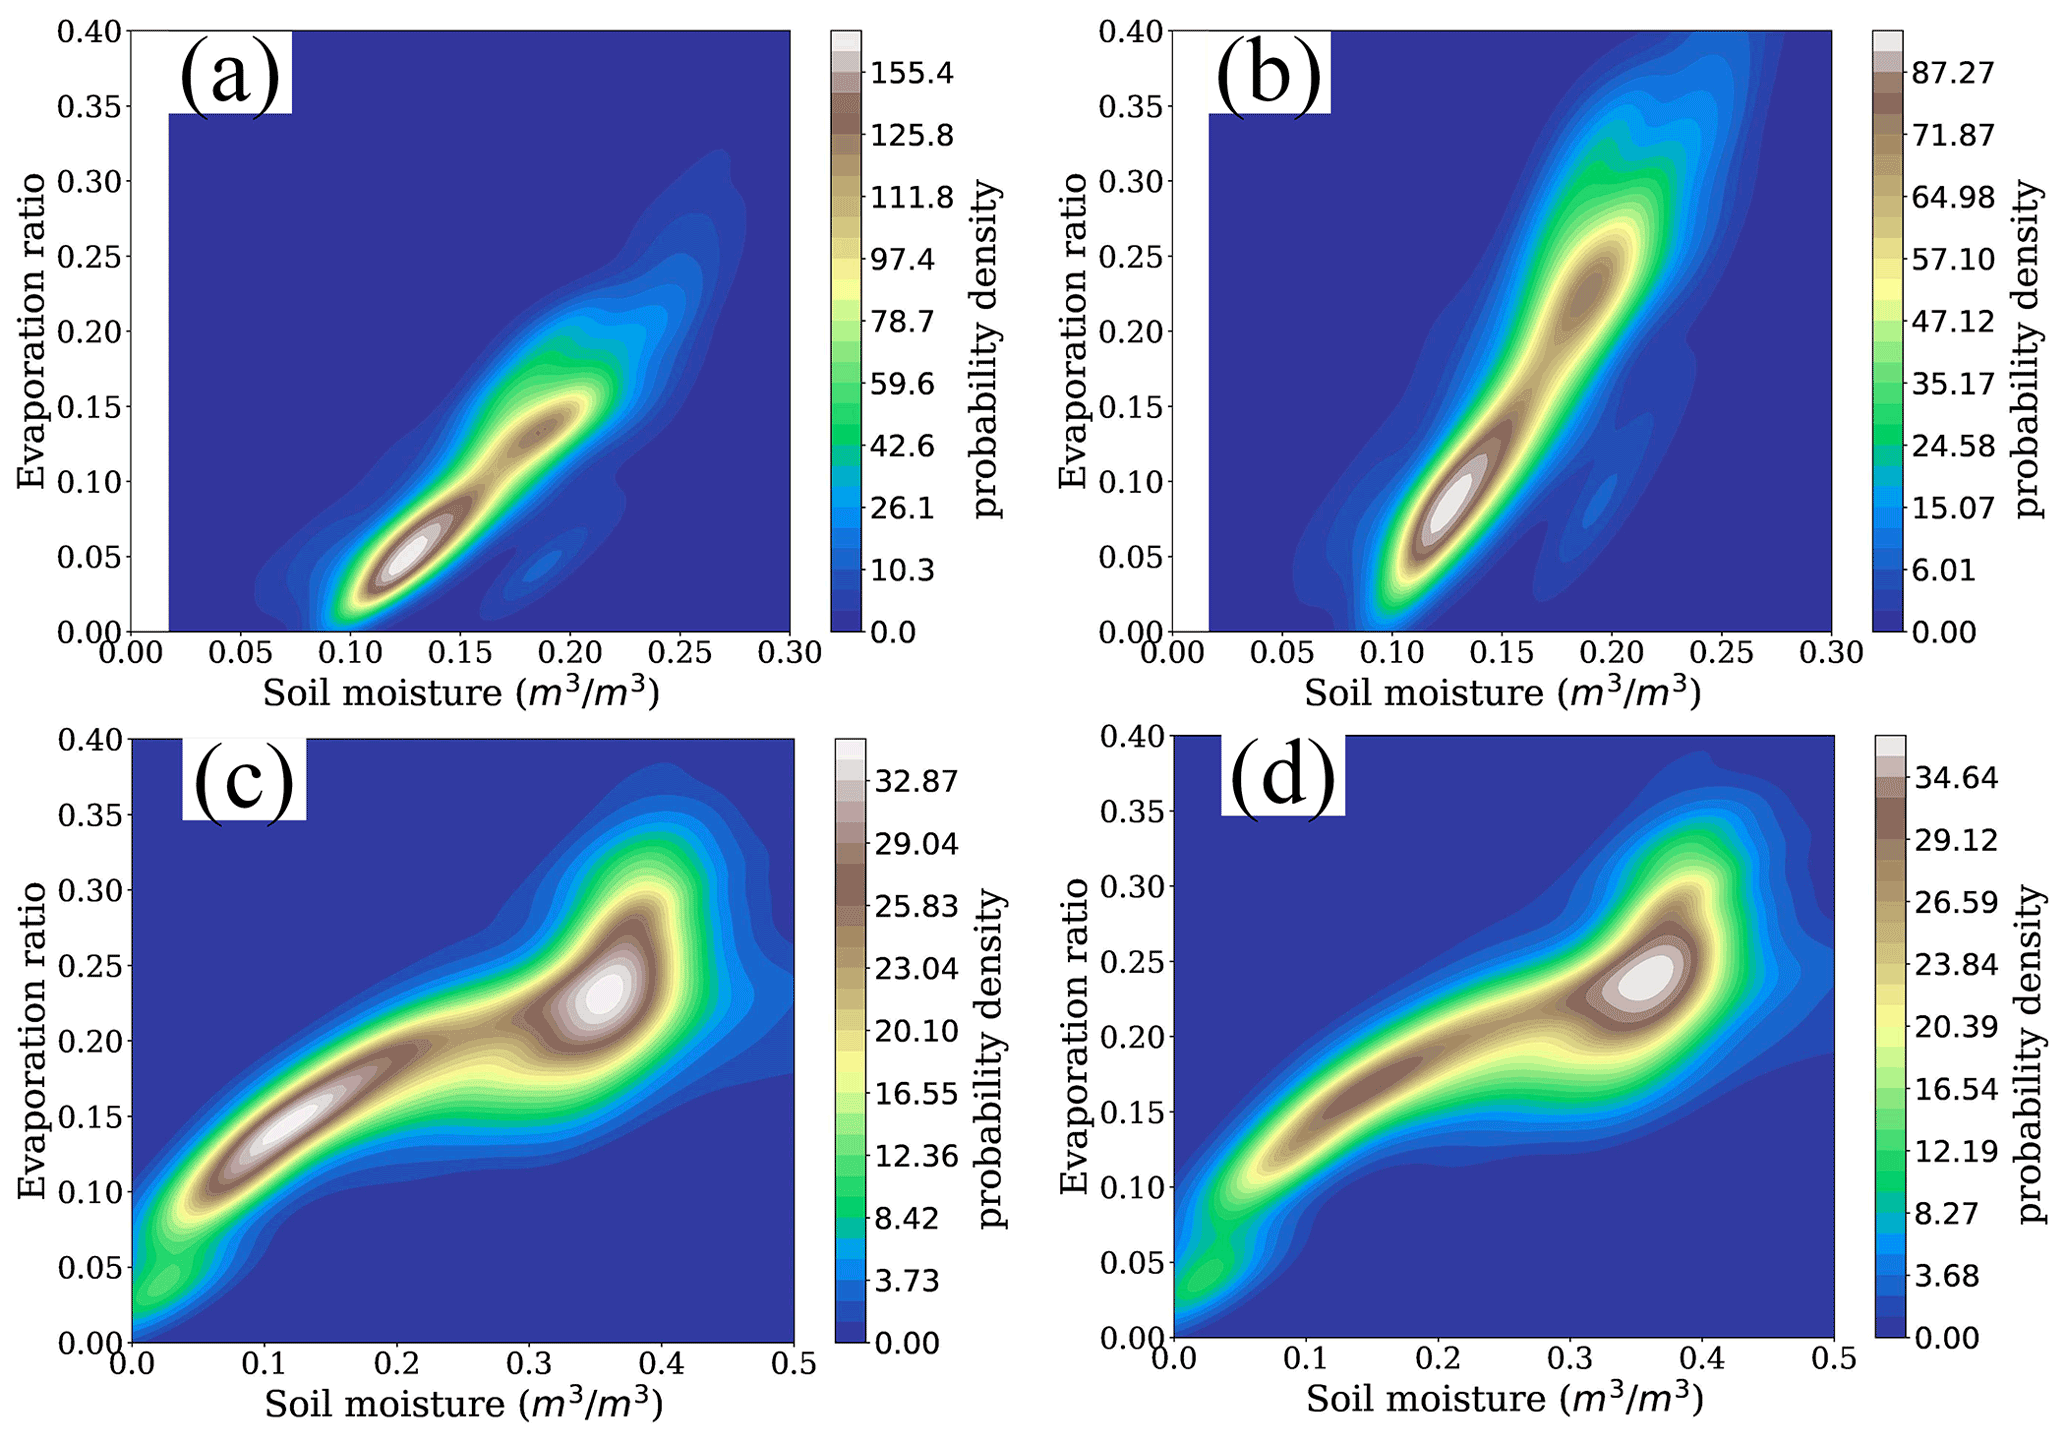
Figure 17Probability distribution of the relationship between the evaporative ratio and the soil moisture in the stages before (a, c) and after (b, d) the middle to late 1990s for the TP based on GLDAS and ERA5.
The SM regime is often distinguished based on the sensitivity of evaporation to SM change, which can be reflected in the relationship between SM and the evaporative ratio (the fraction of latent heat in net radiation) (Koster et al., 2011). Figure 17 compares this relationship before and after the wetting shift for the TP. The sensitivity of evaporation to SM change significantly increased after the wetting shift as the slope of the probability distribution increased substantially for GLDAS, and the center of most probability has entered the wet end for ERA5. In parts of the TP dominated by the arid and semiarid climate, the SM is relatively dry on average, and the evaporation is low. The limited SM cannot become too much lower during dry years. By contrast, it is more likely to produce impacts on evaporation and the overlying atmosphere through the surface energy budget during wet years. With the wetting shift in the middle to late 1990s, the SM seems to have entered a regime where it can have significant impacts on evaporation and the overlying atmosphere.
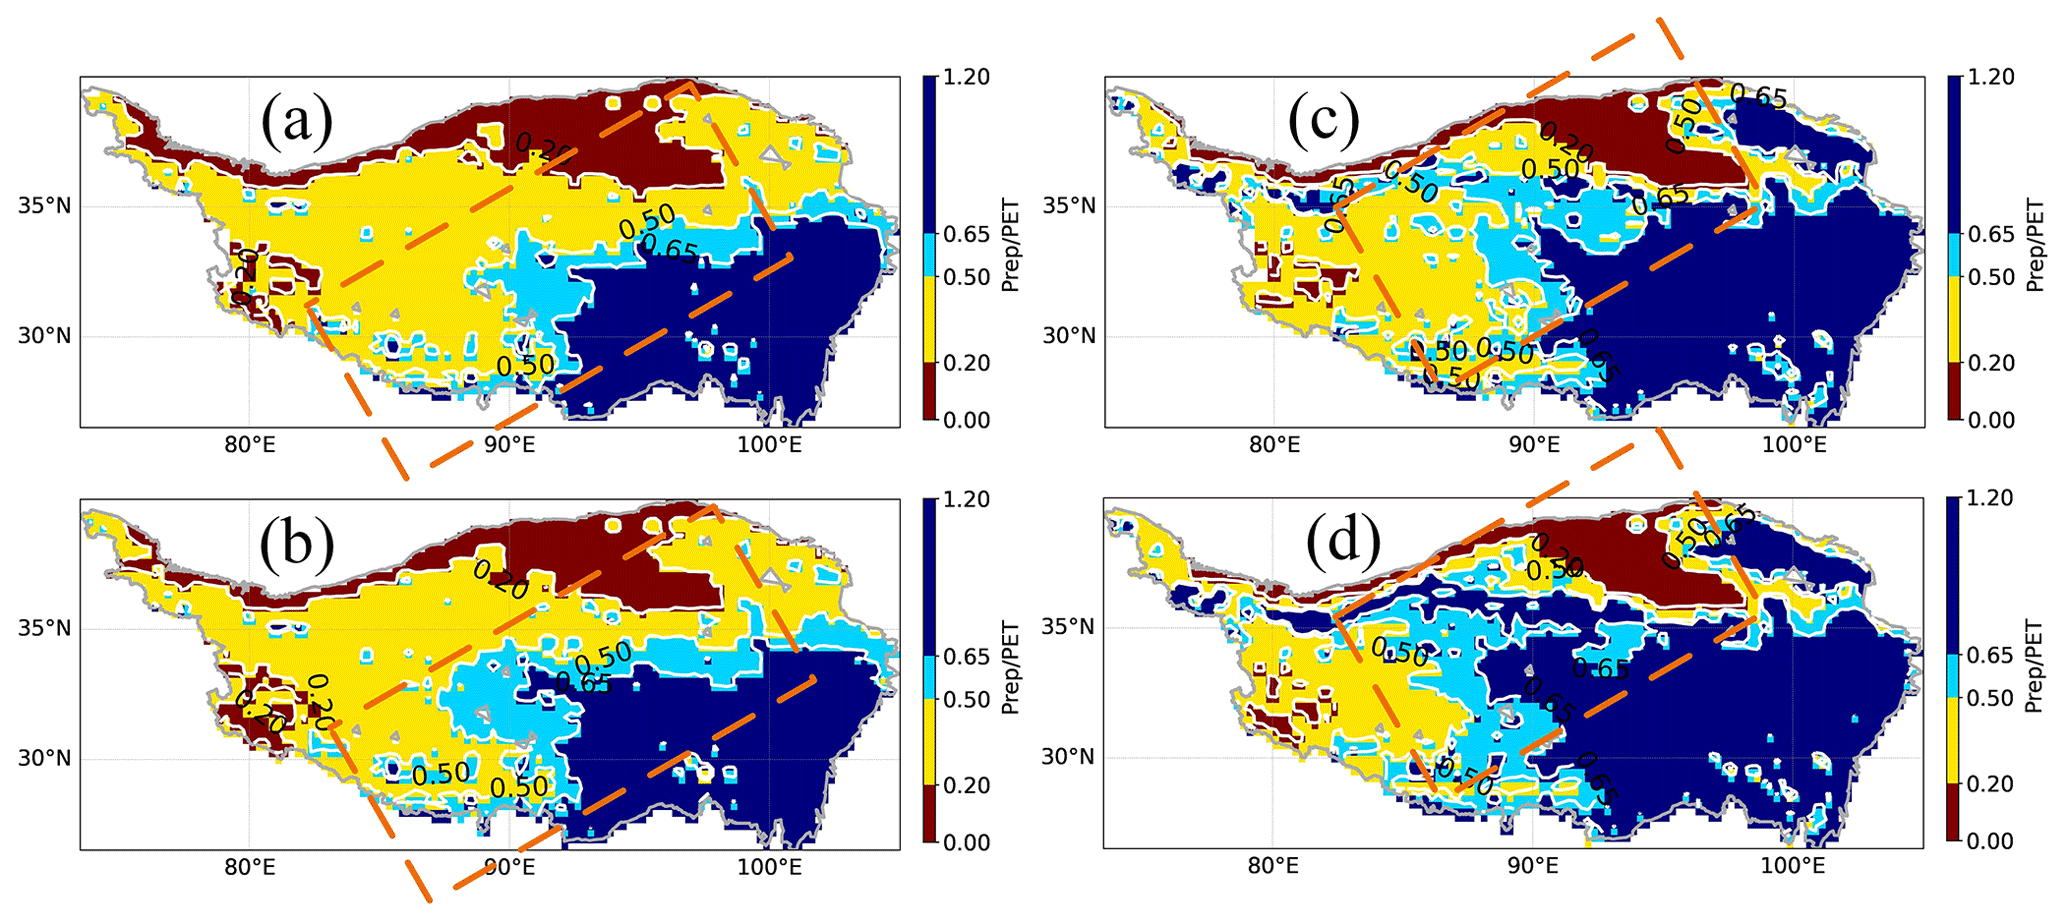
Figure 18Multi-year average Prep / PET for the summer period of May–September over the stages of before (a, c) and after (b, d) the middle to late 1990s based on GLDAS and ERA5.
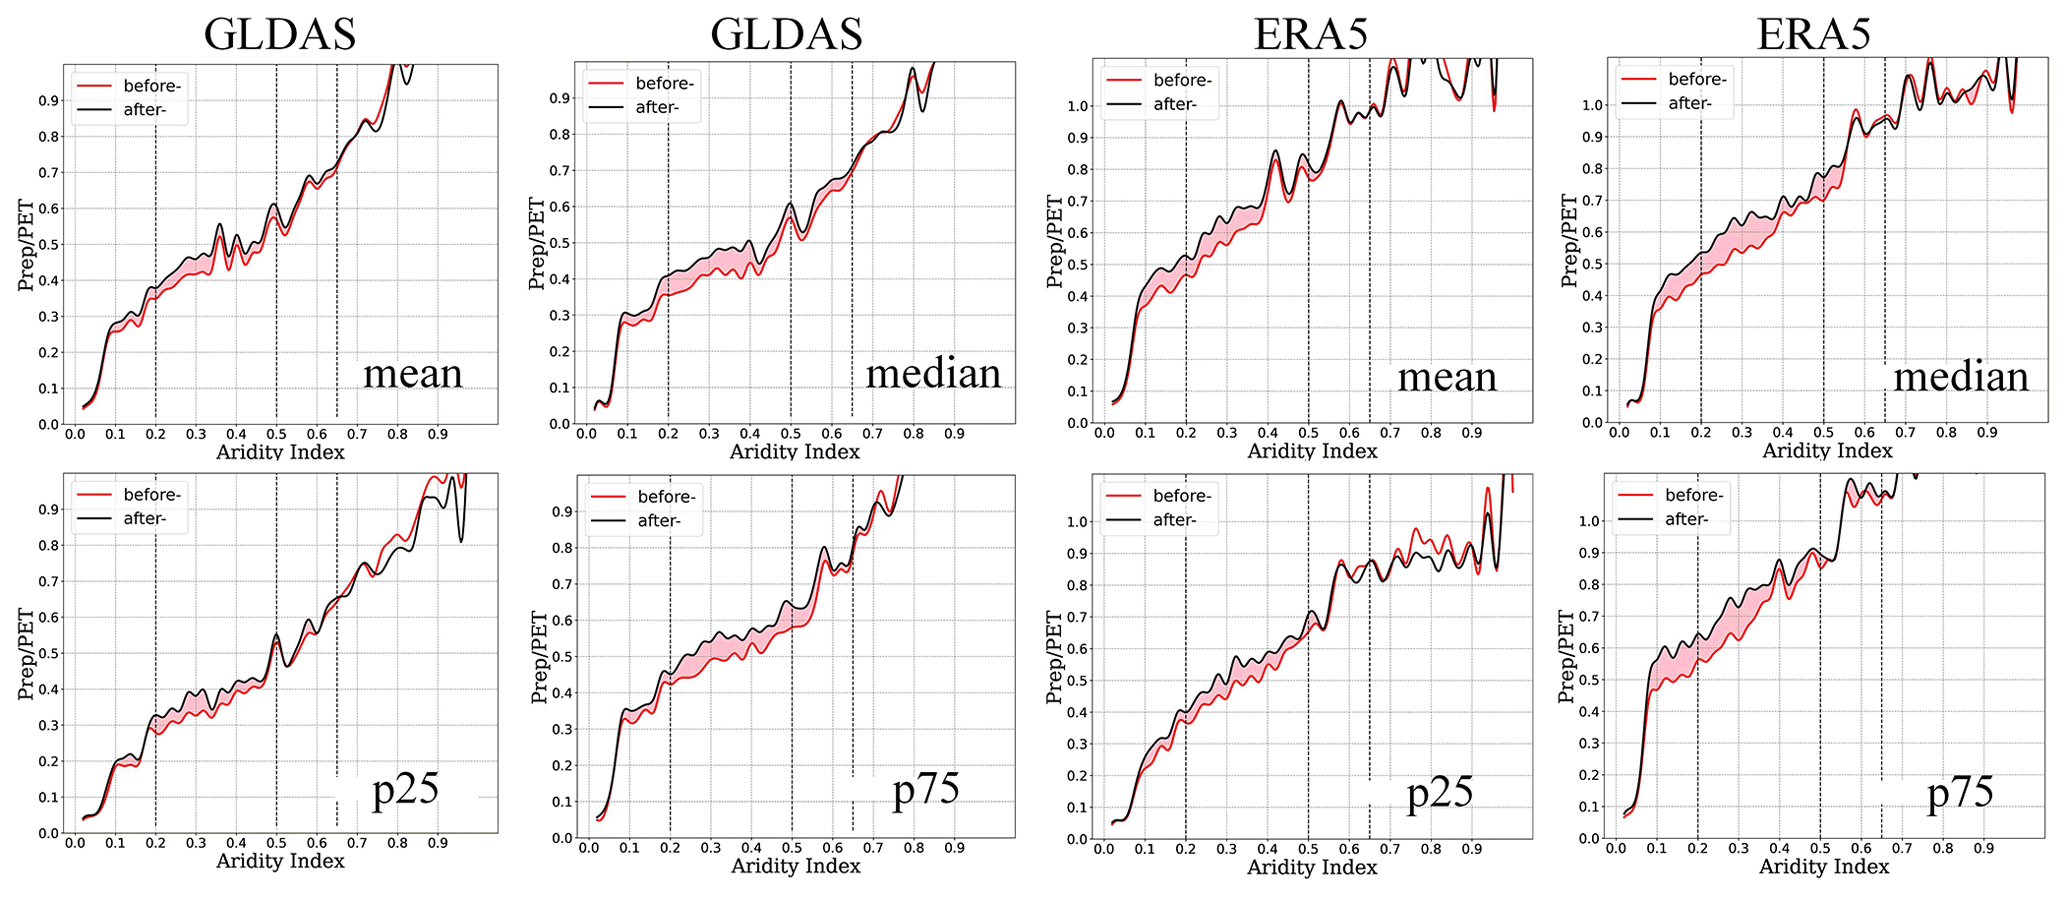
Figure 19Variations of the Prep / PET statistics (mean, median, 25th quantile (p25), and 75th quantile (p75)) over the summer period (May–September) with the aridity index (AI; Fig. S3) for both cases before (before-) and after (after-) the wetting shift based on GLDAS and ERA5. p25 and p75 are the 25th and 75th quantile of the cumulative distribution of Prep / PET. The pink shaded areas represent the degree of wetting shift.
SM regime changes may indicate a changing tendency of the climate system. The ratio of long-term average Prep to PET (Prep / PET; i.e., the aridity index (AI)) provides a notable method of determining the climate regime of a region (Fu and Feng, 2014). The comparison of summer Prep / PET before and after the middle to late 1990s indicates an inclination of phase transition from an arid to semiarid, semiarid to subhumid, and subhumid to humid climate in summer over the wet–dry transitional zone of the TP based on GLDAS and ERA5 (Fig. S4) because the dividing lines for both expand to the northwest in the later stage (Fig. 18; 0.5 and 0.65 lines in the orange rectangle). The significance of this change can be reflected in the comparison of the statistics (mean, median, 25th quantile (p25), and 75th quantile (p75)) from the grid-based summer Prep / PET with a varying aridity index (Fig. S4) between the prior and later stages (Fig. 19). The overwhelmingly higher Prep / PET for the later stage (pink shaded area) compared to the prior stage over the arid, semiarid, and subhumid zones (the region with AI in 0.1–0.65) illustrates the significant wetting of the climate, particularly for the arid and semiarid regions. The plateau enhances the Asian summer monsoon and modulates its variability by exerting strong thermal forcing on the mid-troposphere over the midlatitude of the Northern Hemisphere during summer and spring (Yanai et al., 1992). The possible impacts of the abrupt wetting on Asia and even global climate via the strong land–atmosphere coupling over the transitional zone should be given attention. In addition, climate controls the structure and function of the ecosystem (H. Chen et al., 2013). The large impact of the wetting climate transition on the original ecosystem must be considered, especially for parts of the TP with the most sensitive and fragile ecosystem.
This study explored the climate wetting and drying of the TP over the last half century from variations of historical SM droughts. The spatiotemporal patterns and long-term variations of summer (May–September) SM droughts and the climate causes were comprehensively investigated based on multi-source observation and reanalysis data. To improve the reliability of the results, both the GLDAS and ERA5 SM data were used based on a comprehensive data validation.
As a result, 197 and 193 drought events (consisting of 350 and 339 drought clusters, respectively) were identified based on GLDAS and ERA5 SM, respectively. Spatially, extensive regions, particularly for the central and south TP, endured long-lasting, comparatively severe, and frequent droughts. Large-scale drought clusters are mainly concentrated in the semiarid and subhumid regions. The most severe drought event occurred in May 1994 and affected over 73 % of the TP over 5 months' duration, driven by persistent, abnormally low Prep, along with strong PET.
The TP experienced a significant phase shift of SM drought alleviation in the middle to late 1990s, indicating an abrupt hydroclimate shift to a wetter plateau. Drought alleviation occurred in ∼ 87 % and ∼ 83 % of the plateau based on GLDAS and ERA5, respectively. The major wetting shift for ERA5 is in the interior TP, located in the arid and semiarid regions. Nevertheless, the significant wetting shift for GLDAS is in the central TP, distributed in the semiarid and subhumid regions. The substantial wetting of the interior plateau is likely more credible considering the higher temporal consistency of the ERA5 and in situ SM over the arid and semiarid regions and the higher correlation between the ERA5 and the inter-compared datasets (CMA, CMFD, and Han ET) in Prep and ET than GLDAS over the southwest plateau. Although the wetting shift of central TP in GLDAS is partly supported by the greening of vegetation, the magnitude of wetting needs further investigation. Before and after the phase shift, the SM drought did not present significant trends for the entire TP. Spatially, the SM wetting in the northeast half of the plateau became more prominent after the shift as a larger magnitude of SM wetting and an expanded area with significant changes are observed in the later stage.
We demonstrated that the shift alleviation of SM drought was predominately controlled by its dominant input (i.e., Prep), while its dominant output driver (i.e., PET) was a secondary contributor. By contrast, the drought trends of SM were the combined forces of Prep and PET, and the driving forces of PET increased after the wetting shift in the middle to late 1990s. Furthermore, the Prep driving on the shift of SM drought can be largely attributed to the phase transition of the AMO from cold to warm accompanied by the weakening westerly since the mid-1990s and partly to the phase transition of the PDO and the weakening ISM and EASM dominated by the ocean oscillation. The PET effects on the wetting shift should mainly benefit from the solar dimming and wind stilling, which offset the considerable increase in Temp. By contrast, the PET impacts on the wetting trends are likely the combined forces of solar radiation, wind speed, and vapor pressure deficit. The Prep impacts on trending tend to be related to the weakening ISM under global warming.
Overall, with the objective of exploring the climate wetting–drying of the TP under the background of profound global climate change over the last half century, this study provides a comprehensive investigation of SM droughts of the TP. According to our review of the literature, the core variable of land–atmosphere water and energy cycle, that is SM, was first adopted as an indicator to characterize the drought and indicate the climate wetting and drying of the TP. A significant wetting shift in the plateau was observed. Furthermore, the wetting shift was interpreted synthetically from not only the dominant climate-controlling factors of SM, but also the general circulation of the atmosphere. We demonstrated that the wetting shift indicated a SM regime change and an inclination of phase transition from arid to semiarid, semiarid to subhumid, and subhumid to humid climate. The large impact of the climate transition on the original sensitive and fragile ecosystem of the TP should be considered. The possible impacts of the overall wetting shift on global climate through the strong land–atmosphere coupling should also be given attention. The aforementioned innovative work provides evidence for an abrupt wetting shift of the plateau over the summer period and is significant for further understanding climate change of the TP.
GLDASv2.0/Noah data used in this study are available from https://doi.org/10.5067/9SQ1B3ZXP2C5 (Beaudoing et al., 2019). Precipitation and surface temperature data provided by the Chinese Meteorological Administration are available at http://data.cma.cn/ (CMA, 2020). ISMN soil moisture data are available from https://ismn.geo.tuwien.ac.at/en/ (Dorigo et al., 2011). The AMO, Niño 3.4, and SRF index are provided by the NOAA Physical Sciences Laboratory (http://www.psl.noaa.gov/data/, NOAA PSL, 2020). The PDO index is available at https://www.ncdc.noaa.gov/teleconnections/pdo/ (NOAA NCEI, 2020). The ISM index is available from http://apdrc.soest.hawaii.edu/projects/monsoon/seasonal-monidx.html (Wang et al., 2001), and the EASM index is at http://ljp.gcess.cn/dct/page/65540 (Li and Zeng, 2002). The ERA5 dataset is available at https://cds.climate.copernicus.eu/cdsapp#!/dataset/reanalysis-era5-land-monthly-means (ECMWF, 2022). Further datasets can be accessed upon request from the corresponding author.
The supplement related to this article is available online at: https://doi.org/10.5194/hess-26-3825-2022-supplement.
YoL and YuL conceived and designed the research. YoL performed the experiments and wrote and edited the paper. WW helped revised the paper. HZ and LT gave constructive suggestions to improve the paper.
The contact author has declared that neither they nor their co-authors have any competing interests.
Publisher's note: Copernicus Publications remains neutral with regard to jurisdictional claims in published maps and institutional affiliations.
The authors would like to thank Gao Hongkai and Dong Jianzhi for their constructive suggestions. Our gratitude also goes to the two anonymous reviewers for their critical and insightful comments and suggestions that improved this paper, and we would also like to thank the editor Gerrit H. de Rooij.
This research has been supported by the Second Tibetan Plateau Scientific Expedition and Research Program (grant no. 2019QZKK0202), the National Natural Science Foundation of China (grant nos. 41901049, 41430855, and 41961134003), the Jiangsu Science and Technology Planning Youth Project (grant no. BK20191097), and the National Key Research and Development Program of China (grant no. 2018YFE0105900).
This paper was edited by Gerrit H. de Rooij and reviewed by two anonymous referees.
Andreadis, K. M., Clark, E. A., Wood, A. W., Hamlet, A. F., and Lettenmaier, D. P.: Twentieth-century drought in the conterminous United States, J. Hydrometeorol., 6, 985–1001, https://doi.org/10.1175/Jhm450.1, 2005.
Beaudoing, H., Rodell, M., and NASA/GSFC/HSL: GLDAS Noah Land Surface Model L4 monthly 0.25 × 0.25 degree V2.0, Greenbelt, Maryland, USA, Goddard Earth Sciences Data and Information Services Center (GES DISC) [data set], https://doi.org/10.5067/9SQ1B3ZXP2C5, 2019.
Bi, H., Ma, J., Zheng, W., and Zeng, J.: Comparison of soil moisture in GLDAS model simulations and in situ observations over the Tibetan Plateau, J. Geophys. Res.-Atmos., 121, 2658–2678, https://doi.org/10.1002/2015JD024131, 2016.
Chen, H., Zhu, Q., Peng, C., Wu, N., Wang, Y., Fang, X., Gao, Y., Zhu, D., Yang, G., Tian, J., Kang, X., Piao, S., Ouyang, H., Xiang, W., Luo, Z., Jiang, H., Song, X., Zhang, Y., Yu, G., Zhao, X., Gong, P., Yao, T., and Wu, J. H.: The impacts of climate change and human activities on biogeochemical cycles on the Qinghai-Tibetan Plateau, Glob. Change Biol., 19, 2940–2955, https://doi.org/10.1111/gcb.12277, 2013.
Chen, Y., Yang, K., Qin, J., Zhao, L., Tang, W., and Han, M.: Evaluation of AMSR-E retrievals and GLDAS simulations against observations of a soil moisture network on the central Tibetan Plateau, J. Geophys. Res.-Atmos, 118, 4466–4475, https://doi.org/10.1002/jgrd.50301, 2013.
Cheng, G. and Wu, T.: Responses of permafrost to climate change and their environmental significance, Qinghai–Tibet Plateau. J. Geophys. Res., 112, F02S03, https://doi.org/10.1029/2006JF000631, 2007.
Chinese Meteorological Administration (CMA): China land-surface meteorological daily dataset, CMA [data set], http://data.cma.cn/, last access: 10 May 2020.
Cuo, L., Zhang, Y., Zhu, F., and Liang, L.: Characteristics and changes of streamflow on the Tibetan Plateau: A review, J. Hydrol. Reg. Stud., 2, 49–68, https://doi.org/10.1016/j.ejrh.2014.08.004, 2014.
Diro, G. T. and Sushama, L.: The role of soil moisture-atmosphere interaction on future hot-spells over North America as simulated by the Canadian Regional Climate Model (CRCM5), J. Climate, 30, 5041–5058, https://doi.org/10.1175/JCLI-D-16-0068.1, 2017.
Dorigo, W. A., Wagner, W., Hohensinn, R., Hahn, S., Paulik, C., Xaver, A., Gruber, A., Drusch, M., Mecklenburg, S., van Oevelen, P., Robock, A., and Jackson, T.: The International Soil Moisture Network: a data hosting facility for global in situ soil moisture measurements, Hydrol. Earth Syst. Sci., 15, 1675–1698, https://doi.org/10.5194/hess-15-1675-2011, 2011 (data available at: https://ismn.geo.tuwien.ac.at/en/, last acces: 20 May 2022).
Duan, A. and Xiao, Z.: Does the climate warming hiatus exist over the Tibetan Plateau?, Sci. Rep., 5, 13711, https://doi.org/10.1038/srep13711, 2015.
European Center for Medium-Range Weather Forecast (ECMWF): ERA5-Land monthly averaged data from 1950 to present, ECMWF [data set], https://cds.climate.copernicus.eu/cdsapp#!/dataset/reanalysis-era5-land-monthly-means, last acces: 26 June 2022.
Fu, Q. and Feng, S.: Responses of terrestrial aridity to global warming, J. Geophys. Res.-Atmos., 119, 7863–75, https://doi.org/10.1002/2014JD021608, 2014.
Gao, G., Chen, D. Xu, C. Y., and Simelton, E.: Trend of estimated actual evapotranspiration over China during 1960–2002, J. Geophys. Res.-Atmos., 112, D11120, https://doi.org/10.1029/2006JD008010, 2007.
Gao, Y., Cuo, L., and Zhang, Y.: Changes in moisture flux over the Tibetan Plateau during 1979–2011 and possible mechanisms, J. Clim., 27, 1876–1893, https://doi.org/10.1175/Jcli-D-13-00321.1, 2014.
Guttman, N. B.: Accepting the standardized precipitation index: A calculation algorithm, J. Am. Water Resour. As., 35, 311–322, https://doi.org/10.1111/j.1752-1688.1999.tb03592.x,1999.
Han, C., Ma, Y., Wang, B., Zhong, L., Ma, W., Chen, X., and Su, Z.: Monthly mean evapotranspiration data set of the Tibet Plateau (2001–2018), National Tibetan Plateau Data Center, https://doi.org/10.11888/Hydro.tpdc.270995, CSTR: 18406.11.Hydro.tpdc.270995, 2020.
Han, C., Ma, Y., Wang, B., Zhong, L., Ma, W., Chen, X., and Su, Z.: Long-term variations in actual evapotranspiration over the Tibetan Plateau, Earth Syst. Sci. Data, 13, 3513–3524, https://doi.org/10.5194/essd-13-3513-2021, 2021.
He, J., Yang, K., Tang, W., Lu, H., Qin, J., Chen, Y., and Li, X.: The first high-resolution meteorological forcing dataset for land process studies over China, Scientific Data, 7, 1–11, https://doi.org/10.1038/s41597-020-0369-y,2020.
Herrera-Estrada, J. E., Satoh, Y., and Sheffield, J.: SpatioTemporal dynamics of global drought, Geophys. Res. Lett., 44, 2254–2263, https://doi.org/10.1002/2016GL071768, 2017.
Koster, R. D., Mahanama, S. P. P., Yamada, T. J., Balsamo, G., Berg, A. A., Boisserie, M., Dirmeyer, P. A., Doblas-Reyes, F. J., Drewitt, G., Gordon, C. T., Guo, Z., Jeong, J. H., Lee, W. S., Li, Z., Luo, L., Malyshev, S., Merryfield, W. J., Seneviratne, S. I., Stanelle, T., van den Hurk, B. J. J. M., Vitart, F., and Wood, E. F.: The Second Phase of the Global Land-Atmosphere Coupling Experiment: Soil Moisture Contributions to Subseasonal Forecast Skill, J. Hydrometeorol., 12, 805–822, https://doi.org/10.1175/2011jhm1365.1, 2011.
Koster, R. D., Chang, Y., Wang, H., and Schubert, S. D.: Impacts of Local Soil Moisture Anomalies on the Atmospheric Circulation and on Remote Surface Meteorological Fields during Boreal Summer: A Comprehensive Analysis over North America, J. Climate, 29, 7345–7364, https://doi.org/10.1175/jcli-d-16-0192.1, 2016.
Kuang, X. and Jiao, J. J.: Review on climate change on the Tibetan Plateau during the last half century, J. Geophys. Res.-Atmos., 121, 3979–4007, https://doi.org/10.1002/2015jd024728, 2016.
Lansu, E. M., van Heerwaarden, C. C., Stegehuis, A. I., and Teuling, A. J.: Atmospheric Aridity and Apparent Soil Moisture Drought in European Forest During Heat Waves, Geophys. Res. Lett., 47, e2020GL087091, https://doi.org/10.1029/2020GL087091, 2020.
Li, H., Dai, A., Zhou, T., and Lu, J.: Responses of East Asian summer monsoon to historical SST and atmospheric forcing during 1950–2000, Clim. Dyn., 34, 501–514, https://doi.org/10.1007/s00382-008-0482-7, 2010.
Li, J. and Zeng, Q.: A unified monsoon index, Geophys Res. Lett., 29, 1274, https://doi.org/10.1029/2001GL013874, 2002 (data availavble at: http://ljp.gcess.cn/dct/page/65540, last acces: 23 March 2021).
Li, Y., Su, F., Chen, D., and Tang, Q.: Atmospheric water transport to the endorheic Tibetan Plateau and its effect on the hydrological status in the region, J. Geophys. Res.-Atmos, 124, 12864–12881, https://doi.org/10.1029/2019JD031297, 2019.
Liu, X. and Chen, B.: Climatic warming in the Tibetan Plateau during recent decades, Int. J. Climatol., 20, 1729–1742, https://doi.org/10.1002/1097-0088[20001130]20:14<1729::AID-JOC556>3.0.CO;2-Y, 2000.
Liu, Y., Liu, Y., and Wang, W.: Inter-comparison of satellite-retrieved and Global Land Data Assimilation System-simulated soil moisture datasets for global drought analysis, Remote Sens. Environ., 220, 1–18, https://doi.org/10.1016/j.rse.2018.10.026, 2019a.
Liu, Y., Zhu, Y., Ren, L., Singh, V. P., Yong, B., Jiang, S., and Yang, X.: Understanding the SpatioTemporal Links Between Meteorological and Hydrological Droughts From a Three-Dimensional Perspective. J. Geophys. Res.-Atmos., 124, 3090–3109, https://doi.org/10.1029/2018JD028947, 2019b.
Liu, Y., Liu, Y., Wang, W., and Zhou, H.: Propagation of soil moisture droughts in a hotspot region: Spatial patternand Temporal trajectory, J. Hydrol., 593, 125906, https://doi.org/10.1016/j.jhydrol.2020.125906, 2021.
Lloyd-Hughes, B.: A spatio-Temporal structure-based approach to drought characterisation: a structure-based approach to drought characterization, Int. J. Climatol., 32, 406–418, https://doi.org/10.1002/joc.2280, 2012.
Ma, N. and Zhang, Y.: Increasing Tibetan Plateau terrestrial evapotranspiration primarily driven by precipitation, Agr. Forest Meteorol., 317, 108887, https://doi.org/10.1016/j.agrformet.2022.108887,2022.
Muñoz-Sabater, J., Dutra, E., Balsamo, G., Schepers, D., Albergel, C., Boussetta, S., Agusti-Panareda, A., Zsoter, E., and Hersbach, H.: ERA5-Land: An Improved Version of the ERA5 Reanalysis Land Component, Joint ISWG and LSA-SAF Workshop IPMA, Lisbon, 26–28 June, 26–28, 2018.
National Oceanic and Atmosphere Administration National Centers for Environmental Information (NOAA NCEI): Pacific Decadal Oscillation (PDO), NOAA NCEI [data set], https://www.ncdc.noaa.gov/teleconnections/pdo/, last acces: 10 June 2020.
National Oceanic and Atmosphere Administration Physical Sciences Laboratory (NOAA PSL): Monthly or seasonal time series of climate variables, NOAA PSL [data set], http://www.psl.noaa.gov/data/, last acces: 20 June 2020.
Pettitt, A.: A nonparametric approach to the change-point problem, Appl. Stat., 28, 126–135, 1979.
Seneviratne, S. I., Corti, T., Davin, E. L., Hirschi, M., Jaeger, E. B., Lehner, I., Orlowsky, B., and Teuling, A. J.: Investigating soil moisture–climate interactions in a changing climate: A review, Earth Sci. Rev., 99, 125–161, https://doi.org/10.1016/j.earscirev.2010.02.004, 2010.
Sheffield, J., Goteti, G., and Wood, E. F.: Development of a 50-year high-resolution global dataset of meteorological forcings for land surface modeling, J. Climate, 19, 3088–3111, https://doi.org/10.1175/JCLI3790.1, 2006.
Su, Z., Wen, J., Dente, L., van der Velde, R., Wang, L., Ma, Y., Yang, K., and Hu, Z.: The Tibetan Plateau observatory of plateau scale soil moisture and soil temperature (Tibet-Obs) for quantifying uncertainties in coarse resolution satellite and model products, Hydrol. Earth Syst. Sci., 15, 2303–2316, https://doi.org/10.5194/hess-15-2303-2011, 2011.
Su, Z., Timmermans, W., Zeng, Y., Schulz, J., John, V. O., Roebeling, R. A., Poli, P., Tan, D., Kaspar, F., Kaiser-Weiss, A. K., Swinnen, E., Tote, C., Gregow, H., Manninen, T., Riihela, A., Calvet, J. C., Ma, Y., and Wen, J.: AN OVERVIEW OF EUROPEAN EFFORTS IN GENERATING CLIMATE DATA RECORDS, B. Am. Meteorol. Soc., 99, 349–359, https://doi.org/10.1175/BAMS-D-16-0074.1, 2018.
Su, Z., Ma, Y., Chen, X., Dong, X., Du, J., Han, C., He, Y., Hofste, J. G., Li, M., Li, M., Lv, S., Ma, W., Polo, M. J., Peng, J., Qian, H., Sobrino, J., Van der Velde, R., Wen, J., Wang, B., Wang, X., Yu, L., Zhang, P., Zhao, H., Zheng, H., Zheng, D., Zhong, L., and Zeng, Y.: Monitoring Water and Energy Cycles at Climate Scale in the Third Pole Environment (CLIMATE-TPE), Remote Sens.-Basel, 13, 3661, https://doi.org/10.3390/rs13183661, 2021.
Sun, J., Yang, K., and Guo, W.: Why Has the Inner Tibetan Plateau Become Wetter since the Mid-1990s?, J. Climate, 33, 8507–8522, https://doi.org/10.1175/Jcli-D-19-0471.1, 2020.
Tallaksen, L. M. and Van Lanen, H. A. J. (Eds.): Hydrological drought: processes and estimation methods for streamflow and groundwater, Developments in water science, 48, Elsevier Science B. V., Amsterdam, the Netherlands, 2004.
Taylor, K. E., Stouffer, R. J., and Meehl, G. A.: An overview of CMIP5 and the experiment design, B. Am. Meteorol. Soc., 93, 485–498, https://doi.org/10.1175/BAMS-D-11-00094.1, 2012.
Teng, H. F., Luo, Z. K., Chang, J. F., Shi, Z., Chen, S. C., Zhou, Y., Ciais, P., and Tian, H. Q.: Climate change-induced greening on the Tibetan Plateau modulated by mountainous characteristics, Environ. Res. Lett., 16, 064064, https://doi.org/10.1088/1748-9326/abfeeb, 2021.
Van Loon, A. F. and Van Lanen, H. A. J.: A process-based typology of hydrological drought, Hydrol. Earth Syst. Sci., 16, 1915–1946, https://doi.org/10.5194/hess-16-1915-2012, 2012.
Wan, W., Long, D., Hong, Y., Ma, Y., Yuan, Y., Xiao, P., Duan, H., Han, Z., and Gu, X.: A lake data set for the Tibetan Plateau from the 1960s, 2005, and 2014, Scientific Data, 3, 160039, https://doi.org/10.1038/sdata.2016.39, 2016.
Wanders, N., Bierkens, M. F. P., Jong, S. M., Roo, A., and Karssenberg, D.: The benefits of using remotely sensed soil moisture in parameter identification of large-scale hydrological models, Water Resour. Res., 50, 6874–6891, https://doi.org/10.1002/2013WR014639, 2014.
Wang, B., Wu, R., and Lau, K. M.: Interannual variability of Asian summer monsoon: Contrast between the Indian and western North Pacific–East Asian monsoons, J. Climate, 14, 4073–4090, https://doi.org/10.1175/1520-0442(2001)014<4073:IVOTAS>2.0.CO;2, 2001 (data available at: http://apdrc.soest.hawaii.edu/projects/monsoon/seasonal-monidx.html, last acces: 10 March 2021).
Wang, B., Bao, Q., Hoskins, B., Wu, G., and Liu, Y.: Tibetan Plateau warming and precipitation changes in East Asia, Geophys. Res. Lett., 35, L14702, https://doi.org/10.1029/2008GL034330, 2008.
Wang, T., Miao, J., Sun, J., and Fu, Y.: Intensified East Asian summer monsoon and associated precipitation mode shift under the 1.5 ∘C global warming target, Adv. Climate Change Res., 9, 102–111, https://doi.org/10.1016/j.accre.2017.12.002, 2018.
Wang, Z., Duan, A., Yang, S., and Ullah, K.: Atmospheric moisture budget and its regulation on the variability of summer precipitation over the Tibetan Plateau, J. Geophys Res.-Atmos., 122, 614–630, https://doi.org/10.1002/2016JD025515, 2017.
Xie, H. and Zhu, X.: Reference evapotranspiration trends and their sensitivity to climatic change on the Tibetan Plateau (1970–2009), Hydrol. Process, 27, 3685–3693, https://doi.org/10.1002/hyp.9487, 2013.
Xie, H., Ye, J. Liu, X., and E, C.: Warming and drying trends on the Tibetan Plateau (1971–2005), Theor. Appl. Climatol., 101, 241–253, https://doi.org/10.1007/s00704-009-0215-9, 2010.
Xing, Z., Fan, L., Zhao, L., De Lannoy, G., Frappart, F., Peng, J., Li, X., Zeng, J., Al-Yaari, A., Yang, K., Zhao, T., Shi, J., Wang, M., Liu, X., Hu, G., Xiao, Y., Du, E., Li, R., Qiao, Y., Shi, J., Wen, J., Ma, M., and Wigneron, J. P.: A first assessment of satellite and reanalysis estimates of surface and root-zone soil moisture over the permafrost region of Qinghai-Tibet Plateau, Remote Sens. Environ., 206, 112666, https://doi.org/10.1016/j.rse.2021.112666,2021.
Xu, K., Yang, D., Yang, H., Li, Z., Qin, Y., and Shen, Y.: Spatio-Temporal variation of drought in China during 1961–2012: A climatic perspective, J. Hydrol., 526,253–264, https://doi.org/10.1016/j.jhydrol.2014.09.047, 2015.
Xu, Z., Gong, T., and Li, J.: Decadal trend of climate in the Tibetan Plateau-regional Temperature and precipitation, Hydrol. Process, 22, 3056–3065, https://doi.org/10.1002/hyp.6892, 2008.
Xue, Y. K., Ma, Y., and Li, Q.: Land–climate interaction over the Tibetan Plateau, Oxford Research Encyclopedia of Climate Science, https://doi.org/10.1093/acrefore/9780190228620.013.592, 2017.
Yanai, M., Li, C., and Song, Z.: Seasonal heating of the Tibetan Plateau and its effects on the evolution of the Asian summer monsoon, J. Meteorol. Soc. Jpn., 70, 319–351, https://doi.org/10.2151/jmsj1965.70.1B_319,1992.
Yang, K., Ye, B., Zhou, D., Wu, B., Foken, T., Qin, J., and Zhou, Z.: Response of hydrological cycle to recent climate changes in the Tibetan Plateau, Clim. Change, 109, 517–534, https://doi.org/10.1007/s10584-011-0099-4, 2011.
Yao, T., Thompson, L., Yang, W., Yu, W., Gao, Y., Guo, X., Yang, X., Duan, K., Zhao, H., Xu, B., Pu, J., Lu, A., Xiang, Y., Kattel, D., and Joswiak, D.: Different glacier status with atmospheric circulations in Tibetan Plateau and surroundings, Nat. Clim. Change, 2, 663–667, https://doi.org/10.1038/nclimate1580, 2012.
Yao, T., Xue, Y., Chen, D., Chen, F., Thompson, L., Cui, P., and Li, Q.: Recent third pole's rapid warming accompanies cryospheric melt and water cycle intensification and interactions between monsoon and environment: Multidisciplinary approach with observations, modeling, and analysis, B. Am. Meteorol. Soc., 100, 423–444, https://doi.org/10.1175/BAMS-D-17-0057.1, 2019.
Yang, K., Wu, H., Qin, J., Lin, C.,Tang, W., and Chen, Y.: Recent climate changes over the Tibetan Plateau and their impacts on energy and water cycle: A review, Global Planet. Change, 112, 79–91, https://doi.org/10.1016/j.gloplacha.2013.12.001, 2014.
Yin, Y., Wu, S., Zhao, D., Zheng, D., and Pan, T.: Modeled effects of climate change on actual evapotranspiration in different eco-geographical regions in the Tibetan Plateau, J. Geogr. Sci., 23, 195–207, https://doi.org/10.1007/s11442-013-1003-0, 2013.
You, Q., Min, J., Jiao, Y., Sillanpää, M., and Kang, S.: Observed trend of diurnal temperature range in the Tibetan Plateau in recent decades, Int. J. Climatol., 36, 2633–2643, https://doi.org/10.1002/joc.4517, 2016.
Zhang, C., Tang, Q., Chen, D., van der Ent, R., Liu, X., Li, W., and Haile, G. G.: Moisture Source Changes Contributed to Different Precipitation Changes over the Northern and Southern Tibetan Plateau, J. Hydrometeorol., 20, 217–229, https://doi.org/10.1175/Jhm-D-18-0094.1, 2019.
Zhang, D., Huang, J., Guan, X., and Chen, B.: Long-term trends of precipitable water and precipitation over the Tibetan Plateau derived from satellite and surface measurements, J. Quant. Spectrosc. Ra., 122, 64–71, https://doi.org/10.1016/j.jqsrt.2012.11.028, 2013.
Zhang, L. and Zhou, T.: Drought over East Asia: A Review, J. Climate, 28, 3375–3399, https://doi.org/10.1175/Jcli-D-14-00259.1, 2015.
Zhang, Q., Fan, K., Singh, V. P., Sun, P., and Shi, P.: Evaluation of remotely sensed and reanalysis soil moisture against in situ observations on the Himalayan-Tibetan plateau, J. Geophys. Res.-Atmos., 123, 7132–7148, https://doi.org/10.1029/2017jd027763, 2018.
Zhang, Q., Fan, K., and Singh V. P.: Is Himalayan-Tibetan Plateau “drying”? Historical estimations and future trends of surface soil moisture, Sci. Total Environ., 658, 374–384, https://doi.org/10.1016/j.scitotenv.2018.12.209, 2019.
Zhang, X., Ren, Y., Yin, Z., Lin, Z., and Zheng, D.: Spatial and temporal variation patterns of reference evapotranspiration across the Qinghai–Tibetan Plateau during 1971–2004, J. Geophys. Res.-Atmos., 114, D15105, https://doi.org/10.1029/2009JD011753, 2009.
Zeng, J., Li, Z., Chen, Q., Bi, H., Qiu, J., and Zou, P.: Evaluation of remotely sensed and reanalysis soil moisture products over the Tibetan Plateau using in-situ observations, Remote Sens. Environ., 163, 91–110, https://doi.org/10.1016/j.rse.2015.03.008, 2015.
Zeng, J., Shi, P., Chen, K., Ma, H., Bi, H., and Cui, C.: Assessment and Error Analysis of Satellite Soil Moisture Products Over the Third Pole, IEEE T. Geosci. Remote, 60, 4405418, https://doi.org/10.1109/TGRS.2021.3116078, 2022.
Zhong, L., Ma, Y., Salama, M. S., and Su., Z.: Assessment of vegetation dynamics and their response to variations in precipitation and temperature in the Tibetan Plateau, Climatic Change, 103, 519–535, https://doi.org/10.1007/s10584-009-9787-8, 2010.
Zhou, C., Zhao, P., and Chen, J.: The Interdecadal Change of Summer Water Vapor over the Tibetan Plateau and Associated Mechanisms, J. Climate, 32, 4103–4119, https://doi.org/10.1175/Jcli-D-18-0364.1, 2019.
Zhou, J., Wang, L., Zhong, X., Yao, T., Qi, J., Wang, Y., and Xue, Y.: Quantifying the major drivers for the expanding lakes in the interior Tibetan Plateau, Sci. Bull., 67, 474–478, https://doi.org/10.1016/j.scib.2021.11.010, 2022.
Zhu, Y., Liu, Y., Wang, W., Vijay, P. S., Ma, X., and Yu, Z.: Three dimensional characterization of meteorological and hydrological droughts and their probabilistic links, J. Hydrol., 578, 124016, https://doi.org/10.1016/j.jhydrol.2019.124016, 2019.
Zwieback, S., Paulik, C., and Wagner, W.: Frozen soil detection based on advanced scatterometer observations and air Temperature data as part of soil moisture retrieval, Remote Sens.-Basel, 7, 3206–3231, https://doi.org/10.3390/rs70303206, 2015.