the Creative Commons Attribution 4.0 License.
the Creative Commons Attribution 4.0 License.
 | 13 Jul 2022
Characterizing natural variability in complex hydrological systems using passive microwave-based climate data records: a case study for the Okavango Delta
Robin van der Schalie
Mendy van der Vliet
Clément Albergel
Wouter Dorigo
Piotr Wolski
Richard de Jeu
The Okavango River system in southern Africa is known for its strong interannual variability of hydrological conditions. Here, we present how this is exposed in surface soil moisture, land surface temperature, and vegetation optical depth as derived from the Land Parameter Retrieval Model, using an inter-calibrated, long-term, multi-sensor passive microwave satellite data record (1998–2020). We also investigate how these interannual variations relate to state-of-the-art climate reanalysis data from ERA5-Land. We analysed both the upstream river catchment and the Okavango delta, supported by independent data records of discharge measurements, precipitation, and vegetation dynamics observed by optical satellites. The seasonal vegetation optical depth anomalies have a strong correspondence with the MODIS leaf area index (correlation catchment: 0.74, delta: 0.88). Land surface temperature anomalies derived from passive microwave observations match best with those of ERA5-Land (catchment: 0.88, delta: 0.81) as compared to MODIS nighttime land surface temperature (LST) (catchment: 0.70, delta: 0.65). Although surface soil moisture anomalies from passive microwave observations and ERA5-Land correlate reasonably well (catchment: 0.72, delta: 0.69), an in-depth evaluation over the delta uncovered situations where passive microwave satellites record strong fluctuations, while ERA5-Land does not. This is further analysed using information on inundated area, river discharge, and precipitation. The passive microwave soil moisture signal demonstrates a response to both the inundated area and precipitation. ERA5-Land however, which, by default, does not account for any lateral influx from rivers, only shows a response to the precipitation information that is used as forcing. This also causes the reanalysis model to miss record low land surface temperature values as it underestimates the latent heat flux in certain years. These findings demonstrate the complexity of this hydrological system and suggest that future land surface model generations should also include lateral land surface exchange. Also, our study highlights the importance of maintaining and improving climate data records of soil moisture, vegetation, and land surface temperature from passive microwave observations and other observation systems.
- Article
(3222 KB) - Full-text XML
- BibTeX
- EndNote


Long-term data records of key components of the climate system, known as essential climate variables (ECV), are important for improving our understanding and predictability of climate behaviour at different timescales (Hollmann et al., 2013; Bojinski et al., 2014). These records can help us to determine the root causes of observed climate change, e.g. natural or anthropogenic, assess its impacts and associated risks, and support mitigation and adaptation activities. In 2008, the European Space Agency (ESA) started the Climate Change Initiative programme (CCI) to develop these ECVs from satellite data records. This was done in response to the United Nations Framework Convention on Climate Change (UNFCCC) need for systematic monitoring of the climate system. Today, the CCI programme covers 21 satellite-based ECV records (projects https://www.esa.int/, last access: September 2021).
Surface soil moisture (SSM) is one of these ESA CCI ECVs. These records are based on a fusion of both passive (PMW) and active microwave satellite retrievals (Dorigo et al., 2017). The current version 6.1 spans from 1979 until 2020 (Scanlon et al., 2021), and contains three separate SSM products, which are derived from active, passive, and a combination of active and passive sensors. The methodology and evaluation of the harmonization and merging of the soil moisture retrievals from multiple satellites are described by Gruber et al. (2019). ESA CCI SSM data have been used for more than 10 years as the baseline for the annual evaluation and interpretation of global SSM conditions, as reported in the leading “State of the Climate” reports (Van der Schalie et al., 2021a) that are published as a Supplement to the Bulletin of the American Meteorological Society. Three datasets are produced as part of the passive input for the ESA CCI SM, which is SSM (SSMMW), but also land surface temperature (LSTMW), and vegetation optical depth (VODMW).
SSMMW datasets have been extensively evaluated with ground observations, models, other satellite products, and related ECVs, like precipitation (e.g. Hirschi et al., 2021; Beck et al., 2021; Dorigo et al., 2015; Al-Yaari et al., 2019; Albergel et al., 2013; Loew et al., 2013). VODMW has been used in multiple studies with a focus on seasonal and interannual vegetation dynamics (e.g. Liu et al., 2015; Moesinger et al., 2020; Teubner et al., 2019) or specifically on L-band VOD characteristics (e.g. Schwank et al., 2021; Bousquet et al., 2021; Rodríguez-Fernández et al., 2018). Research on the quality of LSTMW (e.g. Holmes et al., 2009, 2015) remains limited. The robustness of the interannual variability signals within these multi-decadal data records is still not always clear and a combined assessment of all three variables is necessary for understanding these datasets, as the current joint retrieval algorithm makes their values fundamentally intertwined (Owe et al., 2008). Such information provides unique opportunities for both monitoring and seasonal forecasting, e.g. over Africa (e.g. Cook et al., 2021).
The purpose of this paper is to improve insight into the interannual signals of the SSMMW, LSTMW and VODMW by presenting a case study over a region with a complex hydrological system, i.e. the Okavango, and how their skill compares to state-of-the-art climate reanalysis data from ERA5-Land (Muñoz Sabater, 2019; Muñoz-Sabater et al., 2021). ERA5-Land aims to quantify the water and energy cycles over land in a consistent manner, therefore, allowing the characterization of trends and anomalies. Although ERA5-Land (E5) data are known to be of high quality in many regions around the globe, for use in any specific regions, these need to be properly evaluated. Therefore, this dataset does not only function as a benchmark in this study, but will also be analysed in more detail to evaluate its ability to properly detect the natural dynamics and variability in the Okavango and how this compares to the signal of the passive microwave-based datasets. Other datasets are used as support for determining which dataset (i.e. either PMW or E5L estimates of the same variable) is more likely to reflect true conditions. This research can help to improve the synergy between Earth Observation (EO) datasets and land surface models, and to identify both strengths and shortcomings of either one.
More specifically, the Okavango delta and Okavango River catchment in southern Africa were selected as the study areas. The Okavango delta (Republic of Botswana, 2013) consists of permanent marshlands and seasonally flooded plains, and is one of the few endorheic “delta” systems (geomorphologically, Okavango delta is an alluvial fan, Kgathi et al., 2006) that does not flow into the ocean. It is an exceptional example of the interaction between climatic, hydrological, and biological processes leading to a unique mix of flora and fauna, and has therefore been included in the UNESCO World Heritage List since 2014. Three features in the local hydrological system stand out, i.e. the strong interannual variability, the lateral water influx component of the Okavango River into the delta, and the seasonal characteristics with a lag between rainfall, river discharge, and flooding. Unfortunately, it is expected that global warming will affect this natural variability in the hydrological cycle over the Okavango delta (Wolski et al., 2012, 2014), for example, reducing high-water periods like in 2009–2011. These kinds of negative impacts increase the need for reliable monitoring capabilities.
The structure of the paper is as follows. Section 2 introduces the study area and includes the exact regions of interest (ROIs) that are used for the data extraction. Section 3.1 describes the passive microwave data and other data sources. Section 3.2 explains the methodology concerning the inter-calibration (Sect. 3.2.1), the Land Parameter Retrieval Model (LPRM, Sect. 3.2.2), the evaluation of the dataset anomalies (Sect. 3.2.3), and the evaluation of the river, flood, and precipitation contribution to SSM anomalies over the Okavango delta (Sect. 3.2.4). Sections 4–6 provide the Results, Discussion and Conclusions of these different steps.
With a length of approximately 1600 km, the Okavango River is one of the largest in southern Africa (Muzungaire et al., 2012). The river is known globally for its large terminating inland “delta”. The Okavango delta is a large seasonally pulsed inland wetland, a mixture of aquatic vegetation, open water, and dry land with an actively inundated area covering a part of the 28 000 km2 alluvial cone (Ringrose et al., 1988).

Figure 1The research area comprising ROI1 (a part of the upstream area of the Cubango and the Cuito rivers) and ROI2 (the surrounding of the Okavango delta) in relation to the Okavango drainage basin (grey). The black dot marks the location of the discharge station at Mohembo.
In line with both the interannual variation in local and upstream rainfall and the longer term effects of surface–groundwater interactions, substantial interannual variability in the delta's inundated area was recorded over the period 1932–2000 (Wolski and Murray-Hudson, 2008), with annual minima of about 3000 km2 up to annual maxima of 12 000 km2 (Wolski et al., 2017; Gumbricht et al., 2004; McCarthy et al., 2003). Whereas estimates for the total annual water budget stemming from direct rainfall in the Okavango delta ranges between 25 % to 50 %, the Okavango River inflow accounts for the other 50 % to 75 % (McCarthy et al., 1998, 2000; Ashton, 2000; Ashton and Neal, 2003; Wolski et al., 2006).
In this study, we focus on only two perennial rivers in the Okavango catchment – the Cubango River and the Cuito River (Ashton and Neal, 2003). Data were extracted from the catchment area within ROI1 of Fig. 1. These rivers originate in Angola and are a vital lifeline to the Okavango delta, with an average yearly inflow at Mohembo of 9863 millions of m3 (approximately 300 m3 s−1) in the period 1932–2001 and a 71.4 % contribution to the total water budget of the delta.
The Angolan part of the basin is characterized by a subtropical climate, while in Botswana and Namibia, parts are classified as semi-arid (Kgathi et al., 2006). During drought years in the 1980s and 1990s, the annual inflow at Mohembo reduced up to 45 % (McCarthy et al., 2000; Ashworth, 2002; Ashton, 2003; Ashton and Neal, 2003), which then coincided with proportional declines of the Okavango delta outflow to the Thamalakane and Boteti rivers (Ashton, 2000; Ashworth, 2002; Ashton and Neal, 2003). Throughout these periods, a growing water demand arose in Botswana and Namibia (MGDP, 1997; Ashton, 2003). Overall, the dry phase was caused by multi-decadal oscillations in rainfall and was likely related to processes of internal variability in the climate system (Wolski et al., 2012).
ROI1 and ROI2 were chosen to study how their significantly different water influxes affect the signal of the data sources used in the evaluation. The delta is of particular interest as it is mostly driven by a strong and highly variable lateral influx from the Okavango River that creates a pattern of seasonally varying wetness that is asynchronous or off-phase with the rainy season.
3.1 Data
3.1.1 Passive microwave observations
The three main variables that are used for the analysis are surface soil moisture (SSMMW), vegetation optical depth (VODMW), and land surface temperature (LSTMW). These variables are derived from passive microwave observations from multiple satellite sensors that observe in similar frequencies and overlap in time.
Table 1Overview and characteristics of passive microwave satellite sensors used in the study.

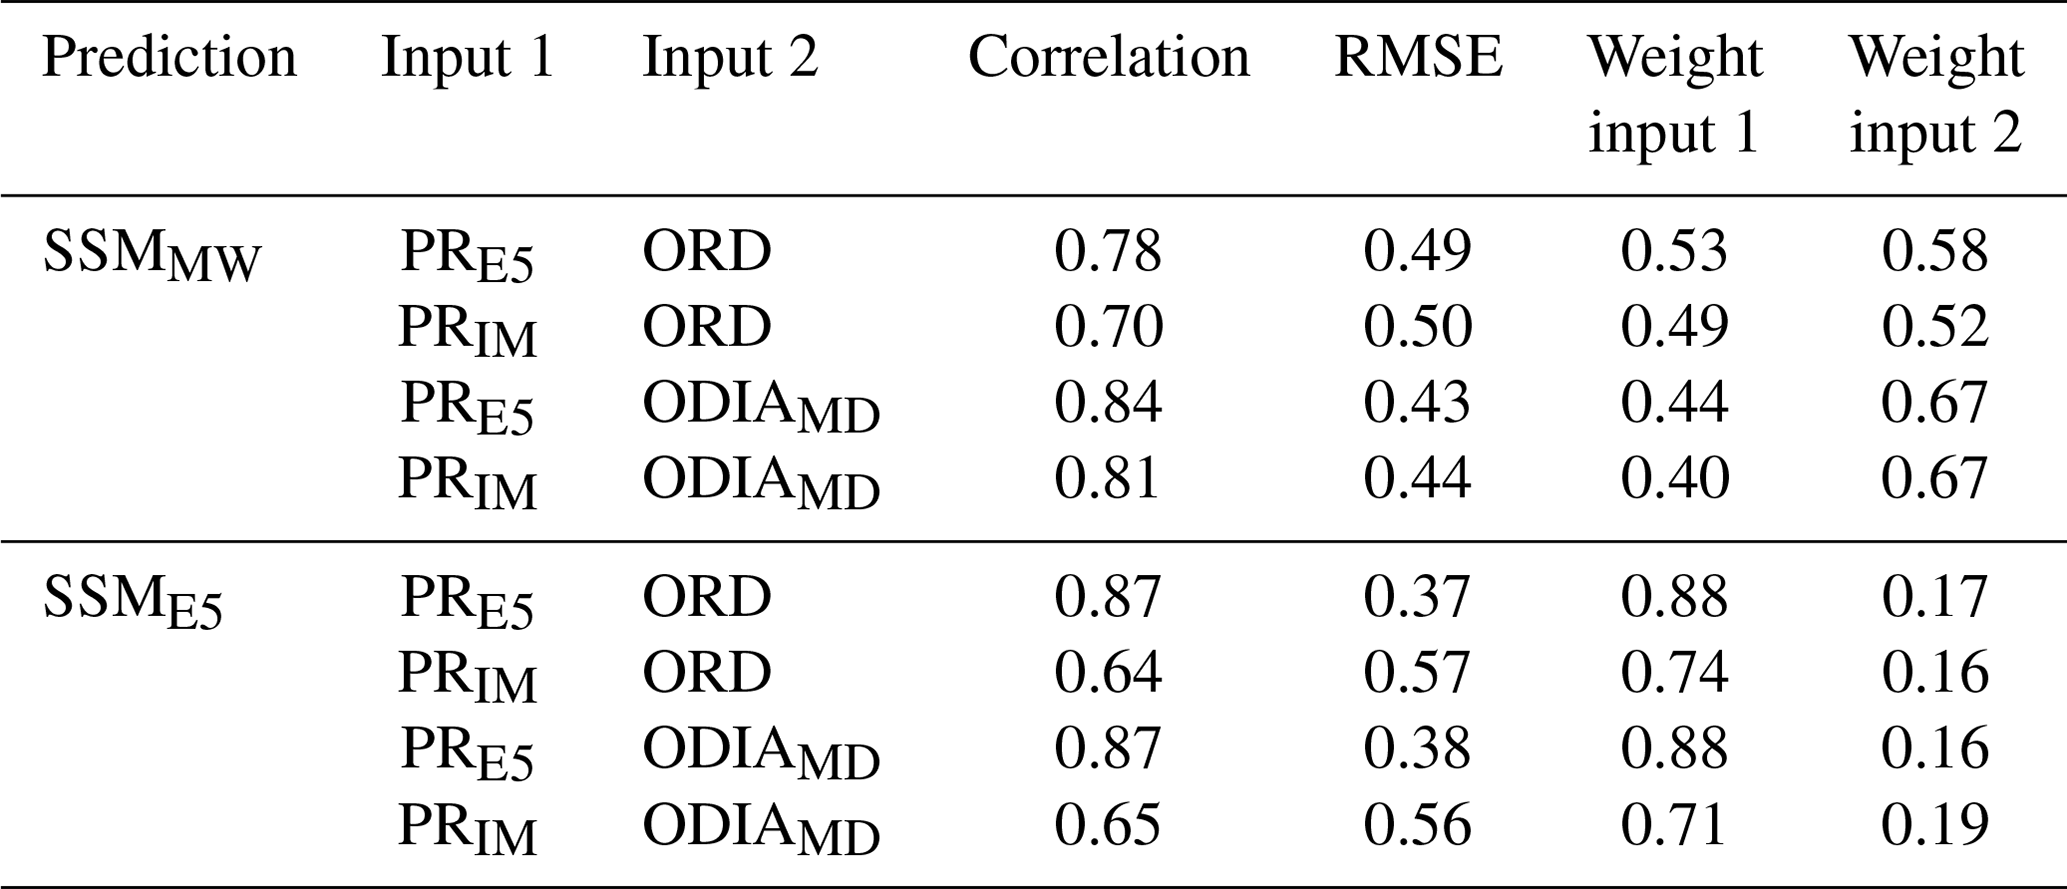
Table 2Results of the multiple linear regression for estimating the relationships between the z-score anomalies of SSM, PR, ORD, and ODIAMD over ROI2.
The Advanced Microwave Scanning Radiometer for EOS (AMSR-E, Kawanishi et al., 2003) is a 12-channel, six-frequency, passive microwave radiometer developed by the Japan Aerospace Exploration Agency (JAXA) and was active between 2002 and 2011. AMSR-E is part of the payload carried onboard the Aqua (EOS PM-1) NASA scientific research satellite, which has a polar orbit with a 01:30/13:30 LT equatorial crossing time for ascending/descending swaths. AMSR-E was launched to obtain data to improve our understanding of global-scale water and energy cycles and played a key role in the development of soil moisture retrieval algorithms. For the technical specifics, see Table 1. Only descending brightness temperature data were used for this study, as due to the thermal equilibrium during nighttime, these are more stable and of higher quality (Owe et al., 2008; Van der Schalie et al., 2021b).
The Advanced Microwave Scanning Radiometer 2 (AMSR2, Imaoka et al., 2012) onboard the GCOM-W1 satellite is the follow-up of AMSR-E and was launched in 2012. Although incorporating improvements, both the general setup and orbital characteristics (e.g. overpass times) are similar to AMSR-E (see Table 2). However, there is a gap between AMSR-E and AMSR2 of about 9 months, making a direct intercalibration of time series complicated.
To overcome this gap and to extend the passive microwave observation record back to 1998, we make use of the Tropical Rainfall Measuring Mission's (TRMM, Kummerow et al., 1998) Microwave Imager (TMI). TMI observes in X-band and higher frequencies. TRMM is not in a polar orbit because of its focus on the tropical regions and, therefore, does not cover the entire globe. Data are only available between 40 ∘N and 40 ∘S, and due to its orbital characteristics, have a variable crossing time (see Table 1). To find a good balance between data availability and data stability (the more stable temperature distribution between the soil and vegetation close to thermal equilibrium), only brightness temperature data were used that had a local overpass time between 22:30 and 04:30 LT, to best match AMSR-E and AMSR2.
For this study, we use VODMW and SSMMW derived from X-band brightness temperature data due to its availability on all three sensors, while Ka-band is the main frequency used for the LSTMW. All brightness temperatures were collected and gridded into a 0.25∘ grid for the study area.
3.1.2 Ancillary datasets
In our analysis, we use several ancillary datasets to determine the ability of passive microwave-based satellite data records to correctly capture interannual variations. These ancillary datasets are split into two types.
Firstly, data were used from the ERA5-Land climate reanalysis model (Muñoz Sabater, 2019; Muñoz-Sabater et al., 2021), which is an enhanced resolution (9 km × 9 km) land-only offline rerun of the ECMWF ERA5 climate reanalysis (Hersbach et al., 2020). SSME5, LSTE5, and PRE5 were extracted. For both SSME5 and LSTE5, the Layer 1 (0–7 cm) was used. LAIE5 was excluded from the analysis as it only contained a climatology based on satellite EOs (no interannual variability). ERA5-Land data were extracted from the Copernicus Climate Change Service (C3S) Climate Data Store (CDS). As it has an hourly resolution, the values closest to the satellite overpasses were chosen. Data cover the complete period from 1998 to 2020.
Secondly, independent observational datasets are used, which have the sole purpose of functioning as a benchmark. These consist of the Okavango River discharge measurements (ORD, Okavango Research Institute, 2021), Okavango delta inundated area (ODIAMD), leaf area index (LAIMD, Yang et al., 2006) and nighttime LST (LSTMD, Wan, 2014) from the Moderate Resolution Imaging Spectroradiometer (MODIS), and precipitation from the NASA Global Precipitation mission's Integrated Multi-satellitE Retrievals for GPM (IMERG) product (PRIM, Huffman et al., 2015).
A majority of the water entering the Okavango delta originates from the delta inlet at Mohembo. Therefore, we use ORD from the Mohembo station (see Fig. 1) to indicate the long-term variability of the lateral inflow into the delta. Measurements using E-type gauge plates are done on a regular (fortnightly) basis by the Botswana Department of Water Affairs and the data are shared by the Okavango Research Institute of the University of Botswana. The advantage of using this dataset is that it has a long historical record dating back to 1974. For this study, data were extracted for the 1998–2020 period.
ODIAMD represents the inundated area in the Okavango delta and is derived from shortwave infrared (SWIR) observations from the MODIS sensor (Wolski et al., 2017). More specifically, data for band b7 from the MCD43A4 product were used. Reflectances of training areas are used to dynamically determine the threshold used for the derivations of the inundation. An automated and up-to-date monitoring tool for the flooding extent can also be found online (http://www.okavangodata.ub.bw/, last access: 22 May 2022).
The LAIMD is defined as the one-sided green leaf area per unit of ground area (Chen and Black, 1992; Yang et al., 2006). The LAIMD for the study area, including both the drainage catchment and the delta, was extracted from the MOD15A2H Version 6 MODIS dataset. This is an 8-daily product that uses the best available pixel within the 8 d period. The product has a spatial resolution of 500 m and the mean was extracted for the complete ROIs.
One kilometre nighttime, about 01:30 LT surface temperature from MODIS, was extracted from the MYD11A2.006 product, which is based on the average over 8 d of all available LSTMD observations. For this study, the mean values of the two areas were extracted. The temporal coverage is from February 2000 to the end of 2020 for the LAIMD and July 2002 to the end of 2020 for the LSTMD.
For PRIM, data were used from the Integrated Multi-satellitE Retrievals for GPM (IMERG, Huffman et al., 2015), which are produced at 0.1∘ resolution. IMERG is a unified algorithm that provides rainfall estimates based on a combination of observations from multiple passive microwave sensors, infrared sensors, and precipitation gauges. Mean daily data were used from the GPM_3IMERGDF version 6, covering June 2000 to December 2020.
3.2 Methods
3.2.1 Intercalibration of PMW brightness temperatures
The intercalibration of AMSR-E, AMSR2, and TRMM is based on the methodology described in Van der Schalie et al. (2021b). In this approach, a two-step linear regression model is used, which first defines a global slope and afterwards a local intercept. Secondly, it uses a cost function that not only minimizes the differences between brightness temperatures of the individual polarizations, i.e. vertical (V) and horizontal (H), but also for the ratio between the two. This is because the Land Parameter Retrieval Model (LPRM, see next section) used for the SSMMW, VODMW, and LSTMW retrievals is very sensitive to the polarization ratio. Inconsistencies in this ratio between different sensors can lead to an imbalance in how the radiative transfer model distinguishes between the emission from the soil and vegetation, respectively, leading to biases in the resulting retrievals. This intercalibration methodology was previously only applied only to the Ku-, K-, and Ka-band, but is here also used for application to the X-band data in the same way.
More specifically, the following cost function is minimized in the linear regression instead of a standard least squares approach:
with:
where TB is the brightness temperature for the two polarizations and from the base (s1) and calibrated (s2) satellite. The α and β are the slope and intercept for the linear regression. The T refers to the time steps with overlapping observations for a single location.
After retrieving sensor-specific SSMMW, VODMW and LSTMW from the inter-calibrated TB, a linear regression is applied between the different sensors using their respective overlap to remove any leftover inconsistencies. Improved inter-calibration between sensors can lead to a reduced need for break corrections (e.g. Preimesberger et al., 2020) and help to better address related issues at the source.
As this study focuses on anomalies at a seasonal timescale, the temporal coverage obtained by the current three sensors is sufficient. However, as was shown by Van der Schalie et al. (2021b) and as is done for the passive microwave-based data input for the ESA CCI SM, other sensors like GPM, FengYun-3B, and FengYun-3D can be included without issues, resulting in improved revisit times and coverage.
3.2.2 Land Parameter Retrieval Model
The Land Parameter Retrieval Model (LPRM, Owe et al., 2008) is a retrieval algorithm that simultaneously solves for SSMMW, VODMW, and LSTMW without the use of any ancillary data sources on vegetation or temperature. The model is based on the tau omega (τ–ω) model (Mo et al., 1982), which simulates the top-of-atmosphere brightness temperatures by modelling the individual contribution of the soil, vegetation, and atmosphere. LPRM mainly distinguished itself from other algorithms through the analytical derivation of the VOD (Meesters et al., 2005) and the use of Ka-band observations for the LSTMW (Holmes et al., 2009). Here, we use version 6.0 of LPRM, as developed by Van der Schalie et al. (2017).
LPRM is currently the main algorithm used for all the passive microwave-based SSM retrievals in ESA CCI SM (Dorigo et al., 2017). Due to its unique analytical solution for the derivation of VODMW that uses no external source of information for the vegetation, LPRM has also been used in several studies of long-term vegetation dynamics (Liu et al., 2012, 2015), land degradation (Liu et al., 2013; Van Marle et al., 2017), and the development of climate data records of VODMW, like the VOD Climate Archive (VODCA, Moesinger et al., 2020).
3.2.3 Evaluation of anomalies
To have a better understanding of the quality of the different datasets in detecting interannual variability and anomalies, a two-step comparison analysis is done. First, the anomalies are visualized over time and their dynamics assessed. Second, the relations between related datasets are quantified using correlations and visualized using density plots. This is done separately for the catchment and the delta.
The SSMMW is compared to the SSME5, both representative of the moisture conditions in the first few centimetres of the soil. As this is a direct comparison, in this step, the focus will be on their similarity and differences without analysing what causes them. Additionally, an extensive analysis is conducted (Sect. 3.2.4) to determine which of the datasets most likely reflects the ground conditions based on their relation to ORD, ODIAMD, and PR.
For VODMW, there is a comparison with another regularly used satellite-based dataset, LAIMD. Theoretically, the VODMW represents the attenuation of the microwave emission through the vegetation cover, which is related to both the structure and moisture content of the vegetation. The LAIMD is representative of the projected single-sided green leaf area per unit ground area. Although VOD and LAI are fundamentally different, it is assumed that for dynamic and sparsely to moderately vegetated regions, i.e. excluding forests, the X-band also mostly measures the response of the leaves with the microwave signal via the vegetation water content (Jackson and Schmugge, 1991). Further defining the quality and ability of VODMW to detect interannual variability can be especially useful in improving the applicability and understanding of independent vegetation data records based on passive microwave observations like VODCA (Moesinger et al., 2020).
Here, the anomalies of LST from three different sources, e.g. passive microwave (LSTMW), model (LSTE5), and thermal infrared (LSTMD) are evaluated. These represent slightly different parts of the soil surface, being 0–7, 0–0.1, and 0 cm (skin), respectively. The mismatch in depth is also a reason why we choose nighttime comparisons as there is much more thermal stability. When looking over longer periods (e.g. weeks, months), we assume that the slightly different definitions of the soil temperature should still show a similarity in underlying anomalies, as in correlating well.
Because the focus is on the (seasonal) variability over a multi-decadal time span, a 91 d moving average (±45 d) is first applied to the datasets. The climatology for the anomaly calculation is based on the 2003–2020 period, as the LSTMD is only available from 2003 onward and the overall consistency for the baseline is preferred. As the window for the moving average is 91 d, little impact is assumed from data loss due to cloud cover in the MODIS datasets.
It is worth keeping in mind that none of these datasets provide the “truth” or measure exactly the same quantity, therefore, differences are to be expected. In the analysis component (see the following section), extra attention will be given to a specific case in the Okavango delta where a clear divergence is observed between the different SSM datasets.
3.2.4 Analysis of river flooding and precipitation contribution to soil moisture anomalies in the Okavango delta
As further in this study (Sect. 4.1) the signal of the two SSM data sources (SSMMW and SSME5) is shown to diverge over the Okavango delta, an in-depth analysis is set up to explain the main drivers of their respective signals. This can help to better understand what the SSM datasets represent and give users insight into how to use them for their research activities and applications.
The first step is to directly compare the SSM datasets to the ORD, ODIAMD, and both PRE5 and PRIM. These datasets can provide insight into what is the driver of the SSM anomalies in this region. As described in Sect. 2, about 50 %–75 % of the total influx of water into the Okavango delta comes from the ORD, while PR, on average, contributes 25 %–50 %, so we expect to see this reflected in the SSM either via the ORD or the ODIAMD signals.
Following this, a multiple linear regression exercise is conducted. This is done to look into the influence of the ODIAMD, ORD, and PR signals on the SSMMW and SSME5 anomalies in the delta. This allows us to determine the drivers of the SSM anomalies and more importantly, how they differ between the two. Instead of using the absolute anomalies in this analysis, the z-score is preferred as this normalization removes issues with conversion of units and can be interpreted as standardized anomalies. A visualization will also be made of the climatologies from the different datasets, including their 10 and 90 percentiles, to further define the connection and time lag between the signals of the different parameters.
4.1 Soil moisture
Figure 2 shows the anomalies of SSMMW and SSME5 over the Okavango catchment and delta, with Fig. 2e and f comparing them directly to each other in a density plot. In both areas, the two datasets correlate moderately well, 0.72 and 0.70, respectively. In the delta however, a mismatch occurs on some occasions, leading to a visible flat line in the density plot where the anomalies of SSMMW vary, while the anomalies of SSME5 are close to zero (Fig. 2e). The SSMMW anomalies over the catchment and SSME5 anomalies over both the catchment and delta seem to have clear short-term variability, as can be seen from the peaks in the wet season, while the dry season remains mostly stable around zero. Only the anomalies of SSMMW over the delta diverge from this and show a more multi-year variation, with highs in the years around 2011 and lows in the early and late periods of the time period. These cases will be further analysed in Sect. 4.4 in combination with the ORD and PR.
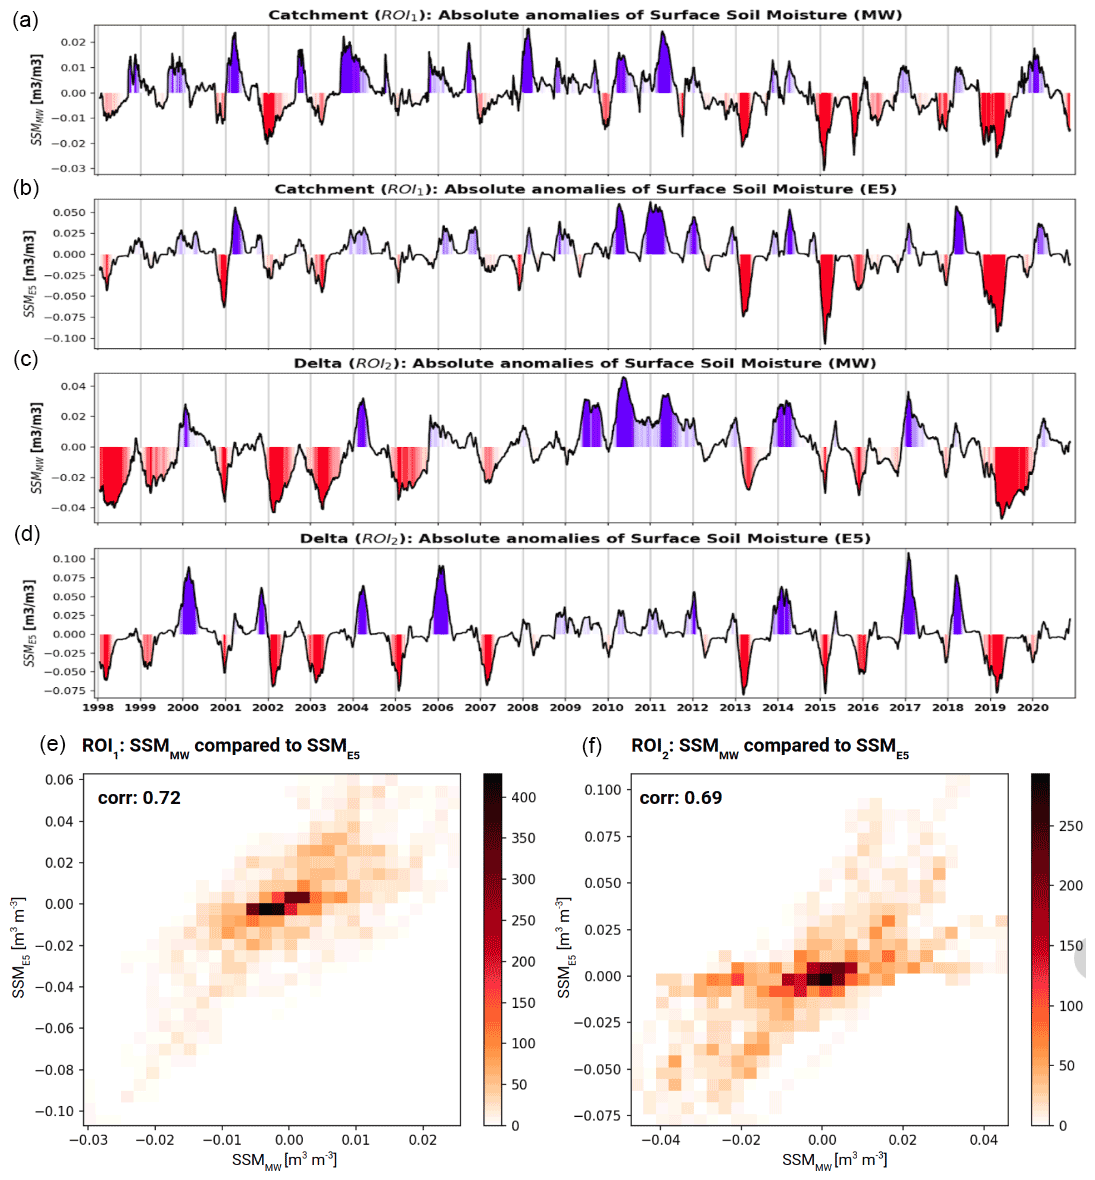
Figure 2SSMMW and SSME5 absolute anomalies over the Okavango catchment (a, b, e), with the intensity of the colouring based on the z-score of the positive (blue) and negative (red) anomalies and the Okavango delta (c, d, f) in time series and density plots. A daily time step is used from the moving average dataset.
The absolute range of the anomalies differs to some extent between the two products: SSMMW anomalies range between −0.03 and 0.025 m3 m−3 in the catchment and −0.05 and 0.05 m3 m−3 in the delta, whereas SSME5 anomalies range between −0.10 and 0.06 m3 m−3 in the catchment and −0.08 and 0.10 m3 m−3 in the delta. However, the dynamics of the signal are very similar.
4.2 Vegetation optical depth
Figure 3 shows the anomalies of VODMW and LAIMD over the Okavango catchment and delta, with Fig. 3e and f again showing a direct comparison in a density plot. The two datasets have a 0.74 correlation over the catchment and up to 0.88 in the delta. Generally, a similar pattern is visible for both regions. One exception can be seen during the 2008 to 2011 period in the catchment, where the VODMW anomaly remains high throughout multiple years, while the overall above average LAIMD anomalies fluctuate to a greater extent. The lowest values in the delta were detected early in the study period, with VODMW recording an almost −0.08 anomaly during 1998 and 2003. This 2003 event is also seen in the LAIMD dataset, while no data are available for 1998. In more recent years, no negative anomalies of that strength have been recorded.
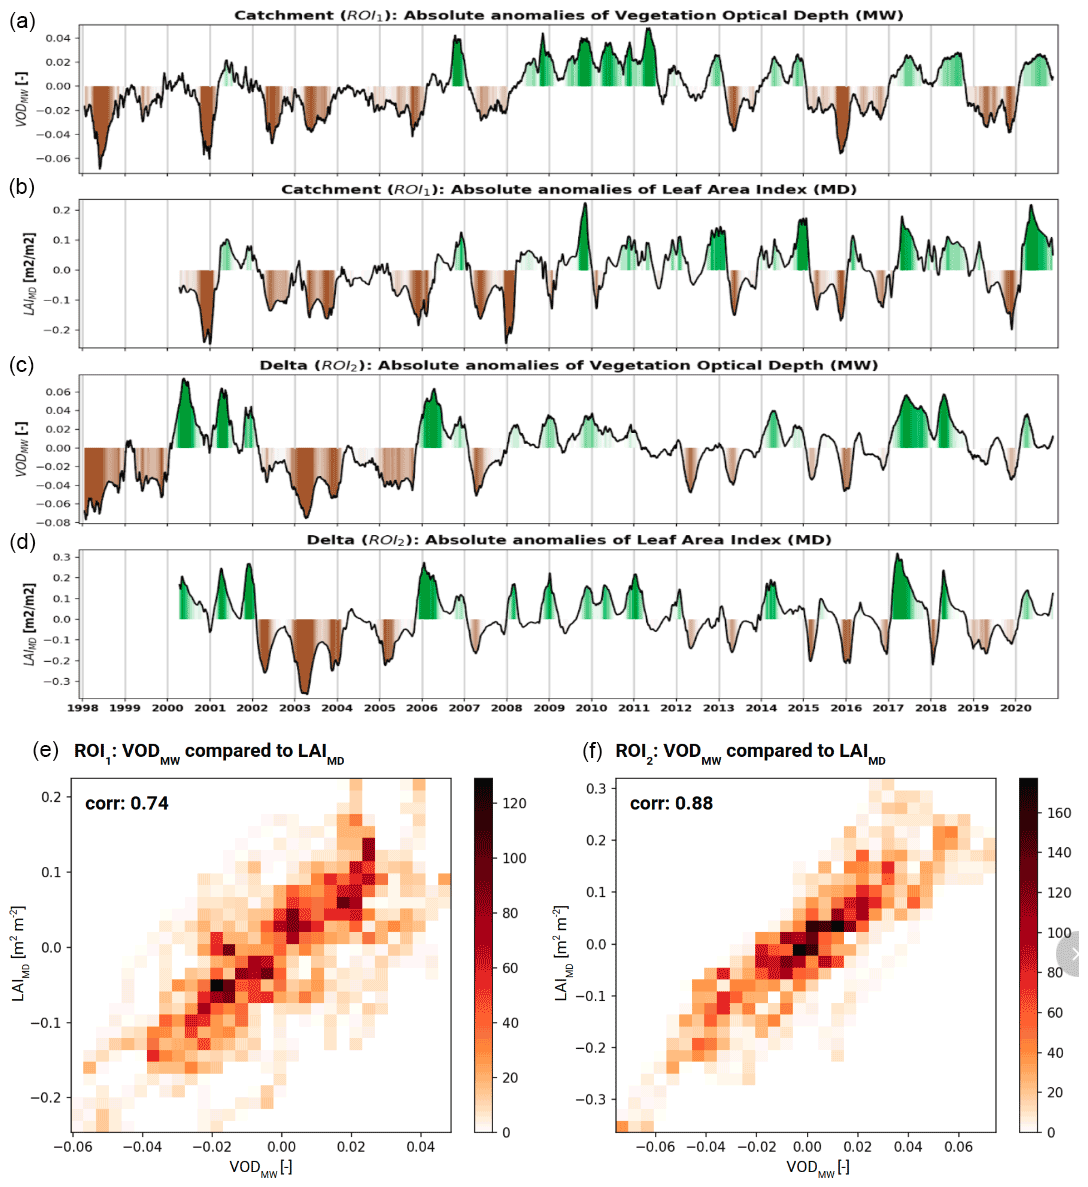
Figure 3VODMW and LAIMD anomalies over the Okavango catchment (a, b, e), with the intensity of the colouring based on the z-score of the positive (green) and negative (brown) anomalies and the Okavango delta (c, d, f) in time series and density plots. A daily time step is used from the moving average dataset.
4.3 Land surface temperature
Figure 4a and b show the anomalies of LSTMW over the Okavango catchment and delta, with Fig. 4b–g showing a direct comparison in a density plot between LSTMW, LSTE5, and LSTMD (time series of LSTE5 and LSTMD anomalies can be found in the Appendix, Fig. A1). Because of the high correlation between LSTMW and LSTE5 of 0.88 in the catchment and 0.81 in the delta, the decision was made to only show the LSTMW time series to focus more on the density plots of the three different products. The correlation of LSTMW against LSTMD is much lower, with 0.64 and 0.26 for both regions, showing a low relation in the catchment. LSTE5 compares better to LSTMD with a correlation of 0.70 in the catchment and 0.65 in the delta, however, this is still significantly lower than the comparison with LSTMW. The absolute ranges in the anomalies as detected by the three products are very similar.
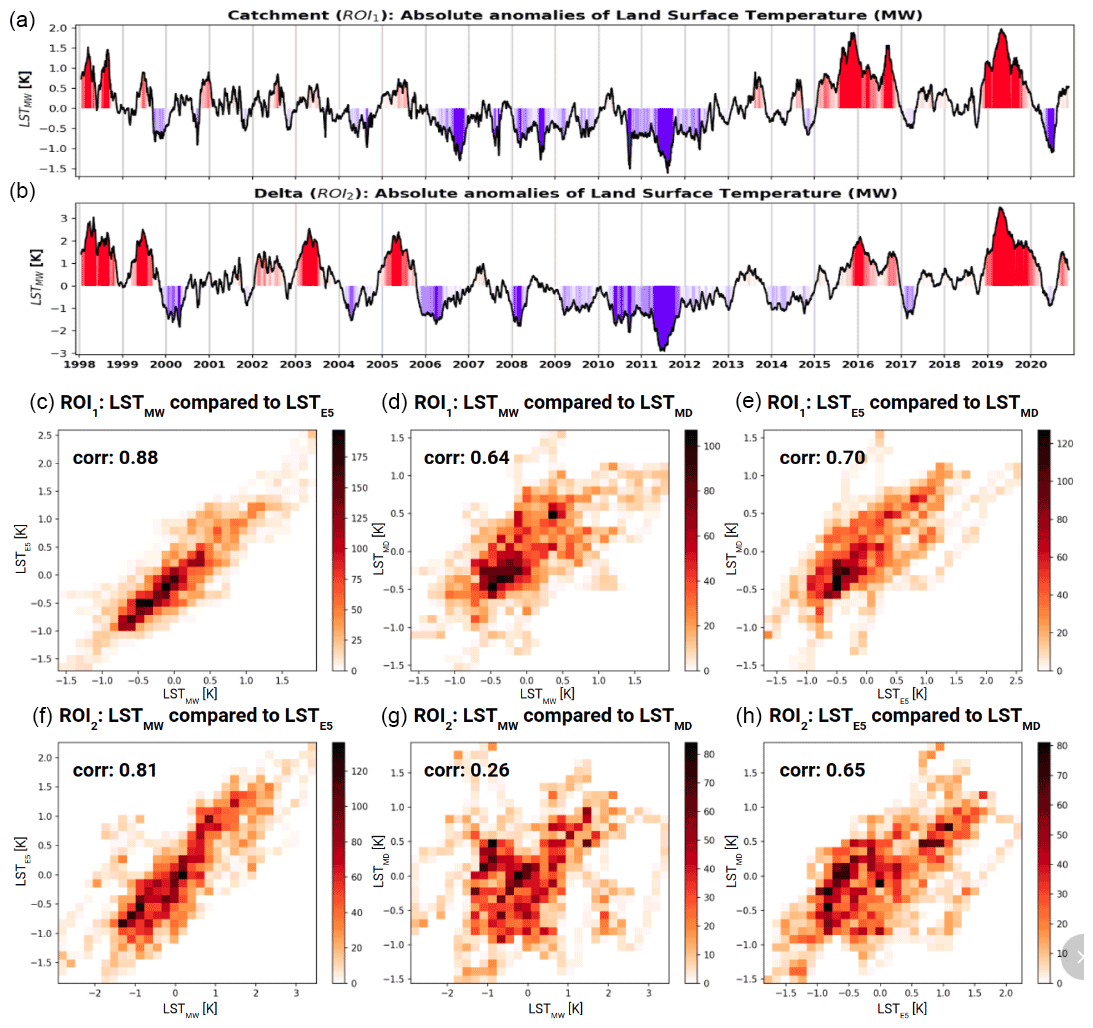
Figure 4LSTMW time series over the Okavango catchment and the Okavango delta (a, b), with the intensity of the colouring based on the z-score of the positive (red) and negative (blue) anomalies. For the density plots; LSTMW compared to LSTE5 (c, f), LSTMW compared to LSTMD (d, g), and LSTE5 compared to LSTMD (e, h). A daily time step is used from the moving average dataset for the density plots.
The slightly lower correlation of LSTMW against LSTE5 in the delta is mostly caused by the period 2010 and 2011, when the LSTE5 anomaly (between −1 and 1 ∘C) is smaller than that of LSTMW (between −3 and −1 ∘C). This breakaway is clearly visible in the density plot of Fig. 4f on the lower left side. Below-average temperatures are recorded for a prolonged period between 2006 and 2014 in both regions. For the delta, the highest temperature anomalies are recorded in 2019 and 1998. In the catchment, this is seen in 2015 and 2019.
4.4 River and precipitation contribution to soil moisture anomalies in the Okavango delta
Figure 5a–c shows the anomalies of the ORD, ODIAMD, and PRE5 over the delta, which have visibly different signals. The ORD shows a strong multi-year signal with especially high values recorded from 2009 to 2012. Outside of that period, with the exception of 2004, values generally lie below the 2003 to 2020 climatology. The OIADMD shows a signal that is relatively similar to that of the ORD, however, smoother with less variability and lagging behind. The PRE5 over the delta shows mostly values around 0 mm during this 2009 to 2012 period, and otherwise varies more dynamically from year to year with values above and below the climatology. Additional PRE5 and PRIM anomaly time series over both the catchment and the delta can be found in the Appendix (Fig. A2).

Figure 5ORD, ODIAMD, and PRE5 time series over the Okavango delta (a–c), with the intensity of the colouring based on the z-score of the positive (blue) and negative (red) anomalies.
Although SSMMW and SSME5 anomalies have an overall correlation of 0.69 in the delta, Fig. 2f shows many occasions where the SSMMW had negative or positive anomalies, while the SSME5 did not diverge from the climatology. To better assess what causes this opposite signal, the climatology (using ±15 d moving average) of different parameters are provided in Fig. 6, including their 10 % and 90 % percentiles. Here, one can see the difference in the dynamics between SSMMW (Fig. 6a) and SSME5 (Fig. 6b). The SSME5 shows a clear relation to the PR datasets (Fig. 6g and h), while the SSMMW still picks up a moisture signal between April and September. When looking at the ORD and OIADMD, these are the moisture-related signals that still show strong variability in this time of the year, indicating that the SSMMW could also contain information from other sources than PR. On a side note, Fig. 6 shows that besides matching well with long-term anomalies, LSTMW and VODMW also have a strong matching intraseasonal signal with LSTE5 and LAIMD, respectively.

Figure 6ROI2 mean climatology (coloured thick line) and both 10 % and 90 % percentiles (black dashed lines) for SSMMW (a), SSME5 (b), LSTMW (c), LSTE5 (d), VODMW (e), LAIMD (f), PRIM (g), PRE5 (h), ODIAMD (i), and ORD (j). Data using a ±15 d moving average were plotted to distinguish between intraseasonal signals.
Table 2 presents the results of a multiple linear regression to determine the drivers of the observed/modelled SSM anomaly signal in the delta, using ODIAMD, ORD, and PR as inputs. The z-score anomalies are used to improve the comparability between the different datasets and their weight. The results show that the weighting for SSMMW consists of a balance between the PR in the delta and the ODIAMD, with an overall slightly higher weight for the ODIAMD, and leading to a maximum correlation of 0.84 when using PRE5 over PRIM. This leads to a RMSE of about 0.44 for the z-score. The SSME5 anomalies are clearly driven by the PRE5 anomalies, reaching a correlation of 0.87. The correlation strongly decreases to 0.64 when the PRE5 is replaced with PRIM, which reflects back in the RMSE of the z-score anomalies, which increases from about 0.37 to 0.57.
Over both the delta and the catchment, a remarkably strong relationship between the LAIMD and VODMW was observed, even though fundamentally, they measure two different things. The relationship is slightly weaker over the catchment where you see more of a buffer effect in the VODMW dataset as compared to the LAIMD. This could be caused by a buildup of woody biomass as this would theoretically be better detected with the VODMW than with the LAIMD. The period of sustained high VODMW in the catchment during the 2008 to 2012 period aligns well with the PRE5, which recorded 5 years of above-average rainfall over the catchment. The ORD shows this increase above the climatology starting only the year afterwards (from 2009 to 2012), showing the lagged response of the system after a prolonged drier period.
The VODMW signal in the delta is more complex: the peaks in VODMW do not coincide with prolonged time spans of high water availability, but seem to peak during shorter periods of increased water availability during overall conditions with medium to low ODIAMD. This can be explained by what the VOD represents: in this case, it is related to biomass that is above the surface. During prolonged periods of high water, a larger extent of these regions are flooded. Therefore, within the 0.25∘ pixel, data that are not corrected for dynamic water bodies, the vegetation covered by these flooded areas might not be properly measured by the VODMW signal as it is also known that VODMW values can be underestimated during flooded conditions (Bousquet et al., 2021). Note that the negative SSMMW and ORD anomalies in 2019 have not led to the same intensity of vegetation decline, while in 2019, the ODIAMD was at a record low in the last 20 years. With the very strong relationship over the delta between the anomalies of both VODMW and LAIMD – two independent satellite-observed datasets – these observations very likely reflect the conditions on the ground. These results show that future use of even longer VODMW records can help monitor complex regions like the Okavango catchment and delta. For example, following the progress on VODCA – which aims to build a data record similar to the ESA CCI SSM for VODMW – future releases will also include the latest calibrated datasets as used here.
Three different sources of LST were tested over the Okavango catchment and delta. The highest correlation can be found between the LSTE5 and LSTMW, which most likely best represent the actual ground conditions. Although LSTMD performs less well, the better correlation of LSTMD against LSTE5 than LSTMW might indicate that the overall best performing dataset is the LSTE5. However, in many cases, an observation-based long-term dataset (e.g. the LSTMW) is still preferred. For example, in 2010 and 2011, the LSTMW has the lowest temperature anomalies on record in the delta, going to −3 K, while the LSTE5 remains more neutral. This is most likely caused by the lack of lateral water influx modelling from the ORD and following ODIAMD in ERA5-Land (Muñoz-Sabater et al., 2021), as shown in Sect. 4.4. The lack of moisture input into the model can lead to an underestimation of the latent heat flux and overestimation of the sensible heat flux, leading to an unrealistically high LSTE5.
In the delta, 2015, 2016, and 2019 have been warm compared to the years before. The LSTMW and LSTE5 both show that these are not unique occurrences as similar high values have been detected on multiple occasions before 2006. These seem to occur during periods of lower ODIAMD, which shows dry anomalies of varying strength in these years. The catchment does see its highest and more prolonged peaks only in the last years, i.e. 2015 and 2019. These high peaks coincide with the strongest negative anomalies found for both SSMMW and SSME5, linking the high temperature and reduced moisture availability.
The precipitation-driven SSM in the catchment aligns closely with SSMMW and SSME5 datasets. Especially in the period after 2010, the signal in the anomalies is very similar. Before 2010, it appears that the SSMMW shows slightly stronger dynamics than SSME5. In the delta, a mismatch is clearly seen between SSME5 and SSMMW, especially with regard to the duration of the dry and wet peaks, but also in their intensity. With the knowledge that about 50 %–75 % of the water flux into the delta comes from the ORD, and about 25 %–50 % from the PR, an analysis using z-score anomalies was conducted to determine the driving signals behind the SSM anomalies, using the ORD, ODIAMD, and PR as inputs. For SSME5, an almost one-to-one relationship was found with the PR, with little to no effects from the ORD or ODIAMD. The SSMMW anomalies, on the other hand, are almost equally driven by PR and ODIAMD, which is much closer to the actual balance between the ORD and PR water fluxes for the delta, as expected from literature.
The almost one-to-one relationship between the SSME5 and PRE5, and lack of signal related to the ORD due to the missing lateral water influx modelling, or alternatively dynamic open water bodies using the ODIAMD, in ERA5-Land, indicates that in a complex region like the Okavango delta, important forcings are missing. This, for example, could also cause the difference in LSTMW and LSTE5 in 2010 and 2011 (not shown) as the model cannot correctly convert the incoming radiation into sensible and latent heat fluxes when the moisture conditions are inaccurate, leading to a false increase of LST. On the other hand, while the SSMMW signal provides users with a better representation of total moisture conditions within the catchment, it can also not be interpreted as a pure SSM signal here as it includes moisture information driven by the ODIAMD. In a dynamic environment such as the Okavango delta, users should therefore clearly define what they require of such datasets to avoid unwanted side effects.
The anomalies of three different parameters, i.e. SSMMW, LSTMW, and VODMW, were evaluated against other satellite-observed datasets and data from the ERA5-Land climate reanalysis. Although SSMMW and SSME5 correlate moderately well, structural differences were detected over the Okavango delta, where SSMMW contains a clear multi-year signal that is not in the SSME5. To determine the cause of this mismatch, an analysis was conducted to determine the impact of three sources of water into the Okavango delta, i.e. the ORD, ODIAMD, and the PR, on the SSM signal. The SSMMW signal appears to be driven about equally by the ODIAMD and the PR, while SSME5 is almost fully driven by the PRE5. This indicates that ERA5-Land does not properly include the lateral influx of the Okavango River and, therefore, the use of SSMMW is preferred in this region.
For the VODMW, a direct comparison against LAIMD was made. Although the two parameters measure two different physical characteristics of the vegetation, their anomalies show a similar response, which were reflected back in their strong correlations (0.74 and 0.88). Over the catchment, a stronger multi-year signal was detected in the VODMW, which could be related to the buildup of biomass, to which VODMW is theoretically more sensitive. For the delta, both datasets are impacted by the increase in open water during long wet periods that can suppress the observed vegetation. This strong similarity, as observed between the two datasets, indicates that it is very likely they are both representative for the in situ conditions.
LSTMW was shown to be of good quality and correlated well with LSTE5 (>0.8). LSTMD still managed to reach a significant correlation with LSTE5, but not with LSTMW, indicating that in general LSTE5 could be of the highest quality of the three when looking at the temporal signal. However, at the record low values in LSTMW over the delta in 2010–2011, corresponding to the peak years of the ORD and ODIAMD, it seems that LSTE5 cannot properly model the sensible and latent heat fluxes because it is missing the lateral water component. This can have a large impact on detecting extremes, which are especially important in the current changing climate.
The findings of this research show the importance of not only relying on climate reanalysis, but also the need for further development and maintenance of observational datasets like the ones derived from passive microwave observations. For example, within the ESA CCI soil moisture datasets, but also the development of new climate data records (CDRs) on VODMW like VODCA. Their ability to properly detect anomalies and extremes is very valuable in climate research and can especially help to improve our insight in complex regions where the current climate reanalysis datasets reach their limitations. With microwave data being available from 1978 onwards, the data can be used for long-term climate studies, near-real-time applications, e.g. monitoring complex natural systems like the Okavango delta, and to constrain climate reanalysis through data assimilation techniques to overcome known model weaknesses.
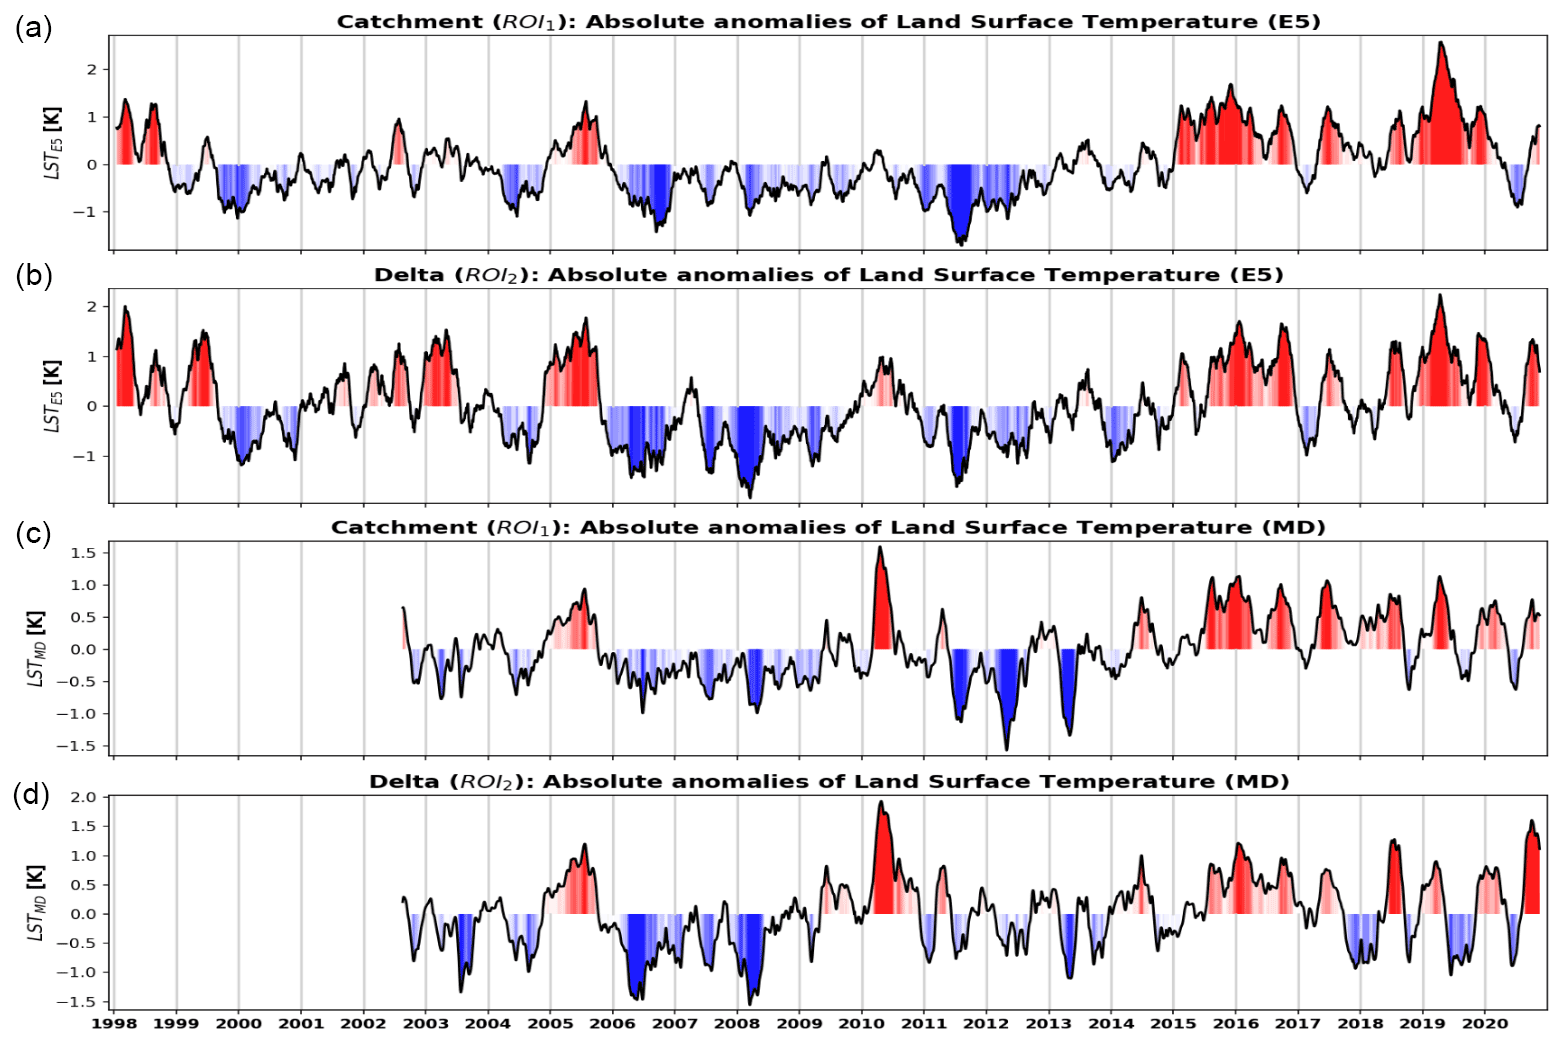
Figure A1LSTE5 (a, b) and LSTIM (c, d) time series over the Okavango catchment and the Okavango delta, with the intensity of the colouring based on the z-score of the positive (red) and negative (blue) anomalies.

Figure A2Time series of PRE5 over the Okavango delta (a) and PRIM over both the Okavango catchment and delta (b, c), with the intensity of the colouring based on the z-score of the positive (blue) and negative (red) anomalies.
Code and data are available on request.
RvdS is the main author of this article and led the conceptualization, data curation, formal analysis, validation, visualization, and writing of the original draft. MvdV provided support for the conceptualization of the study and contributed to the writing and the visualization in Sect. 2 on the research area. CA supported this study by reviewing the article and reforming the conceptualization to better put the research in perspective of the scientific community. WD contributed by extensively reviewing the manuscript. PW provided support in the understanding of the Okavango region, data provision for ODIAMD, and reviewing of the article. RdJ was active in the conceptualization of the study and writing of the Introduction.
The contact author has declared that none of the authors has any competing interests.
Publisher's note: Copernicus Publications remains neutral with regard to jurisdictional claims in published maps and institutional affiliations.
This article is part of the special issue “Microwave remote sensing for improved understanding of vegetation–water interactions (BG/HESS inter-journal SI)”. It is not associated with a conference.
This study and the authors were supported by ESA's Climate Change Initiative for Soil Moisture (contract nos. 4000104814/11/I-NB and 4000112226/14/I-NB).
This research has been supported by the European Space Agency (grant nos. 4000104814/11/I-NB and 4000112226/14/I-NB).
This paper was edited by Tim van Emmerik and reviewed by Victor Pellet and one anonymous referee.
Albergel, C., Dorigo, W., Reichle, R. H., Balsamo, G., De Rosnay, P., Muñoz-Sabater, J., Isaksen, L., De Jeu, R., and Wagner, W.: Skill and global trend analysis of soil moisture from reanalyses and microwave remote sensing, J. Hydrometeorol., 14, 1259–1277, 2013.
Al-Yaari, A., Wigneron, J. P., Dorigo, W., Colliander, A., Pellarin, T., Hahn, S., Mialon, A., Richaume, P., Fernandez-Moran, R., Fan, L., and Kerr, Y. H.: Assessment and inter-comparison of recently developed/reprocessed microwave satellite soil moisture products using ISMN ground-based measurements, Remote Sens. Environ., 224, 289–303, 2019.
Ashton, P.: Potential environmental impacts associated with the proposed abstraction of water from the Okavango River in Namibia, Southern African Journal of Aquatic Sciences, 25, 175–182, https://doi.org/10.2989/160859100780177776, 2000.
Ashton, P.: The search for an equitable basis for water sharing in the Okavango River basin, chap. 7, in: International Waters in Southern Africa, UNUP-1077, ISBN 92-808-1077-4, https://collections.unu.edu/eserv/UNU:2428/nLib9280810774.pdf (last access: 22 May 2022), 164–188, 2003.
Ashton, P. and Neal, M.: An overview of key strategic issues in the Okavango basin, in: Transboundary Rivers, Sovereignty and Development: Hydropolitical Drivers in the Okavango River Basin, 31–64, African Water Issues Research Unit/Green Cross International/University of Pretoria, ISBN-10: 0620304979, ISBN-13: 978-0620304979, 31–63, 2003.
Ashworth, M.: Hydrology. Maun Groundwater Development Programme (MGDP) Phase 2. Gaborone: Water Resources Consultants, https://vuawater.com/Case-Study-Files/Africa/Maun_UBR_Well_Field_Management-2004.pdf (last access: 22 May 2022), 2002.
Beck, H. E., Pan, M., Miralles, D. G., Reichle, R. H., Dorigo, W. A., Hahn, S., Sheffield, J., Karthikeyan, L., Balsamo, G., Parinussa, R. M., van Dijk, A. I. J. M., Du, J., Kimball, J. S., Vergopolan, N., and Wood, E. F.: Evaluation of 18 satellite- and model-based soil moisture products using in situ measurements from 826 sensors, Hydrol. Earth Syst. Sci., 25, 17–40, https://doi.org/10.5194/hess-25-17-2021, 2021.
Berg, W., Bilanow, S., Chen, R., Datta, S., Draper, D., Ebrahimi, H., Farrar, S., Jones, W.L., Kroodsma, R., McKague, D., and Payne, V.: Intercalibration of the GPM microwave radiometer constellation, J. Atmos. Ocean. Tech., 33, 2639–2654, 2016.
Bojinski, S., Verstraete, M., Peterson, T.C., Richter, C., Simmons, A., and Zemp, M.: The concept of essential climate variables in support of climate research, applications, and policy, B. Am. Meteorol. Soc., 95, 1431–1443, 2014.
Bousquet, E., Mialon, A., Rodriguez-Fernandez, N., Prigent, C., Wagner, F. H., and Kerr, Y. H.: Influence of surface water variations on VOD and biomass estimates from passive microwave sensors, Remote Sens. Environ., 257, 112345, 2021.
Chen, J. M. and Black, T. A.: Defining leaf area index for non-flat leaves, Plant Cell Environ., 15, 421–429, 1992.
Cook, B. I., Slinski, K., Peters-Lidard, C., McNally, A., Arsenault, K., and Hazra, A.: The Efficacy of Seasonal Terrestrial Water Storage Forecasts for Predicting Vegetation Activity over Africa, J. Hydrometeorol., 22, 3121–3137, 2021.
Dorigo, W., Wagner, W., Albergel, C., Albrecht, F., Balsamo, G., Brocca, L., Chung, D., Ertl, M., Forkel, M., Gruber, A., and Haas, E.: ESA CCI Soil Moisture for improved Earth system understanding: State-of-the art and future directions, Remote Sens. Environ., 203, 185–215, 2017.
Dorigo, W. A., Gruber, A., De Jeu, R. A. M., Wagner, W., Stacke, T., Loew, A., Albergel, C., Brocca, L., Chung, D., Parinussa, R. M., and Kidd, R.: Evaluation of the ESA CCI soil moisture product using ground-based observations, Remote Sens. Environ., 162, 380–395, 2015.
Gruber, A., Scanlon, T., van der Schalie, R., Wagner, W., and Dorigo, W.: Evolution of the ESA CCI Soil Moisture climate data records and their underlying merging methodology, Earth Syst. Sci. Data, 11, 717–739, https://doi.org/10.5194/essd-11-717-2019, 2019.
Gumbricht, T., Wolski, P., Frost, P., and McCarthy, T. S.: Forecasting the spatial extent of the annual flood in the Okavango delta, Botswana, J. Hydrol., 290, 178–191, 2004.
Hersbach, H., Bell, B., Berrisford, P., Hirahara, S., Horányi, A., Muñoz-Sabater, J., Nicolas, J., Peubey, C., Radu, R., Schepers, D., and Simmons, A.: The ERA5 global reanalysis, Q. J. Roy. Meteorol. Soc., 146, 1999–2049, 2020.
Hirschi, M., Nicolai-Shaw, N., Preimesberger, W., Scanlon, T., Dorigo, W., and Kidd, R.: Product Validation and Intercomparison Report (PVIR), Supporting Product version v06.1, Deliverable ID: D4.1 Version 2, https://admin.climate.esa.int/media/documents/ESA_CCI_SM_D4.1_v2_PVIR_v6.1_issue_1.0.pdf (last access: 22 May 2022), 2021.
Hollmann, R., Merchant, C. J., Saunders, R., Downy, C., Buchwitz, M., Cazenave, A., Chuvieco, E., Defourny, P., de Leeuw, G., Forsberg, R., and Holzer-Popp, T.: The ESA climate change initiative: Satellite data records for essential climate variables, B. Am. Meteorol. Soc., 94, 1541–1552, 2013.
Holmes, T. R. H., De Jeu, R. A. M., Owe, M., and Dolman, A. J.: Land surface temperature from Ka band (37 GHz) passive microwave observations. J. Geophys. Res.-Atmos., 114, https://doi.org/10.1029/2008JD010257, 2009.
Holmes, T. R. H., Crow, W. T., Hain, C., Anderson, M. C., and Kustas, W. P.: Diurnal temperature cycle as observed by thermal infrared and microwave radiometers, Remote Sens. Environ., 158, 110–125, 2015.
Huffman, G. J., Bolvin, D. T., Braithwaite, D., Hsu, K., Joyce, R., Xie, P., and Yoo, S. H.: NASA global precipitation measurement (GPM) integrated multi-satellite retrievals for GPM (IMERG). Algorithm Theoretical Basis Document (ATBD) Version 4, https://gpm.nasa.gov/sites/default/files/document_files/IMERG_ATBD_V4.5.pdf (last access: 22 May 2022), p. 26, 2015.
Imaoka, K., Maeda, T., Kachi, M., Kasahara, M., Ito, N., and Nakagawa, K.: November. Status of AMSR2 instrument on GCOM-W1, in: Earth Observing Missions and Sensors: Development, Implementation, and Characterization II, Vol. 8528, International Society for Optics and Photonics, https://doi.org/10.1117/12.977774, p. 852815, 2012.
Jackson, T. J. and Schmugge, T. J.: Vegetation effects on the microwave emission of soils, Remote Sens. Environ., 36, 203–212, 1991.
Kawanishi, T., Sezai, T., Ito, Y., Imaoka, K., Takeshima, T., Ishido, Y., Shibata, A., Miura, M., Inahata, H., and Spencer, R. W.: The Advanced Microwave Scanning Radiometer for the Earth Observing System (AMSR-E), NASDA's contribution to the EOS for global energy and water cycle studies, IEEE T. Geosci. Remote, 41, 184–194, 2003.
Kgathi, D. L., Kniveton, D., Ringrose, S., Turton, A. R., Vanderpost, C. H. M., Lundqvist, J., and Seely, M.: The Okavango; a river supporting its people, environment and economic development, J. Hydrol., 331, 3–17, 2006.
Kummerow, C., Barnes, W., Kozu, T., Shiue, J., and Simpson, J.: The tropical rainfall measuring mission (TRMM) sensor package, J. Atmos. Ocean. Tech., 15, 809–817, 1998.
Liu, Y. Y., Dorigo, W. A., Parinussa, R. M., de Jeu, R.A., Wagner, W., McCabe, M. F., Evans, J. P., and Van Dijk, A. I. J. M.: Trend-preserving blending of passive and active microwave soil moisture retrievals, Remote Sens. Environ., 123, 280–297, 2012.
Liu, Y. Y., van Dijk, A. I., McCabe, M. F., Evans, J. P., and de Jeu, R. A.: Global vegetation biomass change (1988–2008) and attribution to environmental and human drivers, Global Ecol. Biogeogr., 22, 692–705, 2013.
Liu, Y. Y., Van Dijk, A. I., De Jeu, R. A., Canadell, J. G., McCabe, M. F., Evans, J. P., and Wang, G.: Recent reversal in loss of global terrestrial biomass, Nat. Clim. Change, 5, 470–474, 2015.
Loew, A., Stacke, T., Dorigo, W., de Jeu, R., and Hagemann, S.: Potential and limitations of multidecadal satellite soil moisture observations for selected climate model evaluation studies, Hydrol. Earth Syst. Sci., 17, 3523–3542, https://doi.org/10.5194/hess-17-3523-2013, 2013.
McCarthy, J. M., Gumbricht, T., McCarthy, T., Frost, P., Wessels, K., and Seidel, F.: Flooding patterns of the Okavango wetland in Botswana between 1972 and 2000, Ambio, 32, 453–457, 2003.
McCarthy, T. S., Bloem, A., and Larkin, P. A.: Observations on the hydrology and geohydrology of the Okavango delta, S. Afr. J. Geol., 101, 101–117, 1998.
McCarthy, T. S., Cooper, G. R. J., Tyson, P. D., and Ellery, W.: Seasonal flooding in the Okavango delta, Botswana-recent history and future prospects, S. Afr. J. Sci., 96, 25–33, 2000.
MGDP Maun Groundwater Project Phase 1: Exploration and Resource Assessment – Executive Summary. Gaborone: Department of Mineral, Energy and Water Affairs, https://vuawater.com/Case-Study-Files/Africa/Maun_UBR_Executive_Summary-1993.pdf (last access: 22 May 2022), 1997.
Meesters, A. G., De Jeu, R. A., and Owe, M.: Analytical derivation of the vegetation optical depth from the microwave polarization difference index, IEEE Geosci. Remote Sens. Lett., 2, 121–123, 2005.
Mo, T., Choudhury, B. J., Schmugge, T. J., Wang, J. R., and Jackson, T. J.: A model for microwave emission from vegetation-covered fields, J. Geophys. Res.-Oceans, 87, 11229–11237, 1982.
Moesinger, L., Dorigo, W., de Jeu, R., van der Schalie, R., Scanlon, T., Teubner, I., and Forkel, M.: The global long-term microwave Vegetation Optical Depth Climate Archive (VODCA), Earth Syst. Sci. Data, 12, 177–196, https://doi.org/10.5194/essd-12-177-2020, 2020.
Muñoz-Sabater, J.: ERA5-Land hourly data from 1981 to present, Copernicus Climate Change Service (C3S) Climate Data Store (CDS), https://doi.org/10.24381/cds.e2161bac, 2019.
Muñoz-Sabater, J., Dutra, E., Agustí-Panareda, A., Albergel, C., Arduini, G., Balsamo, G., Boussetta, S., Choulga, M., Harrigan, S., Hersbach, H., Martens, B., Miralles, D. G., Piles, M., Rodríguez-Fernández, N. J., Zsoter, E., Buontempo, C., and Thépaut, J.-N.: ERA5-Land: a state-of-the-art global reanalysis dataset for land applications, Earth Syst. Sci. Data, 13, 4349–4383, https://doi.org/10.5194/essd-13-4349-2021, 2021.
Muzungaire, L., Mebelo, W., Shuuluka, D., and Omoregie, E.: Preliminary investigation of biomagnifications of trace metals in the Okavango River, North-eastern Namibia, Res. J. Agricult. Environ. Manage., 1, 034–042, 2012.
Okavango Research Institute: Okavango Delta Monitoring & Forecasting, http://okavangodata.ub.bw/ori/monitoring/water/#, last access: 20 August 2021.
Owe, M., de Jeu, R., and Holmes, T.: Multisensor historical climatology of satellite-derived global land surface moisture, J. Geophys. Res.-Earth, 113, https://doi.org/10.1029/2007JF000769, 2008.
Preimesberger, W., Scanlon, T., Su, C. H., Gruber, A., and Dorigo, W.: Homogenization of Structural Breaks in the Global ESA CCI Soil Moisture Multisatellite Climate Data Record, IEEE T. Geosci. Remote, 59, 2845–2862, 2020.
Republic of Botswana: Okavango delta World Heritage Nomination Dossier, Nomination dossier to UNESCO for inscription into the World Heritage List, https://whc.unesco.org/uploads/nominations/1432.pdf (last access: 19 August 2021), 2013.
Ringrose, S., Matheson, W., and Boyle, T.: Differentiation of ecological zones in the Okavango delta, Botswana by classification and contextural analyses of Landsat MSS data, Photogram. Eng. Remote Sens., 54, 601–608, 1988.
Rodríguez-Fernández, N. J., Mialon, A., Mermoz, S., Bouvet, A., Richaume, P., Al Bitar, A., Al-Yaari, A., Brandt, M., Kaminski, T., Le Toan, T., Kerr, Y. H., and Wigneron, J.-P.: An evaluation of SMOS L-band vegetation optical depth (L-VOD) data sets: high sensitivity of L-VOD to above-ground biomass in Africa, Biogeosciences, 15, 4627–4645, https://doi.org/10.5194/bg-15-4627-2018, 2018.
Scanlon, T., Pasik, A., Dorigo, W., De Jeu, R. A. M., Hahn, S., Van der Schalie, R., Wagner, W., Kidd, R., Gruber, A., Moesinger, L., and Preimesberger, W.: ESA Climate Change Initiative Plus – Soil Moisture, Algorithm Theoretical Baseline Document (ATBD), Supporting Product Version 06.1, D2.1 Version 2, https://www.esa-soilmoisture-cci.org/sites/default/files/documents/public/CCI SM v06.1 documentation/ESA_CCI_SM_RD_D2.1_v2_ATBD_v06.1_issue_1.1.pdf (last access: 22 May 2022), 2021.
Schwank, M., Kontu, A., Mialon, A., Naderpour, R., Houtz, D., Lemmetyinen, J., Rautiainen, K., Li, Q., Richaume, P., Kerr, Y., and Mätzler, C.: Temperature effects on L-band vegetation optical depth of a boreal forest, Remote Sens. Environ., 263, 112542, https://doi.org/10.1016/j.rse.2021.112542, 2021.
Teubner, I. E., Forkel, M., Camps-Valls, G., Jung, M., Miralles, D. G., Tramontana, G., Van der Schalie, R., Vreugdenhil, M., Mösinger, L., and Dorigo, W. A.: A carbon sink-driven approach to estimate gross primary production from microwave satellite observations, Remote Sens. Environ., 229, 100–113, 2019.
Van der Schalie, R., De Jeu, R. A., Kerr, Y. H., Wigneron, J. P., Rodríguez-Fernández, N. J., Al-Yaari, A., Parinussa, R. M., Mecklenburg, S., and Drusch, M.: The merging of radiative transfer based surface soil moisture data from SMOS and AMSR-E, Remote Sens. Environ., 189, 180–193, 2017.
Van der Schalie, R., Scanlon, T. M., Preimesberger W., Pasik, A. J., Van der Vliet, M., Mösinger, L., Rodríguez-Fernández, N. J., Madelon, R., Hahn, S., Hirschi, M., Kidd, R., De Jeu, R. A. M., and Dorigo, W. A.: Soil moisture [in “State of the Climate in 2020”], B. Am. Meteorol. Soc., 102, S11–S142, https://doi.org/10.1175/BAMS-D-21-0098.1, 2021a.
Van der Schalie, R., Van der Vliet, M., Rodríguez-Fernández, N., Dorigo, W. A., Scanlon, T., Preimesberger, W., Madelon, R., and de Jeu, R. A.: L-band soil moisture retrievals using microwave based temperature and filtering. Towards model-independent climate data records, Remote Sens., 13, 2480, https://doi.org/10.3390/rs13132480, 2021b.
Van Marle, M. J., Field, R. D., van der Werf, G. R., de Wagt, I. A. E., Houghton, R. A., Rizzo, L. V., Artaxo, P., and Tsigaridis, K.: Fire and deforestation dynamics in Amazonia (1973–2014), Global Biogeochem. Cy., 31, 24–38, 2017.
Wan, Z.: New refinements and validation of the collection-6 MODIS land-surface temperature/emissivity product, Remote Sens. Environ., 140, 36–45, 2014.
Wolski, P. and Murray-Hudson, M.: Alternative futures' of the Okavango delta simulated by a suite of global climate and hydro-ecological models, Water SA, 34, 605–610, 2008.
Wolski, P., Savenije, H. H., Murray-Hudson, M., and Gumbricht, T.: Modelling of the flooding in the Okavango delta, Botswana, using a hybrid reservoir–GIS model, J. Hydrol., 331, 58–72, 2006.
Wolski, P., Todd, M. C., Murray-Hudson, M. A., and Tadross, M.: Multi-decadal oscillations in the hydro-climate of the Okavango River system during the past and under a changing climate, J. Hydrol., 475, 294–305, 2012.
Wolski, P., Stone, D., Tadross, M., Wehner, M., and Hewitson, B.: Attribution of floods in the Okavango basin, Southern Africa, J. Hydrol., 511, 350–358, 2014.
Wolski, P., Murray-Hudson, M., Thito, K., and Cassidy, L.: Keeping it simple: Monitoring flood extent in large data-poor wetlands using MODIS SWIR data, Int. J. Appl. Earth Obs. Geoinform., 57, 224–234, 2017.
Yang, W., Tan, B., Huang, D., Rautiainen, M., Shabanov, N. V., Wang, Y., Privette, J. L., Huemmrich, K. F., Fensholt, R., Sandholt, I., and Weiss, M.: MODIS leaf area index products: From validation to algorithm improvement, IEEE T. Geosci. Remote, 44, 1885–1898, 2006.