the Creative Commons Attribution 4.0 License.
the Creative Commons Attribution 4.0 License.
 | 08 Jul 2022
Long-term water clarity patterns of lakes across China using Landsat series imagery from 1985 to 2020
Xidong Chen
Xiao Zhang
Junsheng Li
Shenglei Wang
Yuan Gao
Jun Mi
Monitoring the water clarity of lakes is essential for the sustainable development of human society. However, existing water clarity assessments in China have mostly focused on lakes with areas > 1 km2, and the monitoring periods were mainly in the 21st century. In order to improve the understanding of spatiotemporal variations in lake clarity across China, based on the Google Earth Engine cloud platform, a 30 m long-term LAke Water Secchi depth (SD) dataset (LAWSD30) of China (1985–2020) was first developed using Landsat series imagery and a robust water-color parameter-based SD model. The LAWSD30 dataset exhibited a good performance compared to concurrent in situ SD datasets, with an R2 of 0.86 and a root mean square error of 0.225 m. Then, based on our LAWSD30 dataset, long-term spatiotemporal variations in SD for lakes > 0.01 km2 (N = 40 973) across China were evaluated. The results show that the SD of lakes with areas ≤ 1 km2 exhibited a significant downward trend in the period of 1985–2020, but the decline rate began to slow down and stabilized after 2001. In addition, the SD of lakes with an area > 1 km2 showed a significant downward trend before 2001, and began to increase significantly afterwards. Moreover, in terms of the spatial patterns, the proportion of small lakes (area ≤ 1 km2) showing a decreasing SD trend was the largest in the Mongolian–Xinjiang Plateau Region (MXR) (about 30.0 %), and the smallest in the Eastern Plain Region (EPR) (2.6 %). In contrast, for lakes > 1 km2, this proportion was the highest in MXR (about 23.0 %), and the lowest in the Northeast Mountain Plain Region (NER) (16.1 %). The LAWSD30 dataset and the spatiotemporal patterns of lake water clarity in our research can provide effective guidance for the protection and management of lake environment in China.
- Article
(19855 KB) - Full-text XML
- BibTeX
- EndNote


Lakes are invaluable resources for human societies, providing value in terms of water supply, energy production, commerce, food production, and human health (Bastviken et al., 2011; Palmer et al., 2015). However, like many other ecosystems, lakes are sensitive to multiple co-occurring environmental pressures, notably climate change, nutrient enrichment, organic and inorganic pollution, and human activities (Brönmark and Hansson, 2002). Nowadays, with the rapid development of the economy and the growth of the population in China, the intensification of human activities and pollution from industry and agricultural production have caused severe damage to lakes (Ma et al., 2014; Wang and Yang, 2019; Zhou et al., 2019). According to recent research and national survey reports (Barnes, 2014; Wang and Yang, 2019; Ministry of Ecology and Environment of the People's Republic of China, 2020), approximately 70 % of inland water in China is polluted, 28 % of the assessed lakes are eutrophic, and about 140 million people depend on getting water from unsafe open sources. The deterioration of the lake ecosystem has threatened public health and the safety of both humans and aquatic organisms (Guo, 2007). Therefore, the effective monitoring and evaluation of the environment of lakes across China are necessary.
Water clarity is one of the most intuitive, popular, and important parameters to describe the optical components of water bodies (Carlson, 1977; Liu et al., 2020), and is generally measured in terms of Secchi depth (SD) (Odermatt et al., 2012; Carlson, 1977). Since water clarity is co-determined by the suspended matter, planktonic algae, and colored dissolved organic matter in the water column, it is usually adopted as a practical comprehensive metric for water quality assessment (Kloiber et al., 2002; Mccullough et al., 2012). Although a variety of physical, biological, and chemical parameters have been proposed to analyze the condition of water, water clarity has been utilized for a century as an effective and simple metric (Cuffney et al., 2000; Lee et al., 2018). Recently, water clarity was also recognized as an important parameter in support of the United Nations Sustainable Development Goal SDG 6.3.2 evaluation reports (Shen et al., 2020). Therefore, water clarity is a significant indicator that can be used to monitor and evaluate the comprehensive conditions of water.
Today, with the development of remote sensing technology, significant numbers of satellite images are continuously being acquired. Taking into account the high-frequency revisits, large area of coverage, and the historical archive of remote sensing data available, increasing attention has been paid to the applications of remote sensing datasets in water clarity assessments (Y. Li et al., 2020; Liu et al., 2019; Xue et al., 2019). The evaluation of water clarity from a variety of ocean color satellite sensors has been performed (Y. Li et al., 2020; Feng et al., 2019; Wang et al., 2018; Shi et al., 2018). For example, Shen et al. (2020) used Sentinel-3 data to evaluate the water clarity of 86 lakes (> 30 km2) in eastern China and C. Liu et al. (2021) estimated the SD (water clarity) trends of lakes with an area > 50 km2 in the Tibetan Plateau using MODIS data between 2000 and 2019. However, due to the coarse spatial resolution and the relatively short-term historical archives of these ocean color sensors, their applications were limited to large lakes and reservoirs, and the study periods were concentrated in the past two decades (Y. Li et al., 2020). The statistics of lakes with an area ≤ 1 km2 are scant, and understanding of the variations in SD before the 21st century is limited (Downing et al., 2012; Biggs et al., 2017; Z. Li et al., 2020). In order to improve the water environment monitoring capability, 30 m Landsat series data have recently been used for SD evaluation (Page et al., 2019; Dona et al., 2014). Because of the fine spatial resolution (30 m), long historical archives (> 35 years), and suitability for water clarity assessment, Landsat series data are considered to be “ideal” for the long-term and fine spatial resolution monitoring of lake SD (Olmanson et al., 2008; Olmanson et al., 2016; Y. Li et al., 2020; Y. Zhang et al., 2021). For example, Y. Li et al. (2020) utilized the Landsat series of images to monitor the SD trends in the Xin'anjiang Reservoir between 1986 and 2016 and Yin et al. (2021) tracked the SD changes in Taihu from 1984 to 2018 based on Landsat 5 and 8 images. Recently, in order to conduct the first high spatial resolution investigation of lake SD across China, significant amounts of Landsat 8 data from 2014–2017 were used in the work of Song et al. (2020). However, these studies were limited to individual areas or periods. Due to the requirement for huge amounts of computation and large storage capabilities, and the need for a robust uniform SD model, there are very few examples of national-scale long-term SD estimations using Landsat imagery (Yin et al., 2021; Kloiber et al., 2002; Page et al., 2019).
Fortunately, with the emergence of the Google Earth Engine (GEE) cloud computing platform (Gorelick et al., 2017), its high-performance, intrinsically parallel computing services can easily meet the requirements for very large computational resources (Zhang et al., 2020; L. Liu et al., 2021). Additionally, because the GEE platform integrates multipetabyte analysis-ready Landsat surface reflectance data and these data are intercalibrated between different Landsat sensors, it presents an opportunity to conduct long-term land surface analyses at the pixel level (Racetin et al., 2020; Y. Zhang et al., 2021). Accordingly, a robust SD model is the only requirement for fine-resolution, long-term SD evaluation across China. Lately, some studies have found that the SD is well correlated with water color parameters (e.g., hue angle and the Forel–Ule Index, FUI) (Wang et al., 2021; Chen et al., 2021; Van Der Woerd and Wernand, 2018). Since water color parameters can be retrieved at the global scale and over long time spans (Wang et al., 2021; Wang et al., 2018), it is possible to retrieve long-term water clarity over large areas based on these parameters (Wang et al., 2021; Wang et al., 2020). For example, Wang et al. (2020) recently developed a robust SD model based on water color parameters, and the model was successfully applied to MODIS data to develop a nationwide 500 m long-term SD dataset between 2000 and 2017. Accordingly, a feasible solution for high spatial resolution and long-term SD estimation across China could be provided by incorporating the GEE cloud platform and the water-color parameter-based SD model.
Therefore, in order to provide a comprehensive understanding of nationwide spatiotemporal variations in lake water clarity, we first developed a long-term 30 m LAke Water SD dataset of China from 1985 to 2020 (LAWSD30) using Landsat series data and a water-color parameter-based SD algorithm with the assistance of the GEE cloud platform. Then, the LAWSD30 dataset was employed to evaluate and recognize the spatiotemporal variations in SD for lakes with areas > 0.01 km2 (N = 40 973) across China in the period 1985–2020. Our results can provide effective data support for the management and protection of lake water environments.
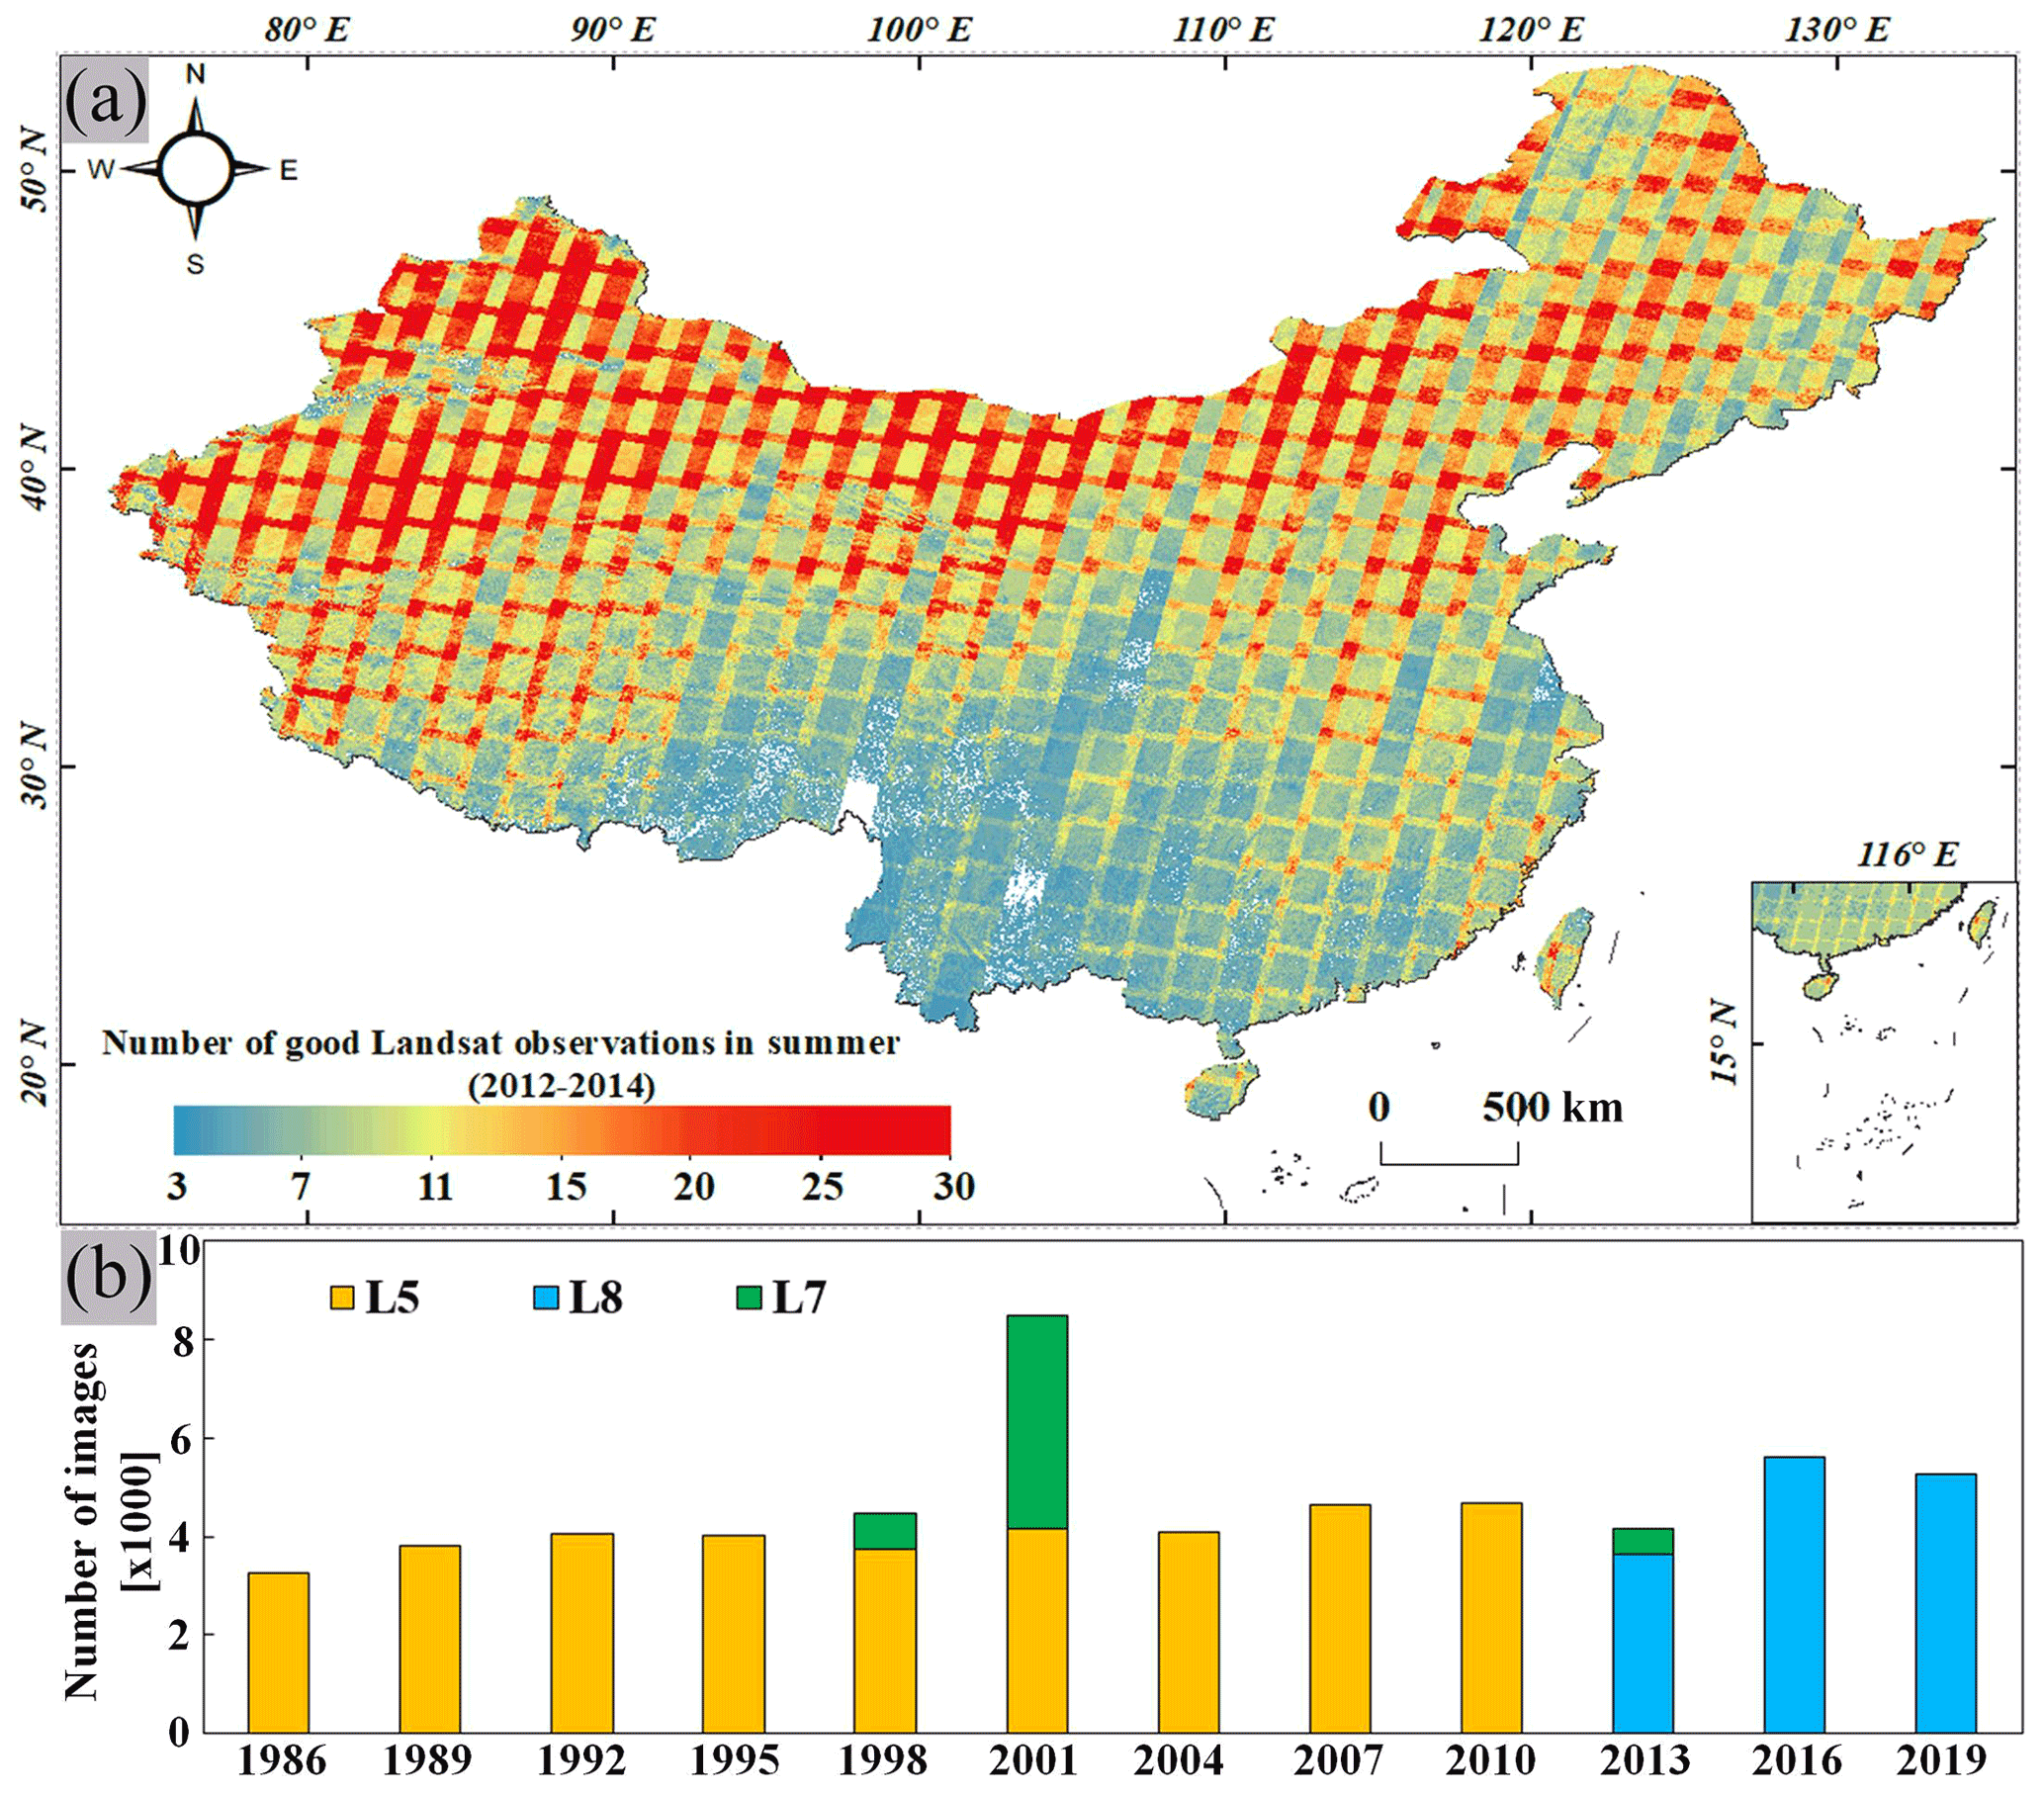
Figure 1Valid Landsat 5 and 8 observations in China from 2012 to 2014 (a) and statistics of Landsat images used to develop the product for each nominal year (b). Note: L8 – Landsat 8; L7 – Landsat 7; L5 – Landsat 5.
2.1 Landsat series satellite datasets
Taking into account the frequent contamination of cloud and cloud shadow, it is hard to develop a spatially continuous application-ready data product throughout China with only 1 year of Landsat images (Zhang et al., 2019). Therefore, we used images from ± 1 year of the target year to generate each product, and a total of 12 SD products with a 3-year time step were developed for 1985–2020. All available Landsat series Level-1 precision terrain (L1TP) surface reflectance datasets (about 46 TB of data), including Landsat 5 Thematic Mapper (TM), Landsat 7 Enhanced Thematic Mapper-plus (ETM+), and Landsat 8 Operational Land Imager (OLI) imagery, acquired in the summer (1 June–30 September) from 1985 to 2020, were used via the GEE cloud computing platform. The summer months were chosen because the lake water is abundant and deep, and the water clarity is more stable with fewer short-term variables in summer than in other seasons when there are no climatic events (i.e., heavy rainfall, storm events) (Olmanson et al., 2008; Chen et al., 2021; Song et al., 2020; Singh and Singh, 2015). Additionally, summer is also the period with the most abundance public in situ water quality data (Mccullough et al., 2012). Therefore, it is suitable for mapping with remote sensing imagery (Kloiber et al., 2002; Singh and Singh, 2015; Song et al., 2020). In addition, since the Landsat L1TP data were intercalibrated across different Landsat series sensors, the collected L1TP data were consistent and suitable for pixel-level time series analysis (Racetin et al., 2020). However, since the Landsat 7 scan line corrector (SLC) failed in 2003, the Landsat 7 images acquired thereafter exhibited wedge-shaped scan gaps (referred to as SLC-off images) (USGS, 2003). Therefore, except for 2012–2014, only Landsat 7 data before 2003 were used for the development of our SD products (Fig. 1b). Since Landsat 5 retired in 2011 and Landsat 8 data were only available after 2013, the valid Landsat observations from 2012 to 2014 were insufficient (Fig. 1a). Therefore, a few Landsat 7 SLC-off images from 2012 to 2014 were used as substitutes to fill the gaps between 2012 and 2014. Figure 1b shows the final number of Landsat series images used to generate the SD product for each nominal year.
2.2 Auxiliary inland water products
The annual 30 m Joint Research Centre Global Surface Water (JRC-GSW) database was used to extract water body regions for each SD product (Pekel et al., 2016). The JRC-GSW was developed based on multiple classification criteria and time series Landsat 5, 7, and 8 data from 1984 to 2019, archived to the GEE platform. The water pixels in the JRC-GSW were labeled as permanent and seasonal water pixels based on the frequency of being detected as water bodies (Pekel et al., 2016). The overall commission and omission accuracies for permanent water were 99.6 % and 98.6 %, respectively, versus 98.6 % and 75.4 % for seasonal water (Pekel et al., 2016). Following Chen et al. (2021), in this study, only the pixels marked as permanent waters in the JRC-GSW were utilized to extract water regions to reduce the disturbance from aquatic vegetation in seasonal waters.
Additionally, the existing Chinese lake inventories (Ma et al., 2011; Song et al., 2020; Chen et al., 2021) and the Reservoirs and Dams vector database (Song et al., 2018) were also collected and used to extract lakes for each SD product.
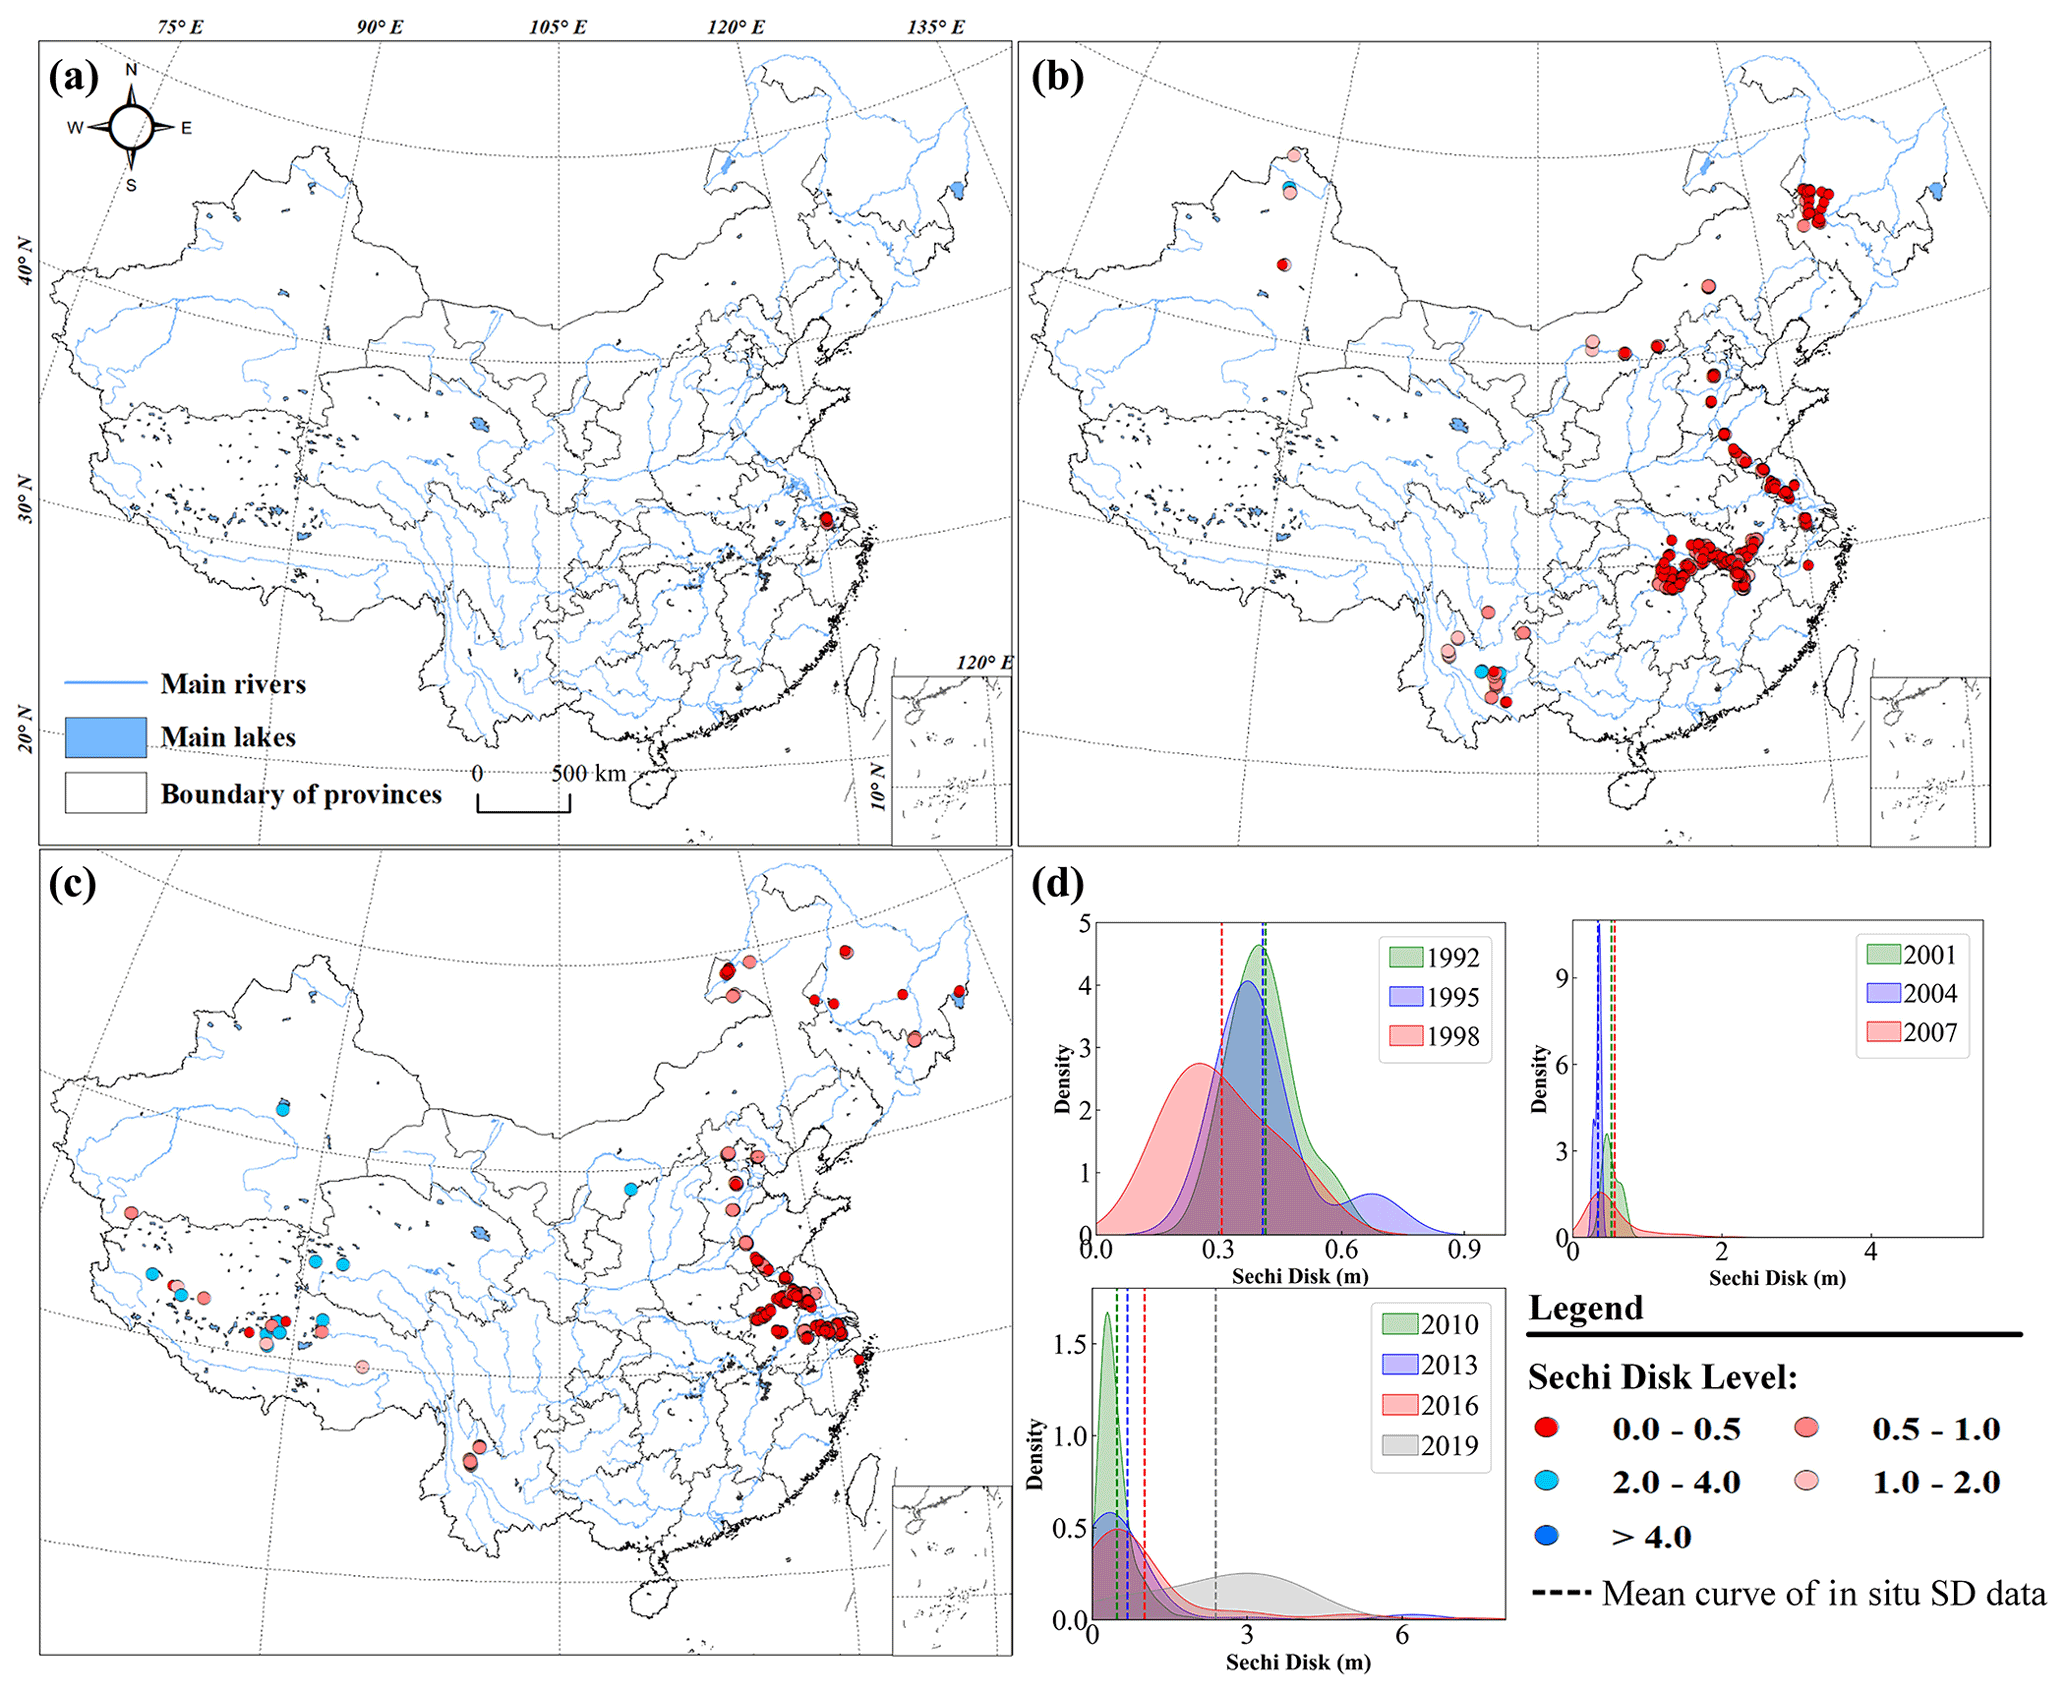
Figure 2Details of the in situ measured SD datasets. (a–c) The geographical distributions of SD samples used to validate the accuracies of the corresponding SD products and (d) the probability density of the collected SD measurements used for each target SD product, used to show the SD range where the collected in situ SDs are mainly concentrated.
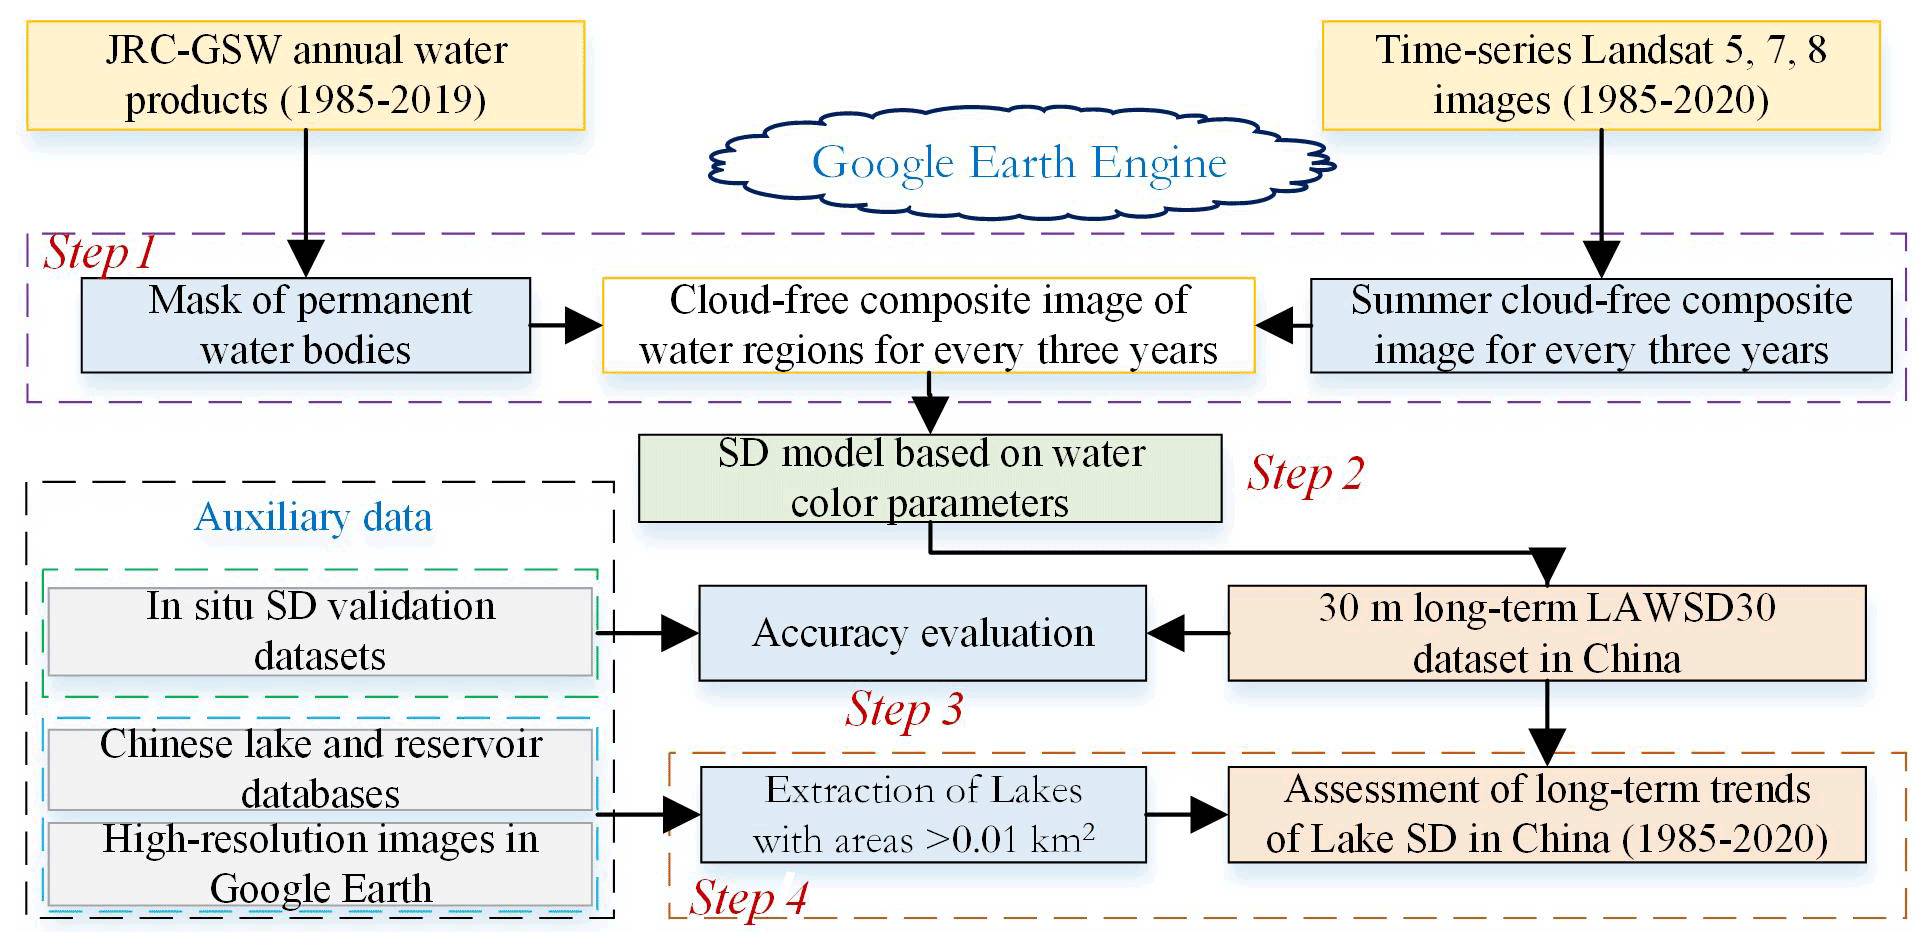
Figure 3A flowchart of the long-term LAWSD30 dataset development steps and the long-term SD trend assessment of lakes in China. Note: LAWSD30 – 30 m LAke Water SD dataset of China.
2.3 In situ SD datasets
In order to quantitatively evaluate the performance of the LAWSD30 dataset, a total of 1349 in situ SD measurements of 208 lakes between 1992 and 2019 were collected from the China Lake Scientific Database (http://www.lakesci.csdb.cn, last access: 25 January 2021), the National Earth System Science Data Center, National Science & Technology Infrastructure of China (http://lake.geodata.cn, last access: 1 December 2021), and work by Wang et al. (2020) and Liu et al. (2020). The collected in situ SD data were all measured on sunny days. Due to the scarcity of field-measured SD records before the 1990s, only SD products after 1992 were validated. Since in situ SD measurements within seven days of satellite overpasses were suitable for the validation of the remote-sensing-derived SD product (Song et al., 2020), the collected SD measurements were coincident with the Landsat data used in our study within a window of ± 7 d. The distributions of the in situ SD records collected to validate products for different nominal years are shown in Fig. 2a–c. The probability density of the collected SD measurements used for each SD product was calculated and is exhibited in Fig. 2d. It can be seen that the collected SD measurements cover a variety of water clarity conditions and are distributed throughout China (Fig. 2). The values of our collected SD data range from 0 to 7 m, covering lakes from clear to eutrophic. Therefore, the collected in situ data can provide a reliable accuracy examination for our LAWSD30 dataset.
In order to assess the long-term trends of SD in Chinese lakes, four steps were taken in our study (Fig. 3). First, based on the time series Landsat images and the JRC-GSW water products archived in GEE, a summer cloud-free composite image was generated between 1985 and 2020 with an interval of three years using the best-available-pixel (BAP) compositing method. Then, based on the generated cloud-free composite images, the long-term LAWSD30 dataset from 1985 to 2020 (including 12 products, representing 1986, 1989, 1992, 1995, 1998, 2001, 2004, 2007, 2010, 2013, 2016, and 2019) were developed using a robust SD model based on water color parameters. Next, the accuracy of our developed LAWSD30 dataset was evaluated using the collected concurrent in situ datasets. Finally, with the assistance of the existing Chinese lake and reservoir datasets and high-resolution images in Google Earth, the assessment of the long-term SD trends for lakes > 0.01 km2 across China was conducted using the developed SD products.
3.1 Generation of cloud-free composites using best-available-pixel (BAP) composition method
Since summer is suitable for SD mapping with remote sensing imagery (Mccullough et al., 2012; Singh and Singh, 2015; Song et al., 2020), cloud-free summer composites of Landsat data for twelve 3-year time steps were compiled from 1985 to 2010. Generally, the median and mean composite methods were used to generate cloud-free images in the SD assessing studies (Y. Li et al., 2020; Wang et al., 2020; Liu et al., 2020). However, since multisource sensors (TM, ETM+, and OLI) were used in this study, the different band settings between these sensors made the parameters of the algorithm specific to each sensor (Y. Li et al., 2020; Garnesson et al., 2019). Because the median and mean composite methods will change the original radiation value of the pixel (Xie et al., 2019; Griffiths et al., 2014), the composite pixels derived from these general methods are difficult to trace back to the sensor from which they originated. Therefore, these methods are not well suitable for our research. Recently, White et al. (2014) proposed a BAP method to generate cloudless composites for a large area. Since BAP compiles cloud-free images by selecting the best available observation based on user-defined criteria (Gomez et al., 2016; Griffiths et al., 2013), the BAP composites can retain the source image information from which they came. In addition, since BAP can ensure phenological consistency between multitemporal BAP composites by setting the acquisition day-of-year (DOY) criteria (Griffiths et al., 2014; Chen et al., 2021), it is suitable for multiyear change detection and assessment (Griffiths et al., 2014; Gomez et al., 2016; Hermosilla et al., 2015; X. Zhang et al., 2021). Accordingly, the BAP method was used to generate cloud-free composites. Our team recently used BAP to develop summer composites for water color mapping (Chen et al., 2021). Following Chen et al. (2021), the DOY criteria (Eq. A1), the cloud and cloud shadow criteria (Eq. A2), and the atmospheric opacity criteria (Eq. A3) were selected to generate the BAP composites (the details of the criteria are presented in the Appendix A). The score for each criterion was summed, and the observation with the highest score was selected as the BAP composite. The parameter values for the criteria used were obtained from Chen et al. (2021). However, since floods and rainfall in summer will bring suspended particles into water bodies, making the SD of water bodies much lower than usual (Murshed et al., 2014; C. Liu et al., 2021), it is also necessary to reduce the impact of these climatic events on the BAP composites to ensure the reliability of the long-term SD trend assessment. Here, the normalized difference turbidity index (NDTI) (Lacaux et al., 2007) was used to indicate the turbidity of the water (Eq. 1). As the SD of water decreases, the NDTI of water increases (Islam, 2006; Lacaux et al., 2007). Therefore, the interference of floods and rainfall was restricted by only using the observations with NDTI less than the 80th quantile of their NDTI stack for BAP compositing.
Finally, based on the intra-annual permanent water pixels detected in the JRC-GSW, water regions were extracted from the BAP composites.
3.2 Inversion model of water SD
Previous studies have demonstrated that FUI and hue angle (α) are useful water color parameters to assess the SD of inland waters (Wang et al., 2020; Chen et al., 2021; Garaba et al., 2015). Recently, these two watercolor parameters were further demonstrated to be robust parameters for retrieving SD over large areas and long-term spans (Wang et al., 2020; Pitarch et al., 2019). Therefore, the SD of the extracted permanent water regions was retrieved using a robust SD model based on FUI and α (Wang et al., 2020). The SD model showed good performance and adaptability over a variety of water clarity ranges, with a mean relative difference of 27.4 % and a mean absolute difference of 0.37 m (Wang et al., 2020). There are three main steps in the SD model.
Table 1Polynomial coefficients for the Landsat-OLI/TM/ETM+ hue angle correction (Wang, 2018).
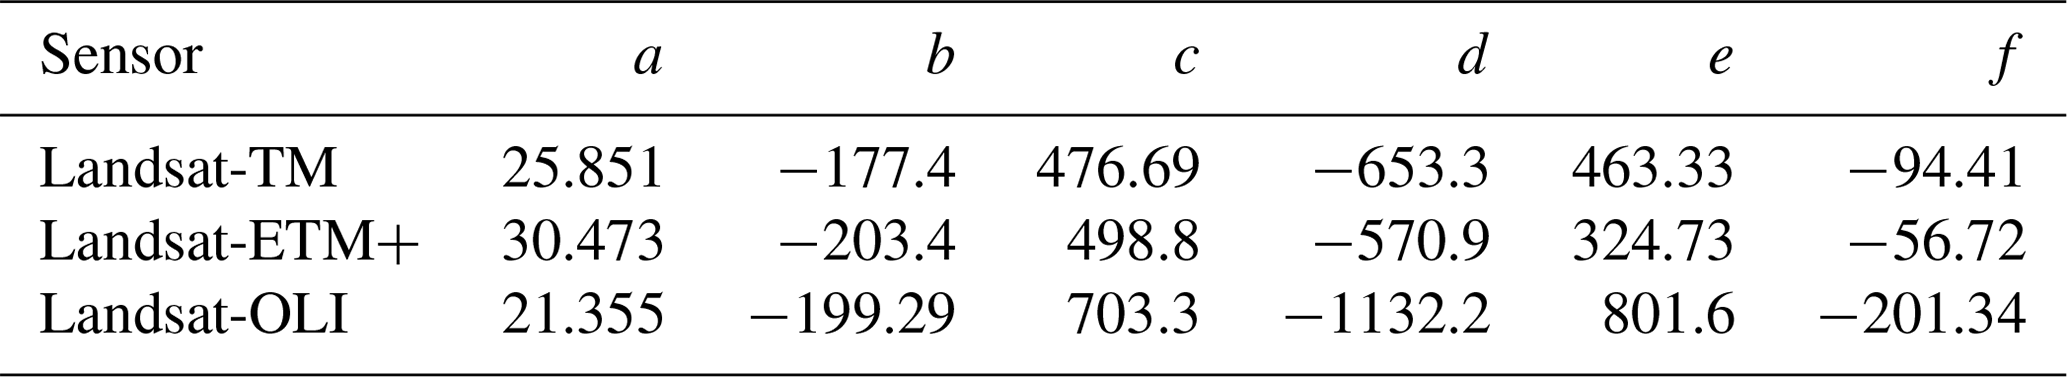
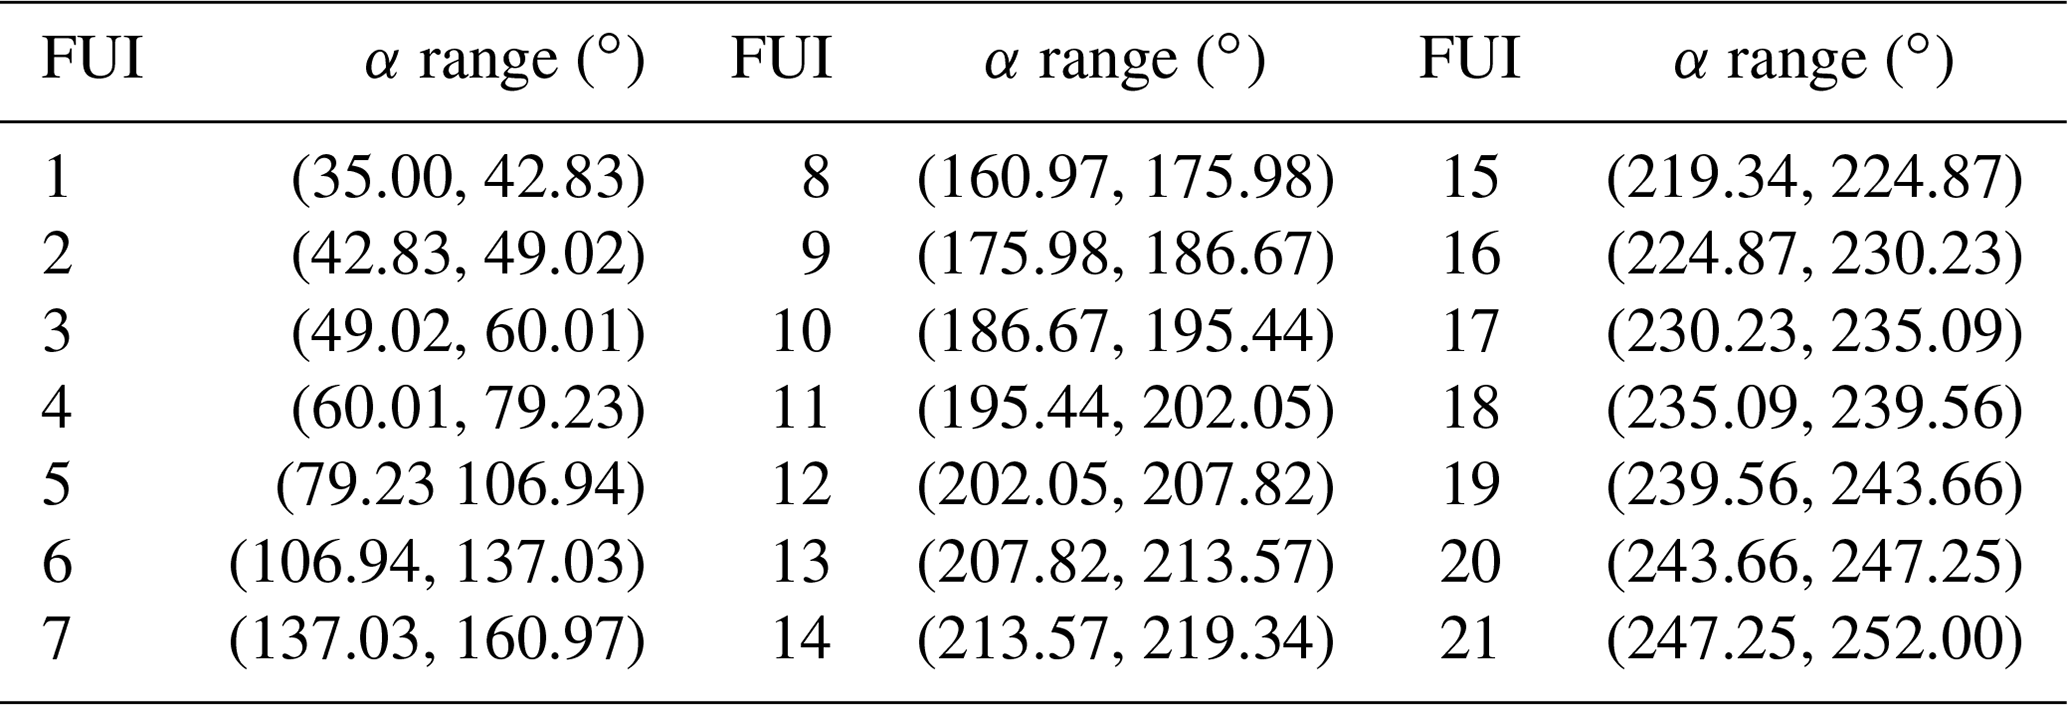
Table 2The 21-class FUI indices and the corresponding range of hue angle α (Wang et al., 2018; Chen et al., 2021).
-
Calculation of the hue angle (α). The α is the angle of the line drawn counterclockwise from the positive x axis at y = in the Commission on Illumination's (CIE) chromaticity diagram (Wang et al., 2018). In order to derive the angle α, the CIE primary color tristimulus (X, Y, Z) was calculated from the reflectance in the visible bands of Landsat images first (Wang et al., 2020; Chen et al., 2021). Since ETM+/TM has only three bands in the visible range, the tristimulus of Landsat ETM+/TM was calculated using the RGB conversion method (Wang, 2018; Cie, 1932) (Eqs. 2–4):
where R represents the band reflectance. Since OLI has four visible bands, the X, Y, and Z of Landsat OLI data were calculated using the linear weighted summation method as per Chen et al. (2021) (Eqs. 5–7):
Once the tristimulus was calculated, the chromaticity coordinates (x, y) were then acquired from the X, Y, and Z (Wang et al., 2021) (Eq. 8). Afterwards, the hue angle α was derived based on x and y (Van Der Woerd and Wernand, 2018) (Eq. 9). However, because of the band settings of sensors, there is an offset (Δα) of the sensor-derived hue angle (Van Der Woerd and Wernand, 2015). Following the ideas in Van Der Woerd and Wernand (2015), Wang (2018) recently developed polynomial deviation delta corrections for multiple sensors (Eq. 10). Accordingly, the angle α was finally corrected using α+Δα:
where a–f are coefficients of the deviation delta correction, and the correction coefficients of OLI/ETM+/TM are shown in Table 1.
-
Calculation of the FUI. The FUI for pixels in Landsat was derived from the corrected angle α based on the FUI lookup table (Novoa et al., 2013) (Table 2). Each FUI corresponds to a range of angle α.
-
Calculation of the SD. Based on the calculated FUI and α, the SD was obtained following the algorithm proposed in Wang et al. (2020) (Eqs. 11 and 12). This model had been demonstrated to be suitable for large-area and long-term SD monitoring (Wang et al., 2020).
3.3 Assessment of long-term SD trends in China's lakes
In order to comprehensively evaluate the long-term trends in SD of natural lakes across China, lakes with areas > 0.01 km2 (more than 10 pixels) were manually extracted by referring to the Chinese lake inventories (Chen et al., 2021; Song et al., 2020), the Chinese reservoir and dam database (Song et al., 2018), and high-resolution images from Google Earth. Since previous water investigations were mainly based on MODIS and Sentinel-3 images, and focused on lakes with an area > 1 km2, the knowledge of lakes < 1 km2 was limited (Y. Zhang et al., 2021; Chen et al., 2021). Therefore, in our study, the extracted lakes were divided into two groups, lakes with an area > 1 km2 and lakes with an area ≤ 1 km2, to explore the SD trends in the two different areas. In order to reduce the impact of aquatic vegetation, algae bloom areas, and shallow nearshore on the lake SD assessment, the mean SD of each lake was calculated following the method in Chen et al. (2021). Specifically, the floating algae index (FAI) (Eq. 13) (Dai et al., 2021; Hu, 2009) was first used to mask algae bloom and aquatic vegetation areas with a threshold of −0.02 (Chen et al., 2021). Then, shallow nearshore pixels were excluded by setting the corresponding threshold value for each lake (Chen et al., 2021). Pixels whose SD was less than the SD value of 80 % of the pixels in a given lake were regarded as shallow nearshore pixels and excluded. After the above steps, the remaining pixels in each lake region were used to calculate the mean SD of that lake as follows:
where Red, NIR, and SWIR represent the reflectance of red, near-infrared (NIR), and shortwave infrared (SWIR) bands, and λNIR, λRed, and λSWIR are the center wavelengths of NIR, red, and SWIR bands.
The nonparametric Loess regression method (Steyerberg, 2016) was employed to delineate the long-term SD trend for each lake, and the widely used Mann–Kendall (MK) test (Yuan et al., 2018; Kendall, 1990; Mann, 1945) was applied to indicate the monotonicity of the long-term SD trend. Specifically, the MK indicated the monotonic trend by using a standardized MK statistic Z (Yuan et al., 2018). Z > 0 indicated an upward trend, while Z < 0 indicated a downward trend. The indicated trend was regarded as significant only when P ≤ 0.05 (Y. Li et al., 2020). Since the reliability of the long-term trend analysis relied on the observation number of time series data (Y. Li et al., 2020; Wang et al., 2020), only the lakes that existed in at least 10 SD products were retained for our long-term SD assessment. Using the above criteria, a total of 40,973 lakes were used for time series SD analysis.
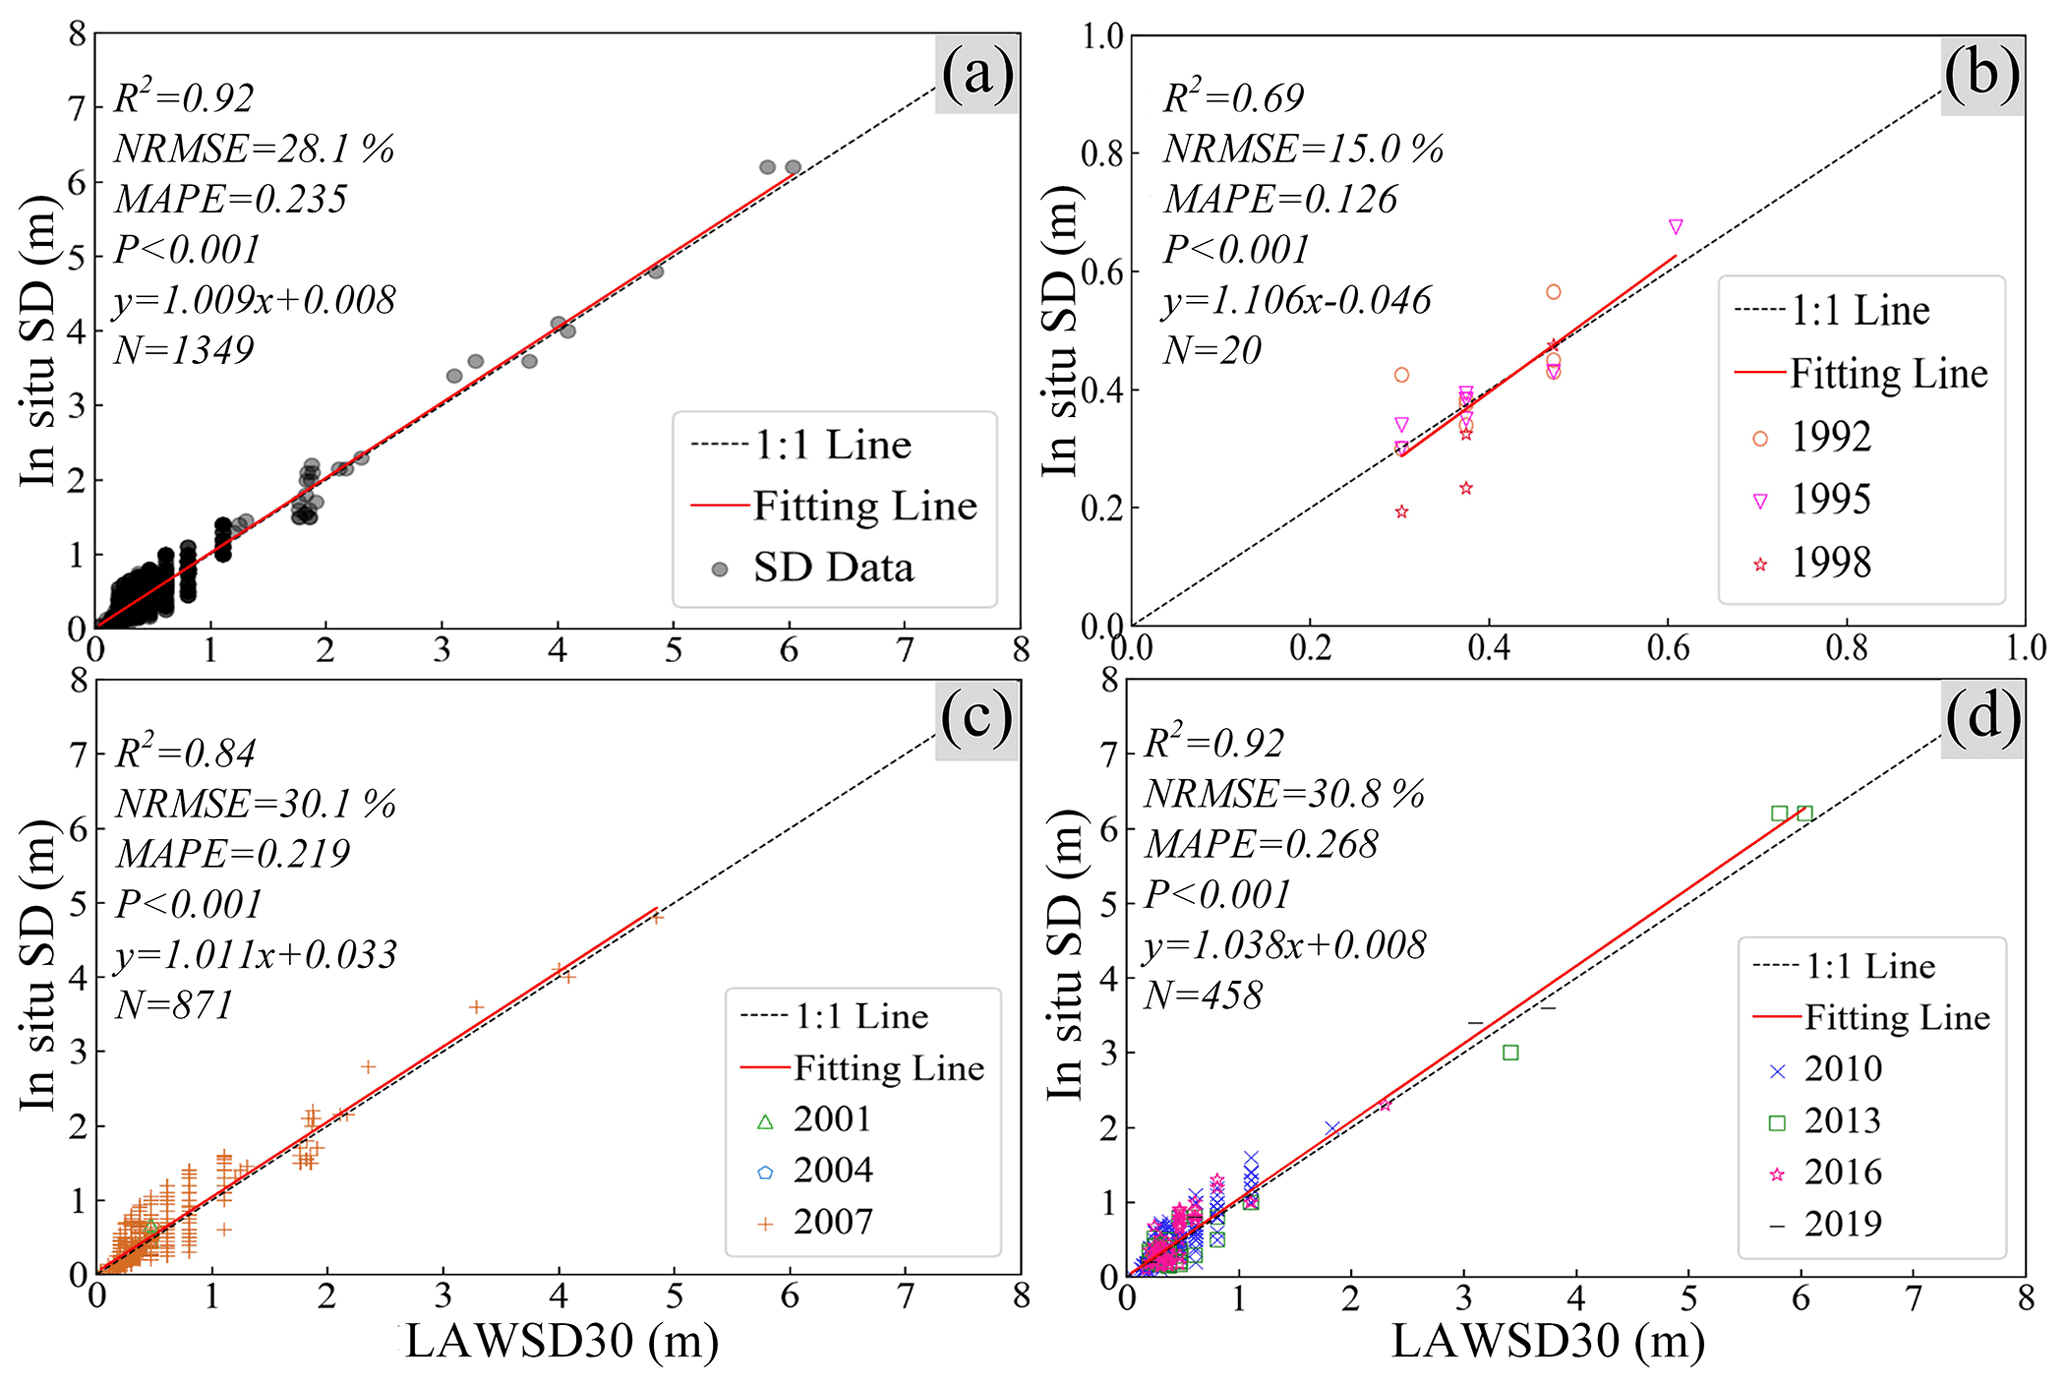
Figure 4Scatterplots of the in situ measured SD data and our LAWSD30 dataset. (a) An overall scatterplot of our LAWSD30 dataset and all the collected in situ SD data, and (b–d) scatterplots of our LAWSD30 dataset and the corresponding in situ SD data in the 1990s (1992, 1995, and 1998), 2000s (2001, 2004, and 2007), and 2010s (2010, 2013, 2016, and 2019), respectively.
4.1 Accuracy evaluation of the 30 m long-term LAWSD30 dataset
The accuracy of our LAWSD30 dataset was evaluated with the collected concurrent in situ SD datasets, as illustrated in Fig. 4. From Fig. 4a, our LAWSD30 dataset exhibited a significant correlation with all collected in situ SD data, with an R2 of 0.92, a root mean square error (NRMSE) of 28.1 %, and a mean absolute percentage error (MAPE) of 0.235. Most of the scatter points were distributed close to the 1:1 line. Specifically, from the validation results in the 2010s, our LAWSD30 showed good performance, with an R2 of 0.92, a NRMSE of 30.8 %, and a MAPE of 0.268. In addition, a stable performance was also shown in the results for the 2000s, with R2 reaching 0.84, NRMSE reaching 30.1 %, and MAPE reaching 0.219. Furthermore, a good performance was also seen before the 2000s, with an R2 of 0.69, a NRMSE of 15.0 %, and a MAPE of 0.126 in the 1990s. The validation results for these different decades demonstrated the stable performance of our LAWSD30 in different periods. Although some of the measured SD records had some deviations from LAWSD30 and resulted in vertical lines, it was found that these deviations were mainly due to differences between the dates of the SD measurements and the LAWSD30 dataset. Moreover, for most regions, the deviation between the measured SD and LAWSD30 was small. It is concluded, therefore, that our LAWSD30 can be a reliable dataset for the long-term SD trend assessment of lakes in China.
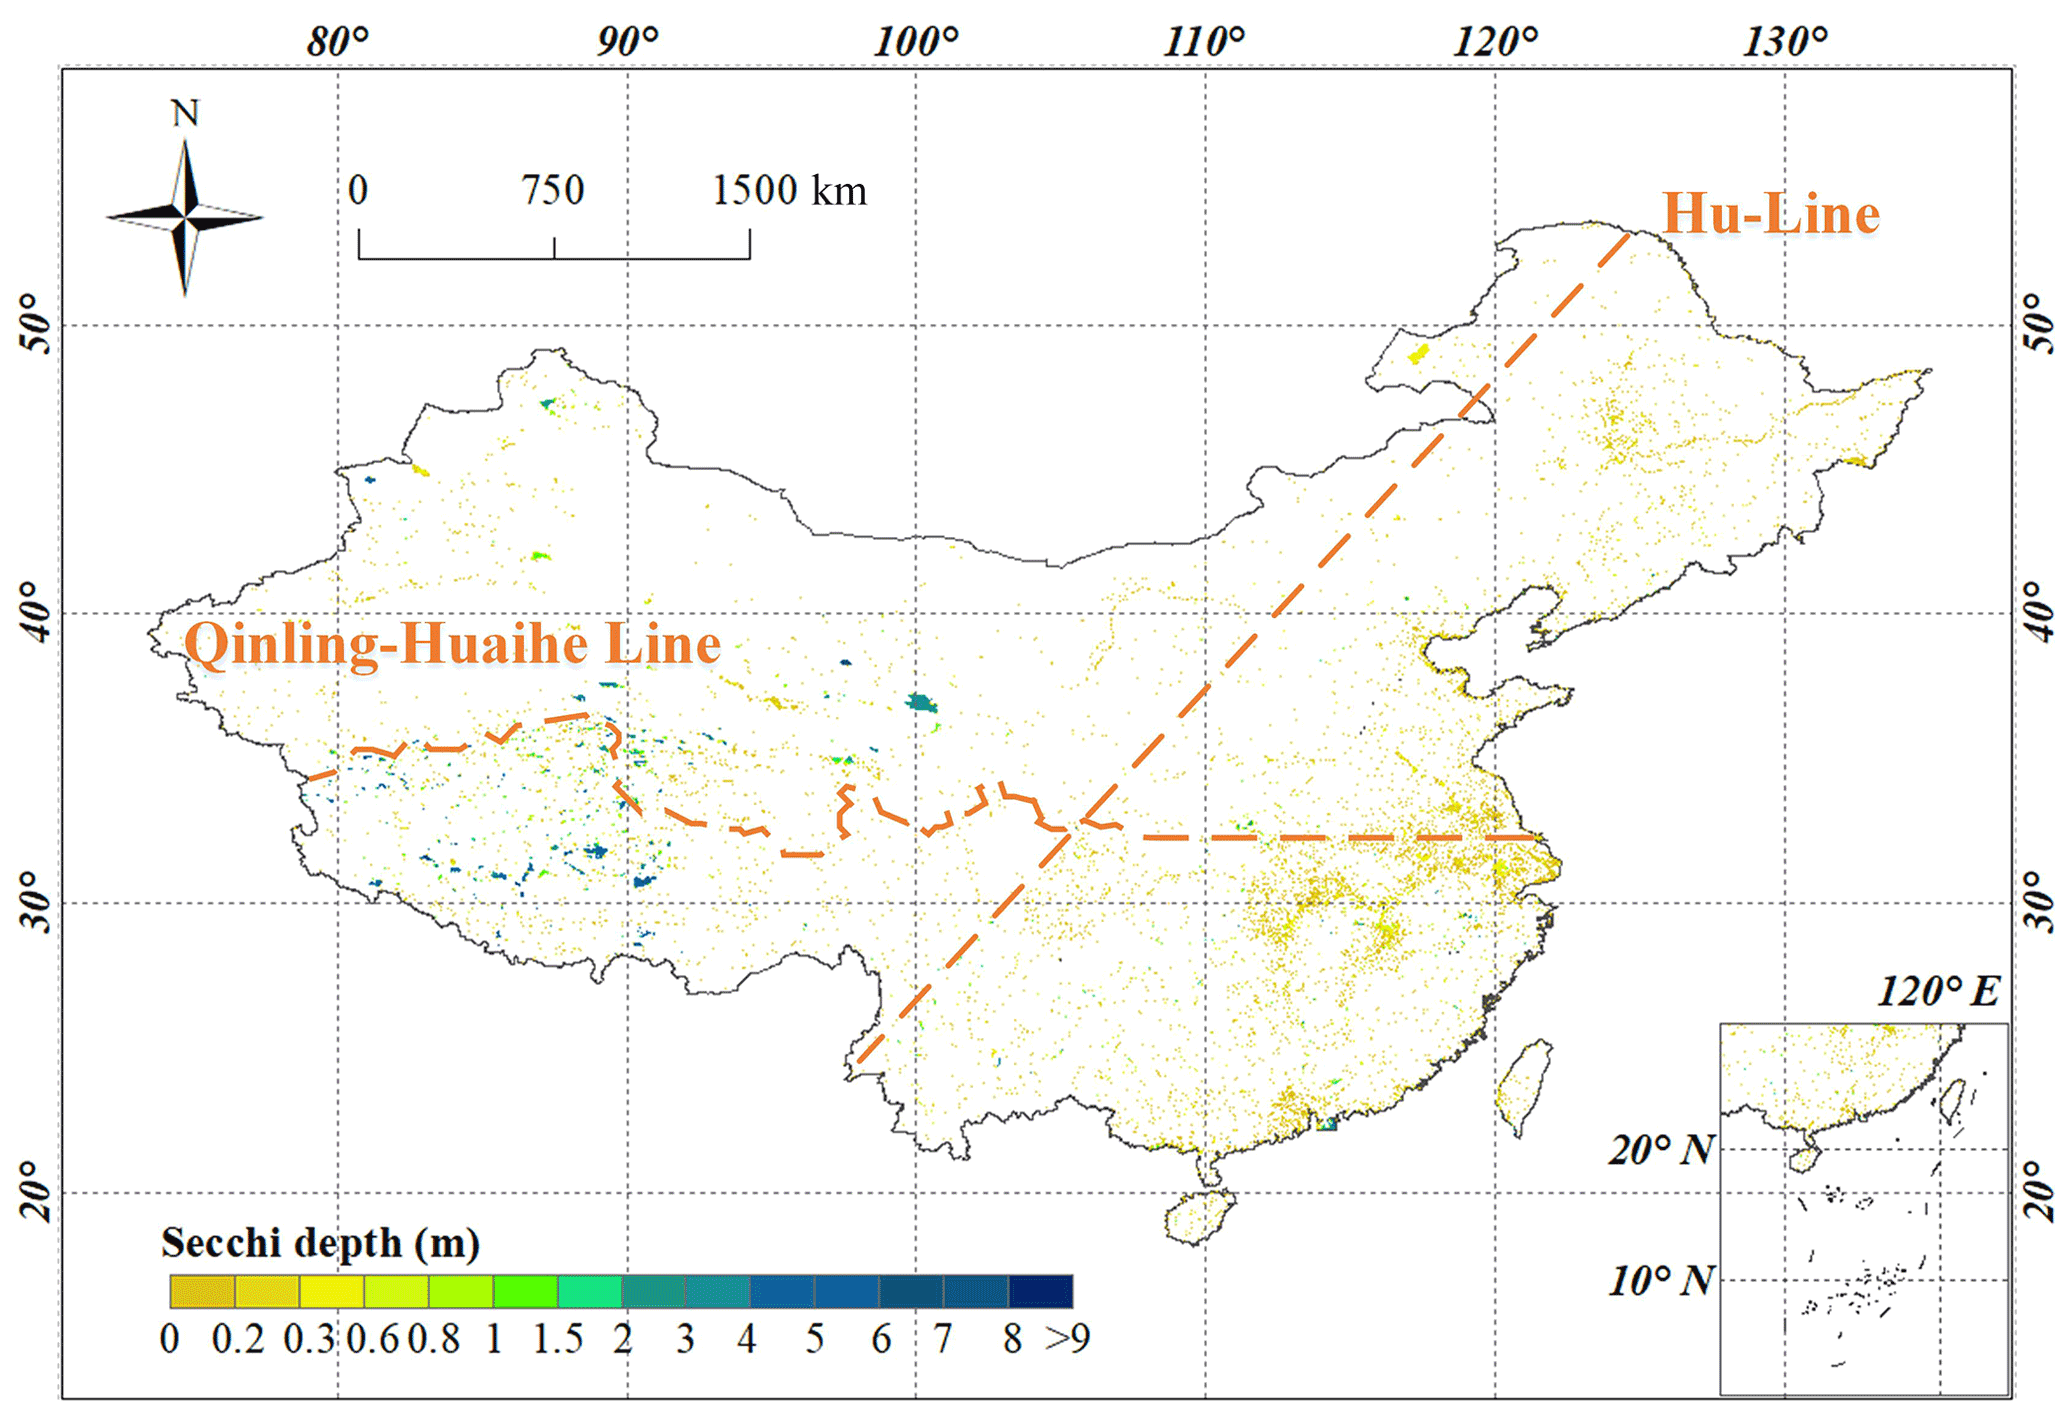
Figure 5The 30 m SD product in China in 2019. Note: the north–south dashed line is the Hu Line, inherited from Hu (1990) and the east–west dashed line is the Qinling–Huaihe Line, inherited from Liu et al. (2015).
4.2 The LAWSD30 dataset in China
Our developed long-term LAWSD30 dataset includes 12 SD products of the corresponding nominal years, now available at https://doi.org/10.5281/zenodo.5734071. Here, the SD product in 2019 is shown in Fig. 5. It can be found that the water bodies in our LAWSD30 dataset showed a wide range of SD values (0.1 m to more than 9 m), indicating a great diversity of Chinese inland waters. Taking the famous Hu Line (Hu, 1990) as the boundary, the SD of water bodies showed an obvious pattern of “high west and low east” across China. The average SD of the water bodies to the west of the Hu Line was approximately 1.7 m, while the average SD of the eastern water bodies was about 0.4 m. Furthermore, regarding the famous Qinling–Huaihe Line (Liu et al., 2015), the dividing line between the north and south of China, a significant latitudinal pattern of “high in the south and low in the north” was exhibited across China. The average SD of the water bodies distributed to the north of the Qinling–Huaihe Line was about 0.72, whereas the average SD reached about 1.16 for the water bodies south of this line. The above SD patterns observed across China were in good agreement with other studies (Wang et al., 2020; Y. Zhang et al., 2021).
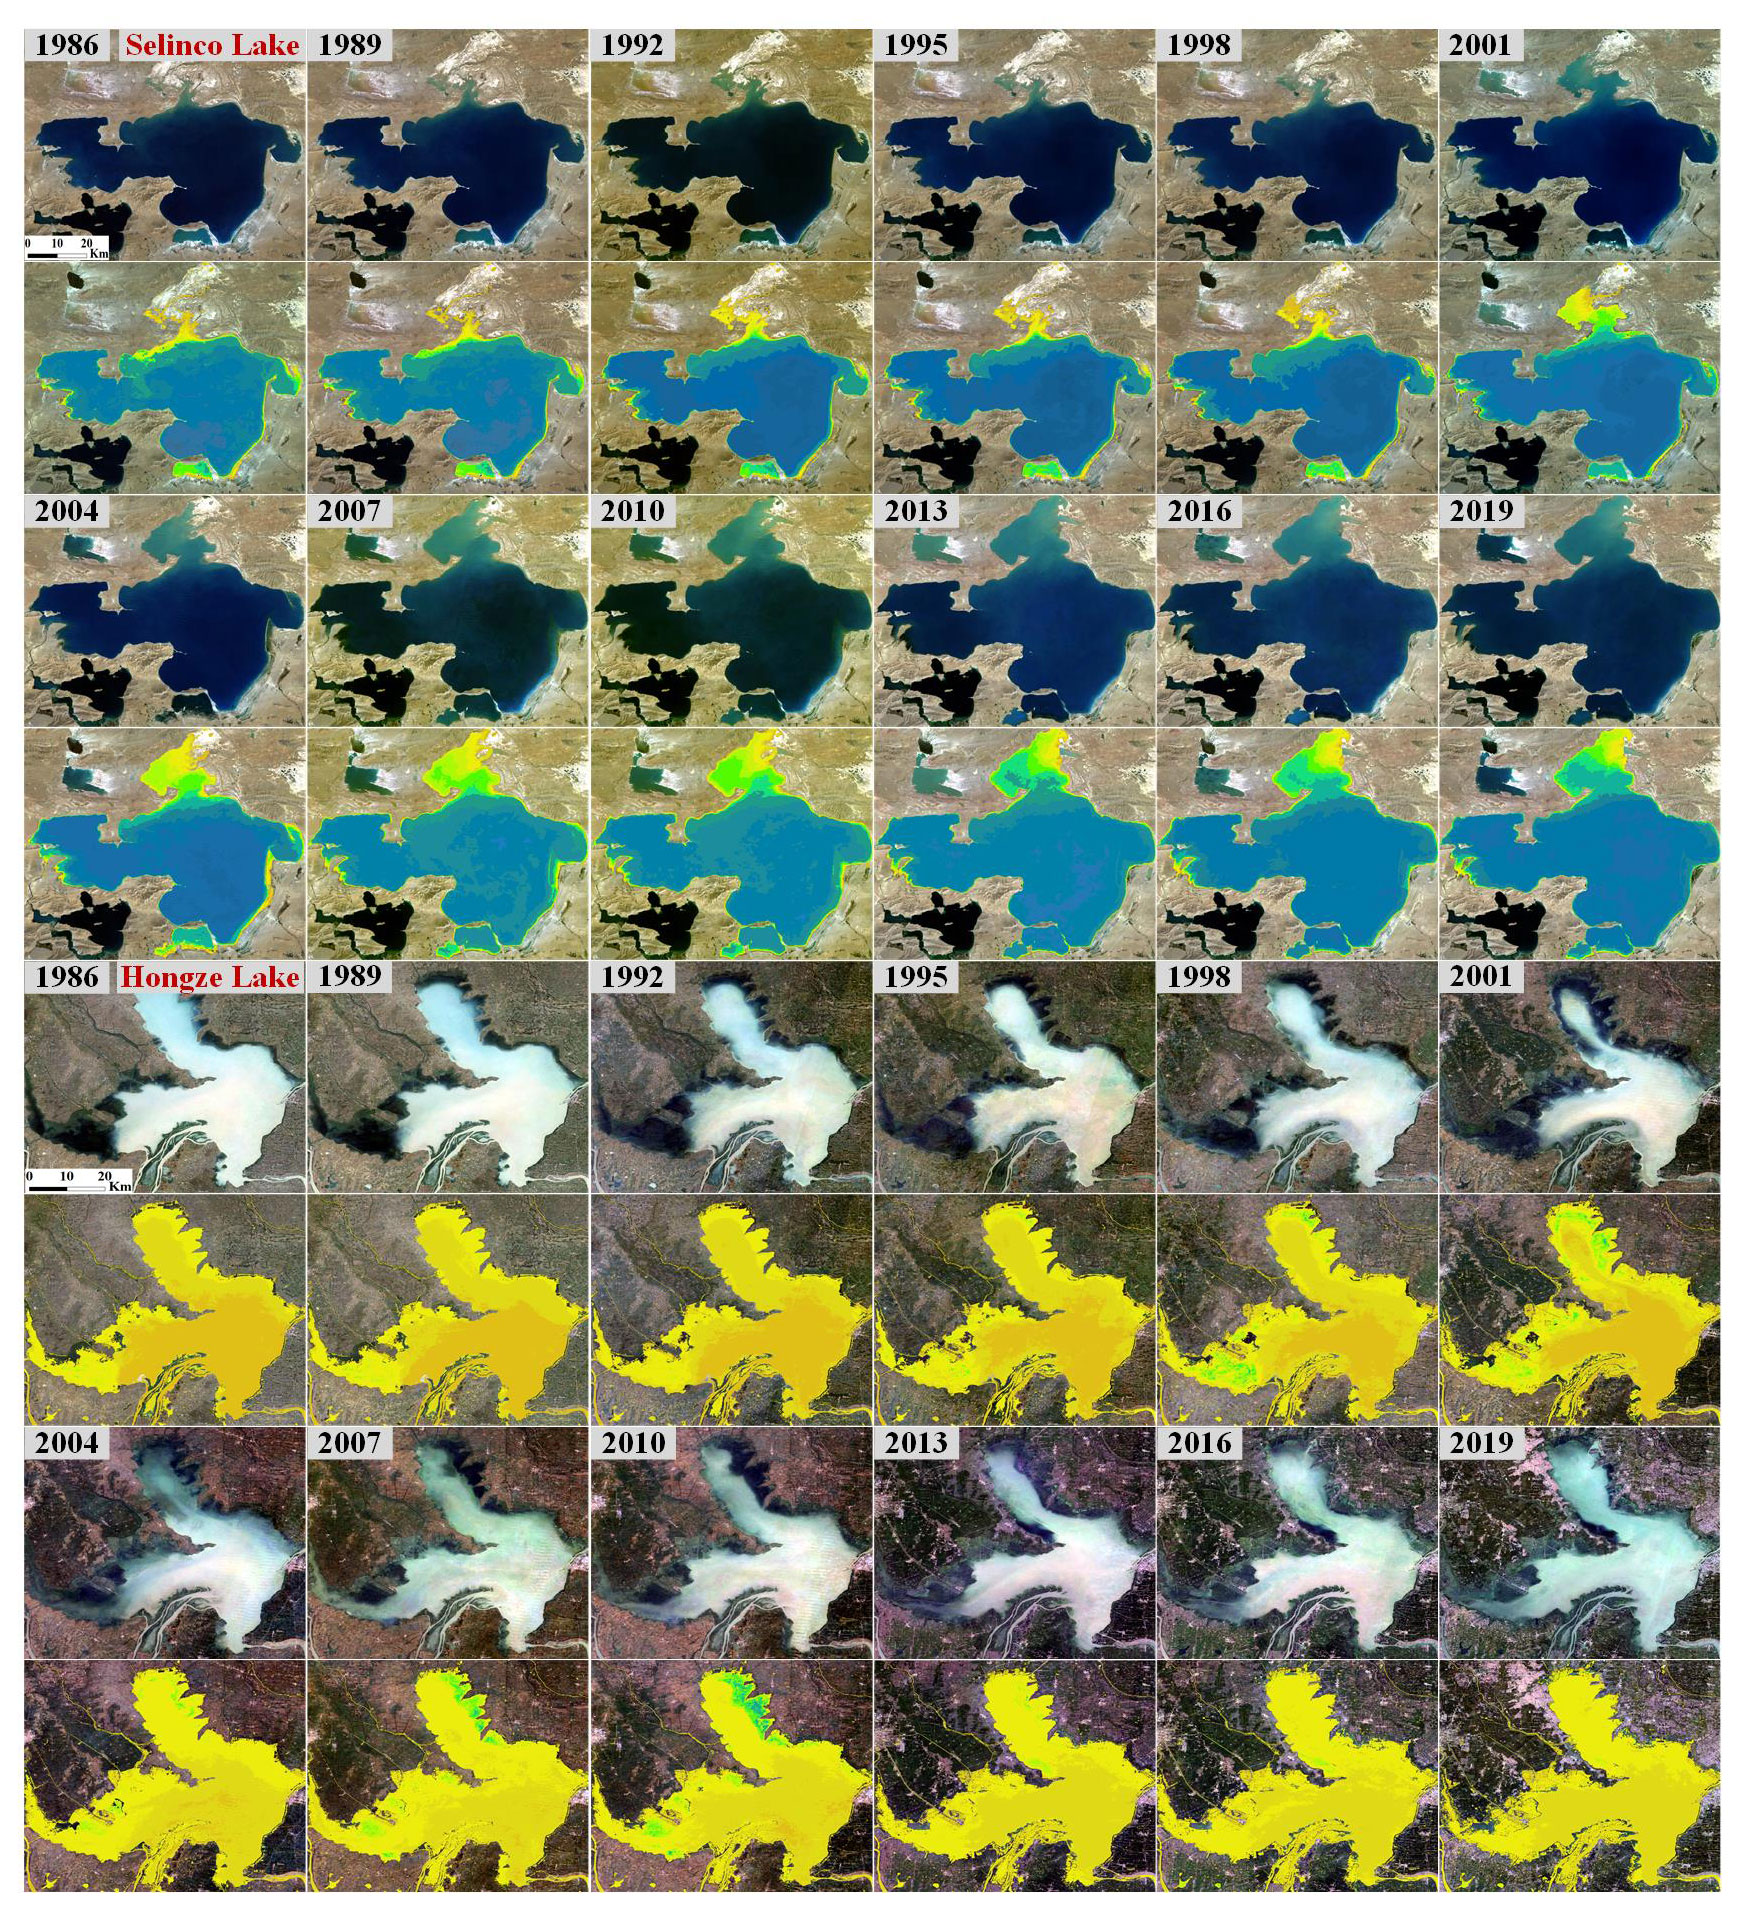
Figure 6The long-term SD results of Selinco Lake and Hongze Lake between 1985 and 2020. Note: the color bar is the same as that in Fig. 5. The time series background imagery of Selinco Lake and Hongze Lake come from the United States Geological Survey (https://earthexplorer.usgs.gov/, last access: 10 September 2021).
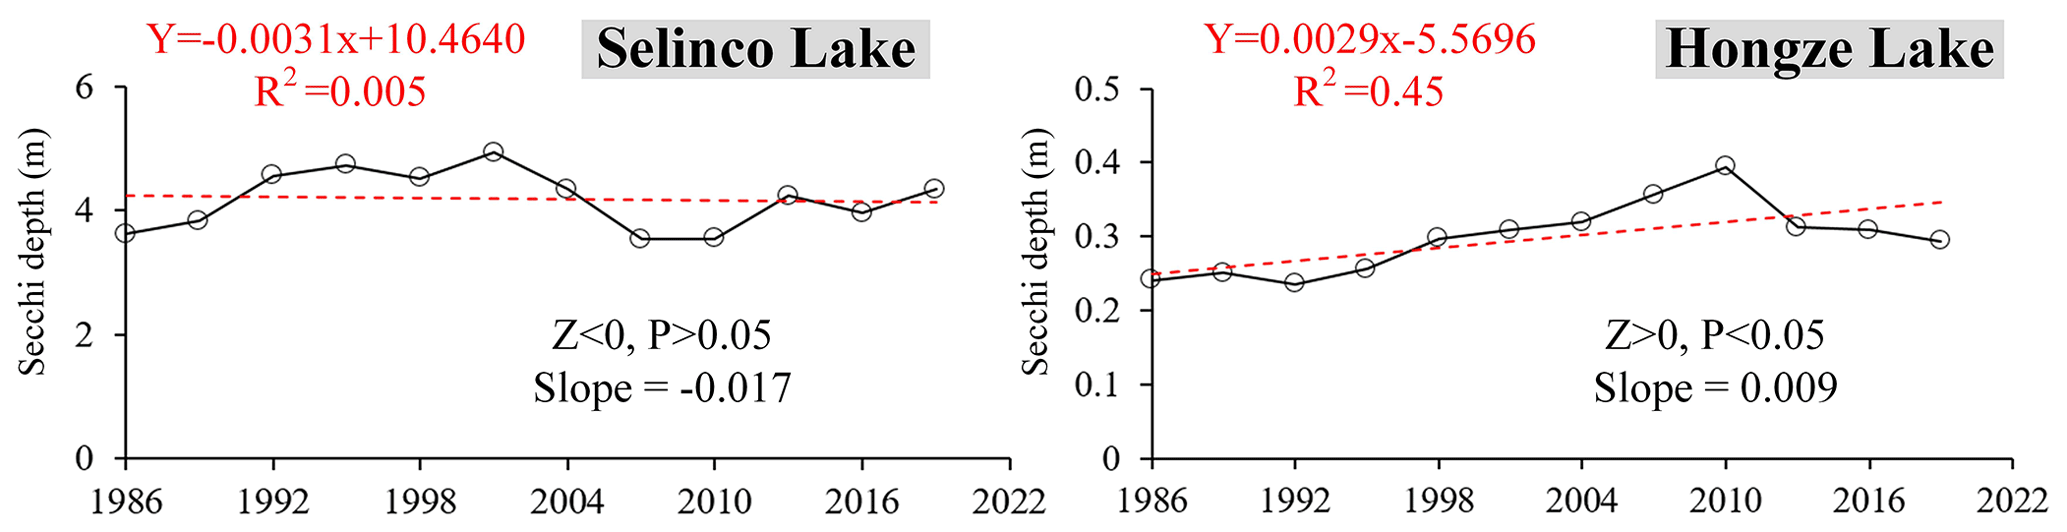
Moreover, in order to illustrate the ability of our long-term LAWSD30 dataset to monitor the spatiotemporal pattern of SD in water bodies, the time series SD results for two important lakes, Selinco Lake and Hongze Lake, are displayed and used as case studies (Fig. 6). These two lakes were chosen because they are distributed in western and eastern China, respectively, which can be used to illustrate the ability of our LAWSD30 dataset in assessing the SD trends of lakes in different environments. Additionally, since the water environment of the two lakes have been widely concerned and studied (C. Liu et al., 2021; Cao et al., 2017; Xue et al., 2019), it is convenient to compare the conclusions of our study with the previous studies. The long-term mean SD of the two lakes is shown in Fig. 7. From the perspective of the spatial pattern, it can be seen that the water area in the northern part of Selinco Lake has been increasing, and the SD of the north is generally lower than that of the central and southern areas of the lake. A significant pattern of “high center and low north” was found from the SD results for Selinco Lake. Additionally, an obvious clarity gradient with high values on the northern side and lower values on the central area and southern side could be found in Hongze Lake. These results are in good agreement with previous studies (Wang et al., 2020; Xue et al., 2019; C. Liu et al., 2021). Furthermore, we can see that the clarity of water in the northern part of Selinco Lake has improved in recent years, and the SD in the central and southern regions of Hongze Lake has also increased compared with 35 years ago (Fig. 6). Moreover, in terms of the SD trends, the mean SD of Selinco Lake exhibited a decreasing but insignificant trend (Z < 0, P> 0.05) in the period 1985–2020, while Hongze Lake has shown a significant increasing SD trend (Z > 0, P< 0.05) over the past 35 years (Fig. 7). Specifically, the SD curve of Selinco Lake first showed an upward trend before the 2000s and then exhibited a decreasing trend after 2001. As for Hongze Lake, it was found to have an increasing SD trend before 2010, but the SD began to decrease after that. Similarly, other studies found the same SD change patterns in the two lakes (C. Liu et al., 2021; Li et al., 2016; Wang et al., 2020; Cao et al., 2017; Li et al., 2019). Therefore, our long-term SD dataset can provide an opportunity to quickly evaluate the temporal dynamics of SD in water bodies at low costs, which is of great significance for large-scale water quality monitoring.
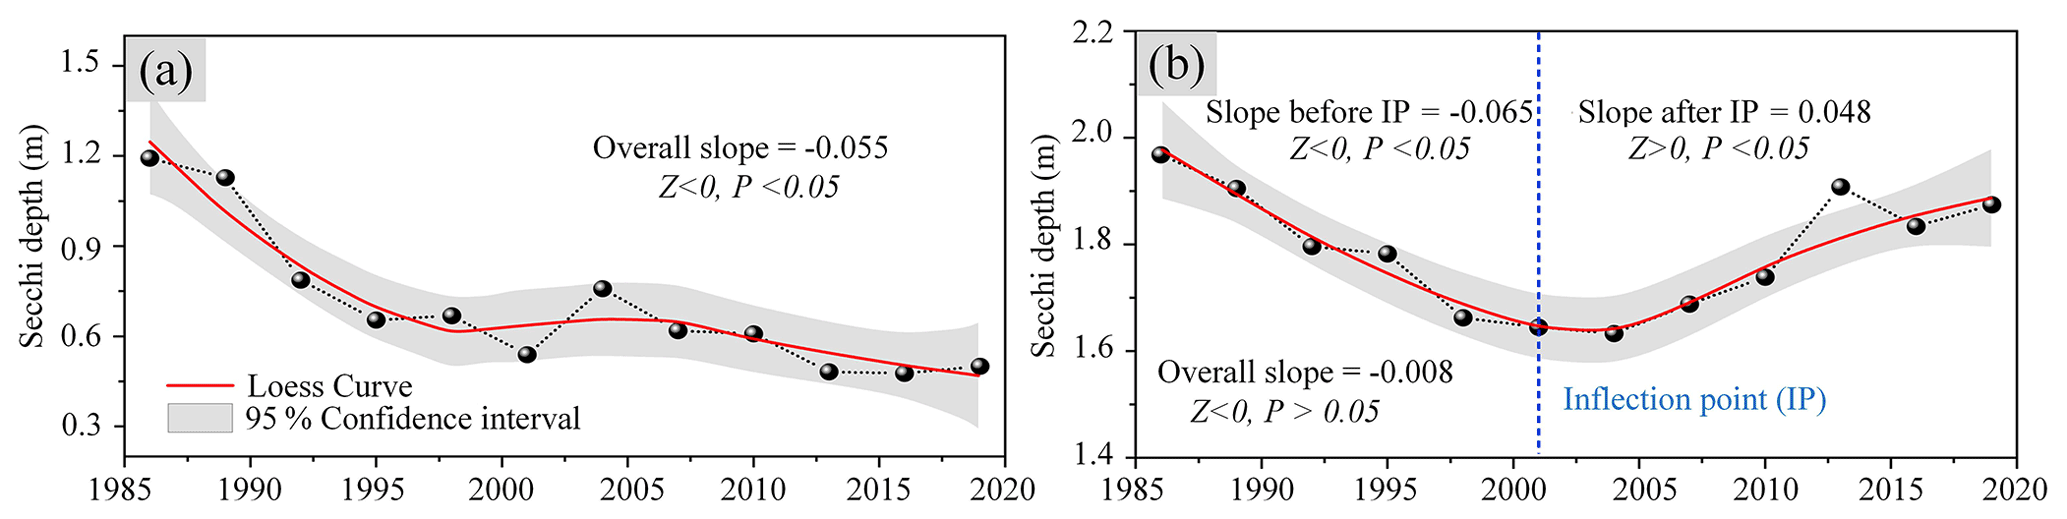
Figure 8The long-term trend in SD for lakes with an area > 0.01 km2 (N = 40 973) across China from 1985 to 2020. (a) The mean SD of lakes ≤ 1 km2 across China and (b) the mean SD of lakes > 1 km2 across China. Note: IP – inflection point.
4.3 Long-term SD trend of lakes across China in the period 1985–2020
The long-term variations in SD for lakes with an area > 0.01 km2 (N = 40,973) across China from 1985 to 2020 were first evaluated and recognized using our LAWSD30 products (Fig. 8). First, for lakes with an area ≤ 1 km2 (Fig. 8a), the mean SD of the lakes showed a significant downward trend since 1985 (Z < 0, P < 0.05), with a rate of −0.055 m yr−1. However, it can be seen that the decline rate of SD began to slow down and stabilized after 2001 (with a rate of −0.026 m yr−1 after 2001). In addition, regarding lakes with areas > 1 km2 (Fig. 8b), the mean SD of the lakes around 2020 was basically the same as that in 1985, and the long-term SD of the lakes has not shown a significant downward trend since 1985 (Z < 0, P > 0.05). However, by carefully observing the time series SD curve of these lakes (Fig. 8b), an obvious turning point could be found around 2001. The SD of the lakes showed a significant downward trend (Z < 0, P < 0.05) before 2001 and began to increase significantly (Z > 0, P< 0.05) afterward. The above results demonstrate that the water clarity of lakes in China has continued to improve since the 21st century, but the SD of lakes with an area ≤ 1 km2 is still low.
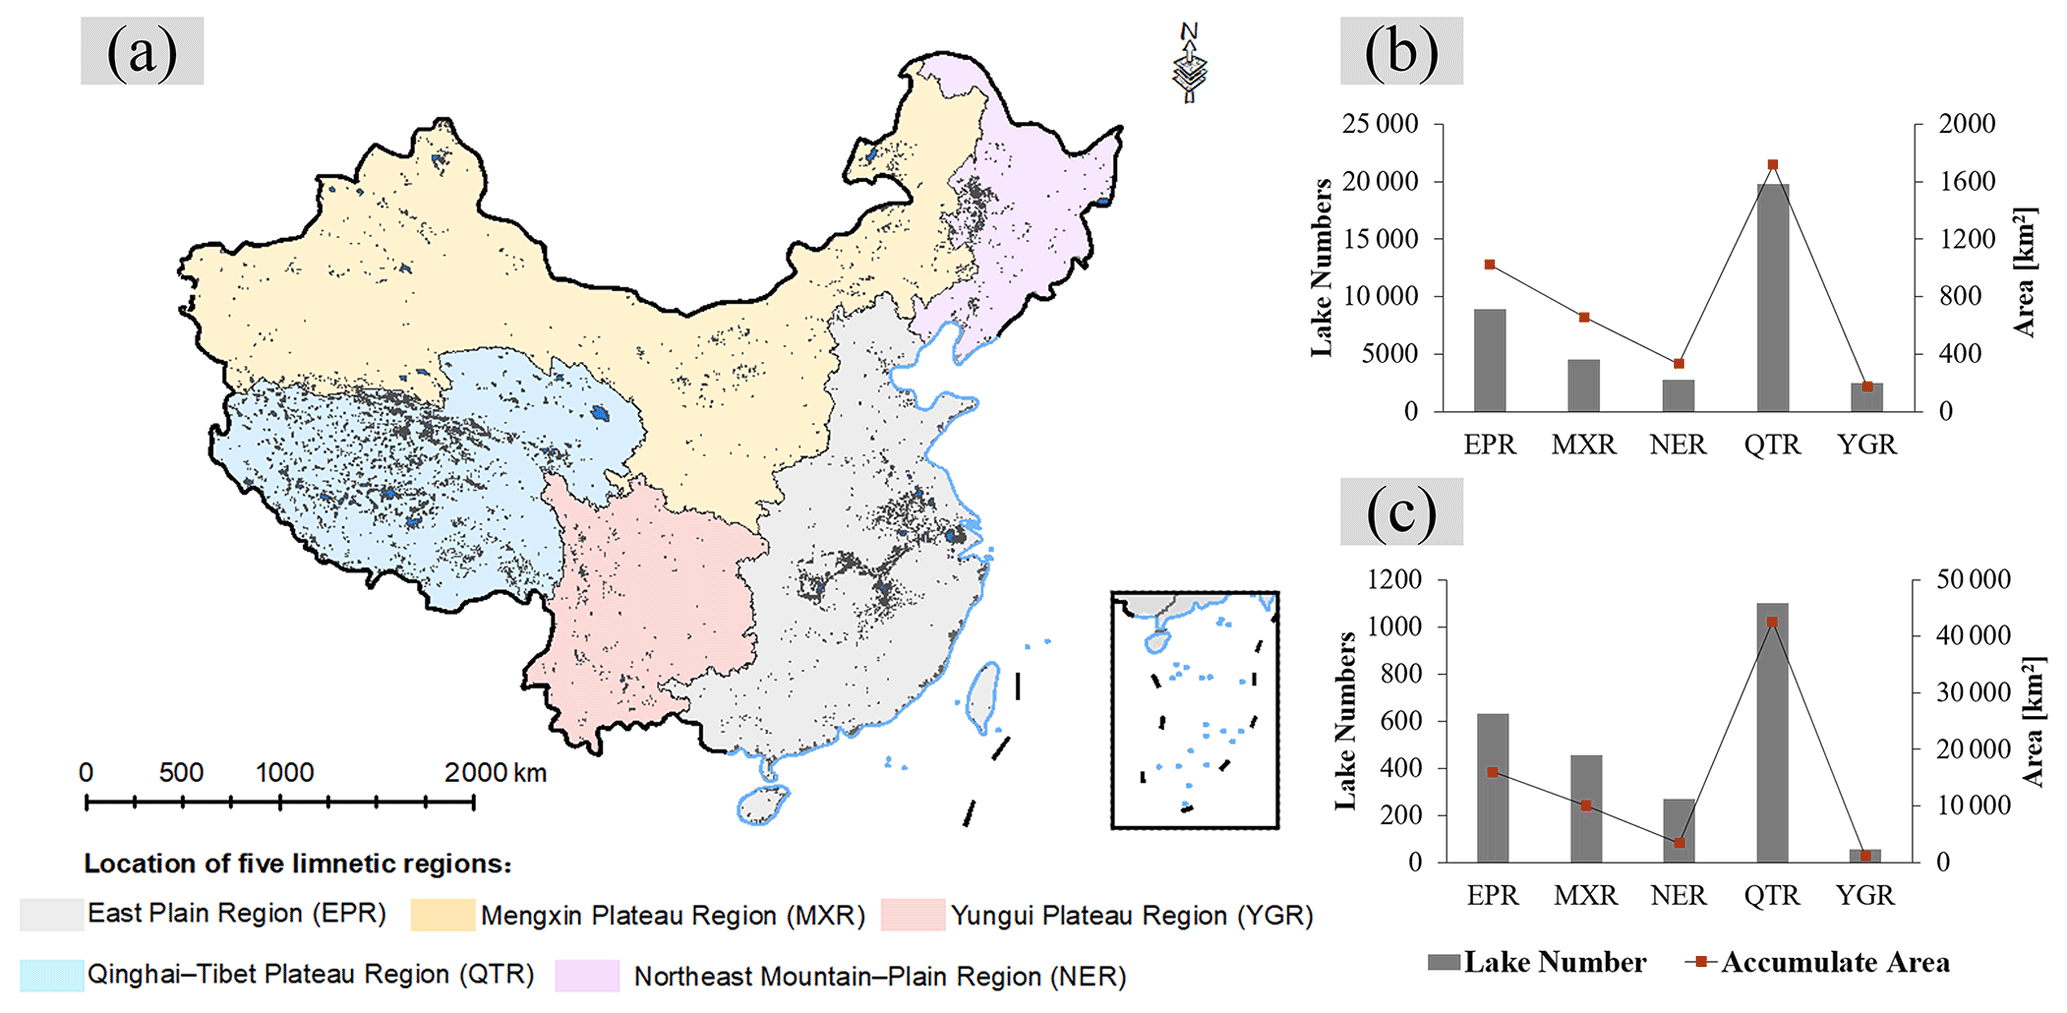
Figure 9The location of the five limnetic regions and the lake statistics in each limnetic region. (a) The location of the five limnetic regions, (b) statistics of lakes with areas ≤ 1 km2 in each region, and (c) statistics of lakes with areas > 1 km2 in each region. The location of the five limnetic regions comes from Ma et al. (2011) and Chen et al. (2021).
In order to further evaluate the long-term SD trends of lakes in different geographic regions, China was divided into five limnetic regions (Ma et al., 2011; Chen et al., 2021), i.e., the Northeast Mountain Plain Region (NER), Eastern Plain Region (EPR), Yunnan–Guizhou Plateau Region (YGR), Qinghai–Tibet Plateau Region (QTR), and the Mongolian–Xinjiang Plateau Region (MXR) (Fig. 9). The statistics of lakes with an area > 1 km2 and an area ≤ 1 km2 are shown in Fig. 9b and c, respectively. It can be seen that the number of lakes with an area ≤ 1 km2 in each region was far greater than that of lakes with an area > 1 km2, but their accumulation area was much smaller than that of lakes with an area > 1 km2. Furthermore, the number and area of lakes in QTR were the highest, while those in YGR were the lowest.
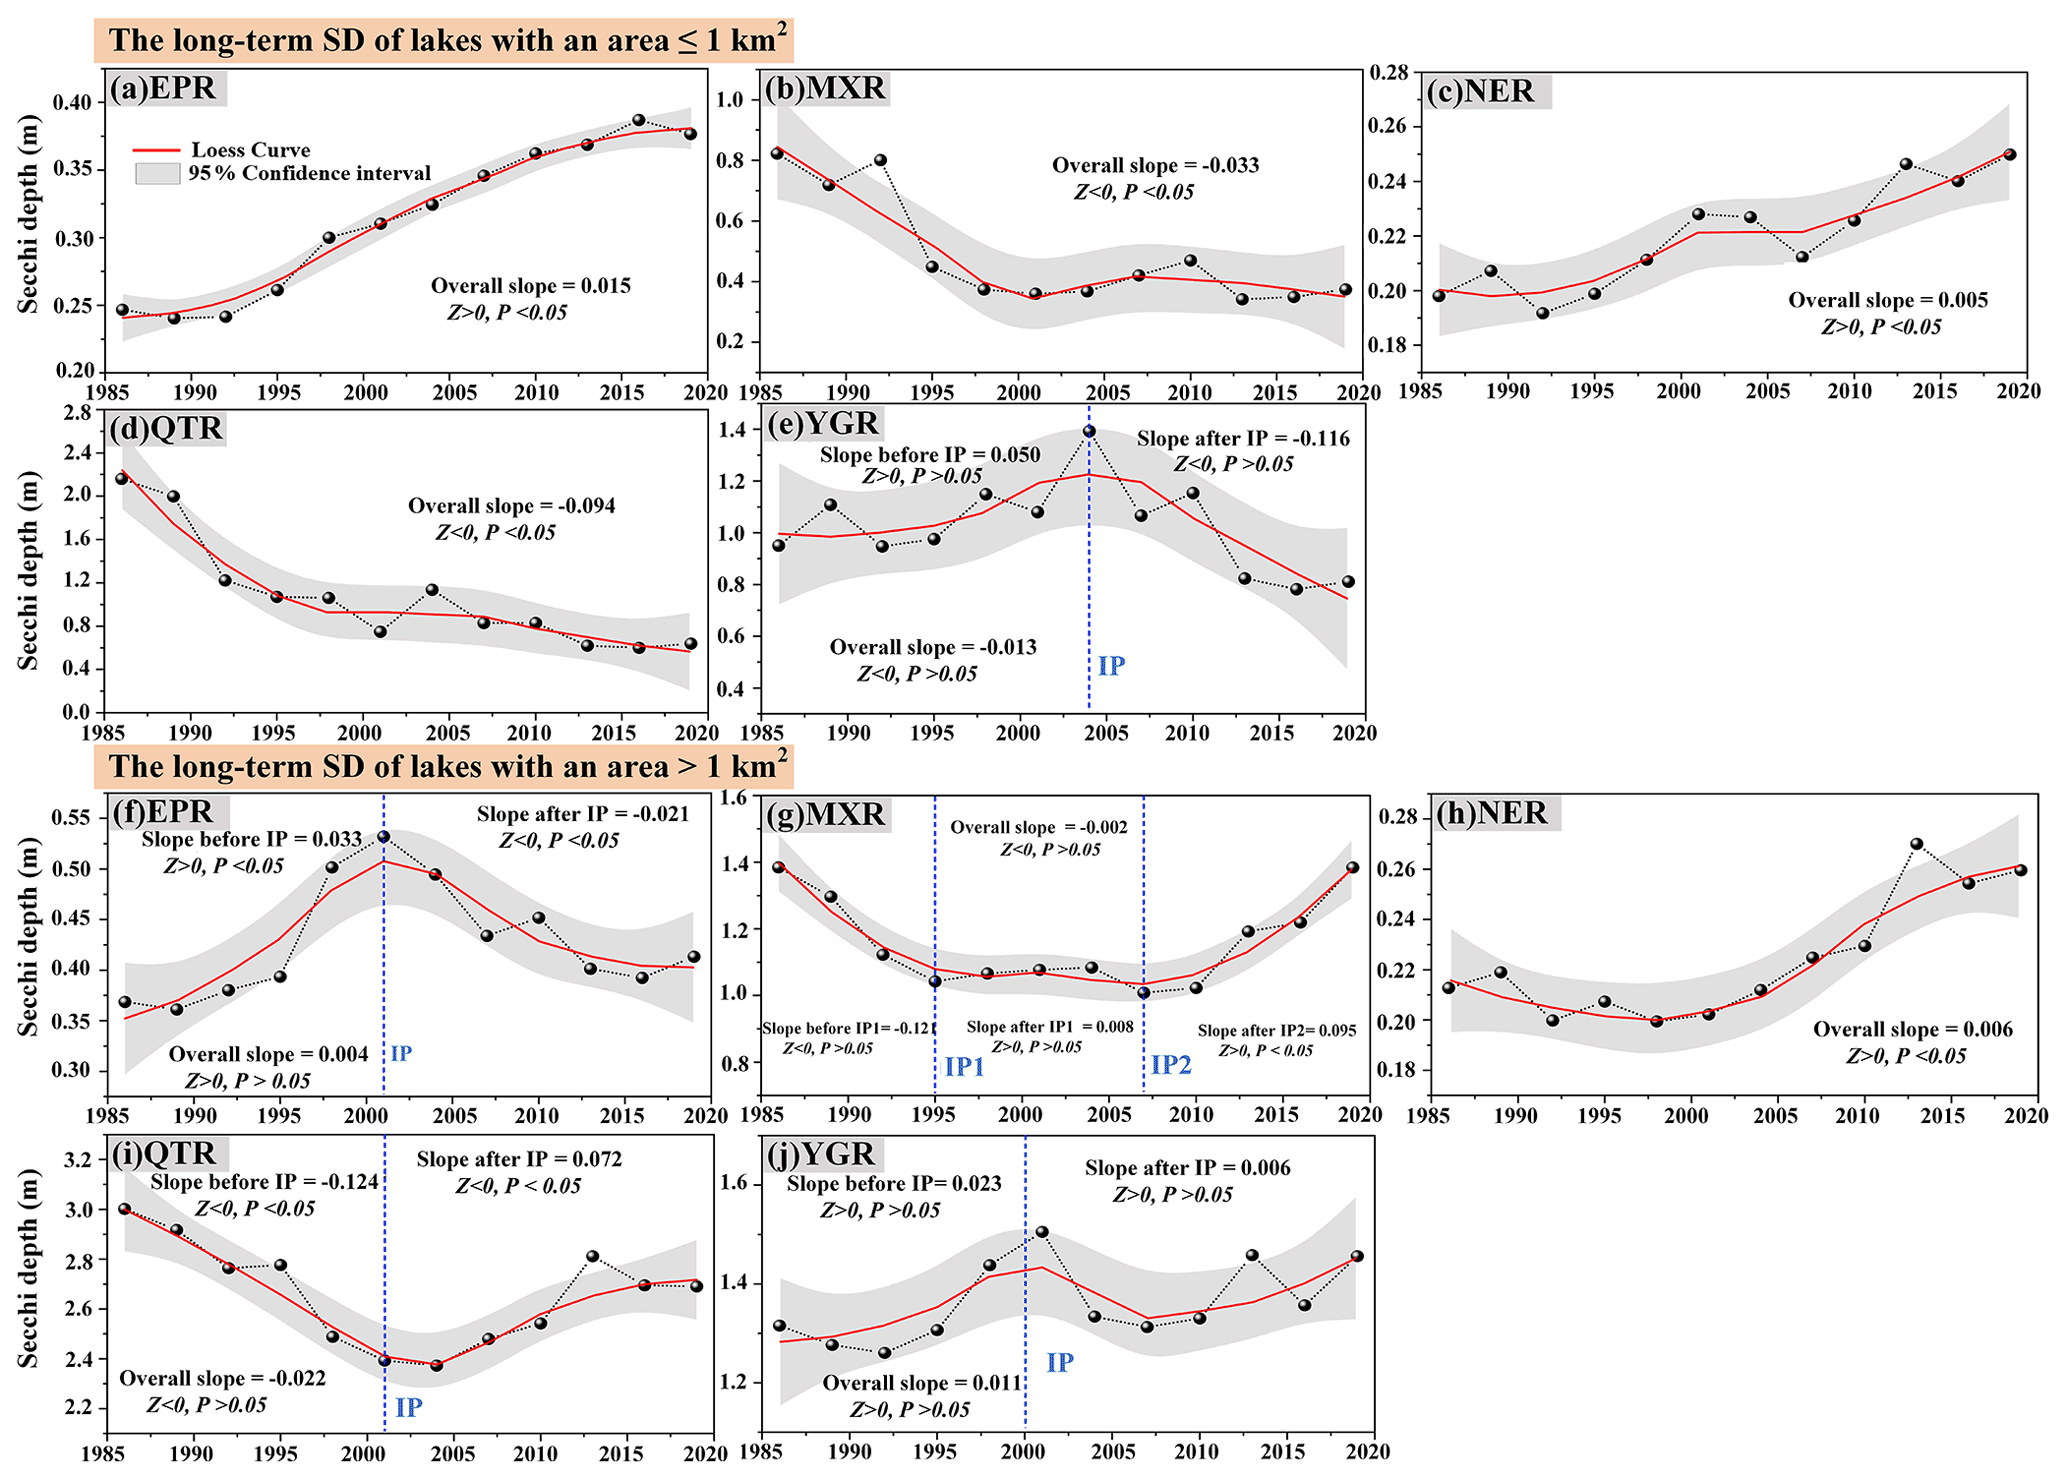
Figure 10The long-term SD trend of lakes in each limnetic region from 1985 to 2020. (a–e) The long-term SD trend of lakes with an area ≤ 1 km2 in each region and (f–j) the long-term SD trend of lakes with an area > 1 km2 in each region. Note: EPR – Eastern Plain Region, MXR – Mongolian–Xinjiang Plateau Region, NER – Northeast Mountain Plain Region, QTR – Qinghai–Tibet Plateau Region, YGR – Yunnan–Guizhou Plateau Region, and IP – inflection point.
Figure 10 gives the long-term SD trend of lakes in each limnetic region. For lakes ≤ 1 km2 (Fig. 10a–e), it can be seen that, except for MXR and QTR, the SD of the lakes in other regions did not show a significant decreasing trend (P > 0.05) during the entire analysis period. Moreover, the SD of small lakes (area ≤ 1 km2) in EPR and NER showed obvious increases (Z > 0, P < 0.05) since 1985, with average change rates of 0.015 and 0.005 m yr−1, respectively. Although the SD of small lakes in MXR and QTR experienced significant downward trends over the past 35 years, the decline rates slowed down after the beginning of the 21st century (with rates of 0.001 m yr−1 in MXR and −0.045 m yr−1 in QTR after 2001), and the decrease trend had not been significant since 2001 (Z < 0, P > 0.05). Secondly, as for lakes > 1 km2, there were no dramatic decreases in SD in any of the five regions from 1985 to 2020. Moreover, the lakes with an area > 1 km2 in NER experienced a significant upward trend in water clarity (Z > 0, P < 0.05) over the past 35 years. Additionally, we can also see that the water clarity of lakes > 1 km2 in MXR and QTR significantly improved since the beginning of the 21st century. The SD of lakes > 1 km2 in YGR in 2020 was also higher than that in 1985. However, it should be noted that although the SD of lakes > 1 km2 in 2020 was also greater than that in 1985 in EPR, the SD of these lakes was characterized by a significant decrease, with a rate of −0.021 m yr−1 after 2001.
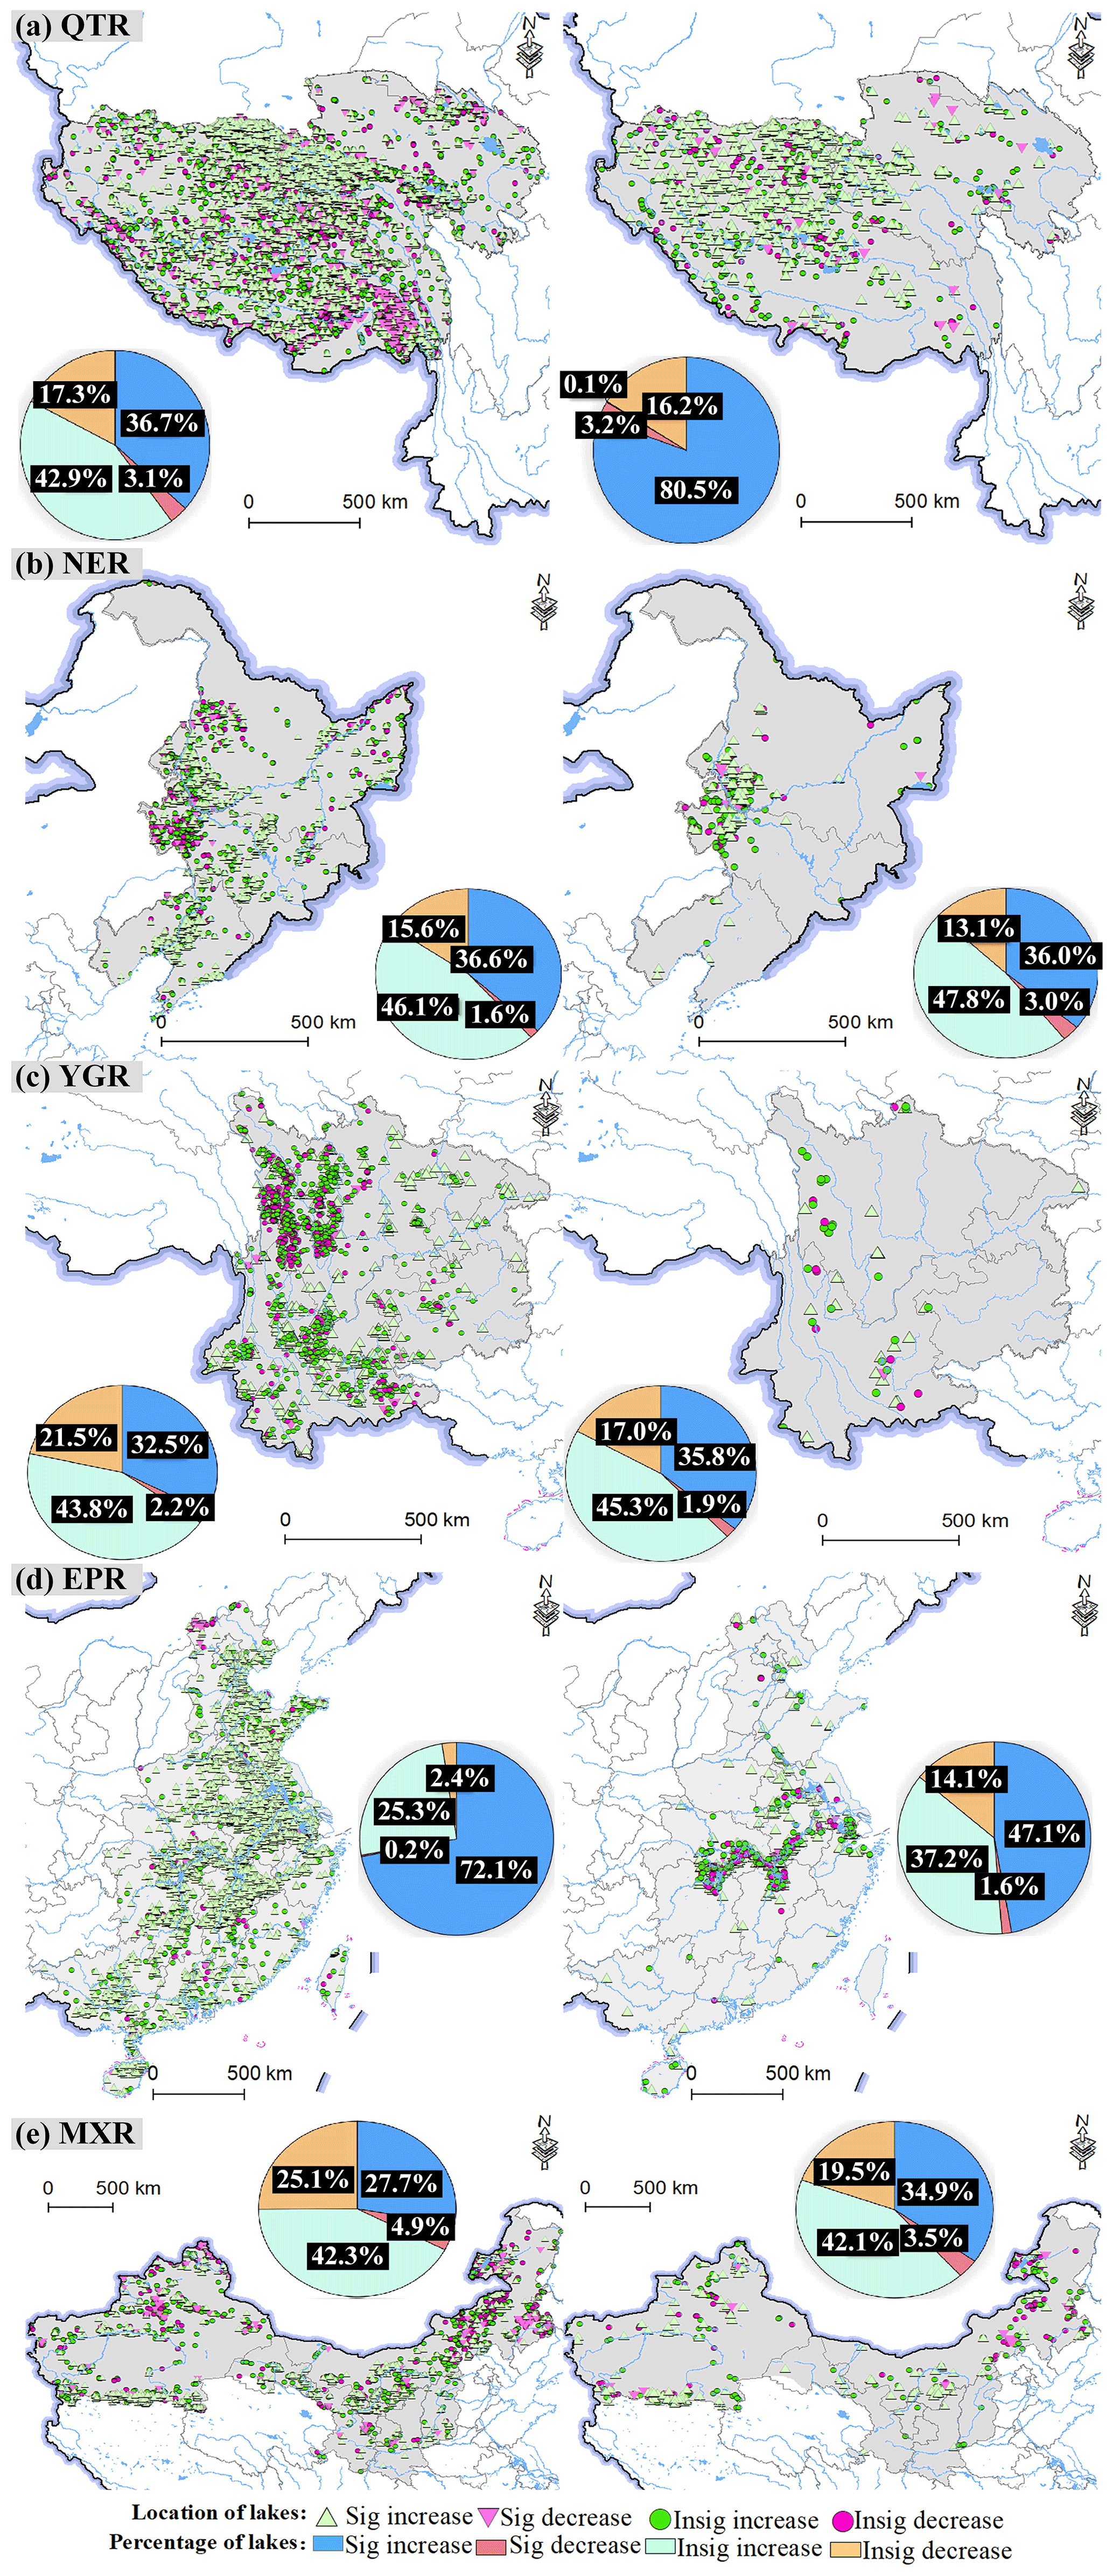
Figure 11The spatiotemporal patterns of SD in lakes in the five limnetic regions from 1985 to 2020 (from left to right are the spatiotemporal patterns of lakes with an area ≤ 1 km2 and the spatiotemporal patterns of lakes with an area > 1 km2). Note: Sig., significant and Insig., insignificant.
4.4 Spatiotemporal patterns of water clarity in lakes over China
The spatiotemporal patterns of SD in lakes in the five limnetic regions from 1985 to 2020 are shown in Fig. 11. Overall, for lakes with an area ≤ 1 and > 1 km2, the average proportions of lakes with an increasing SD trend were about 76.1 % and 81.3 %, respectively, in the five limnetic regions. In addition, the region with the lowest percentage of lakes tending to become clear (with an increasing trend) was still about 70.0 %. The above results indicate that most lakes in China exhibited a tendency to become clear in the period 1985–2020. Specifically, as for lakes with areas ≤ 1 km2 (hereinafter referred to as small lakes), the minimum proportion of small lakes whose SD was characterized by an increasing trend was in the MXR (about 70.0 %), while the maximum proportion appeared in the EPR (about 97.4 %). In addition, for lakes with areas > 1 km2 (hereinafter referred to as large lakes), the smallest and largest proportions of large lakes that had increasing trends were also in the MXR (about 77.0 %) and the EPR (about 84.3 %), respectively.
Focusing on the detailed spatial–temporal SD patterns in each limnetic region, there were basically no small lakes with a decreasing trend in SD (2.6 %) in the EPR. The individual small lakes that experienced downward trends in the EPR were mainly located at the northernmost regions and at the junction of the Hubei and Hunan Provinces. Moreover, as for the large lakes in the EPR, these were mainly distributed along the Yangtze River, and the lakes showing decreasing SD trends were mainly located in the middle reaches of the Yangtze River. Secondly, the MXR was the region with the minimum percentage of lakes that had an increasing trend among the five limnetic regions. Specifically, small lakes that exhibited decreasing trends were mainly located in the northeast and northwest of MXR, while large lakes that had decreasing trends were mainly distributed in the northeast areas of MXR. Additionally, in the NER, large and small lakes with decreasing SD were mainly distributed in the west and northeast of NER, accounting for 17.2 % of small lakes and 16.1 % of large lakes, respectively. Furthermore, in the QTR, most lakes were located in the north, center, and southeast. Among these lakes, most of the small lakes with a tendency to become turbid were located in the center, northeast, and southeast of QTR. In addition, the large lakes that were characterized by decreasing trends were mainly distributed in the central and northeast parts of the QTR. Lastly, as for the lakes in YGR, the small lakes that had a decreasing trend were mainly located in the northwest and southeast of YGR. In contrast, the number of large lakes in the YGR were relatively small (N = 53), and the lakes with a decreasing trend were mainly distributed in the southeast and west of YGR. Therefore, although most lakes had a tendency to become clearer from 1985 to 2020, there were still a considerable proportion of lakes whose SD experienced a downward trend over the past few decades, which suggests that effective water management is still required in many regions.
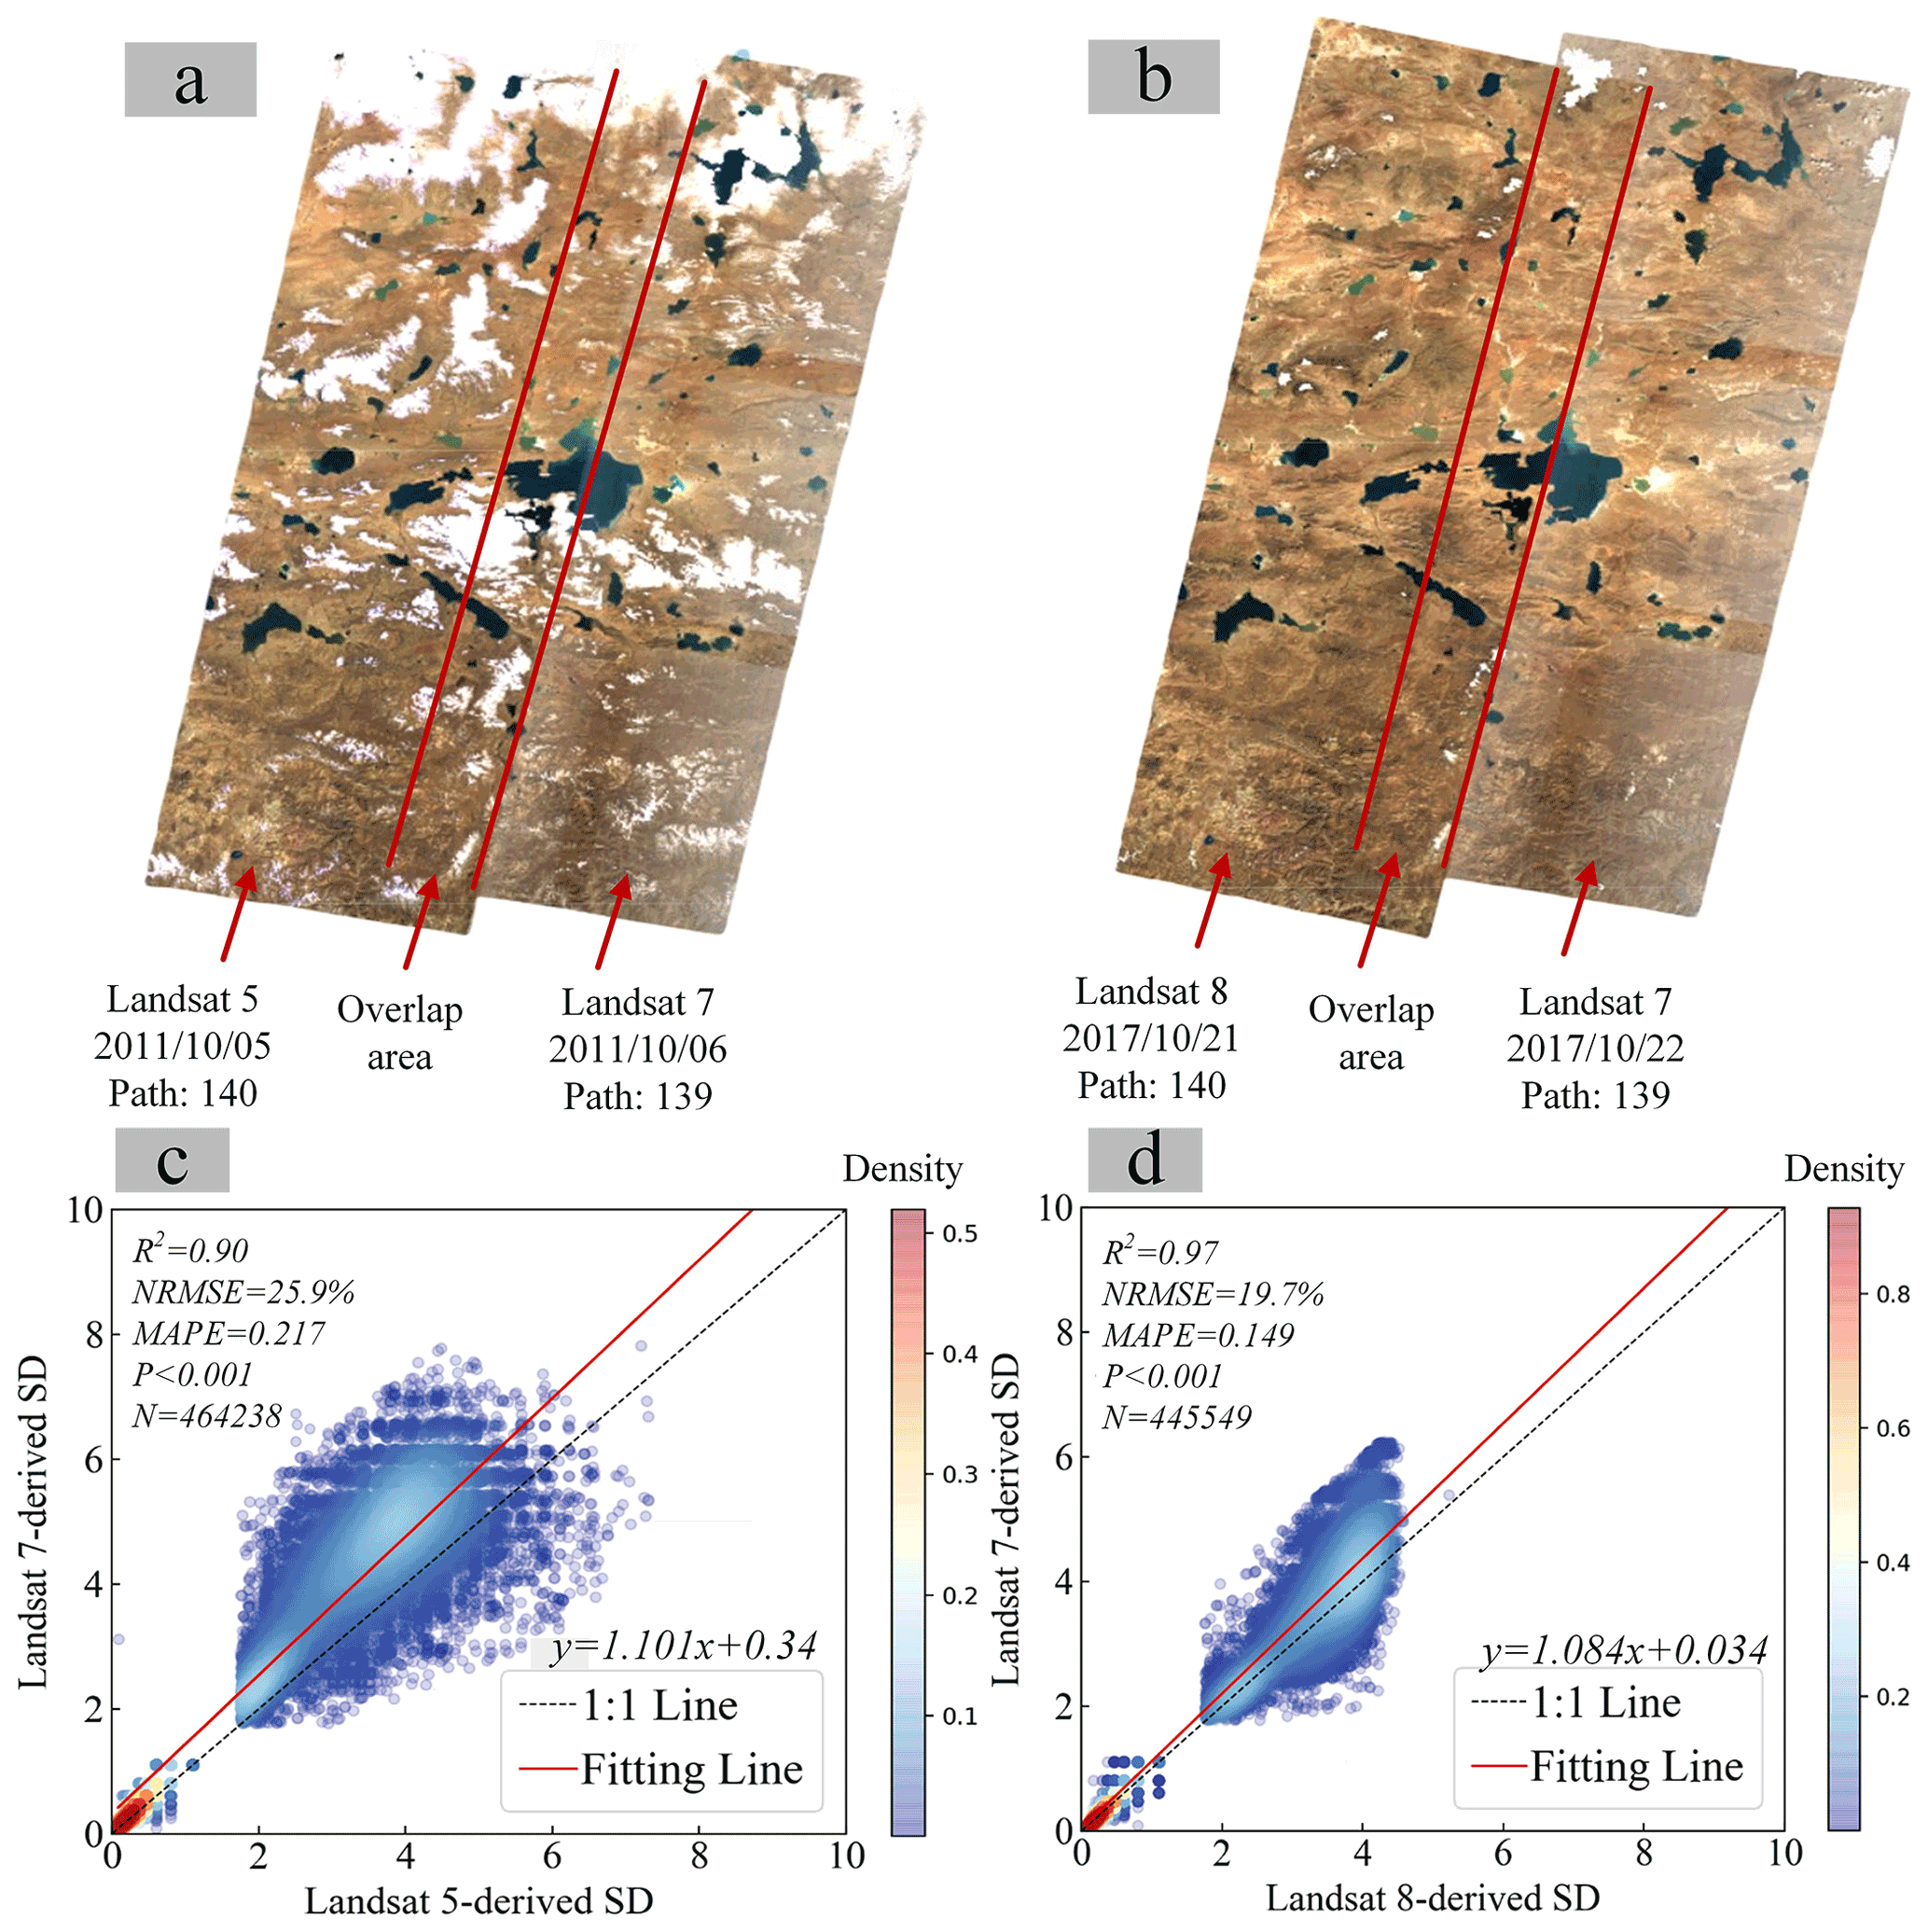
Figure 12Overlapping regions of Landsat 5 and 7 data, (a) Landsat 8 and 7 data (b), lake SD comparison for the Landsat 7 vs. 5 data, and (c) the Landsat 7 vs. 8 data (d) for the lakes from the overlap. The Landsat imagery for (a) and (b) come from the United States Geological Survey (https://earthexplorer.usgs.gov/, last access: 10 September 2021).
5.1 Consistency between the Landsat estimation SD results
Recently, many studies have demonstrated the feasibility of using long-term Landsat series data from GEE to assess the changes in lake clarity (Y. Zhang et al., 2021; Yin et al., 2021). In order to evaluate the comparability of our LAWSD30 dataset in monitoring long-term SD variations, the Landsat 5, 7, and 8 data for two adjacent tracks with overlapping areas were first selected to test the consistency between the Landsat estimation SD results (Fig. 12). The images of paths 139 and 140 were chosen because the lakes in this place are hardly affected by human activities and, thus, the SD of lakes can remain stable within a few days under stable weather conditions (Zhang et al., 2019). The Landsat 5 images were taken on 5 October 2011, the Landsat 8 images were taken on 21 October 017, and the Landsat 7 ETM+ images were taken on 6 October 2011 and 22 October 2017. Since the compared images were quasi-synchronized with each other in one day, the SD of water bodies was assumed to be the same for both images. Figure 12c and d shows scatterplots of the SD results for the overlapping regions. It can be seen that although the model coefficients of the three sensors were different in our calculation (Sect. 3.2), there was still strong consistency between the SD results of Landsat 5, 7, and 8, with an R2 of 0.90 for Landsat 5 vs. 7 and an R2 of 0.97 for Landsat 8 vs. 7 (Fig. 12). In addition, the NRMSE and MAPE for Landsat 5 vs. 7 and Landsat 8 vs. 7 were both lower than 26 % and 0.22, respectively. The above results demonstrate that the estimated SD results from Landsat 5, 7, and 8 data are highly consistent.
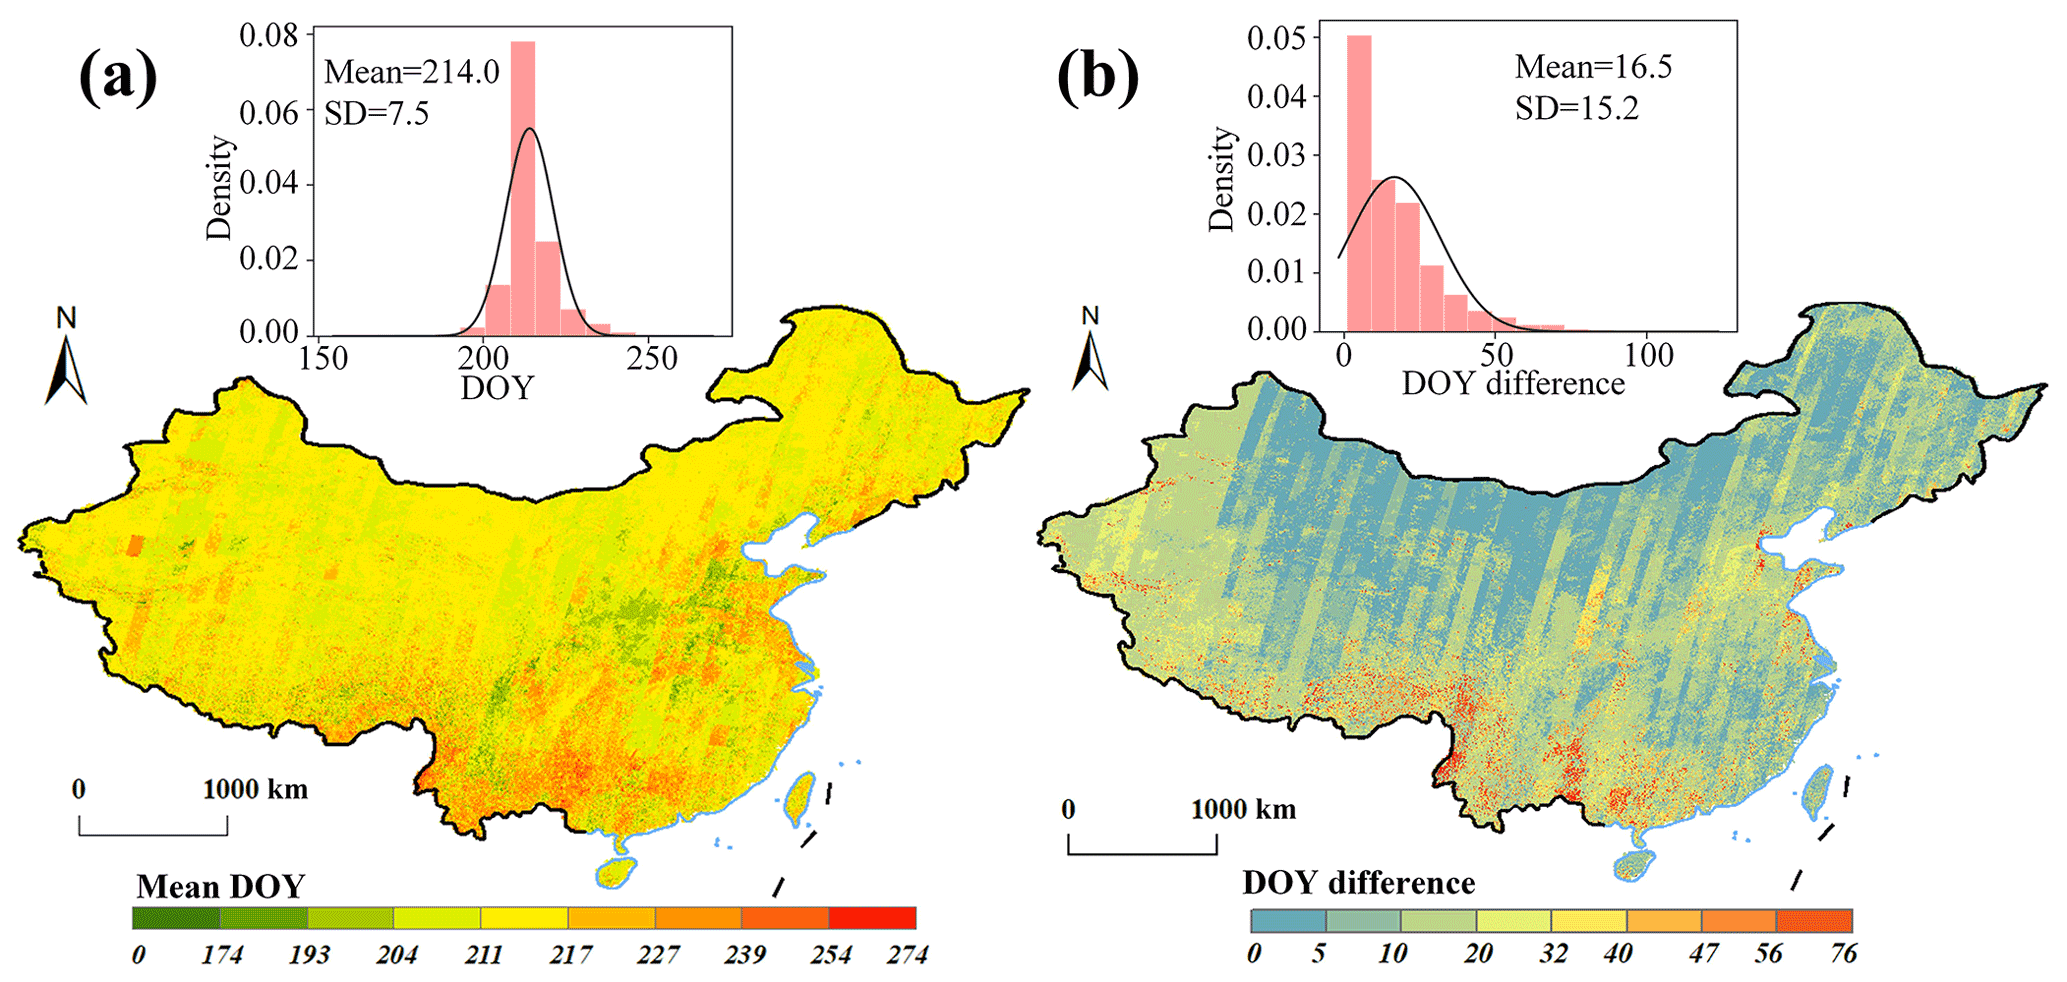
Figure 13The mean DOY of each pixel in the BAP composites from 1985 to 2020 and (a) the maximum DOY difference of each pixel location in the BAP composites from 1985 to 2020 (b). Note: SD – standard deviation.
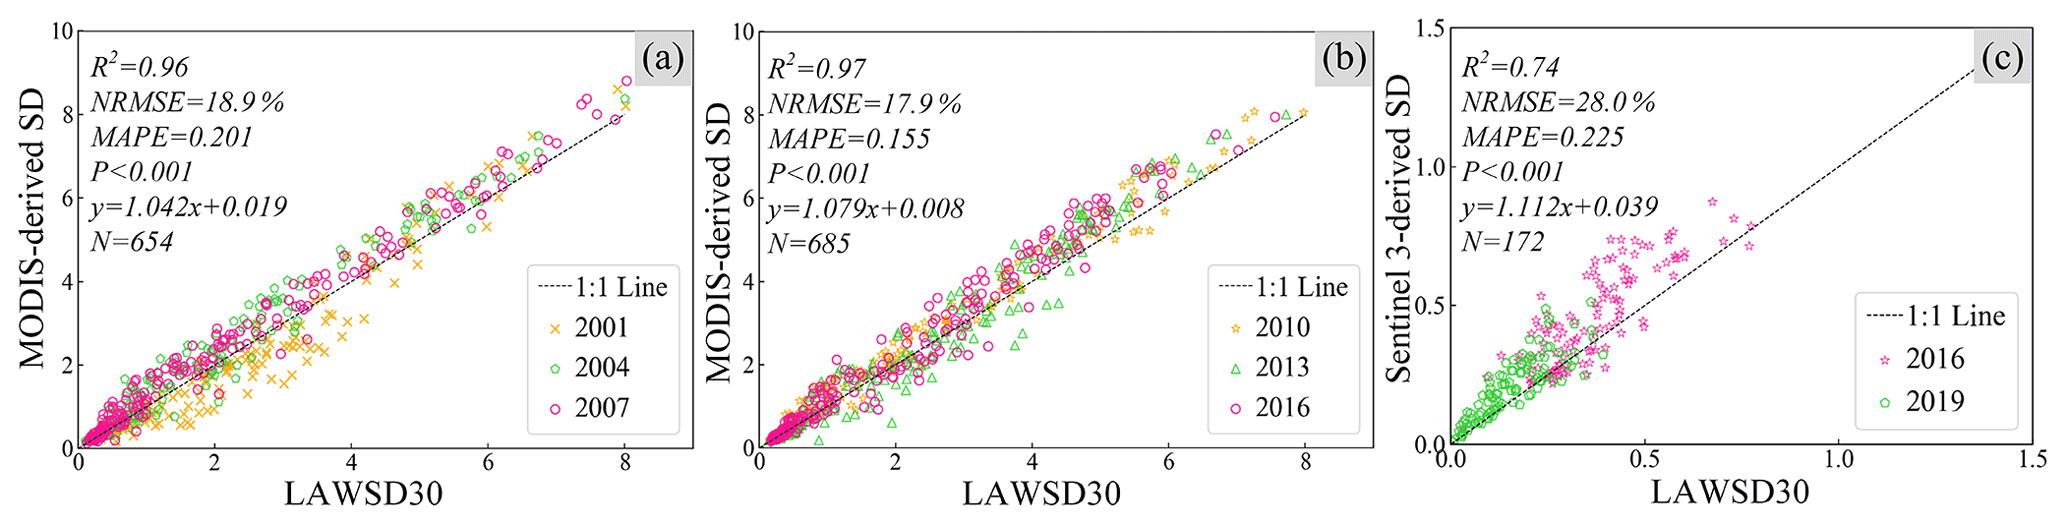
Figure 14(a, b) Scatterplots of our LAWSD30 data and the corresponding MODIS-derived SD data (Wang et al., 2020) in the 2000s (2001, 2004, and 2007) and 2010s (in 2010, 2013, and 2016), respectively, and (c) scatterplot of our LAWSD30 data and the corresponding Sentinel 3-derived SD data (Shen et al., 2020) in 2016 and 2019.
Moreover, since SD changes over time and our LAWSD30 dataset was calculated based on the BAP composites, it was also necessary to test the phenological consistency between the time series summer BAP composites. The mean DOY of each pixel in the BAP composites from 1985 to 2020 was calculated and is shown in Fig. 13a. In addition, the maximum DOY difference of each pixel location in the BAP composites from 1985 to 2020 was calculated and displayed in Fig. 13b. From Fig. 13a, most areas of China were composites based on images around DOY 214, and the mean standard deviation was only 7.5 d. Therefore, the developed BAP composites can effectively ensure the consistency of phenology between different regions across China. In addition, from Fig. 13b, the mean value of the maximum DOY difference across China was only 16.5 d, and the maximum DOY differences for most pixels across China (about 94 %) were within 32 d. Although the maximum DOY difference in parts of southern China exceeded 32 d due to the influence of clouds, most of these areas were mountainous with few lakes. In addition, since the phenology of these regions were in summer and the SD is relatively stable during this season (Mccullough et al., 2012; Kloiber et al., 2002), the consistency of water clarity in these areas can thus be considered not to have much impact on the final result. Therefore, the results displayed in Figs. 12 and 13 confirm the reliability of our LAWSD30 dataset to evaluate the long-term SD across China.
5.2 Cross-comparison with existing water clarity monitoring studies
To date, some past studies have also evaluated the water clarity of specific lakes in China (Shen et al., 2020; Wang et al., 2020). In order to further analyze the reliability of our estimated SD results across China, the results of this study were assessed against other existing water clarity monitoring studies. However, since most of the existing investigations focused on the annual average SD (Y. Zhang et al., 2021; Y. Li et al., 2020; Yin et al., 2021) and our LAWSD30 dataset is a summer SD dataset, it is a challenge to compare our results with other studies due to the different periods of interest. Fortunately, Wang et al. (2020) recently generated a time series summer SD dataset (for the period 2000–2017) for lakes > 25 km2 in China using water color parameters and MODIS data. Additionally, Shen et al. (2020) developed a multiyear monthly SD dataset (2016–2020) for 86 lakes in eastern China using Sentinel 3 images and a random forest regression SD model. Since both of the studies included SD results in summer, we had a unique opportunity to compare our SD estimates with theirs. The summer mean SD for each lake in the MODIS and the Sentinel 3-derived SD datasets was calculated and compared with our LAWSD30 dataset. As shown in Fig. 14, our LAWSD30 agreed well with both the MODIS and Sentinel 3-derived SD results. An average R2 of 0.96 was achieved when compared with the MODIS-derived results, and the average NMRSE and MAPE were only 18.4 % and 0.178, respectively (Fig. 14a and b). In addition, an R2 of 0.74, a NMRSE of 28.0 %, and a MAPE of 0.225 were shown in the comparison between the Sentinel 3-derived SD and our LAWSD30 dataset (Fig. 14c). Thus, the above results confirm the reliability of our long-term LAWSD30 dataset.
5.3 Limitations and suggestions for future work
First, due to the relative long revisit period of Landsat series data and the interference from clouds, our study is not suitable for the evaluation of the intra-annual changes in water clarity. The long-term intra-annual and seasonal SD changes of lakes across China still need to be evaluated. In the future, more efforts will be devoted to the use of more multi-source data to increase the number of valid observations, so as to conduct more analysis on SD at a seasonal scale.
Secondly, because this study is mainly focused on monitoring the long-term SD changes in lakes across China, the comprehensive analysis of the relationship between the variation of lake water clarity and environmental factors was not investigated. Since the discharge of agricultural fertilizers, industrial sewage, and livestock excrement within the lake drainage area, and the spatial–temporal variations of land use and land cover can affect the clarity of the water bodies (Y. Li et al., 2020), data on related factors should be collected and analyzed. In addition, the topographic conditions of the lake basin, such as the slope of the lake shoreline and the size of the recharge river, and the extreme weather and climate events (i.e., drought and heat events) (C. Liu et al., 2021; Yu and Zhai, 2020) may also have important impacts on the lake clarity. In future work, we will do more investigations to analyze the above potential driver factors of SD changes.
Water clarity is one of the most intuitive and important indicators of water quality. In order to improve our understanding of the long-term spatiotemporal patterns of lake water clarity in China, a long-term LAWSD30 dataset with a 3-year temporal interval was first developed for the period 1985–2020 using Landsat series data and the GEE platform. The dataset exhibited good performance when compared with concurrent in situ SD measurements (with an R2 of 0.86 and a RMSE of 0.225 m), thus confirming the reliability of our LAWSD30 dataset.
Subsequently, based on the generated LAWSD30 dataset, the national-scale long-term SD estimations of lakes in China (N = 40,973) over the past 35 years were analyzed. It was found that the SD of lakes with an area ≤ 1 km2 showed a significant decreasing trend during the period 1985–2020, but the decline rate began to slow down and stabilized after 2001. Regarding the SD of lakes with an area > 1 km2, a significant downward trend was seen before 2001, and it began to increase significantly afterwards. In addition, in terms of the spatial patterns, the small lakes showing a decreasing SD trend during 1985–2020 accounted for the largest proportion in MXR (about 30.0 %), followed by YGR (23.8 %), QTR (20.4 %), NER (17.2 %), and EPR (2.6 %). Additionally, for large lakes, this proportion was the largest in MXR (about 23.0 %), followed by QTR (19.4 %), YGR (18.9 %), EPR (17.7 %), and NER (16.1 %). The above results indicate that although the clarity of lakes in China has shown an improving trend since the 21st century, there has still been a considerable proportion of lakes experiencing a downward SD trend over the past few decades. This study can give effective guidance for the management and restoration of lake water environments.
In order to generate the BAP composites, three criteria (i.e., the DOY criteria (Eq. A1), the cloud and cloud shadow criteria (Eq. A2), and the atmospheric opacity criteria (Eq. A3) were selected:
where μ and σ represent the target DOY and the standard deviation of the DOY, respectively, and xj is the DOY for image j. The target DOY μ and the standard deviation of the DOY was set to 1 August and 60, respectively. Di is the distance from pixel i to cloud or cloud shadow, and Dreq is the minimum required distance, which was set to 50 here. Oi is the opacity of pixel i, while Omax and Omin are the minimum opacity value, respectively. Omax was set to 0.3 and Omin was set to 0.2. All parameters for the three criteria were set according to Chen et al. (2021). The BAP score was then derived as follows:
Because the software code involves some unpublished algorithms and papers of our team and other teams, the code is temporarily unavailable for public access.
Our long-term LAWSD30 dataset and the lake vector dataset generated for lakes with an area > 0.01 km2 are now available at https://doi.org/10.5281/zenodo.5734071 (Chen and Liu, 2021a) and https://doi.org/10.5281/zenodo.5734166 (Chen and Liu, 2021b), respectively.
XC, LL, and XZ conceived the experimental design, contributed to the manuscript, and performed experiments and validation. JL and SW helped with experiments, provided validation data, and assisted in editing the paper. YG and JM participated in the validation and experiments.
The contact author has declared that none of the authors has any competing interests.
Publisher's note: Copernicus Publications remains neutral with regard to jurisdictional claims in published maps and institutional affiliations.
The authors gratefully acknowledge the data support from “National Earth System Science Data Center, National Science & Technology Infrastructure of China (http://www.geodata.cn, last access: 1 December 2021)”, and the financial support provided for this research by the National Natural Science Foundation of China (grant nos. 41825002, 41971318, 41901272), and the Strategic Priority Research Program of the Chinese Academy of Sciences (grant no. XDA19090125).
This research has been supported by the Strategic Priority Research Program of the Chinese Academy of Sciences (grant no. XDA19090122) and the National Natural Science Foundation of China (grant nos. 41825002, 41971318, and 41901272).
This paper was edited by Anas Ghadouani and reviewed by two anonymous referees.
Barnes, A.: Muddy Waters: The Public Health Risks and Sustainability of Bottled Water in China, Vermont Law Review, 38, 971–1024, 2014.
Bastviken, D., Tranvik, L. J., Downing, J. A., Crill, P. M., and Enrich-Prast, A.: Freshwater Methane Emissions Offset the Continental Carbon Sink, Science, 331, 50, https://doi.org/10.1126/science.1196808, 2011.
Biggs, J., von Fumetti, S., and Kelly-Quinn, M.: The importance of small waterbodies for biodiversity and ecosystem services: implications for policy makers, Hydrobiologia, 793, 3–39, https://doi.org/10.1007/s10750-016-3007-0, 2017.
Brönmark, C. and Hansson, L.: Environmental issues in lakes and ponds: current state and perspectives, Environ. Conserv., 29, 290–306, 2002.
Cao, Z., Duan, H., Feng, L., Ma, R., and Xue, K.: Climate-and human-induced changes in suspended particulate matter over Lake Hongze on short and long timescales, Remote Sens. Environ., 192, 98–113, https://doi.org/10.1016/j.rse.2017.02.007, 2017.
Carlson, R. E.: A trophic state index for lakes, Limnol. Oceanogr., 22, 361–369, https://doi.org/10.4319/lo.1977.22.2.0361, 1977.
Chen, X. and Liu, L.: The 30 m long-term LAke Water Secchi Depth (SD) dataset (LAWSD30) of China (1985–2020), Zenodo [data set], https://doi.org/10.5281/zenodo.5734071, 2021a.
Chen, X. and Liu, L.: Natural Lake Dataset in China (NLD_China), Zenodo [data set], https://doi.org/10.5281/zenodo.5734166, 2021b.
Chen, X., Liu, L., Zhang, X., Li, J., and Song, K.: An assessment of water color for inland water in China using a Landsat 8-derived Forel-Ule index and the Google Earth Engine platform, IEEE J. Select. Top. Appl. Earth Obs. Remote Sens., 99, 5773–5785, https://doi.org/10.1109/JSTARS.2021.3085411, 2021.
CIE: Commission Internationale de l'Éclairage Proceedings, Cambridge University Press, Cambridge, UK, 1932.
Cuffney, T. F., Meador, M. R., Porter, S. D., and Gurtz, M. E.: Responses of Physical, Chemical, and Biological Indicators of Water Quality to a Gradient of Agricultural Land Use in the Yakima River Basin, Washington, Environ. Monit. Assess., 64, 259–270, https://doi.org/10.1023/A:1006473106407, 2000.
Dai, Y., Feng, L., Hou, X., and Tang, J.: An automatic classification algorithm for submerged aquatic vegetation in shallow lakes using Landsat imagery, Remote Sens. Environ., 260, 112459, https://doi.org/10.1016/j.rse.2021.112459, 2021.
Dona, C., Sanchez, J. M., Caselles, V., Dominguez, J. A., and Camacho, A.: Empirical Relationships for Monitoring Water Quality of Lakes and Reservoirs Through Multispectral Images, IEEE J. Sel. Top. Appl., 7, 1632–1641, https://doi.org/10.1109/JSTARS.2014.2301295, 2014.
Downing, J. A., Cole, J. J., Duarte, C. M., Middelburg, J. J., Melack, J. M., Prairie, Y. T., Kortelainen, P., Striegl, R. G., McDowell, W. H., and Tranvik, L. J.: Global abundance and size distribution of streams and rivers, Inland Waters, 2, 229–236, https://doi.org/10.5268/iw-2.4.502, 2012.
Feng, L., Hou, X., and Zheng, Y.: Monitoring and understanding the water transparency changes of fifty large lakes on the Yangtze Plain based on long-term MODIS observations, Remote Sens. Environ., 221, 675–686, https://doi.org/10.1016/j.rse.2018.12.007, 2019.
Garaba, S., Friedrichs, A., Voß, D., and Zielinski, O.: Classifying Natural Waters with the Forel-Ule Colour Index System: Results, Applications, Correlations and Crowdsourcing, Int. J. Env. Res. Pub. He., 12, 16096–16109, https://doi.org/10.3390/ijerph121215044, 2015.
Garnesson, P., Mangin, A., Fanton d'Andon, O., Demaria, J., and Bretagnon, M.: The CMEMS GlobColour chlorophyll a product based on satellite observation: multi-sensor merging and flagging strategies, Ocean Sci., 15, 819–830, https://doi.org/10.5194/os-15-819-2019, 2019.
Gomez, C., White, J. C., and Wulder, M. A.: Optical remotely sensed time series data for land cover classification: A review, ISPRS J. Photogramm., 116, 55–72, https://doi.org/10.1016/j.isprsjprs.2016.03.008, 2016.
Gorelick, N., Hancher, M., Dixon, M., Ilyushchenko, S., Thau, D., and Moore, R.: Google Earth Engine: Planetary-scale geospatial analysis for everyone, Remote Sens. Environ., 202, 18–27, https://doi.org/10.1016/j.rse.2017.06.031, 2017.
Griffiths, P., van der Linden, S., Kuemmerle, T., and Hostert, P.: Pixel-Based Landsat Compositing Algorithm for Large Area Land Cover Mapping, IEEE J. Sel. Top. Appl., 6, 2088–2101, https://doi.org/10.1109/jstars.2012.2228167, 2013.
Griffiths, P., Kuemmerle, T., Baumann, M., Radeloff, V. C., Abrudan, I. V., Lieskovsky, J., Munteanu, C., Ostapowicz, K., and Hostert, P.: Forest disturbances, forest recovery, and changes in forest types across the Carpathian ecoregion from 1985 to 2010 based on Landsat image composites, Remote Sens. Environ., 151, 72–88, https://doi.org/10.1016/j.rse.2013.04.022, 2014.
Guo, L.: Ecology – Doing battle with the green monster of Taihu Lake, Science, 317, 1166–1166, https://doi.org/10.1126/science.317.5842.1166, 2007.
Hermosilla, T., Wulder, M. A., White, J. C., Coops, N. C., and Hobart, G. W.: An integrated Landsat time series protocol for change detection and generation of annual gap-free surface reflectance composites, Remote Sens. Environ., 158, 220–234, https://doi.org/10.1016/j.rse.2014.11.005, 2015.
Hu, C.: A novel ocean color index to detect floating algae in the global oceans, Remote Sens. Environ., 113, 2118–2129, https://doi.org/10.1016/j.rse.2009.05.012, 2009.
Hu, H.: Population distribution, regionalization, and prospects in China, Acta Geographica Sinica, 45, 139–145, 1990.
Islam, M. M.: Analyses of ASTER and Spectroradiometer Data with in Situ Measurements for Turbidity and Transparency Study of Lake Abashiri, International Journal of Geoinformatics, 87, 76–77, 2006.
Kendall, M. G.: Rank Correlation Methods, Brit. J. Psychol., 25, 86–91, https://doi.org/10.1111/j.2044-8295.1934.tb00727.x, 1990.
Kloiber, S. N., Brezonik, P. L., Olmanson, L. G., and Bauer, M. E.: A procedure for regional lake water clarity assessment using Landsat multispectral data, Remote Sens. Environ., 82, 38–47, https://doi.org/10.1016/s0034-4257(02)00022-6, 2002.
Lacaux, J. P., Tourre, Y. M., Vignolles, C., Ndione, J. A., and Lafaye, M.: Classification of ponds from high-spatial resolution remote sensing: Application to Rift Valley Fever epidemics in Senegal, Remote Sens. Environ., 106, 66–74, https://doi.org/10.1016/j.rse.2006.07.012, 2007.
Lee, Z., Arnone, R., Boyce, D., Franz, B., and Wilson, C.: Global Water Clarity: Continuing a Century-Long Monitoring, Marine Sci. Facult. Publ., 99, 1984, https://doi.org/10.1029/2018EO097251, 2018.
Li, J., Wang, S., Wu, Y., Zhang, B., Chen, X., Zhang, F., Shen, Q., Peng, D., and Tian, L.: MODIS observations of water color of the largest 10 lakes in China between 2000 and 2012, Int. J. Digit. Earth, 9, 788–805, https://doi.org/10.1080/17538947.2016.1139637, 2016.
Li, N., Shi, K., Zhang, Y., Gong, Z., Peng, K., Zhang, Y., and Zha, Y.: Decline in Transparency of Lake Hongze from Long-Term MODIS Observations: Possible Causes and Potential Significance, Remote Sens.-Basel, 11, 177, https://doi.org/10.3390/rs11020177, 2019.
Li, Y., Shi, K., Zhang, Y., Zhu, G., Zhang, Y., Wu, Z., Liu, M., Guo, Y., and Li, N.: Analysis of water clarity decrease in Xin’anjiang Reservoir, China, from 30-Year Landsat TM, ETM plus, and OLI observations, J. Hydrol., 590, 125476, https://doi.org/10.1016/j.jhydrol.2020.125476, 2020.
Li, Z., Cao, Y., Tang, J., Wang, Y., Duan, Y., Jiang, Z., and Qu, Y.: Relationships between Temporal and Spatial Changes in Lakes and Climate Change in the Saline-Alkali Concentrated Distribution Area in the Southwest of Songnen Plain, Northeast China, from 1985 to 2015, Water, 12, 3557, https://doi.org/10.3390/w12123557, 2020.
Liu, C., Zhu, L., Li, J., Wang, J., Ju, J., Qiao, B., Ma, Q., and Wang, S.: The increasing water clarity of Tibetan lakes over last 20 years according to MODIS data, Remote Sens. Environ., 253, 112199, https://doi.org/10.1016/j.rse.2020.112199, 2021.
Liu, D., Duan, H., Loiselle, S., Hu, C., Zhang, G., Li, J., Yang, H., Thompson, J. R., Cao, Z., Shen, M., Ma, R., Zhang, M., and Han, W.: Observations of water transparency in China's lakes from space, International Journal of Applied Earth Observations and Geoinformation, 92, 102187, https://doi.org/10.1016/j.rse.2020.111950 2020.
Liu, L., Zhang, X., Gao, Y., Chen, X., Xie, S., and Mi, J.: Finer-Resolution Mapping of Global Land Cover: Recent Developments, Consistency Analysis, and Prospects, J. Remote Sens., 2021, 38, https://doi.org/10.34133/2021/5289697, 2021.
Liu, X., Lee, Z., Zhang, Y., Lin, J., and Sun, Z.: Remote Sensing of Secchi Depth in Highly Turbid Lake Waters and Its Application with MERIS Data, Remote Sens.-Basel, 11, 2226, https://doi.org/10.3390/rs11192226, 2019.
Liu, Y., Chen, C., and Li, Y.: Differentiation regularity of urban-rural equalized development at prefecture-level city in China, J. Geogr. Sci., 25, 1075–1088, https://doi.org/10.1007/s11442-015-1220-9, 2015.
Ma, H., Xu, J., and Wang, P.: Water Resource Utilization and China's Urbanization, Resources Science, 36, 334–341, 2014.
Ma, R., Yang, G., Duan, H., Jiang, J., Wang, S., Feng, X., Li, A., Kong, F., Xue, B., Wu, J., and Li, S.: China's lakes at present: Number, area and spatial distribution, Sci. China-Earth Sci., 54, 283–289, https://doi.org/10.1007/s11430-010-4052-6, 2011.
Mann, H. B.: Non-parametric tests against trend, Econometrica, 13, 245–259, https://doi.org/10.2307/1907187, 1945.
McCullough, I. M., Loftin, C. S., and Sader, S. A.: Combining lake and watershed characteristics with Landsat TM data for remote estimation of regional lake clarity, Remote Sens. Environ., 123, 109–115, https://doi.org/10.1016/j.rse.2012.03.006, 2012.
Ministry of Ecology and Environment of the People's Republic of China: Report on the State of the Ecology and Environment in China, Ministry of Ecology and Environment of the People's Republic of China, Beijing, http://english.mee.gov.cn/Resources/Reports/, last access: 30 December 2020.
Murshed, M. F., Aslam, Z., Lewis, R., Chow, C., Wang, D., Drikas, M., and Leeuwen, J. V.: Changes in the quality of river water before, during and after a major flood event associated with a La Nia cycle and treatment for drinking purposes, J. Environ. Sci., 26, 1985–1993, https://doi.org/10.1016/j.jes.2014.08.001, 2014.
Novoa, S., Wernand, M. R., and van der Woerd, H. J.: The Forel-Ule scale revisited spectrally: preparation protocol, transmission measurements and chromaticity, J. Eur. Opt. Soc.-Rapid, 8, 13057, https://doi.org/10.2971/jeos.2013.13057, 2013.
Odermatt, D., Gitelson, A., Brando, V. E., and Schaepman, M.: Review of constituent retrieval in optically deep and complex waters from satellite imagery, Remote Sens. Environ., 118, 0–126, https://doi.org/10.1016/j.rse.2011.11.013, 2012.
Olmanson, L., Bauer, M., and Brezonik, P.: A 20-year Landsat water clarity census of Minnesota's 10,000 lakes, Remote Sens. Environ., 112, 4086–4097, https://doi.org/10.1016/j.rse.2007.12.013, 2008.
Olmanson, L. G., Brezonik, P. L., Finlay, J. C., and Bauer, M. E.: Comparison of Landsat 8 and Landsat 7 for regional measurements of CDOM and water clarity in lakes, Remote Sens. Environ., 185, 119–128, https://doi.org/10.1016/j.rse.2016.01.007, 2016.
Page, B. P., Olmanson, L. G., and Mishra, D. R.: A harmonized image processing workflow using Sentinel-2/MSI and Landsat-8/OLI for mapping water clarity in optically variable lake systems, Remote Sens. Environ., 231, 111284, https://doi.org/10.1016/j.rse.2019.111284, 2019.
Palmer, S. C. J., Kutser, T., and Hunter, P. D.: Remote sensing of inland waters: Challenges, progress and future directions, Remote Sens. Environ., 157, 1–8, https://doi.org/10.1016/j.rse.2014.09.021, 2015.
Pekel, J. F., Cottam, A., Gorelick, N., and Belward, A. S.: High-resolution mapping of global surface water and its long-term changes, Nature, 540, 418–422, https://doi.org/10.1038/nature20584, 2016.
Pitarch, J., van der Woerd, H. J., Brewin, R. J. W., and Zielinski, O.: Optical properties of Forel-Ule water types deduced from 15 years of global satellite ocean color observations, Remote Sens. Environ., 231, https://doi.org/10.1016/j.rse.2019.111249, 2019.
Racetin, I., Krtalic, A., Srzic, V., and Zovko, M.: Characterization of short-term salinity fluctuations in the Neretva River Delta situated in the southern Adriatic Croatia using Landsat-5 TM, Ecol. Indic., 110, 105924, https://doi.org/10.1016/j.ecolind.2019.105924, 2020.
Shen, M., Duan, H., Cao, Z., Xue, K., Qi, T., Ma, J., Liu, D., Song, K., Huang, C., and Song, X.: Sentinel-3 OLCI observations of water clarity in large lakes in eastern China: Implications for SDG 6.3.2 evaluation, Remote Sens. Environ., 247, 111950, https://doi.org/10.1016/j.rse.2020.111950, 2020.
Shi, K., Zhang, Y., Zhu, G., Qin, B., and Pan, D.: Deteriorating water clarity in shallow waters: Evidence from long term MODIS and in-situ observations, Int. J. Appl. Earth Obs., 68, 287–297, https://doi.org/10.1016/j.jag.2017.12.015, 2018.
Singh, S. P. and Singh, P.: Effect of temperature and light on the growth of algae species: A review, Renew. Sust. Energ. Rev., 50, 431–444, https://doi.org/10.1016/j.rser.2015.05.024, 2015.
Song, K., Wen, Z., Xu, Y., Yang, H., Lyu, L., Zhao, Y., Fang, C., Shang, Y., and Du, J.: Dissolved carbon in a large variety of lakes across five limnetic regions in China, J. Hydrol., 563, 143–154, https://doi.org/10.1016/j.jhydrol.2018.05.072, 2018.
Song, K., Liu, G., Wang, Q., Wen, Z., Lyu, L., Du, Y., Sha, L., and Fang, C.: Quantification of lake clarity in China using Landsat OLI imagery data, Remote Sens. Environ., 243, 111800, https://doi.org/10.1016/j.rse.2020.111800, 2020.
Steyerberg, E. W.: Regression Modeling Strategies: With Applications, to Linear Models, Logistic and Ordinal Regression, and Survival Analysis, Biometrics, 72, 1006–1007, https://doi.org/10.1007/978-3-319-19425-7, 2016.
USGS: Preliminary Assessment of the Value of Landsat 7 ETM+ Data Following Scan Line Corrector Malfunction, US Geological Survey, Sioux Falls, SD, https://d9-wret.s3.us-west-2.amazonaws.com/assets/palladium/production/s3fs-public/atoms/files/SLC_off_Scientific_Usability.pdf (last access: 20 December 2018), 2003.
van der Woerd, H. J. and Wernand, M. R.: True Colour Classification of Natural Waters with Medium-Spectral Resolution Satellites: SeaWiFS, MODIS, MERIS and OLCI, Sensors, 15, 25663–25680, https://doi.org/10.3390/s151025663, 2015.
van der Woerd, H. J. and Wernand, M. R.: Hue-Angle Product for Low to Medium Spatial Resolution Optical Satellite Sensors, Remote Sens.-Basel, 10, 180, https://doi.org/10.3390/rs10020180, 2018.
Wang, S.: Large-scale and Long-time Water Quality Remote Sensing Monitoring over Lakes Based on Water Color Index, University of Chinese Academy of Sciences, Beijing, 2018.
Wang, S., Li, J., Zhang, B., Spyrakos, E., Tyler, A. N., Shen, Q., Zhang, F., Kutser, T., Lehmann, M. K., Wu, Y., and Peng, D.: Trophic state assessment of global inland waters using a MODIS-derived Forel-Ule index, Remote Sens. Environ., 217, 444–460, https://doi.org/10.1016/j.rse.2018.08.026, 2018.
Wang, S., Li, J., Zhang, B., Lee, Z., Spyrakos, E., Feng, L., Liu, C., Zhao, H., Wu, Y., Zhu, L., Jia, L., Wan, W., Zhang, F., Shen, Q., Tyler, A. N., and Zhang, X.: Changes of water clarity in large lakes and reservoirs across China observed from long-term MODIS, Remote Sens. Environ., 247, 111949, https://doi.org/10.1016/j.rse.2020.111949, 2020.
Wang, S., Li, J., Zhang, W., Cao, C., and Zhang, B.: A dataset of remote-sensed Forel-Ule Index for global inland waters during 2000–2018, Scientific Data, 8, 26, https://doi.org/10.1038/s41597-021-00807-z, 2021.
Wang, X. and Yang, W.: Water quality monitoring and evaluation using remote-sensing techniques in China: A systematic review, Ecosystem Health and Sustainability, 5, 47–56, https://doi.org/10.1080/20964129.2019.1571443, 2019.
White, J. C., Wulder, M. A., Hobart, G. W., Luther, J. E., Hermosilla, T., Griffiths, P., Coops, N. C., Hall, R. J., Hostert, P., Dyk, A., and Guindon, L.: Pixel-Based Image Compositing for Large-Area Dense Time Series Applications and Science, Can. J. Remote Sens., 40, 192–212, https://doi.org/10.1080/07038992.2014.945827, 2014.
Xie, S., Liu, L., Zhang, X., Yang, J., Chen, X., and Gao, Y.: Automatic Land-Cover Mapping using Landsat Time-Series Data based on Google Earth Engine, Remote Sens.-Basel, 11, 3023, https://doi.org/10.3390/rs11243023, 2019.
Xue, K., Ma, R., Duan, H., Shen, M., Boss, E., and Cao, Z.: Inversion of inherent optical properties in optically complex waters using sentinel-3A/OLCI images: A case study using China's three largest freshwater lakes, Remote Sens. Environ., 225, 328–346, https://doi.org/10.1016/j.rse.2019.03.006, 2019.
Yin, Z., Li, J., Liu, Y., Xie, Y., and Zhang, B.: Water clarity changes in Lake Taihu over 36 years based on Landsat TM and OLI observations, Int. J. Appl. Earth Obs., 102, 102457, https://doi.org/10.1016/j.jag.2021.102457, 2021.
Yu, R. and Zhai, P.: More frequent and widespread persistent compound drought and heat event observed in China, Scient. Rep., 10, 14576, https://doi.org/10.1038/s41598-020-71312-3, 2020.
Yuan, Z., Liang, C., and Li, D.: Urban stormwater management based on an analysis of climate change: A case study of the Hebei and Guangdong provinces, Landscape Urban Plan., 177, 217–226, https://doi.org/10.1016/j.landurbplan.2018.04.003, 2018.
Zhang, G., Yao, T., Chen, W., Zheng, G., Shum, C. K., Yang, K., Piao, S., Sheng, Y., Yi, S., Li, J., O'Reilly, C. M., Qi, S., Shen, S. S. P., Zhang, H., and Jia, Y.: Regional differences of lake evolution across China during 1960s-2015 and its natural and anthropogenic causes, Remote Sens. Environ., 221, 386–404, https://doi.org/10.1016/j.rse.2018.11.038, 2019.
Zhang, X., Liu, L., Wu, C., Chen, X., Gao, Y., Xie, S., and Zhang, B.: Development of a global 30 m impervious surface map using multisource and multitemporal remote sensing datasets with the Google Earth Engine platform, Earth Syst. Sci. Data, 12, 1625–1648, https://doi.org/10.5194/essd-12-1625-2020, 2020.
Zhang, X., Liu, L., Chen, X., Gao, Y., and Jiang, M.: Automatically Monitoring Impervious Surfaces Using Spectral Generalization and Time Series Landsat Imagery from 1985 to 2020 in the Yangtze River Delta, Journal of Remote Sensing, 2021, 9873816, https://doi.org/10.34133/2021/9873816, 2021.
Zhang, Y., Zhang, Y., Shi, K., Zhou, Y., and Li, N.: Remote sensing estimation of water clarity for various lakes in China, Water Res., 192, 116844, https://doi.org/10.1016/j.watres.2021.116844, 2021.
Zhou, Q. C., Wang, W. L., Huang, L. C., Zhang, Y. L., Qin, J., Li, K. D., and Chen, L.: Spatial and temporal variability in water transparency in Yunnan Plateau lakes, China, Aquat. Sci., 81, 36, https://doi.org/10.1007/s00027-019-0632-5, 2019.