the Creative Commons Attribution 4.0 License.
the Creative Commons Attribution 4.0 License.
 | 05 Jul 2022
Diel streamflow cycles suggest more sensitive snowmelt-driven streamflow to climate change than land surface modeling does
Sebastian A. Krogh
Lucia Scaff
James W. Kirchner
Beatrice Gordon
Gary Sterle
Adrian Harpold
Climate warming will cause mountain snowpacks to melt earlier, reducing summer streamflow and threatening water supplies and ecosystems. Quantifying how sensitive streamflow timing is to climate change and where it is most sensitive remain key questions. Physically based hydrological models are often used for this purpose; however, they have embedded assumptions that translate into uncertain hydrological projections that need to be quantified and constrained to provide reliable inferences. The purpose of this study is to evaluate differences in projected end-of-century changes to streamflow timing between a new empirical model based on diel (daily) streamflow cycles and regional land surface simulations across the mountainous western USA. We develop an observational technique for detecting streamflow responses to snowmelt using diel cycles of incoming solar radiation and streamflow to detect when snowmelt occurs. We measure the date of the 20th percentile of snowmelt days (DOS20) across 31 western USA watersheds affected by snow, as a proxy for the beginning of snowmelt-initiated streamflow. Historic DOS20 varies from mid-January to late May among our sites, with warmer basins having earlier snowmelt-mediated streamflow. Mean annual DOS20 strongly correlates with the dates of 25 % and 50 % annual streamflow volume (DOQ25 and DOQ50, both R2=0.85), suggesting that a 1 d earlier DOS20 corresponds with a 1 d earlier DOQ25 and 0.7 d earlier DOQ50. Empirical projections of future DOS20 based on a stepwise multiple linear regression across sites and years under the RCP8.5 scenario for the late 21st century show that DOS20 will occur on average 11±4 d earlier per 1 ∘C of warming. However, DOS20 in colder watersheds (mean November–February air temperature, ∘C) is on average 70 % more sensitive to climate change than in warmer watersheds (TNDJF>0 ∘C). Moreover, empirical projections of DOQ25 and DOQ50 based on DOS20 are about four and two times more sensitive to climate change, respectively, than those simulated by a state-of-the-art land surface model (NoahMP-WRF) under the same scenario. Given the importance of changes in streamflow timing for water resources, and the significant discrepancies found in projected streamflow sensitivity, snowmelt detection methods such as DOS20 based on diel streamflow cycles may help to constrain model parameters, improve hydrological predictions, and inform process understanding.
- Article
(7151 KB) - Full-text XML
- BibTeX
- EndNote


Earlier streamflow caused by earlier snowmelt is of great concern in a changing climate (Barnett et al., 2005; Harpold and Brooks, 2018; Musselman et al., 2017; Stewart et al., 2004, 2005). Earlier winter and spring streamflow volume comes at the expense of later summer streamflow in regions like the western United States (USA; Hidalgo et al., 2009; McCabe and Clark, 2005; Regonda et al., 2005; Stewart et al., 2004, 2005) and challenges reservoir operations (Barnett et al., 2005; Immerzeel et al., 2020; Viviroli et al., 2011). Furthermore, ecosystems may evaporate more water as reductions in albedo increase energy inputs (Meira Neto et al., 2020; Gordon et al., 2022), decreasing runoff from upland forested watersheds (Foster et al., 2016; Jepsen et al., 2018; Milly and Dunne, 2020). More than 50 % of mountainous watersheds play essential roles in supporting downstream systems (Viviroli et al., 2007), and snowpack changes are likely to increase lowland agriculture water stress (Immerzeel et al., 2020). However, it remains difficult to predict how much streamflow timing and amount will shift in future climates (Gordon et al., 2022) due to altered snow accumulation patterns (Mote et al., 2018) and melt rates (Musselman et al., 2017) and shifts from snowfall to rainfall (Klos et al., 2014).
Physically based hydrological models are typically used to predict how snow accumulation and melt will interact with the critical zone (CZ) to affect short-term flooding and seasonal water supply (Kopp et al., 2018; Wood and Lettenmaier, 2006). In mountainous regions like the western USA, models need to accurately simulate snow processes across watersheds with varying snowpack conditions (Serreze et al., 1999) and then transport and store that water in the CZ with varying subsurface properties (Brooks et al., 2015). More precipitation falling as rain instead of snow will result in streamflow dynamics that more closely mirror the amount and timing of rainfall. Precipitation phase (rainfall versus snowfall) is mediated by basin elevation and hypsometry (Jennings et al., 2018; Wayand et al., 2015), which also influences precipitation amounts (Houze, 2012), with higher elevations and steeper watersheds typically having higher precipitation and snowfall. Solar radiation is the primary energy source for snowmelt in snow-dominated montane watersheds (Cline, 1997; Marks and Dozier, 1992). Conversely, cloudiness lowers solar radiation and melt rates (Sumargo and Cayan, 2018). Shallower snowpacks have less cold content and begin to melt earlier when solar radiation is lower (Harpold et al., 2012; Harpold and Brooks, 2018; Musselman et al., 2017), which shifts streamflow earlier (Clow, 2010). Storage and drainage of water in the CZ control the sensitivity of streamflow to earlier rain or meltwater inputs. For example, snowmelt-mediated spring streamflow timing is more sensitive to climate change in watersheds with rapid subsurface drainage than in landscapes with deep groundwater reservoirs that drain slowly (Safeeq et al., 2013). In contrast, slow-draining watersheds have greater sensitivity to snowmelt-mediated summer streamflow volume from climate change (Tague and Grant, 2009). The complexity of these storage relationships is exemplified by isotopic evidence showing that the fraction of streamflow that is young water (less than 3 months old) is smaller in steeper watersheds (Jasechko et al., 2016), suggesting that physically modeling interactions between CZ water storage and changing hydrometeorology will be challenging in mountainous areas. In a recent data-driven review, Gordon et al. (2022) proposed a predictive framework composed of three testable and interrelated mechanisms to infer changes to snowmelt-driven streamflow response under warming. Such mechanisms are associated with snow season energy and mass exchanges and the intensity of snow season liquid water input and the synchrony of energy and water availability, and their analysis highlights the complexities in predicting future streamflow in regions where multiple mechanisms interact.
Hydrologists typically apply the following two types of modeling tools to predict streamflow: empirical models and more mechanistically oriented models (conceptual or physically based land surface models). Empirical models assume that long-term and often site-to-site statistical relationships among predictor variables (e.g., precipitation and air temperature) and water fluxes (e.g., evapotranspiration and streamflow) can be used to understand and model their likely changes over time or space. Empirical models used to predict changes over time (sometimes referred to as space-for-time substitutions) have been used to predict responses to climate change in fields such as hydrology (Goulden and Bales, 2014; Jepsen et al., 2018; Sivapalan et al., 2011), biodiversity (Blois et al., 2013), and tree growth (Klesse et al., 2020). Such models use retrospective information from different places (space), typically spanning wide range of conditions (e.g., climate gradients), to predict future changes over time. For example, observed characteristics from warm regions maybe used to infer future changes in cold regions due to global warming. A limitation of this approach is that it neglects non-correlated (or independent) changes in spatially variable factors (Jepsen et al., 2018). For example, heterogeneous patterns of warming, variations in precipitation and vegetation, or changes that occur at different temporal scales (e.g., development of soil properties over hundreds to thousands of years versus shifts from rain to snow over hours) are implicitly neglected in such empirical frameworks.
Conversely, physically based models embed state-of-the-art physical understanding of hydrological processes. These models typically require some degree of calibration or validation to observations (e.g., daily streamflow) to improve and assess their predictive skill. The current generation of regional weather models using the Weather Research and Forecasting model (WRF; Skamarock et al., 2008) coupled to the Noah-Multiple Parameterization land surface model (Noah-MP; Niu et al., 2011), which we refer as NoahMP-WRF, has shown promising results for modeling atmospheric and snow processes in the contiguous USA (He et al., 2019; Liu et al., 2017; Musselman et al., 2017; Scaff et al., 2020). For example, snow simulations have been used to quantify mountain snowmelt and streamflow response to climate change (Musselman et al., 2017, 2018). These simulations use a pseudo global warming approach, which perturbs the historical climate with a climate change signal from an ensemble of global climate models (GCMs); using this perturbation avoids systemic biases in the GCMs and avoids issues related to their interannual variability (Liu et al., 2017). Comparisons between land surface models and empirically based predictions of future streamflow are rare but valuable (Jepsen et al., 2018) and could help to diagnose modeling deficiencies and improve predictions.
New observations of streamflow generation during snowmelt could be key to improving current hydrological models. Determining whether streamflow response was produced by rainfall or snowmelt is an important but difficult task (Weiler et al., 2018). Few simple, low-cost observational tools are available to separate rainfall-driven from snowmelt-driven contributions to streamflow or to separate this year's snowmelt from the previous years' melt and storage. One method that can be straightforwardly applied to existing long-term observations is based on coupled diel cycles in solar radiation, snowmelt, and streamflow (Kirchner et al., 2020; Lundquist and Cayan, 2002). Diel (24 h) cycles in streamflow and shallow groundwater levels can result from daily cycles in snow-/ice melt and evapotranspiration, which are both ultimately driven by solar radiation inputs (Kirchner et al., 2020). This mechanistic response has been used to study watershed properties like kinematic wave celerity (Kirchner et al., 2020), the impact of snowpack variability on streamflow timing (Lundquist and Dettinger, 2005), groundwater fluctuations (Loheide and Lundquist, 2009), and transitions from snowmelt to evapotranspiration-dominated streamflow fluctuations (Kirchner et al., 2020; Mutzner et al., 2015; Woelber et al., 2018). More recently, Kirchner et al. (2020) combined local observations and remote sensing to show that streamflow diel response was tightly controlled by the timing of snowpack disappearance. However, it remains unknown whether information embedded in the diel streamflow response following snowmelt events can be used to inform streamflow predictions under climate change and whether such projections are consistent with current state-of-the-art hydrological modeling. The purpose of this research is to evaluate whether land surface hydrology model simulations and a new diel streamflow-based empirical model yield similar projected end-of-century changes in streamflow volume timing across mountainous western USA headwater watersheds. To this aim, we extend the diel cycle index approach of Kirchner et al. (2020) using diel streamflow observations to detect days when streamflow is coupled to snowmelt inputs (i.e., a snowmelt-dominated streamflow event) and investigate their contributions to historical variability in streamflow volume timing. We then compare empirical diel streamflow-based projections by the end of the century under a RCP8.5 pseudo global warming scenario against predictions from a state-of-the-art land surface model (under the same climate scenario) across 31 mountainous watersheds in the western USA to answer the following questions:
-
Do historical diel streamflow cycles indicate earlier snowmelt in warmer watersheds and years, and can we use diel observations of snowmelt to predict the timing of streamflow volume?
-
In which watersheds is the timing of snowmelt the most sensitive to climate change, as projected by an empirical diel streamflow-based model?
-
Do historical streamflow volume timings and future empirical diel streamflow-based projections diverge from commonly used, state-of-the-art land surface models?
A list with the abbreviations used in this study is presented in Table 1.

2.1 Study domain and data
We studied 31 mountainous watersheds in the western USA (Table 2), spanning snow fractions from 0.27 to 0.78 (Fig. A3a), aridity index values from 0.22 to 2.86 (Addor et al., 2017), and soil depths from 0.27 to 2.52 m (Addor et al., 2017; Pelletier et al., 2016; Table 2). These watersheds are part of the CAMELS (Catchments Attributes and MEteorology for Large-sample Studies) dataset (Addor et al., 2017; Newman et al., 2015), which provides daily streamflow and meteorological forcing, among other observed and simulated hydrometeorological variables at the watershed scale. These watersheds were chosen because their streamflows are unregulated, they have relatively small drainage areas (<250 km2), and they are at relatively high elevations (>1000 m a.s.l. – above sea level). This last criterion was introduced to focus on watersheds with snowmelt-driven streamflow regimes. The names, locations, elevations, slopes, drainage areas, and other key characteristics of the 31 watersheds are presented in Table 2.
Table 2List of the 31 watersheds from the CAMELS dataset included in this study. Data are from Addor et al. (2017). Note: USGS is the United States Geological Survey.

The data used in this analysis include hourly streamflow, incoming shortwave radiation, mean daily relative humidity, air temperature, and precipitation. Hourly streamflow was obtained from the U.S. Geological Survey (USGS). Hourly incoming shortwave radiation is from phase 2 of the National Land Data Assimilation System (NLDAS-2; Xia et al., 2012) at the nearest grid point to the watershed outlet. Mean daily relative humidity, air temperature, and precipitation at the watershed scale are from CAMELS, based on the Daymet dataset (https://daymet.ornl.gov/, last access: 20 June 2022), which in turn is interpolated from existing ground observations. Available hourly streamflow records vary significantly across watersheds, extending back to 1986 for some sites. Figure A1a shows the number of years that have more than 70 %, 80 %, and 90 % of days with hourly records for the period between 1 December and 1 August. Based on this preliminary analysis, we selected water years with more than 80 % of days with hourly streamflow records. This threshold for data availability results in most watersheds having more than 5 years to analyze (except for site ID 10 and 30 with 4 years).
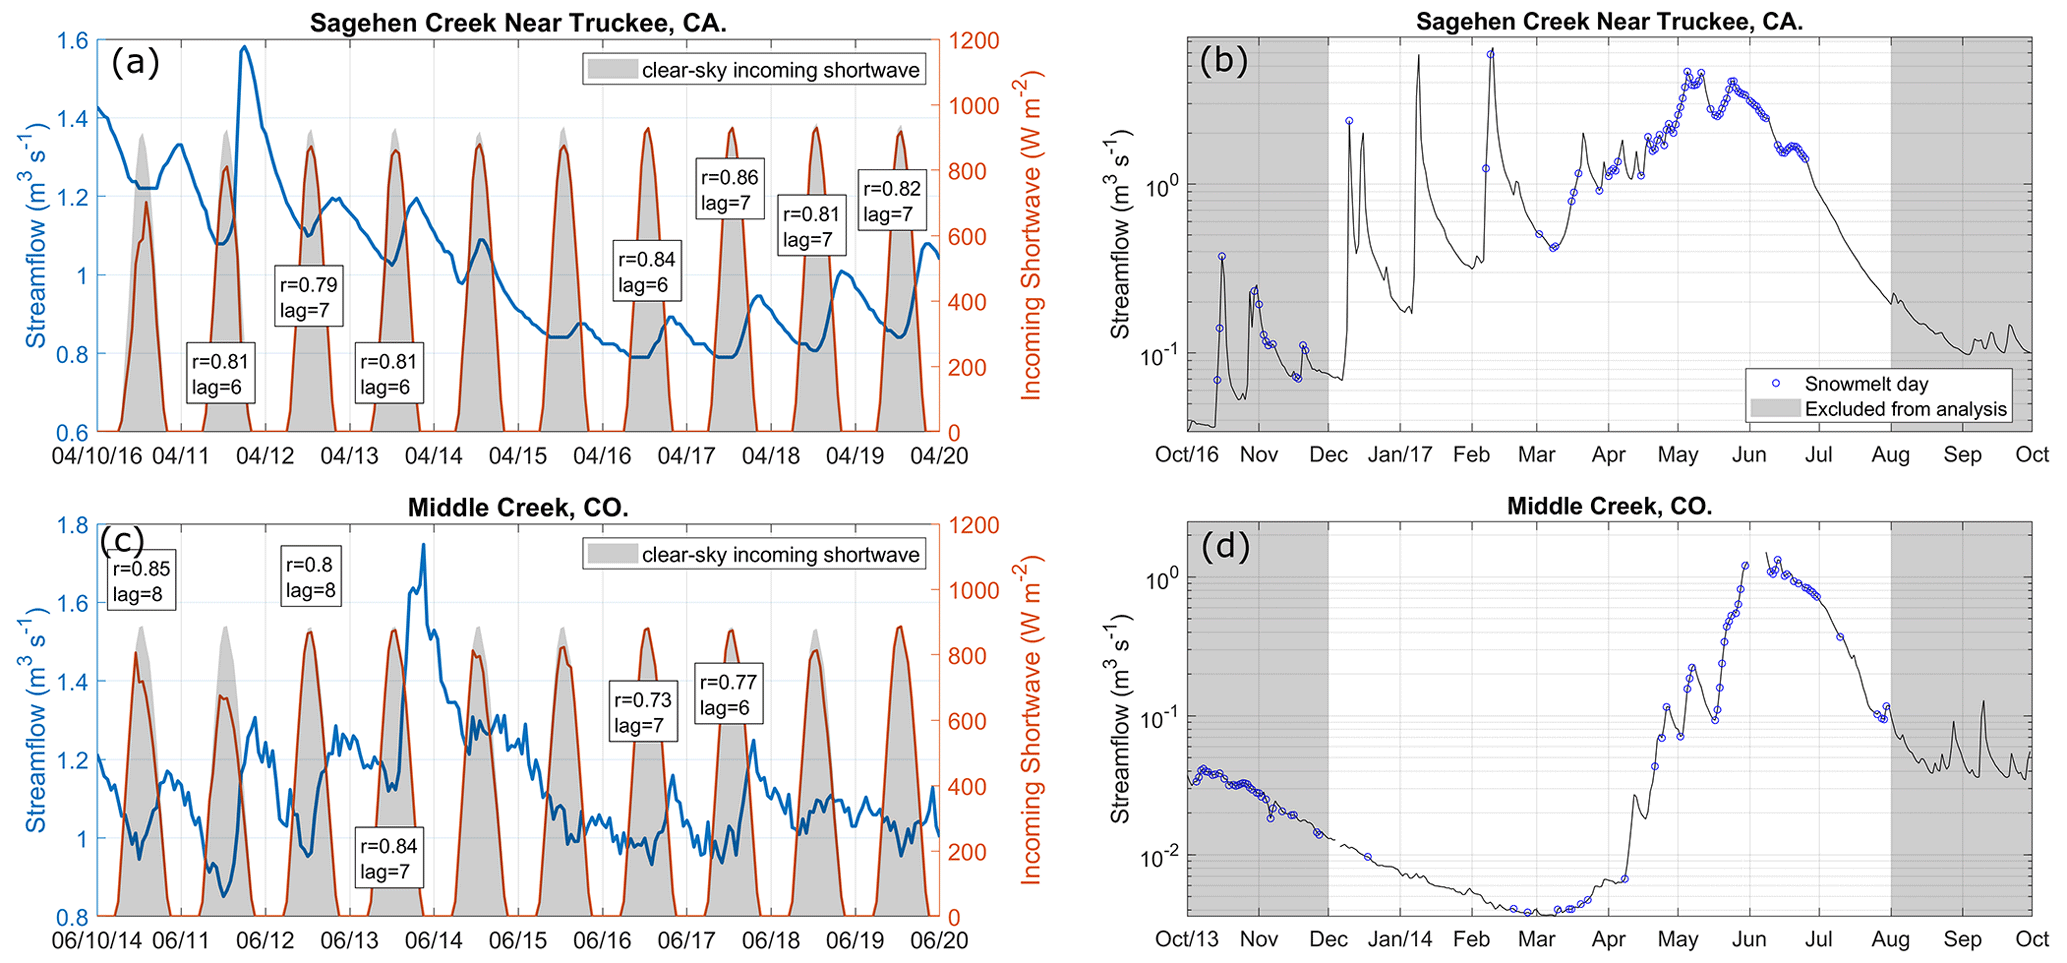
Figure 1Examples of the diel cycle analysis applied to two watersheds located in (a, b) California (WY2016) and (c, d) Colorado (WY2014). Panels (a) and (c) show hourly solar radiation (orange) and streamflow (blue). The first statistically significant (p<0.01) lagged Spearman correlation (r>0.6) between streamflow and solar radiation is shown in a text box for clear-sky days only (>80 % of clear-sky solar radiation). Panels (b) and (d) show the solar radiation-driven snowmelt days (blue circles) on top of the annual hydrograph (semi-log scale) for the period of analysis (white background; December to July).
2.2 Snowmelt and streamflow diel coupling
To identify days when solar radiation-driven snowmelt is coupled to the streamflow response, hereafter called snowmelt days for simplicity, we calculated the correlation between hourly values of solar radiation and lagged streamflow (Fig. 1). A snowmelt day is defined as a day in which the Spearman correlation between hourly solar radiation and lagged streamflow is statistically significant (p value ≤ 0.01) and exceeds a given cutoff. Due to the lagged diel streamflow response after snowmelt, we lagged diel streamflow from solar radiation between 6 and 18 h, computed the correlation of all combinations, and kept those statistically significant correlations that were above a predefined correlation cutoff. Although having both a correlation cutoff and a statistical significance criterion may be redundant, we used both to guarantee significant correlations above different correlation cutoffs. We tried several correlation cutoffs (r>0.5, 0.6, 0.7, 0.8, and 0.9; see Fig. 1 for r>0.6) to assess their effects on the detection algorithm (Fig. A2). The preliminary lag window of 6 to 18 h was used to avoid confounding snowmelt signals with evapotranspiration (ET)-induced streamflow diel responses (Kirchner et al., 2020; Mutzner et al., 2015; Woelber et al., 2018). ET-induced streamflow diel response can positively correlate with solar radiation with lags below 6 h, due to the previous day's ET, and above 18 h, due to the next day's ET diurnal signal (Kirchner et al., 2020). However, this preliminary lag window may incorrectly select days with a rainfall-induced streamflow diel response or rain-on-snow events. To minimize this, we further restricted the lags that could be selected based on optimum lags from snowmelt days with clear skies. Clear-sky days were defined as days with solar radiation greater than 80 % of the clear-sky solar radiation value (gray areas in left panels on Fig. 1). This lag window was defined on a monthly and watershed basis and was calculated as the lags between the 10th and 90th percentile of clear-sky days with Spearman correlations above 0.8. This second filter also helped to avoid the incorrect selection of ET-induced streamflow diel response, as it minimized the chance of selecting 18 h lags that can be associated with ET. Despite efforts to select only snowmelt-driven streamflow diel responses, this methodology does not guarantee that rainfall-driven streamflow diel changes with lags within our lag window will always be excluded. Excluding such cases would require hourly precipitation observations, which are unavailable at some of our study watersheds. However, we believe that any such cases will minimally affect the results of our analysis.
To better assess the potential impact that rainfall may have on our proposed diel analysis, particularly on the effect of rain-on-snow events, we analyzed which days classified as snowmelt days also had rainfall. We assessed daily rainfall using the daily precipitation time series from CAMELS based on the Daymet product for each watershed. A false detection rate metric was computed for each watershed, in which every day classified as a snowmelt day with daily precipitation above 5 mm and a mean daily air temperature above 2 ∘C was assumed to be misclassified (Fig. 2). A false detection rate of 100 % means that all snowmelt days were misclassified and 0 % means that no days had significant rainfall. On average, the false detection rate was estimated at 7 %, with a standard deviation of 5 %, and only watershed ID 24 and 31 (located in WA and OR, respectively) exceeded 15 %, with 21 % and 29 %, respectively. This suggests that the effect of potential rainfall-induced diel streamflow cycles (including rain-on-snow events) in most watersheds is low (except for watershed ID 24 and 31), supporting further analysis. We also assessed the mean cross-site false detection rate for precipitation thresholds of 1 and 10 mm and found reasonable values of 12 % and 3 %, respectively. However, we believe that 1 mm is not a reasonable threshold, as a 1 mm rainfall event would be unlikely to produce a distinguishable diel streamflow signal and could represent error/noise in the Daymet product.
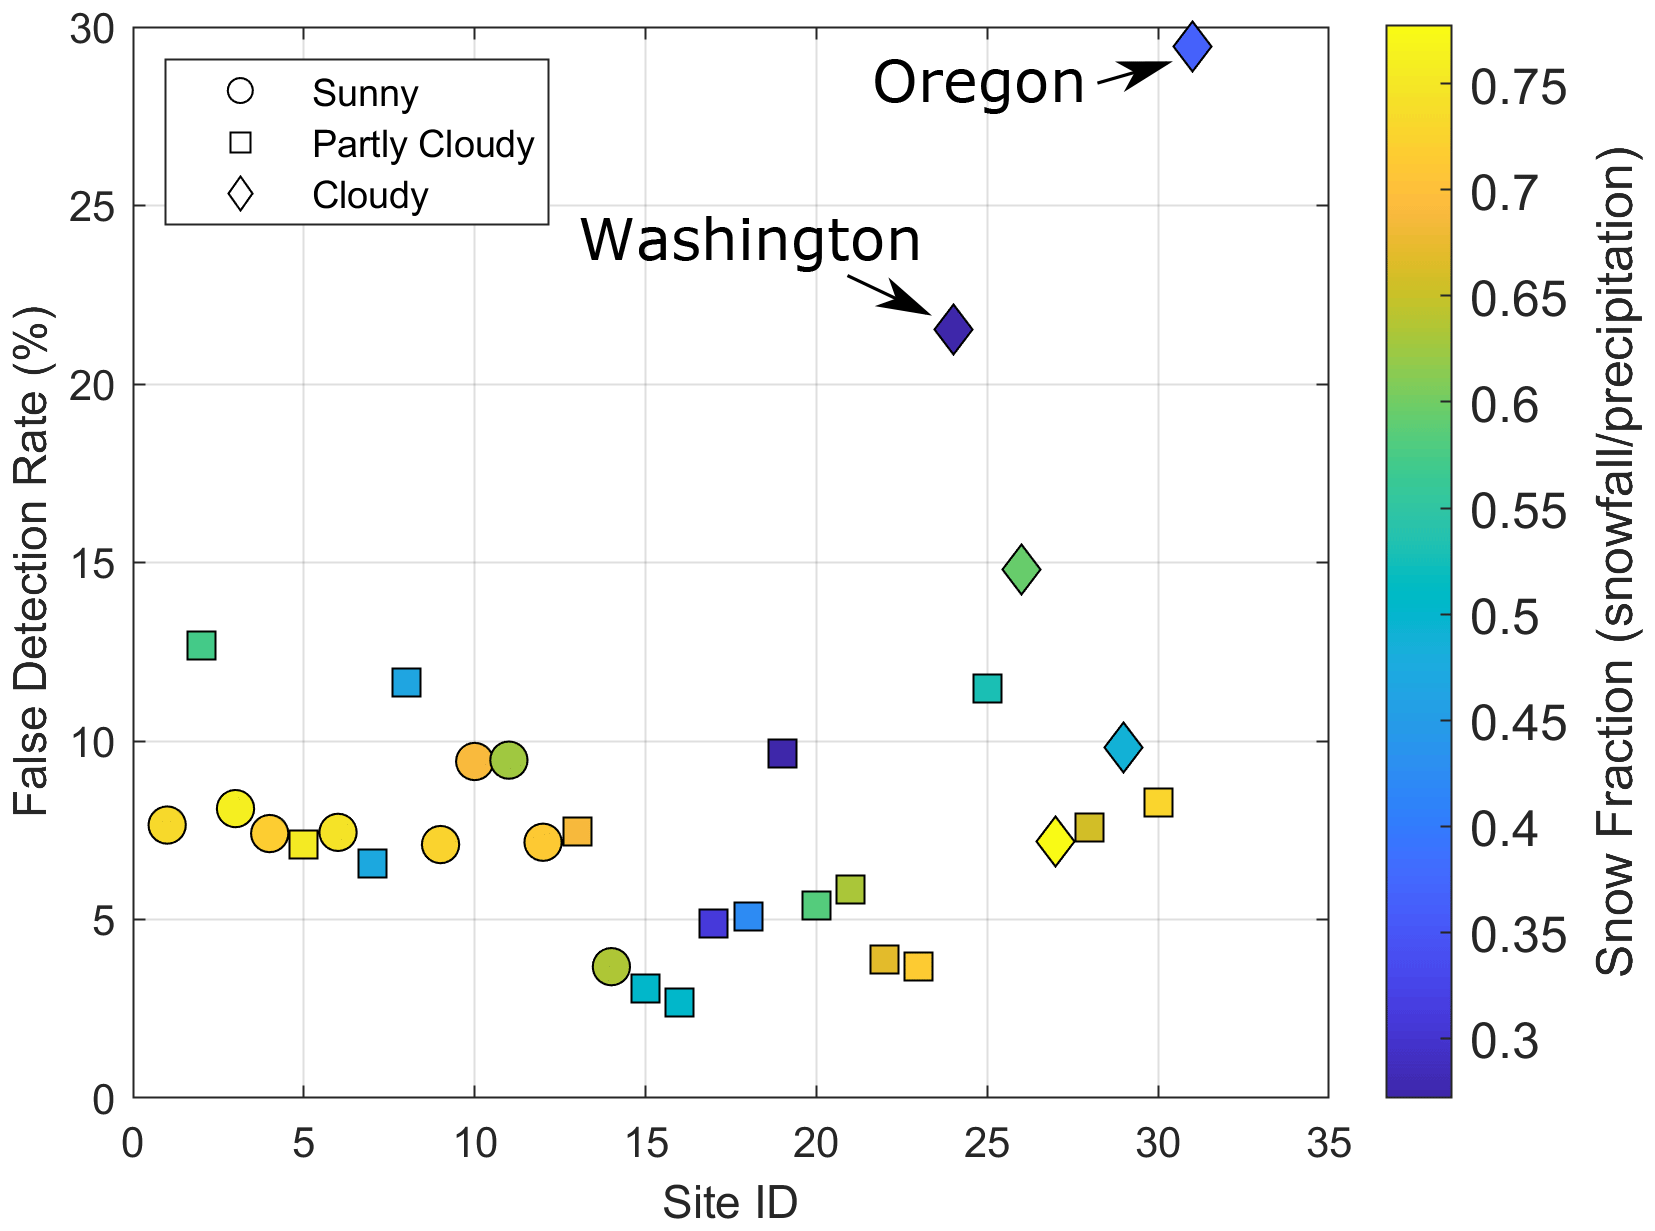
Figure 2Percentage of days that were classified as having snowmelt following the diel streamflow cycle analysis that also had daily precipitation above 5 mm and a mean daily air temperature above 2 ∘C. Symbols are associated with the mean annual percentage of snowmelt days under clear-sky conditions. Sunny sites (circles) have >90 %, clear-sky snowmelt days, partly cloudy sites (squares) have between 70 % and 90 %, and cloudy sites (diamonds) have <70 % clear-sky snowmelt days. Clear-sky snowmelt days are defined as those with more than 80 % of the potential clear-sky solar radiation.
2.3 The empirical diel streamflow-based model
We defined the day when the 20th percentile of the snowmelt days (as defined in Sect. 2.2) occurs (DOS20) as a new metric to characterize the seasonality of early snowmelt for each water year and watershed. However, other metrics such as the 5th, 10th, and 30th percentiles (presented in the Appendix) were also investigated to assess the impact of this choice on the analysis. We chose this metric because we expected it to be associated with the timing of streamflow volume, and the choice of slightly earlier or later snowmelt day metrics (e.g., DOS10 or DOS30) would not substantially change our results. We fitted a stepwise multiple linear regression model (MLR; p value < 0.01; Eq. 1) to reconstruct historical DOS20 across all watersheds and years (Fig. 7) using four climate variables as predictors, i.e., total precipitation, air temperature, relative humidity, and solar radiation, as follows:
where x1 is cumulative air temperature (i.e., degree day; ∘ C), x2 is cumulative precipitation (mm), x3 is mean relative humidity (%), x4 is mean solar radiation (W m−2), and the βi are regression coefficients. Mean annual climate variables were calculated for the period between 1 November and DOS20 (i.e., between late fall and the metric representing the date of early snowmelt events). As a result, DOS20 is present in both sides of Eq. (1); therefore, the stepwise MLR requires an iterative solution when used in a predictive mode (i.e., for the climate change analysis when DOS20 is unknown). The MLR model is the basis of our empirical diel streamflow-based model which is used to assess changes in DOS20 due to climate change (i.e., changes in x1, x2, x3, and x4 in Eq. 1). We verified the stepwise MLR assumptions, namely linear relationships between each predictor and DOS20, normally distributed residuals, homoscedasticity, and the absence of strong multicollinearity (as suggested by a variance inflation factor < 3). We also tested other metrics related to the timing of early snowmelt events. These included the first snowmelt day, the first three consecutive snowmelt events, and the 5th, 10th, and 30th percentiles of snowmelt days (DOS5, DOS10, and DOS30, respectively). All metrics were also computed using each of the different Spearman correlation cutoffs (Tables A1–A5), but the main analysis presented here focuses on DOS20 based on snowmelt days calculated with hourly Spearman correlations > 0.8.
We predict changes to DOS20 based on the stepwise MLR model and end-of-the-century mean climate change forcing from NoahMP-WRF (Liu et al., 2017). NoahMP-WRF was run under a high-emission scenario (RCP8.5), using the pseudo global warming approach for the end of the century. Overall, it projects a warmer (4–5.2 ∘C), wetter (0 %–20 % increase in precipitation) climate (Figs. A4 and A5). These mean annual changes in climate were applied to the predictors in the stepwise MLR model to predict changes in DOS20. As previously mentioned, predictors used in the stepwise MLR were calculated for the period between 1 November and DOS20; therefore, as we do not know the value of DOS20 in the future, an iterative solution is required to solve for DOS20 in Eq. (1). We find a numerical solution, using a 2 d convergence threshold between iterations, so that |DOS20i+1–DOS20 d, where i is the number of the iteration.
2.4 Streamflow volume timing from a land surface model
Historical NoahMP-WRF simulations include the period 2001–2013 over the contiguous USA at 4 km spatial resolution and the period 2071–2100 under pseudo global warming (Liu et al., 2017). NoahMP-WRF simulations include an improved Noah configuration, which aims to better represent the snow physics. These improvements include the following (Liu et al., 2017): the rain–snow transition is based on a microphysics partitioning approach as opposed to a subjective temperature-based approach, patchy snowpack are allowed in the calculation of the surface energy balance, the heat transport from rainfall to the ground is included, and the snow depletion curve is vegetation dependent. These improvements allow for a better representation of the surface energy balance and the simulation of snow accumulation and melt processes. We used daily watershed-scale outputs of surface and subsurface runoff from historical and future NoahMP-WRF simulations to estimate the date of 25 % and 50 % of annual streamflow volume (DOQ25 and DOQ50, respectively). Given the range of the watershed drainage areas (4–236 km2; Table 2), watersheds covering several grid cells use the total surface and subsurface runoff for their corresponding grid cells. Small watersheds are represented by only the single nearest NoahMP-WRF grid cell. The way NoahMP-WRF is implemented within WRF lacks a streamflow routing scheme such as the one in WRF-Hydro (Gochis et al., 2020); therefore, we used the sum of surface and subsurface runoff to estimate DOQ25 and DOQ50. We also repeated the analysis using surface runoff only, leading to similar results (Fig. A7). Given the relatively coarse NoahMP-WRF spatial resolution (4 km) compared to the watershed drainage areas (4–236 km2), we assume that mean streamflow timing metrics are not significantly affected by the lack of streamflow routing.
3.1 Empirical relationships between DOS20, climate, and streamflow
Mean annual DOS20 (the date of the 20th percentile of snowmelt days) has a strong regional variability that is reasonably captured by a negative linear correlation (R2=0.48) with the mean winter air temperature (November to February; TNDJF) in watersheds with ∘C, whereas warmer watersheds do not follow the same pattern (Figs. 3a and 4a). Warmer sites ( ∘C) have a more variable mean DOS20, ranging from mid-January to early May, whereas the coldest sites ( ∘C) have a later and less variable DOS20 around mid- to late May. On average, the regression suggests that a 1 ∘C warming of results in 7.2 d earlier DOS20. A relationship between later DOS20 and colder TNDJF is also found in the year-to-year variations at most watersheds (21 out of 31; Fig. 3b). A strong negative linear relationship was found between the date of the 25 % of the annual streamflow volume (DOQ25) and TNDJF (Fig. 3c). Warmer watersheds (TNDJF>0 ∘C) generate streamflow earlier (DOQ25 between mid-December and early March) compared to the coldest watersheds ( ∘C) where DOQ25 is between early and late May (Fig. 3c). On average, the cross-site regression shows that each 1 ∘C warmer TNDJF produces a 13 d earlier DOQ25. For most watersheds (25 out of 31), interannual regressions show a similar pattern, with warmer years having earlier DOQ25; however, these interannual regressions have shallower slopes than the cross-site relationships (Fig. 3b and d). Previous work by Stewart et al. (2005) also related seasonal meteorological patterns with the spring onset and streamflow timing and found similar relationships (e.g., warmer watersheds have earlier spring onset and streamflow timing). However, the definition of the spring onset was based on the cumulative hydrograph (the day when the cumulative departure from the mean streamflow was the minimum), as opposed to our more mechanistic diel streamflow analysis. Other definitions for spring onset based on streamflow, snow pillows, and air temperature are presented by Lundquist et al. (2004).
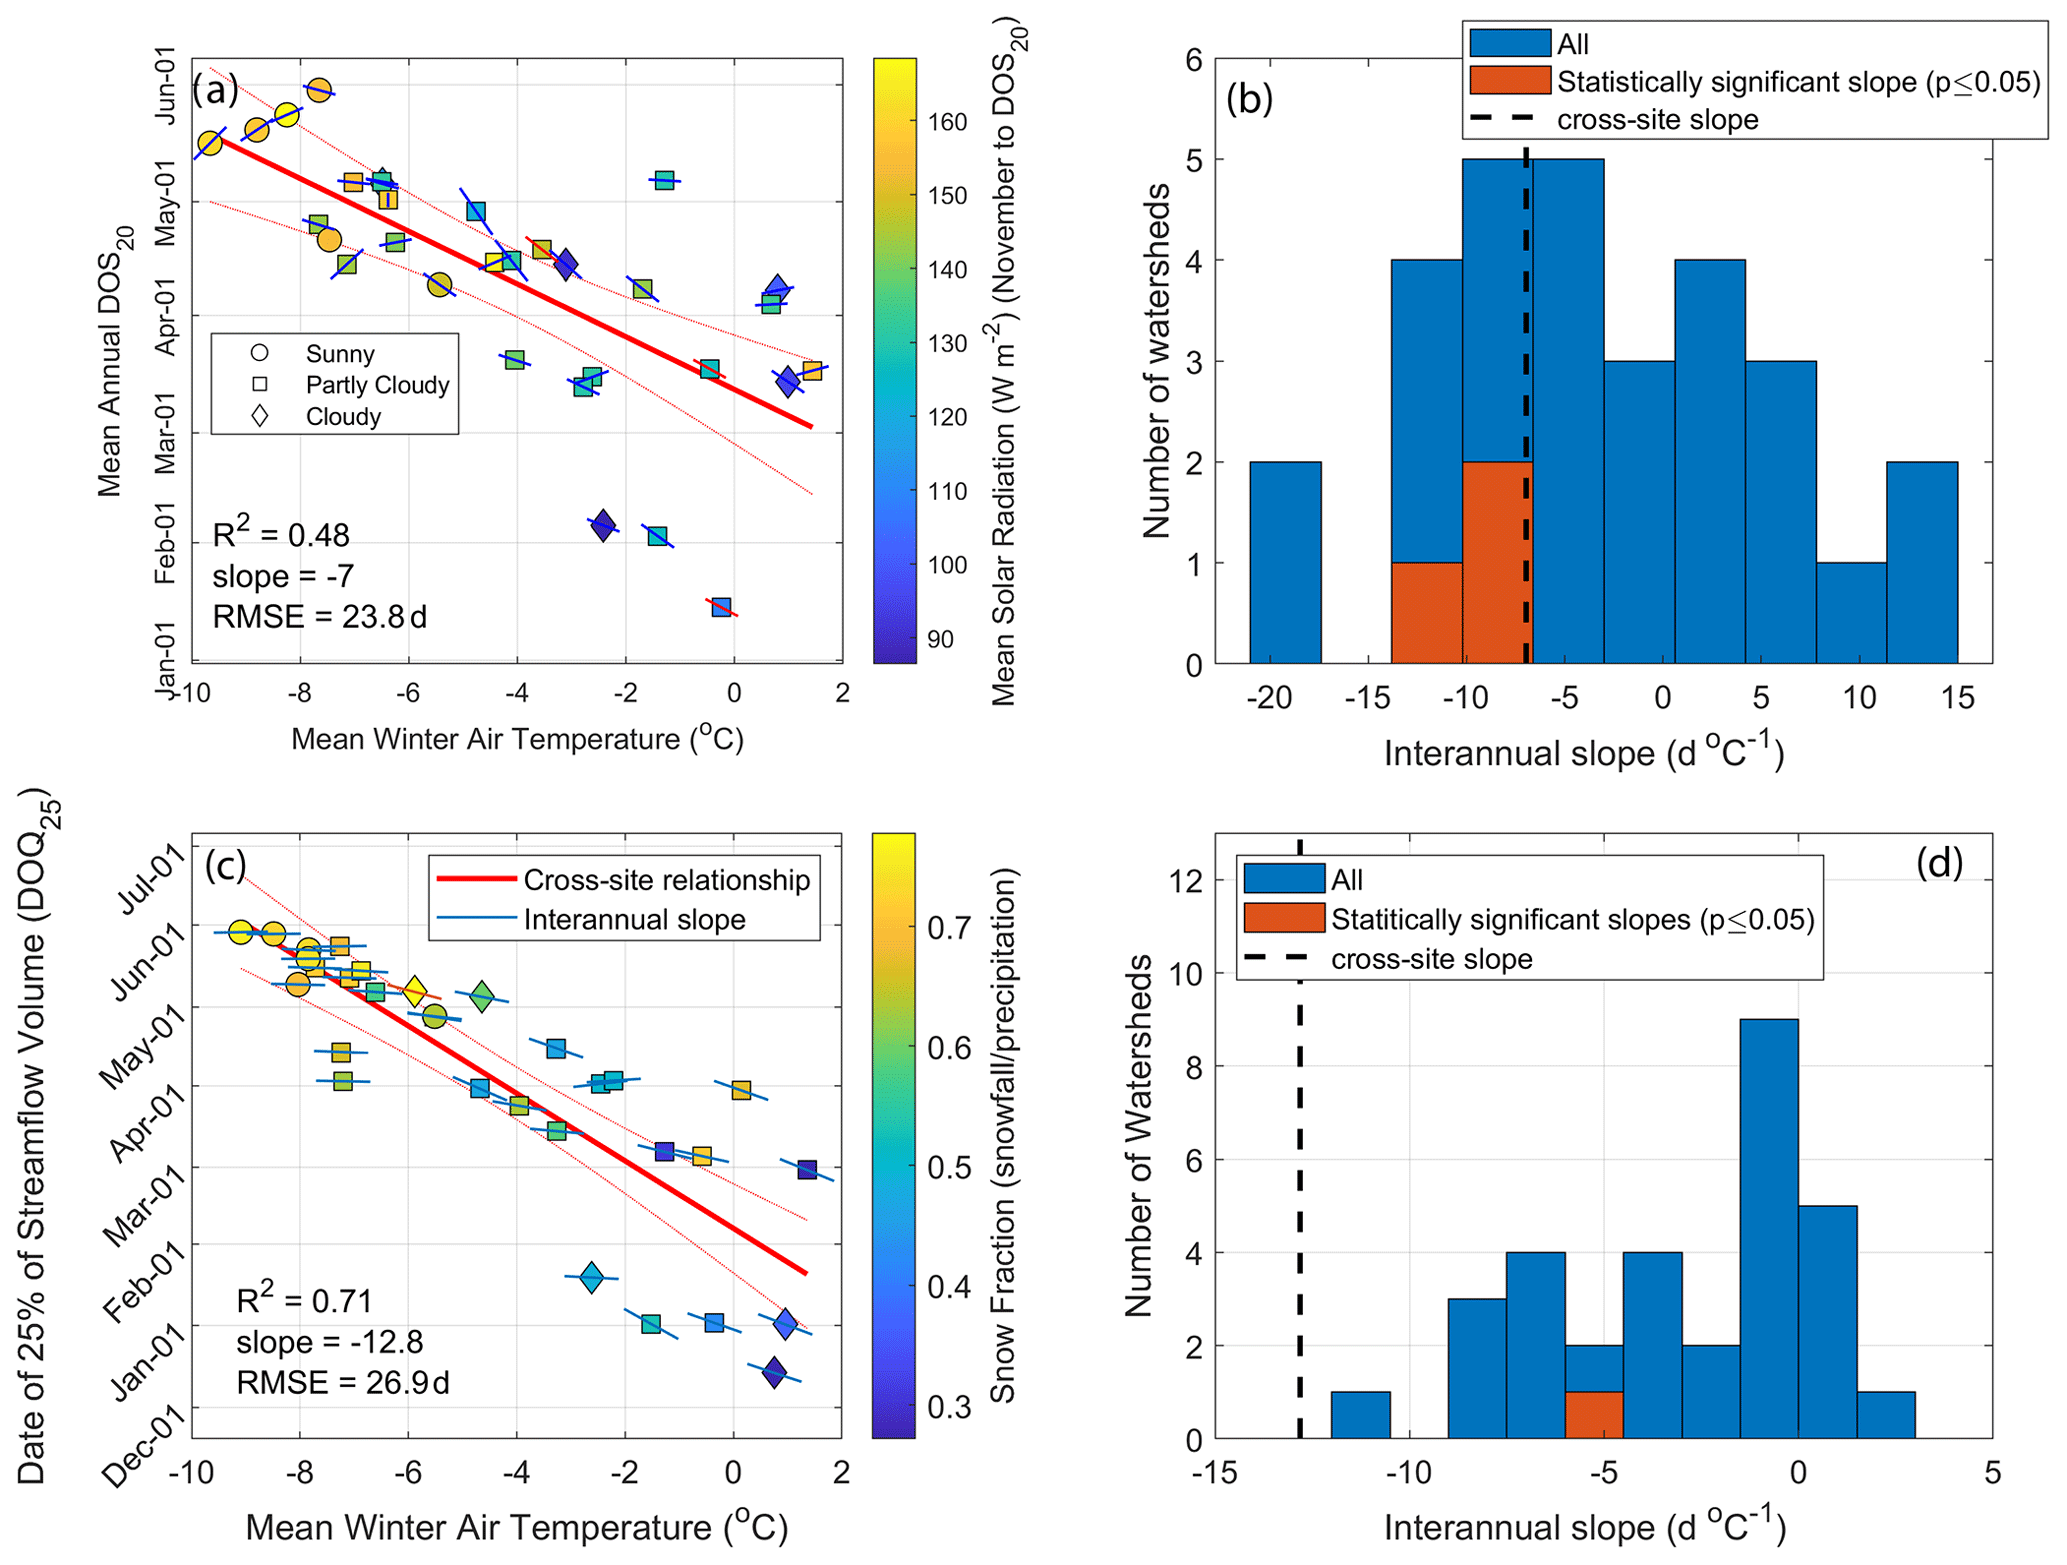
Figure 3Panels (a) and (c) show cross-site relationships between mean winter air temperature (November to February) and DOS20 and the date of 25 % of the annual streamflow volume (DOQ25), respectively. Slopes of individual sites' interannual relationships are shown as the lines on top of each symbol, where statistically significant (p value ≤ 0.05) slopes are red. Non-significant interannual slopes are presented to show the overall tendency in their spatial distribution. Symbols are associated with the mean annual percentage of snowmelt days under clear-sky conditions. Sunny sites (circles) have >90 % clear-sky snowmelt days, partly cloudy sites (squares) have between 70 % and 90 %, and cloudy sites (diamonds) have <70 % clear-sky snowmelt days. Clear-sky snowmelt days are defined as those with more than 80 % of the potential clear-sky solar radiation. Panels (b) and (d) show histograms of interannual slopes (for all watersheds and those with statistically significant relationships), and the cross-site relationships are presented in their respective left panel.
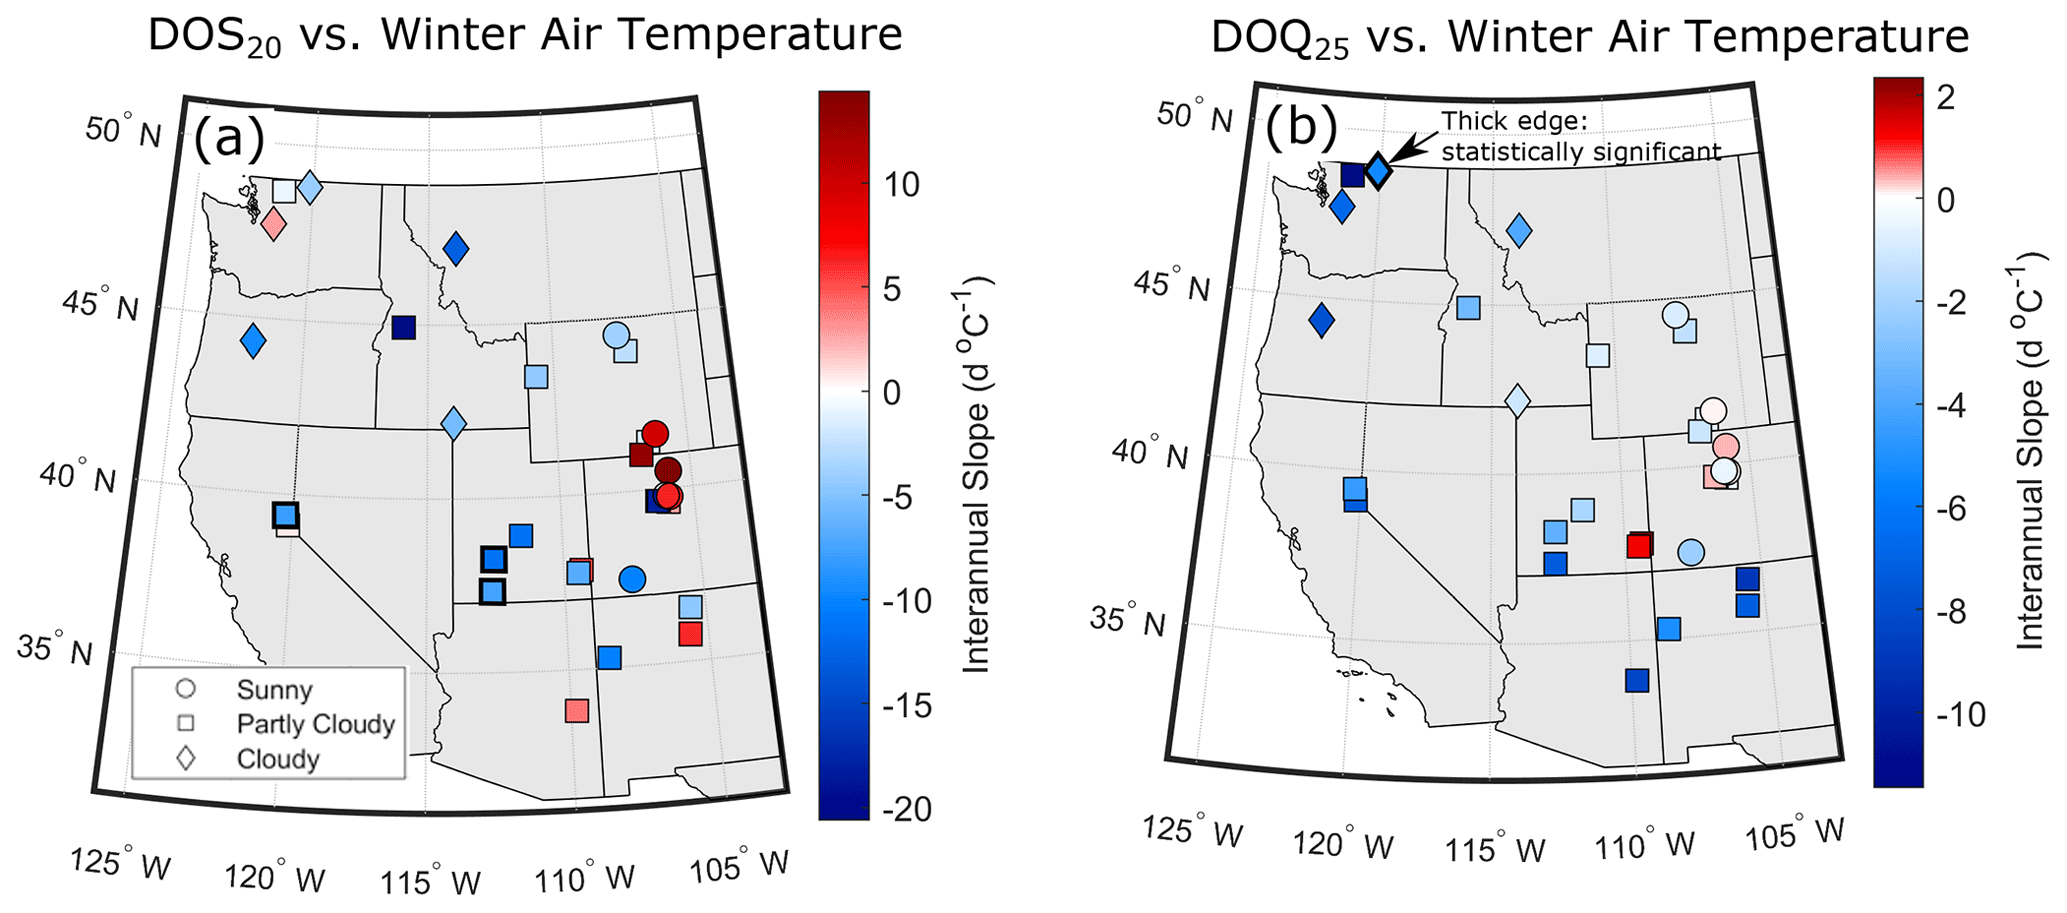
Figure 4Spatial variability in watershed-level interannual slopes for (a) DOS20 versus winter air temperature and (b) DOQ25 versus winter air temperature. Watersheds with statistically significant relationships are highlighted in symbols with thicker edges and are associated with those presented in Fig. 3. Symbols are associated with the mean annual percentage of snowmelt days under clear-sky conditions. Sunny sites (circles) have >90 % clear-sky snowmelt days, partly cloudy sites (squares) have between 70 % and 90 %, and cloudy sites (diamonds) have <70 % clear-sky snowmelt days. Clear-sky snowmelt days are defined as those with more than 80 % of the potential clear-sky solar radiation.
Strong correlations between DOS20 and both DOQ25 and DOQ50 (the date of 50 % of the annual streamflow volume; R2=0.85; Fig. 5a and c) suggest connections between the timing of snowmelt and streamflow generation across watersheds and years. On average, sites that melt earlier are associated with earlier DOQ25 (Fig. 5a) and a lower ratio of snowfall to total precipitation (snow fraction < 0.5). The relationship between DOS20 and DOQ25 closely follows the 1:1 line (Fig. 5a), although three sites in Washington and Oregon (site ID 24, 25, and 31; see Table 2 and Fig. 6a) deviate substantially from this pattern, perhaps because they receive relatively little of their precipitation as snow. Similar watershed-level relationships using interannual variability in DOQ25 were found for most watersheds, with statistically significant slopes varying between 0.4 and 2.5 d d−1 (Fig. 5b). DOS20 also predicts DOQ50 well, with 10 d earlier snowmelt producing 7 d earlier DOQ50 on average (Fig. 5c) and similar watershed-level interannual relationships (Fig. 5d). The same three relatively rainy watersheds have DOQ50 prior to the DOS20 (Figs. 5c and 6b), suggesting that early snowmelt timing is not an important predictor of DOQ50 in such places.

Figure 5(a) The day when the 20th percentile of snowmelt days occurs (DOS20), compared to the date of the 25 % of the annual streamflow volume (DOQ25). (c) DOS20 against the date of 50 % of the annual streamflow volume (DOQ50). Dashed lines in panels (a) and (c) are 1:1 lines, and the slopes of the sites' interannual relationships are shown as the lines on top of each symbol, with statistically significant (p value ≤ 0.05) slopes shown in red. Site ID 24, 25, and 31, indicated by dashed circles, fall far from the linear regression and are not included in its calculation. Symbols indicate the mean annual percentage of clear-sky snowmelt days, where sunny sites (circles) have >90 % clear-sky snowmelt days, partly cloudy sites (squares) have between 70 % and 90 %, and cloudy sites (diamonds) have <70 %; clear-sky snowmelt days are defined as those with more than 80 % of the potential clear-sky solar radiation. Panels (b) and (d) show histograms of interannual slopes (for all watersheds and those with statistically significant relationships), and the cross-site relationships are presented in their respective left panels.
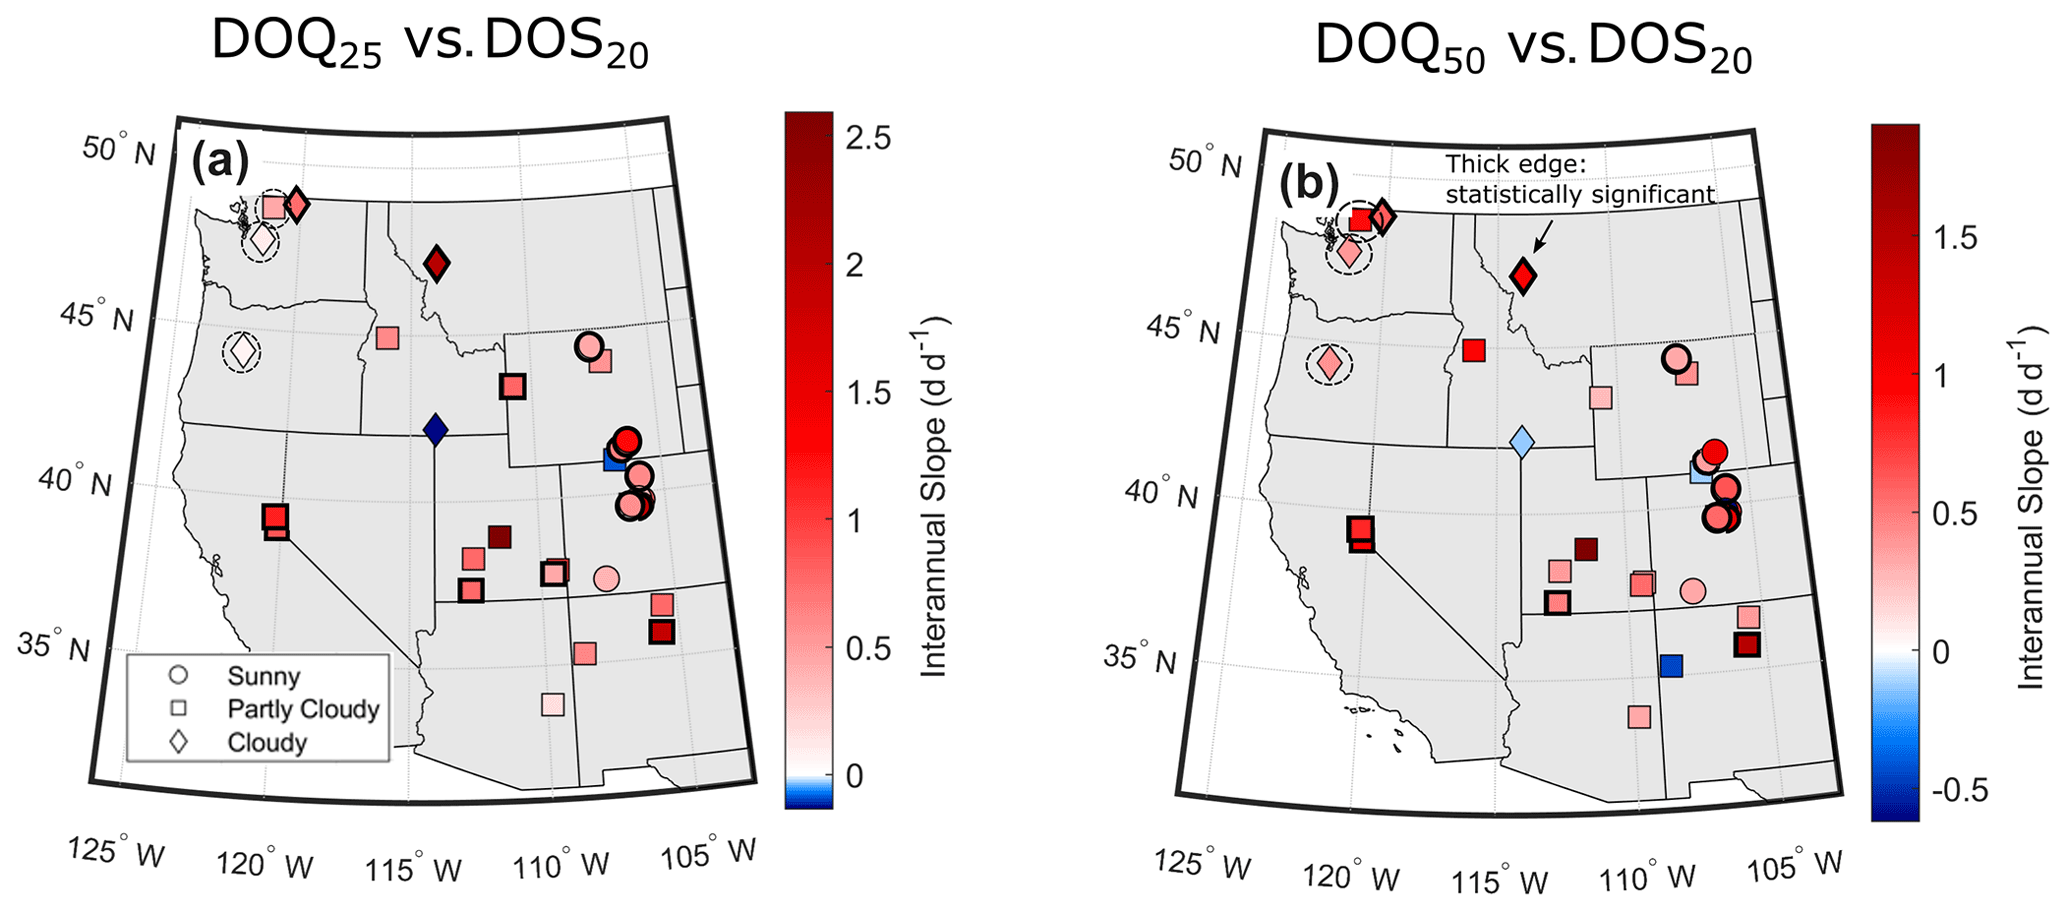
Figure 6Spatial variability in the watershed-level interannual slopes for (a) DOQ25 versus DOS20 and (b) DOQ50 versus DOS20. Watersheds with statistically significant relationships are highlighted in symbols with thicker edges and are associated with those presented in Fig. 5. Watersheds that fall far from the linear regression presented in Fig. 5 are surrounded by a circle with a dashed line. Symbols are associated with the mean annual percentage of snowmelt days under clear-sky conditions. Sunny sites (circles) have >90 % clear-sky snowmelt days, partly cloudy sites (squares) have between 70 % and 90 %, and cloudy sites (diamonds) have <70 %. Clear-sky snowmelt days are defined as those with more than 80 % of the potential clear-sky solar radiation.
3.2 Diel streamflow-based sensitivity of snowmelt timing (DOS20) to climate change
We fitted a stepwise MLR with four climate variables (air temperature, precipitation, relative humidity, and solar radiation) to predict the diel streamflow-based DOS20 metric across watersheds and years. A total of 333 watershed–year combinations of DOS20 and climate variables were used to train the stepwise MLR model. The watershed–year relationship between observed and MLR predictions has a relatively high R2 of 0.83, a root mean square error (RMSE) of 17.5 d, and normally distributed residuals (p<0.01) off the 1:1 line and centered at 0, with a standard deviation of 17.3 d (Fig. 7a). The relationship between observations and MLR predictions of inter-watershed mean annual DOS20 (Fig. 7b) is also strong (R2=0.83 and RMSE = 13.2 d) and follows the 1:1 line. Similarly, when we look at interannual values, represented by the lines overlapping the circles in Fig. 7b, we find a good agreement with most slopes close to 1:1 (see the inset in Fig. 7b). This analysis demonstrates that the MLR model can reasonably represent both the mean annual DOS20 values at each watershed and their interannual variability. Table A4 shows the standardized beta coefficients that indicate the importance of each climate variable in the stepwise MLR. For the 0.8 correlation cutoff, we found that incoming shortwave radiation has the greatest importance (β=0.75), followed by relative humidity (β=0.37) and air temperature ().
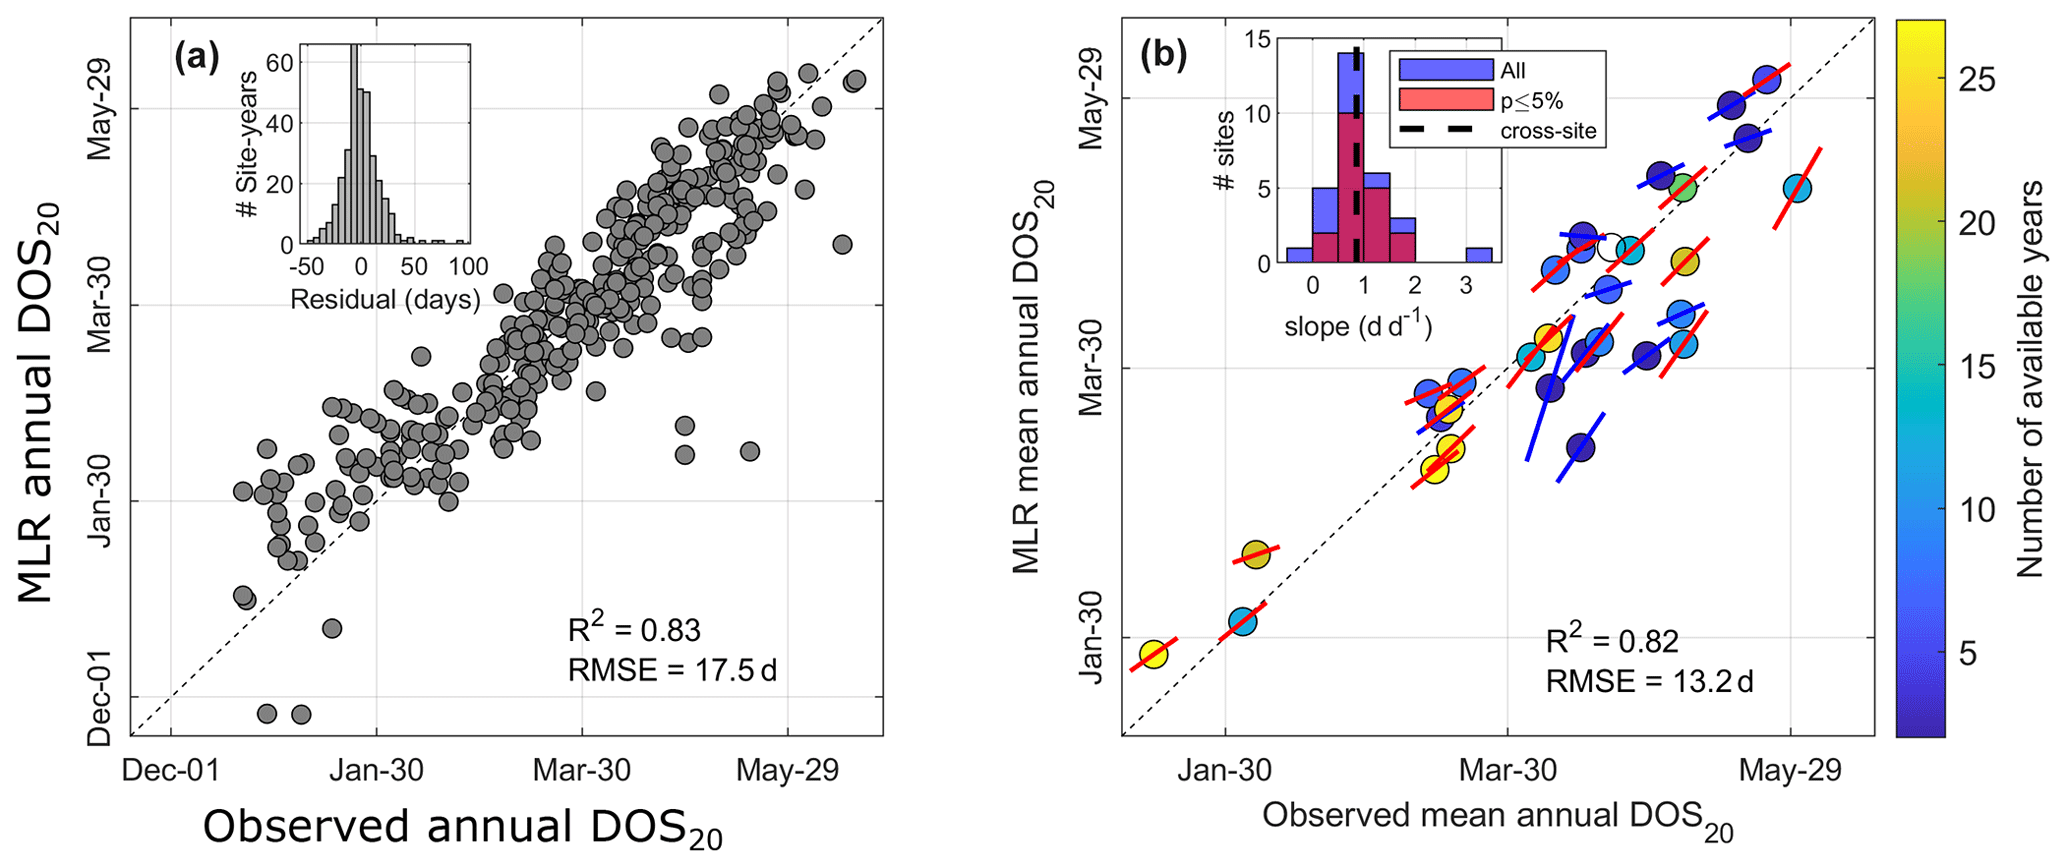
Figure 7(a) Scatterplot showing the fit of the stepwise multiple linear regression (MLR) model to the observed DOS20 across all sites and years. Panel (b) shows the same stepwise MLR model applied at the mean annual watershed level across all watersheds. Interannual variability represented by the slope of the linear relationship is shown as a line overlapping each circle (i.e., watershed); red and blue lines indicate statistically significant (p≤0.05) and insignificant slopes, respectively.
Empirical diel streamflow-based projections under climate change show earlier mean annual DOS20 in all watersheds (i.e., earlier snowmelt initiation), with significant variability from site to site (Fig. 8a). Most watersheds show significant end-of-century changes in DOS20, ranging from up to 3 months earlier in cold sites where, historically, snowmelt under clear-sky conditions dominates (circles in Fig. 8a) to as little as 20 d earlier in warm sites under historically cloudier conditions. The cross-site average change in DOS20 is 55.3 d, with a standard deviation of 21.8 d. In many watersheds, the mean projection of DOS20 under climate change is within the historically observed variability in DOS20 (Fig. 8a). The empirical model predicts that, on average, colder watersheds ( ∘C) are about 70 % more sensitive to climate change (13.7±4.6 d ∘C−1) than warmer watersheds (TNDJF>0 ∘C) (8.1±6.2 d ∘C−1), as represented by the change in the DOS20 per degree of warming (Fig. 8b). Site ID 24 (South Fork Tolt River, WA) shows almost no change in its DOS20, which can be attributed to its weaker climate change signal compared to the other watersheds (about +4 ∘C, 5 % precipitation increase and virtually no change in humidity and solar radiation; Fig. A4). The diel streamflow-based analysis suggests an average sensitivity of DOS20 to a climate change of 11.1±4.2 d ∘C−1 across all watersheds.
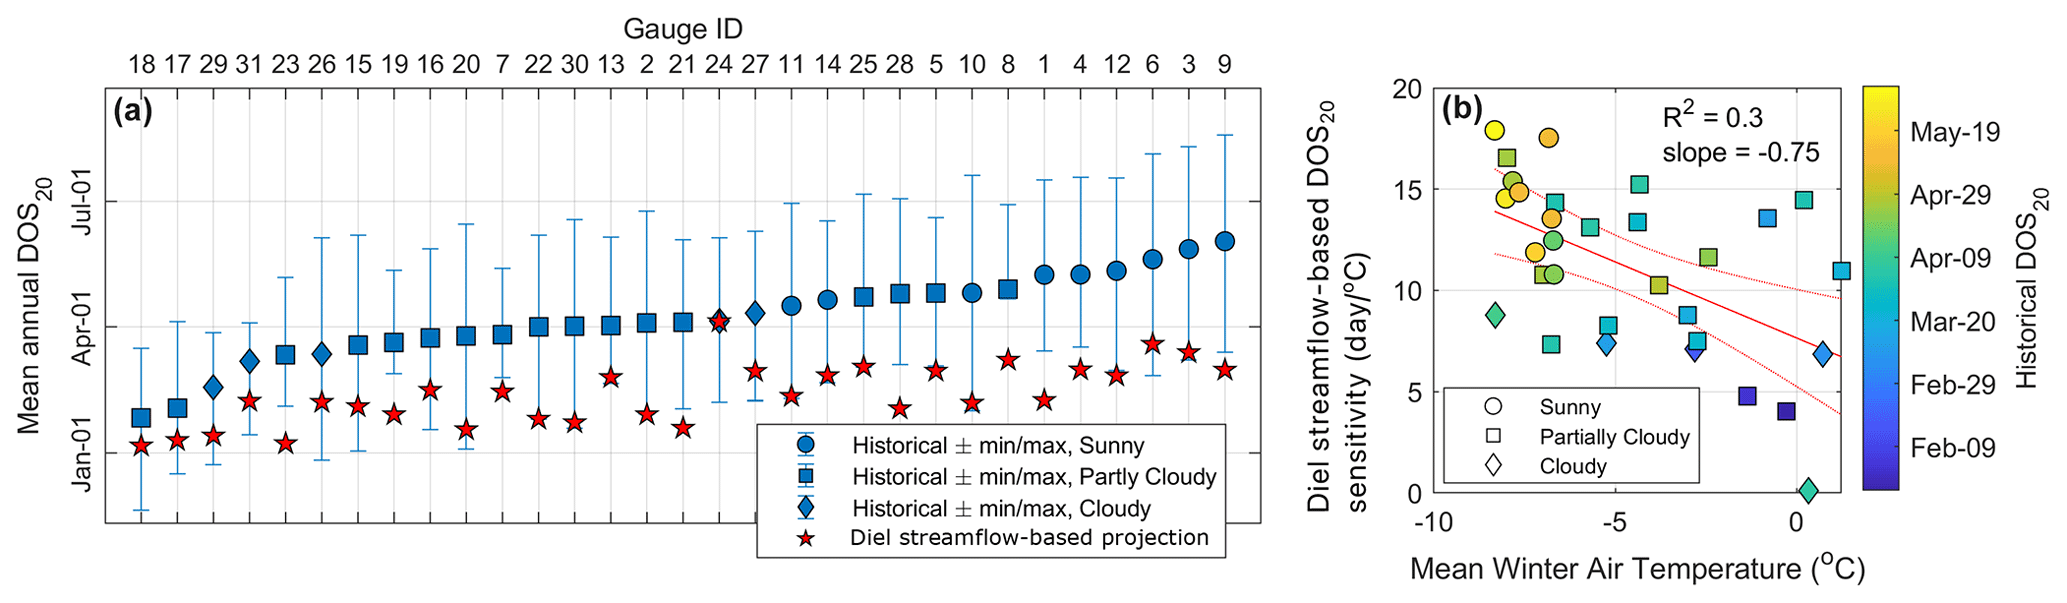
Figure 8(a) Historical DOS20 from the diel analysis and projected changes in DOS20 using the empirical diel streamflow-based projections under the RCP8.5 pseudo global warming climate for the end of the 21st century. Watersheds are sorted from earlier (left) to later (right) historical DOS20. Symbols associated with future projections (stars) are not classified by sunny, partly cloudy, or cloudy conditions, as we make no inference about the cloudiness condition of snowmelt days under the climate change scenario. Blue symbols in panel (a) represent the mean annual percentage of clear-sky snowmelt days, where sunny sites (circles) have >90 % clear-sky snowmelt days, partly cloudy sites (squares) have between 70 % and 90 %, and cloudy sites (diamonds) have <70 %. Clear-sky snowmelt days are defined as those with more than 80 % of the potential clear-sky solar radiation. (b) Relationship between mean winter air temperature and the sensitivity of DOS20 to climate change, as projected by the empirical diel streamflow-based model.
3.3 Sensitivity of streamflow timing to climate change: empirical diel streamflow-based model versus NoahMP-WRF
We compared historical and empirical diel streamflow-based projections for DOQ25 and DOQ50 with those from NoahMP-WRF. Empirical streamflow timing sensitivity projections for DOS20 under climate change were derived from the linear regressions presented in Fig. 5a and c (DOQ25 and DOQ50 versus DOS20) with projected changes in DOS20 using the MLR under climate change. Empirical projections for DOQ25 range from early January to late May (red symbols; Fig. 9a), advancing between 20 and 100 d under RCP8.5 (x axis; Fig. 9c). The DOQ50 is projected to advance between roughly 15 and 65 d (x axis; Fig. 9d), ranging from mid-February to late May (red symbols; Fig. 9b). The historical DOQ25 is underestimated by NoahMP-WRF (blue symbols; Fig. 9a), with a mean DOQ25 in mid-February, whereas historical DOQ25 is in early April (50 d mean difference). Projected changes to DOQ25 by NoahMP-WRF under pseudo global warming range between early January to mid-March (mean in early February; Fig. 9a), averaging −15 d (ΔDOQ25; Fig. 9c), whereas empirical diel streamflow-based projections range between early January and late March (mean in mid-February; Fig. 9a), averaging about −60 d (ΔDOQ25; Fig. 9c). These results indicate that empirical diel streamflow-based projections of DOQ25 are about 4 times more sensitive to climate change than those from NoahMP-WRF. Historical DOQ50 is reasonably well represented by NoahMP-WRF under the current climate (blue symbols; Fig. 9b) with a mean difference against observations of 7 d; however, future changes of about −20 d are projected, which are roughly half of the −40 d predicted by the empirical streamflow-based projections (ΔDOQ50; Fig. 9d). Empirical diel streamflow-based projections of DOQ50 range between mid-February and early April, whereas NoahMP-WRF projections range between mid-March and mid-May, suggesting later estimates of streamflow volume by the land surface model. Watersheds with the largest disagreement between the empirical model and NoahMP-WRF projections for streamflow volume timing are those where DOS20 is the most sensitive to warming (represented by the orange and yellow symbols in Fig. 9c and d). These watersheds are characterized by historical cold winter temperatures ( ∘C), with snowmelt occurring mostly under sunny conditions (circle symbols) in the Rocky Mountains.
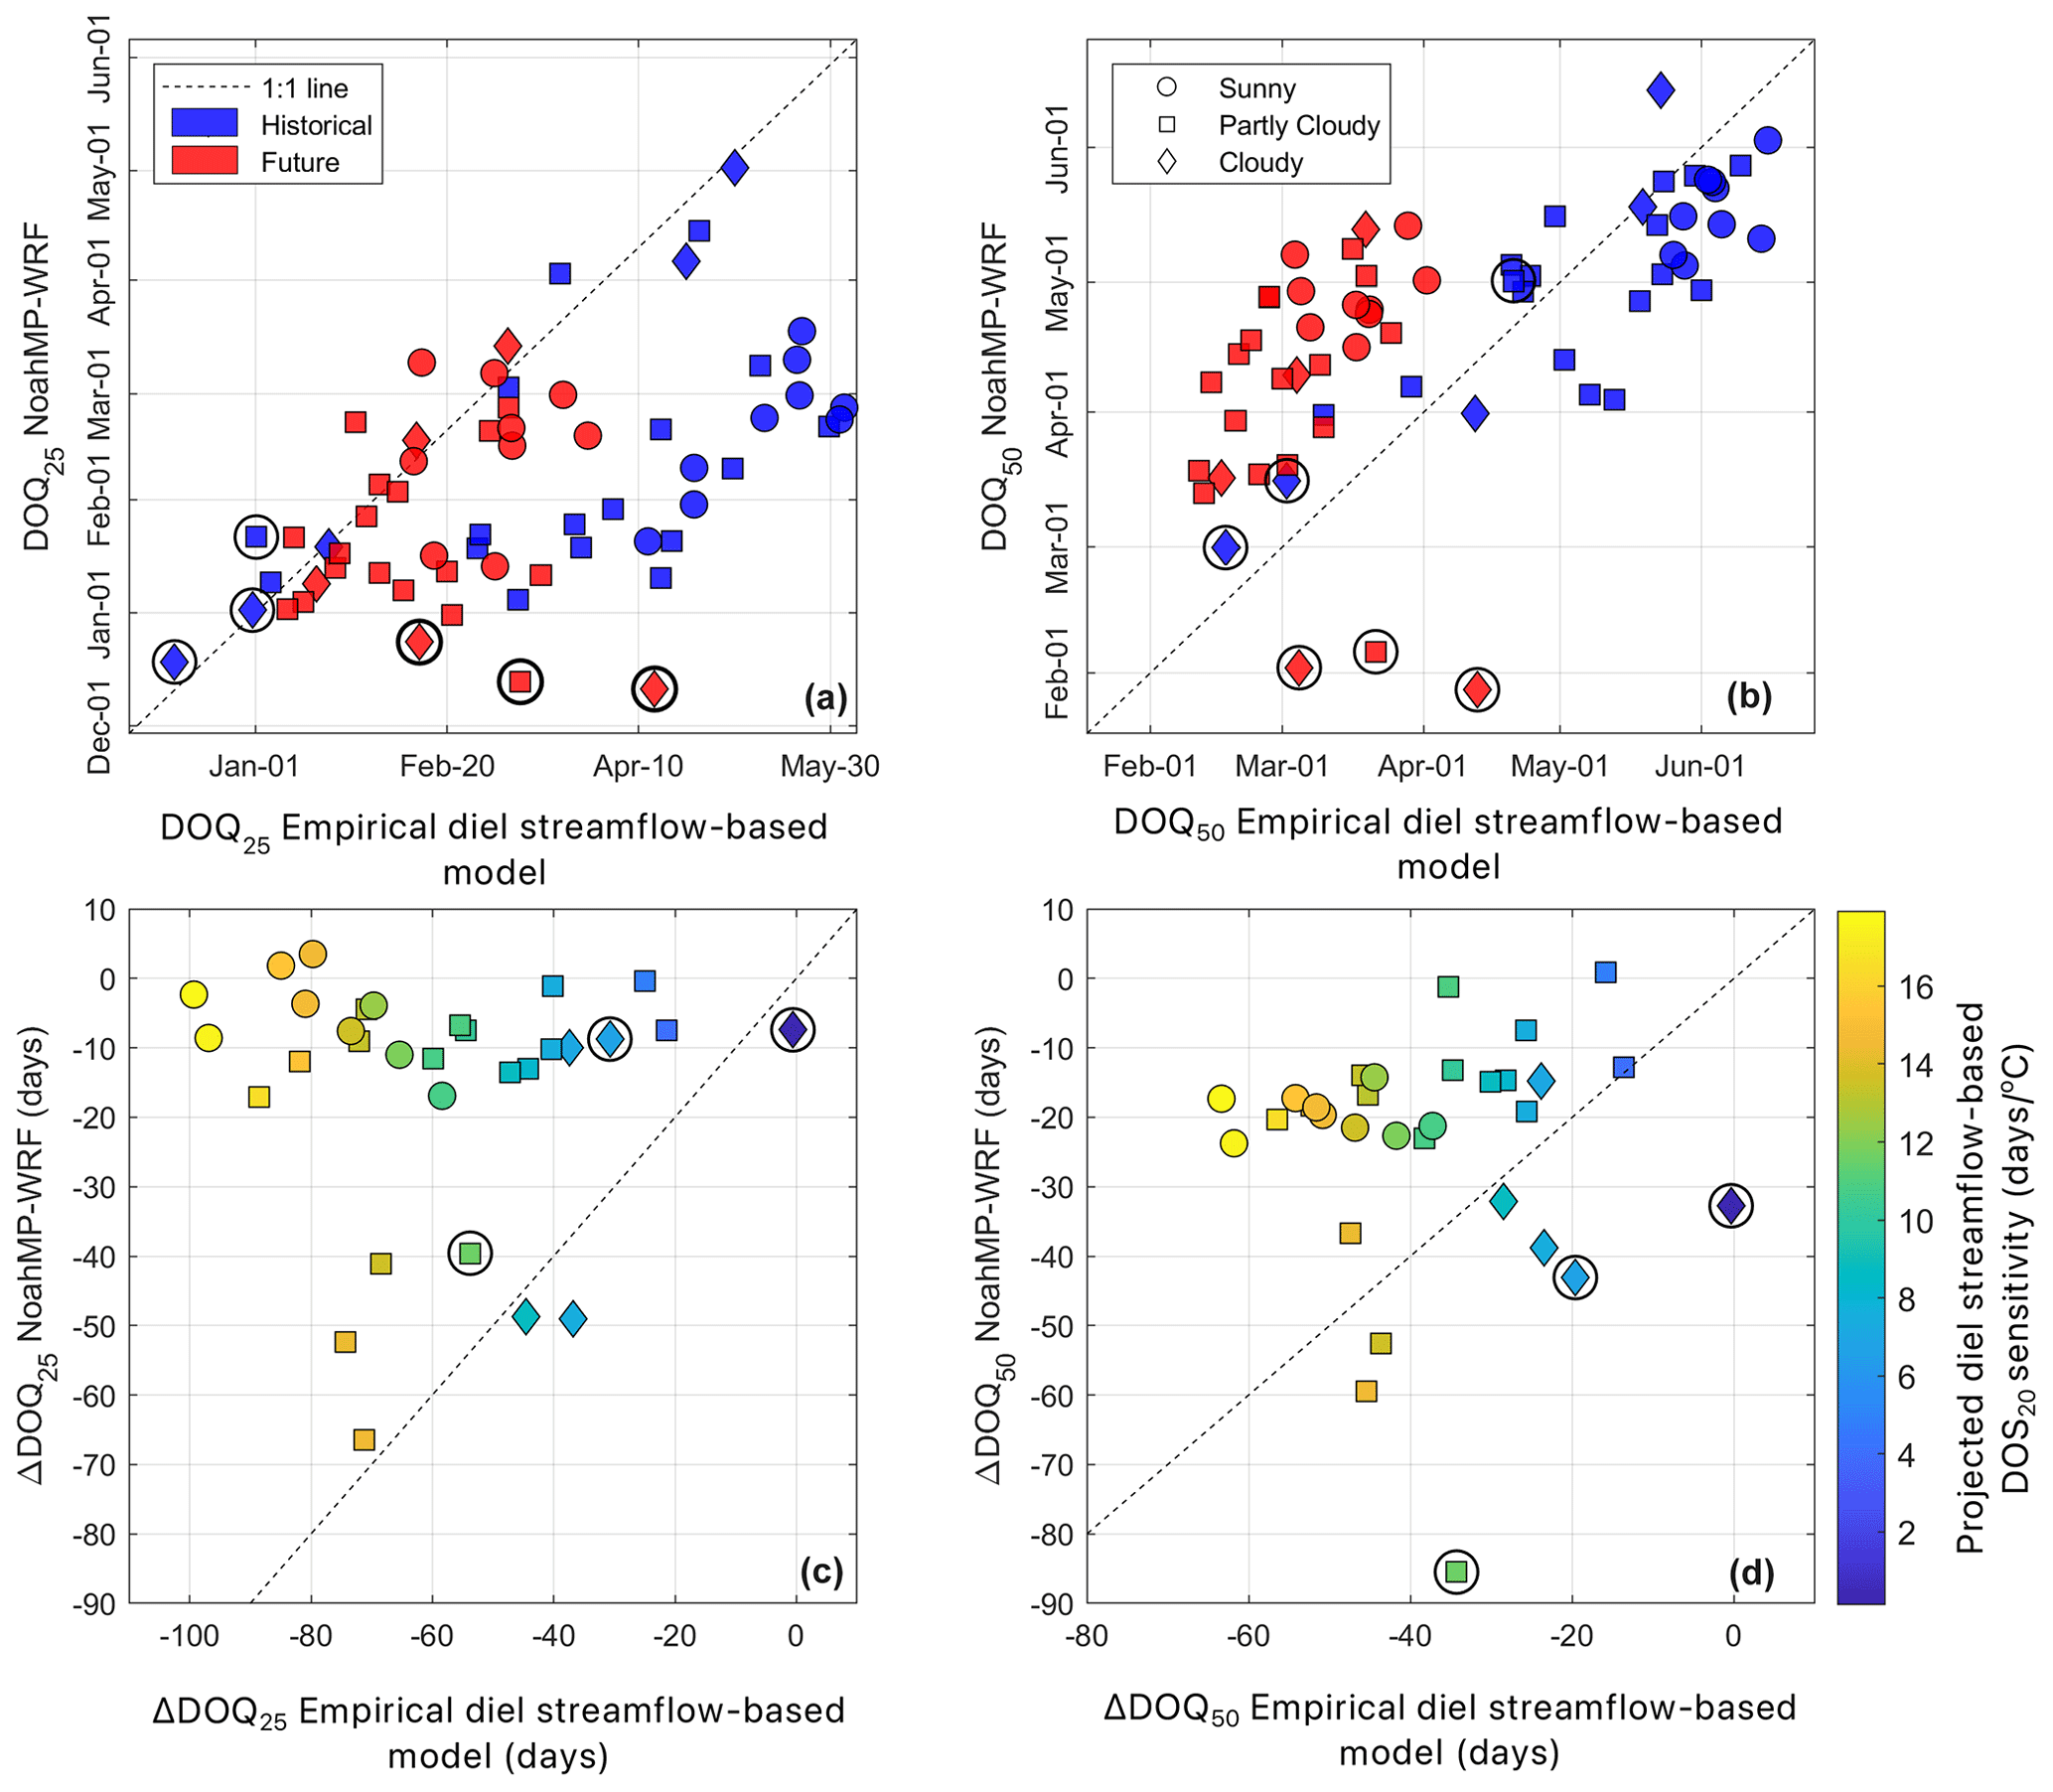
Figure 9Changes to DOQ25 and DOQ50 due to climate change under a RCP8.5 pseudo global warming climate scenario by the end of the century. Panels (a) and (b) compare historical against projected values between NoahMP-WRF and the empirical diel streamflow-based model. Panels (c) and (d) compare the projected change in streamflow timing (future minus historical) between NoahMP-WRF and the empirical diel streamflow-based model, colored by the sensitivity of DOS20 to climate change as projected by the empirical diel streamflow-based model (Fig. 8b). Symbols surrounded by black circles indicate sites that were excluded from the regression analysis in Fig. 5 (rainier site ID 24, 25, and 31). Symbols represent the historical mean annual percentage of clear-sky snowmelt days, where sunny sites (circles) have >90 % clear-sky snowmelt days, partly cloudy sites (squares) have between 70 % and 90 %, and cloudy sites (diamonds) have <70 %; clear-sky snowmelt days are defined as those with more than 80 % of the potential clear-sky solar radiation. We make no inference about the cloudiness condition of snowmelt days under the RCP8.5 climate scenario; however, red symbols (upper panels) follow the same symbology for easier interpretation.
The new DOS20 metric based on the diel streamflow analysis quantifies the timing of early snowmelt events and suggests that shifts towards earlier snowmelt will generate larger shifts toward earlier streamflow in colder, sunnier watersheds than in warmer, cloudier watersheds where snowmelt is more interspersed with rain. Despite the intuitive connections between snowmelt and streamflow, empirically linking changes in earlier snowmelt rates (Harpold and Brooks, 2018; Musselman et al., 2017) with changes in streamflow amount (Barnhart et al., 2016) and timing (Stewart et al., 2004) has been challenging (Weiler et al., 2018). This study represents of the first empirical analysis of streamflow-induced snowmelt change across a regional climate gradient not relying only on streamflow volume. Understanding these connections is challenging due to the representative scales at which snow (point scale) and streamflow (watershed-scale) are typically measured and analyzed. For example, evidence of snowmelt at Snow Telemetry (SNOTEL) sites in the USA has shown more intermittent snowmelt events at sites with higher humidity, and future modeling suggests lower-humidity sites will experience slower, earlier snowmelt (Harpold and Brooks, 2018; Musselman et al., 2017). However, the cascading effects of earlier and slower snowmelt on streamflow amount and timing remain relatively unexplored (e.g. Berghuijs et al., 2014) and are potentially affected by surface and subsurface hydrological connectivity, vegetation water use, and other processes that are not easily measured or parameterized. Our diel streamflow analysis has limitations in places dominated by rainfall, as evidenced by higher false detections in areas with low snow fractions (Fig. 2) and by the small (or nonexistent) interannual correlation between DOS20 and the metrics DOQ25 and DOQ50 (Fig. 5a and c) in those places. Conversely, the colder and sunnier watersheds, primarily in the intermountain region, have strong interannual correlations between DOS20 and DOQ25 (Figs. 5a and 6a), reflecting the importance of snowmelt (instead of rain) in controlling streamflow volume timing.
Because the diel streamflow analysis does not require the many assumptions that are embedded in physically based models, it is an independent tool that can be used to verify historical streamflow simulations from subdaily resolved hydrological models. For example, land surface models could be benchmarked against observed snowmelt days based on the diel streamflow analysis or metrics like DOS20 to better represent processes associated with snowmelt-driven streamflow generation. The diel streamflow analysis is also easier to implement than detailed process-based models because it only requires observed hourly streamflow data and solar radiation. If measured solar radiation is not available, it can be reliably represented by land surface models like NLDAS-2 (Luo et al., 2003) that assimilate field observations and remotely sensed radiation (including the effects of clouds) into an atmospheric modeling framework. In our analysis, we tested the sensitivity of some modeling decisions, such as the correlation cutoff between hourly solar radiation and streamflow used to detect snowmelt days and metrics for snowmelt timing and found similar sensitivities of DOS20 to climate change across different correlation cutoffs and snowmelt timing percentiles (Table A5). Metrics like the first snowmelt day or the first 3 consecutive snowmelt days showed less consistent results (Table A5), likely due to individual early or midwinter melt events that do not necessarily represent the seasonal watershed behavior. The diel streamflow analysis has the following four main limitations that need to be examined in future work: (1) it requires a steep enough stage–discharge relationship so that daily streamflow cycles can be detected across the flow regime, (2) it focuses on snowmelt driven by solar radiation (and energy fluxes synchronized with it), (3) it is sensitive to assumptions about the lag time between solar radiation and streamflow, and (4) it is sensitive to assumptions about evapotranspiration losses. A steep stage–discharge relationship, in which small changes in discharge are associated with large changes in stage, is ideal to observe small diel streamflow changes with sufficient precision. The second limitation originates from the assumption that the majority of snowmelt is correlated with solar radiation, which is supported by the dominant role of solar radiation in process-based studies of maritime and continental snowpacks (Cline, 1997; Jepsen et al., 2012; Marks and Dozier, 1992). Because our method allows the lag time between solar radiation and streamflow to vary within a predefined window, we expect it to capture the effects of other important energy fluxes, such as sensible heat, that often lag the diel patterns of solar radiation by several hours (Ohmura, 2001). Rain-on-snow events are particularly challenging to detect with our analysis, as days with a lower percentage of incoming shortwave radiation (<80 % of clear sky) are filtered out to avoid issues with potential rainfall-dominated diel signals. It may also misclassify rainfall-driven diel streamflow cycles, although we checked for rainfall-induced cycles and found that these accounted for only a small fraction (7 % on average; Fig. 2) of our inferred snowmelt days. The relationships between streamflow timing (i.e., DOS20, DOQ25, and DOQ50) and meteorological drivers in rainier sites showed cross-site and interannual relationships that are consistent with those in colder, more snow-dominated places (except for watershed ID 24, 25, and 31; e.g., Fig. 3a and c). The third limitation is that the spatiotemporal variability in snowpack, surface and subsurface storage, and evapotranspiration will change the magnitude and lag time of the diel streamflow response (Kirchner et al., 2020; Lundquist and Cayan, 2002; Lundquist and Dettinger, 2005), which we address by allowing variable watershed- and month-specific time lags. However, lag times greater than 24 h, which are associated with large watersheds or large subsurface storage, will make this method impossible to apply. The method may also miss early snowmelt-driven diel cycles in watersheds with dry soils, as the diel signal will be buffered by the subsurface storage capacity before generating a measurable streamflow response. Our empirical diel streamflow-based model implicitly assumes that other variables not included in the analysis vary together with the predictive variables (climate) and neglects watersheds' physical (e.g., soil storage) and biological (e.g., vegetation) properties that do not necessarily covary with climate. The fourth limitation is that evapotranspiration losses must be small relative to snowmelt inputs, which is necessary because the effect of evapotranspiration is out of phase with the effect of snowmelt (Kirchner et al., 2020). Evapotranspiration effects are minimized by focusing on early snowmelt periods, when evapotranspiration losses are small (Bowling et al., 2018; Cooper et al., 2020; Winchell et al., 2016).
Hydrological modeling in land surface models attempts to physically represent snowpack storage, snowmelt, subsurface storage, and its release to the streamflow, which is challenged by uncertain forcing data and simplified and uncertain model parameters. For example, snowmelt modeling in complex terrain is challenged by steep climate gradients and by the lack of adequate forcing data (precipitation, temperature, wind, etc.). Characterizing precipitation phase and timing in steep watersheds remains challenging in rain-to-snow transition zones (Harpold et al., 2017; Jennings et al., 2018; Wayand et al., 2015), which will presumably increase in extent in the future (Klos et al., 2014). Complex terrain affects radiation fluxes, which are hard to estimate at kilometer spatial scales (Müller and Scherer, 2005) used in most land surface models. Most of our study sites are forest covered, which exerts a strong control on the snowpack mass and energy balance (Lundquist et al., 2013; Pomeroy et al., 1998; Safa et al., 2021) with spatially heterogeneous effects on snow accumulation and melt that remain challenging to model (Broxton et al., 2015; Krogh et al., 2020). The presence of preferential flow paths through the snowpack impacts the timing of melt release (Leroux and Pomeroy, 2017) and is not typically included in hydrological models. Once snowmelt is released from the snowpack, simulating (and validating) what fraction flows as subsurface and surface runoff remains difficult. Decades of tracer studies (e.g., Godsey et al., 2010; Kirchner, 2003) have shown that streamflow during and after hydrologic events (i.e., snowmelt or rainfall events) is typically old water that has been stored in the watershed for months to years. Land surface models like NoahMP-WRF lack realistic groundwater stores to represent old water and lack hillslope and near-stream processes (Fan et al., 2019). For example, previous work at Sagehen Creek (site ID 23) suggests that streamflow remains ∼80 % groundwater even during the snowmelt freshet (Urióstegui et al., 2017), despite a strong snowmelt diel response caused by pressure changes induced by infiltrating snowmelt. Innovative observations that give new physical insights, like the diel streamflow analysis, could bring new information to modeling beyond what is possible with typical daily discharge resolution (Kirchner, 2006).
The diel-based analysis of snowmelt-driven streamflow to changing climate gives unique insights over previous efforts using daily and seasonal streamflow volumes (Berghuijs et al., 2014; Stewart et al., 2005) and retrospective hydrological modeling (Barnhart et al., 2016). Empirical projections of DOS20 under the pseudo global warming scenario (Fig. 8b) show that colder, drier, and sunnier sites (typical of the Rocky Mountains) are about twice as sensitive to warming as warmer, more humid, and cloudier sites (typical of the Pacific Northwest). Humid and warmer sites have lower snow fractions (<0.5; more rainfall effects) and, thus, a smaller snowmelt signal in the diel streamflow observations. In contrast, Harpold and Brooks (2018) showed that winter ablation at SNOTEL sites in humid places, like the Pacific Northwest, are more sensitive to warming than less humid places, like the southwestern USA. However, Kirchner et al. (2020) showed general agreement between SNOTEL snowmelt response and the snowmelt-induced diel streamflow signal at the warm Sagehen Creek watershed (site ID 23). The sensitivity of the early snowmelt timing metric (DOS20) to climate change is a function of changes in precipitation phase (rainfall versus snowfall), snowpack ablation (changes in the patterns of melt and sublimation), and hydrological partitioning to streamflow versus evaporative loss. Due to the empirical basis of our analysis, these sensitivities are not easy to disentangle, but the diel analysis is a new source of information that could help in that effort. The reliability of the empirical diel streamflow-based projections partially depends on whether climate projections are within or outside the range of observed climate conditions across the large climatic gradient found in the western USA. Under the pseudo global warming scenario, cold, sunny watersheds like those in the Rocky Mountains (site ID 9 and 10) will shift toward more humid, warmer conditions (Fig. A6), like those observed in Southern Idaho (site ID 29) and the northern Sierra Nevada (site ID 23). In contrast, the pseudo global warming scenarios for places like the Pacific Northwest, particularly those involving changes in atmospheric humidity above 5 g m−3 (Fig. A4), have not been observed in the historical record and therefore are more uncertain. Determining reasonable conditions to apply empirical models that use observed differences in sites to predict future changes (often called space-for-time models), like the presented diel streamflow analysis, has been posed as one of the 23 unsolved problems in hydrology (Blöschl et al., 2019).
The sensitivity of historical snowmelt-mediated streamflow volume timing (DOQ25 and DOQ50) to climate change differs substantially between the empirical diel streamflow-based approach and a land surface model, raising questions about current state-of-the-art projections of early season streamflow timing from NoahMP-WRF, particularly in cold watersheds (Fig. 9c and d). The observed data used in the diel streamflow-based approach have larger and more variable streamflow timing responses to climate change (10–17 d ∘C−1) in cold, dry, sunny places that are representative of small, high-elevation Rocky Mountain watersheds (Fig. 8b). The historical diel streamflow analysis suggests that NoahMP-WRF may be systematically underpredicting the sensitivity of streamflow volume timing to earlier snowmelt-induced streamflow in colder and sunnier places (Fig. 9c) that are most likely to have increased temperature and increased cloudiness in the future. The same mean annual future climate scenarios were applied to both approaches; however, important differences in the streamflow timing response were found between NoahMP-WRF and diel streamflow-based projections (Fig. 9c and d). NoahMP-WRF underpredicts historical DOQ25 (Fig. 9a) across most sites, whereas DOQ50 is much better represented. It is worth noting that when DOQ25 simulated by NoahMP-WRF is calculated using surface runoff alone (Fig. A7a), rather than subsurface plus surface runoff, it performs better against observed DOQ25. However, NoahMP-WRF projected sensitivity in streamflow timing to climate change remains significantly lower than predictions based on the diel-streamflow analysis (Fig. A7c). We used these simulations in the analysis because Noah-MP underlies the U.S. National Water Model, and thus, its relevance to policy and research is high. There are many differences in the way that NoahMP-WRF and the empirical diel streamflow-based approach function. NoahMP-WRF can track the hourly covariance in precipitation, temperature, and humidity to estimate precipitation partitioning between rain and snow. It is also able to represent hourly radiative and turbulent energy at the snowpack, and the cold content needed to predict snowmelt. Its physical hydrology is also advanced and able to consider antecedent conditions and allow evapotranspiration losses that also modulate streamflow. Despite the advantages of land surface models like NoahMP-WRF in constraining processes for future projections, the simplicity of diel streamflow-based analysis also provides several advantages. One of the main advantages is that it is derived from observations, and thus, it is well constrained by the observed spatial and temporal variability of snowmelt across watersheds and years (Fig. 7b). Also, it does not assume anything about the complex spatial distribution of snowpacks and precipitation or subsurface properties, which are major constraints to physically based models (Baroni et al., 2010; Christiaens and Feyen, 2001; Wilby et al., 2002). While the empirical diel streamflow-based model is not a replacement for land surface models like NoahMP-WRF, partly because the underlying streamflow datasets are not available everywhere, there is added value in including new benchmarks like the proposed DOS20 to further constrain modeling decisions and improve model fidelity required for reliable and accurate hydrological predictions.
Water management in the western USA requires accurate predictions of how both short-term climate variability and long-term climate change will alter snowmelt and streamflow. Differences in predictions of snowmelt-induced streamflow between empirical diel streamflow-based projections and a land surface model (NoahMP-WRF) raise important questions about the sensitivity of streamflow timing to climate change, particularly in cold regions, and its impact on water planning. Significant differences exist in the way diel streamflow-based and land surface models predict changes to snowmelt and streamflow timing, with both approaches having strengths and weaknesses; however, the land surface model misrepresents historical patterns in streamflow response that are more accurately estimated by the empirical model. We show that DOS20 is a strong predictor of the early season hydrograph response, particularly in cold, sunny areas where the NoahMP-WRF streamflow timing simulations lack sensitivity to climate change. Rigorously validating future model predictions is impossible, but snowmelt and streamflow timing, inferred from diel streamflow cycles, could be used to refine land surface models and better determine the risk to valuable snow water resources (Barnett et al., 2005; Sturm et al., 2017; Viviroli et al., 2007), particularly in cold regions. Our novel approach can complement the benchmarking or calibration of physically based hydrological models beyond typical benchmarking against daily streamflow or snow accumulation metrics. For example, the snowmelt timing metric DOS20 based on diel streamflow observations could be used to test how well land surface models, running at subdaily scales and fine spatial resolution, can reproduce the historical snowmelt regime across watersheds and years. As land surface models move towards real application for water management (Kopp et al., 2018), the hydrology community must seek ways to test and improve them using widely available datasets if we are to meet the grand water management challenges posed by climate change in mountainous regions.

Figure A1(a) Number of available years with less than 30 %, 20 %, and 10 % gaps in days with hourly streamflow records between 1 December and 1 August. Gauge ID is as presented in Table 2. Numbers of years at site ID 13 are the same for all thresholds (overlapping symbols). (b) Sensitivity of the mean annual number of detected snowmelt days to different Spearman correlation cutoffs (0.5, 0.6, 0.7, and 0.9) between hourly solar radiation and streamflow. Error bar represents the standard deviation.
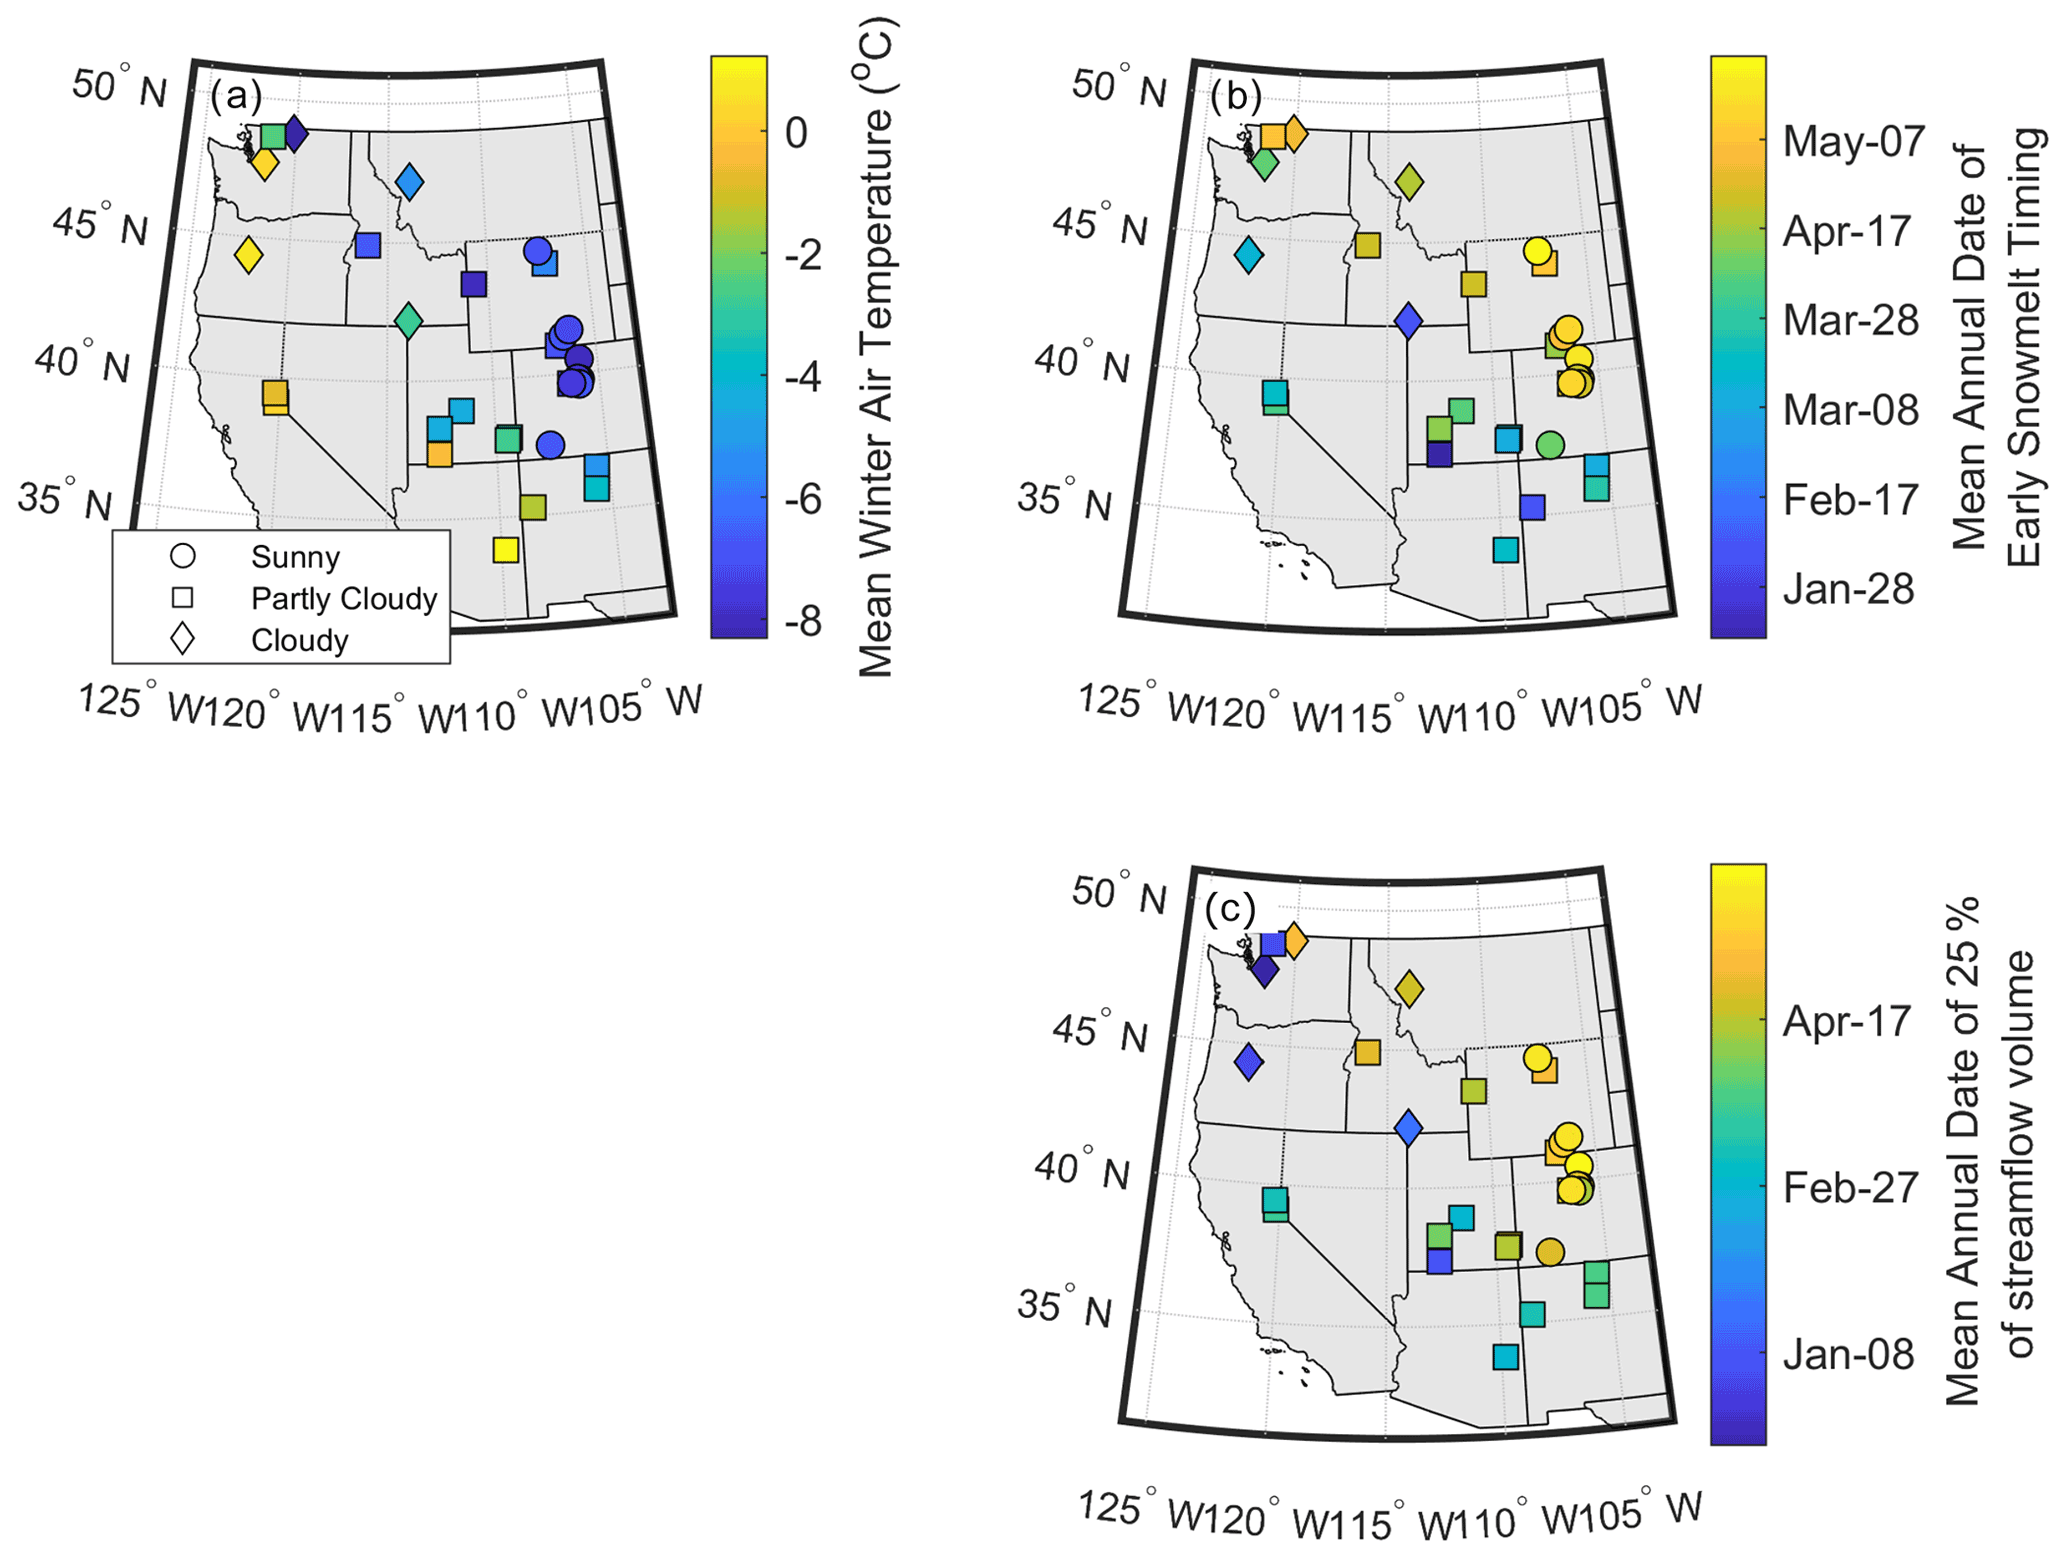
Figure A2(a) CAMELS mean winter (November to February) air temperature, (b) mean annual DOS20, and (c) mean annual DOQ25. Symbols (circle, square, and diamond) represent the mean annual percentage of clear-sky snowmelt days, where sunny sites have >90 % clear-sky snowmelt days, partly cloudy have between 70 % and 90 %, and cloudy have <70 %; clear-sky snowmelt days are defined as those with more than 80 % of the potential clear-sky solar radiation.
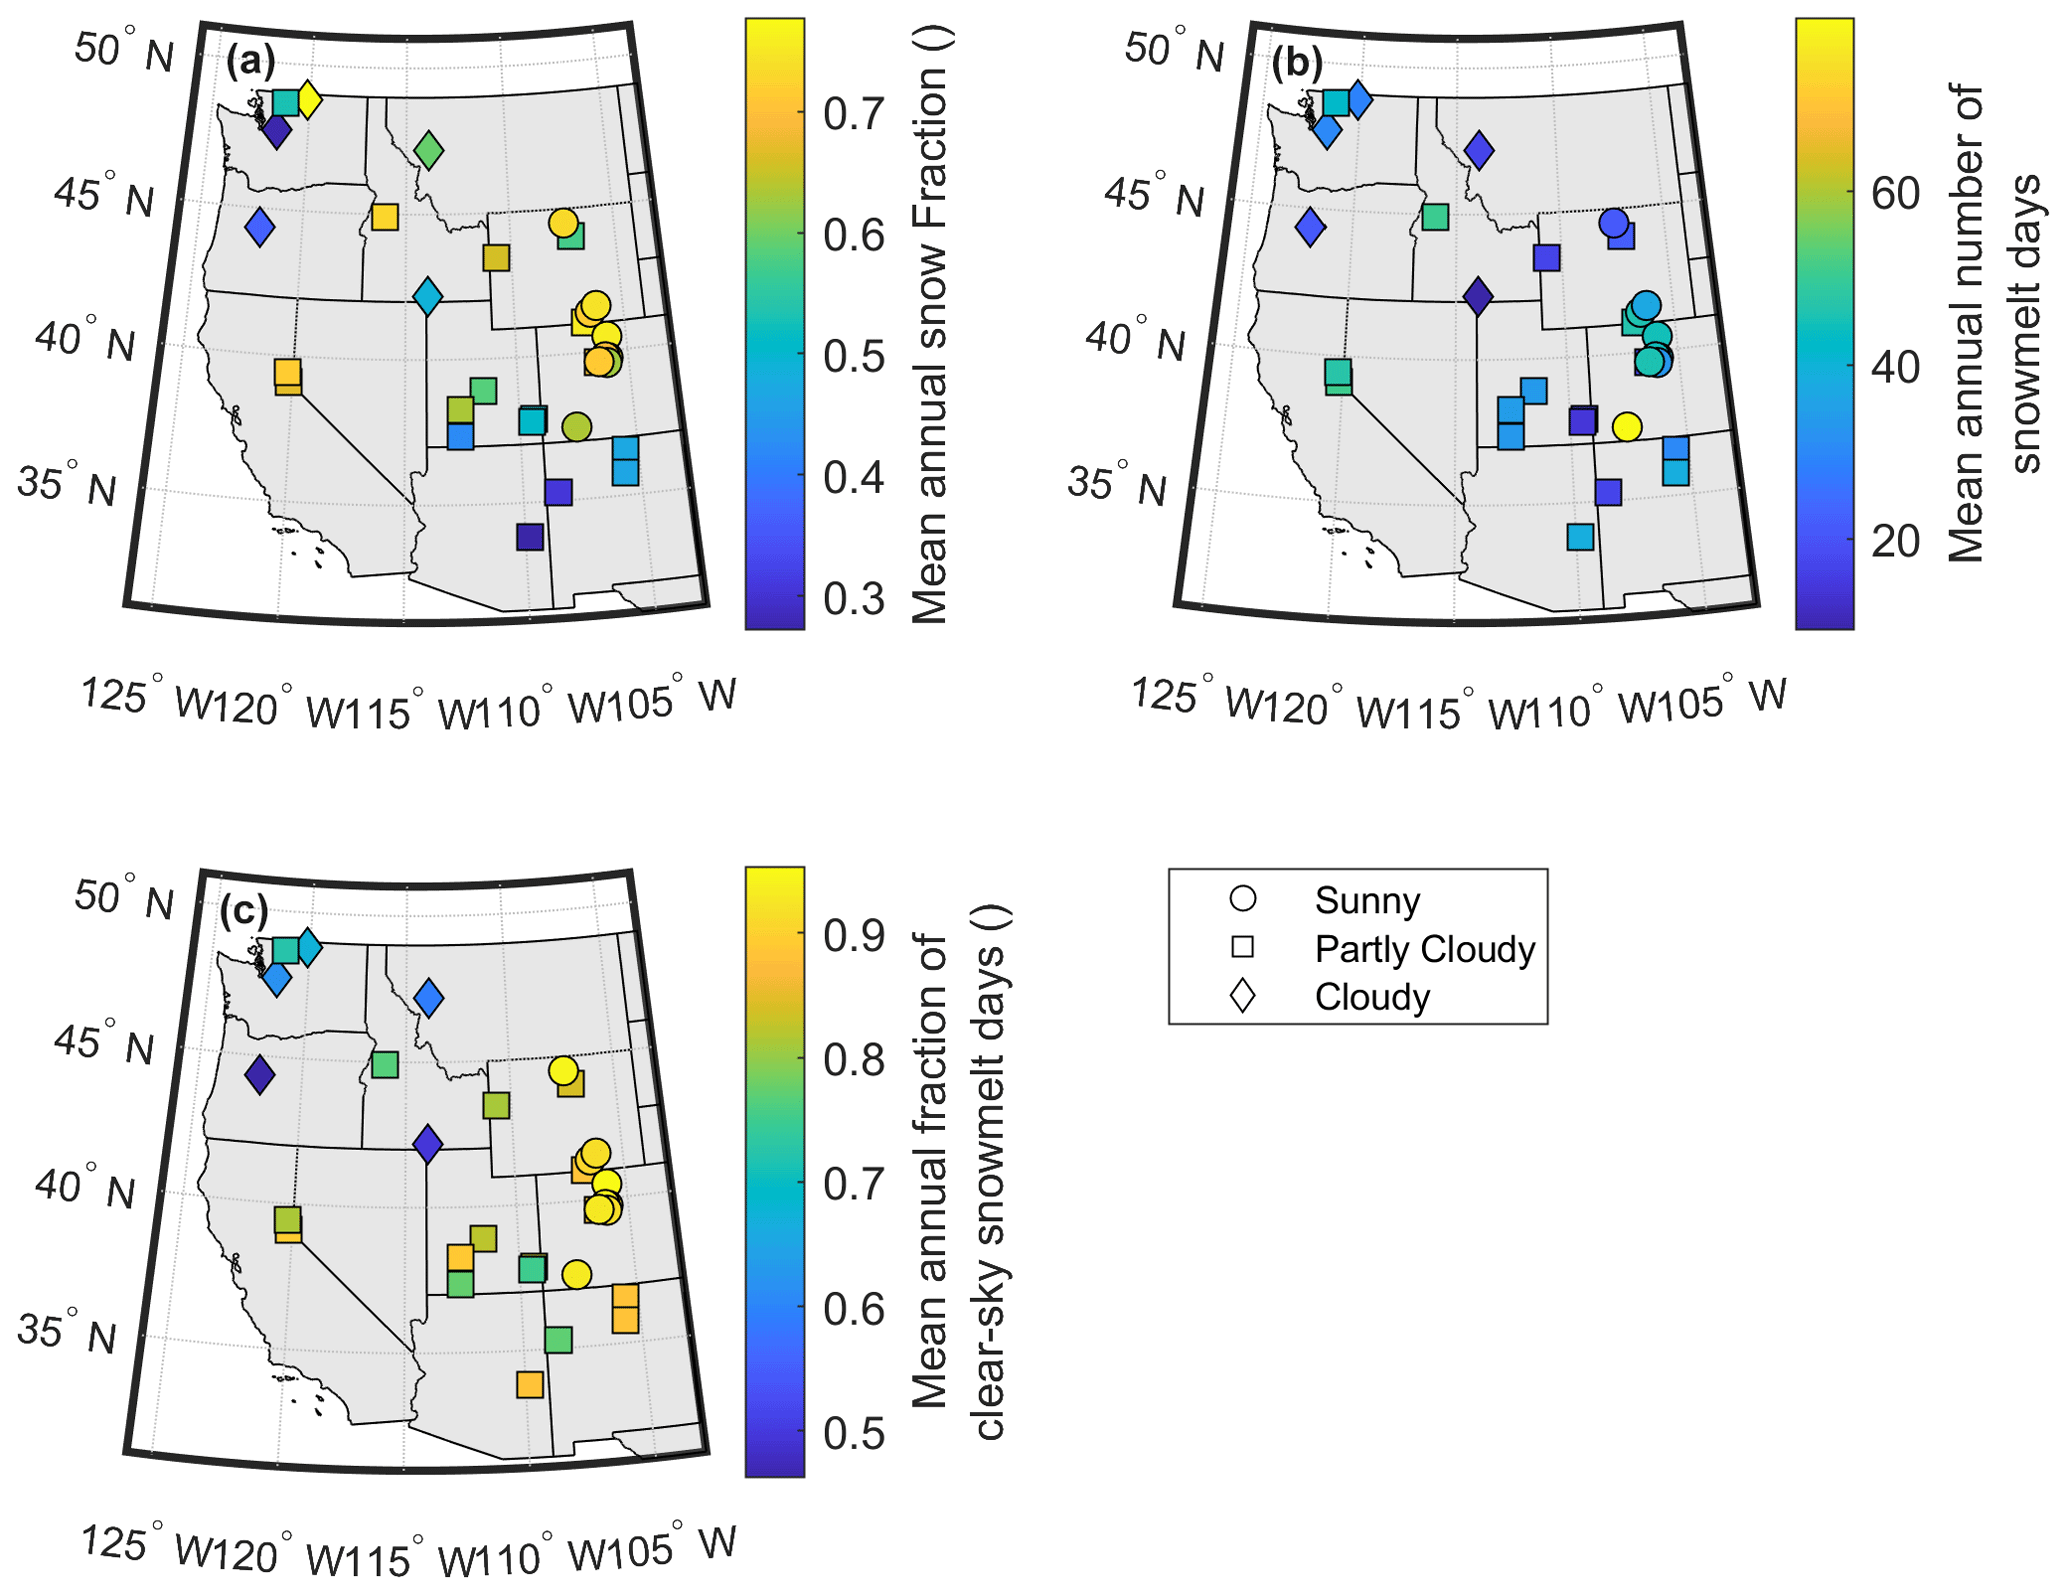
Figure A3(a) CAMELS mean annual snow fraction (snowfallprecipitation), (b) mean annual number of snowmelt days between 1 December and 1 August (calculated as the days with a correlation between hourly solar radiation and lagged streamflow greater than 0.8), and (c) mean annual fraction of clear-sky snowmelt days, calculated as the number of snowmelt days with clear-sky conditions as a fraction of total snowmelt days. A clear-sky snowmelt day is defined as having more than 80 % of the potential clear-sky solar radiation. Symbols (circle, square, and diamond) represent the mean annual percentage of clear-sky snowmelt days, where sunny sites have >90 % clear-sky snowmelt days, partly cloudy have between 70 % and 90 %, and cloudy have <70.
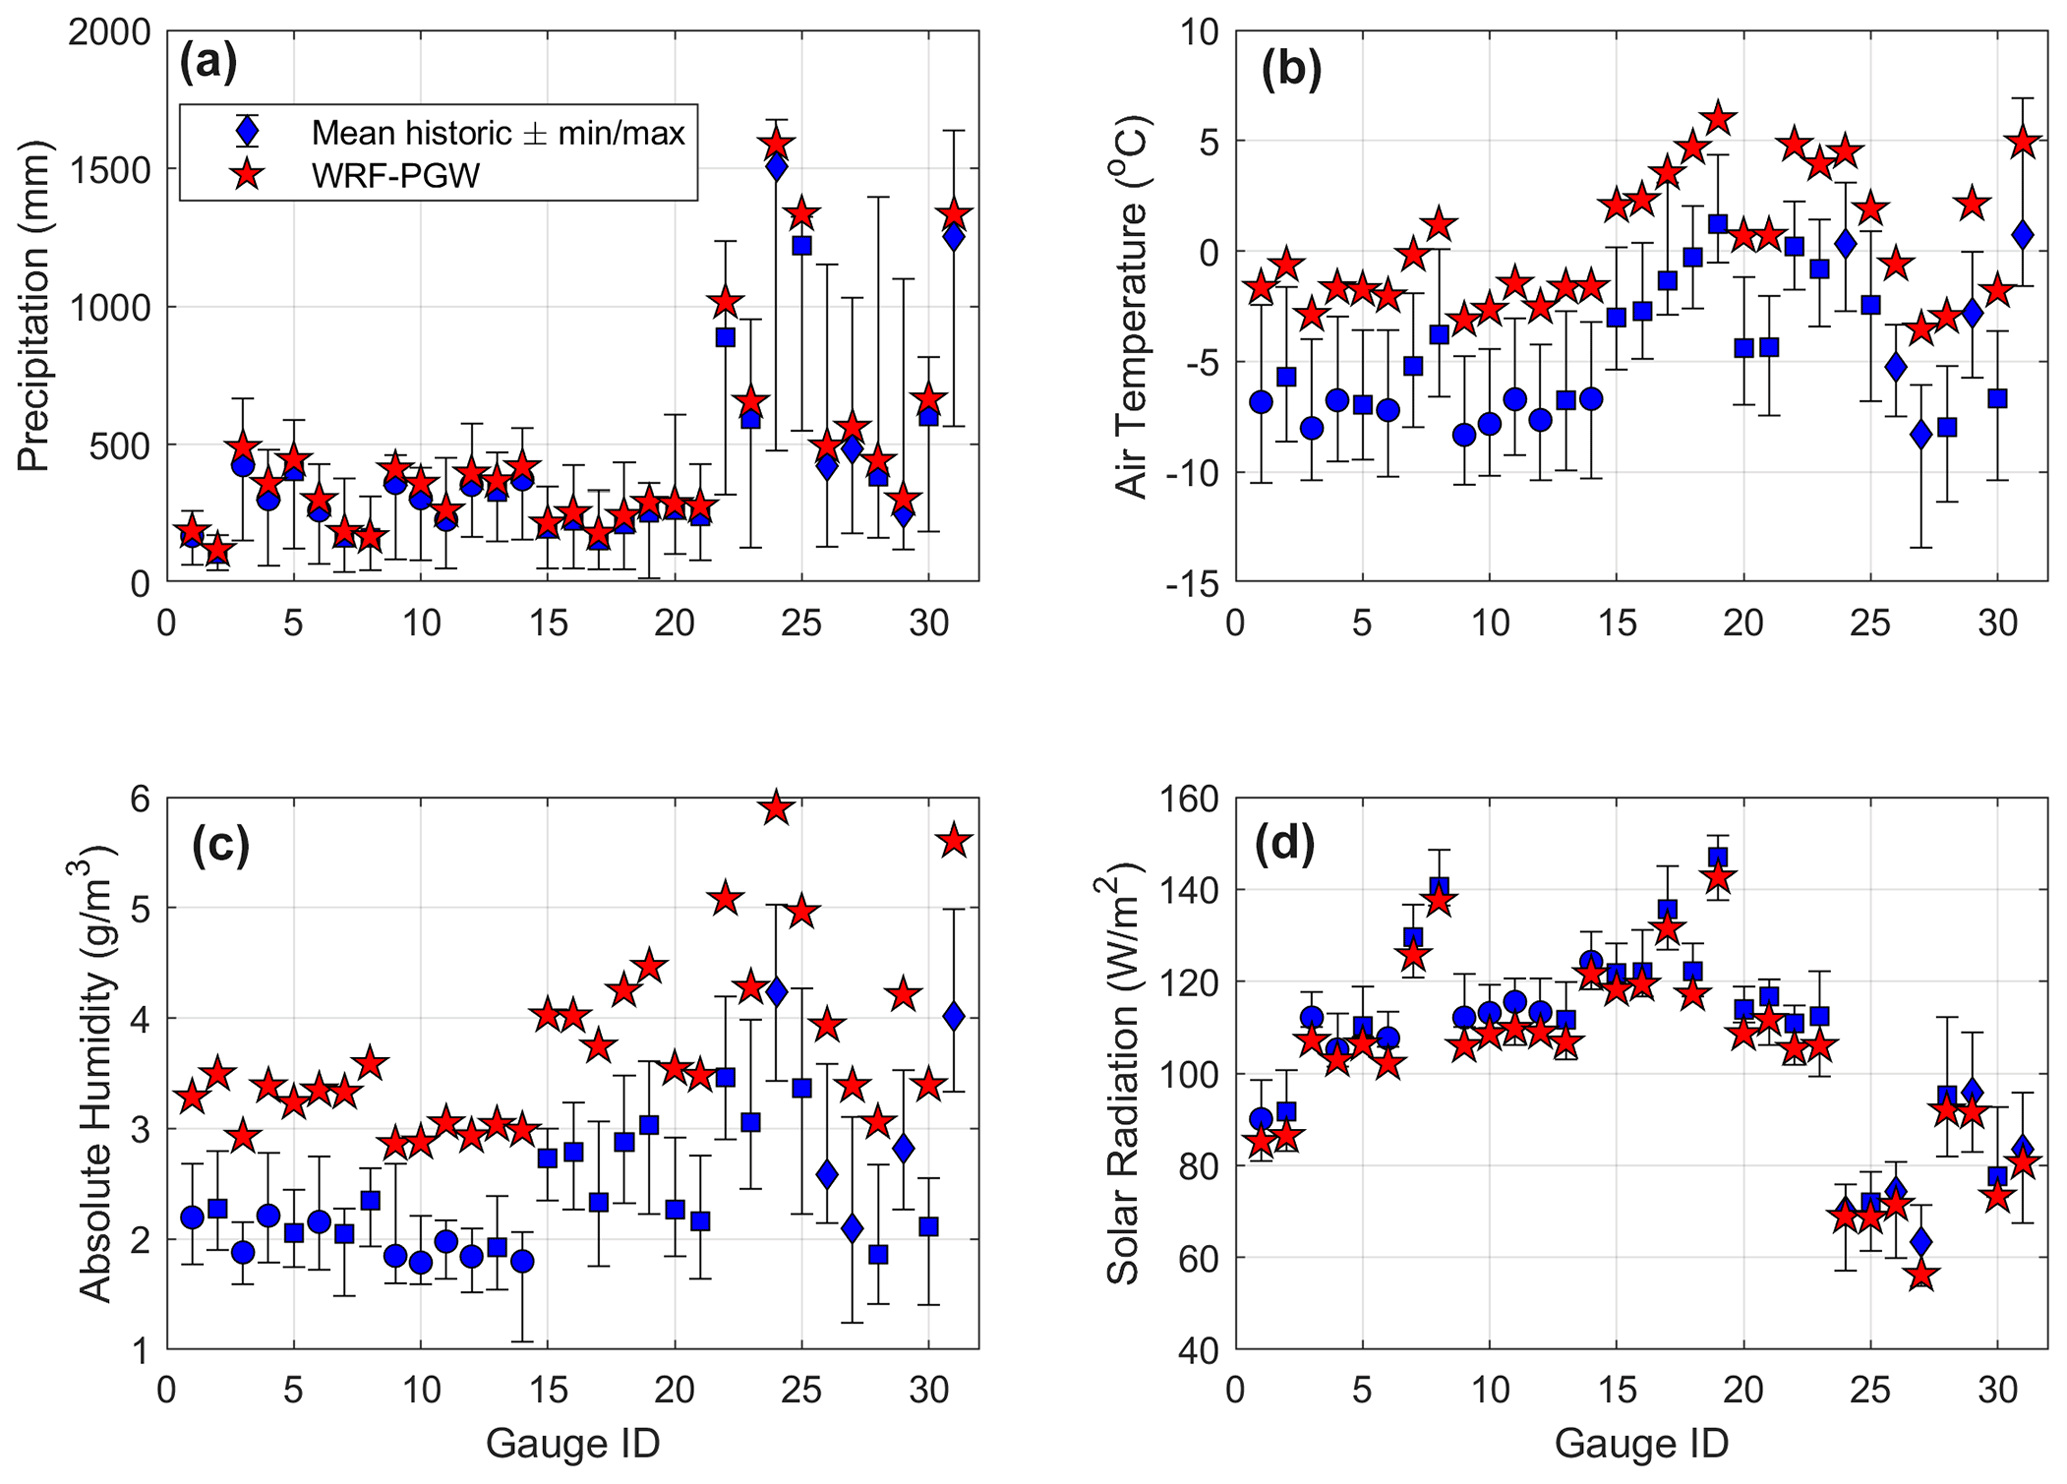
Figure A4Historic winter climate variability for each predictor used in the stepwise MLR model (Eq. 1) for the period between November and DOS20 in blue. (a) Precipitation, (b) air temperature, (c) absolute humidity, and (d) solar radiation. In red are the perturbed mean climate variables under the RCP8.5 pseudo global warming scenario by the end of the century. This analysis suggests that most of the climate change signal from NoahMP-WRF pseudo global warming is within the observed climate variability, except for air temperature and atmospheric humidity in some watersheds. Blue symbols (circle, square, and diamond) associated with historical values represent the mean annual percentage of clear-sky snowmelt days, where sunny sites have >90 % clear-sky snowmelt days, partly cloudy have between 70 % and 90 %, and cloudy have <70 %; clear-sky snowmelt days are defined as those with more than 80 % of the potential clear-sky solar radiation. We make no inference about the cloudiness condition of snowmelt days under the RCP8.5 pseudo global warming scenario, and thus, we use a five-point star (in red) for the future scenario.
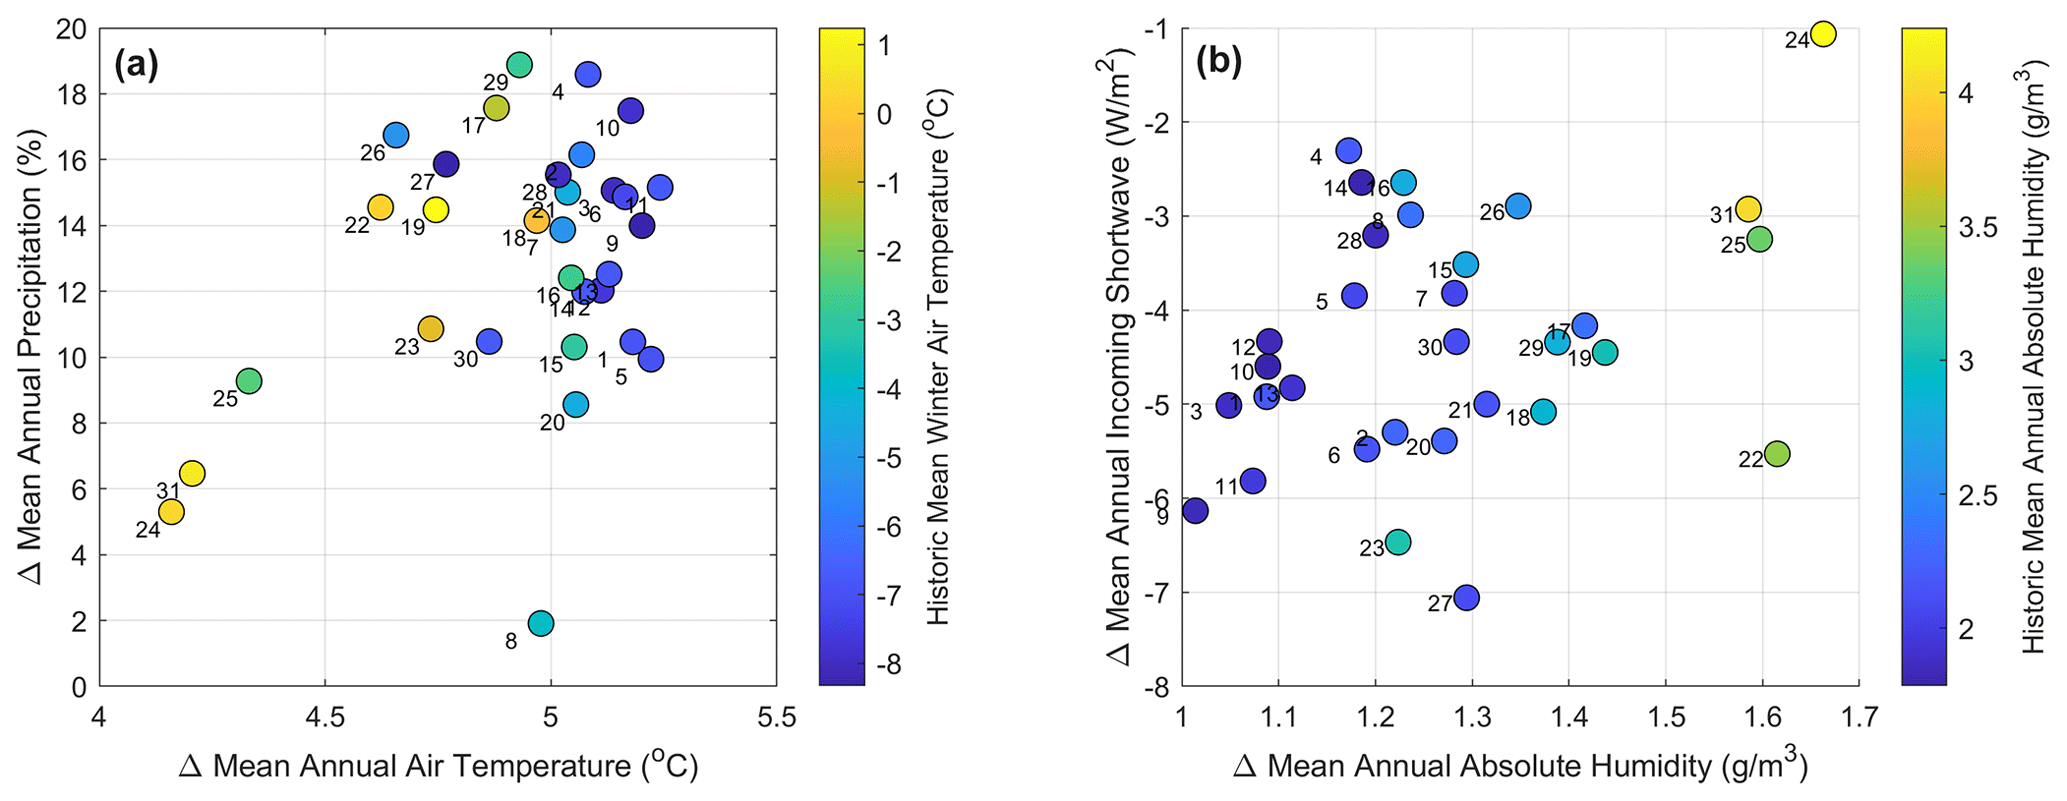
Figure A5Mean annual climate changes projected by WRF under a RCP8.5 pseudo global warming scenario by the end of the century. Panel (a) shows changes in precipitation against air temperature. Panel (b) shows incoming shortwave against absolute humidity. Numbers represent the gauge IDs as presented in Table 2.
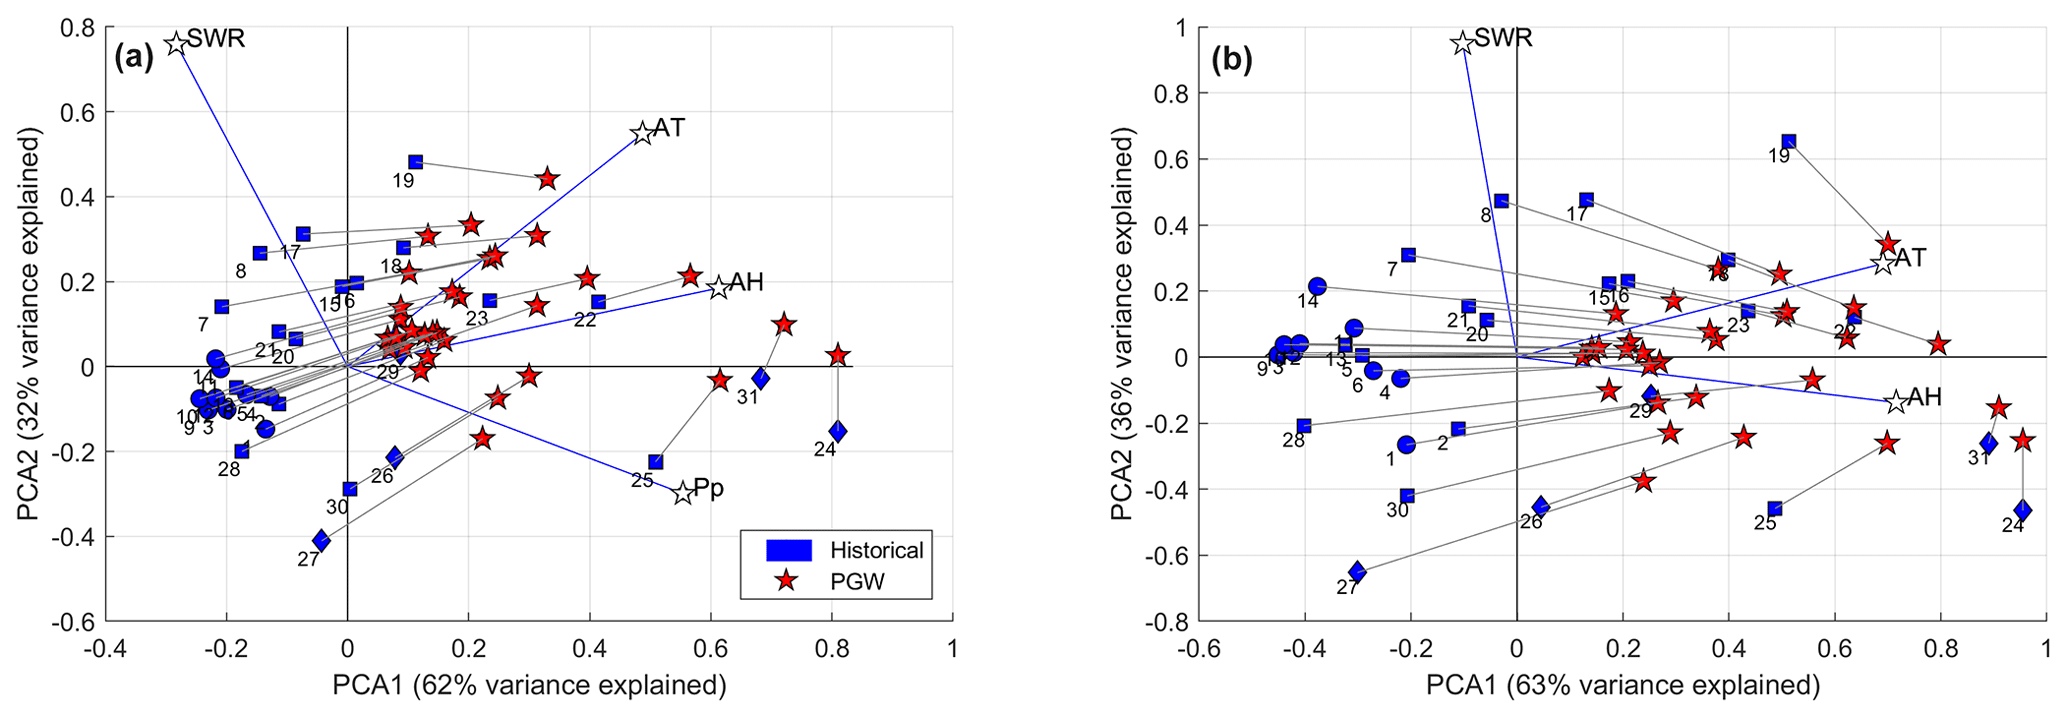
Figure A6(a) Principal component analysis for historical precipitation (Pp), air temperature (AT), absolute humidity (AH) and shortwave radiation (SWR) at each watershed and the changes associated with the pseudo global warming as simulated by WRF. Panel (b) shows the same analysis but excluding precipitation from the analysis. Blue symbols (circle, square, and diamond) associated with historical values represent the mean annual percentage of clear-sky snowmelt days, where sunny sites have >90 % clear-sky snowmelt days, partly cloudy have between 70 % and 90 %, and cloudy have <70 %; clear-sky snowmelt days are defined as those with more than 80 % of the potential clear-sky solar radiation. We make no inference about the cloudiness condition during snowmelt days under the RCP8.5 pseudo global warming scenario, and thus, we use a five-point star (in red) for the future scenario. Numbers next to blue symbols represent the gauge IDs as presented in Table 2.
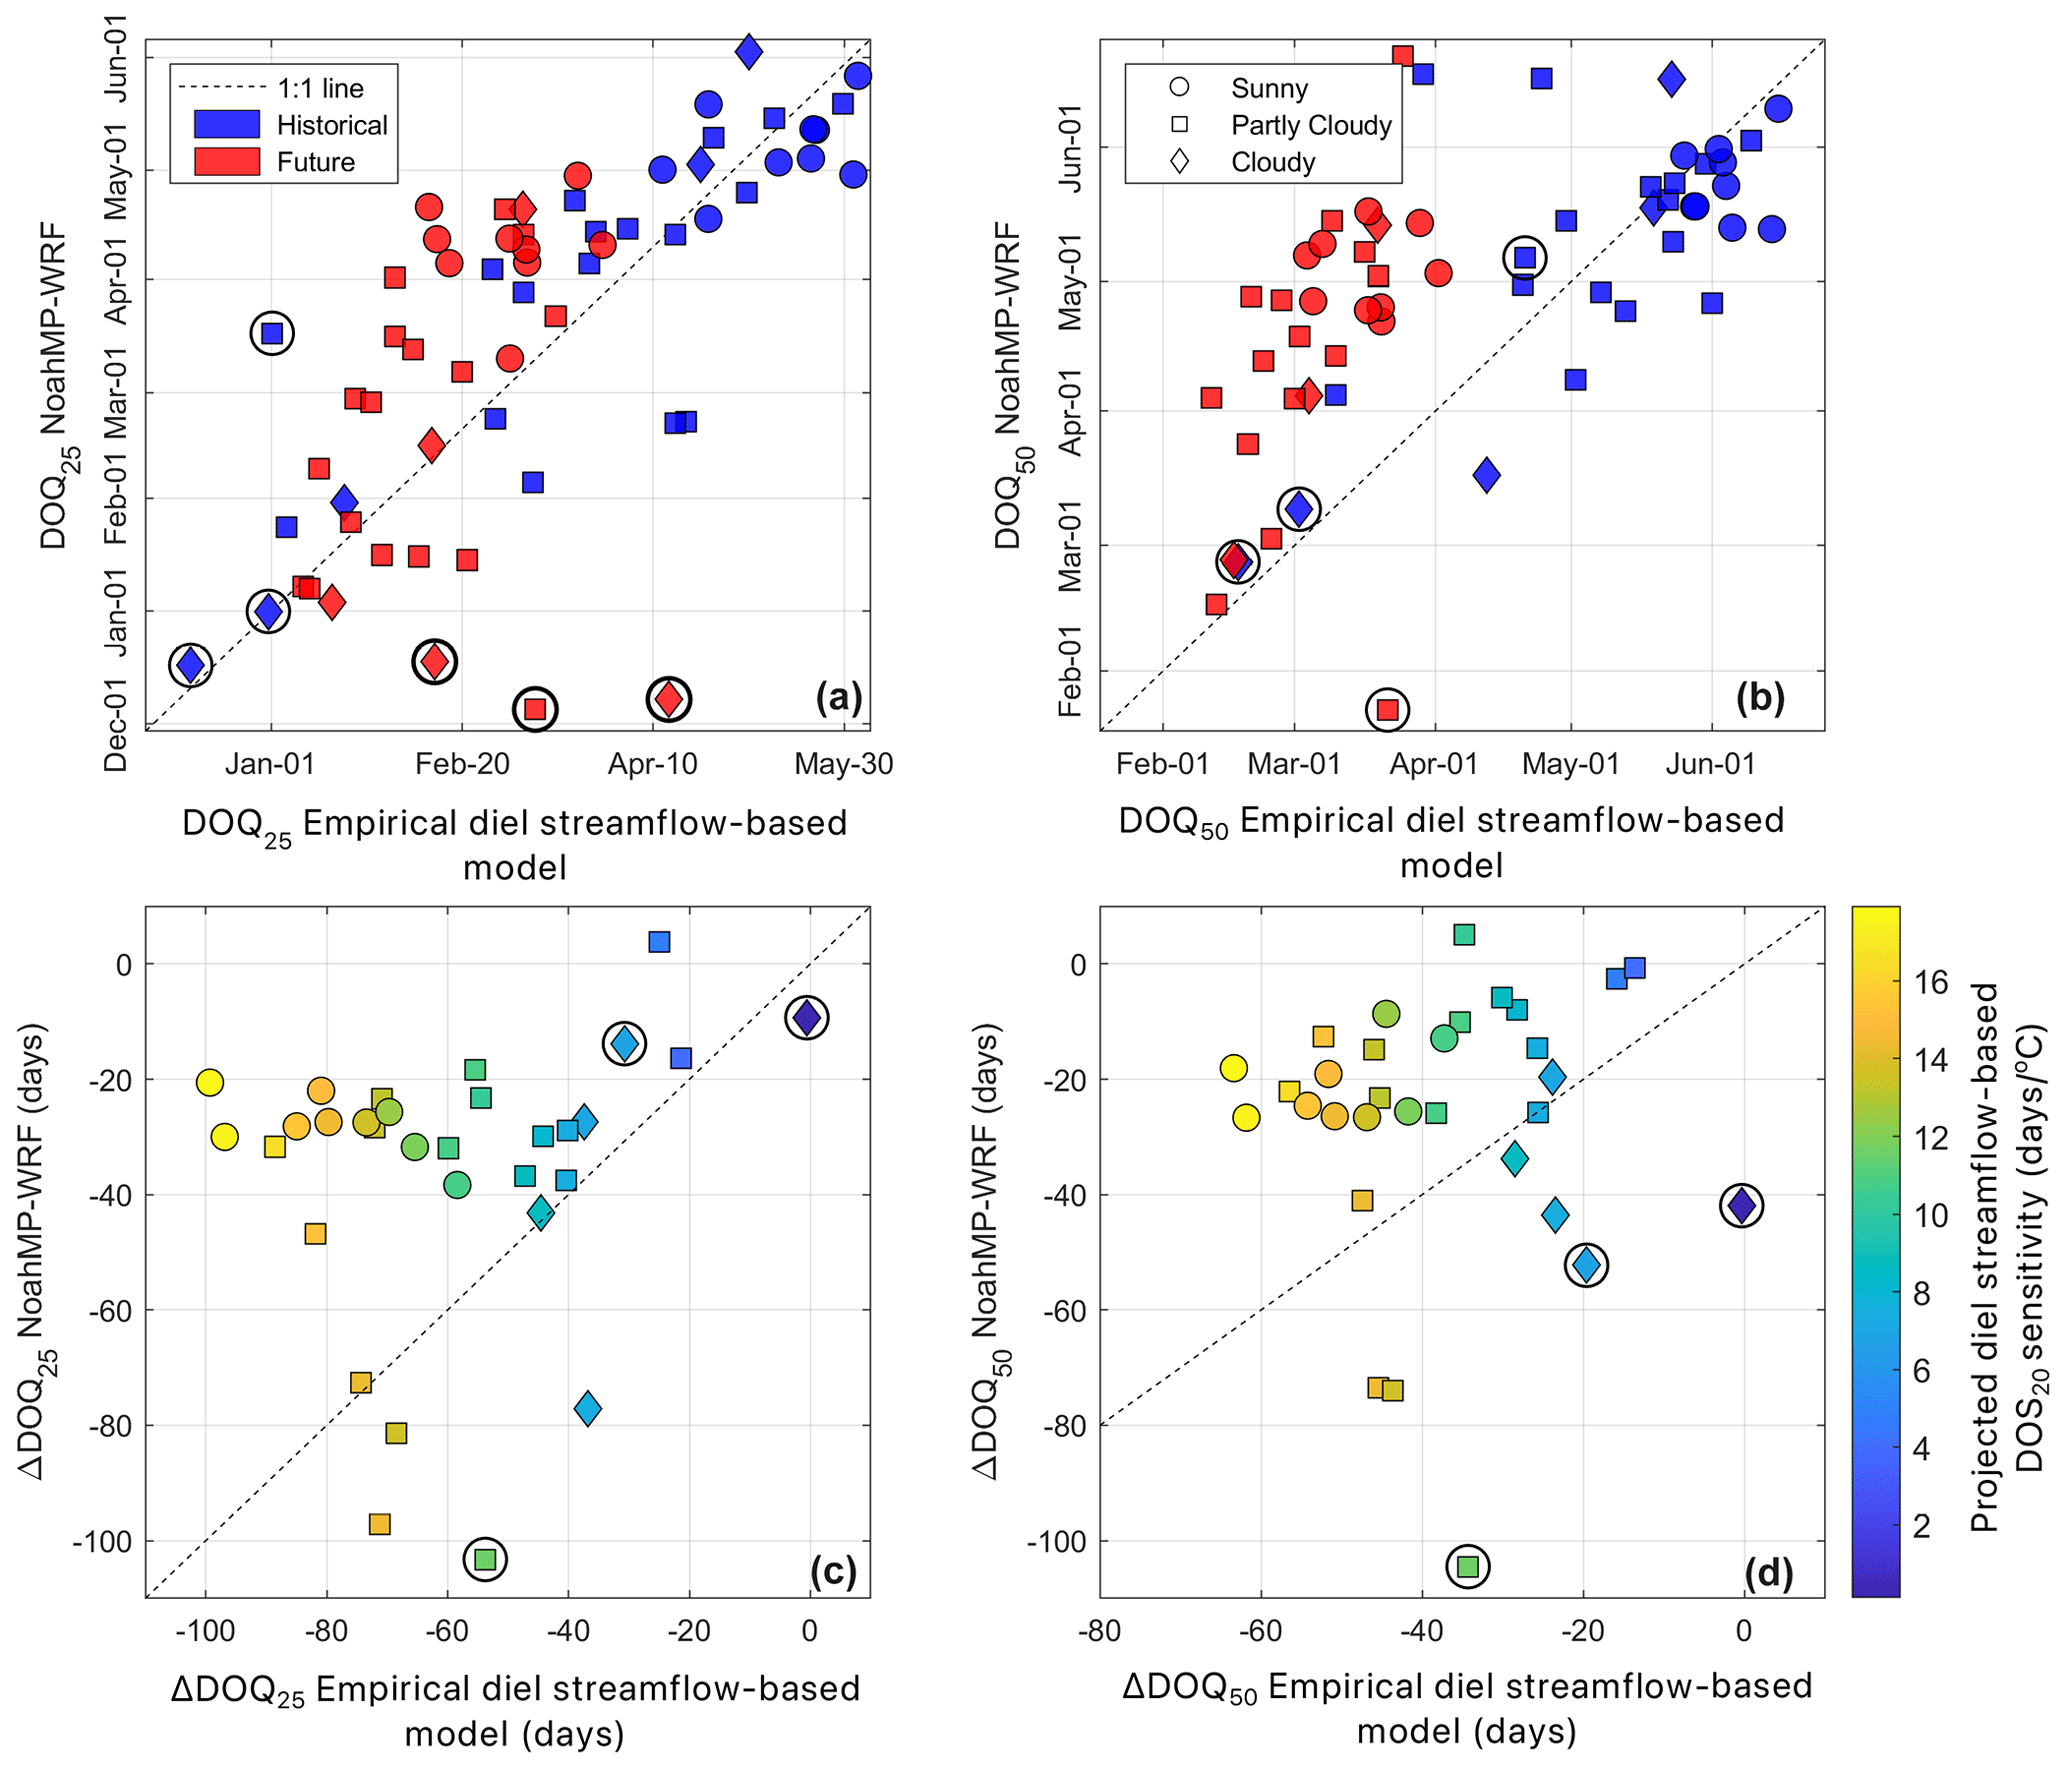
Figure A7Same as Fig. 9 but using streamflow timing metrics from NoahMP-WRF for a RCP8.5 pseudo global warming scenario, calculated using surface runoff only instead of using surface plus subsurface runoff (as in Fig. 6). Note the improved fit in historical DOQ25; however, this analysis yields very similar results to those in Fig. 6, with NoahMP-WRF streamflow simulations being much less sensitive to climate change than the empirical diel streamflow-based model suggests. Panels (a) and (b) compare historical against projected values between NoahMP-WRF and the empirical diel streamflow-based model. Panels (c) and (d) compare the projected change (future minus historical) between NoahMP-WRF and the diel streamflow-based model, colored by the sensitivity of DOS20 to climate change as projected by the empirical diel streamflow-based model (Fig. 5b). Symbols surrounded by black circles indicate sites that were excluded from the regression analysis in Fig. 3 (rainier site ID 24, 25, and 31). Symbols (circle, square, and diamond) represent the historical mean annual percentage of clear-sky snowmelt days, where sunny sites have >90 % clear-sky snowmelt days, partly cloudy have between 70 % and 90 %, and cloudy have <70 %; clear-sky snowmelt days are defined as those with more than 80 % of the potential clear-sky solar radiation. We make no inference about the cloudiness condition of snowmelt days under the RCP8.5 pseudo global warming climate scenario; however, red symbols (upper panels) follow the same symbology for easier interpretation.
Table A1Coefficient of determination (R2) and slope (in parentheses; day/day) of the linear regression between different early snowmelt timing metrics and DOQ25 and DOQ50, as presented in Fig. 5, for different correlation cutoffs (r) between hourly solar radiation and streamflow. DOSxx represent the date when the xxth percentile of snowmelt days occurs. Site ID 24, 35, and 31 are excluded from the linear relationship. Bolded numbers are those used in the result and discussion sections.
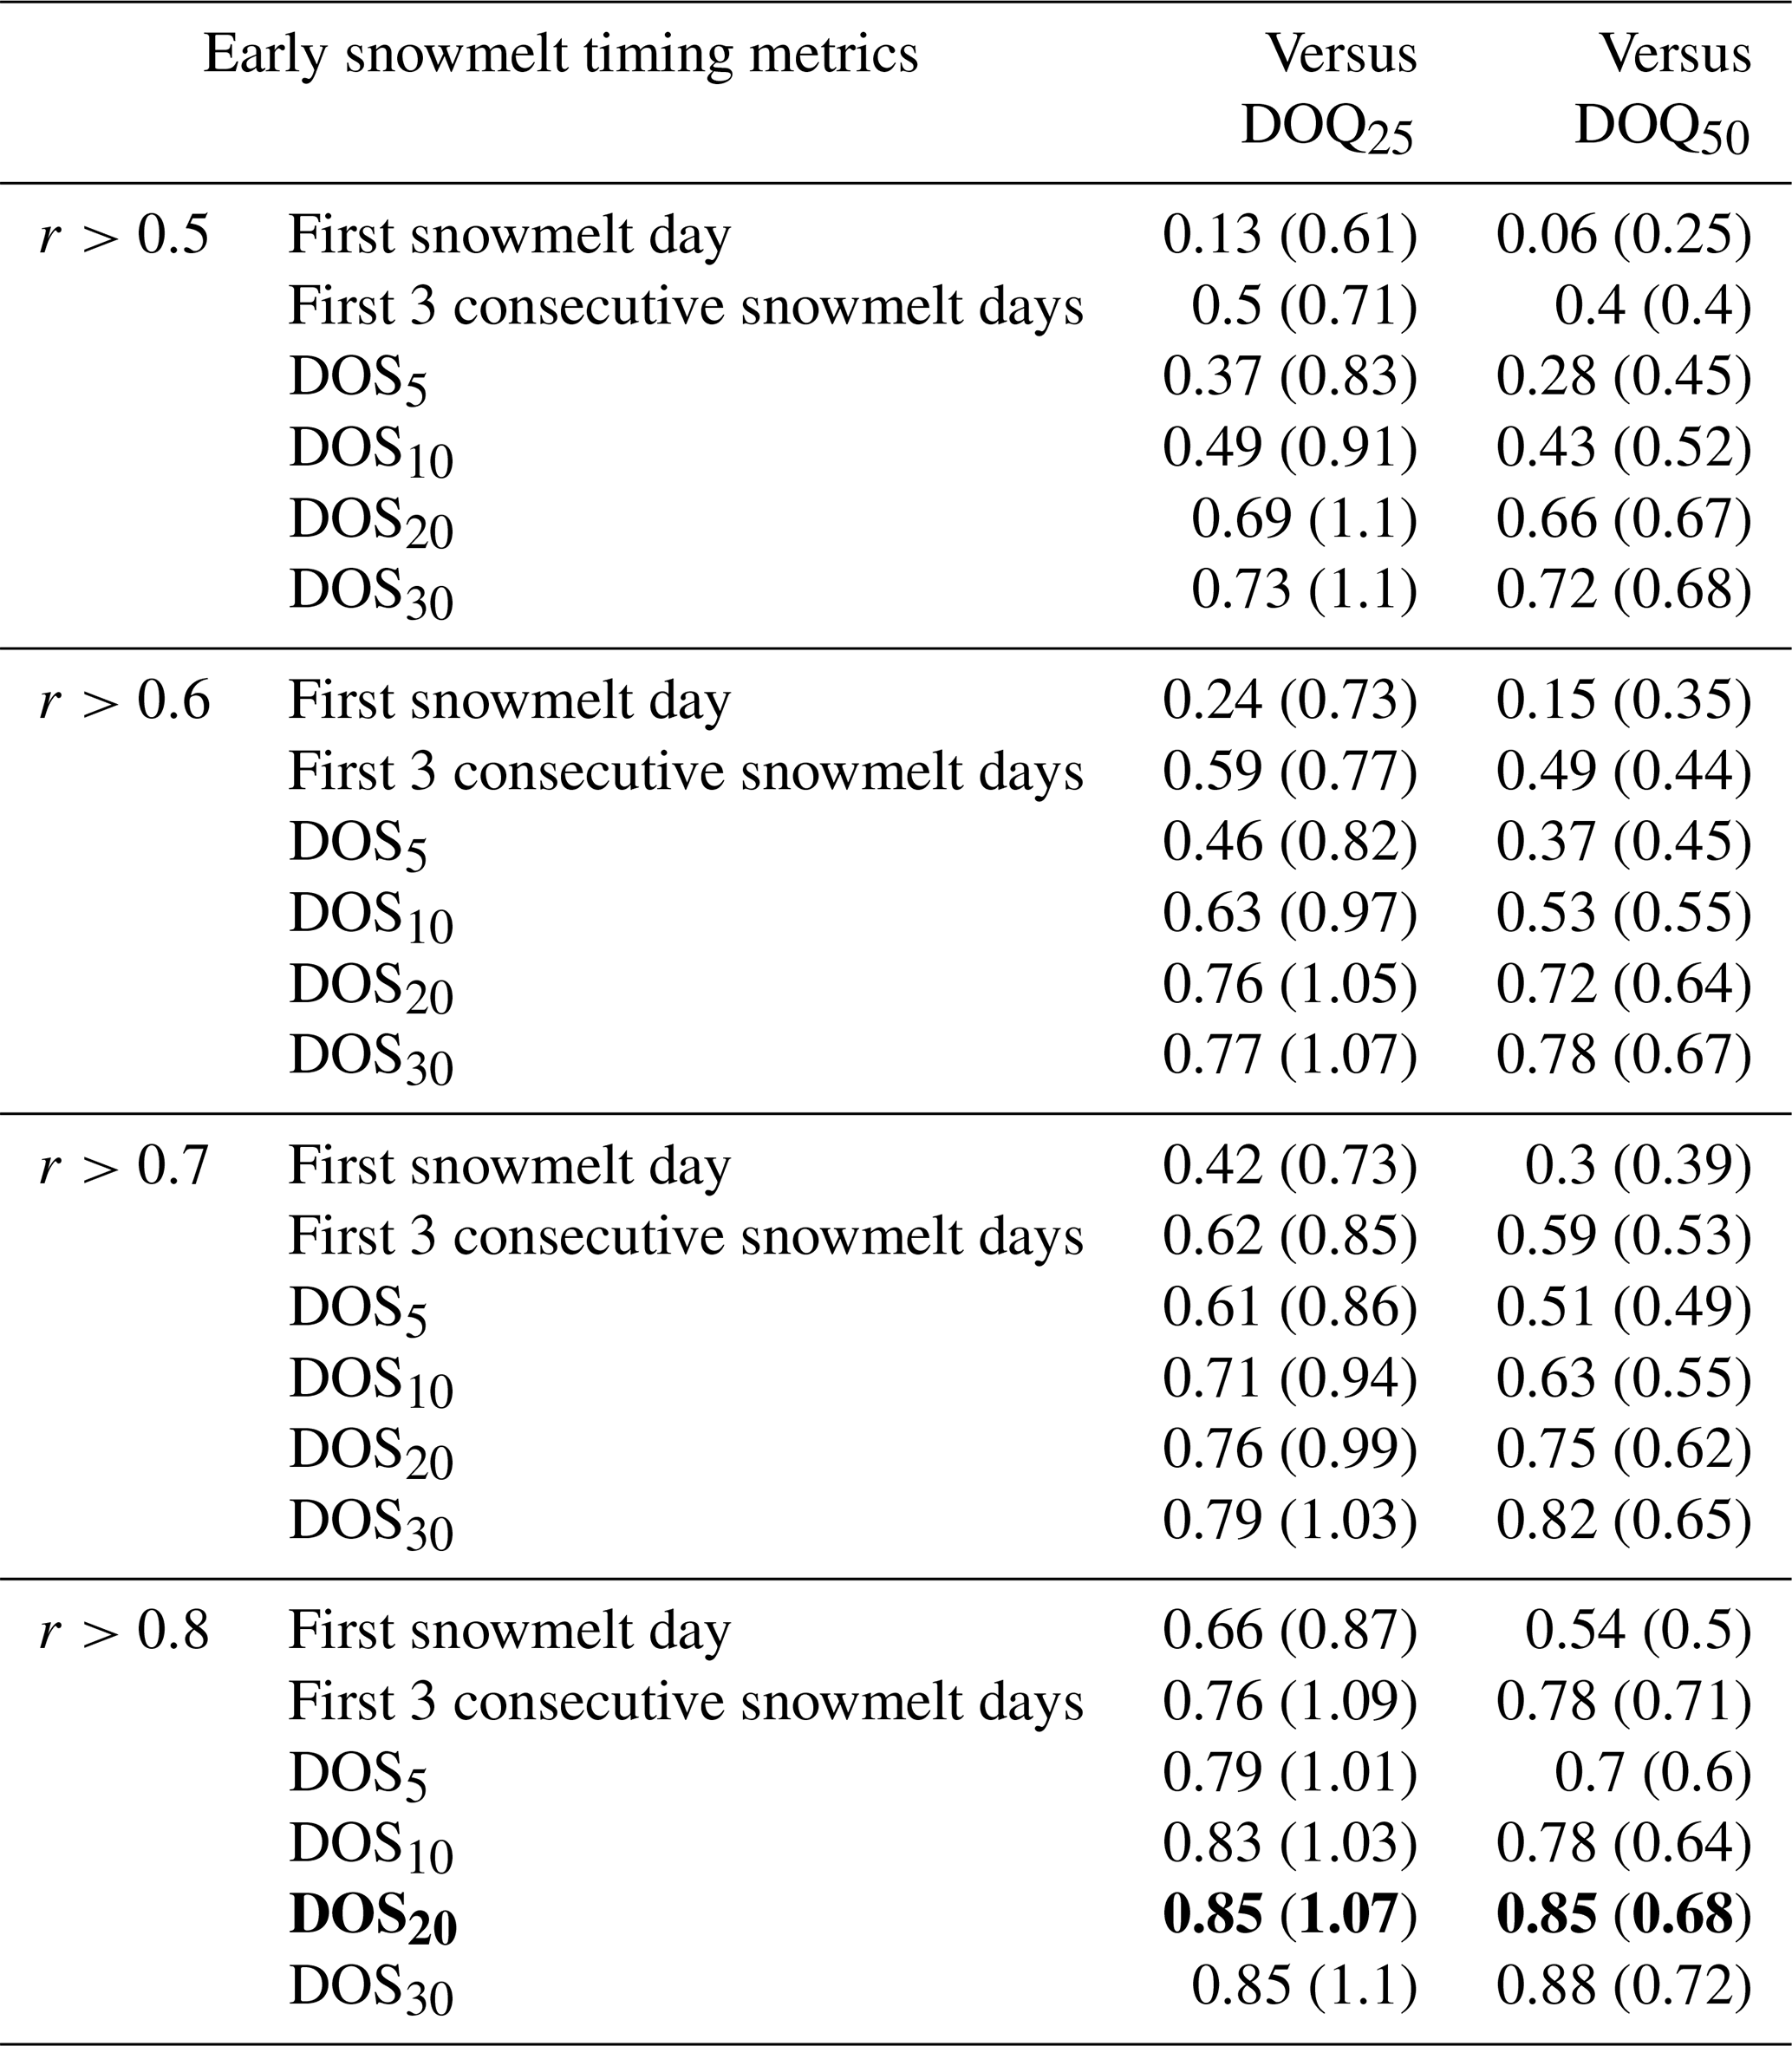
Table A2Root mean square error (RMSE) and coefficient of determination (R2; in parentheses) associated with several stepwise multiple linear regressions (similar to the one in Eq. 1) using different early snowmelt timing metrics (e.g., Eq. 1 uses DOS20) and correlation cutoffs (r) between hourly solar radiation and streamflow used to define snowmelt days. DOSxx represents the date when the xxth percentile of snowmelt days occurs. Bolded numbers are associated with the stepwise MLR in Eq. (1), which is also shown in Fig. 7a.
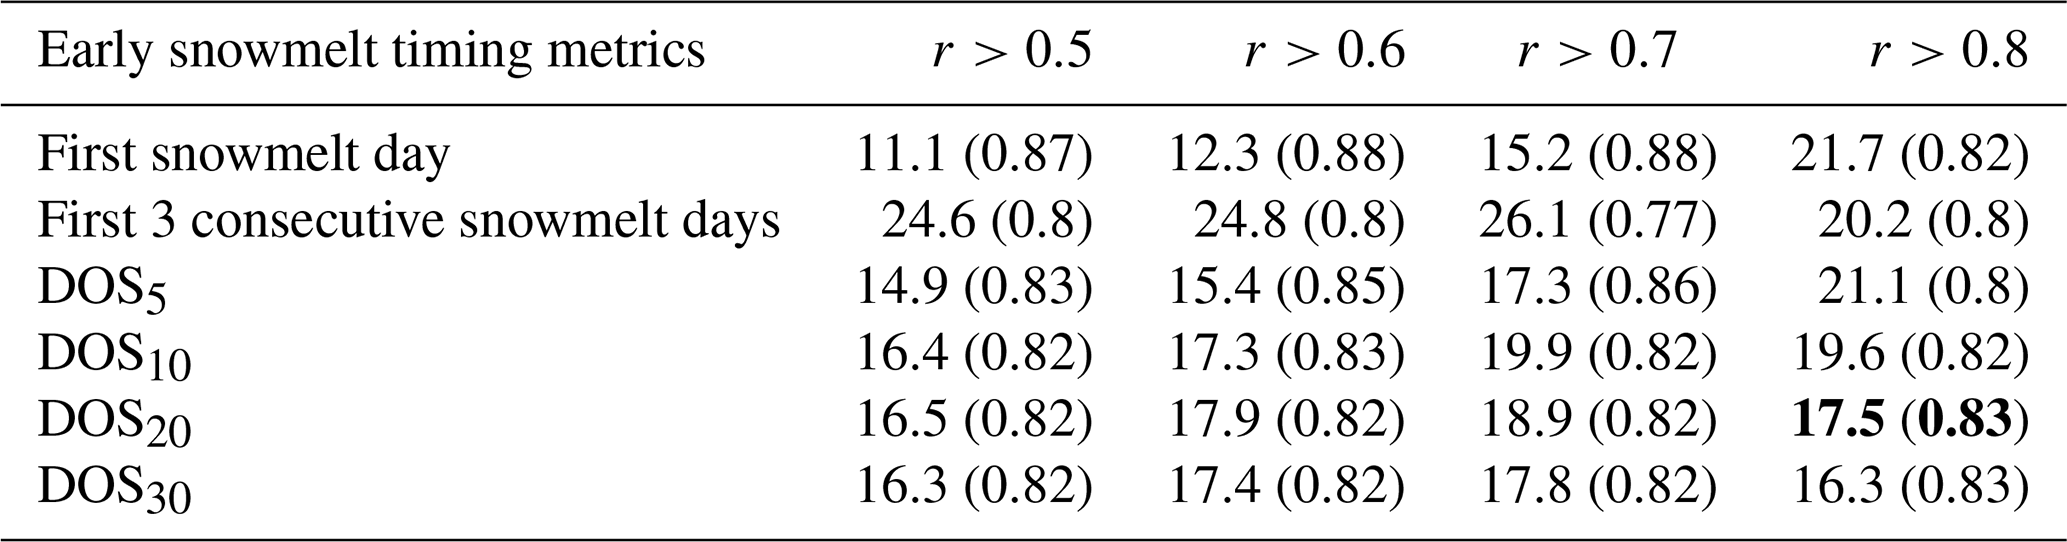
Table A3Coefficient of determination (R2) for the site-averaged stepwise multiple linear regression, analogous to that presented in Fig. 7b, for different modeling decisions (correlation cutoff between hourly solar radiation and streamflow, r, and early snowmelt days metrics). DOSxx represents the date when the xxth percentile of snowmelt days occurs. The bolded number is associated with the stepwise MLR in Eq. (1) using DOS20.
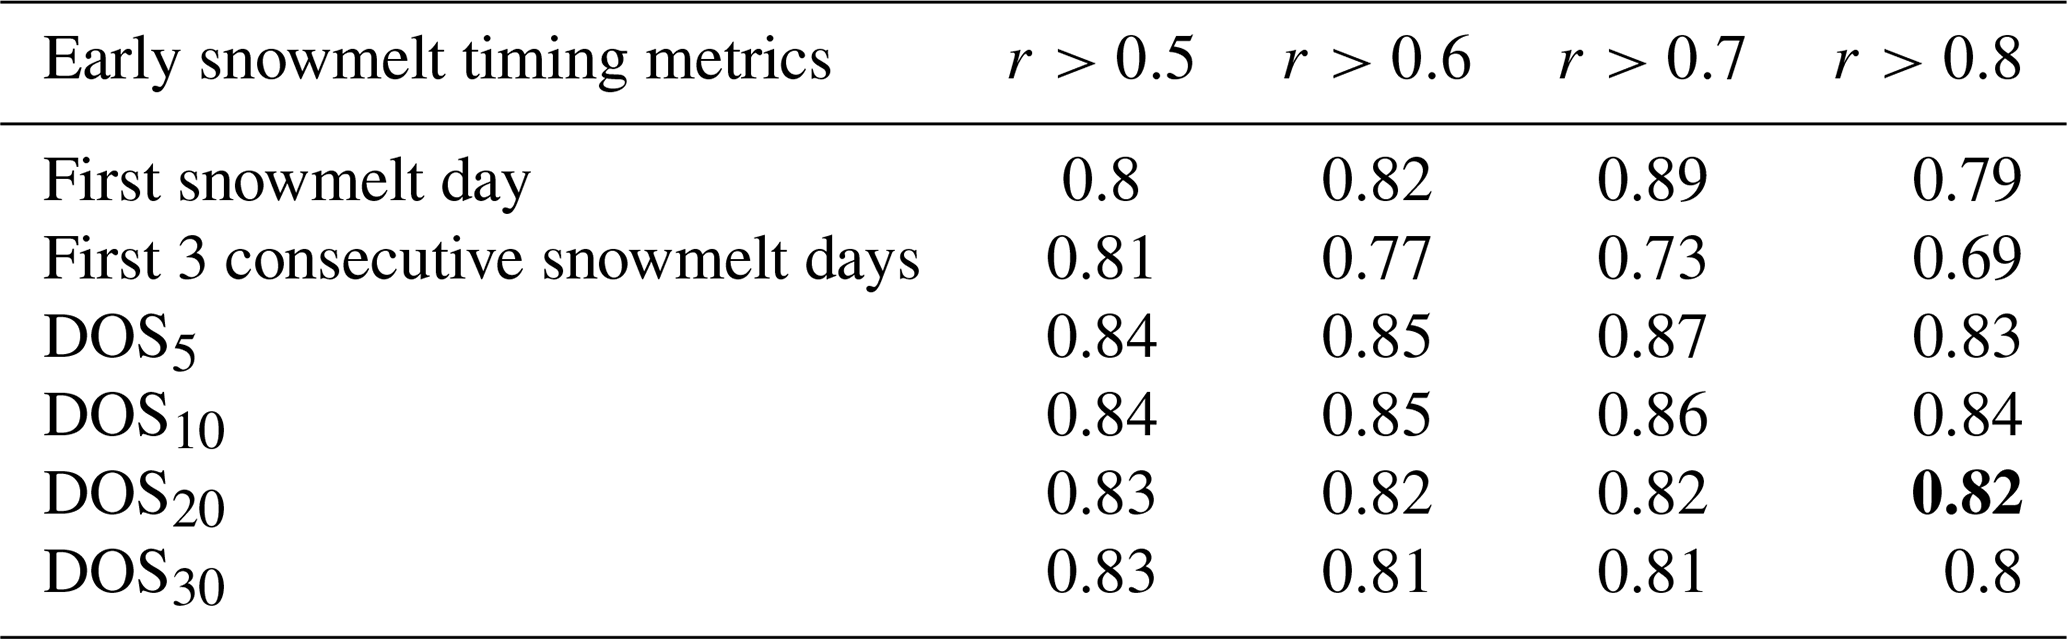
Table A4Standardized beta coefficients for the stepwise MLR associated with the different correlation cutoffs (r) between hourly solar radiation and streamflow and different early snowmelt metrics. These stepwise MLR models follow the same structure as that of Eq. (1); however, in this case, predictors were standardized to estimate their relative importance. Note: AT – air temperature; Pp – precipitation; RH – relative humidity; SWR – incoming shortwave radiation. DOSxx represent the date when the xxth percentile of snowmelt days occurs. The asterisk* indicates rows that do not meet all the MLR assumptions. Bolded numbers are associated with the modeling decisions used in the result and discussion sections.
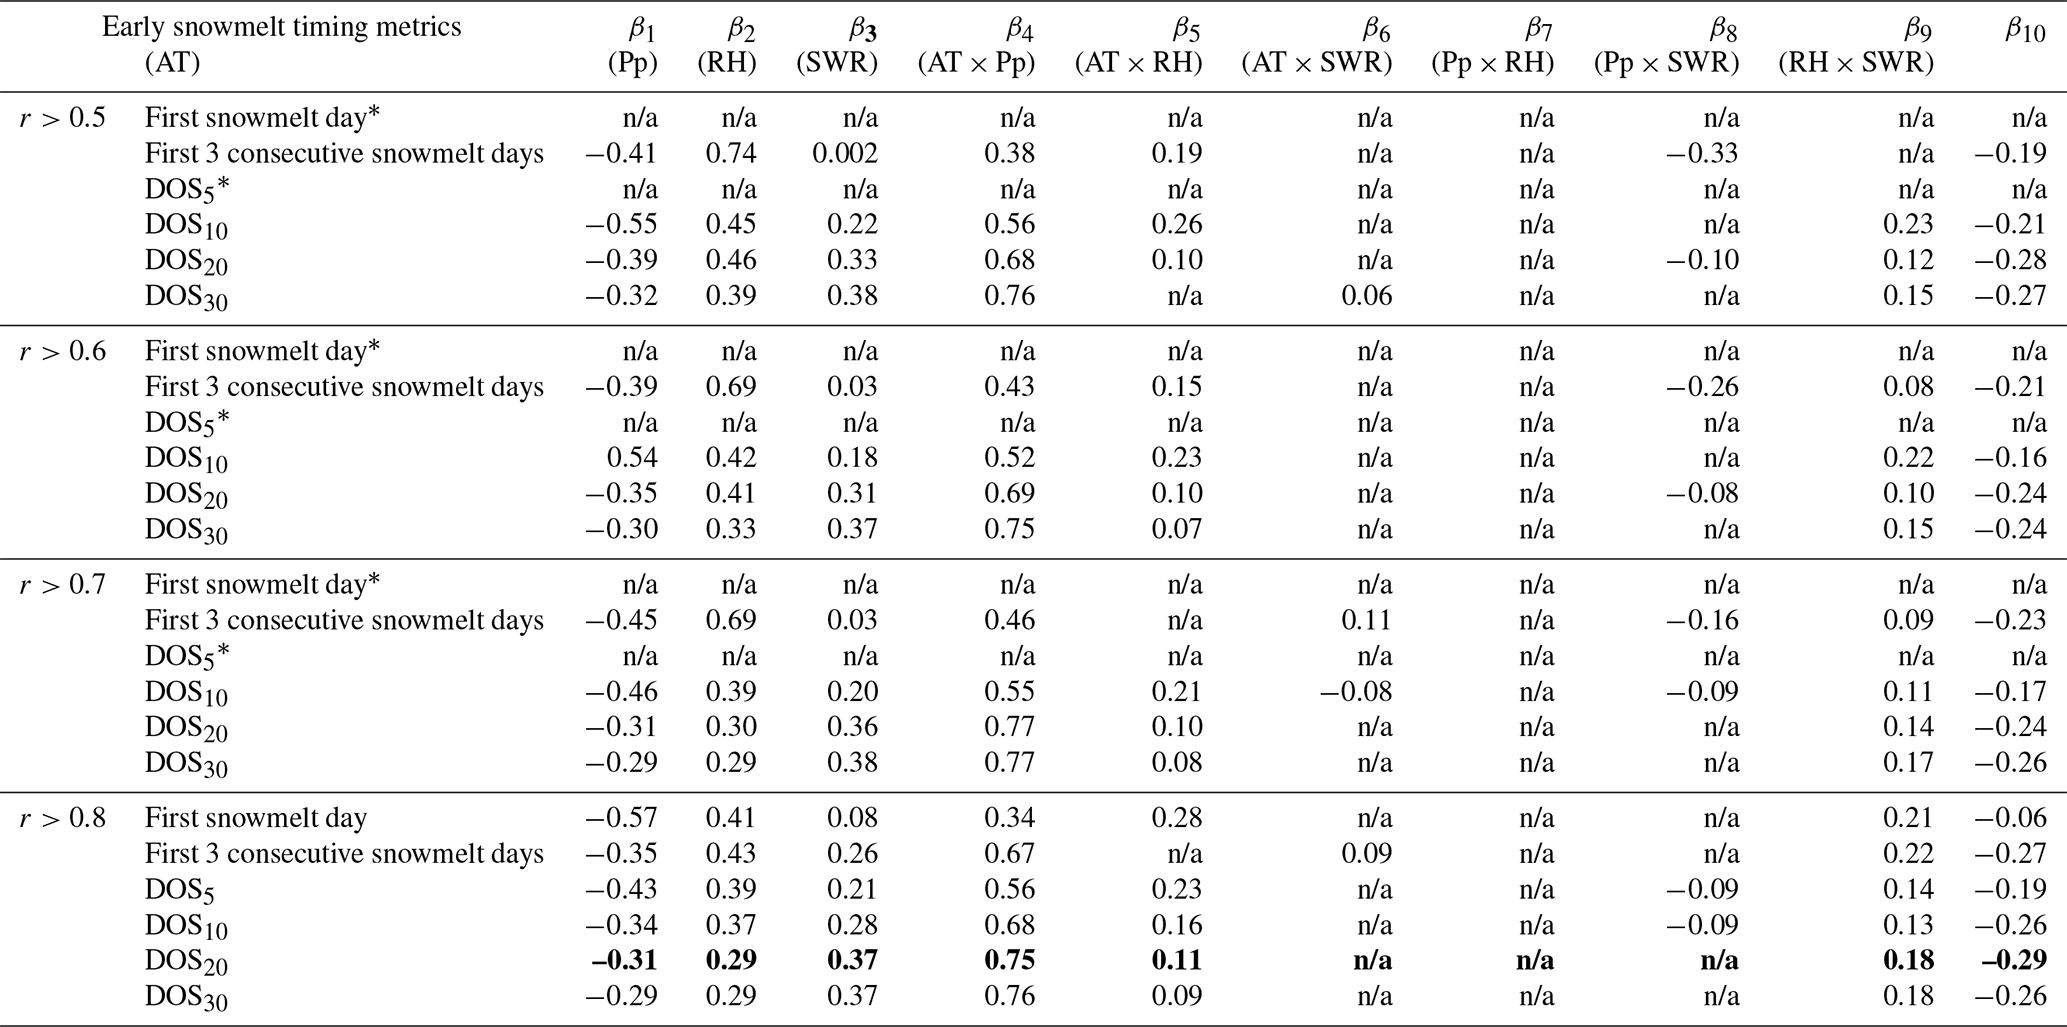
Note: n/a stands for not applicable.
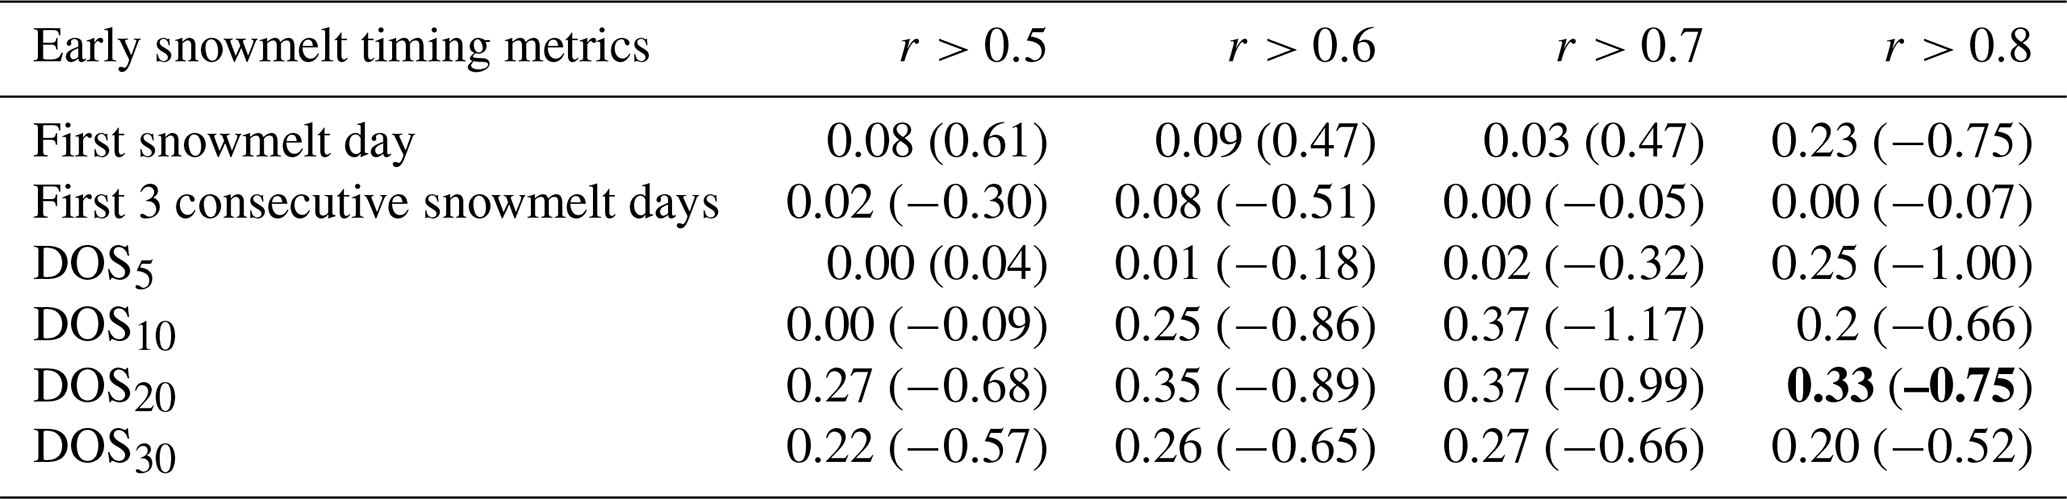
Table A5Coefficient of determination (R2) and slope (in parentheses; d ∘C−1) of the linear regression between the empirical diel streamflow-based model sensitivity to warming and sites' mean winter air temperature as presented in Fig. 8b, for different early snowmelt day metrics and correlation cutoffs (r) between hourly solar radiation and streamflow. DOSxx represent the date when the xxth percentile of snowmelt days occurs. Bolded numbers are associated with the modeling decisions used in the result and discussion sections.
Data from NoahMP-WRF simulations can be accessed through their public website at https://doi.org/10.5065/49SN-8E08 (Rasmussen et al., 2021). Hourly shortwave radiation can be accessed online at https://doi.org/10.5067/6J5LHHOHZHN4 (Xia et al., 2009). Hourly streamflow from the USGS database can be accessed online at https://waterdata.usgs.gov/nwis/sw (US Geological Survey, 2016). The code used to process and analyze the data presented in the study is available upon request to the corresponding author.
SAK and AH designed the study. SAK performed all the analyses, prepared the figures, and drafted the first version of the paper. JWK developed the diel cycle index, which served as the initial idea for the presented snowmelt detection method. GS collected and preprocessed USGS hourly streamflow data and NLDAS-2 solar radiation. LS preprocessed daily surface and subsurface runoff from the WRF CONUS-I simulations. All the authors reviewed and contributed to the final version of the paper.
The contact author has declared that neither they nor their co-authors have any competing interests.
Publisher's note: Copernicus Publications remains neutral with regard to jurisdictional claims in published maps and institutional affiliations.
We appreciate the positive feedback and suggestions from Jessica Lundquist and an anonymous reviewer, which greatly improved the paper.
This project has been supported by a grant from the Center for Weather and Water Extremes in the West (CW3E) Atmospheric River Program and two National Science Foundation grants (EAR nos. 2012310 and 2012188) to Adrian Harpold. Sebastian A. Krogh thanks CONICYT, for providing financial support through the Becas Chile program for postdoctoral studies.
This paper was edited by Efrat Morin and reviewed by Jessica Lundquist and one anonymous referee.
Addor, N., Newman, A. J., Mizukami, N., and Clark, M. P.: The CAMELS data set: catchment attributes and meteorology for large-sample studies, Hydrol. Earth Syst. Sci, 21, 5293–5313, https://doi.org/10.5194/hess-21-5293-2017, 2017.
Barnett, T. P., Adam, J. C., and Lettenmaier, D. P.: Potential impacts of a warming climate on water availability in snow-dominated regions, Nature, 438, 303–309, https://doi.org/10.1038/nature04141, 2005.
Barnhart, T. B., Molotch, N. P., Livneh, B., Harpold, A. A., Knowles, J. F., and Schneider, D.: Snowmelt rate dictates streamflow, Geophys. Res. Lett., 43, 8006–8016, https://doi.org/10.1002/2016GL069690, 2016.
Baroni, G., Facchi, A., Gandolfi, C., Ortuani, B., Horeschi, D., and van Dam, J. C.: Uncertainty in the determination of soil hydraulic parameters and its influence on the performance of two hydrological models of different complexity, Hydrol. Earth Syst. Sci., 14, 251–270, https://doi.org/10.5194/hess-14-251-2010, 2010.
Berghuijs, W. R., Woods, R. A., and Hrachowitz, M.: A precipitation shift from snow towards rain leads to a decrease in streamflow, Nat. Clim. Change, 4, 583–586, https://doi.org/10.1038/nclimate2246, 2014.
Blois, J. L., Williams, J. W., Fitzpatrick, M. C., Jackson, S. T., and Ferrier, S.: Space can substitute for time in predicting climate-change effects on biodiversity, P. Natl. Acad. Sci. USA, 110, 9374–9379, https://doi.org/10.1073/pnas.1220228110, 2013.
Blöschl, G., Bierkens, M. F. P., Chambel, A., Cudennec, C., Destouni, G., Fiori, A., Kirchner, J. W., McDonnell, J. J., Savenije, H. H. G., Sivapalan, M., Stumpp, C., Toth, E., Volpi, E., Carr, G., Lupton, C., Salinas, J., Széles, B., Viglione, A., Aksoy, H., Allen, S. T., Amin, A., Andréassian, V., Arheimer, B., Aryal, S. K., Baker, V., Bardsley, E., Barendrecht, M. H., Bartosova, A., Batelaan, O., Berghuijs, W. R., Beven, K., Blume, T., Bogaard, T., Borges de Amorim, P., Böttcher, M. E., Boulet, G., Breinl, K., Brilly, M., Brocca, L., Buytaert, W., Castellarin, A., Castelletti, A., Chen, X., Chen, Y., Chen, Y., Chifflard, P., Claps, P., Clark, M. P., Collins, A. L., Croke, B., Dathe, A., David, P. C., de Barros, F. P. J., de Rooij, G., Di Baldassarre, G., Driscoll, J. M., Duethmann, D., Dwivedi, R., Eris, E., Farmer, W. H., Feiccabrino, J., Ferguson, G., Ferrari, E., Ferraris, S., Fersch, B., Finger, D., Foglia, L., Fowler, K., Gartsman, B., Gascoin, S., Gaume, E., Gelfan, A., Geris, J., Gharari, S., Gleeson, T., Glendell, M., Gonzalez Bevacqua, A., González-Dugo, M. P., Grimaldi, S., Gupta, A. B., Guse, B., Han, D., Hannah, D., Harpold, A., Haun, S., Heal, K., Helfricht, K., Herrnegger, M., Hipsey, M., Hlaváčiková, H., Hohmann, C., Holko, L., Hopkinson, C., Hrachowitz, M., Illangasekare, T. H., Inam, A., Innocente, C., Istanbulluoglu, E., Jarihani, B., Kalantari, Z., Kalvans, A., Khanal, S., Khatami, S., Kiesel, J., Kirkby, M., Knoben, W., Kochanek, K., Kohnová, S., Kolechkina, A., Krause, S., Kreamer, D., Kreibich, H., Kunstmann, H., Lange, H., Liberato, M. L. R., Lindquist, E., Link, T., Liu, J., Loucks, D. P., Luce, C., Mahé, G., Makarieva, O., Malard, J., Mashtayeva, S., Maskey, S., Mas-Pla, J., Mavrova-Guirguinova, M., Mazzoleni, M., Mernild, S., Dudley Misstear, B., Montanari, A., Müller-Thomy, H., Nabizadeh, A., Nardi, F., Neale, C., Nesterova, N., Nurtaev, B., Odongo, V. O., Panda, S., Pande, S., Pang, Z., Papacharalampous, G., Perrin, C., Pfister, L., Pimentel, R., Polo, M. J., Post, D., Prieto Sierra, C., Ramos, M.-H., Renner, M., Reynolds, J. E., Ridolfi, E., Rigon, R., Riva, M., Robertson, D. E., Rosso, R., Roy, T., Sá, J. H. M., Salvadori, G., Sandells, M., Schaefli, B., Schumann, A., Scolobig, A., Seibert, J., Servat, E., Shafiei, M., Sharma, A., Sidibe, M., Sidle, R. C., Skaugen, T., Smith, H., Spiessl, S. M., Stein, L., Steinsland, I., Strasser, U., Su, B., Szolgay, J., Tarboton, D., Tauro, F., Thirel, G., Tian, F., Tong, R., Tussupova, K., Tyralis, H., Uijlenhoet, R., van Beek, R., van der Ent, R. J., van der Ploeg, M., Van Loon, A. F., van Meerveld, I., van Nooijen, R., van Oel, P. R., Vidal, J.-P., von Freyberg, J., Vorogushyn, S., Wachniew, P., Wade, A. J., Ward, P., Westerberg, I. K., White, C., Wood, E. F., Woods, R., Xu, Z., Yilmaz, K. K., and Zhang, Y.: Twenty-three unsolved problems in hydrology (UPH) – a community perspective, Hydrolog. Sci. J., 64, 1141–1158, https://doi.org/10.1080/02626667.2019.1620507, 2019.
Bowling, D. R., Logan, B. A., Hufkens, K., Aubrecht, D. M., Richardson, A. D., Burns, S. P., Anderegg, W. R. L., Blanken, P. D., and Eiriksson, D. P.: Limitations to winter and spring photosynthesis of a Rocky Mountain subalpine forest, Agr. Forest Meteorol., 252, 241–255, https://doi.org/10.1016/j.agrformet.2018.01.025, 2018.
Brooks, P. D., Chorover, J., Fan, Y., Godsey, S. E., Maxwell, R. M., McNamara, J. P., and Tague, C.: Hydrological partitioning in the critical zone: Recent advances and opportunities for developing transferable understanding of water cycle dynamics, Water Resour. Res., 51, 6973–6987, https://doi.org/10.1002/2015WR017039, 2015.
Broxton, P. D., Harpold, A. A., Biederman, J. A., Troch, P. A., Molotch, N. P., and Brooks, P. D.: Quantifying the effects of vegetation structure on snow accumulation and ablation in mixed-conifer forests, Ecohydrology, 8(, 1073–1094, https://doi.org/10.1002/eco.1565, 2015.
Christiaens, K. and Feyen, J.: Analysis of uncertainties associated with different methods to determine soil hydraulic properties and their propagation in the distributed hydrological MIKE SHE model, J. Hydrol., 246, 63–81, https://doi.org/10.1016/S0022-1694(01)00345-6, 2001.
Cline, D. W.: Snow surface energy exchanges and snowmelt at a continental, midlatitude Alpine site, Water Resour. Res., 33, 689–701, https://doi.org/10.1029/97WR00026, 1997.
Clow, D. W.: Changes in the timing of snowmelt and streamflow in Colorado: A response to recent warming, J. Climate, 23, 2293–2306, https://doi.org/10.1175/2009JCLI2951.1, 2010.
Cooper, A. E., Kirchner, J. W., Wolf, S., Lombardozzi, D. L., Sullivan, B. W., Tyler, S. W., and Harpold, A. A.: Snowmelt causes different limitations on transpiration in a Sierra Nevada conifer forest, Agr. Forest Meteorol., 291, 108089, https://doi.org/10.1016/j.agrformet.2020.108089, 2020.
Fan, Y., Clark, M., Lawrence, D. M., Swenson, S., Band, L. E., Brantley, S. L., Brooks, P. D., Dietrich, W. E., Flores, A., Grant, G., Kirchner, J. W., Mackay, D. S., McDonnell, J. J., Milly, P. C. D., Sullivan, P. L., Tague, C., Ajami, H., Chaney, N., Hartmann, A., Hazenberg, P., McNamara, Pelletier, J., Perket, J., Rouholahnejad-Freund, E., Wagener, T., Zeng, X., Beighley, E., Buzan, J., Huang, M., Livneh, B., Mohanty, B. P., Nijssen, B., Safeeq, M., Shen, C., Verseveld, W., Volk, J., and Yamazaki, D.: Hillslope Hydrology in Global Change Research and Earth System Modeling, Water Resour. Res., 55, 1737–1772, https://doi.org/10.1029/2018WR023903, 2019.
Foster, L., Bearup, L., Molotch, N., Brooks, P., and Maxwell, R.: Energy budget increases reduce mean streamflow more than snow–rain transitions: using integrated modeling to isolate climate change impacts on Rocky Mountain hydrology, Environ. Res. Lett., 11, 044015, https://doi.org/10.1088/1748-9326/11/4/044015, 2016.
Gochis, D. J., Barlage, M., Cabell, R., Casali, M., Dugger, A., FitzGerald, K., McAllister, M., McCreight, J., RafieeiNasab, A., Read, L., Sampson, K., Yates, D., and Zhang, Y.: The WRF-Hydro modeling system technical description, (Version 5.1.1), https://ral.ucar.edu/sites/default/files/public/projects/wrf_hydro/technical-description-user-guide/wrf-hydro-v5.1.1-technical-description.pdf (last access: 20 June 2022), 2020.
Godsey, S. E., Aas, W., Clair, T. A., de Wit, H. A., Fernandez, I. J., Kahl, J. S., Malcolm, I. A., Neal, C., Neal, M., Nelson, S. J., Norton, S. A., Palucis, M. C., Skjelkvåle, B. L., Soulsby, C., Tetzlaff, D., and Kirchner, J. W.: Generality of fractal 1/f scaling in catchment tracer time series, and its implications for catchment travel time distributions, Hydrol. Process., 24, 1660–1671, https://doi.org/10.1002/hyp.7677, 2010.
Gordon, B. L., Brooks, P. D., Krogh, S. A., Boisrame, G. F. S., Carroll, R. W. H., McNamara, J. P., and Harpold, A. A.: Why does snowmelt-driven streamflow response to warming vary? A data-driven review and predictive framework, Environ. Res. Lett., 111, 1–20, https://doi.org/10.1088/1748-9326/ac64b4, 2022.
Goulden, M. L. and Bales, R. C.: Mountain runoff vulnerability to increased evapotranspiration with vegetation expansion, P. Natl. Acad. Sci. USA, 111, 14071–14075, https://doi.org/10.1073/pnas.1319316111, 2014.
Harpold, A., Brooks, P., Rajagopal, S., Heidbuchel, I., Jardine, A., and Stielstra, C.: Changes in snowpack accumulation and ablation in the intermountain west, Water Resour. Res., 48, W11501, https://doi.org/10.1029/2012WR011949, 2012.
Harpold, A. A. and Brooks, P. D.: Humidity determines snowpack ablation under a warming climate, P. Natl. Acad. Sci. USA, 115, 1215–1220, https://doi.org/10.1073/pnas.1716789115, 2018.
Harpold, A. A., Rajagopal, S., Crews, J. B., Winchell, T., and Schumer, R.: Relative Humidity Has Uneven Effects on Shifts From Snow to Rain Over the Western U.S., Geophys. Res. Lett., 44, 9742–9750, https://doi.org/10.1002/2017GL075046, 2017.
He, C., Chen, F., Barlage, M., Liu, C., Newman, A., Tang, W., Ikeda, K., and Rasmussen, R.: Can Convection-Permitting Modeling Provide Decent Precipitation for Offline High-Resolution Snowpack Simulations Over Mountains?, J. Geophys. Res.-Atmos., 124, 12631–12654, https://doi.org/10.1029/2019JD030823, 2019.
Hidalgo, H. G., Das, T., Dettinger, M. D., Cayan, D. R., Pierce, D. W., Barnett, T. P., Bala, G., Mirin, A., Wood, A. W., Bonfils, C., Santer, B. D., and Nozawa, T.: Detection and Attribution of Streamflow Timing Changes to Climate Change in the Western United States, J. Climate, 22, 3838–3855, https://doi.org/10.1175/2009JCLI2470.1, 2009.
Houze, R. A.: Orographic effects on precipitating clouds, Rev. Geophys., 50, RG1001, https://doi.org/10.1029/2011RG000365, 2012.
Immerzeel, W. W., Lutz, A. F., Andrade, M., Bahl, A., Biemans, H., Bolch, T., Hyde, S., Brumby, S., Davies, B. J., Elmore, A. C., Emmer, A., Feng, M., Fernández, A., Haritashya, U., Kargel, J. S., Koppes, M., Kraaijenbrink, P. D. A., Kulkarni, A. V., Mayewski, P. A., Nepal, S., Pacheco, P., Painter, T. H., Pellicciotti, F., Rajaram, H., Rupper, S., Sinisalo, A., Shrestha, A. B., Viviroli, D., Wada, Y., Xiao, C., Yao, T., and Baillie, J. E. M.: Importance and vulnerability of the world's water towers, Nature, 577, 364–369, https://doi.org/10.1038/s41586-019-1822-y, 2020.
Jasechko, S., Kirchner, J. W., Welker, J. M., and McDonnell, J. J.: Substantial proportion of global streamflow less than three months old, Nat. Geosci., 9, 126–129, https://doi.org/10.1038/ngeo2636, 2016.
Jennings, K. S., Winchell, T. S., Livneh, B., and Molotch, N. P.: Spatial variation of the rain–snow temperature threshold across the Northern Hemisphere, Nat. Commun., 9, 1148, https://doi.org/10.1038/s41467-018-03629-7, 2018.
Jepsen, S. M., Molotch, N. P., Williams, M. W., Rittger, K. E., and Sickman, J. O.: Interannual variability of snowmelt in the Sierra Nevada and Rocky Mountains, United States: Examples from two alpine watersheds, Water Resour. Res., 48, 1–15, https://doi.org/10.1029/2011WR011006, 2012.
Jepsen, S. M., Harmon, T. C., Ficklin, D. L., Molotch, N. P., and Guan, B.: Evapotranspiration sensitivity to air temperature across a snow-influenced watershed: Space-for-time substitution versus integrated watershed modeling, J. Hydrol., 556, 645–659, https://doi.org/10.1016/j.jhydrol.2017.11.042, 2018.
Kirchner, J. W.: A double paradox in catchment hydrology and geochemistry, Hydrol. Process., 17, 871–874, https://doi.org/10.1002/hyp.5108, 2003.
Kirchner, J. W.: Getting the right answers for the right reasons: Linking measurements, analyses, and models to advance the science of hydrology, Water Resour. Res., 42, 1–5, https://doi.org/10.1029/2005WR004362, 2006.
Kirchner, J. W., Godsey, S. E., Solomon, M., Osterhuber, R., McConnell, J. R., and Penna, D.: The pulse of a montane ecosystem: coupling between daily cycles in solar flux, snowmelt, transpiration, groundwater, and streamflow at Sagehen Creek and Independence Creek, Sierra Nevada, USA, Hydrol. Earth Syst. Sci., 24, 5095–5123, https://doi.org/10.5194/hess-24-5095-2020, 2020.
Klesse, S., DeRose, R. J., Babst, F., Black, B. A., Anderegg, L. D. L., Axelson, J., Ettinger, A., Griesbauer, H., Guiterman, C. H., Harley, G., Harvey, J. E., Lo, Y., Lynch, A. M., O'Connor, C., Restaino, C., Sauchyn, D., Shaw, J. D., Smith, D. J., Wood, L., Villanueva-Díaz, J., and Evans, M. E. K.: Continental-scale tree-ring-based projection of Douglas-fir growth: Testing the limits of space-for-time substitution, Global Change Biol., 26, 5146–5163, https://doi.org/10.1111/gcb.15170, 2020.
Klos, P. Z., Link, T. E., and Abatzoglou, J. T.: Extent of the rain-snow transition zone in the western U.S. under historic and projected climate, Geophys. Res. Lett., 41, 4560–4568, https://doi.org/10.1002/2014GL060500, 2014.
Kopp, S., Cline, D., Miniat, C., Lucero, C., Rothlisberger, J., Levinson, D., Evett, S., Brusberg, M., Lowenfish, M., Strobel, M., Tschirhart, W., Rindahl, B., Holder, S., and Ables, M.: Perspectives on the National Water Model, Water Resour. Impact, 20, 10–11, 2018.
Krogh, S. A., Broxton, P. D., Manley, P. N., and Harpold, A. A.: Using Process Based Snow Modeling and Lidar to Predict the Effects of Forest Thinning on the Northern Sierra Nevada Snowpack, Front. Forest Global Change, 3, 21, https://doi.org/10.3389/ffgc.2020.00021, 2020.
Leroux, N. R. and Pomeroy, J. W.: Modelling capillary hysteresis effects on preferential flow through melting and cold layered snowpacks, Adv. Water Resour., 107, 250–264, https://doi.org/10.1016/j.advwatres.2017.06.024, 2017.
Liu, C., Ikeda, K., Rasmussen, R., Barlage, M., Newman, A. J. A. J. A. J. A. J., Prein, A. F. A. F., Chen, F., Chen, L., Clark, M., Dai, A., Dudhia, J., Eidhammer, T., Gochis, D., Gutmann, E., Kurkute, S., Li, Y., Thompson, G., and Yates, D.: Continental-scale convection-permitting modeling of the current and future climate of North America, Clim. Dynam., 49, 71–95, https://doi.org/10.1007/s00382-016-3327-9, 2017.
Loheide, S. P. and Lundquist, J. D.: Snowmelt-induced diel fluxes through the hyporheic zone, Water Resour. Res., 45, 1–9, https://doi.org/10.1029/2008WR007329, 2009.
Lundquist, J. D. and Cayan, D. R.: Seasonal and Spatial Patterns in Diurnal Cycles in Streamflow in the Western United States, J. Hydrometeorol., 3, 591–603, https://doi.org/10.1175/1525-7541(2002)003<0591:SASPID>2.0.CO;2, 2002.
Lundquist, J. D. and Dettinger, M. D.: How snowpack heterogeneity affects diurnal streamflow timing, Water Resour. Res., 41, 1–14, https://doi.org/10.1029/2004WR003649, 2005.
Lundquist, J. D., Cayan, D. R., and Dettinger, M. D.: Spring Onset in the Sierra Nevada: When Is Snowmelt Independent of Elevation?, J. Hydrometeorol., 5, 327–342, https://doi.org/10.1175/1525-7541(2004)005<0327:SOITSN>2.0.CO;2, 2004.
Lundquist, J. D., Dickerson-Lange, S. E., Lutz, J. A., and Cristea, N. C.: Lower forest density enhances snow retention in regions with warmer winters: A global framework developed from plot-scale observations and modeling, Water Resour. Res., 49, 6356–6370, https://doi.org/10.1002/wrcr.20504, 2013.
Luo, L., Robock, A., Mitchell, K. E., Houser, P. R., Wood, E. F., Schaake, J. C., Lohmann, D., Cosgrove, B., Wen, F., Sheffield, J., Duan, Q., Higgins, R. W., Pinker, R. T., and Tarpley, J. D.: Validation of the North American Land Data Assimilation System (NLDAS) retrospective forcing over the southern Great Plains, J. Geophys. Res.-Atmos., 108, 8843, https://doi.org/10.1029/2002JD003246, 2003.
Marks, D. and Dozier, J.: Climate and Energy Exchange at the Snow Surface in the Alpine Region of the Sierra Nevada 2. Snow Cover Energy Balance, Water Resour. Res., 28, 3043–3054, 1992.
McCabe, G. J. and Clark, M. P.: Trends and Variability in Snowmelt Runoff in the Western United States, J. Hydrometeorol., 6, 476–482, https://doi.org/10.1175/JHM428.1, 2005.
Meira Neto, A. A., Niu, G., Roy, T., Tyler, S., and Troch, P. A.: Interactions between snow cover and evaporation lead to higher sensitivity of streamflow to temperature, Commun. Earth Environ., 1, 56, https://doi.org/10.1038/s43247-020-00056-9, 2020.
Milly, P. C. D. and Dunne, K. A.: Colorado River flow dwindles as warming-driven loss of reflective snow energizes evaporation, Science, 367, 1252–1255, https://doi.org/10.1126/science.aay9187, 2020.
Mote, P. W., Li, S., Lettenmaier, D. P., Xiao, M., and Engel, R.: Dramatic declines in snowpack in the western US, npj Clim. Atmos. Sci., 1, 2, https://doi.org/10.1038/s41612-018-0012-1, 2018.
Müller, M. D. and Scherer, D.: A Grid- and Subgrid-Scale Radiation Parameterization of Topographic Effects for Mesoscale Weather Forecast Models, Mon. Weather Rev., 133, 1431–1442, https://doi.org/10.1175/MWR2927.1, 2005.
Musselman, K. N., Clark, M. P., Liu, C., Ikeda, K., and Rasmussen, R.: Slower snowmelt in a warmer world, Nat. Clim. Change, 7, 214–219, https://doi.org/10.1038/nclimate3225, 2017.
Musselman, K. N., Lehner, F., Ikeda, K., Clark, M. P., Prein, A. F., Liu, C., Barlage, M., and Rasmussen, R.: Projected increases and shifts in rain-on-snow flood risk over western North America, Nat. Clim. Change, 8, 808–812, https://doi.org/10.1038/s41558-018-0236-4, 2018.
Mutzner, R., Weijs, S. V., Tarolli, P., Calaf, M., Oldroyd, H. J., and Parlange, M. B.: Controls on the diurnal streamflow cycles in two subbasins of an alpine headwater catchment, Water Resour. Res., 51, 3403–3418, https://doi.org/10.1002/2014WR016581, 2015.
Newman, A. J., Clark, M. P., Sampson, K., Wood, A., Hay, L. E., Bock, A., Viger, R. J., Blodgett, D., Brekke, L., Arnold, J. R., Hopson, T., and Duan, Q.: Development of a large-sample watershed-scale hydrometeorological data set for the contiguous USA: data set characteristics and assessment of regional variability in hydrologic model performance, Hydrol. Earth Syst. Sci., 19, 209–223, https://doi.org/10.5194/hess-19-209-2015, 2015.
Niu, G. Y., Yang, Z. L., Mitchell, K. E., Chen, F., Ek, M. B., Barlage, M., Kumar, A., Manning, K., Niyogi, D., Rosero, E., Tewari, M., and Xia, Y.: The community Noah land surface model with multiparameterization options (Noah-MP): 1. Model description and evaluation with local-scale measurements, J. Geophys. Res., 116, 1–19, https://doi.org/10.1029/2010JD015139, 2011.
Ohmura, A.: Physical Basis for the Temperature-Based Melt-Index Method, J. Appl. Meteorol., 40, 753–761, https://doi.org/10.1175/1520-0450(2001)040<0753:PBFTTB>2.0.CO;2, 2001.
Pelletier, J. D., Broxton, P. D., Hazenberg, P., Zeng, X., Troch, P. A., Niu, G., Williams, Z., Brunke, M. A, and Gochis, D.: A gridded global data set of soil, intact regolith, and sedimentary deposit thicknesses for regional and global land surface modeling, J. Adv. Model. Earth Syst., 8, 41–65, https://doi.org/10.1002/2015MS000526, 2016.
Pomeroy, J. W., Parviainen, J., Hedstrom, N., and Gray, D. M.: Coupled modelling of forest snow interception and sublimation, Hydrol. Process., 12, 2317–2337, https://doi.org/10.1002/(SICI)1099-1085(199812)12:15<2317::AID-HYP799>3.0.CO;2-X, 1998.
Rasmussen, R., Dai, A., Liu, C., and Ikeda, K.: CONUS (Continental U.S.) II High Resolution Present and Future Climate Simulation, Research Data Archive at the National Center for Atmospheric Research, Computational and Information Systems Laboratory [data set], https://doi.org/10.5065/49SN-8E08, 2021.
Regonda, S. K., Rajagopalan, B., Clark, M., and Pitlick, J.: Seasonal Cycle Shifts in Hydroclimatology over the Western United States, J. Climate, 18, 372–384, https://doi.org/10.1175/JCLI-3272.1, 2005.
Safa, H., Krogh, S. A., Greenberg, J., Kostadinov, T. S., and Harpold, A. A.: Unraveling the Controls on Snow Disappearance in Montane Conifer Forests Using Multi-Site Lidar, Water Resour. Res., 57, 1–20, https://doi.org/10.1029/2020WR027522, 2021.
Safeeq, M., Grant, G. E., Lewis, S. L., and Tague, C. L.: Coupling snowpack and groundwater dynamics to interpret historical streamflow trends in the western United States, Hydrol. Process., 27, 655–668, https://doi.org/10.1002/hyp.9628, 2013.
Scaff, L., Prein, A. F., Li, Y., Liu, C., Rasmussen, R., and Ikeda, K.: Simulating the convective precipitation diurnal cycle in North America's current and future climate, Clim. Dynam., 55, 369–382, https://doi.org/10.1007/s00382-019-04754-9, 2020.
Serreze, M. C., Clark, M. P., Armstrong, R. L., McGinnis, D. A., and Pulwarty, R. S.: Characteristics of the western United States snowpack from snowpack telemetry (SNOTEL) data, Water Resour. Res., 35, 2145–2160, https://doi.org/10.1029/1999WR900090, 1999.
Sivapalan, M., Yaeger, M. A., Harman, C. J., Xu, X., and Troch, P. A.: Functional model of water balance variability at the catchment scale: 1. Evidence of hydrologic similarity and space-time symmetry, Water Resour. Res., 47, 1–18, https://doi.org/10.1029/2010WR009568, 2011.
Skamarock, W. C., Klemp, J. B., Dudhi, J., Gill, D. O., Barker, D. M., Duda, M. G., Huang, X.-Y., Wang, W., and Powers, J. G.: A Description of the Advanced Research WRF Version 3, NCAR/UCAR, Boulder, Colorado, USA, https://doi.org/10.5065/D68S4MVH, 2008.
Stewart, I. T., Cayan, D. R., and Dettinger, M. D.: Changes in Snowmelt Runoff Timing in Western North America under a `Business as Usual' Climate Change Scenario, Climatic Change, 62, 217–232, https://doi.org/10.1023/B:CLIM.0000013702.22656.e8, 2004.
Stewart, I. T., Cayan, D. R., and Dettinger, M. D.: Changes toward Earlier Streamflow Timing across Western North America, J. Climate, 18, 1136–1155, https://doi.org/10.1175/JCLI3321.1, 2005.
Sturm, M., Goldstein, M. A., and Parr, C.: Water and life from snow: A trillion dollar science question, Water Resour. Res., 53, 3534–3544, https://doi.org/10.1002/2017WR020840, 2017.
Sumargo, E. and Cayan, D. R.: The Influence of Cloudiness on Hydrologic Fluctuations in the Mountains of the Western United States, Water Resour. Res., 54, 8478–8499, https://doi.org/10.1029/2018WR022687, 2018.
Tague, C. and Grant, G. E.: Groundwater dynamics mediate low-flow response to global warming in snow-dominated alpine regions, Water Resour. Res., 45, 1–12, https://doi.org/10.1029/2008WR007179, 2009.
Urióstegui, S. H., Bibby, R. K., Esser, B. K., and Clark, J. F.: Quantifying annual groundwater recharge and storage in the central Sierra Nevada using naturally occurring 35∘ S, Hydrol. Process., 31, 1382–1397, https://doi.org/10.1002/hyp.11112, 2017.
US Geological Survey: National Water Information System data available on the World Wide Web (USGS Water Data for the Nation), http://waterdata.usgs.gov/nwis/ (last access: 20 June 2022), 2016.
Viviroli, D., Dürr, H. H., Messerli, B., Meybeck, M., and Weingartner, R.: Mountains of the world, water towers for humanity: Typology, mapping, and global significance, Water Resour. Res., 43, 1–13, https://doi.org/10.1029/2006WR005653, 2007.
Viviroli, D., Archer, D. R., Buytaert, W., Fowler, H. J., Greenwood, G. B., Hamlet, A. F., Huang, Y., Koboltschnig, G., Litaor, M. I., López-Moreno, J. I., Lorentz, S., Schädler, B., Schreier, H., Schwaiger, K., Vuille, M., and Woods, R.: Climate change and mountain water resources: overview and recommendations for research, management and policy, Hydrol. Earth Syst. Sci., 15, 471–504, https://doi.org/10.5194/hess-15-471-2011, 2011.
Wayand, N. E., Lundquist, J. D., and Clark, M. P.: Modeling the influence of hypsometry, vegetation, and storm energy on snowmelt contributions to basins during rain-on-snow floods, Water Resour. Res., 51, 8551–8569, https://doi.org/10.1002/2014WR016576, 2015.
Weiler, M., Seibert, J., and Stahl, K.: Magic components-why quantifying rain, snowmelt, and icemelt in river discharge is not easy, Hydrol. Process., 32, 160–166, https://doi.org/10.1002/hyp.11361, 2018.
Wilby, R., Dawson, C., and Barrow, E.: Sdsm – a Decision Support Tool for the Assessment of Regional Climate Change Impacts, Environ. Model. Softw., 17, 145–157, https://doi.org/10.1016/S1364-8152(01)00060-3, 2002.
Winchell, T. S., Barnard, D. M., Monson, R. K., Burns, S. P., and Molotch, N. P.: Earlier snowmelt reduces atmospheric carbon uptake in midlatitude subalpine forests, Geophys. Res. Lett., 43, 8160–8168, https://doi.org/10.1002/2016GL069769, 2016.
Woelber, B., Maneta, M. P., Harper, J., Jencso, K. G., Gardner, W. P., Wilcox, A. C., and López-Moreno, I.: The influence of diurnal snowmelt and transpiration on hillslope throughflow and stream response, Hydrol. Earth Syst. Sci., 22, 4295–4310, https://doi.org/10.5194/hess-22-4295-2018, 2018.
Wood, A. W. and Lettenmaier, D. P.: A Test Bed for New Seasonal Hydrologic Forecasting Approaches in the Western United States, B. Am. Meteorol. Soc., 87, 1699–1712, https://doi.org/10.1175/BAMS-87-12-1699, 2006.
Xia, Y., et al.: NCEP/EMC (2009), NLDAS Primary Forcing Data L4 Hourly 0.125×0.125 degree V002, edited by: Mocko, D., NASA/GSFC/HSL, Greenbelt, Maryland, USA, Goddard Earth Sciences Data and Information Services Center (GES DISC) [data set], https://doi.org/10.5067/6J5LHHOHZHN4, 2009.
Xia, Y., Mitchell, K., Ek, M., Sheffield, J., Cosgrove, B., Wood, E., Luo, L., Alonge, C., Wei, H., Meng, J., Livneh, B., Lettenmaier, D., Koren, V., Duan, Q., Mo, K., Fan, Y., and Mocko, D.: Continental-scale water and energy flux analysis and validation for the North American Land Data Assimilation System project phase 2 (NLDAS-2): 1. Intercomparison and application of model products, J. Geophys. Res.-Atmos., 117, 1–27, https://doi.org/10.1029/2011JD016048, 2012.