the Creative Commons Attribution 4.0 License.
the Creative Commons Attribution 4.0 License.
 | 15 Jun 2022
The influence of vegetation water dynamics on the ASCAT backscatter–incidence angle relationship in the Amazon
Ashwini Petchiappan
Susan C. Steele-Dunne
Mariette Vreugdenhil
Sebastian Hahn
Wolfgang Wagner
Rafael Oliveira
Microwave observations are sensitive to plant water content and could therefore provide essential information on biomass and plant water status in ecological and agricultural applications. The combined data record of the C-band scatterometers on the European Remote-Sensing Satellites (ERS)-, the Metop (Meteorological Operational satellite) series, and the planned Metop Second Generation satellites will span over 40 years, which would provide a long-term perspective on the role of vegetation in the climate system. Recent research has indicated that the unique viewing geometry of the Advanced SCATterometer (ASCAT) could be exploited to observe vegetation water dynamics. The incidence angle dependence of backscatter can be described with a second order polynomial, the slope and curvature of which are related to vegetation. In a study limited to grasslands, seasonal cycles, spatial patterns, and interannual variability in the slope and curvature were found to vary among grassland types and were attributed to differences in moisture availability, growing season length and phenological changes. To exploit ASCAT slope and curvature for global vegetation monitoring, their dynamics over a wider range of vegetation types needs to be quantified and explained in terms of vegetation water dynamics. Here, we compare ASCAT data with meteorological data and GRACE equivalent water thickness (EWT) to explain the dynamics of ASCAT backscatter, slope, and curvature in terms of moisture availability and demand. We consider differences in the seasonal cycle, diurnal differences, and the response to the 2010 and 2015 droughts across ecoregions in the Amazon basin and surroundings. Results show that spatial and temporal patterns in backscatter reflect moisture availability indicated by GRACE EWT. Slope and curvature dynamics vary considerably among the ecoregions. The evergreen forests, often used as a calibration target, exhibit very stable behavior, even under drought conditions. The limited seasonal variation follows changes in the radiation cycle and may indicate phenological changes such as litterfall. In contrast, the diversity of land cover types within the Cerrado region results in considerable heterogeneity in terms of the seasonal cycle and the influence of drought on both slope and curvature. Seasonal flooding in forest and savanna areas also produced a distinctive signature in terms of the backscatter as a function of incidence angle. This improved understanding of the incidence angle behavior of backscatter increases our ability to interpret and make optimal use of the ASCAT data record and vegetation optical depth products for vegetation monitoring.
- Article
(20443 KB) - Full-text XML
-
Supplement
(684 KB) - BibTeX
- EndNote


Microwave remote sensing observations are sensitive to plant water content, which depends on aboveground biomass and plant water status (Konings et al., 2019; Owe et al., 2001; Jackson et al., 1982). Data from active and passive microwave sensors can provide valuable information about vegetation in a range of applications in ecological and agricultural monitoring (Konings et al., 2019; Chaparro et al., 2019; Rao et al., 2019; Steele-Dunne et al., 2017; Tian et al., 2016; Andela et al., 2013; Saatchi et al., 2013; Liu et al., 2013; McNairn et al., 2000; Wagner et al., 1999). In particular, vegetation optical depth (VOD) products derived from various passive and active microwave sensors are increasingly used for biomass monitoring (Liu et al., 2015), drought monitoring (Liu et al., 2018), and wildfire risk assessment (Forkel et al., 2019) and have been related to gross primary production (Teubner et al., 2018, 2019), carbon stocks (Chaparro et al., 2019), and drought-driven tree mortality (Rao et al., 2019). Currently, VOD datasets are available from single sensor passive microwave observations, such as SMAP (Soil Moisture Active Passive; Konings et al., 2016), SMOS (Soil Moisture and Ocean Salinity; Fernandez-Moran et al., 2017), and AMSR2 (Advanced Microwave Scanning Radiometer 2; Owe et al., 2001; De Jeu, 2003) and active microwave observations such as ASCAT (Advanced SCATterometer; Vreugdenhil et al., 2016). Furthermore, long-term data records are available that combine VOD from different sensors (Moesinger et al., 2020; Liu et al., 2011).
The current study is motivated by the availability of consistent C-band data from 1991 to at least 2030, and its potential value as a long-term data record for vegetation monitoring. ASCAT is a real aperture radar operating at 5.255 GHz with co-polarization (VV). There are currently three ASCAT instruments in orbit on Metop (Meteorological Operational satellite)-A, Metop-B, and Metop-C, launched in October 2006, September 2012, and November 2018, respectively. ASCAT builds on the success of the European Scatterometer (ESCAT) which flew on the European Remote-Sensing Satellites (ERS)- satellites from 1991–2011 (Attema, 1991; Figa-Saldaña et al., 2002; Wagner et al., 2013). Continuation of the ESCAT/ASCAT record is ensured by the plans to launch SCA (Scatterometer) on Metop-SG (Second Generation) in 2024 (Stoffelen et al., 2017). Using data from a single series of satellites with identical and intercalibrated instruments circumvents many of the challenges of reconciling data using different frequencies, viewing geometries, and orbit characteristics. The continuity from ERS to Metop and Metop-SG ensures an internally consistent data product for at least 40 years, rendering it ideal to study the role of vegetation in the climate system.
Many early studies demonstrated the sensitivity of ESCAT and ASCAT backscatter to vegetation and explored the potential value of these data for vegetation monitoring (Wismann et al., 1995; Frison et al., 1998; Woodhouse et al., 1999; Jarlan et al., 2002; Steele-Dunne et al., 2012; Schroeder et al., 2016). These studies focused on spatial and temporal variations in backscatter normalized to some reference angle. Here, the focus is on the potential information content of the incidence angle behavior of backscatter and particularly the so-called dynamic vegetation parameters describing the incidence angle behavior of backscatter as calculated in the TU Wien Soil Moisture Retrieval (TUW SMR) algorithm (Hahn et al., 2017).
The ASCAT Dynamic Vegetation Parameters refer to the parameters of the second-order Taylor polynomial used to describe the incidence angle (θ) dependence of backscatter σo. This is described as follows:
where σo(θr), σ′(θr), and σ′′(θr) are the normalized backscatter, slope, and curvature at some reference angle θr. In the TUW SMR algorithm, this expression is used to normalize backscatter values from different incidence angles to a reference angle θr. It is also used to account for the influence of vegetation on backscatter, as the incidence angle behavior of σo depends on whether total backscatter is dominated by surface scattering from the soil, volume scattering from the vegetation, or multiple scattering (Wagner et al., 1999; Naeimi et al., 2009; Hahn et al., 2017). In other words, slope and curvature are calculated and used to account for the influence of vegetation in the soil moisture retrieval. An increase in soil moisture results in an increase in backscatter at all incidence angles, while a change in the vegetation (due to growth cycle or water status) changes the sensitivity of backscatter to incidence angle, i.e., it results in a change in slope and curvature. So, the slope and curvature provide complementary information to the normalized backscatter.
Results from Steele-Dunne et al. (2019) suggest that considering the slope (σ′(θ)) and curvature (σ′′(θ)) dynamics in combination with the backscatter could yield valuable insights into vegetation water dynamics. Seasonal cycles, spatial patterns, and interannual variability in the slope varied between grassland cover type, reflecting variations in soil moisture availability and growing season length. Slope is considered an indication of vegetation density, or aboveground fresh biomass, which is a combination of dry biomass and vegetation water content. Results also suggested that curvature variations were influenced by the total water content but also its vertical distribution within the vegetation and the geometry of constituents. Contiguous anomalies were observed in both slope and curvature during drought periods, suggesting that the slope and curvature provide insight into when the severity of a soil moisture anomaly is enough to impact vegetation. Diurnal variations were also observed and attributed to sub-daily variations in the dominant scattering mechanism due to changes in the vertical moisture distribution of the grasses. More recently, Pfeil et al. (2020) observed a spring peak in slope values around April in broadleaf deciduous forest in Europe. Using leaf area index (LAI) and data from the Pan European Phenology database (PEP725) (Templ et al., 2018), they argued that this spring peak in ASCAT slope coincides with spring activation, particularly the increase in water content of bare twigs and branches prior to leaf out in broadleaf deciduous forests. ASCAT slope and curvature therefore seem to be sensitive to changes in vegetation water content and structure of vegetation.
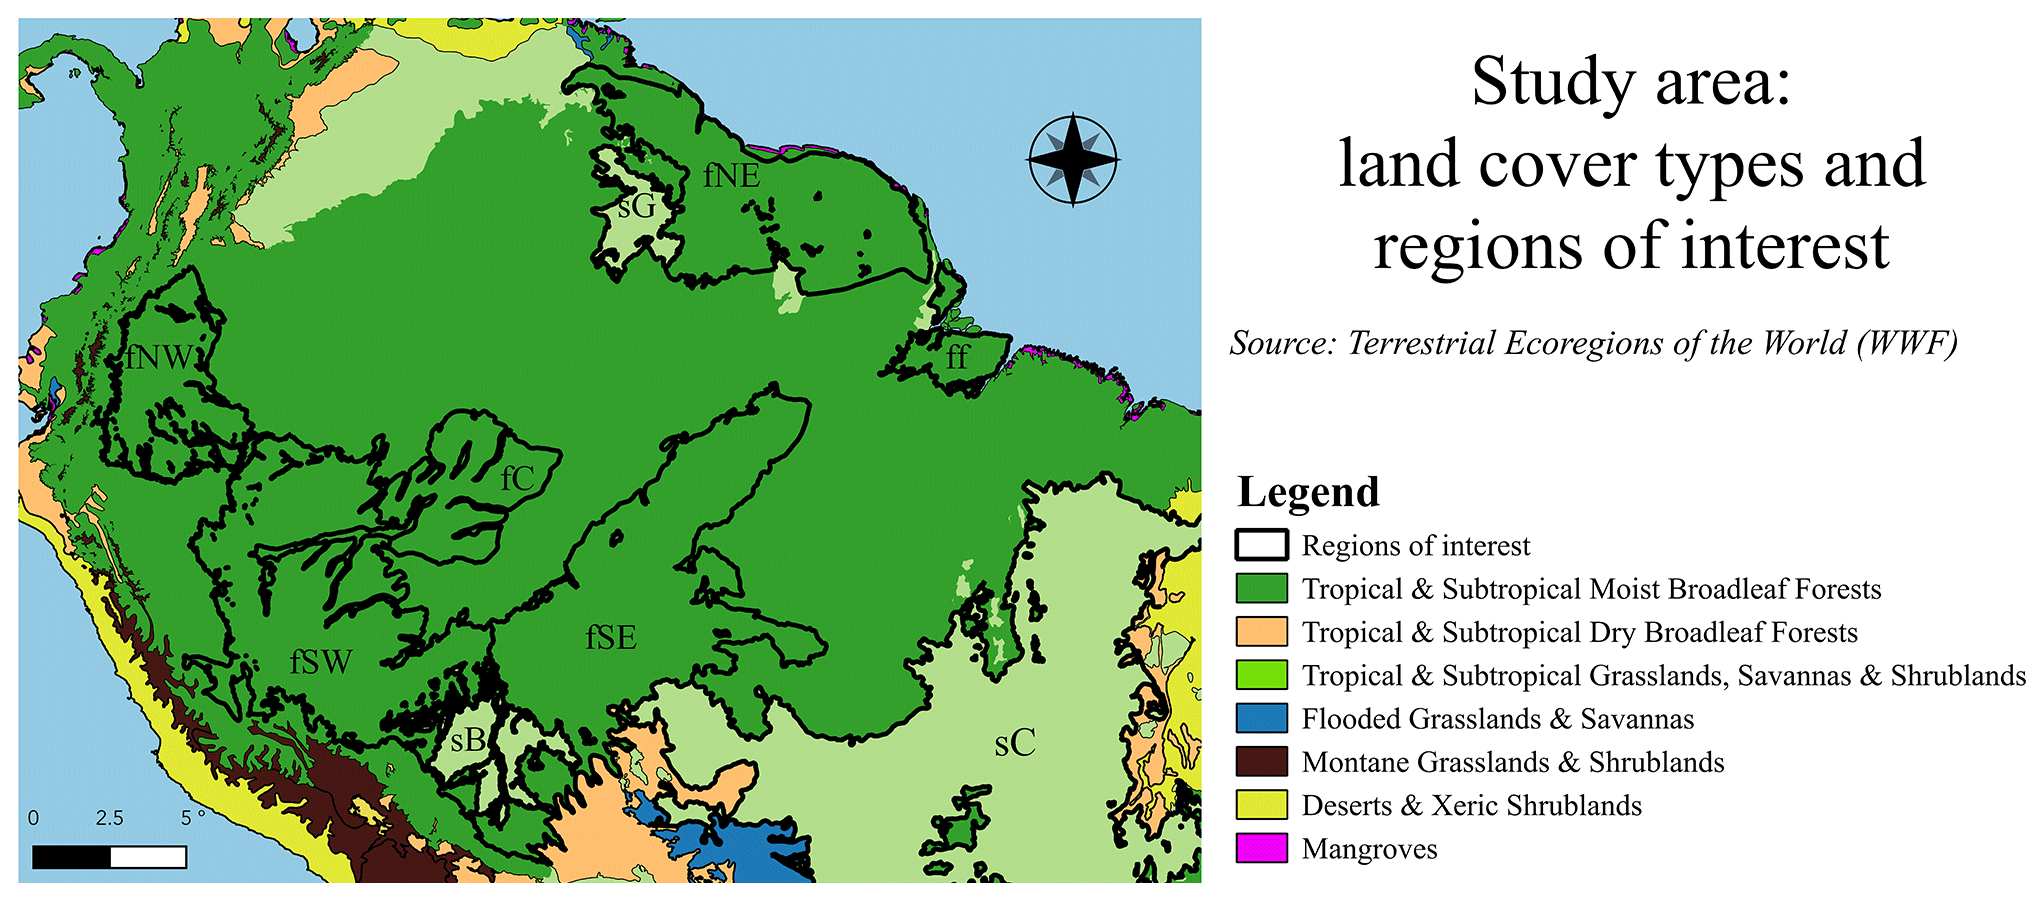
Figure 1Study area. The map is colored by biome, and nine ecoregions of interest are highlighted based on the dataset of Olson et al. (2001). The six forest ecoregions of interest are the Napo moist forests (fNW), Guianan moist forests (fNE), Southwest Amazon moist forests (fSW), Madeira–Tapajós moist forests (fSE), Juruá–Purus moist forests (fC), and the Marajó várzea flooded forests (ff). The three savanna ecoregions of interest are the Cerrado (sC), Guianan savanna (sG), and Beni savanna (sB).
The goal of this study is to improve our understanding of the ASCAT backscatter–incidence angle relationship and how this relationship might be used to monitor vegetation water dynamics. The Amazon basin and its surroundings has been chosen as a study area, as it provides a wide range in terms of expected variability in ASCAT backscatter, slope, and curvature. Backscatter in the evergreen forest was considered to be so stable that this region has been used for satellite radar calibration (Birrer et al., 1982). In contrast, seasonal changes in the Cerrado are expected to yield strong annual cycles in backscatter, slope, and curvature. Seasonal cycles and diurnal differences in ASCAT backscatter, slope, and curvature will be determined for several ecoregions of interest. These will be compared to meteorological data and GRACE terrestrial water storage variations to relate the ASCAT backscatter, slope, and curvature to moisture availability and demand. Finally, we will investigate whether there are anomalies in the ASCAT backscatter, slope, and curvature as a result of the 2010 and 2015 droughts.
2.1 Study area
Figure 1 shows the extent of the study domain, highlights the biomes (by color), and outlines the ecoregions of interest identified in the World Wildlife Fund (WWF) Terrestrial Ecoregions dataset (WWF, 2019) and described by Olson et al. (2001). The study domain extends from 9∘ N and 19∘ S to 44–80∘ W. Most of the study region is covered by the Amazon rainforest, which extends over 5.3 million km2 (Soares et al., 2006). A total of six forest ecoregions are investigated here.
-
The Napo moist forests (fNW), located in northwestern Amazonia, receive some of the highest amounts of annual precipitation in the biome, reaching up to 4000 mm in some parts. This highly biodiverse region has canopies reaching 40 m.
-
The Guianan moist forests (fNE) are one of the largest continuous stretches of relatively pristine lowland tropical rainforest in the world. There are two distinct wet seasons, i.e., from December to January and from May to August. The floral diversity is rich, with multi-tiered vegetation of 40 m tall trees with herbaceous plants below. The dry season (September–November) can see a substantial reduction in leaves, although the forest is evergreen.
-
The Southwest Amazon moist forests (fSW) have significant variations in topography and soil characteristics, leading to extremely high biodiversity. The size and orientation of the ecoregion means that climatic conditions vary markedly, with the north being wetter and having less seasonal variability compared to the south. The inaccessibility of the region has aided in its conservation.
-
The Madeira–Tapajós moist forests (fSE) are transected by the Trans-Amazonian Highway and have high levels of urbanization and deforestation. There are characteristic liana (woody vine) forests with a lower (<25 m) and more open canopy than the typical humid terra firme forests.
-
The Juruá–Purus moist forests (fC) are largely intact forests in the low Amazon Basin. The canopy can reach up to 30 m, with some patches of open canopy.
-
The seasonally flooded forest, Marajó várzea (ff), is located at the mouth of the Amazon River. The vegetation is dominated by palms and shorter than surrounding forests. It has areas with tidal flows from the Atlantic Ocean and seasonally and permanently inundated forests. The annual seasonal flooding occurs during the peak precipitation period between January and May (Camarão et al., 2002).
The following three savanna ecoregions are also considered in this study:
-
The Cerrado (sC) borders the Amazon biome to the southeast. It occupies an area of 2 million km2 in the Brazilian Central Plateau and is the second most extensive biome in South America (Oliveira et al., 2005). The vegetation cover varies from closed tree canopy to grasslands with low shrubs only (Eiten, 1972).
-
The Guianan savanna (sG) consists of forest patches encircled by extensive grasslands and shrub formations. The area is more susceptible to vegetation fires than typical humid moist forest environments, and the dry season lasts from December to March.
-
The Beni savanna (sB) is a wetland region with riverine gallery forests and small forest islands. The landscape is dominated by the palm species Attalea princeps (Hordijk et al., 2019). Seasonal flooding occurs in up to half the region for 4 to 9 months, peaking in March–April (Hamilton et al., 2004).
There are three Köppen–Geiger climate classes (KGCC) that cover most of the study region (Fig. 2). The evergreen forest regions are classified as Af (tropical fully humid) or Am (tropical monsoonal), and the savanna regions have Aw (tropical winter dry) climate (Bradley et al., 2011). The annual precipitation in the forests can exceed 2000–3000 mm, with less than 100 mm rainfall for up to 3 months in the year. The savannas have a wet season extending for 5–8 months, with an annual total of 1000–2000 mm (Bradley et al., 2011). Net radiation peaks in the winter months, due to the absence of cloud cover in the dry season (Liu et al., 2018). In 2010 and 2015, two major droughts occurred in the region during the study period (Jiménez-Muñoz et al., 2016; Marengo et al., 2011) and are of particular interest in this study.
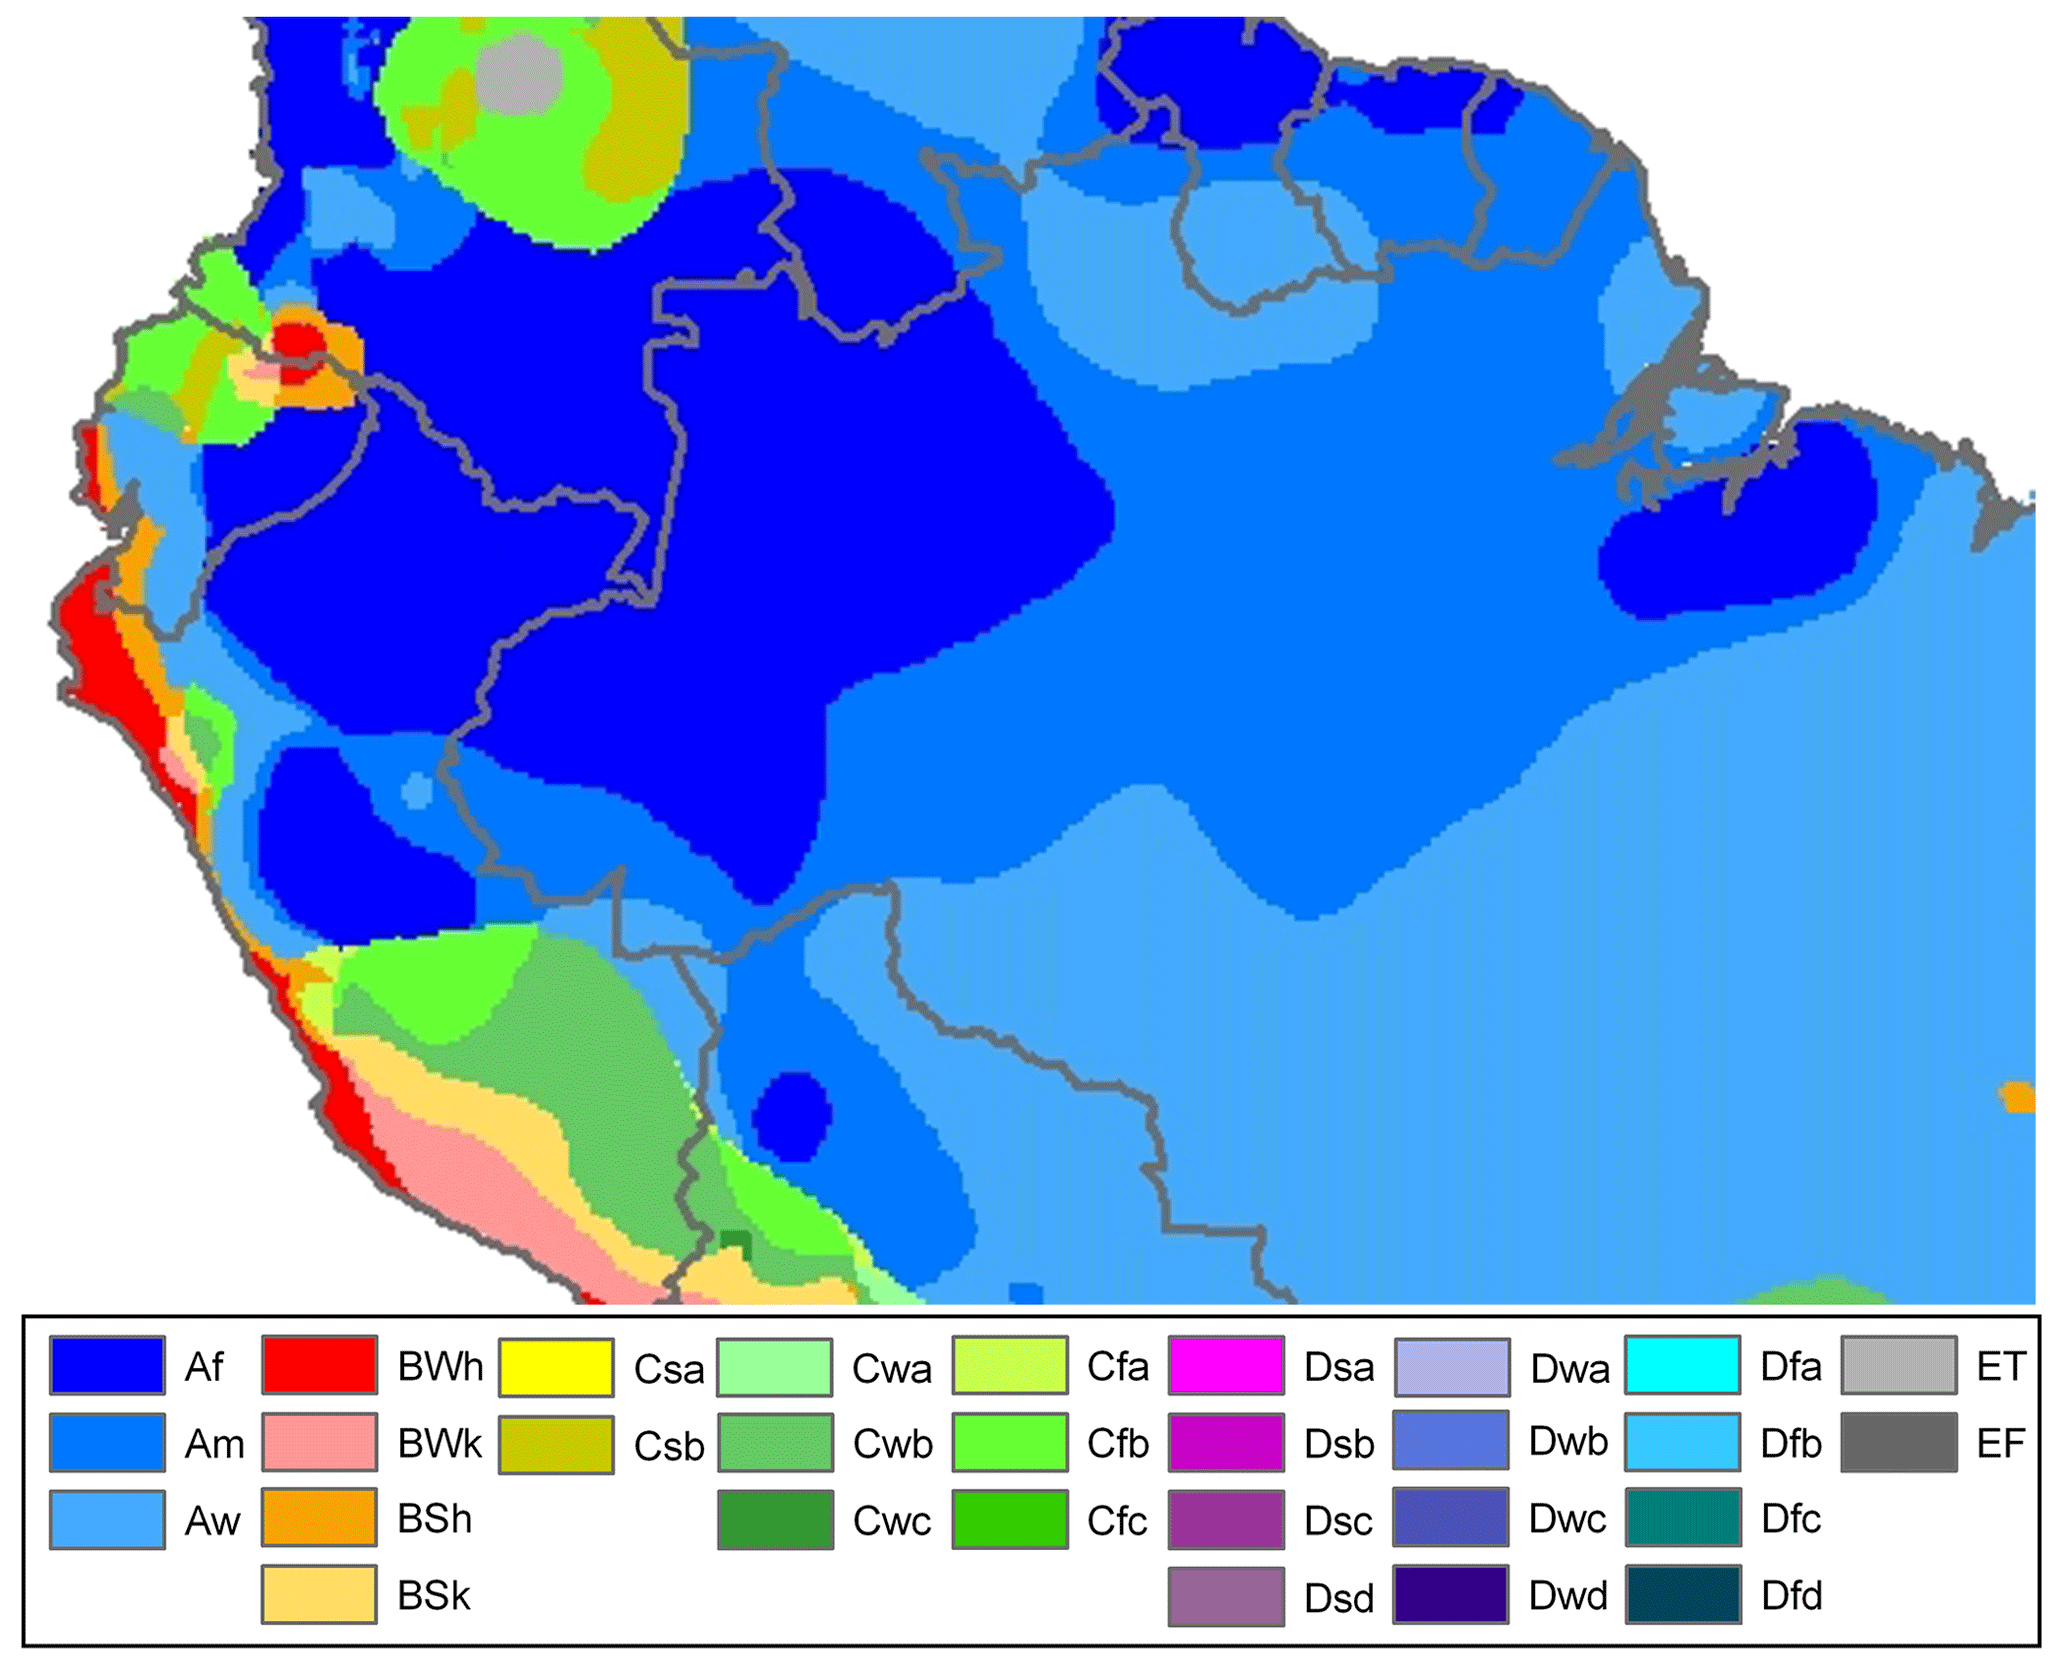
Figure 2Köppen–Geiger climate zones in the study area (source: Peel et al., 2007).
2.2 ASCAT data
The ASCAT data were processed using the same procedure as Steele-Dunne et al. (2019). The Metop-A ASCAT Swath Grid (SZR) Level 1b Fundamental Climate Data Record, resampled at a 12.5 km swath grid, was obtained from the EUMETSAT data center for the period 2007 to 2016. Following the procedure described by Naeimi et al. (2009), the backscatter observations were resampled to a fixed Earth grid using a Hamming window function. The slope and curvature were calculated from the ASCAT backscatter observations using the method introduced by Metzler (2013) and described by Hahn et al. (2017). The ASCAT instrument on board the Metop satellites has three antennas on either side, oriented at 45∘ (fore), 90∘ (mid), and 135∘ (aft) to the satellite track. As a result, three independent measurements of each location on the surface are obtained almost instantaneously. These so-called backscatter triplets (Hahn et al., 2017) are used to calculate an instantaneous backscatter slope, also known as the local slope, as follows:
where mid, a, and f indicate the backscatter measurements from the mid-, aft- and fore beams, respectively. Following the approach of Metzler (2013), an Epanechnikov kernel (with width λ=21) is used to weight the local slope values by their temporal distance from a given day of interest. This yields an estimate of the slope and curvature for a given day, based on all local slope values within a 42 d window. For a more detailed description of their derivation, the reader is referred to Steele-Dunne et al. (2019).
(Anderson et al., 2011) showed a calibration accuracy of Metop ASCAT backscatter of 0.15–0.25 dB. However, radiometric accuracy is expected to be better (i.e., less noisy) over stable, homogeneous targets (e.g., evergreen rainforest). To reduce noise, the backscatter data are averaged in space (over the ecoregions of interest) and/or time (to monthly or dekadal intervals). The number of grid points averaged is provided in Tables S1 and S2 in the Supplement. Data are available every 1–2 d (Wagner et al., 2013). Observations from the descending and ascending overpasses are unlikely to occur on the same day. Hence, the data were aggregated into 10 d intervals (dekads). Unless otherwise indicated, the analysis uses data from the descending pass only (∼ 10:00 LT). Diurnal differences refer to the values from the descending overpass (∼ 10:00 LT) minus the values from the ascending overpass (∼ 22:00 LT).
2.3 Water dynamics data
Downwelling shortwave radiation at the surface and specific humidity were obtained from the Princeton meteorological dataset (Sheffield et al., 2006). These data have a daily resolution. Precipitation data were obtained from the Global Precipitation Climatology Product (GPCP) Precipitation Level 3 Monthly 0.5-Degree V3.0 beta dataset (Huffman et al., 2009). Precipitation, radiation, and humidity are hypothesized to be the main atmospheric forcing for vegetation activity in the Amazon (Nemani et al., 2003). Therefore, these three forcings are compared to slope and curvature. As they are on similar temporal and spatial scales, quantitative comparisons are performed. Data from the Gravity Recovery and Climate Experiment (GRACE) mission were used to provide insight into terrestrial water storage variations (Landerer and Swenson, 2012; Swenson and Wahr, 2006). Here, we used the equivalent water thickness (EWT) from the GRACE Tellus dataset, which is available at monthly resolution from the NASA Jet Propulsion Laboratory (JPL) Physical Oceanography Distributed Active Archive Center (PO DAAC). These data give the relative change in EWT with respect to a baseline, the method of calculation for which is explained by Wahr et al. (1998). These data provide information on fluctuations in EWT on monthly to interannual timescales. Note that EWT includes variations in all terrestrial water storage terms, including groundwater and surface water, in addition to the variables of interest in this paper, namely soil moisture and vegetation. Furthermore, EWT is based on monthly data with a spatial resolution of hundreds of kilometers. Statistical comparisons between the EWT and ASCAT would be strongly influenced by the sensitivity of EWT to ground- and surface water and by artifacts of the difference in spatial and temporal scale between the two products. Therefore, EWT is only qualitatively compared to backscatter, which is affected by soil moisture and vegetation.
Seasonal cycles were determined for precipitation, radiation, humidity, and EWT by averaging data from the entire study duration. Anomalies in precipitation during the drought years were also calculated (as drought year values minus climatology) to provide an indicator of the water stress against which to compare the backscatter, slope, and curvature anomalies.
3.1 Seasonal climatology
Figure 3 shows the mean and range of normalized backscatter (), slope, and curvature for the study period (2007–2016). In general, the spatial patterns in the mean and range of all three quantities reflect the spatial patterns in land cover expected from Fig. 1. It is striking that even the influence of the riverine network on the vegetation cover is discernible in the maps, particularly that of the mean backscatter (Fig. 3a). Striping effects are visible in several of the maps, particularly that of the range in curvature (Fig. 3f). This is due to the backscatter observations at the swath edges being available only at very high or very low incidence angles, which skews the calculation of the slope and curvature. This effect is particularly noticeable in forest regions where the natural dynamic range in both quantities is limited.
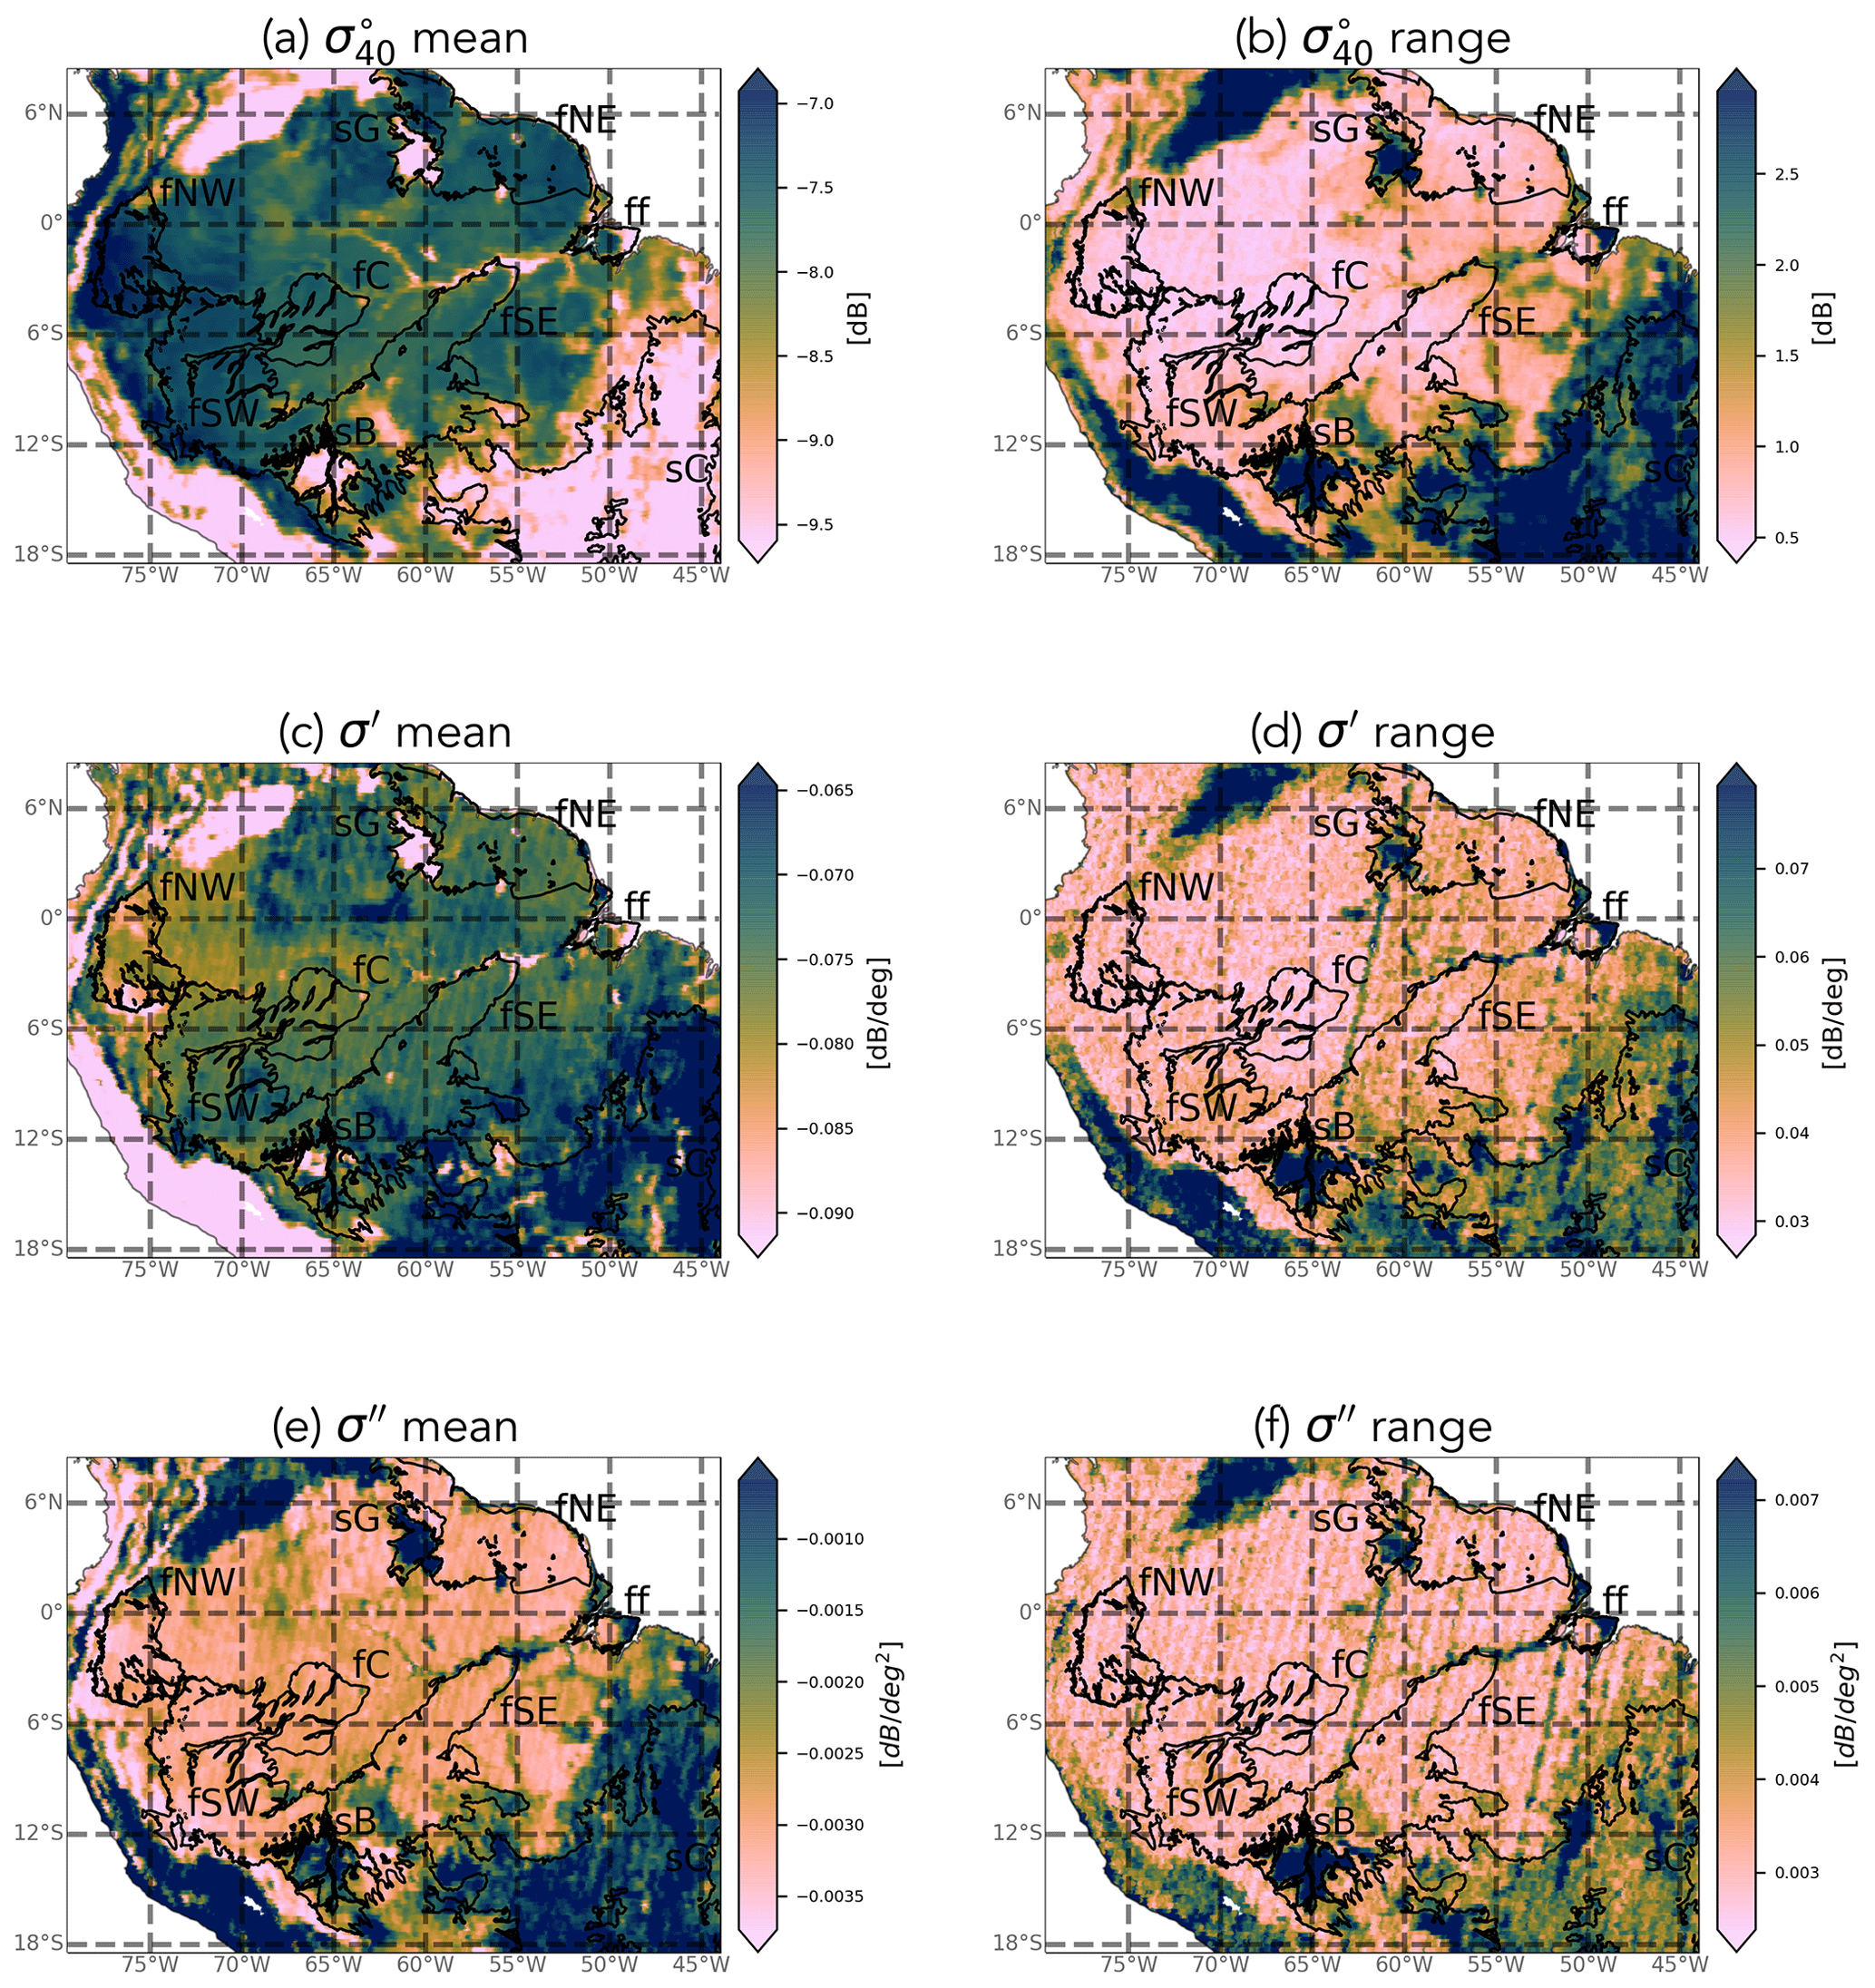
Figure 3Mean and range of ASCAT normalized backscatter, slope, and curvature in the study period (2007–2016). Note that there are no data gaps, so white indicates that the quantity has a value equal to or less than the minimum value indicated on the color bar.
Mean backscatter is highest, with the least variability, in the evergreen forest regions (Fig. S1 in the Supplement). Mean backscatter is 2–2.5 dB lower in the savanna areas, but the range is up to 3 dB, compared to just 0.5 to 1 dB in the forest. The stability of the forest is also apparent in the maps of the slope and curvature. Though there is some variability among the forest ecoregions, the most striking differences in slope and curvature are between the forest and savanna areas. Limited structural and water content changes in the forest canopy result in a limited range of the slope and curvature values in the forest ecoregions. The range of both slope and curvature are highest in the Cerrado areas (Fig. S1). One interesting feature is the difference in mean slope between the Guianan savanna (sG) in the north and the Cerrado (sC) region in the south. The Guianan savanna, with sparse vegetation, has low mean slope values. The Cerrado, on the other hand, shows mean values higher than the evergreen forests. This is unexpected since slope is generally considered to be a measure of vegetation density, and the evergreen forests are much denser than savannas. This will be discussed in detail in Sect. 3.1.1. Seasonal flooding of the Marajó várzea (the seasonally flooded forest) and Beni savannas ensure that both ecoregions have strong seasonal cycles in all three quantities. These will be discussed separately in Sect. 3.1.2.
The mean seasonal cycles in backscatter for all ecoregions of interest are compared in Fig. 4a. This highlights the contrast between the very stable evergreen forest regions and the flooded forest and savanna areas. The mean backscatter value is high, with limited seasonal amplitude in the evergreen forest regions. Backscatter variations are so limited in these areas that they have long been used as calibration targets for spaceborne radar (Birrer et al., 1982; Kennett and Li, 1989; Frison and Mougin, 1996; Hawkins et al., 2000). In contrast, backscatter is generally low but also exhibits strong seasonal variations in the flooded forest and savanna areas. Figure 4b–f shows the seasonal variation in backscatter split out for five ecoregions of interest, against the corresponding climatologies of precipitation and EWT. As the evergreen forest ecoregions showed very similar climatologies, only the Juruá–Purus moist forest is shown as a separate plot. In all of the ecoregions, the maximum backscatter occurs during the wet season, and a decrease in backscatter is observed during the dry season, though the amplitude of the variations is obviously much smaller in the forest ecoregions. In each ecoregion, there is clear agreement between the seasonality of EWT and backscatter. This indicates that backscatter is influenced by moisture availability in terms of total terrestrial water storage, which includes groundwater storage. It is noteworthy that this temporal consistency between backscatter and EWT is apparent for both forest (fC in Fig. 4b) and the Guianan savanna (sG in Fig. 4e), despite the contrast between almost zero (0.25 dB) variability in backscatter in fC and the 2.5 dB seasonal cycle in sG. Figure S2 shows that the temporal correlation between backscatter and precipitation is low for all ecoregions. A strong negative correlation and strong positive correlation are found with radiation and humidity for lags between −2 and 2 months, indicating that backscatter is lowest during drier periods with higher radiation and lower specific humidity.
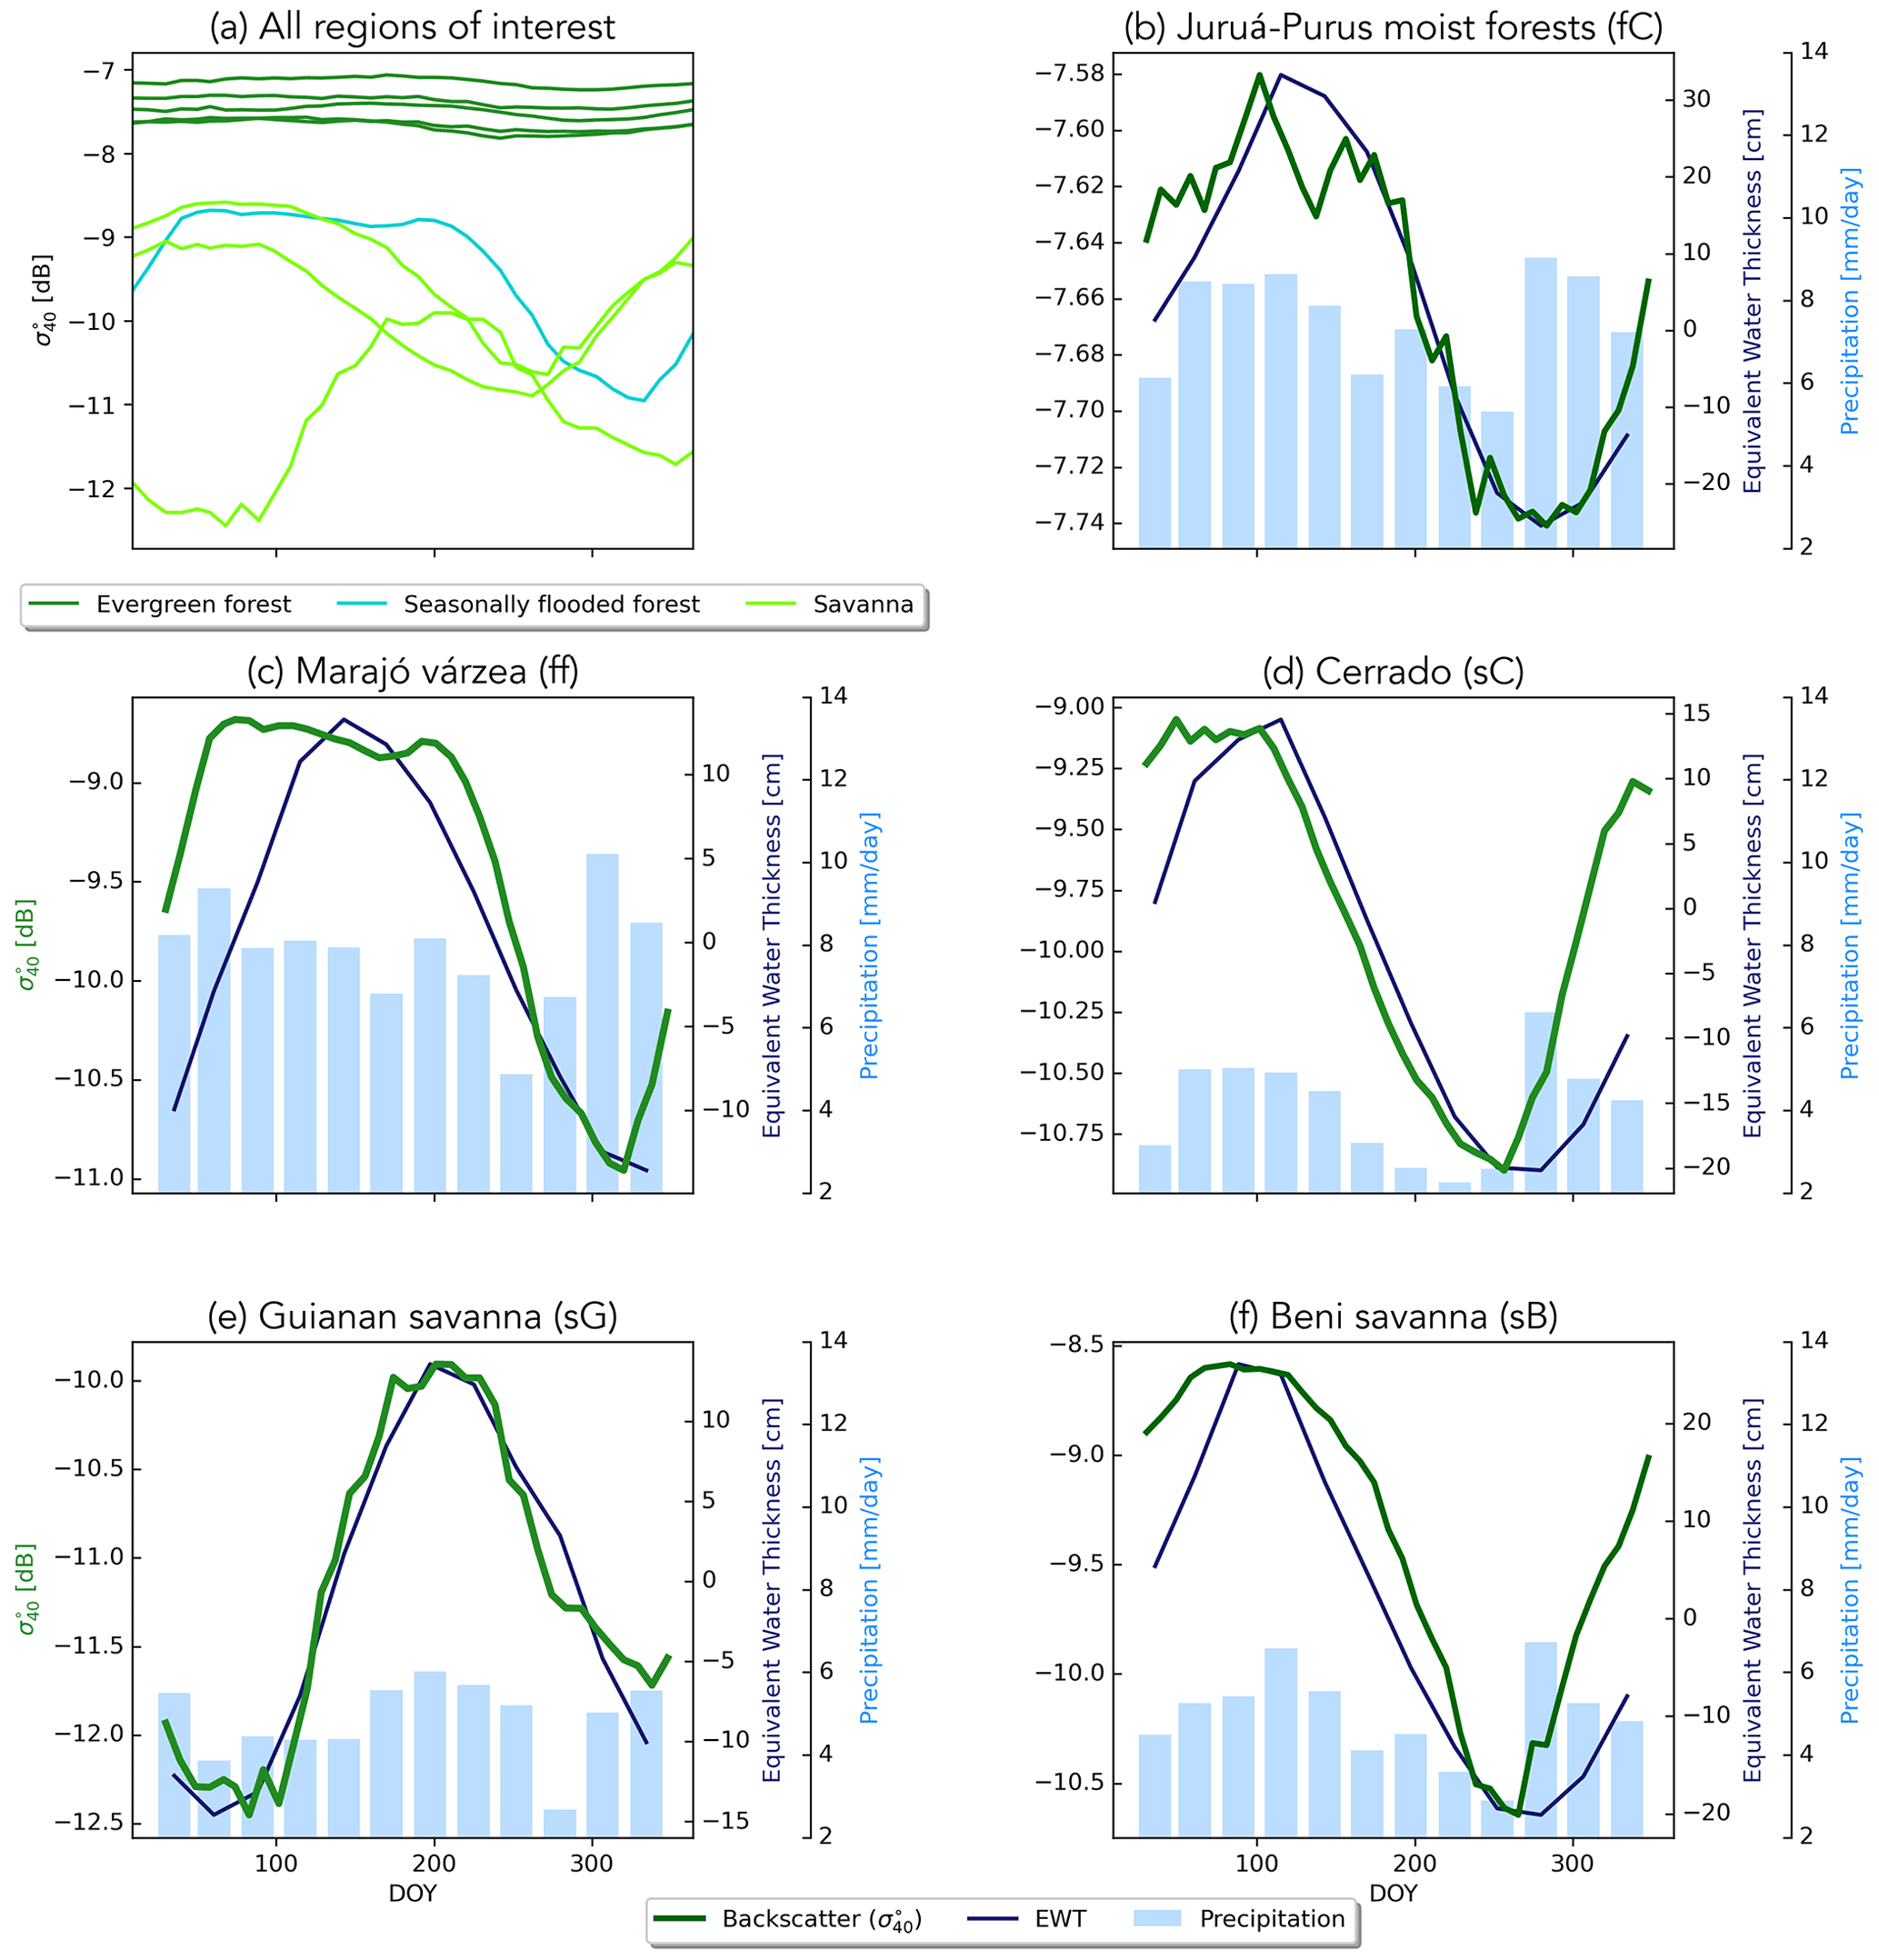
Figure 4Climatologies of backscatter for all ecoregions, with five evergreen forests (dark green), flooded forests (cyan), and three savannas (light green) (a). Panels (b)–(f) show the climatology of backscatter (green line) with precipitation (bars) and equivalent water thickness (EWT; blue line) per ecoregion. Note the different y axes and that only the Juruá–Purus moist forest (fC) is shown, as it is similar to the other evergreen forests.
Figure 5a summarizes the mean seasonal cycle in the slope for the ecoregions of interest. The difference between ecoregions is more pronounced than for backscatter. The seasonal cycle for the evergreen forest ecoregions is similar in magnitude, but there are minor differences in the timing of the peak. The differences between the savanna regions are more pronounced than for backscatter. Significant differences can be seen in the mean slope value and the amplitude and timing of the seasonal cycle of the slope values for each ecoregion of interest.

Figure 5Climatologies of the slope for all ecoregions, with five evergreen forests (dark green), flooded forests (cyan), and three savannas (light green) (a). Panels (b)–(f) show the climatology of the slope (green line) with precipitation (bars) and specific humidity (blue line) and radiation (red line) per ecoregion. Note the different y axes and that only the Juruá–Purus moist forest (fC) is shown, as it is similar to the other evergreen forests.
In Fig. 5b–f, the seasonal cycle of the slope in each ecoregion is compared to the corresponding cycles of radiation, specific humidity, and precipitation which drive photosynthetic activity in the region. Note again that only the Juruá–Purus moist forest is shown as a separate plot. Furthermore, Fig. S2 illustrates the temporal correlation between slope and precipitation, radiation, and specific humidity. In the Juruá–Purus moist forests (Fig. 5b), the change in slope is 1/10 of that observed in the other ecoregions. The variations in radiation and specific humidity are also very limited. Nonetheless, the seasonal cycle of the slope follows that of the radiation with a lag of about 30 d (Fig. S2; R=0.75 at lag−1). This can be explained by the fact that the vegetation phenology in this tropical evergreen forest is driven by radiation (Romatschke and Houze, 2013). The photosynthetic capacity depends on the available solar energy (Borchert et al., 2015). Energy availability drives transpiration and the accumulation of leafy biomass. This increases the volume scattering from the canopy and therefore leads to an increase in the slope. Similar results were observed for the other forest ecoregions. In the Marajó várzea flooded forest (Fig. 5c), the variation in slope is much larger, and the seasonal cycle is clearly out of phase with that of the radiation. The seasonal variations in slope in this ecoregion are dominated by the influence of surface flooding rather than vegetation water content variations (Sect. 3.1.2).
In the Cerrado (Fig. 5d), there is a significant variation in specific humidity and radiation, as well as a strong seasonal cycle in precipitation. The peak in slope occurs during the driest time of year, when radiation is at a maximum and specific humidity and precipitation are at a minimum. Recall, from Fig. 4, that this is also during the minimum EWT and backscatter period. This is also illustrated in Fig. S2, where strong negative correlations are found between slope and humidity. Correlations between slope and radiation are lower, and the highest correlation occurs at a lag of 2 months, i.e., slope leads radiation. Section 3.1.1 provides a detailed analysis of the vegetation types within the Cerrado ecoregion to better understand these variations. The slope values in the Guianan savanna (Fig. 5e) are the lowest observed in all ecoregions and also have the smallest variations among the non-forest cover types which are not strongly related to precipitation, radiation, or specific humidity. This is consistent with the relatively low, but stable, vegetation density associated with grasslands (Steele-Dunne et al., 2019). In the Beni savanna (Fig. 5f), on the other hand, slope varies as much as in the Cerrado, and there is a very clear relationship between the slope and the atmospheric forcing data (Fig. 5f). The maximum slope occurs at the peak of precipitation, EWT (from Fig. 4) and humidity. The minimum slope occurs during the dry season at the minimum in precipitation, humidity, and EWT. This is consistent with the interpretation of the slope as an indicator of vegetation density as the vegetation cover in this savanna changes dramatically in response to atmospheric forcing. This is also illustrated in Fig. S2, where high correlations are observed between slope and humidity with small lags. The contrast in the seasonal cycles in slope in Fig. 5 reflect the diversity in the vegetation cover types in the ecoregions and their varied response to moisture supply and demand.
Figure 6a shows the mean seasonal cycles in curvature for the regions of interest. The differences in the amplitudes of the seasonal cycles vary considerably among the regions. While the evergreen forests vary less than 0.0005 dB ∘−2, variations in the wetland regions (Beni savanna and Marajó várzea) are an order of magnitude larger. Aside from the Guianan savanna, the timing of the seasonal cycle is similar across all ecoregions. Previous research has suggested that curvature is related to vegetation phenology and structure (Steele-Dunne et al., 2019). Since the vegetation phenology in much of the forested region is radiation driven, we hypothesize that the curvature seasonality is related to the radiation and evaporative demand. In the Amazon rainforest, Borchert et al. (2015) observed that leaf flushing and flowering in adult trees of numerous species coincided with the rise and decline of insolation. Wagner et al. (2016) made a similar observation about leaf flushing and rising insolation in July and also noted that the litterfall peak occurs when evaporative demand is highest and can persist through the dry season. Figure 6b shows that although the changes in curvature are very small in the rainforest, the peak occurs in July on the rising limb of the radiation data and when the specific humidity is near its minimum. Figures 6b–f and S2 show the strong correspondence between curvature and radiation (positive correlation at a lag of 2 months) and specific humidity (negative correlation with a lag of −1 month) and that the highest values of curvature generally correspond to lower humidity, higher solar radiation, and lower precipitation. This suggests that higher values of curvature may be related to litterfall during periods of high evaporative demand. It is also noteworthy that the curvature values in the Guianan savanna (Fig. 6e are positive for much of the year, consistent with the dominance of grass cover in this region.
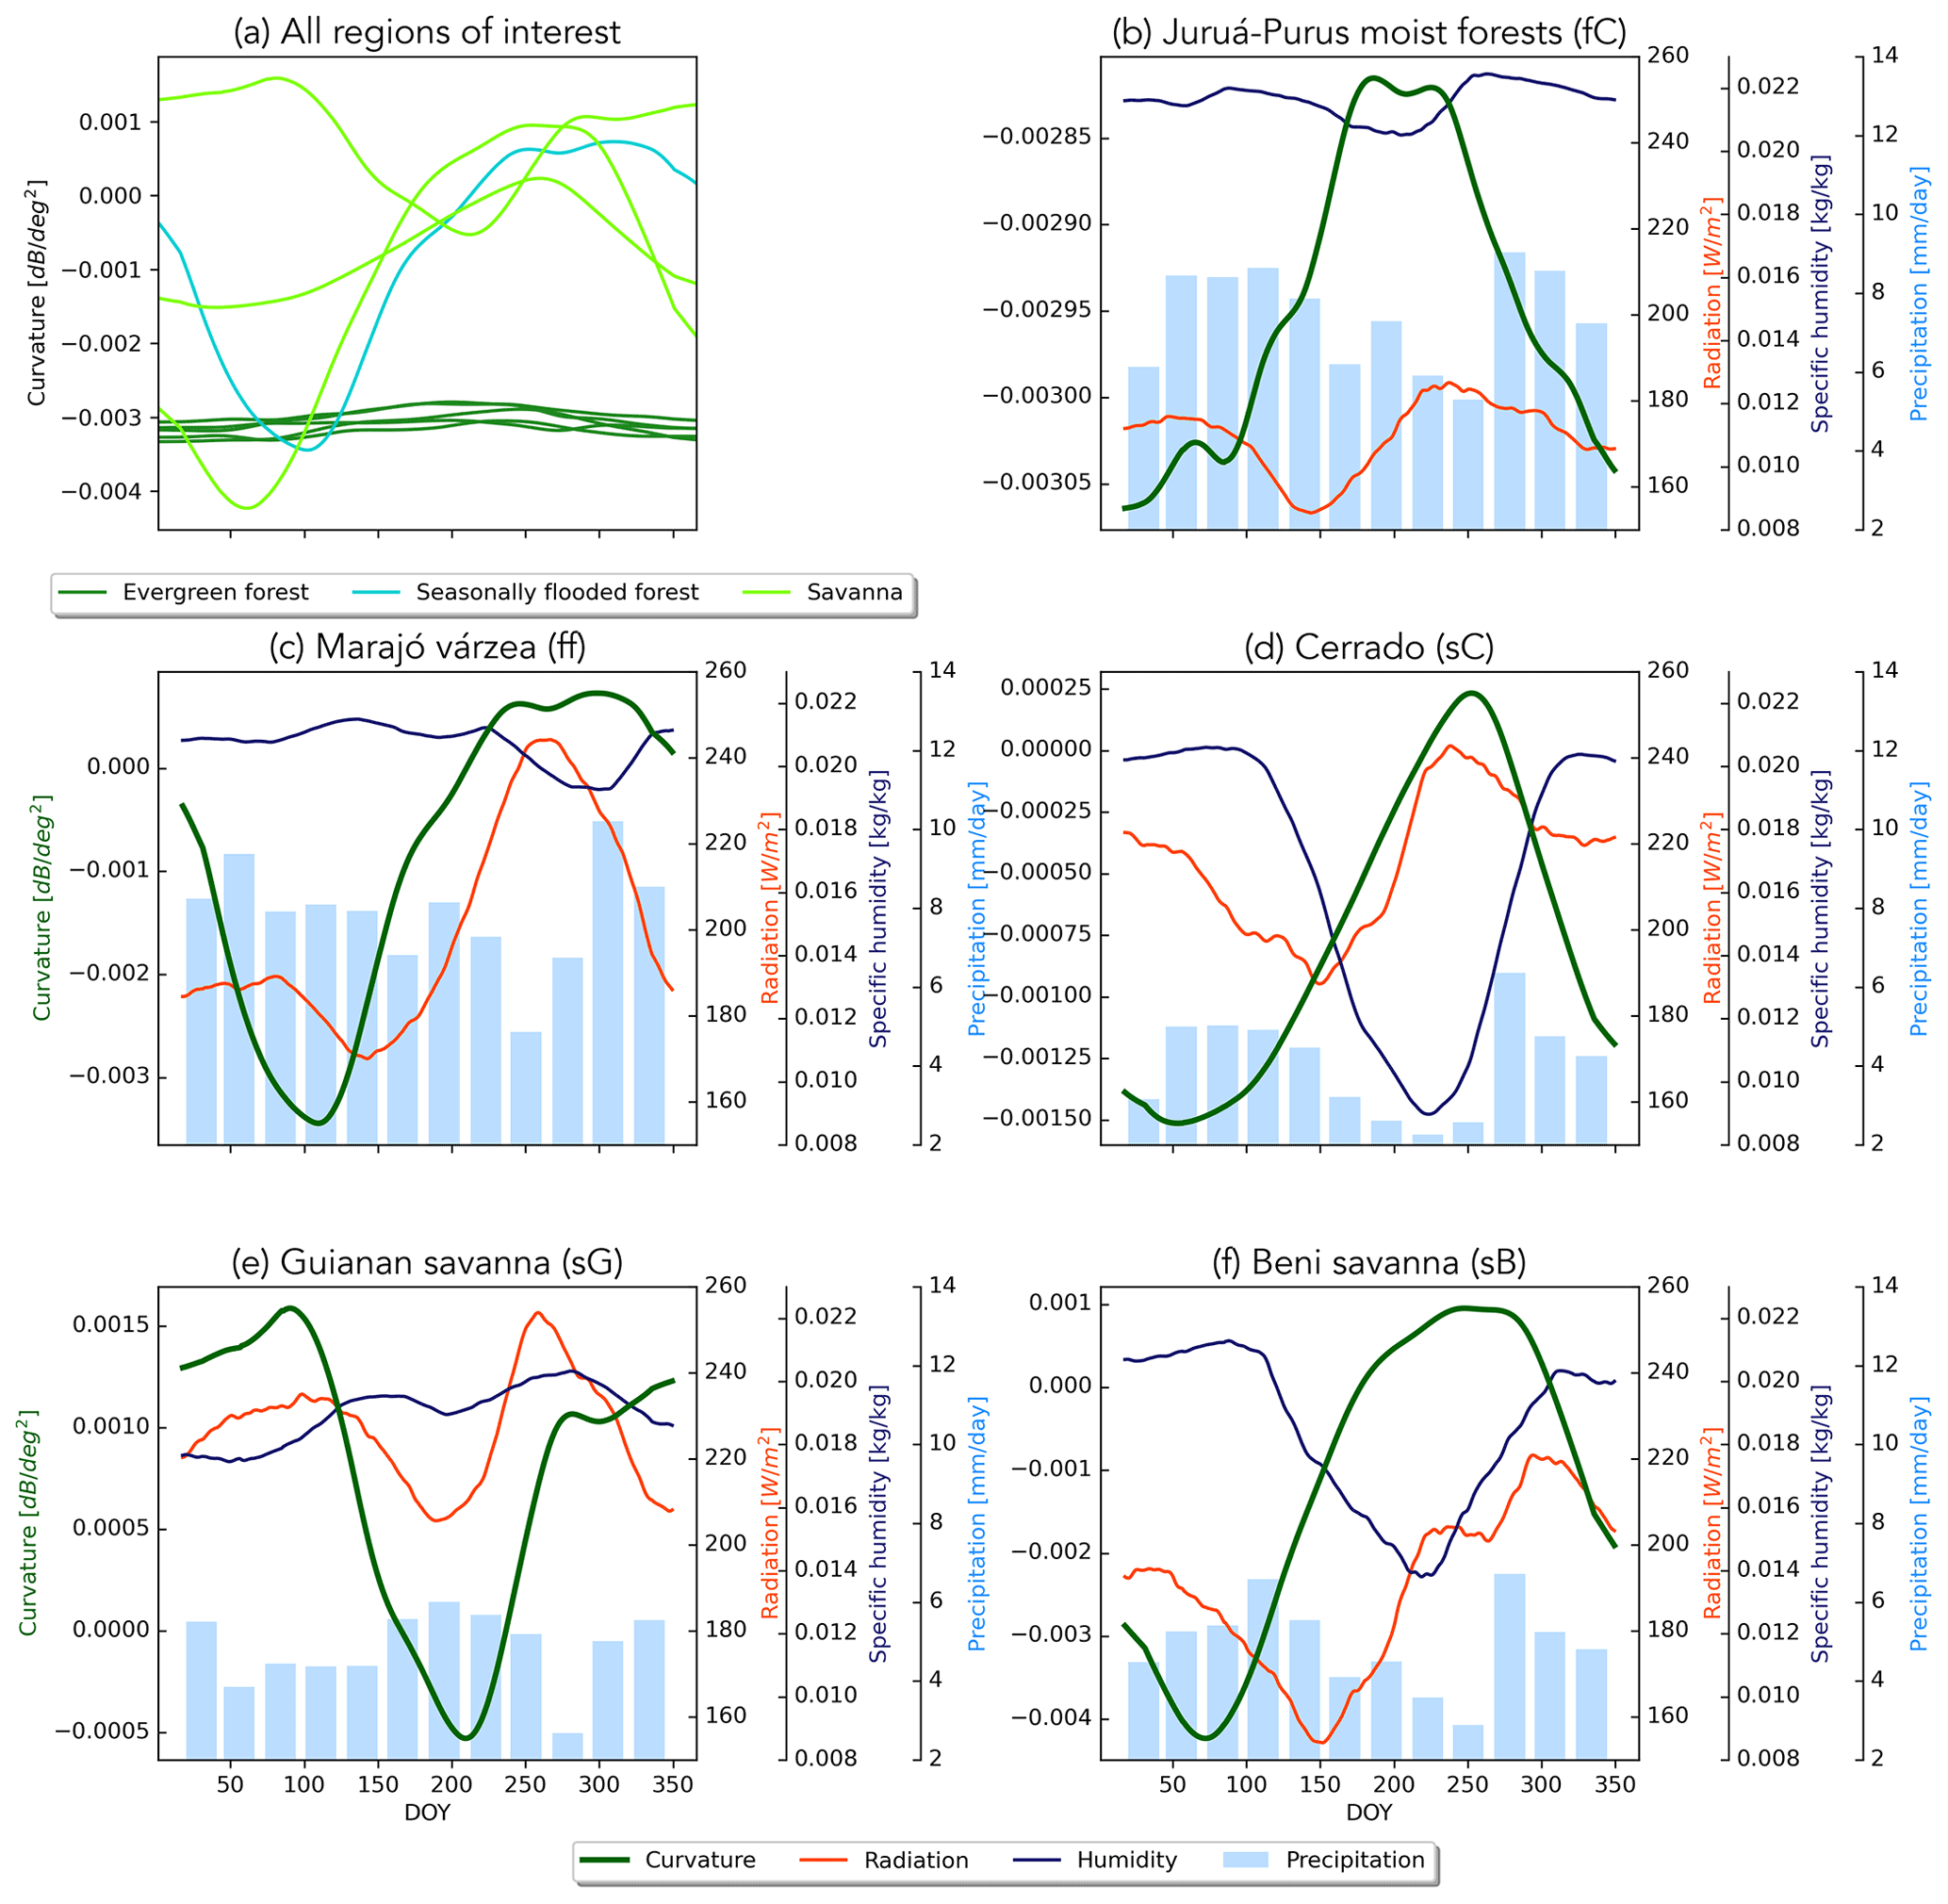
Figure 6Climatologies of curvature for all ecoregions, with five evergreen forests (dark green), flooded forests (cyan), and three savannas (light green) (a). Panels (b)–(f) show the climatology of curvature (green line) with precipitation (bars) and specific humidity (blue line) and radiation (red line) per ecoregion. Note the different y axes and that only the Juruá–Purus moist forest (fC) is shown, as it is similar to the other evergreen forests.
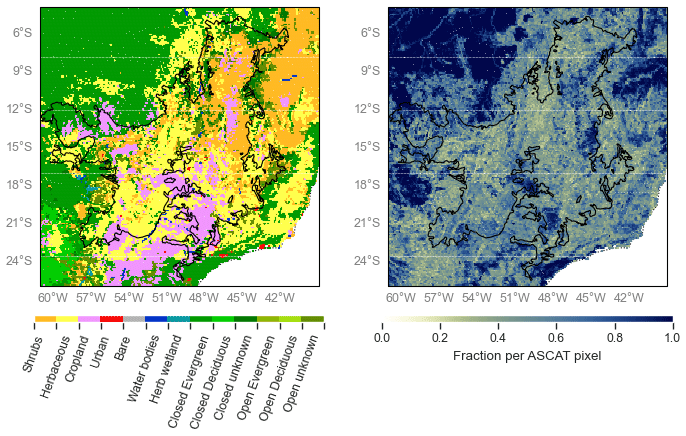
Figure 7Dominant land cover type (left panel) and fraction (right panel) derived from the Copernicus Global Land Service Land Cover (2015) for the Cerrado region (Buchhorn et al., 2020).
3.1.1 Cerrado
As described in Sect. 3, the Cerrado shows a peak in slope, which indicates increased volume scattering, at a time of low precipitation and humidity, maximum radiation, and low backscatter. To better understand these variations, backscatter, slope, and curvature are analyzed for the entire Cerrado region per land cover class. An overview of the number of used grid points per land cover can be found in Table S2. Figure 7 provides a detailed map of the Copernicus Global Land Service Land Cover within the Cerrado region (Buchhorn et al., 2020). The dominant cover types are herbaceous cover and shrubland, with patches of cropland and forest. Figures 8 and 9 show the spatial patterns and boxplot per land cover type of mean, maximum, and the day of year (DOY) of the maximum for backscatter, slope, and curvature. The mean backscatter varies between −13 and −7 dB and is highest for forest regions and lowest for croplands. The DOY for the maximum backscatter varies with latitude from December to January in the southern region to April in the northern region. As expected, the highest backscatter corresponds with the months of highest precipitation and EWT, and the minimum in backscatter corresponds with the months of lowest moisture availability (Fig. 4). The seasonal dynamics in backscatter are strongest in cropland. This may be related to the higher sensitivity to surface soil moisture in croplands, and low backscatter may be related to dry surface soil conditions. The slope mean and maximum values show a decrease from shrubs to herbaceous to cropland, which decrease with vegetation density as expected. Forests are characterized by high mean and maximum slope values. The seasonal dynamics and DOY of the maximum slope vary strongly with the land cover type. In croplands, the maximum slope, i.e., where volume scattering is highest, occurs between DOY 340-150. This corresponds to the highest precipitation and EWT, indicating increased vegetation density. In natural vegetation, such as herbaceous cover, shrubs, and forests, the highest slope occurs between DOY 200 and 300 and coincides with the minimum in precipitation and EWT but with maximum radiation (Fig. 5). This is illustrated in Fig. 10, where slope and radiation dynamics for different land cover classes are depicted. To exclude confounding effects due to heterogeneous land cover within ASCAT pixels, we used only pixels with a dominant land cover fraction of >80 %. The slope dynamics in cropland are following the precipitation dynamics and have their peak during the wet season. Herbaceous cover shows two peaks in slope, with one coinciding with the wet season at the beginning of the year and a higher peak coinciding with the dry season and maximum in radiation. The increase in slope coincides with the onset of the increase in radiation. In shrubs and forests, the slope starts to increase after the wet season but before the increase in radiation (Fig. 10). This counterintuitive behavior of the slope over natural vegetation can be explained by the variability in limiting factors to vegetation activity. Within the Cerrado region, vegetation can be moisture limited or energy limited (Nemani et al., 2003), depending on location and land cover type. Contrary to crops, natural vegetation types such as herbaceous vegetation, shrublands, and forests have deeper root systems, and they can tap into deeper water reservoirs. This enables them to increase photosynthesis and leaf development slightly before or at the onset of increasing radiation, even though precipitation is at its minimum. The increase in vegetation activity will lead to increased volume scattering and a flatter backscatter over all incidence angles and subsequent higher slopes. Chave et al. (2010) found that, among the tropical forest types in South America, the highest seasonality in litterfall was observed in low-stature forests, such as those found in the Cerrado. They also cite Wright and Van Schaik (1994) to argue that the seasonality of solar radiation rather than precipitation may be the most important trigger for leaf flushing and leaf abscission. Croplands and herbaceous vegetation show positive curvatures, whereas forests are characterized by negative curvatures, with the maximum values occurring between DOY 200 and 300 across the Cerrado. The positive curvature for crops and herbaceous vegetation can be explained by the vertical structure of the vegetation.
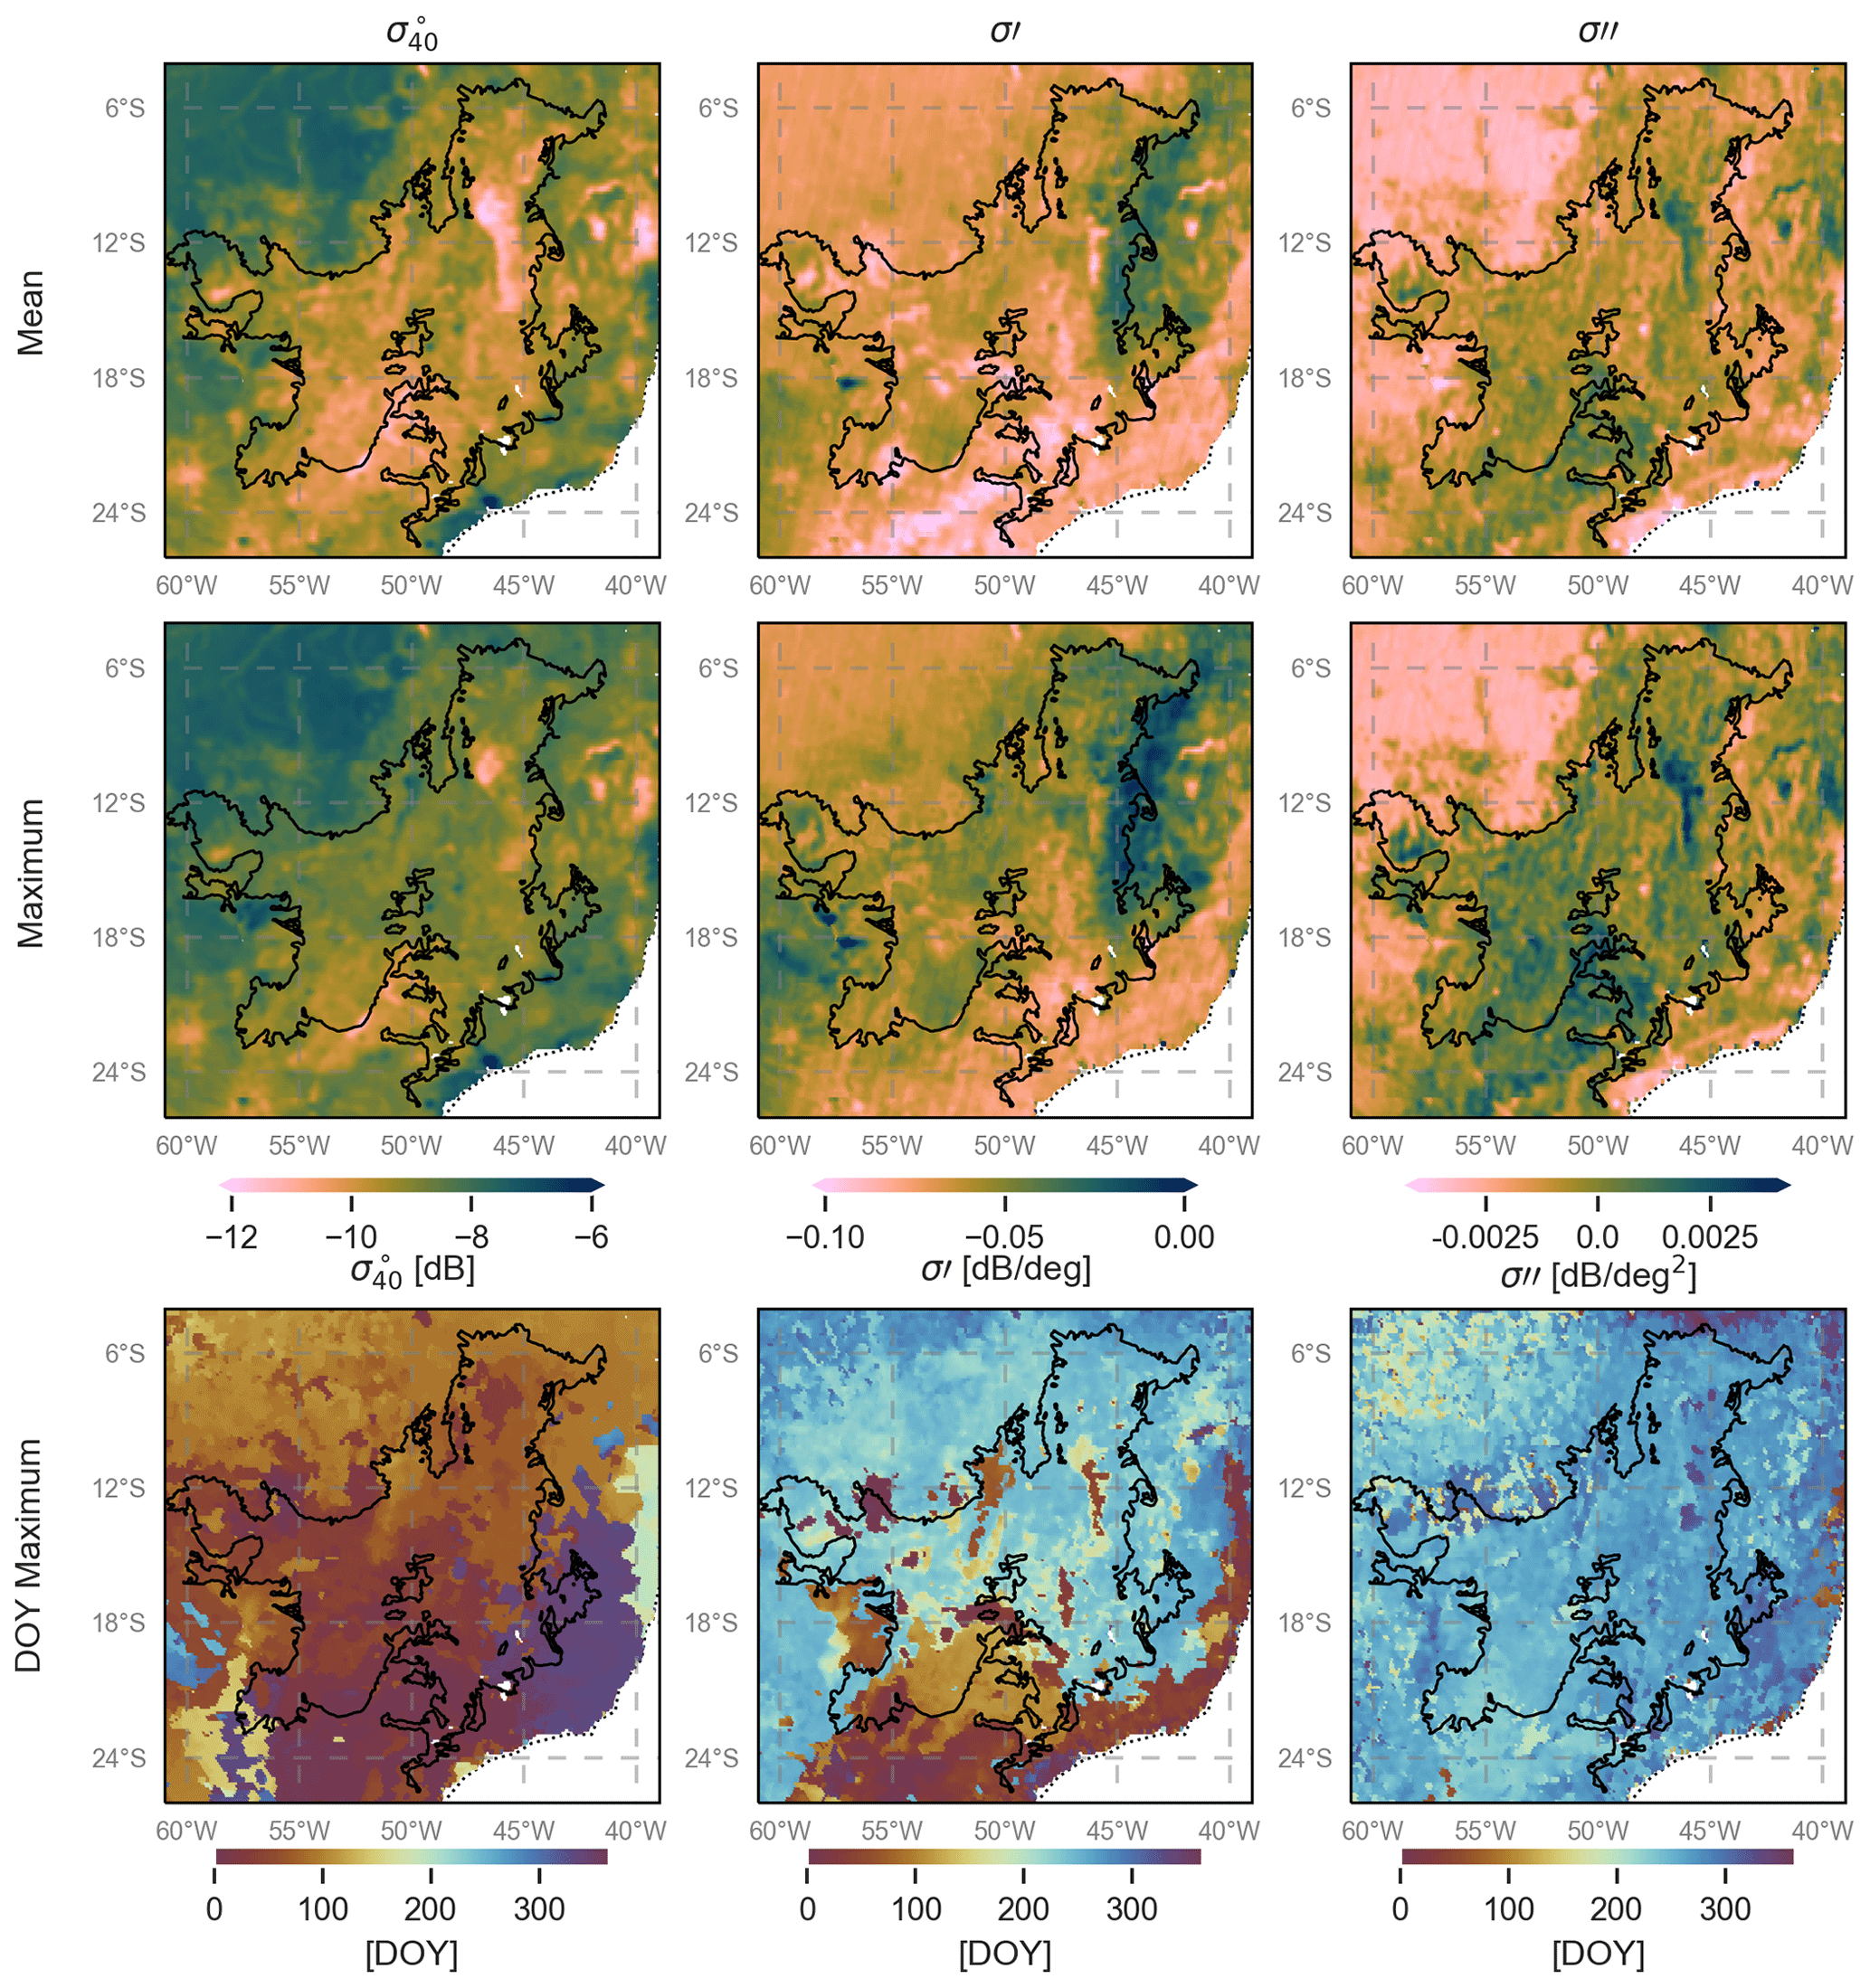
Figure 8Mean, maximum, and DOY of maximum for backscatter, slope, and curvature over the Cerrado.

Figure 9Time series averaged per land cover class and box plots of mean, maximum, and DOY of maximum for backscatter, slope, and curvature over the Cerrado.
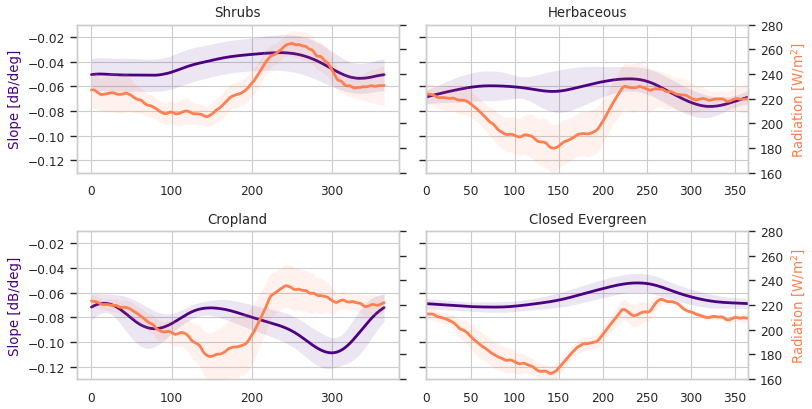
Figure 10Seasonal cycle of the slope and radiation per land cover class in the Cerrado region. Only ASCAT pixels in which the fraction of the dominant land cover type exceeds 80 % are included.
3.1.2 Seasonal flooding
Figure 11 shows the striking effect of seasonal flooding on the incidence angle dependence of backscatter. This relationship was obtained using Eq. (1) for a reference angle of 40∘, with the climatological mean values of , slope, and curvature for several days during the year. The flooded period is indicated in shades of blue. First, note that is around 2 dB higher during the seasonal flooding. Under forest/woody vegetation, this is due to a combination of double bounce scattering between the surface and trunks and multi-path scattering between the surface and the vegetation (Townsend, 2002).
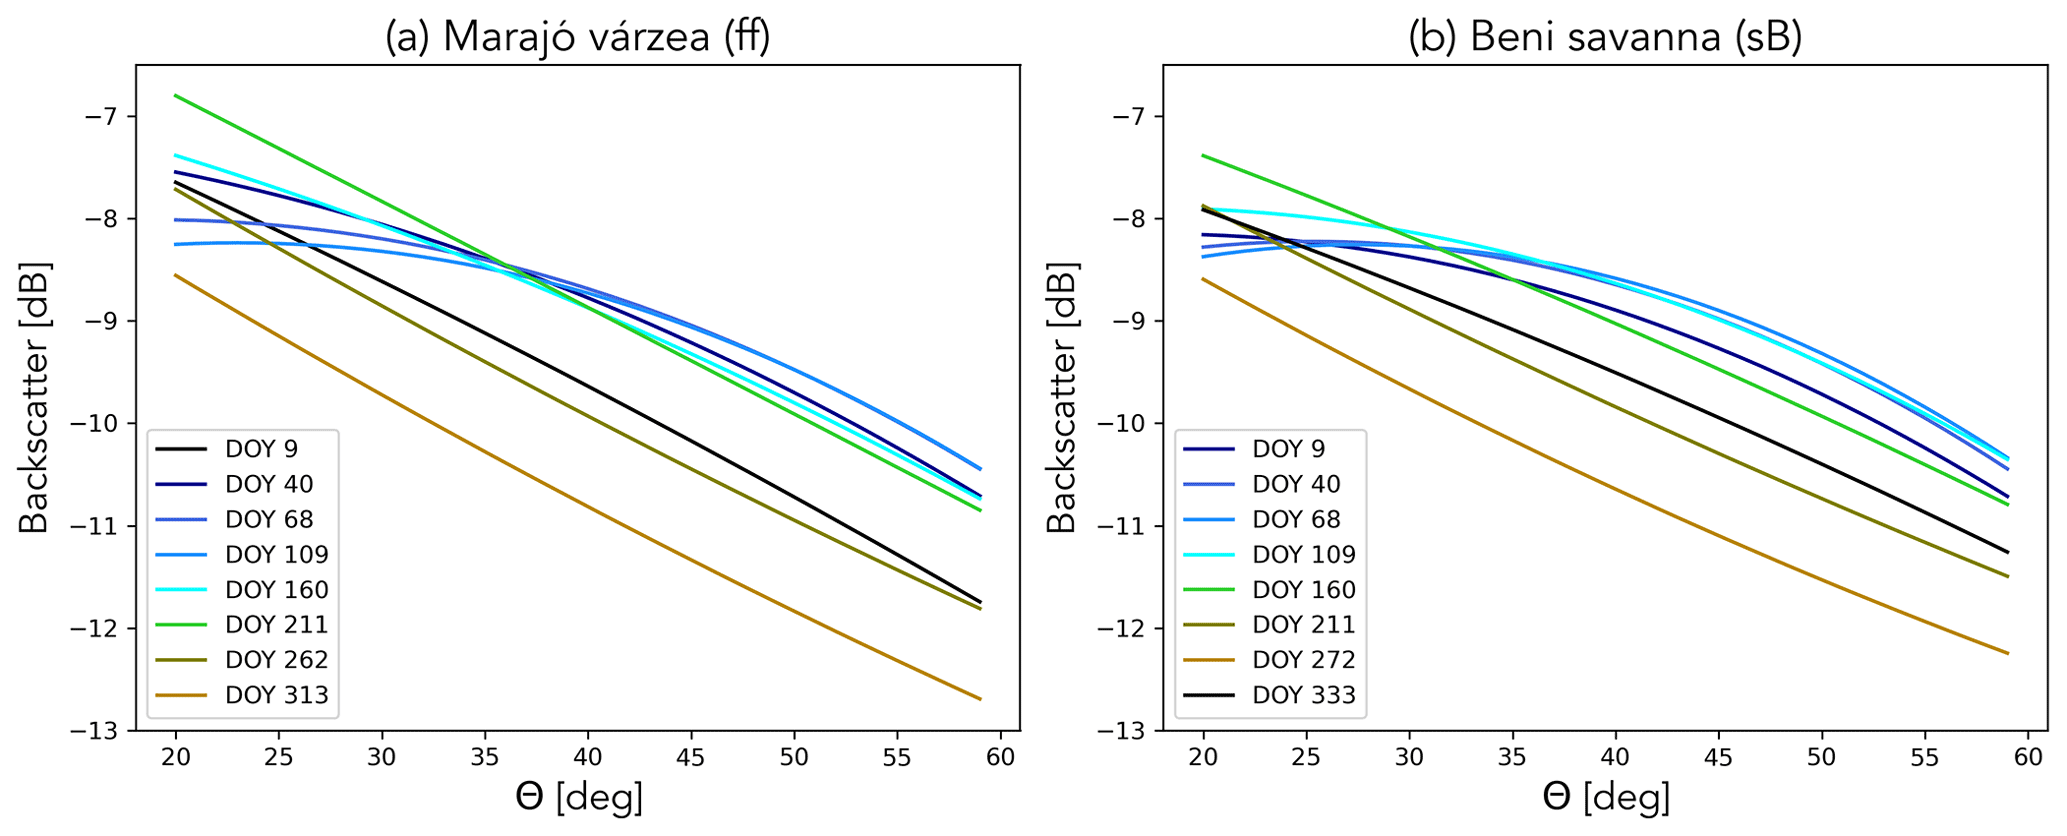
Figure 11Averaged backscatter as a function of incidence angle for several dates in the Marajó várzea (a) and Beni savanna (b) ecoregions.
Recall, from Fig. 5, that the slope is slightly higher during this period as this multiple scattering is apparently slightly less sensitive to incidence angle than scattering from the vegetation during the non-flooded period. However, the most noteworthy difference is in the curvature. In both ecoregions, the curvature changes considerably and even changes sign during the flooded period. This illustrates that the curvature includes useful information on changes in the scattering mechanisms, which are related to physical changes at the land surface.
3.2 Diurnal differences
Figure 12 shows the mean diurnal differences for backscatter and EWT in the study area for alternate months in the year, where positive values indicate that values are higher during the descending (10:00 LT) overpass than those from the ascending (22:00 LT) overpass. The diurnal differences in backscatter are generally very small, with maximum values less than 0.15 dB. Although this is unquestionably close to the limits of the ASCAT sensor in terms of radiometric accuracy, these results are based on monthly averages, which is expected to reduce noise. Furthermore, there is a clear seasonal variation, broadly following that of EWT, demonstrating that patterns are likely not a result of noise.

Figure 12Maps of monthly mean diurnal differences in (morning minus evening passes) and monthly mean equivalent water thickness (EWT) from GRACE for different months in the year.
For most of the domain, especially the evergreen forests, high values in EWT coincide with negative diurnal differences in backscatter and vice versa. During periods of maximum EWT, the backscatter is higher in the evening than in the morning. This is consistent with the finding that precipitation in tropical South America (since it is generally produced by convective systems) predominantly occurs in the late afternoons and evenings (Romatschke and Houze, 2013). Hence, these higher backscatter values are due to the canopy being wetter in the evening.
During the drier periods – e.g., September (h, k) and November (i, l) in the south of the study area – backscatter is higher at 10:00 LT than at 22:00 LT, consistent with the loss of moisture through transpiration during the day. In a light-limited evergreen forest such as the Amazon (rather than a water-limited forest), the canopy photosynthetic capacity seasonality is driven by radiation (Wagner et al., 2016). When the plants are phenologically active, they lose water during the daytime through transpiration, resulting in lower evening backscatter values. The results in Fig. 12 are consistent with the findings of previous studies by Frolking et al. (2011) and Friesen et al. (2012), who also found the morning backscatter over Amazonia to be higher (on average) than the evening values due to higher water content in the vegetation. In the areas surrounding the evergreen forests, the patterns can be less straightforward. Note, for example, that the diurnal difference in in the Guianan savanna (sG) consistently has the opposite sign to that of the surrounding forest.
In Fig. 13, the seasonal cycle of the diurnal difference in is compared to those of the radiation, precipitation, and EWT for each of the ecoregions of interest. Figure 13a is indicative of the seasonal variations observed across the evergreen forest ecoregions. Note that the diurnal differences are very small (<0.06 dB). Recall from Figs. 4, 5, and 6 that the backscatter, slope, and curvature in these evergreen forests were essentially stable throughout the year, so even this small diurnal difference is noteworthy, given the limited seasonal variation. As mentioned in the discussion of Fig. 12, evening values are higher than morning values during the EWT maximum and vice versa. Diurnal differences are larger in the Marajó várzea (Fig. 13b), but interpreting their seasonal variation is complicated by the seasonal inundation. In the Cerrado and Beni savanna ecoregions (Fig. 13c and e), the diurnal differences in backscatter are almost twice as large as those observed in the evergreen forest regions. Morning values are up to 0.1 dB higher than evening values during the dry season due to loss of plant moisture during the day. Similar to the forest regions, evening backscatter values are higher during the rainy season. The Guianan savanna (Fig. 13d) is quite distinct in that morning backscatter is up to 0.15 dB higher than evening backscatter during the EWT and backscatter peak. One possible explanation for this unusual seasonal cycle is that it is related to a change in the relative dominance of the forests and grasslands in the backscatter signal. The transition from positive to negative curvature values during the EWT peak indicate an increased contribution from tree patches and shrubs during the wetter period. The higher backscatter in the morning may be due to water uptake in the trees during the night.
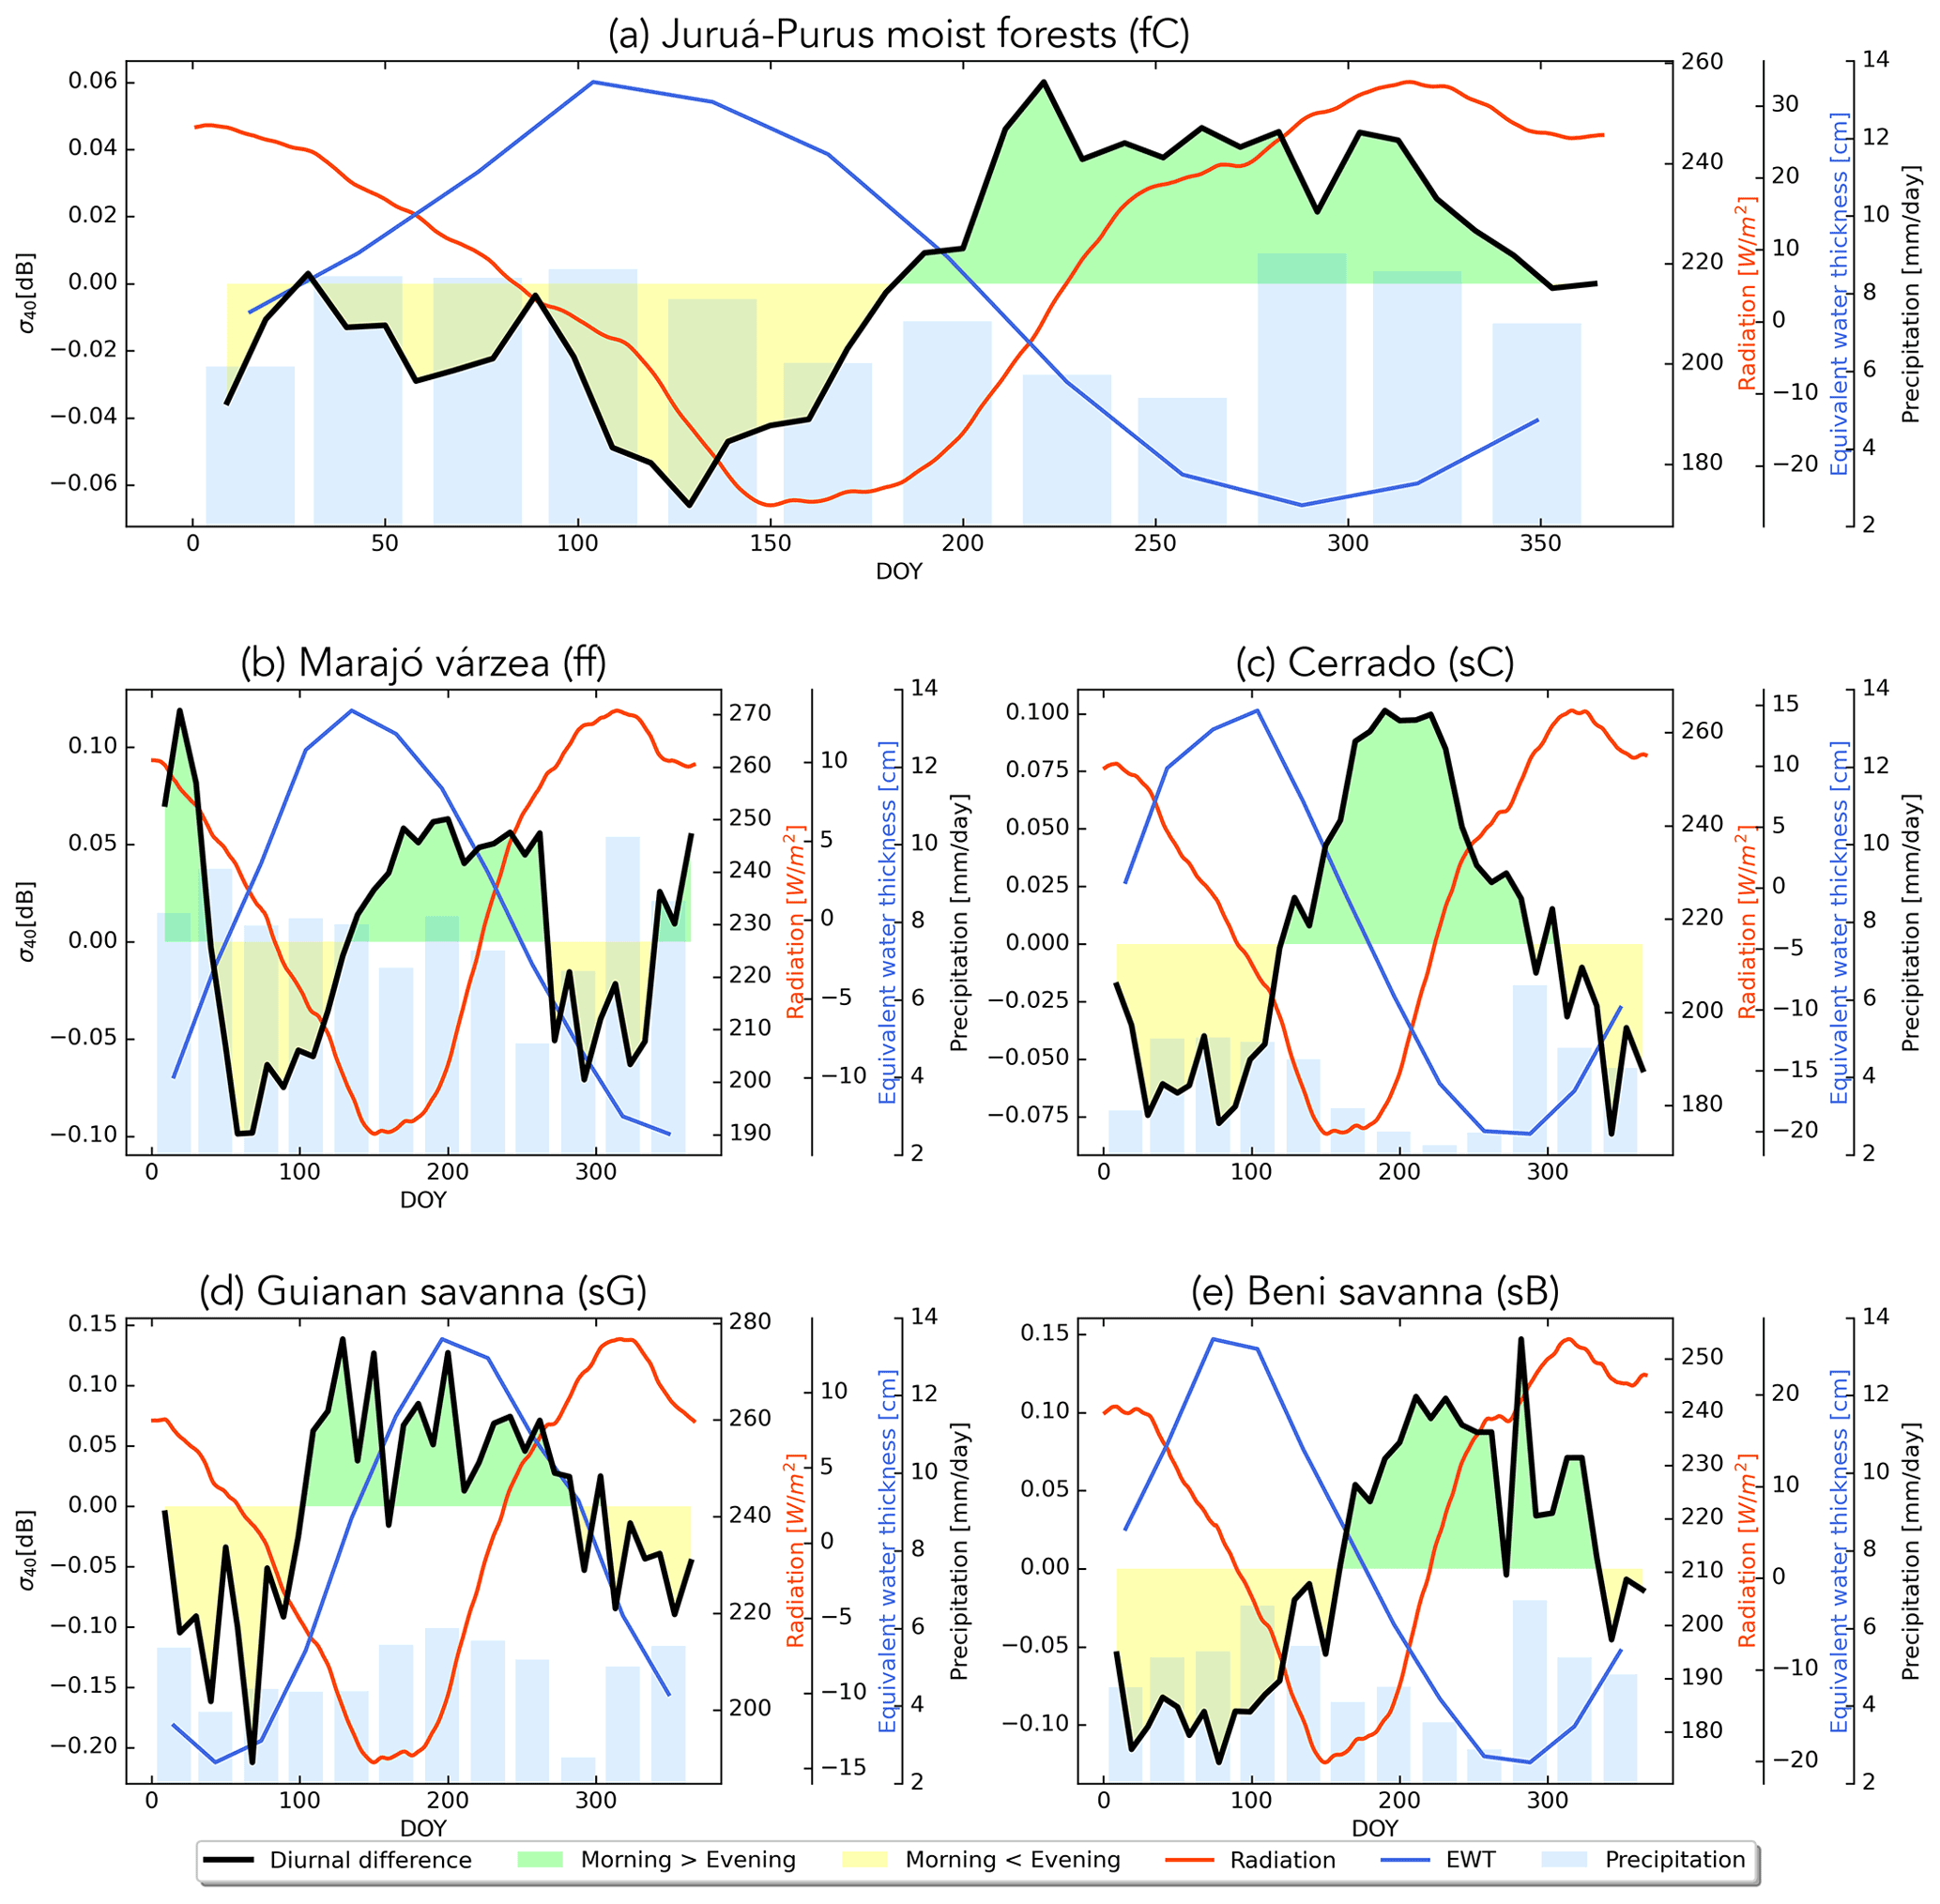
Figure 13Seasonal cycle of diurnal difference in backscatter (black line), radiation (red line), EWT (blue line), and precipitation (bars) for different cover types. Green (yellow) fill indicates days on which backscatter is higher (lower) in the morning than in the evening.
3.3 The 2010 and 2015 droughts
During the study period (2007–2016), two major droughts occurred in Amazonia in 2010 and 2015. Figure 14 shows the spatial distribution of anomalies in , slope, and curvature during the peak of the droughts from June to September 2010 and October to December 2015. The two regions of interest are indicated in the maps, i.e., the savanna Cerrado (sC) ecoregion and Southwest Amazon moist forests (fsW). The 2010 drought was most severe over southern and western Amazonia (Panisset et al., 2018). The 2015 drought was considered to be a record-breaking event, with stronger warming than that seen in previous events (Jiménez-Muñoz et al., 2016). According to Panisset et al. (2018), there was a “pronounced lack of rainfall availability during late spring and early summer”. The 2015 drought was more widespread than the event in 2010 and strongest in eastern Amazonia.
Negative anomalies are observed in , especially in the southern regions and in the Cerrado in 2010 and in eastern regions in 2015. Although anomalies are small over forests, they are robust. Recall from Sect. 2 that the backscatter noise level is low over evergreen forests and noise is further reduced through temporal aggregation. Note that the most eastern part of the Cerrado shows positive anomalies in 2010. The forests in fsW show minor negative anomalies (<0.1 dB) in in 2010 and slightly stronger negative anomalies in 2015. Negative anomalies in backscatter from QuikSCAT (Quick Scatterometer) were also observed during the 2005 drought (Saatchi et al., 2013; Frolking et al., 2017). No significant spatial or temporal anomalies were observed in the diurnal differences in backscatter during the drought years. The slope and curvature do not show clear spatial patterns in anomalies during the 2010 drought, although the southern region shows slightly more positive anomalies. A clear positive anomaly can be observed in the slope in eastern Amazonia in the 2015 drought. The curvature shows fewer clear patterns, although a striping pattern can be seen that is likely related to swaths.
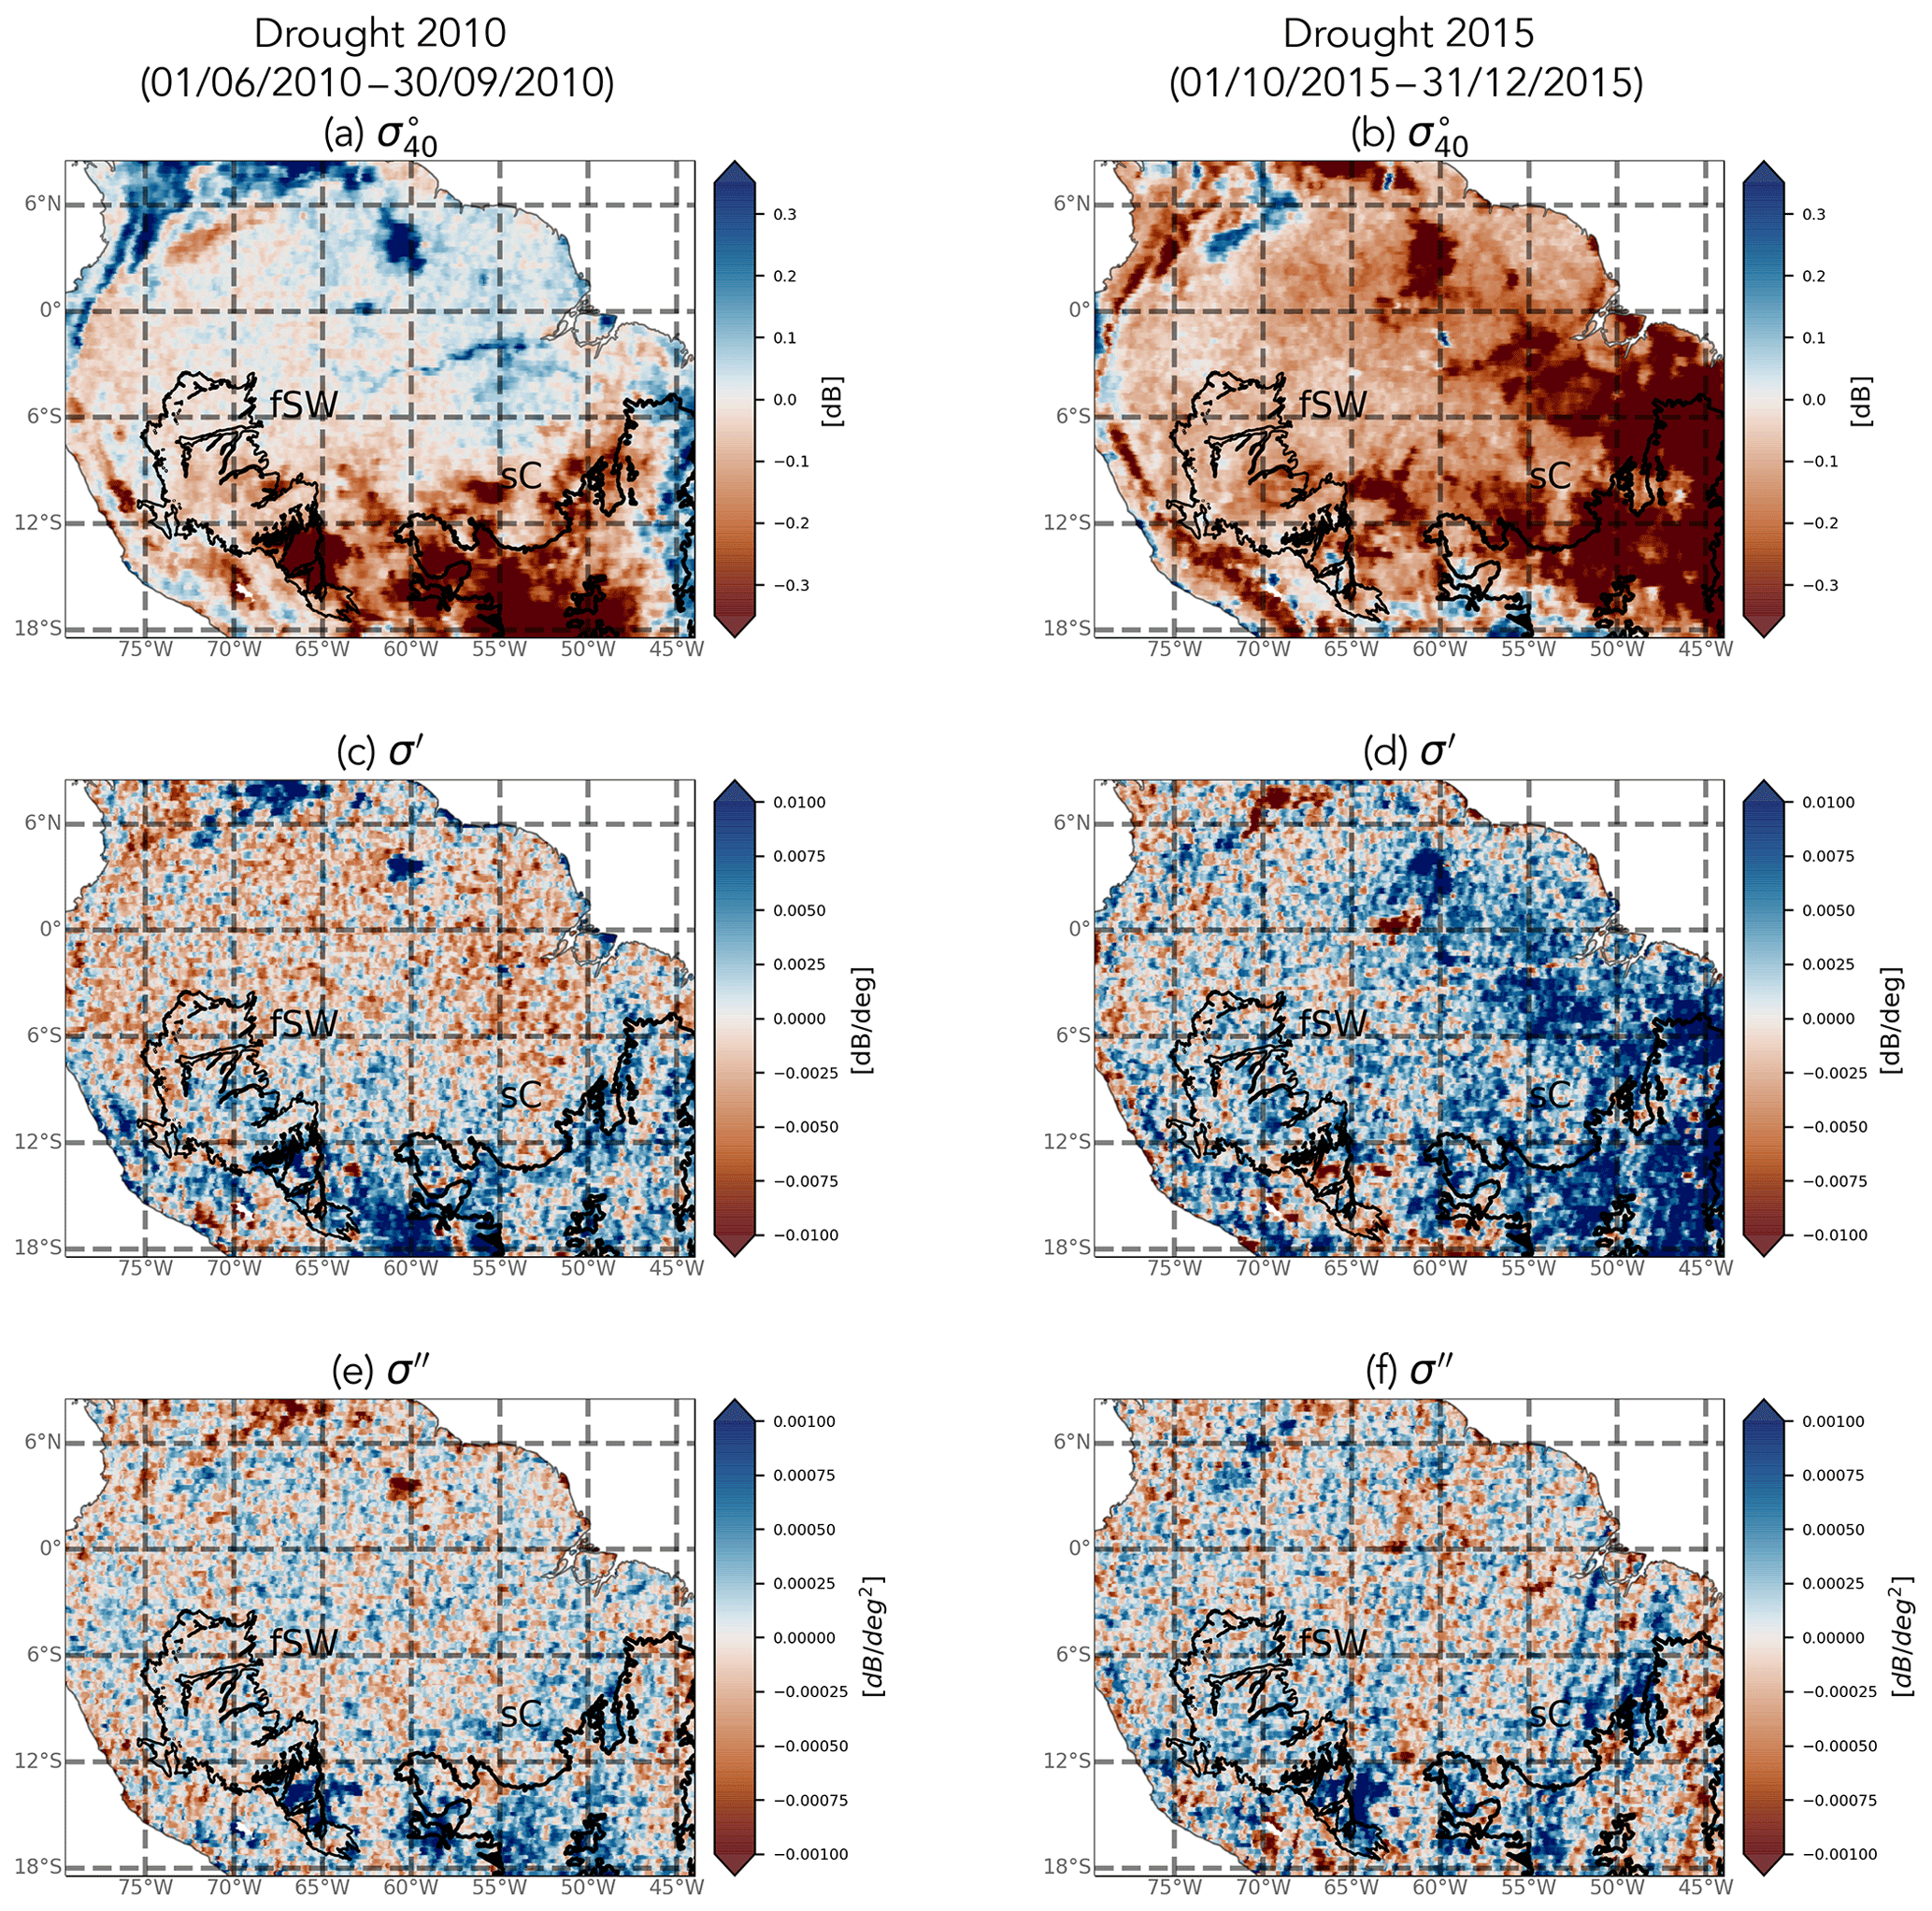
Figure 14Spatial patterns in anomalies in backscatter, slope, and curvature in response to the 2010 and 2015 droughts.
Figure 15 shows the time series of anomalies in backscatter, slope, and curvature for the moist forests in fsW and the Cerrado region for the 2010 and 2015 drought. The backscatter, slope, and curvature over the closed evergreen forest in fsW shows very little variation (both in time and space) during both droughts. A slight increase up to 0.002 dB per degree in slope can be observed during the peak of the 2015 drought. This demonstrates that the fsW forests are stable for satellite calibration. The Cerrado shows varying responses depending on land cover type and are therefore investigated further. Negative anomalies in in cropland and herbaceous land cover can be seen during both droughts. Especially during the 2010 drought, the croplands in the Cerrado are strongly affected, with a negative anomaly of dB for some pixels. During the more extensive drought in 2015, in forest is also affected, and negative anomalies up to −1.5 dB are observed. The slope shows minor positive anomalies during the peak of the drought in 2010. In an analysis of drought impact on VOD over the forests in southern Amazonia, Liu et al. (2018) observed similar positive anomalies in VOD from May to August during the 2010 drought. Negative anomalies in VOD were only observed during later stages of the drought, from August to October. In 2010, negative slope anomalies in the Cerrado are observed from October on. During the 2015 drought, strong positive anomalies in slope and curvature are present over the Cerrado, especially in forests. Contrary to the drought of 2010, the peak of the 2015 drought occurs during the precipitation season in the Cerrado. Normally the precipitation season is characterized by lower radiation, and the positive anomalies in radiation during the drought might enhance vegetation growth. Note that the very small fluctuations in backscatter observed in Figs. 14 and 15 may only be scientifically evaluated in rainforest regions, where the spatiotemporal backscatter dynamics (radiometric variations) are among the most stable in the world.

Figure 15Time series of anomalies in backscatter, slope, and curvature for moist forest (fsW) and Cerrado region. The shaded areas indicate the 5th and 95th percentile. The peak drought intervals (June–September 2010 and September–December 2015) are shown within dash–dotted blue lines.
In this study, ASCAT backscatter, slope, and curvature were analyzed in conjunction with meteorological data and terrestrial water storage from GRACE in the Amazon region. Previous results, limited to grasslands, had suggested that the slope and curvature contained useful information for monitoring vegetation water dynamics. However, the current study is the first to attempt to explain the spatial and temporal variations in slope and curvature in terms of seasonal variations in moisture availability and demand. Furthermore, it confirms that the conclusions of Steele-Dunne et al. (2019) can be extended to a wide range of cover types.
Results show that the unique viewing geometry of ASCAT provides valuable insight into vegetation water dynamics across a diverse range of ecoregions. The timing of the seasonal cycle of normalized backscatter was consistent with that of GRACE EWT, with the maximum (minimum) normalized backscatter coinciding with the maximum (minimum) EWT in all ecoregions. Spatial patterns in the mean and range of the slope reflect the ecoregions within the study area. The seasonal cycle in the slope was found to follow the moisture availability and demand indicated by meteorological data and their influence on phenology. A detailed analysis per land cover type over the Cerrado demonstrated this. Slope dynamics were concurrent with precipitation in croplands and herbaceous cover, although herbaceous cover showed a second peak coinciding with the maximum in radiation. Slope dynamics in shrubs and forest corresponded with radiation, although the onset in increasing slope preceded the onset of increasing radiation. This may be due to leaf flushing, but it is difficult to draw a firmer conclusion given the limited availability of ground data (Chave et al., 2010). While the mechanism driving these variations in slope may not be immediately clear, it is important to note that there are open questions around the process of litterfall and its relation to precipitation and radiation in general. A recent study from Hashimoto et al. (2021) demonstrated that the temporal density of optical data from the Advanced Baseline Imager (ABI) on board the Geostationary Operational Environmental Satellite 16 (GOES-16) yields unprecedented detail on the seasonality of the normalized difference vegetation index (NDVI) and LAI in the evergreen Amazon forests. A comparison of ASCAT slope and curvature and ABI data may yield additional insight into the connection between slope, curvature, and litterfall in the various ecoregions of our study area. Consistent with the findings of Steele-Dunne et al. (2019) in a study limited to grasslands, variations in curvature seem to be related to phenological change. The highest values of curvature coincide with periods of high evaporative demand (e.g., high radiation, lower humidity, and lower precipitation). This suggests a link between curvature and phenological changes such as leaf flushing and litterfall. For example, the curvature peak in July in the rainforest occurs during rising insolation and coincides with leaf flushing. Areas affected by seasonal flooding exhibited dramatic changes in both backscatter and curvature due to a suspected increase in multiple scattering between water on the surface and the vegetation.
Diurnal variations (i.e., the difference between morning and evening overpasses) were generally small, particularly in the evergreen forests. Nonetheless, their relation to the timing of precipitation highlights the importance of overpass time in using microwave observations for vegetation monitoring. Diurnal differences in backscatter during the dry season are dominated by transpiration losses. Long-term monitoring of these diurnal differences could provide insight into moisture availability and its influence on transpiration and vegetation functioning (Konings et al., 2021). Consistent with previous studies on the effect of drought on the backscatter signal over the Amazon forests (Frolking et al., 2011; Saatchi et al., 2013), a negative anomaly in backscatter was observed during the 2010 and 2015 drought; although this was minor for the moist forests, strong anomalies were observed in the Cerrado. The slope showed positive anomalies during the drought events in the Cerrado, similar to positive anomalies in VOD over forests observed by Liu et al. (2018), who attributed this to enhanced canopy growth due to increased radiation. Persistent positive anomalies in radiation were observed over the Cerrado, especially in 2015. The analysis confirms the confounding effects of mechanisms driving variation in slope in these regions.
For regions with non-closed-canopy conditions and significant soil contribution, the water sensitivity of the slope and curvature may be influenced, or even dominated, by soil moisture dynamics (Greimeister-Pfeil et al., 2022). Furthermore, the various storage compartments (soil and vegetation) are linked by the soil–plant–atmosphere system. An improved physical understanding of the influence of both soil and vegetation on slope and curvature is essential. Future research should also include forward electro-magnetic modeling of multi-angular backscatter (i.e., slope and curvature) to improve our understanding of how they relate to vegetation water and biomass variations and soil moisture.
The improved understanding of the slope and curvature gained in this study is valuable in terms of our ability to use ASCAT for vegetation monitoring and specifically for vegetation water dynamics. Slope and curvature may be influenced by the number and distribution of the scatterers, and their dielectric properties, all of which influence the optical depth, i.e., the attenuation of the signal by the vegetation. Our improved understanding of the slope and curvature and how they are affected by vegetation structure and water content and interactions between the soil and vegetation is essential to improve our ability to interpret and optimally use VOD derived from ASCAT. Therefore, this research contributes directly to the continued development of the ASCAT VOD products. For example, it provides further insights in the VOD calculated from ASCAT by Vreugdenhil et al. (2016), where the main temporal dynamics stem from the slope and curvature. Furthermore, the fact that the slope and curvature themselves reveal different aspects of the vegetation response to the balance between moisture availability and demand means they are potentially useful low-level observables, i.e., they are obtained with minimal processing and avoid the assumptions and simplifications required to retrieve geophysical variables. The results of this study suggest that their information content can be directly exploited to monitor vegetation water dynamics. The current study was performed over different land cover types, demonstrating the potential to study vegetation water dynamics with these observables over different regions. However this research also confirms the need for further research to overcome the limited understanding of the spatiotemporal dynamics of the slope compared to environmental drivers and effects in structure of vegetation. A lot of our understanding of the incidence angle dependence of backscatter is based on experiments with tower-based or airborne radar systems conducted in the 1970s to 1990s (e.g., Ulaby, 1975; Ferrazzoli et al., 1992) to optimize the design of spaceborne radar systems. However, these experiments were generally focused on classification, soil moisture, or LAI/biomass retrieval. Radar data were limited in space and/or time, and water dynamics (beyond soil moisture) were often not considered. Recent studies have focused on the relation between water dynamics in vegetation and tower-based radar backscatter response (e.g., Vermunt et al., 2020; Khabbazan et al., 2022) but not at the slope of the backscatter incidence angle relationship. So, in any first-order ground validation, we advocate the inclusion of incidence angle dependence. Nonetheless, field-based experimental campaigns have the disadvantage that they are very localized. Thus, studies, like the one presented here, to explore ASCAT dynamic vegetation parameters and explain the variations in terms of modeled or observed geophysical variables are equally valuable and needed because they allow us to study a wide range of cover and climate types and the impact of events such as drought. Based on this, and considering the planned SCA instrument on Metop-SG, incidence angle variations should be studied in more detail and be considered as a potentially valuable source of useful information. Ongoing research is focused on using data-driven and radiative transfer modeling approaches to investigate the sensitivity of the slope and curvature to physical changes at the land surface including also different regions and cover types.
As input for the slope and curvature calculation with the WAter Retrieval Package developed by TU Wien, the ASCAT Level 1 Sigma0 resampled at 12.5 km Swath Grid – Metop – Global calibrated backscatter data are used. These data are available from the EUMETSAT data centre.
The supplement related to this article is available online at: https://doi.org/10.5194/hess-26-2997-2022-supplement.
AP, SCSD, and MV were responsible for the conceptualization, methodology, formal analysis, investigation, visualization, and writing (original draft preparation). SH provided resources (ASCAT data). RO contributed to the investigation. SCSD and MV provided supervision. All authors contributed to writing (review and editing) the paper.
The contact author has declared that neither they nor their co-authors have any competing interests.
Publisher's note: Copernicus Publications remains neutral with regard to jurisdictional claims in published maps and institutional affiliations.
This article is part of the special issue “Microwave remote sensing for improved understanding of vegetation–water interactions (BG/HESS inter-journal SI)”. It is a result of the EGU General Assembly 2020, 3–8 May 2020.
Susan Steele-Dunne has been supported by the Netherlands Organization for Scientific Research (NWO) User Support Programme Space Research (project no. ALWGO.2018.036 – “A new perspective on global vegetation water dynamics from radar satellite data”) and NWO Vidi Grant 14126. Mariette Vreugdenhil has been supported by ESA's Living Planet Fellowship SHRED (contract no. 4000125441/18/I-NS).
This paper was edited by Julia K. Green and reviewed by two anonymous referees.
Andela, N., Liu, Y. Y., van Dijk, A. I. J. M., de Jeu, R. A. M., and McVicar, T. R.: Global changes in dryland vegetation dynamics (1988–2008) assessed by satellite remote sensing: comparing a new passive microwave vegetation density record with reflective greenness data, Biogeosciences, 10, 6657–6676, https://doi.org/10.5194/bg-10-6657-2013, 2013. a
Anderson, C., Figa, J., Bonekamp, H., Wilson, J. J. W., Verspeek, J., Stoffelen, A., and Portabella, M.: Validation of Backscatter Measurements from the Advanced Scatterometer on MetOp-A, J. Atmos. Ocean. Tech., 29, 77–88, https://doi.org/10.1175/JTECH-D-11-00020.1, 2011. a
Attema, E. P.: The active microwave instrument on-board the ERS-1 satellite, Proc. IEEE, 79, 791–799, 1991. a
Birrer, I., Bracalente, E., Dome, G., Sweet, J., and Berthold, G.: σ signature of the Amazon rain forest obtained from the SeaSat scatterometer, IEEE T. Geosci. Remote, GE-20, 11–17, 1982. a, b
Borchert, R., Calle, Z., Strahler, A. H., Baertschi, A., Magill, R. E., Broadhead, J. S., Kamau, J., Njoroge, J., and Muthuri, C.: Insolation and photoperiodic control of tree development near the equator, New Phytol., 205, 7–13, 2015. a, b
Bradley, A. V., Gerard, F. F., Barbier, N., Weedon, G. P., Anderson, L. O., Huntingford, C., Aragão, L. E., Zelazowski, P., and Arai, E.: Relationships between phenology, radiation and precipitation in the Amazon region, Global Change Biol., 17, 2245–2260, 2011. a, b
Buchhorn, M., Smets, B., Bertels, L., Roo, B. D., Lesiv, M., Tsendbazar, N.-E., Herold, M., and Fritz, S.: Copernicus Global Land Service: Land Cover 100 m: collection 3: epoch 2015: Globe, Zenodo [data set], https://doi.org/10.5281/zenodo.3939038, 2020. a, b
Camarão, A. P., Lourenço Júnior, J. D. B., and Dutra, S.: Flooded pasture production for grazing buffalo in the brazilian Amazon region, in: Embrapa Amazônia Oriental-Artigo em anais de congresso (ALICE), Belém, 68–82, https://www.alice.cnptia.embrapa.br/alice/handle/doc/403437 (last access: 14 June 2022), 2002. a
Chaparro, D., Duveiller, G., Piles, M., Cescatti, A., Vall-llossera, M., Camps, A., and Entekhabi, D.: Sensitivity of L-band vegetation optical depth to carbon stocks in tropical forests: a comparison to higher frequencies and optical indices, Remote Sens. Environ., 232, 111303, https://doi.org/10.1016/j.rse.2019.111303, 2019. a, b
Chave, J., Navarrete, D., Almeida, S., Álvarez, E., Aragão, L. E. O. C., Bonal, D., Châtelet, P., Silva-Espejo, J. E., Goret, J.-Y., von Hildebrand, P., Jiménez, E., Patiño, S., Peñuela, M. C., Phillips, O. L., Stevenson, P., and Malhi, Y.: Regional and seasonal patterns of litterfall in tropical South America, Biogeosciences, 7, 43–55, https://doi.org/10.5194/bg-7-43-2010, 2010. a, b
De Jeu, R. A.: Retrieval of land surface parameters using passive microwave remote sensing, PhD thesis, Vrije Universiteit, Amsterdam, ISBN 9090164308, 2003. a
Eiten, G.: The cerrado vegetation of Brazil, Bot. Rev., 38, 201–341, 1972. a
Fernandez-Moran, R., Al-Yaari, A., Mialon, A., Mahmoodi, A., Al Bitar, A., De Lannoy, G., Rodriguez-Fernandez, N., Lopez-Baeza, E., Kerr, Y., and Wigneron, J.-P.: SMOS-IC: An Alternative SMOS Soil Moisture and Vegetation Optical Depth Product, Remote Sens., 9, 457, https://doi.org/10.3390/rs9050457, 2017. a
Ferrazzoli, P., Paloscia, S., Pampaloni, P., Schiavon, G., Solimini, D., and Coppo, P.: Sensitivity of microwave measurements to vegetation biomass and soil moisture content: a case study, IEEE Transactions on Geoscience and Remote Sens., 30, 750–756, 1992. a
Figa-Saldaña, J., Wilson, J. J., Attema, E., Gelsthorpe, R., Drinkwater, M. R., and Stoffelen, A.: The advanced scatterometer (ASCAT) on the meteorological operational (MetOp) platform: A follow on for European wind scatterometers, Can. J. Remote Sens., 28, 404–412, 2002. a
Forkel, M., Andela, N., Harrison, S. P., Lasslop, G., van Marle, M., Chuvieco, E., Dorigo, W., Forrest, M., Hantson, S., Heil, A., Li, F., Melton, J., Sitch, S., Yue, C., and Arneth, A.: Emergent relationships with respect to burned area in global satellite observations and fire-enabled vegetation models, Biogeosciences, 16, 57–76, https://doi.org/10.5194/bg-16-57-2019, 2019. a
Friesen, J., Steele-Dunne, S. C., and van de Giesen, N.: Diurnal differences in global ERS scatterometer backscatter observations of the land surface, IEEE T. Geosci. Remote, 50, 2595–2602, 2012. a
Frison, P.-L. and Mougin, E.: Use of ERS-1 wind scatterometer data over land surfaces, IEEE T. Geosci. Remote, 34, 550–560, 1996. a
Frison, P. L., Mougin, E., and Hiernaux, P.: Observations and interpretation of seasonal ERS-1 wind scatterometer data over northern Sahel (Mali), Remote Sens. Environ., 63, 233–242, 1998. a
Frolking, S., Milliman, T., Palace, M., Wisser, D., Lammers, R., and Fahnestock, M.: Tropical forest backscatter anomaly evident in SeaWinds scatterometer morning overpass data during 2005 drought in Amazonia, Remote Sens. Environ., 115, 897–907, 2011. a, b
Frolking, S., Hagen, S., Braswell, B., Milliman, T., Herrick, C., Peterson, S., Roberts, D., Keller, M., and Palace, M.: Evaluating multiple causes of persistent low microwave backscatter from Amazon forests after the 2005 drought, PloS One, 12, e0183308, https://doi.org/10.1371/journal.pone.0183308, 2017. a
Greimeister-Pfeil, I., Wagner, W., Quast, R., Hahn, S., Steele-Dunne, S., and Vreugdenhil, M.: Analysis of short-term soil moisture effects on the ASCAT backscatter-incidence angle dependence, Sci. Remote Sens., 5, 100053, https://doi.org/10.1016/j.srs.2022.100053, 2022. a
Hahn, S., Reimer, C., Vreugdenhil, M., Melzer, T., and Wagner, W.: Dynamic characterization of the incidence angle dependence of backscatter using metop ASCAT, IEEE J. Select. Top. Appl. Earth Obs. Remote Sens., 10, 2348–2359, 2017. a, b, c, d
Hamilton, S. K., Sippel, S. J., and Melack, J. M.: Seasonal inundation patterns in two large savanna floodplains of South America: the Llanos de Moxos (Bolivia) and the Llanos del Orinoco (Venezuela and Colombia), Hydrol. Process., 18, 2103–2116, 2004. a
Hashimoto, H., Wang, W., Dungan, J. L., Li, S., Michaelis, A. R., Takenaka, H., Higuchi, A., Myneni, R. B., and Nemani, R. R.: New generation geostationary satellite observations support seasonality in greenness of the Amazon evergreen forests, Nat. Commun., 12, 684, https://doi.org/10.1038/s41467-021-20994-y, 2021. a
Hawkins, R., Attema, E., Crapolicchio, R., Lecomte, P., Closa, J., Meadows, P., and Srivastava, S.: Stability of Amazon Backscatter at C-Band: Spaceborne Results from ERS- and RADARSAT-1, in: SAR workshop: CEOS Committee on Earth Observation Satellites, vol. 450, p. 99, https://earth.esa.int/eogateway/documents/20142/37627/p103.pdf (last access: 14 June 2022), 2000. a
Hordijk, I., Meijer, F., Nissen, E., Boorsma, T., and Poorter, L.: Cattle affect regeneration of the palm species Attalea princeps in a Bolivian forest–savanna mosaic, Biotropica, 51, 28–38, 2019. a
Huffman, G. J., Adler, R. F., Bolvin, D. T., and Gu, G.: Improving the global precipitation record: GPCP Version 2.1, Geophys. Res. Lett., 36, L17808, https://doi.org/10.1029/2009GL040000, 2009. a
Jackson, T. J., Schmugge, T. J., and Wang, J. R.: Passive microwave sensing of soil moisture under vegetation canopies, Water Resour. Res., 18, 1137–1142, https://doi.org/10.1029/WR018i004p01137, 1982. a
Jarlan, L., Mougin, E., Frison, P. L., Mazzega, P., and Hiernaux, P.: Analysis of ERS wind scatterometer time series over Sahel (Mali), Remote Sens. Environ., 81, 404–415, https://doi.org/10.1016/S0034-4257(02)00015-9, 2002. a
Jiménez-Muñoz, J. C., Mattar, C., Barichivich, J., Santamaría-Artigas, A., Takahashi, K., Malhi, Y., Sobrino, J. A., and Van Der Schrier, G.: Record-breaking warming and extreme drought in the Amazon rainforest during the course of El Niño 2015–2016, Sci. Rep., 6, 33130, https://doi.org/10.1038/srep33130, 2016. a, b
Kennett, R. G. and Li, F. K.: Seasat over-land scatterometer data. II. Selection of extended area and land-target sites for the calibration of spaceborne scatterometers, IEEE T. Geosci. Remote, 27, 779–788, 1989. a
Khabbazan, S., Steele-Dunne, S. C., Vermunt, P., Judge, J., Vreugdenhil, M., and Gao, G.: The influence of surface canopy water on the relationship between L-band backscatter and biophysical variables in agricultural monitoring, Remote Sens. Environ., 268, 112789, https://doi.org/10.1016/j.rse.2021.112789, 2022. a
Konings, A. G., Piles, M., Rötzer, K., McColl, K. A., Chan, S. K., and Entekhabi, D.: Vegetation optical depth and scattering albedo retrieval using time series of dual-polarized L-band radiometer observations, Remote Sens. Environ., 172, 178–189, https://doi.org/10.1016/j.rse.2015.11.009, 2016. a
Konings, A. G., Rao, K., and Steele-Dunne, S. C.: Macro to micro: microwave remote sensing of plant water content for physiology and ecology, New Phytol., 223, 1166–1172, https://doi.org/10.1111/nph.15808, 2019. a, b
Konings, A. G., Saatchi, S. S., Frankenberg, C., Keller, M., Leshyk, V., Anderegg, W. R., Humphrey, V., Matheny, A. M., Trugman, A., Sack, L., Agee, E., Barnes, M. L., Binks, O., Cawse-Nicholson, K., Christoffersen, B. O., Entekhabi, D., Gentine, P., Holtzman, N. M., Katul, G. G., Liu, Y., Longo, M., Martinez-Vilalta, J., McDowell, N., Meir, P., Mencuccini, M., Mrad, A., Novick, K. A., Oliveira, R. S., Siqueira, P., Steele-Dunne, S. C., Thompson, D. R., Wang, Y., Wehr, R., Wood, J. D., Xu, X., and Zuidema, P. A.: Detecting forest response to droughts with global observations of vegetation water content, Global Change Biol., 27, 6005–6024, https://doi.org/10.1111/gcb.15872, 2021. a
Landerer, F. W. and Swenson, S.: Accuracy of scaled GRACE terrestrial water storage estimates, Water Resour. Res., 48, W04531, https://doi.org/10.1029/2011WR011453, 2012. a
Liu, Y. Y., de Jeu, R. A., McCabe, M. F., Evans, J. P., and van Dijk, A. I.: Global long-term passive microwave satellite-based retrievals of vegetation optical depth, Geophys. Res. Let., 38, L18402, https://doi.org/10.1029/2011GL048684, 2011. a
Liu, Y. Y., Dijk, A. I., McCabe, M. F., Evans, J. P., and Jeu, R. A.: Global vegetation biomass change (1988–2008) and attribution to environmental and human drivers, Global Ecol. Biogeogr., 22, 692–705, https://doi.org/10.1111/geb.12024, 2013. a
Liu, Y. Y., Van Dijk, A. I., De Jeu, R. A., Canadell, J. G., McCabe, M. F., Evans, J. P., and Wang, G.: Recent reversal in loss of global terrestrial biomass, Nat. Clim. Change, 5, 470–474, 2015. a
Liu, Y. Y., van Dijk, A. I., Miralles, D. G., McCabe, M. F., Evans, J. P., de Jeu, R. A., Gentine, P., Huete, A., Parinussa, R. M., Wang, L., Guan, K., Berry, J., and Restrepo-Coupe, N.: Enhanced canopy growth precedes senescence in 2005 and 2010 Amazonian droughts, Remote Sens. Environ., 211, 26–37, https://doi.org/10.1016/j.rse.2018.03.035, 2018. a, b, c, d
Marengo, J. A., Tomasella, J., Alves, L. M., Soares, W. R., and Rodriguez, D. A.: The drought of 2010 in the context of historical droughts in the Amazon region, Geophys. Res. Lett., 38, L12703, https://doi.org/10.1029/2011GL047436, 2011. a
McNairn, H., Van der Sanden, J. J., Brown, R. J., and Ellis, J.: The potential of RADARSAT-2 for crop mapping and assessing crop condition, in: Second International Conference on Geospatial Information in Agriculture and Forestry, Lake Buena Vista, 10–12 January 2000, Florida, ftp://ftp.geogratis.gc.ca/pub/nrcan_rncan/publications/STPublications_PublicationsST/219/219589/4716.pdf (last access: 14 June 2022), 2000. a
Metzler, T.: Vegetation Modelling in WARP 6.0, in: Proc. EUMETSAT Meteorological Satellite Conf., September 2013, Vienna, Austria, 1–7, https://www-cdn.eumetsat.int/files/2020-04/pdf_conf_p_s1_07_melzer_v.pdf (last access: 14 June 2022), 2013. a, b
Moesinger, L., Dorigo, W., de Jeu, R., van der Schalie, R., Scanlon, T., Teubner, I., and Forkel, M.: The global long-term microwave Vegetation Optical Depth Climate Archive (VODCA), Earth Syst. Sci. Data, 12, 177–196, https://doi.org/10.5194/essd-12-177-2020, 2020. a
Naeimi, V., Scipal, K., Bartalis, Z., Hasenauer, S., and Wagner, W.: An Improved Soil Moisture Retrieval Algorithm for ERS and METOP Scatterometer Observations, IEEE T. Geosci. Remote, 47, 1999–2013, https://doi.org/10.1109/TGRS.2008.2011617, 2009. a, b
Nemani, R. R., Keeling, C. D., Hashimoto, H., Jolly, W. M., Piper, S. C., Tucker, C. J., Myneni, R. B., and Running, S. W.: Climate-driven increases in global terrestrial net primary production from 1982 to 1999, Science, 300, 1560–1563, 2003. a, b
Oliveira, R., Bezerra, L., Davidson, E., Pinto, F., Klink, C., Nepstad, D., and Moreira, A.: Deep root function in soil water dynamics in cerrado savannas of central Brazil, Funct. Ecol., 19, 574–581, 2005. a
Olson, D. M., Dinerstein, E., Wikramanayake, E. D., Burgess, N. D., Powell, G. V., Underwood, E. C., D'amico, J. A., Itoua, I., Strand, H. E., Morrison, J. C., Loucks, C. J.. Allnutt, T. F., Ricketts, T. H., Kura, Y., Lamoreux, J. F., Wettengel, W. W., Hedao, P., and Kassem, K. R: Terrestrial Ecoregions of the World: A New Map of Life on Earth A new global map of terrestrial ecoregions provides an innovative tool for conserving biodiversity, BioScience, 51, 933–938, https://doi.org/10.1641/0006-3568(2001)051[0933:TEOTWA]2.0.CO;2, 2001. a, b
Owe, M., de Jeu, R., and Walker, J.: A methodology for surface soil moisture and vegetation optical depth retrieval using the microwave polarization difference index, IEEE T. Geosci. Remote, 39, 1643–1654, 2001. a, b
Panisset, J. S., Libonati, R., Gouveia, C. M. P., Machado-Silva, F., França, D. A., França, J. R. A., and Peres, L. F.: Contrasting patterns of the extreme drought episodes of 2005, 2010 and 2015 in the Amazon Basin, Int. J. Climatol., 38, 1096–1104, 2018. a, b
Peel, M. C., Finlayson, B. L., and McMahon, T. A.: Updated world map of the Köppen–Geiger climate classification, Hydrol. Earth Syst. Sci., 11, 1633–1644, https://doi.org/10.5194/hess-11-1633-2007, 2007. a
Pfeil, I., Wagner, W., Forkel, M., Dorigo, W., and Vreugdenhil, M.: Does ASCAT observe the spring reactivation in temperate deciduous broadleaf forests?, Remote Sens. Environ., 250, 112042, https://doi.org/10.1016/j.rse.2020.112042, 2020. a
Rao, K., Anderegg, W. R. L., Sala, A., Martínez-Vilalta, J., and Konings, A. G.: Satellite-based vegetation optical depth as an indicator of drought-driven tree mortality, Remote Sens. Environ., 227, 125–136, https://doi.org/10.1016/j.rse.2019.03.026, 2019. a, b
Romatschke, U. and Houze Jr., R. A.: Characteristics of precipitating convective systems accounting for the summer rainfall of tropical and subtropical South America, J. Hydrometeorol., 14, 25–46, 2013. a, b
Saatchi, S., Asefi-Najafabady, S., Malhi, Y., Aragão, L. E., Anderson, L. O., Myneni, R. B., and Nemani, R.: Persistent effects of a severe drought on Amazonian forest canopy, P. Natl. Acad. Sci. USA, 110, 565–570, 2013. a, b, c
Schroeder, R., McDonald, K. C., Azarderakhsh, M., and Zimmermann, R.: ASCAT MetOp-A diurnal backscatter observations of recent vegetation drought patterns over the contiguous US: An assessment of spatial extent and relationship with precipitation and crop yield, Remote Sents. Environ., 177, 153–159, 2016. a
Sheffield, J., Goteti, G., and Wood, E. F.: Development of a 50-year high-resolution global dataset of meteorological forcings for land surface modeling, J. Climate, 19, 3088–3111, 2006. a
Soares, B. S., Nepstad, D. C., Curran, L. M., Cerqueira, G. C., Garcia, R. A., Ramos, C. A., Voll, E., McDonald, A., Lefebvre, P., and Schlesinger, P.: Modelling conservation in the Amazon basin, Nature, 440, 520–523, 2006. a
Steele-Dunne, S. C., Friesen, J., and van de Giesen, N.: Using diurnal variation in backscatter to detect vegetation water stress, IEEE T. Geosci. Remote, 50, 2618–2629, 2012. a
Steele-Dunne, S. C., McNairn, H., Monsivais-Huertero, A., Judge, J., Liu, P.-W., and Papathanassiou, K.: Radar remote sensing of agricultural canopies: A review, IEEE J. Select. Top. Appl. Earth Obs. Remote Sens., 10, 2249–2273, 2017. a
Steele-Dunne, S. C., Hahn, S., Wagner, W., and Vreugdenhil, M.: Investigating vegetation water dynamics and drought using Metop ASCAT over the North American Grasslands, Remote Sens. Environ., 224, 219–235, 2019. a, b, c, d, e, f, g
Stoffelen, A., Aaboe, S., Calvet, J.-C., Cotton, J., De Chiara, G., Saldana, J. F., Mouche, A. A., Portabella, M., Scipal, K., and Wagner, W.: Scientific developments and the EPS-SG scatterometer, IEEE J. Select. Top. Appl. Earth Obs. Remote Sens., 10, 2086–2097, 2017. a
Swenson, S. and Wahr, J.: Post-processing removal of correlated errors in GRACE data, Geophys. Res. Lett., 33, L08402, https://doi.org/10.1029/2005GL025285, 2006. a
Templ, B., Koch, E., Bolmgren, K., Ungersböck, M., Paul, A., Scheifinger, H., Busto, M., Chmielewski, F.-M., Hájková, L., Hodzić, S., Kaspar, F., Pietragalla, B., Romero-Fresneda, R., Tolvanen, A., Vučetič, V., Zimmermann, K., and Zust, A.: Pan European Phenological database (PEP725): a single point of access for European data, Int. J. Climatol., 62, 1109–1113, 2018. a
Teubner, I., Forkel, M., Jung, M., Liu, Y., Miralles, D., Parinussa, R., van der Schalie, R., Vreugdenhil, M., Schwalm, C., Tramontana, G., Camps-Valls, G., and Dorigo, W.: Assessing the relationship between microwave vegetation optical depth and gross primary production, Int. J. Appl. Earth Obs. Geoinform., 65, 79–91, https://doi.org/10.1016/j.jag.2017.10.006, 2018. a
Teubner, I., Forkel, M., Camps-Valls, G., Jung, M., Miralles, D., Tramontana, G., van der Schalie, R., Vreugdenhil, M., Mösinger, L., and Dorigo, W.: A carbon sink-driven approach to estimate gross primary production from microwave satellite observations, Remote Sens. Environ., 229, 100–113, https://doi.org/10.1016/j.rse.2019.04.022, 2019. a
Tian, F., Brandt, M., Liu, Y. Y., Verger, A., Tagesson, T., Diouf, A. A., Rasmussen, K., Mbow, C., Wang, Y., and Fensholt, R.: Remote sensing of vegetation dynamics in drylands: Evaluating vegetation optical depth (VOD) using AVHRR NDVI and in situ green biomass data over West African Sahel, Remote Sens. Environ., 177, 265–276, https://doi.org/10.1016/j.rse.2016.02.056, 2016. a
Townsend, P.: Relationships between forest structure and the detection of flood inundation in forested wetlands using C-band SAR, Int. J. Remote Sens., 23, 443–460, 2002. a
TU Wien, Department of Geodesy and Geoinformation: Soil WAter Retrieval Package (WARP): v5.10.0, 2022. a
Ulaby, F.: Radar response to vegetation, IEEE T. Antenn. Propagat., 23, 36–45, https://doi.org/10.1109/TAP.1975.1140999, 1975. a
Vermunt, P. C., Khabbazan, S., Steele-Dunne, S. C., Judge, J., Monsivais-Huertero, A., Guerriero, L., and Liu, P.-W.: Response of Subdaily L-Band Backscatter to Internal and Surface Canopy Water Dynamics, IEEE T. Geosci. Remote, 59, 7322–7337, https://doi.org/10.1109/TGRS.2020.3035881, 2020. a
Vreugdenhil, M., Dorigo, W. A., Wagner, W., De Jeu, R. A., Hahn, S., and Van Marle, M. J.: Analyzing the vegetation parameterization in the TU-Wien ASCAT soil moisture retrieval, IEEE T. Geosci. Remote , 54, 3513–3531, 2016. a, b
Wagner, F. H., Hérault, B., Bonal, D., Stahl, C., Anderson, L. O., Baker, T. R., Becker, G. S., Beeckman, H., Boanerges Souza, D., Botosso, P. C., Bowman, D. M. J. S., Bräuning, A., Brede, B., Brown, F. I., Camarero, J. J., Camargo, P. B., Cardoso, F. C. G., Carvalho, F. A., Castro, W., Chagas, R. K., Chave, J., Chidumayo, E. N., Clark, D. A., Costa, F. R. C., Couralet, C., da Silva Mauricio, P. H., Dalitz, H., de Castro, V. R., de Freitas Milani, J. E., de Oliveira, E. C., de Souza Arruda, L., Devineau, J.-L., Drew, D. M., Dünisch, O., Durigan, G., Elifuraha, E., Fedele, M., Ferreira Fedele, L., Figueiredo Filho, A., Finger, C. A. G., Franco, A. C., Freitas Júnior, J. L., Galvão, F., Gebrekirstos, A., Gliniars, R., Graça, P. M. L. D. A., Griffiths, A. D., Grogan, J., Guan, K., Homeier, J., Kanieski, M. R., Kho, L. K., Koenig, J., Kohler, S. V., Krepkowski, J., Lemos-Filho, J. P., Lieberman, D., Lieberman, M. E., Lisi, C. S., Longhi Santos, T., López Ayala, J. L., Maeda, E. E., Malhi, Y., Maria, V. R. B., Marques, M. C. M., Marques, R., Maza Chamba, H., Mbwambo, L., Melgaço, K. L. L., Mendivelso, H. A., Murphy, B. P., O'Brien, J. J., Oberbauer, S. F., Okada, N., Pélissier, R., Prior, L. D., Roig, F. A., Ross, M., Rossatto, D. R., Rossi, V., Rowland, L., Rutishauser, E., Santana, H., Schulze, M., Selhorst, D., Silva, W. R., Silveira, M., Spannl, S., Swaine, M. D., Toledo, J. J., Toledo, M. M., Toledo, M., Toma, T., Tomazello Filho, M., Valdez Hernández, J. I., Verbesselt, J., Vieira, S. A., Vincent, G., Volkmer de Castilho, C., Volland, F., Worbes, M., Zanon, M. L. B., and Aragão, L. E. O. C.: Climate seasonality limits leaf carbon assimilation and wood productivity in tropical forests, Biogeosciences, 13, 2537–2562, https://doi.org/10.5194/bg-13-2537-2016, 2016. a, b
Wagner, W., Lemoine, G., Borgeaud, M., and Rott, H.: A study of vegetation cover effects on ERS scatterometer data, IEEE T. Geosci. Remote, 37, 938–948, 1999. a, b
Wagner, W., Hahn, S., Kidd, R., Melzer, T., Bartalis, Z., Hasenauer, S., Figa-Saldaña, J., de Rosnay, P., Jann, A., Schneider, S., Komma, J., Kubu, G., Brugger, K., Aubrecht, C., Züger, J., Gangkofner, U., Kienberger, S., Brocca, L., Wang, Y., Blöschl, G., Eitzinger, J., Steinnocher, K., Zeil, P., and Rubel, F.: The ASCAT Soil Moisture Product: A Review of Its Specifications, Validation Results, and Emerging Applications, Meteorol. Z., 22, 5–33, https://doi.org/10.1127/0941-2948/2013/0399, 2013. a, b
Wahr, J., Molenaar, M., and Bryan, F.: Time variability of the Earth's gravity field: Hydrological and oceanic effects and their possible detection using GRACE, J. Geophys. Res.-Solid, 103, 30205–30229, 1998. a
Wismann, V. R., Boehnke, K., and Schmullius, C.: Monitoring ecological dynamics in Africa with the ERS-1 scatterometer, in: IEEE 1995 International Geoscience and Remote Sensing Symposium, IGARSS'95, Quantitative Remote Sensing for Science and Applications, vol. 2, 10–14 July 1995, 1523–1525, https://doi.org/10.1109/IGARSS.1995.521798, 1995. a
Woodhouse, I. ., van der Sanden, J. J., and Hoekman, D. H.: Scatterometer observations of seasonal backscatter variation over tropical rain forest, IEEE T. Geosci. Remote, 37, 859–861, 1999. a
Wright, S. J. and Van Schaik, C. P.: Light and the phenology of tropical trees, Am. Nat., 143, 192–199, 1994. a
WWF: Terrestrial Ecoregions|Biome Categories|WWF, https://files.worldwildlife.org/wwfcmsprod/files/Publication/file/6kcchn7e3u_official_teow.zip?_ga=2.266153039.1704052247.1654773215-2069422009.1654773214 (last access: 6 June 2022), 2019. a