the Creative Commons Attribution 4.0 License.
the Creative Commons Attribution 4.0 License.
 | 23 May 2022
Event controls on intermittent streamflow in a temperate climate
Nils Hinrich Kaplan
Theresa Blume
Markus Weiler
Intermittent streams represent a substantial part of the total stream network, and their occurrence is expected to increase due to climate change. Thus, it is of high relevance to provide detailed information on the temporal and spatial controls of streamflow intermittency to support management decisions. This study presents an event-based analysis of streamflow responses in intermittent streams in a mesoscale catchment with a temperate climate. Based on the streamflow responses, precipitation events were classified into flow or no-flow classes. Response controls like precipitation, soil moisture, and temperature were used as predictors in a random forest model to identify the temporally changing factors that explain streamflow intermittency at the event scale. Soil moisture was the most important predictor, but the predictor importance varied with the geology in the catchment. Streamflow responses in the slate geology were controlled by soil moisture in the shallow and deep soil layers, while streamflow in the marl geology was primarily controlled by soil moisture in the upper soil layer. Streamflow responses in catchments underlain by both marl and sandstone were dependent on soil moisture, whereas streamflow in the only catchment with a pure sandstone geology depended on precipitation characteristics. In all slate and marl catchments, streamflow intermittency also varied with soil temperature, which is probably a proxy for seasonal changes in evapotranspiration and an indicator of freezing conditions. Our findings underline the importance of using high temporal resolution data and tailored event definitions that account for the fast changes between flow/no flow in intermittent streams to identify streamflow controls at the event scale.
- Article
(5826 KB) - Full-text XML
- Companion paper
-
Supplement
(1933 KB) - BibTeX
- EndNote


The scientific literature contains a variety of terms to define the different degrees of streamflow intermittency for streams that cease to flow during certain parts of the year, including temporary, ephemeral, seasonal, and episodic streams and intermittent rivers (Uys and O'Keeffe, 1997; Costigan et al., 2016; Datry et al., 2017; Fritz et al., 2020). This study follows the definition of Busch et al. (2020), who define an intermittent river as follows:
a non-perennial river or stream with a considerable connection to the groundwater table, having variable cycles of wetting and flow cessation, and with flow that is sustained longer than a single storm event. These waterways are hydrologically gaining the majority of the time, when considering long term flow patterns.
Accordingly, an ephemeral stream is defined as follows:
a type of non-perennial river or stream without a considerable groundwater connection that flows for a short period of time, typically only after precipitation events. These waterways are hydrologically losing the majority of the time when considering long term flow patterns. (Busch et al., 2020)
Inputs in the form of subsurface stormflow and overland flow as an immediate response to precipitation events are frequently mentioned as the predominant source of streamflow in ephemeral reaches (e.g. Boulton et al., 2017; Zimmer and McGlynn, 2017), whereas streamflow in intermittent streams is dominantly driven by the seasonal fluctuations of the near-surface groundwater table, snowmelt contributions, or monsoon seasoning (e.g. Uys and O'Keeffe, 1997; Sophocleous, 2002; Goodrich et al., 2018; Fritz et al., 2020). The stream network changes its spatial extent with the wetting and drying of these intermittent and ephemeral reaches. Even larger perennial rivers are becoming intermittent as a result of climate change, and the number of intermittent streams is expected to increase in the future (Datry et al., 2014; Reynolds et al., 2015). Climate, geology, soil, topography, and land use have been identified as major spatial controls of streamflow intermittency (Olson and Brouillette, 2006; Reynolds et al., 2015; Trancoso et al., 2016; Costigan et al., 2016; Zimmer and McGlynn, 2017; Ward et al., 2018; Jaeger et al., 2019; Gutiérrez-Jurado et al., 2019, 2021; Prancevic and Kirchner, 2019; Kaplan et al., 2020a). The temporal dynamics of streamflow result from fluctuating contributions of groundwater and precipitation event inputs (overland flow and subsurface stormflow), depending on the antecedent wetness state of the catchment (e.g. Zehe et al., 2007; Zimmermann et al., 2014).
Although extensive research on overland flow and subsurface stormflow generation at the hillslope and reach scale, as well as baseflow contributions to perennial streams, has been conducted, there are still few studies on the dynamic controls of flow occurrence in ephemeral and intermittent reaches (James and Roulet, 2009; Zimmer and McGlynn, 2017). Studies of intermittent streams can be roughly categorised into the following four scales: (1) continental-scale studies based on discharge measurements (Reynolds et al., 2015; Eng et al., 2016; Trancoso et al., 2016; Jaeger et al., 2019), (2) (nested) catchment-scale studies based on wet/dry mapping of the stream network (Godsey and Kirchner, 2014; Sando and Blasch, 2015; Shaw, 2016; Goodrich et al., 2018; Jensen et al., 2017, 2018), (3) single-site or hillslope-scale studies based on conventional discharge measurements (Sidle et al., 1995; Ries et al., 2017; Moreno-de-las-Heras et al., 2020), and (4) (multi)catchment- scale studies that are based on continuous measurements of streamflow presence and absence with low-cost sensors (i.e. temperature, electric conductivity, or flow sensors and time-lapse cameras) at multiple locations along the stream to monitor the intermittent stream network (Jaeger and Olden, 2012; Zimmermann et al., 2014; Zimmer and McGlynn, 2017; Jensen et al., 2019; Kaplan et al., 2020a). The continental-scale studies are based on datasets from environmental agencies, which are usually not specifically dedicated to intermittent streams (Reynolds et al., 2015; Eng et al., 2016; Trancoso et al., 2016; Jaeger et al., 2019). These studies of streamflow intermittency commonly use statistical models to predict the extent of the intermittent stream network by incorporating the climatic controls at a coarse temporal resolution. Climatic controls include mean or total annual precipitation (Reynolds et al., 2015; Trancoso et al., 2016; Jaeger et al., 2019), the annual average number of days of measurable precipitation (Reynolds et al., 2015), snowpack persistence, from, for example, March to July/August, or the contribution of snow to annual precipitation (Reynolds et al., 2015; Sando and Blasch, 2015; Jaeger et al., 2019), annual evapotranspiration (Trancoso et al., 2016), and dryness or the seasonality index (Trancoso et al., 2016). These climatic predictors are used to identify the likelihood of the stream network being spatially intermittent (Reynolds et al., 2015; Trancoso et al., 2016; Jaeger et al., 2019) or to identify long-term changes in streamflow intermittency under a changing climate (Eng et al., 2016). Reynolds et al. (2015) found a generally poor agreement of single climate predictors and zero-flow days in the Upper Colorado River basin and emphasised the importance of interplay between the composite of precipitation and temperature to predict zero-flow days. They also highlighted the high correlation between the Palmer drought severity index and the degree of stream intermittency. Eng et al. (2016) identified different types of intermittent streams in the USA based on the climatic seasonality that was, in some cases, overwritten by catchment characteristics (e.g. local geology). They found intermittency in fall to winter to be primarily caused by precipitation storage in the form of snow and ice with streamflow, starting with the onset of snowmelt and sustained only by the stored snow. On the contrary, the summer-to-winter intermittency was mainly caused by periods of low precipitation coinciding with maximum potential evaporation. Similar precipitation events that did not initiate flow during the summer-to-winter streamflow intermittency were able to cause flow later in the year when the soil moisture content was higher due to antecedent precipitation events. Nonseasonal intermittent streams mainly appeared in regions with high precipitation variability and large water deficits caused by high evapotranspiration (Eng et al., 2016). Jaeger et al. (2019) presented a regional-scale model approach for the Pacific Northwest of the USA and found that total annual precipitation, minimum annual temperature and the percent forest cover were the most important predictors for flow permanence, while submodels for specific regions highlight the importance of evapotranspiration during the drier months. The regional variation in continental-scale intermittency in eastern Australia could be best described by the dryness index (Budyko, 1974) and photosynthetically active radiation (fPAR), while soil properties had a significant effect on streamflow intermittency at the regional scale (Trancoso et al., 2016).
The (nested) catchment-scale studies often rely on a limited number of wet/dry mapping campaigns of the stream network (Godsey and Kirchner, 2014; Sando and Blasch, 2015; Shaw, 2016; Goodrich et al., 2018; Jensen et al., 2017, 2018; Durighetto et al., 2020). These data are used to validated models that predict the dynamics of the wetted channel network. Predictors used in these models vary from the discharge (Godsey and Kirchner, 2014; Jensen et al., 2017) or the recession rate at the catchment outlet (Shaw, 2016) to the groundwater recharge data (Goodrich et al., 2018). However, the drainage network extent does not necessarily correspond to the timing of the streamflow recession, as shown by Shaw (2016) for a headwater catchment in the state of New York. Shaw (2016) noticed the presence of seeps at the channel head of multiple subchannels that contributed to flow, even when the lower reaches ceased to flow. This suggests the presence of multiple perched water tables due to the structure of the subsurface (i.e. geological layering and bedrock fractures) and contribute to channel flow at the seeps (Shaw, 2016). The importance of geology on the occurrence of intermittent streamflow was also shown in other climatic settings (Buttle et al., 2012; Jensen et al., 2017; Durighetto et al., 2020). Rainfall timing and intensity were good predictors of stream network dynamics in an Alpine headwater catchment, whereas evapotranspiration had little predictive power (Durighetto et al., 2020).
In hillslope-scale studies, streamflow is usually measured continuously with conventional streamflow gauges at a single site or in nested subcatchments and hillslopes (Sidle et al., 1995; Ries et al., 2017; Moreno-de-las-Heras et al., 2020). The streamflow dynamics are typically analysed in combination with high temporal resolution soil moisture data (Penna et al., 2011; Ries et a., 2017; Zimmer and McGlynn, 2017), local shallow groundwater measurements (Zimmer and McGlynn, 2017; Sidle et al., 1995), or subsurface flow observations at a trench (Sidle et al., 1995), as well as high-resolution precipitation data. These studies aim towards a separation of streamflow into contributions of Hortonian overland flow (HOF), saturation excess overland flow (SOF), subsurface stormflow (SSF), and groundwater contributions at the event scale. The dependence of runoff initiation on thresholds of antecedent soil moisture at 10–30 cm depth was demonstrated for several climates, topographies, and land use characteristics (James and Roulet, 2009; Penna et al., 2011). Ries et al. (2017) showed, for Mediterranean ephemeral streams, that precipitation sums during a precipitation event below 50 mm lead to local Hortonian runoff. Above this threshold, streamflow was primarily explained by bedrock permeability, soil water storage and rainfall intensity, and a predominance of SOF with only small contributions of HOF. The importance of storage variability was also highlighted by Zimmer and McGlynn (2017), who found seasonally distinct flow paths, depending on the catchment storage state. These seasonal fluctuations in catchment storage were driven by the changes in evapotranspiration. Precipitation events that occurred at low antecedent storage resulted in HOF at the beginning of the event, followed by SOF, with contributions from shallow perched groundwater at the upper hillslope. During more saturated conditions, the deeper groundwater provided baseflow before and after a precipitation event, and all stormflow was SOF and the stream network extended to its maximum length, including zero-order hollows.
Some of the recent studies on streamflow intermittency were based on streamflow duration data captured by newly developed sensor technology, such as electric conductivity (EC), temperature sensors, self-made flow-detection sensors, or time-lapse cameras along the stream network (Jaeger and Olden 2012; Zimmermann et al., 2014; Bhamjee et al., 2016; Zimmer and McGlynn, 2017; Jensen et al., 2019; Kaplan et al., 2020a; Warix et al., 2021). For example, Jaeger and Olden (2012) studied the temporal dynamics of longitudinal connectivity and streamflow continuity in the stream network based on the temporal high and spatially coarse (2 km spacing) resolution data of streamflow presence and absence. They found that the stream location within the channel network (headwater vs. lower parts) had a higher explanatory power to differentiate between perennial and non-perennial streams than geology. Recent studies have broadened the initial approaches to event-based analyses and the inclusion of additional measures by including the antecedent precipitation index (API) to describe the antecedent wetness state of the catchment and precipitation measures like rainfall amount, intensity, and duration (Zimmermann et al., 2014; Jensen et al., 2019). These studies also had a smaller sensor spacing ranging from 5 to 40 m. Jensen et al. (2019) found that 60 % of the variance in the maximum wetted fraction of the stream network during precipitation events was explained by 7 to 30 d antecedent precipitation and 16 % by the precipitation amount. Zimmermann et al. (2014) modelled the connectivity of the drainage network at the event scale using precipitation characteristics (i.e. event duration, maximum precipitation intensity, and total rainfall) and API as predictors. They furthermore identified total rainfall and maximum precipitation intensity as the major controls, and the long-term antecedent wetness (API including 128 d prior to the event) as a minor control, of drainage network connectivity (i.e., the total active stream length divided by the maximum length of the channel network). Warix et al. (2021) found a poor correlation between groundwater residence time and seasonal flow permanence in semi-arid catchments in southwestern Idaho that are underlain by volcanics, basalt, and latite. They observed continuous streamflow at some reaches due to seasonally stable groundwater inputs. The seasonal flow permanence in these catchments was highly correlated with topographic metrics (contributing area, slope, and topographic wetness index), but groundwater and topography only explained half of the observed variability in streamflow intermittency.
Although the understanding of streamflow intermittency and drainage network connectivity been addressed by the different types of studies at the continental scale, headwater catchment and hillslope-scale studies of intermittency in mesoscale catchments in temperate climates still remain scarce. With this study, we aim to close the research gap of temporally variable drivers of intermittent streams in temperate climates and diverse geologies. We benefit from a large dataset of observations on the presence or absence of flow (Kaplan et al., 2019a), high-resolution precipitation (Neuper and Ehret, 2019), soil moisture, and temperature data (Zehe et al., 2014; Demand et al., 2019; Mälicke et al., 2020) collected in the mesoscale Attert catchment. In a previous study, the three distinct main geologies were identified as being major spatial controls of streamflow intermittency (Kaplan et al., 2020a). We now take this a step further and evaluate the relationship between geology and the temporal predictors of streamflow intermittency. Following the approaches of Zimmermann et al. (2014) and Jensen et al. (2019), we present an event-based analysis of precipitation and streamflow responses. Similar to their approaches, measures of antecedent precipitation and precipitation event characteristics are considered, but we also include soil moisture and soil temperature in a random forest modelling approach. We aim to answer the following questions: (1) which types of rainfall events trigger a streamflow response in intermittent streams and which do not? (2) What are the main dynamic controls (or predictors) of streamflow in intermittent streams? (3) Are the controls of intermittent streamflow dependent on the geological setting?
The Attert catchment is located in the midwest of Luxembourg, with a minor area located in Belgium, and has a catchment area of 247 km2 at the outlet at Useldange (Hellebrand et al., 2008). Devonian slate is the dominant bedrock in the northern part of the catchment in the Luxembourg Ardennes, the central part consists of Keuper marl, and the southern part is conformed of the Jurassic Luxembourg sandstone formation (Fig. 1; Martínez-Carreras et al., 2012). The elevation is highest in the Ardennes and Luxembourg sandstone formation at 549 and 440 m a.s.l. (above sea level), respectively, while the outlet in Useldange has an elevation of 245 m a.s.l. (Martínez-Carreras et al., 2012; Pfister et al., 2018). The Luxembourg Ardennes are characterised by steep inclined valleys with forested hillslopes (approx. 15–25∘) and plateaus with agricultural land use. The central part of the catchment consists of gentle hills (slope ca. 3∘) that are mainly used for agriculture, grassland, and forest. The sandstone areas are characterised by steep hillslopes that are dominantly forested and, in the lower part, used as grassland and for agriculture (Kaplan et al., 2020a). Soils in the Attert catchment are linked to lithology, land cover, and land use (Cammeraat et al., 2018). Soils in the slate geology are dominated by stony silty soils, while the soils in Keuper marl have a silty clayey texture, and the Luxembourg sandstone region is largely covered by sandy and silty soils (Müller et al., 2016). On slate, the soil depth to the weathered C horizon is usually less than 50 cm, while the soils on the marl are more heterogeneous, with a clay-rich layer (>50 % clay) starting between 20 and 50 cm depth (Demand et al., 2019). The soil depth to the unweathered bedrock can reach more than 2 m in sandstone, and Bt horizons are often deeper than 1 m (Sprenger et al., 2015).

Figure 1Geology and stream network of the Attert catchment and the locations of streamflow monitoring at artificial channels, forest roads, and natural channels, as well as the soil moisture and temperature measurement sites. Sites with intermittent flow were used for analyses in this study, while the sites with perennial flow were used as pour point sites to delineate the catchment boundaries for the eight subcatchments of Noumtemerbaach, Colpach, Foulschterbaach, Beschruederbaach, Schammicht, Hei, Pall, and Schwebich (based on a 15 m DEM, the Hei catchment boundary is not visible due to the overlap with its label). The map sections show the more intensively instrumented areas in each geology, i.e. slate (blue frame), marl (red frame), and sandstone (green frame). Selected sites in the sandstone geology are labelled with the ID (e.g. SA1) that is used in the discussion. The geological map from 1947 was provided by the Geological Service of Luxembourg (adapted version from Kaplan et al., 2019a), the stream network was derived from a topographic map (Le Gouvernment du Grand-Duché de Luxembourg, 2009).
The climate is classified as pluvial oceanic (Wrede et al., 2015). Annual precipitation varies from 1000 mm in the northwest to roughly 800 mm in the southeast (Pfister et al., 2017). The mean monthly precipitation ranges from 70 mm, in August and September, to 100 mm, in December until February (Wrede et al., 2015). Evapotranspiration is higher during summer (82 mm in July, when the average temperature is 17 ∘C) and lowest in winter (13 mm in December, when the average temperature is 0 ∘C; Wrede et al., 2015). The seasonal fluctuations in precipitation and evapotranspiration influence the runoff regime, resulting in high flows during the winter season, while low flows occur in the summer (Wrede et al., 2015). Spatial differences in the seasonal variation in streamflow depend on the bedrock permeability, which controls the storage, mixing, and release of water in the Attert catchment (Pfister et al., 2017). The sandstone geology in the Attert catchment provides the largest total and active storage (defined as the maximum interannual variability in catchment storage) compared to marl and slate (Pfister et al., 2017). Thus, the sandstone geology has the lowest proportion of active storage compared to total storage (15 %–26 %), while this is higher in the slate (69 %–82 %) and marl (69 %). For nearby catchments on the Keuper marl, active storage is up to 100 % of total storage (Pfister et al., 2017).
Kaplan et al. (2020a) demonstrated the importance of bedrock permeability and soil hydraulic conductivity for streamflow intermittency in the Attert catchment. They also highlighted the potential of streamflow alteration through either artificial surface and subsurface drainage, dams, and trenches in the agricultural areas, as reported by Schaich et al. (2011), and flows from wastewater treatment plants on the plateaus of the Ardennes. The drainage density of the perennial stream network derived from the topographic map of the region (Le Gouvernment du Grand-Duché de Luxembourg, 2009) is 1.4 and 0.6 km km−2 for intermittent streams. The drainage density varies among the three geologies with 0.8 and 0.2 km km−2 for perennial and intermittent streams on sandstone, 0.7 and 0.3 km km−2 for perennial and intermittent streams on marl, and 1.0 and 1.0 km km−2 for perennial intermittent streams on slate.
3.1 Data acquisition
We used the intermittency dataset described in Kaplan et al. (2019a), which is a binary dataset of streamflow presence or absence for 182 gauging sites in the Attert catchment. These sites were predominantly located at natural streams but also comprise smaller channels at ditches and three sites in sandstone erosion channels on forest roads. Gauging sites at artificial channels were mainly located in the less natural landscape on the marl geology (see Fig. 1). Thus, the definition of intermittent or ephemeral stream channels in this study includes natural and artificial channels with occasional (ephemeral) surface runoff or intermittent streamflow as defined above (Sect. 1). The data were collected using various sensors, including time-lapse imagery (Dörr Snapshot Mini 5.0), electric conductivity (EC) sensors (modified Onset HOBO Pendant waterproof temperature and light data logger), and conventional gauges (METER Group, Inc./Decagon Devices CTD pressure transducers in stilling wells at weirs). Time-lapse imagery was predominantly installed at sites that were expected to have intermittent streamflow, EC sensors at locations with expected perennial flow, and conventional gauges at catchment outlets and close to the soil moisture measurement sites (Kaplan et al., 2019a). From the 182 sites of the original dataset, a subset of 54 gauges with intermittent streamflow was selected to comprise the sites which were monitored by time-lapse camera (C) and conventional gauges (CGs). To account for the definition of intermittent streamflow in Sect. 1, observed streamflow at gauging sites showing at least a period of 1 h with no flow are considered as intermittent. The subset was split into further subsets according to the dominant geology (slate, marl, and sandstone) of the upslope contributing area. For the different geological regions, these subsets comprised 22 gauging sites in slate, 23 in marl, and 9 in sandstone (see Figs. 1 and 3). The contributing area derived from geographic information system (GIS) analysis using a digital elevation model (DEM; 15 m resolution) of all intermittent streamflow gauging sites (Kaplan et al., 2020a) is shown in Fig. S1 in the Supplement. The streamflow data were aggregated from the original 15 min temporal resolution to 1 h intervals by calculating the mean of the binary values and rounding (threshold of 0.5) the resulting value to one digit, i.e. back to binary values ().
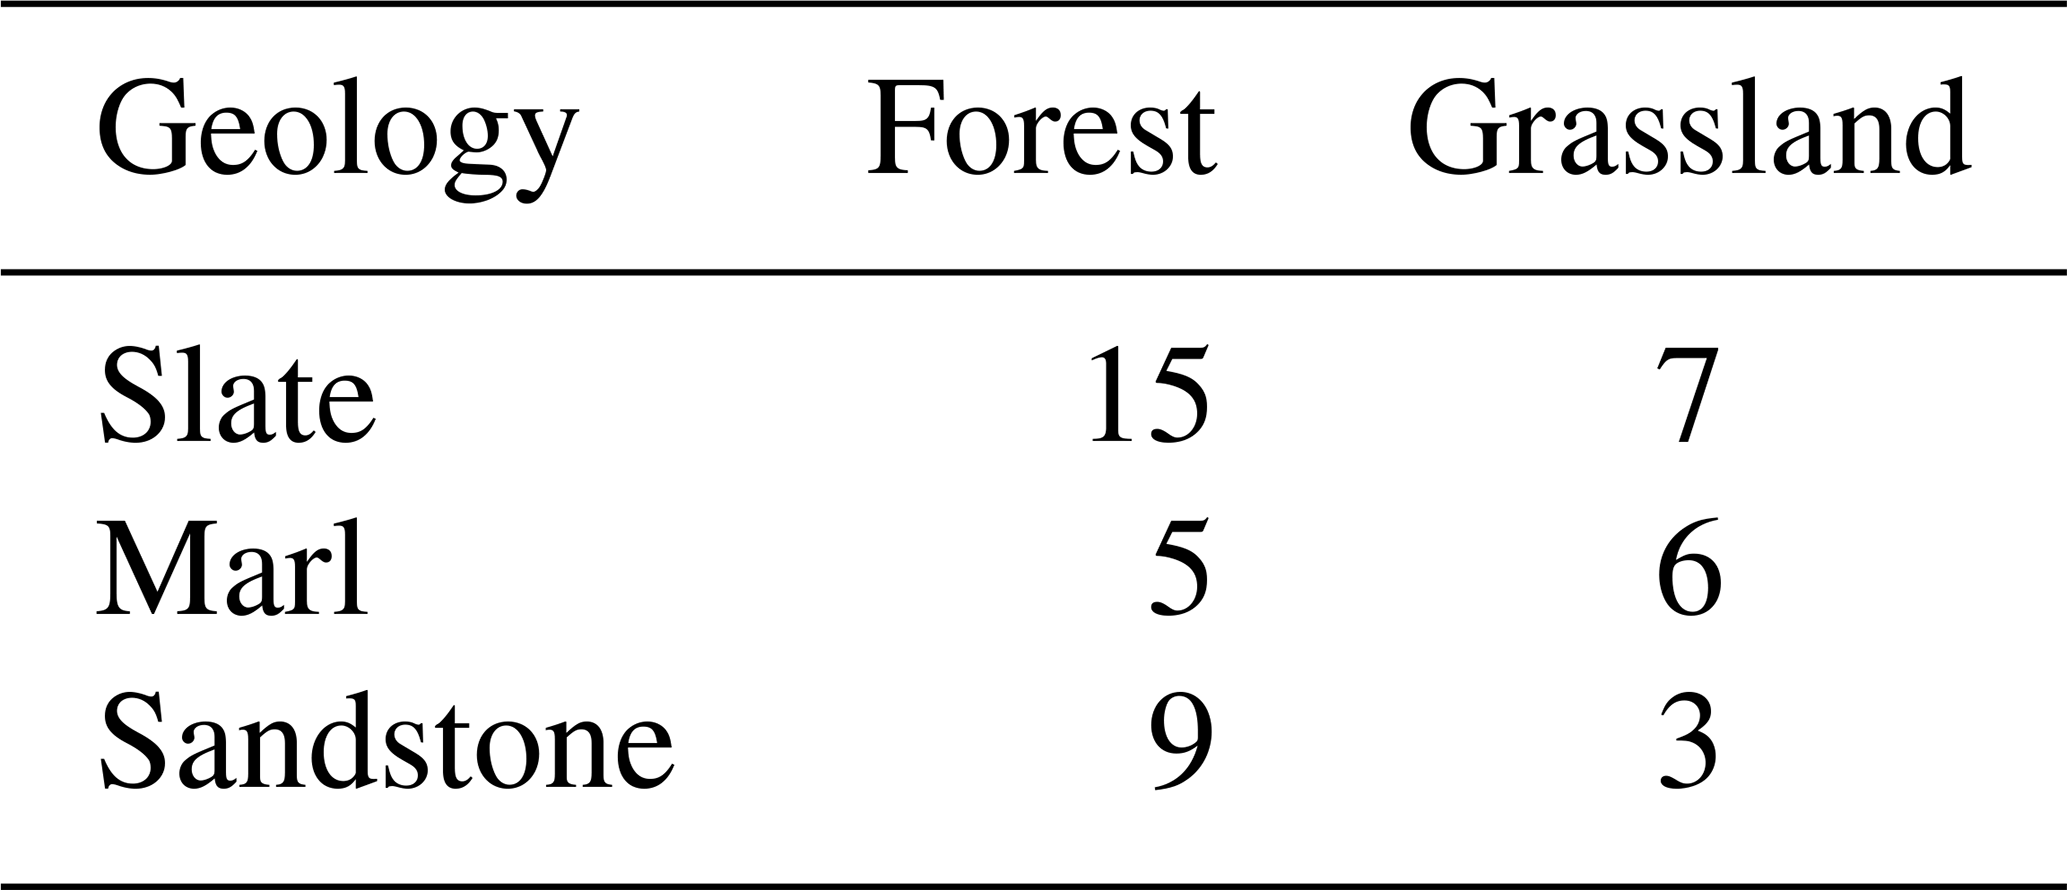
Soil moisture and soil temperature were measured at 45 sites (hereafter soil moisture sites) across the catchment, with each site consisting of three soil profiles (total of 135 soil profiles; Fig. 1). In each profile, combined soil moisture and temperature sensors were installed at 10, 30, and 50 cm below the surface, and recorded data have a temporal resolution of 5 min. The soil moisture sites were located in each of the three main geologies in the catchment in either forest or grassland (see Table 1). Combined, these two land cover classes represent the predominant land cover in the catchment (Kaplan et al., 2019a). In the marl and slate regions, agricultural land use has a substantial share of 41 % and 42 %. However, in agricultural land use permanent sensor installations are not feasible, and the natural stream network is heavily altered by artificial drainage systems. The soil moisture sites were chosen for the best possible representation of the combined land use and geology at a variety of slope gradients, expositions (north and south) and position along the slope (top, mid, and valley; Zehe et al., 2014). Overall, 11 sites were located in the marl region, 22 sites were in the slate region, and 12 sites in the sandstone, resulting in a total of 33, 66, and 36 soil moisture measurement profiles per geology, respectively (Table 1). Although these measurements do not include all land cover classes, the assumption was made that the sites represent the general soil moisture dynamics in the three geologies. The first measurements started in March 2012 to October 2013 and ended in February 2018. In this study, a subset of the data for the period from 1 April 2016 until 17 July 2017 was used because it had the largest overlap with the other data sources used in this study. Initially, 5TE capacitance soil moisture sensors (METER Group, Inc./Decagon Devices, USA) were installed, but due to the sensor malfunction, 43 sensors were replaced with SMT100 (TRUEBNER GmbH, Neustadt, Germany) and 9 sensors with GS3 sensors (Decagon Devices/METER Environment, USA) in 2016. The data were visually checked, and offsets between soil moisture measurements after sensor replacement were detected in four time series. Additionally, seven time series with strong sensor noise and/or extensive periods of constant soil moisture were removed from the dataset. The soil moisture values were normalised to the minimum and maximum of the time series for each sensor to avoid possible bias among sensors. Soil moisture dynamics at each geology are represented by the mean of the normalised time series for all sites located in the corresponding geology. The soil moisture data were aggregated to hourly means. The averaged soil moisture was assigned to the streamflow gauging sites based on the main geology in the upstream catchment area of each site.
Table 1Number of soil moisture and temperature measurement sites for each geology and land use. Each site has three soil profiles with soil moisture and temperature sensors at 10, 30, and 50 cm depth.
Neuper and Ehret (2019) estimated precipitation from weather radar data combined with data from six disdrometers, two micro rain radars, regular rain gauges, and weather radar reflectivity (for locations, see Fig. 1) using an information theory approach. This precipitation dataset was used in this study due to its high temporal (1 h) and spatial (100 m) resolution. The precipitation data from this gridded dataset were used at the locations of the intermittent stream gauging sites. The precipitation data at the gauging sites were thereafter used to calculate precipitation averages for the eight subcatchments (Fig. 1) for a catchment-scale analysis of precipitation events. Averages of the precipitation time series were calculated as the average of precipitation at all stream gauging sites within the catchment without further spatial interpolation.
3.2 Definition of precipitation events and streamflow response
In accordance with Wiekenkamp et al. (2016) and Demand et al. (2019), a precipitation event was defined as having a minimum precipitation sum of 1 mm. The required time period of no precipitation to separate two successive events was defined as 3 h after testing a set of four different values (3, 6, 12, and 24 h without rain; Penna et al., 2011, 2015; Demand et al., 2019). The maximum time between the start of a precipitation event and the start of the streamflow response was limited to 48 h after testing, with both 24 and 48 h as thresholds (Fig. 2). In the case of multiple precipitation events within 48 h before the streamflow response, the latest precipitation event before the streamflow response was chosen as the initialising precipitation event. The following characteristics were calculated for each event: cumulative antecedent precipitation (CAP) within 24 h before the precipitation event and the 7 and 14 d antecedent precipitation index (API), as follows:
with Pt as the precipitation during time step t, i the number of antecedent time steps (7 or 14 d), and k as a decay constant (Kohler and Linsley, 1951). Values for the decay constant usually range between 0.80 and 0.98 (Heggen, 2001). A value of 0.85 was chosen for this study to minimise the correlation between the API and CAP.
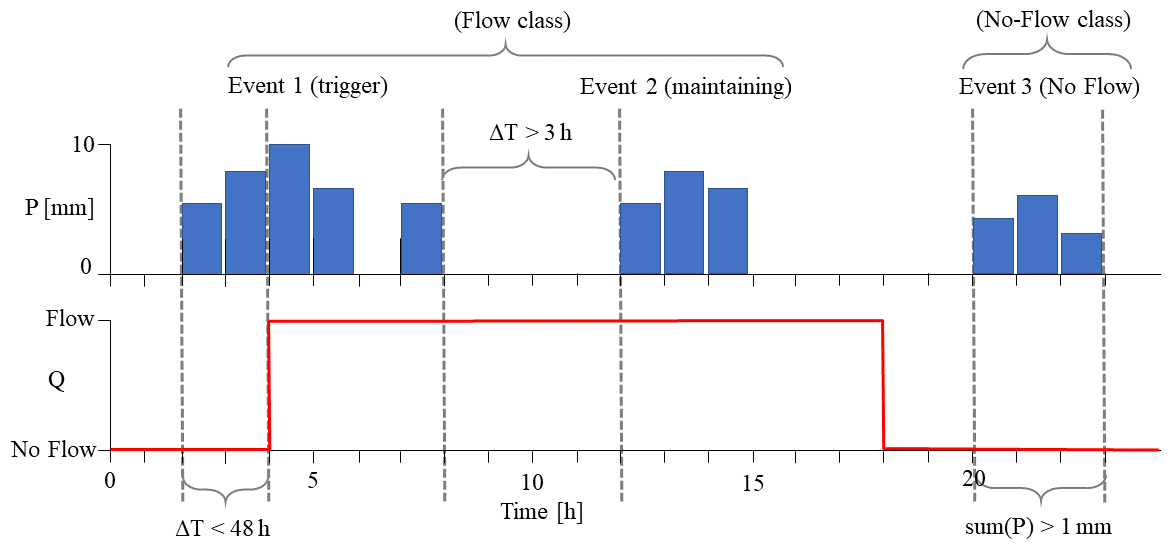
Figure 2Precipitation events are defined by a minimum precipitation sum of 1 mm separated by at least 3 h on no precipitation (ΔT>3 h). Flow events are assigned to the last precipitation event within a 48 h period before flow initialisation (ΔT<48 h). Precipitation events are classified as either triggering or maintaining events for the corresponding streamflow events and summarised in the flow class or classified as no flow in cases without streamflow response within 48 h after the start of the precipitation event.
Additional precipitation event characteristic included the maximum 1 h precipitation intensity (Pmax), mean precipitation intensity (Pmean), total sum of precipitation (Psum), duration of the precipitation event (PD), and the normalised soil moisture (averaged per geology) at 10 cm (θ10; Fig. S2), 30 cm (θ30), and 50 cm (θ50) depth at the first and last time step of the precipitation event, as well as the temporal minimum, mean, and maximum normalised soil moisture during the event. We also used the minimum soil temperature during the precipitation event (Tmin; Fig. S3) as a proxy of seasonal changes in temperature and the corresponding fluctuations in evapotranspiration (Wrede et al., 2015) and as a potential identifier of freezing conditions. The soil temperature was used due to its lower daily variability and lower dependence on the microclimate at the site to obtain a better representation of the average temperature for each geology.
Table 2Number of gauging sites per subcatchment, precipitation sums during the study period (1 April 2016 to 17 July 2017), and the percentage of catchment geology. The three main geological units do not always sum to 100 % due to the presence of other geologies and alluvium in the catchment.
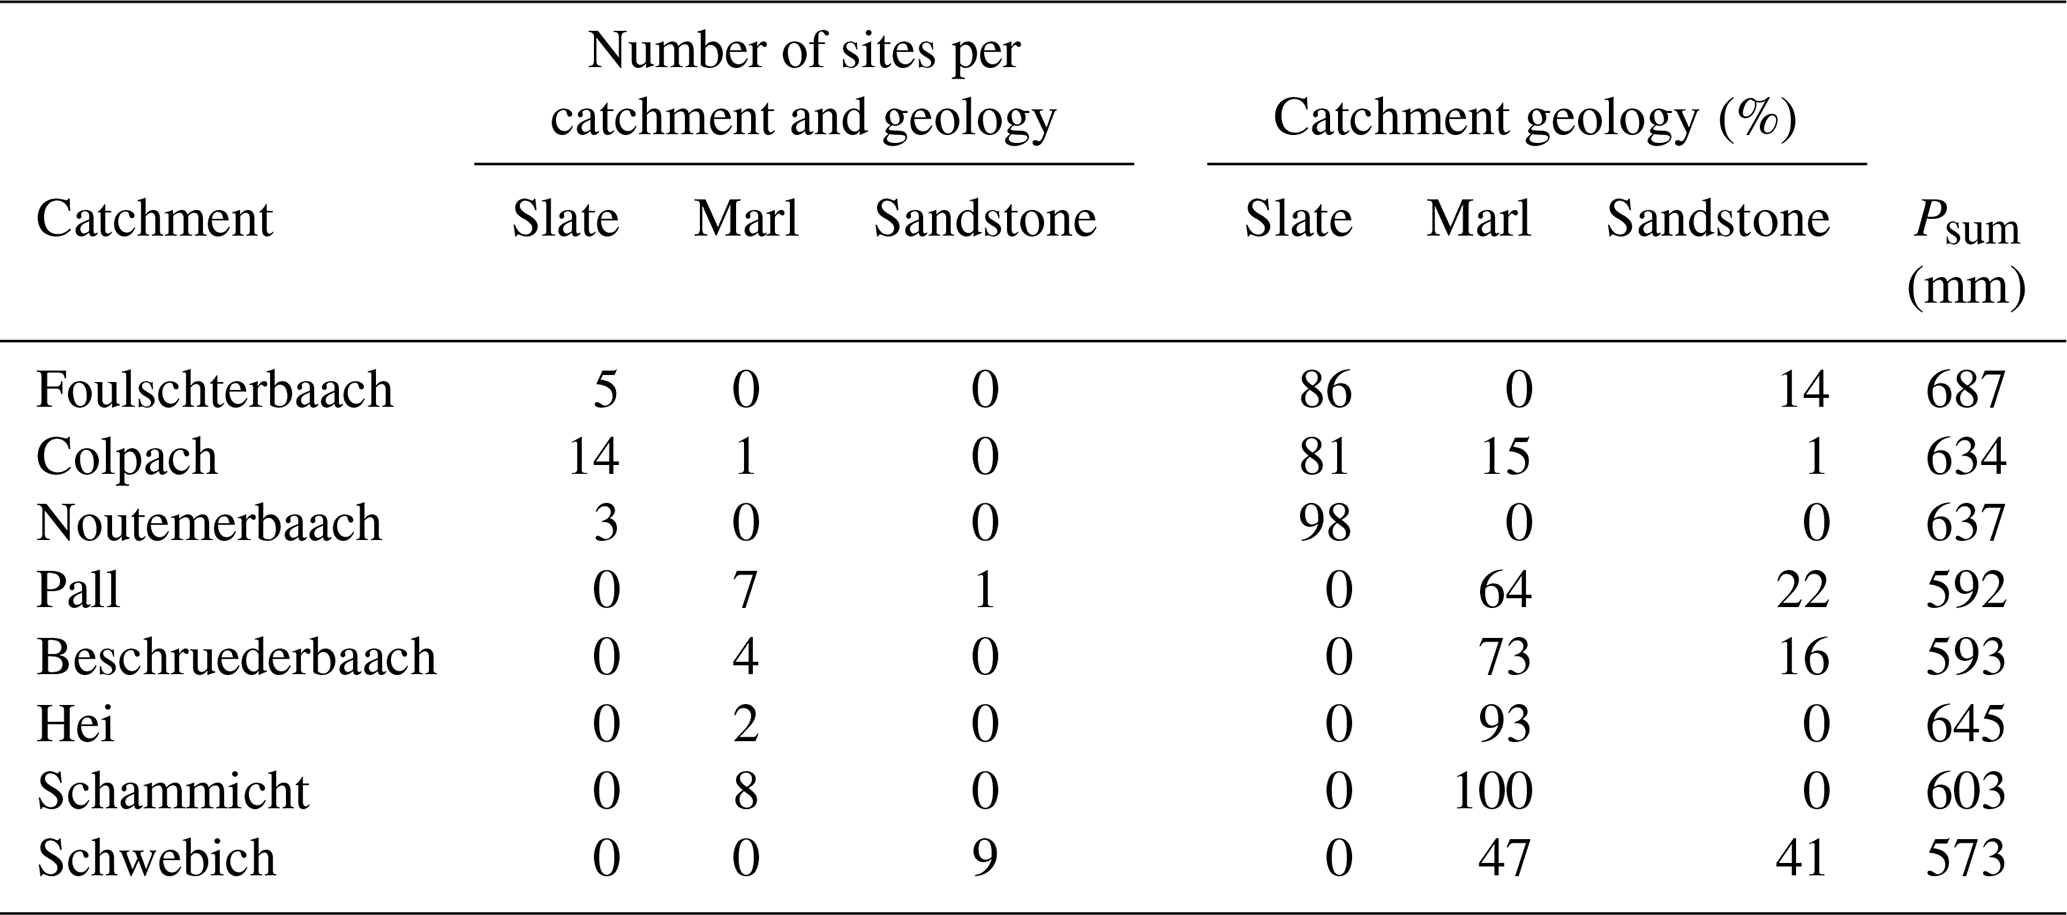
Events were classified according to the presence or absence of flow at the stream gauges. Precipitation events which triggered the initialisation of a streamflow response within 48 h after the start of the precipitation event – according to the definition above – were classified as flow initialising. Precipitation events without a flow response are classified as no flow. Those precipitation events that are classified neither as flow initialising nor as a no-flow response and happen while the stream is already flowing are classified as flow maintaining (Fig. 2). For the purpose of modelling streamflow responses, the two classes, flow initialising and flow maintaining, were merged into one response class named flow (Fig. 2) because we assume from the event data that the preconditions for flow initiation and maintenance are very similar. The precipitation event definition and streamflow classification were carried out for rainfall measured locally at the streamflow monitoring sites and for each of the eight subcatchments as the averaged precipitation at the single gauging sites within each of those catchments at Pall, Beschruederbaach, Hei, Schammicht (marl geology), Schwebich (sandstone geology), Noutemerbaach, Colpach, and Foulschterbaach (slate geology; Fig. 1; Table 2). For each subcatchment, there existed one precipitation dataset containing the same precipitation time series (averages of those at the sites) at each site; thus, identical precipitation events were derived for all sites within a subcatchment. The spatial aggregation of precipitation data is possible due to the very high correlation between the precipitation at the single sites in the subcatchments (Fig. S4). Thus, for each site, responses to the precipitation event can be flow, no flow or NA (not available) in cases of larger data gaps in the flow data.
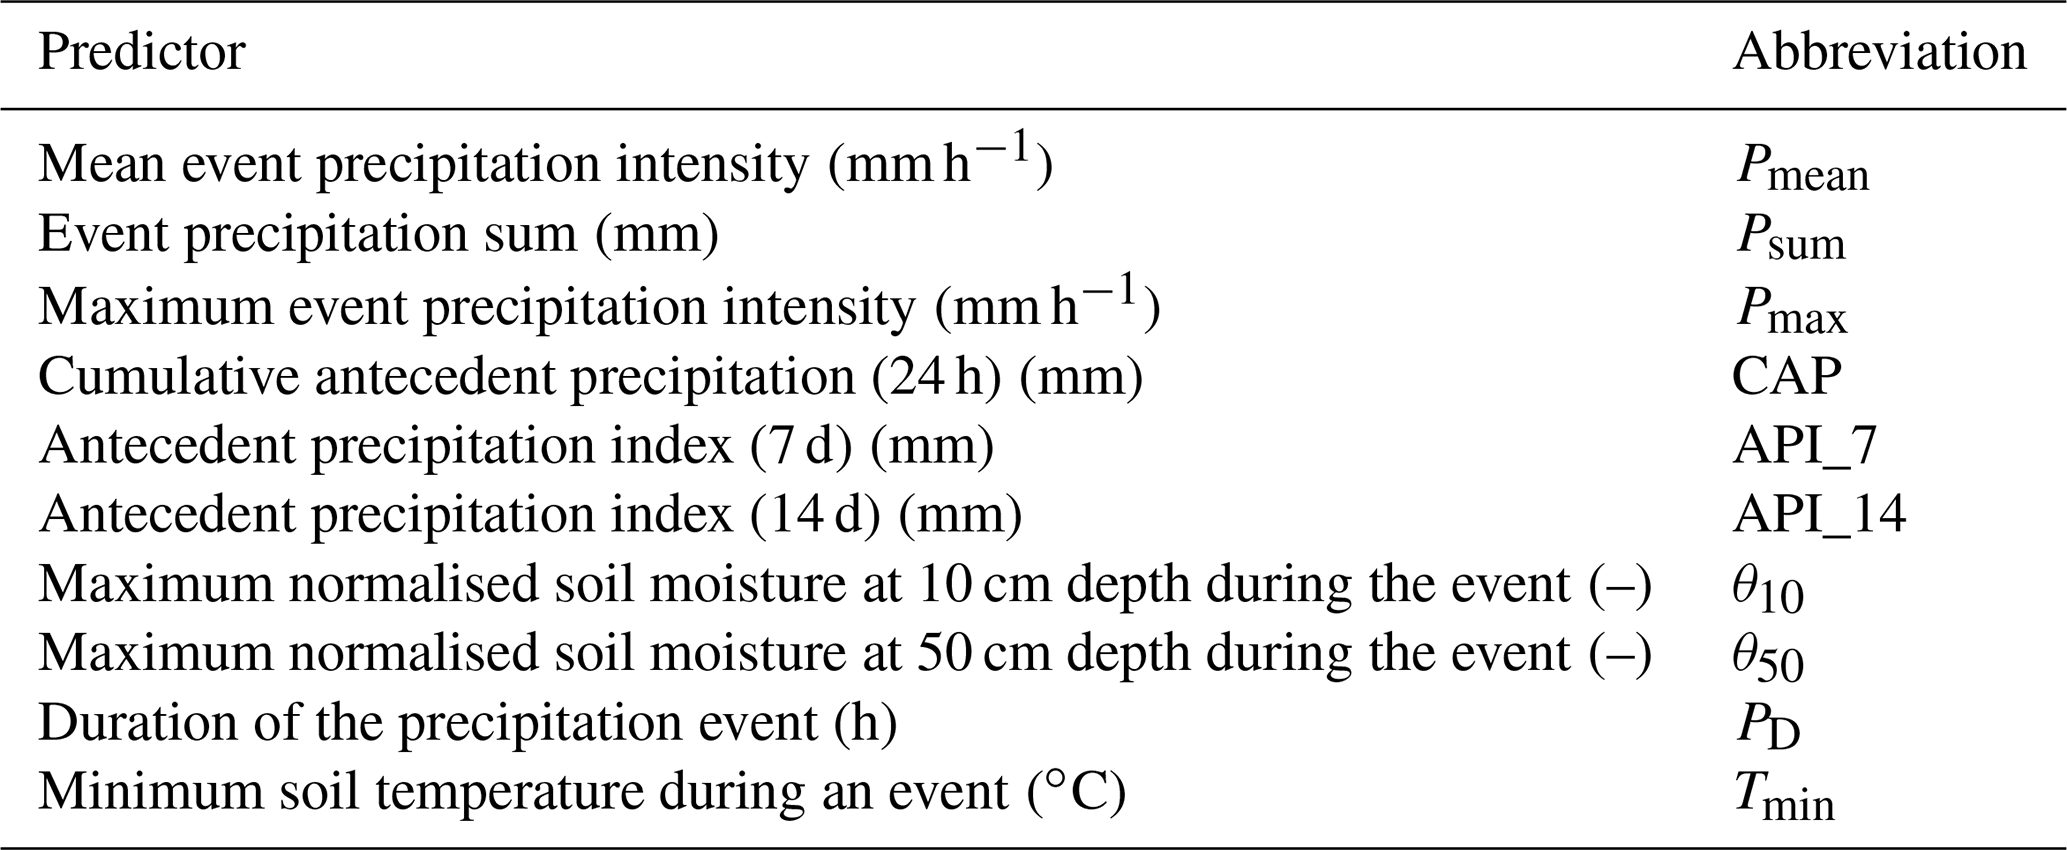
Table 3Predictor variables used in the random forest model selection.
3.3 Random forest model for intermittency
In general, a random forest (RF) model contains an ensemble of regression trees. Predictions of a RF model are based on the averaged predictions of all trees in the forest (Breiman, 2001). A RF model is created by bootstrapping several random samples from the original data and fitting a single classification tree to a bootstrapped sample (out-of-bag samples – OBB). Validation of the OBB classification is performed with the data that are not included in the bootstrap sample. These data are used for independent predictions for each OBB-based tree. From these predictions, the OBB error rate is calculated over all trees to provide a measure of the predictive performance of the model (Breiman, 2001).
Multiple RF models were used to model the classes of streamflow responses (flow or no flow) as a function of the predictor variables (Table 3). Table 3 includes the selected predictor variables. Only the maximum soil moisture, at 10 and 50 cm depth (θ10 and θ50), was selected due to high correlations (Kendall's τ>0.8) among the other soil moisture predictors, namely initial, end, minimum and mean soil moisture during a precipitation event in the different depths, and the high correlation between soil moisture at 10 and 50 cm with soil moisture at 30 cm (see Fig. S5). The correlation was low among most of the selected predictors for the RF model (Table 3); only the correlation between the soil moisture measures at the two depths and API for the two periods was higher for most sites (see Table 3; Figs. S6–S8). For each site, an individual random forest model with the dataset containing the classification of streamflow responses and the corresponding predictor variables was set up. This is necessary, as the number of complete precipitation events with streamflow responses varies considerably among the sites due to gaps in the streamflow observations and the variance in precipitation patterns and timing in the catchment (40 to 119 precipitation events; see Fig. 3 and Tables S1–S3 in the Supplement). Despite the varying number of precipitation events, the importance of temporal predictors on the streamflow responses to the precipitation events can still be analysed for each site.
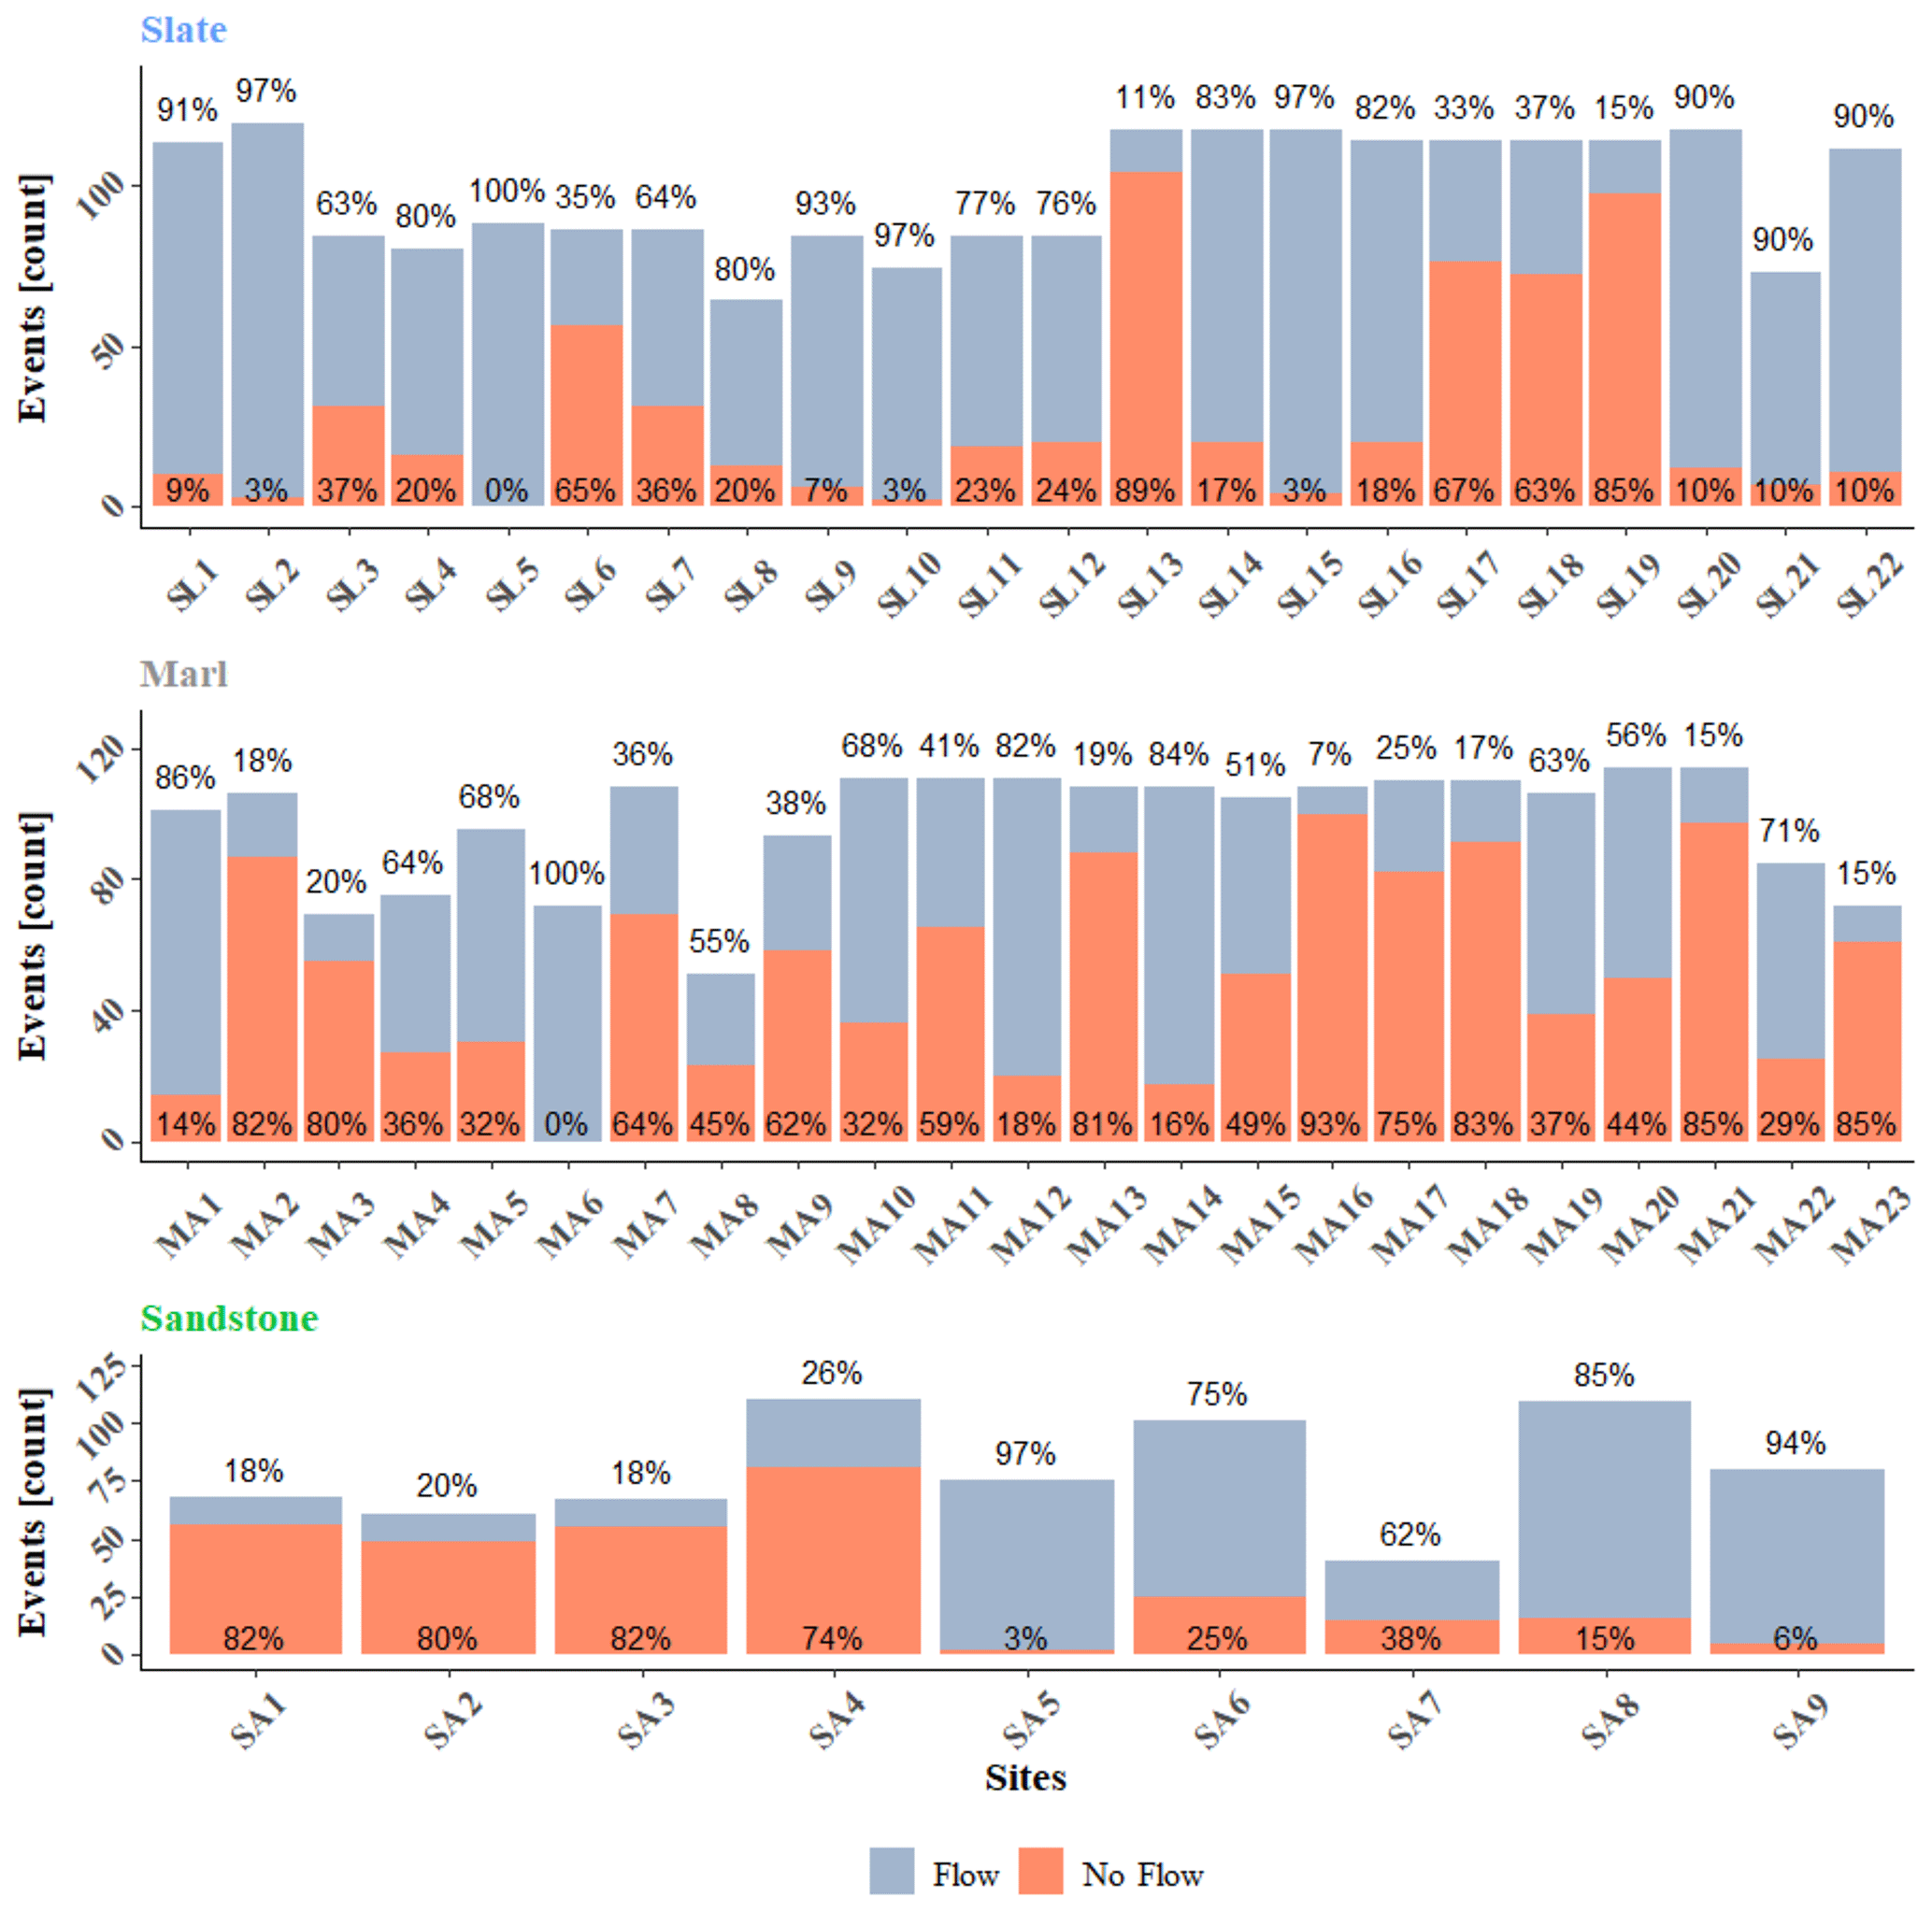
Figure 3Number of precipitation events resulting in either a flow or no-flow response for the sites underlain by different geology, i.e. slate, marl, and sandstone. The average percentage of flow responses per geology are 71 % in slate, 47 % in marl, and 57 % in sandstone.
The dataset was split into a training dataset (70 % of the data) for model fitting and a test dataset (30 % of the data) for model validation. Several training datasets had a highly unequal number of flow or no-flow responses, which would lead to an overfitting of the model to the class with a higher number of responses. Thus, two methods of data resampling from the R package ROSE (Random Over-Sampling Examples; Lunardon et al., 2014) were used to avoid an overrepresentation of one class, as follows: (1) the oversampling function from the ROSE package performs simple oversampling with replacement from the minority class until the specified sample size N is reached and (2) with the option of the both function, the ROSE package the minority class is oversampled with replacement, and the majority class is undersampled without replacement until the sample size N is reached. The resampling is carried out with the probability for the minority class given by the value p (in this study 0.5; Lunardon et al., 2014). Oversampling was set up to generate a dataset holding twice the number of observations of the overrepresented class, whereas the over-/undersampling aims for the 1.5-fold number of all events contained in the original dataset. Thus, three different datasets were used as training data, i.e. (a) the original training dataset, (b) a resampled training dataset after using the oversampling function of ROSE, and (c) a resampled training dataset using the over-/undersampling (called both) function of ROSE. In a first run, the three different datasets for each site were used to fit three random forest models, which were validated with the corresponding test dataset. The random forest models were run with the R package randomForest (Liaw and Wiener, 2002) with a randomly chosen seed set to 123 to ensure reproducibility of the statistical model. The number of trees was set to 2500 after reaching stable OBB error rates around this threshold, and the default value of three predictor variables tried at each split. The confusionMatrix function from the R package caret (Kuhn et al., 2015) was used for validation. The confusion matrix compares the modelled with the observed values and allows one to quantify the percentage of correct and false classified classes and overall accuracy of model results as the total correct classifications. Only models with an averaged sensitivity (correct flow predictions/total flow observations) and specificity (correct no-flow predictions/total no-flow observations) > 0.5 and a sum of both measures higher than one were considered for further analysis. The dataset with the highest averaged sensitivity/specificity was chosen for each site for further analysis. In cases where multiple datasets for a site had the same values of sensitivity/ specificity, the original data were chosen over the resampled datasets. The model accuracy (total correctly classified events/total number of modelled events) was used as an additional indicator for the assessment of model quality but was not used during the evaluation process.
With one dataset selected for each site, one model was run for each site and the mean decrease Gini (MDG) was obtained only for those models based on the selected datasets by using the importance function from the R package randomForest. The MDG is calculated for each predictor variable X in the random forest model. For each decision tree in the model, the summed-up decrease in the node impurity measure (the Gini index) is weighted by the proportion of data points reaching the nodes that are split by the specific predictor variable. These decreases in the Gini index for single trees are averaged over all trees in the forest to obtain the mean decrease Gini (Louppe et al., 2013). A higher mean decrease in Gini indicates higher variable importance. The MDG is recognised as a robust measure to rank the importance of the predictor variables of the random forest models (Calle and Urrea, 2010).
4.1 Event analysis
4.1.1 Event analysis based on local rainfall characteristics
Between 64 and 119 precipitation events were identified for the 22 sites in the slate geology (Fig. 3; Table S1). The different number of events were caused by the natural spatial variability of precipitation but also by data gaps in the streamflow response dataset. For 17 sites, the precipitation events led predominantly to flow responses, while no-flow responses were only dominant for five sites (Fig. 3). The share of no-flow responses at the sites ranged from 3 % to 89 %. For one site – although having intermittent flow – no precipitation event led to a no-flow response. For the 23 sites located in the marl geology, between 51 and 114 events were identified. A total of 12 of these sites had more flow responses to precipitation than no-flow responses, while for 11 sites there were more no-flow responses (Table S2; Fig. 3). Generally, the number of flow responses to precipitation events were lower in the marl geology than the slate and sandstone sites (Fig. 3). The percentage of no-flow responses ranged between 14% and 93 %, but for one site there were not any detected no-flow responses. The total number of precipitation events for the nine sites in the sandstone geology varied between 40 and 110 (Table S3, Fig. 3). There was a nearly equal split of sites with predominance in flow (five sites) and no-flow (four sites) responses. The proportion of no-flow responses to the total number of precipitation events ranged from 3 % to 82 %.
The differences in the averaged values of the predictors at each site between flow and no-flow responses were tested with a two-sided t test separately for each geology. The results of the t test show significantly (p<0.05) higher average soil moisture at sites for flow responses compared to the no-flow responses in all geologies (Fig. 4a). The largest differences in soil moisture between flow and no-flow responses were observed for the marl geology, with a mean θ10 of 0.63 and θ50 of 0.66 during flow responses, compared to 0.38 (θ10) and 0.44 (θ50) during no-flow responses (Fig. 4a). The differences in soil moisture were smallest for sandstone, with θ10 of 0.48 and θ50 of 0.47 during flow responses and 0.35 and 0.36, respectively, during no-flow responses. For the sites on slate, soil moisture was slightly higher than in the sandstone during the responses (θ10 of 0.52 and θ50 of 0.55) and similar during no-flow responses (0.37 in both depths).
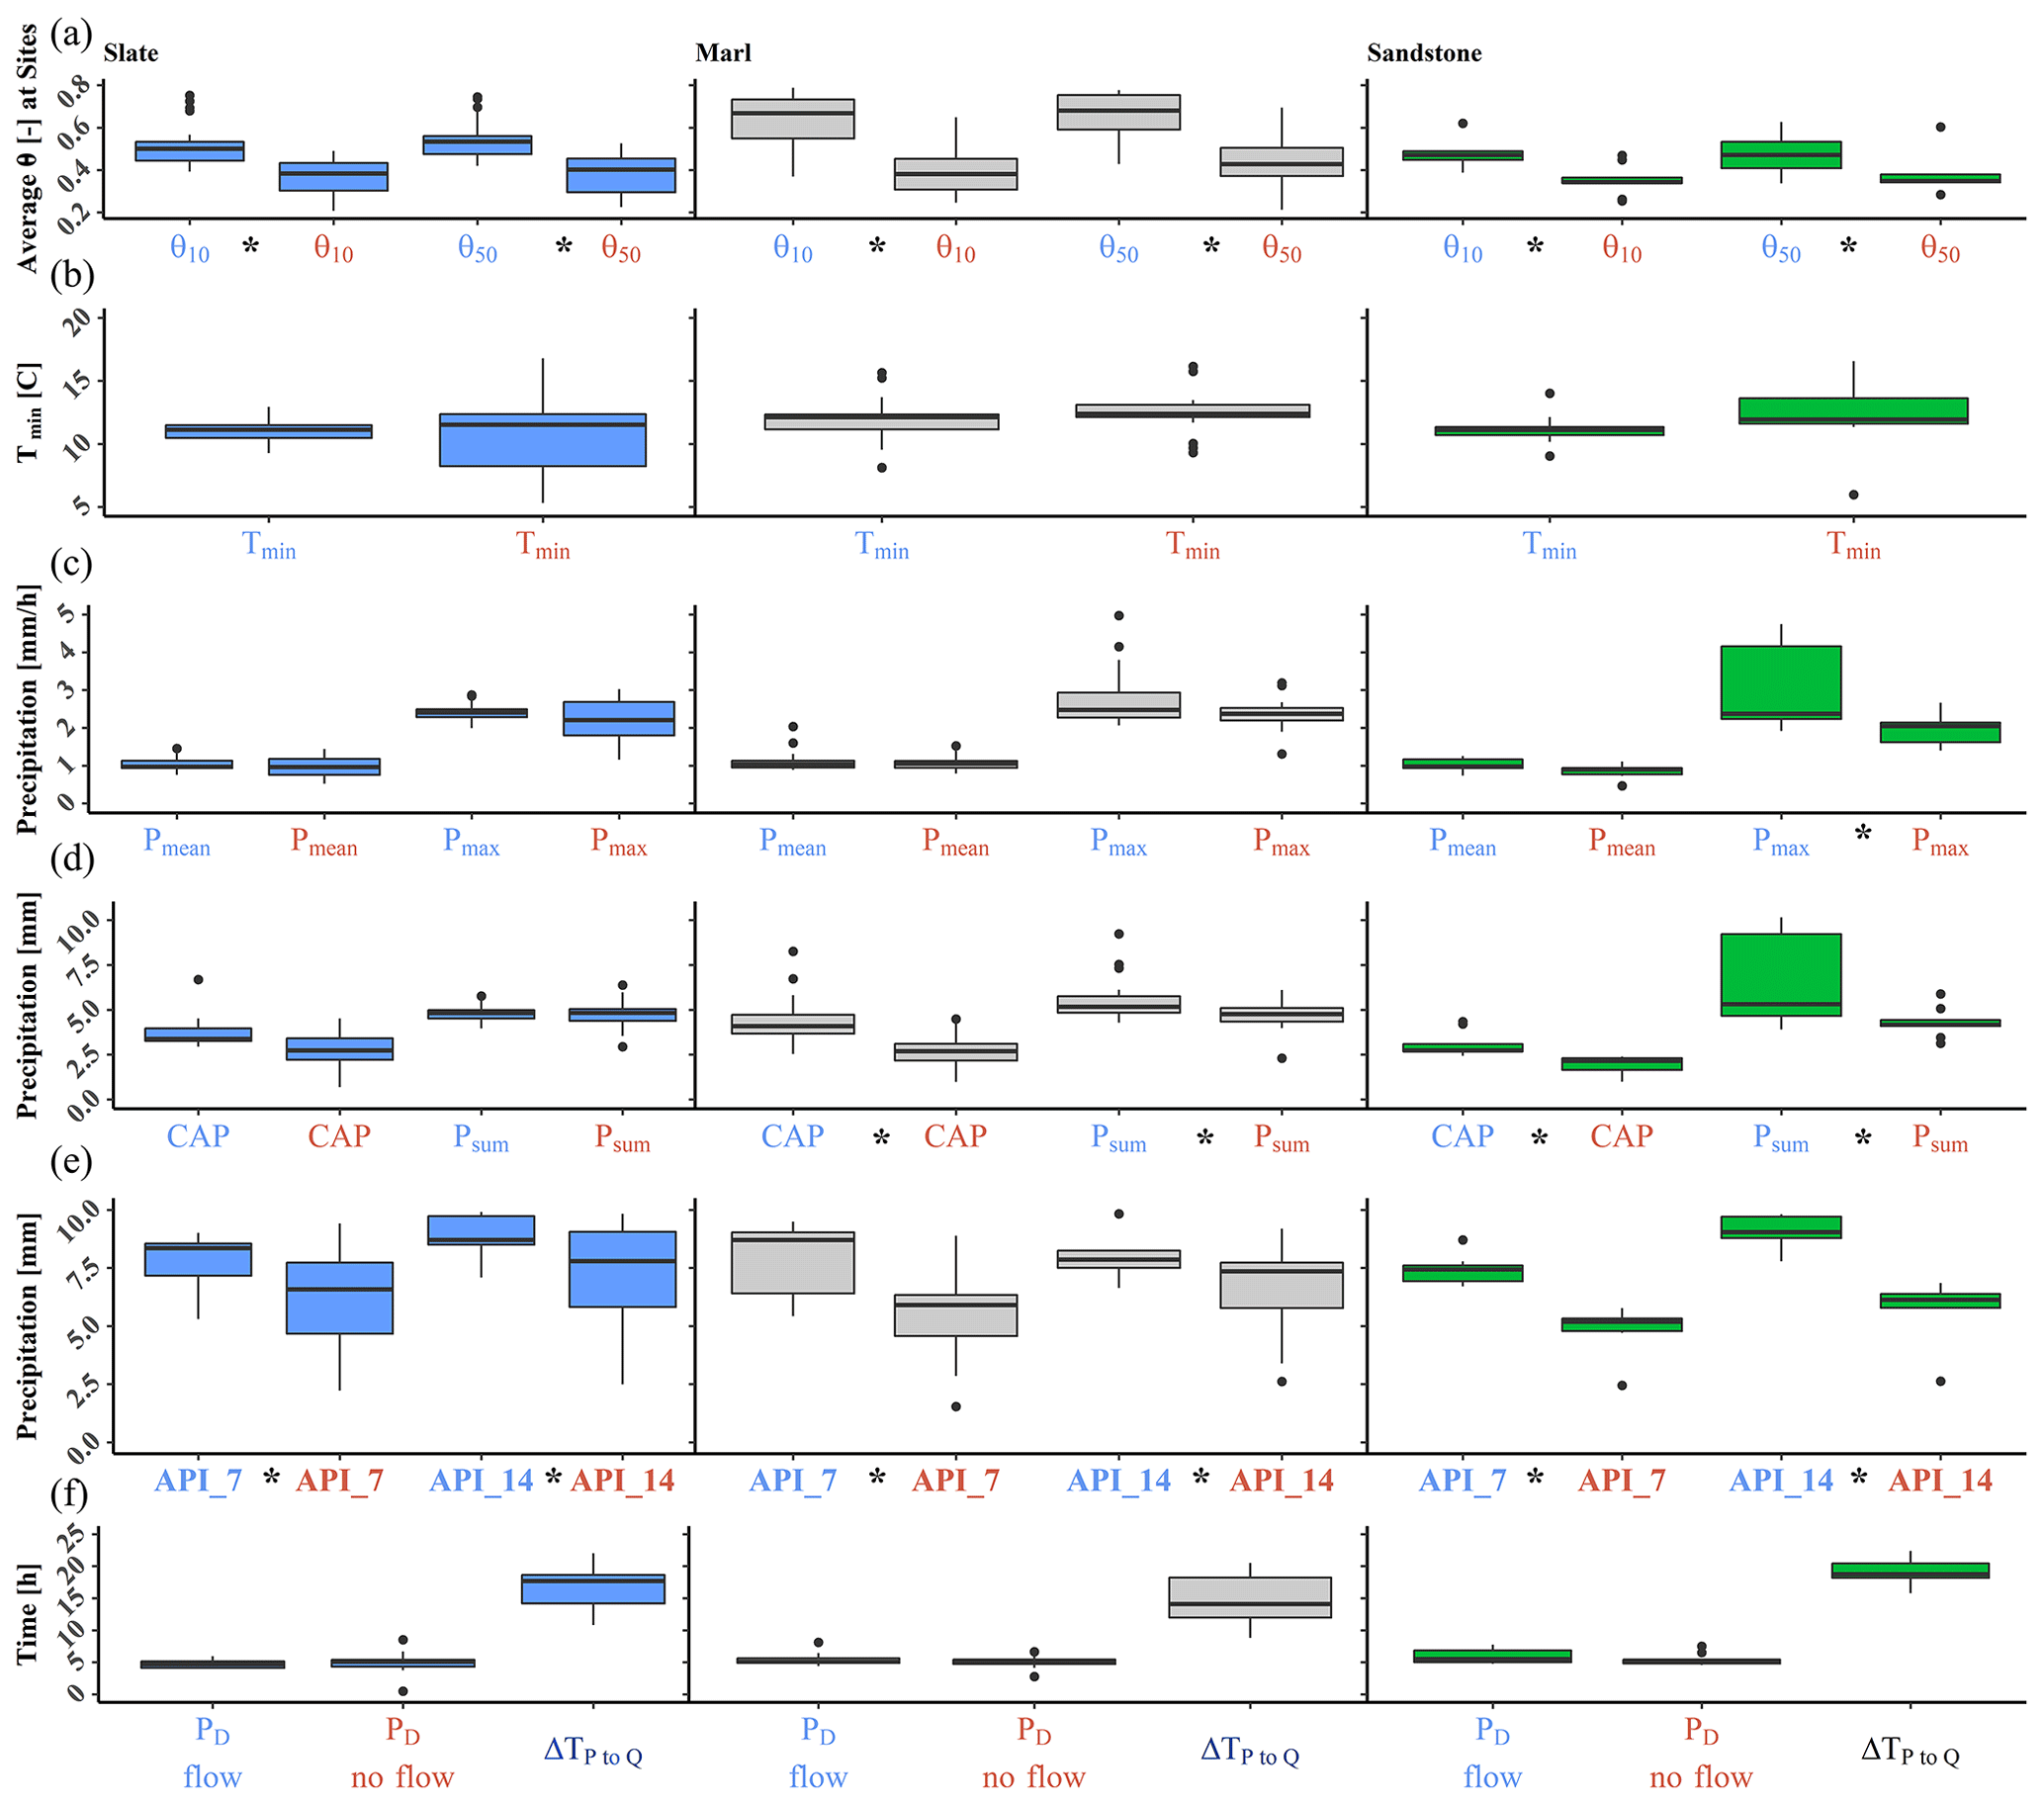
Figure 4Box plots of the characteristics of the events that led to flow (blue x-axis labels) and no-flow (red labels) responses in the three geologies (slate, marl, and sandstone). (a) Averaged maximum soil moisture at 10 and 50 cm depth during precipitation events, (b) averaged minimum soil temperature at 10 cm depth during the precipitation event, (c) average and maximum precipitation intensity (Pmean and Pmax), (d) the cumulative antecedent precipitation (CAP) and the cumulative event precipitation (Psum), (e) the 7 and 14 d antecedent precipitation index (API_7/API_14), and (f) the duration of the precipitation event (PD), as well as the time between initial precipitation and flow initiation (ΔTP to Q). One outlier for Pmean (6.5 mm h−1) in slate is not shown to enhance the readability. The boxes show the 25th and 75th percentile, and dots are the outliers outside 1.5 times the interquartile range from the box boundaries. The line indicates the median. Significant differences (two-sided t test) between flow and no-flow responses for the predictor values within each geology are marked with an asterisk.
In contrast to soil moisture, the averages for minimum soil temperature did not differ significantly between flow and no-flow responses (Fig. 4b). The precipitation measures Pmean, Psum and Pmax were similar for flow and no-flow responses at sites in slate and marl geology (Fig. 4c). However, the t test showed significantly higher values for Psum and Pmax for flow responses (Psum=6.4 mm; Pmax=3 mm h−1), compared to no-flow responses (Psum=4.3 mm; Pmax=2 mm h−1) for the sandstone, and a significantly higher Psum during flow responses (Psum=5.5 mm) than no-flow responses (Psum=4.6 mm) for the marl. While the API_7 and API_14 varied significantly between flow and no-flow responses across all geologies, the 24 h cumulative antecedent precipitation was significantly higher for flow responses in marl (CAPflow=4.7 mm; CAPno-flow=2.7 mm) and sandstone (CAPflow=3.1 mm; CAPno-flow=1.9 mm; Fig. 4d and e) compared to no-flow responses, but the differences in the slate were not significant. The duration of a precipitation event was not significantly different between flow or no-flow responses but were slightly longer for flow responses in the sandstone (Fig. 4f). However, there are noteworthy differences in the lag between initiation of the precipitation events and the beginning of the streamflow response (Fig. 4f). The sites in marl have the shortest and sandstone sites the longest response times.
4.1.2 Event analysis based on subcatchment averaged rainfall characteristics
The streamflow responses for the catchments of Pall, Beschruederbaach, Hei, Schammicht (marl catchments), Schwebich (sandstone catchment), Noutemerbaach, Colpach, and Foulschterbaach (slate catchments) are shown in Fig. 5. The mapped data reveal large differences in flow responses, even between catchments that are located close to each other. The two small subcatchments within the Hei catchment are prominent examples of two gauging sites that were less than 500 m apart but with very different shares of flow responses (eastern site is 56 %; western site is 15 %; Fig. 5).
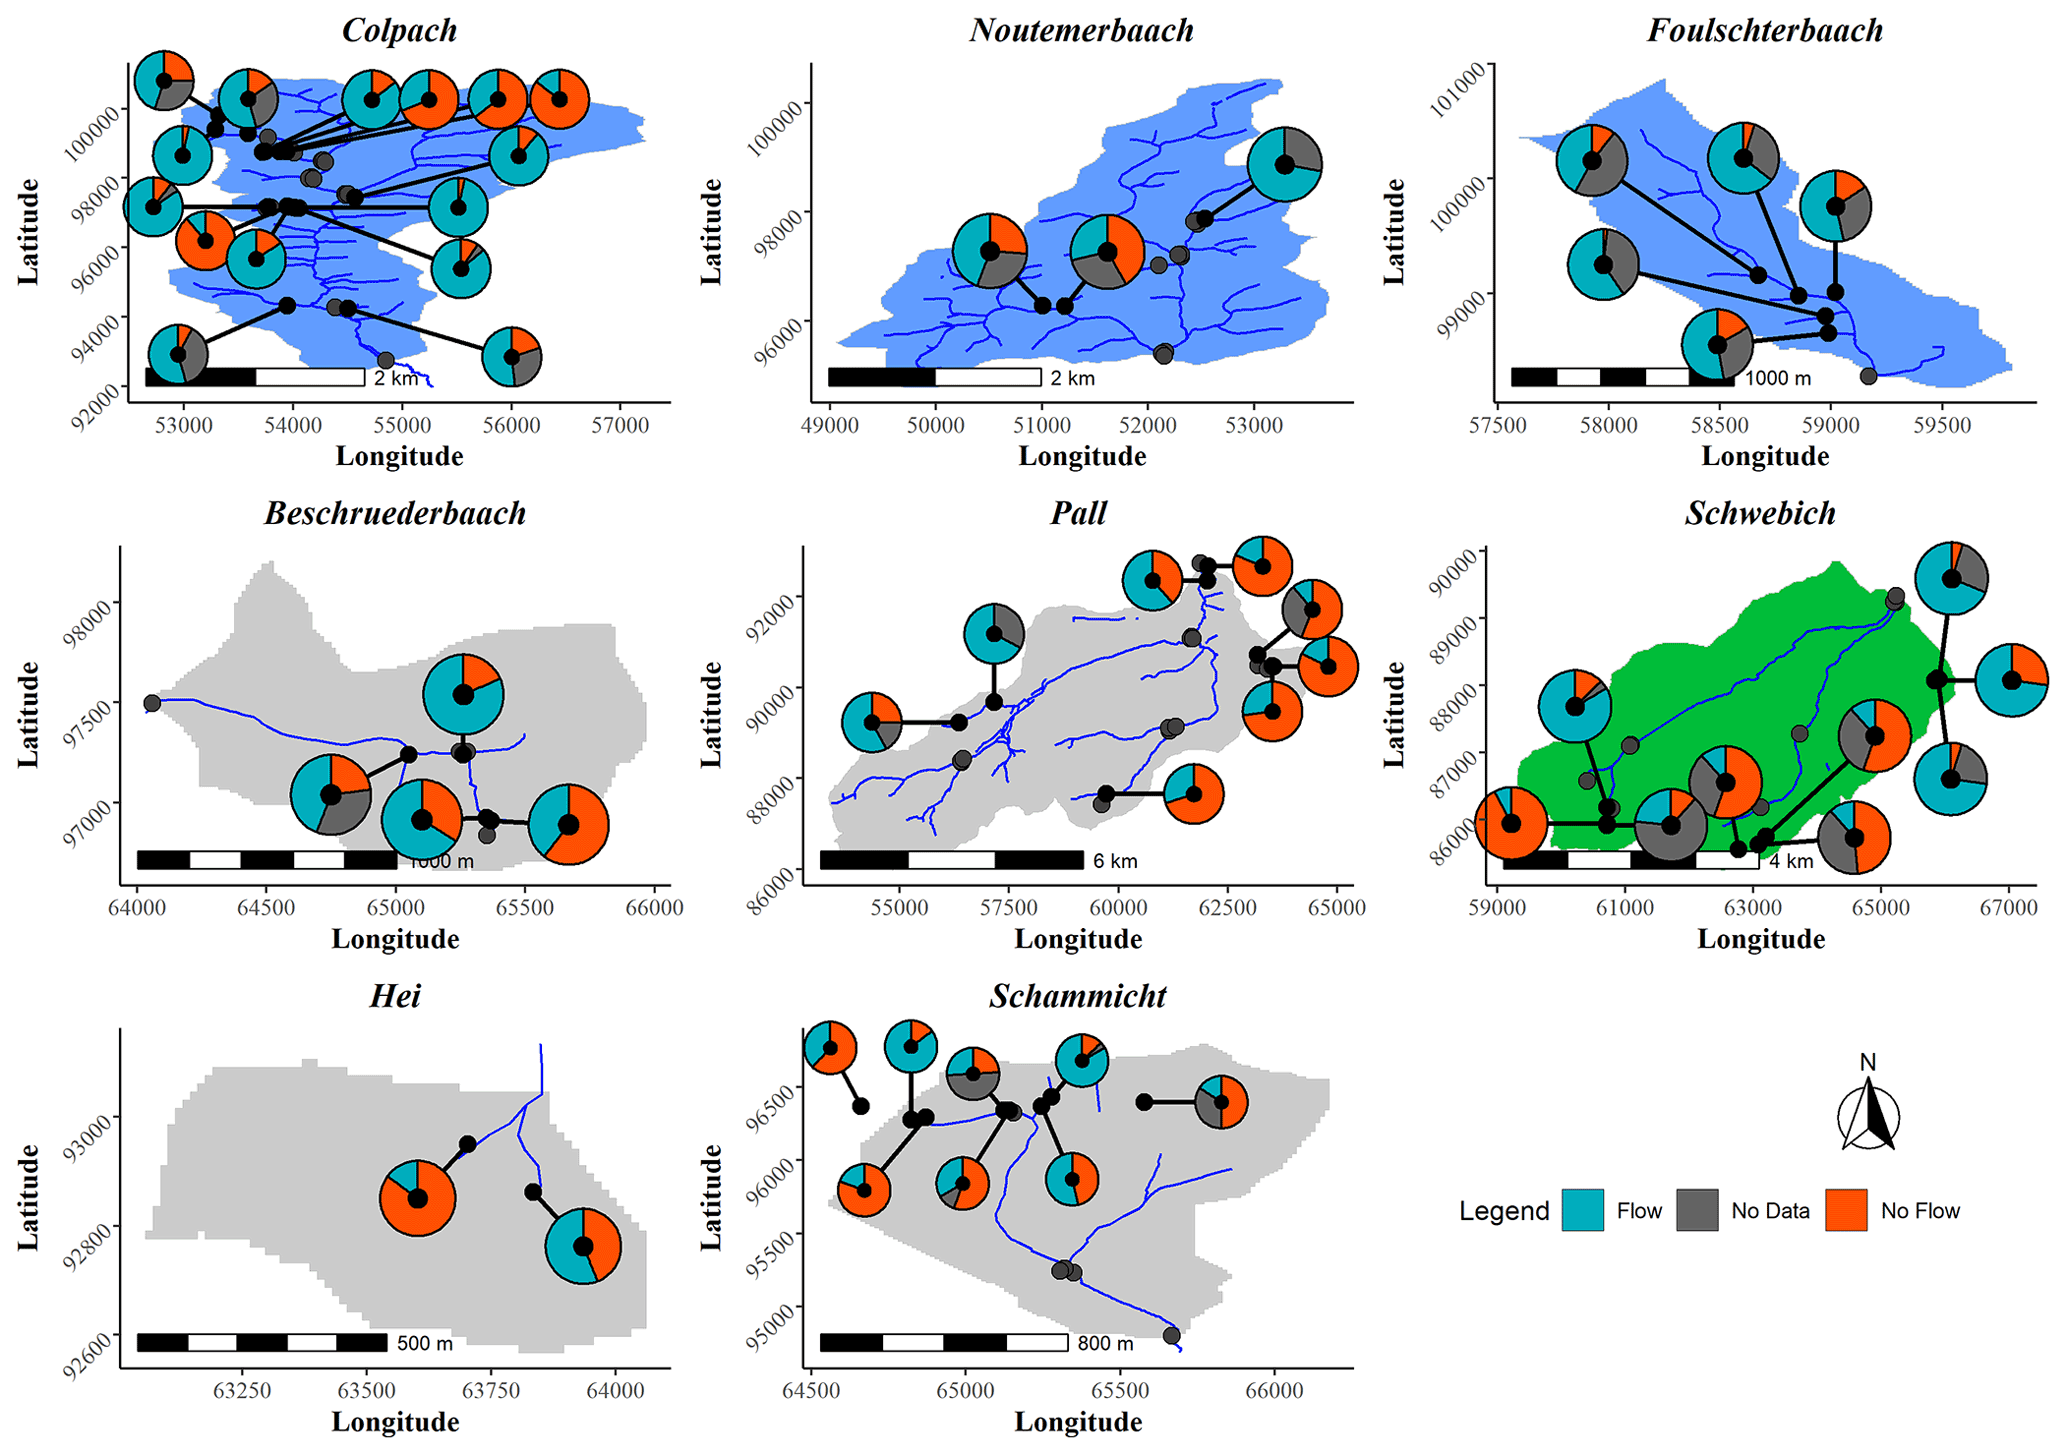
Figure 5Maps of the sites and their corresponding proportion of flow responses. The prevalent geology at the majority of the sites in each catchment is indicated by the colour of the catchment (blue is slate, grey is marl, and green is sandstone). The geology at the site does not always reflect the dominant geology of the entire catchment. Catchment shapes appear distorted in the maps due to the differences in shape and size.
The Colpach catchment (dominant geology of slate) had more sites with no-flow responses during precipitation events with low soil moisture compared to precipitation events with higher soil moisture (Fig. 6a). For a few events with very high mean precipitation, all sites of the Colpach catchment had flow, mostly with a little delay. In the Foulschterbaach catchment (slate), all sites maintained flow for a first sequence of events, even with low soil moisture, while some of the sites remained dry during events with lower precipitation and intermediate soil moisture. Flow occurred at all sites when the normalised soil moisture reached a threshold of around 0.65. In the Noumtemerbaach catchment (slate), there was a gradual decline in flowing sites, with a decline in soil moisture. Also, in this catchment, a sequence of average precipitation intensity events but rising soil moisture led to the activation of flow for all sites (Fig. 6c; Event a). Also, precipitation events with high intensity during periods of lower normalised soil moisture (<0.50) initiated streamflow responses at two sites (Fig. 6c; Events b and c). Subsequent events with soil moisture above that threshold led to the initiation of flow at all sites in the Noutemerbaach catchment. The sites in the Schammicht catchment (marl) represent many small subcatchments. In total, five series of precipitation events with high corresponding proportions of flowing streams were identified (Fig. 6f; Events g–h, i–j, k–l, m–n, and o–p). Of these series, two with the most subsequent precipitation events resulting in flow responses were characterised by relatively high soil moisture values (>0.72; Events g–h and o–p). A third period had a larger share of missing flow responses during events with a very dynamic soil moisture and multiple successive events of higher precipitation (in contrast to frequent changes in event precipitation between low to high for the other events; Events k–l). Furthermore, two short series of precipitation events (Events i–j and m–n) of flow correspond to successive events of higher mean precipitation. One single event of very high mean precipitation intensity (60 mm h−1), when soil moisture was low, did not lead to flowing conditions at all sites in the catchment (Fig. 6f; Event q). The temporal flow dynamics for the Beschruederbaach (marl) were generally closely related to those observed at the Schammicht catchment, as both catchments are very close to each other and have a similar geology and land use (Fig. 1). The Hei catchment (marl) had rarely flowing conditions at both monitored sites. These flow responses mostly corresponded to either comparably high mean event precipitation and/or high soil moisture (>0.8; Fig. 6g). One site in the Pall catchment was located in the sandstone region, while all others were situated in the marl (Fig. 1). For this catchment, the percentage of sites without a flow response is notably higher during times of lower soil moisture (Fig. 6h; Events r–u and v–x). However, in these dry periods, rapid flow activation occurred during larger event precipitation (e.g. Events s–t and w). Other periods with a higher number of sites having a flow response were linked to higher soil moisture (higher than 0.73). In the Schwebich catchment, the majority of the sites were located in the sandstone geology. Unfortunately, the share of no-data observations was quite significant during the first third of the events (Fig. 6d). Nevertheless, there was a relation between soil moisture and the proportion of sites with flow for the sites in the sandstone, but it was less strong compared to the marl and slate geology. Notable streamflow responses from the majority of the streams in the catchment occurred at comparably low soil moisture but a higher mean precipitation intensity during Events d–f (Fig. 6d).
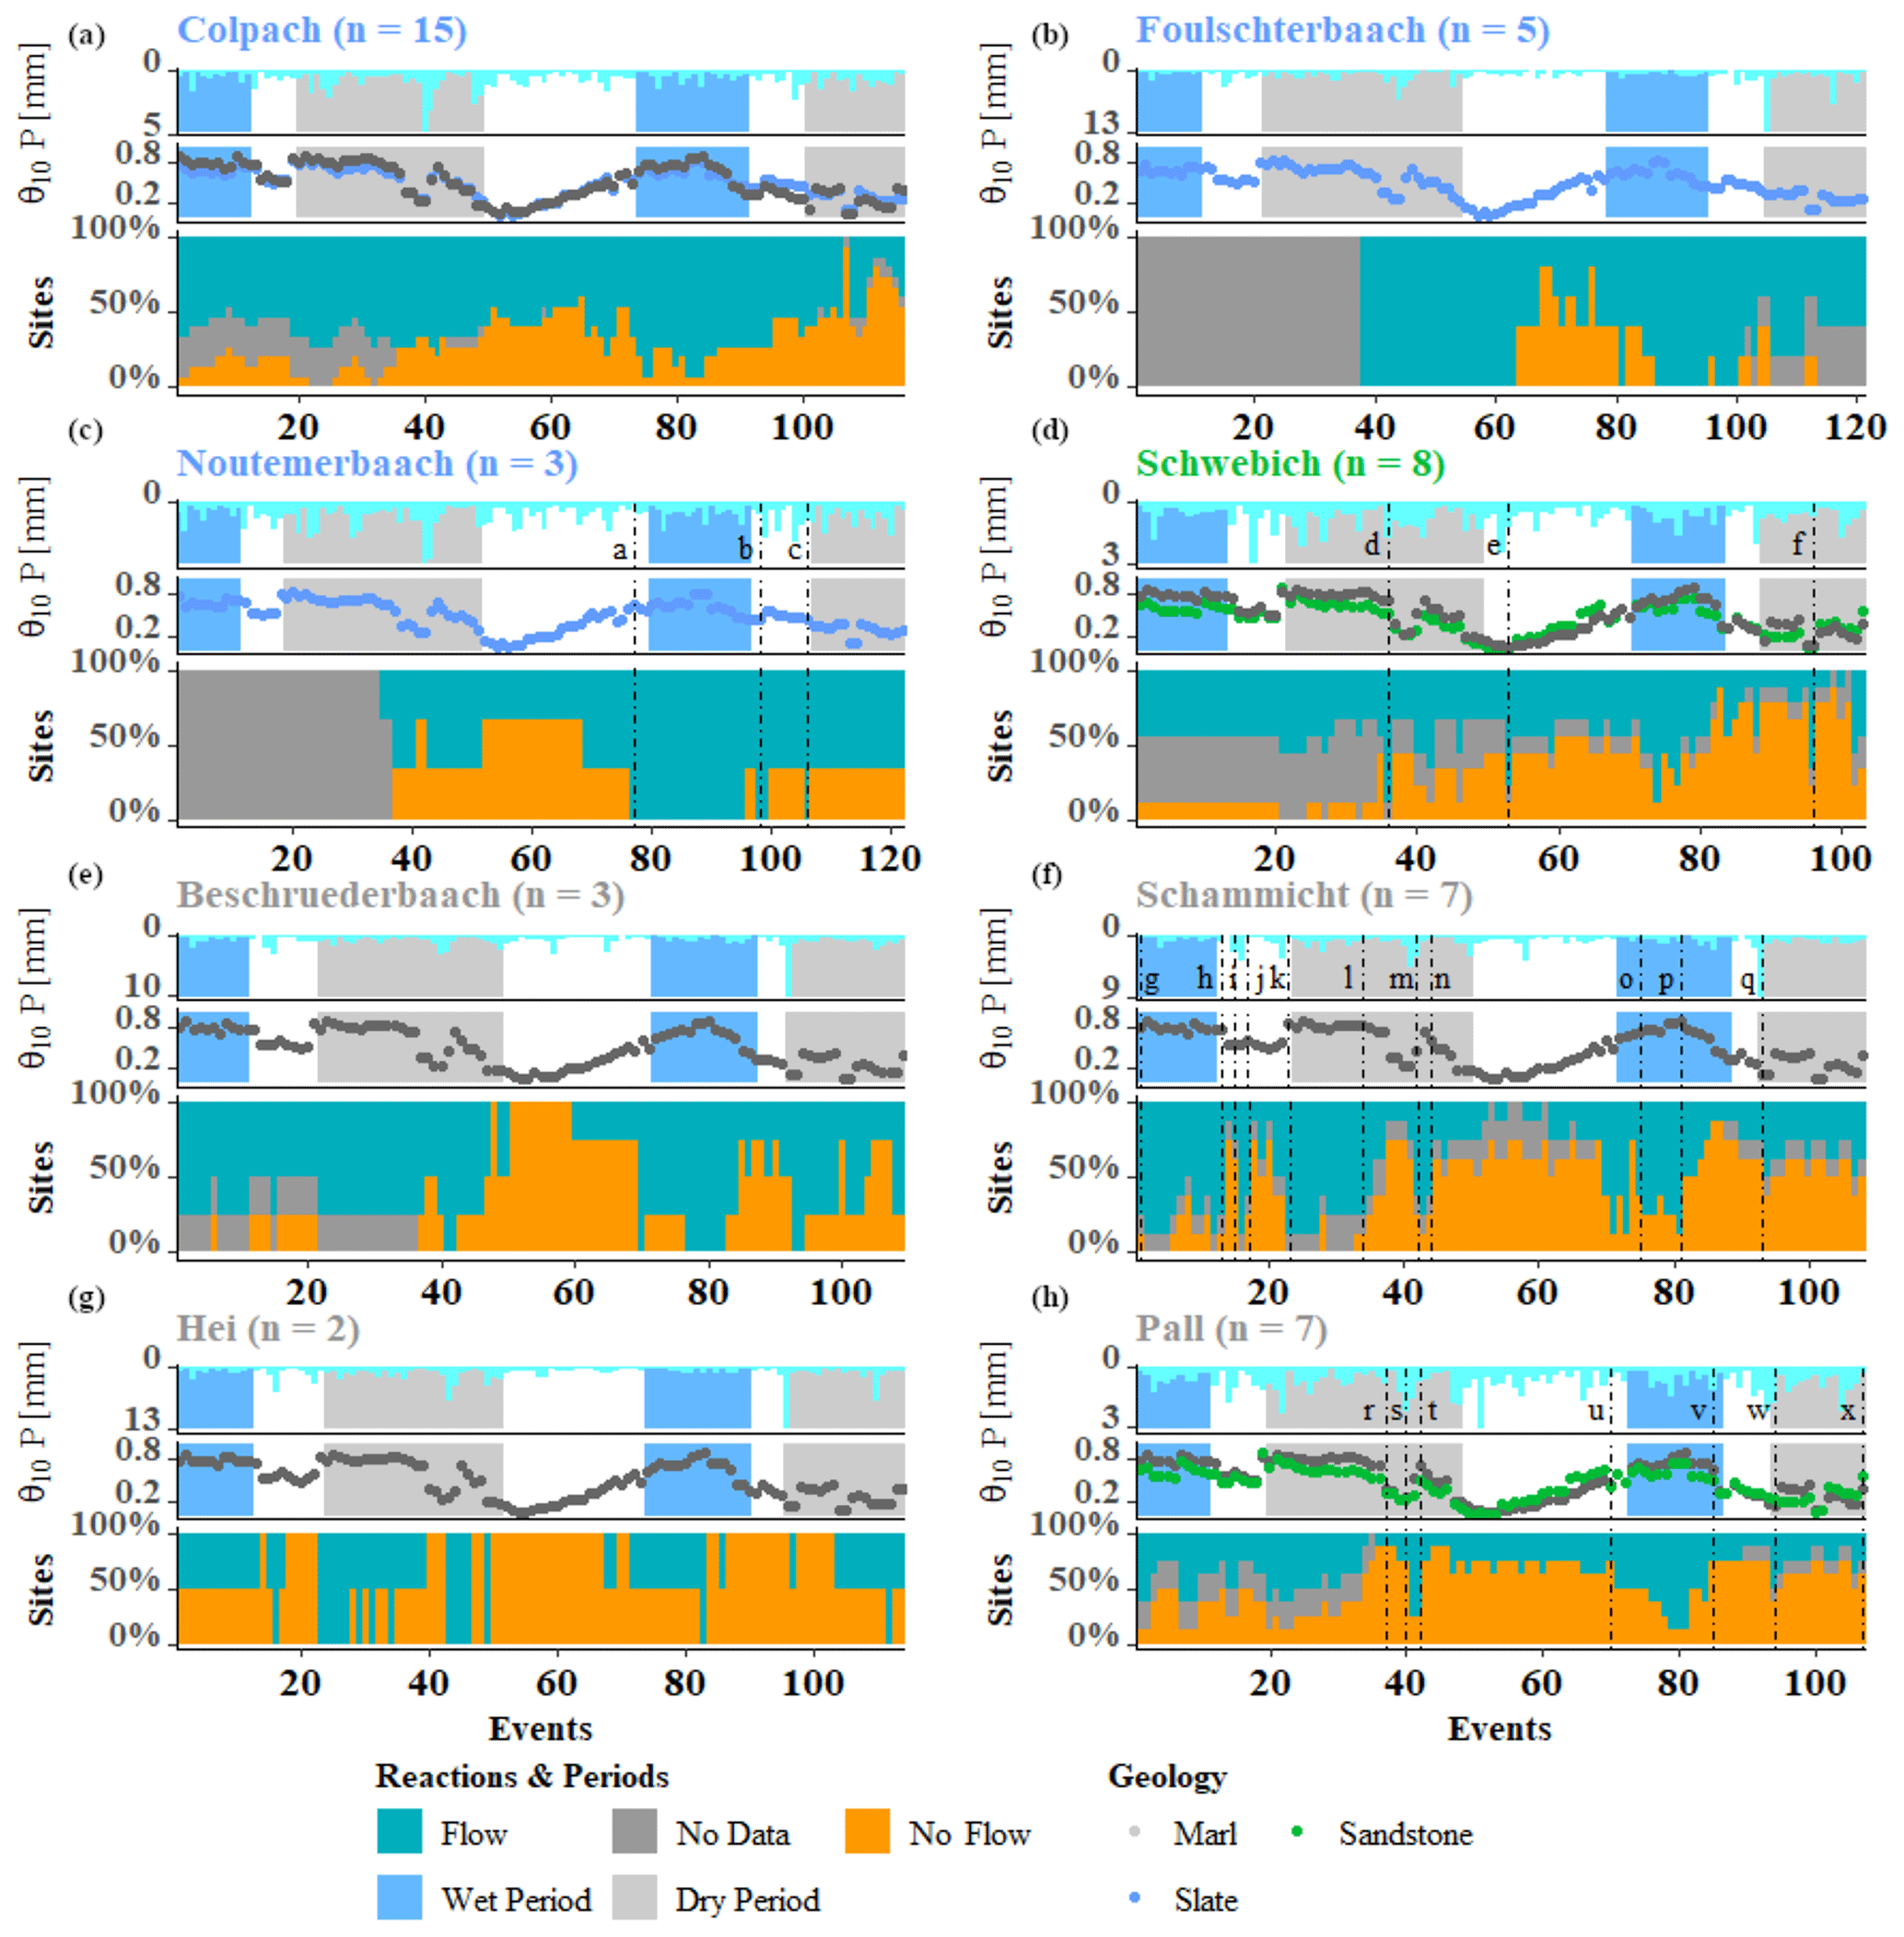
Figure 6Events for each catchment ordered by their temporal succession. Each subplot shows the mean event precipitation (top), normalised maximum soil moisture in 10 cm depth (mid), and the percentage of sites in the catchment with a flow or no-flow response or no data for each catchment ordered by the temporal succession of the events. For subcatchments with sites in two different geologies, the soil moisture is shown for each of the geologies. The events in the months February, March, and April are highlighted with a blue background, representing a period with a high number of sites in the Attert catchment with flow, whereas the months of June, July, and August are highlighted with a grey background to indicate a dry period. Specific events are highlighted with dashed lines and labelled with letters for reference. The colour of the header of the subplot represents the dominant geology (blue is slate, grey is marl, and green is sandstone). The header also includes the number (n) of sites in the catchment. Note that the event numbers on the x axis differ between the plots, i.e. event no. 40 does not refer the same event across all sites.
4.2 Random forest model results
4.2.1 Site selection
The evaluation criteria for a good model (sensitivity (correct flow predictions/total flow observations) and specificity (correct no-flow predictions/total no-flow observations) > 0.5) were not met for all sites. These sites were excluded to avoid the inclusion of results with bad-performing models in the further analysis. The site selection was based on a combination of the evaluation criteria (specificity and sensitivity) during validation.
Out of the 22 sites in the slate geology, eight were rejected from further analysis based on the model evaluation criteria (Fig. 7). After rejection of the unsuccessful models, the mean accuracy over all sites in the slate was 0.90, with a standard deviation of 0.08. The rejected sites in the slate geology were distributed over all subcatchments (Fig. 8). However, the Foulschterbaach catchment had a high share of sites (three out of five) that did not meet the evaluation criteria. All of the rejected sites in the slate geology had a low number of no-flow responses compared to the other sites in slate (Figs. 3 and 7). In the case of SL5 and SL10, splitting the dataset into training and test data led to zero samples of the no-flow class. For SL2, the ratio of 116:3 of flow to no-flow responses could not be compensated through the resampling of the data. Roughly two-thirds of the sites in the slate geology that were selected for further analysis had better model performance with the resampled data.
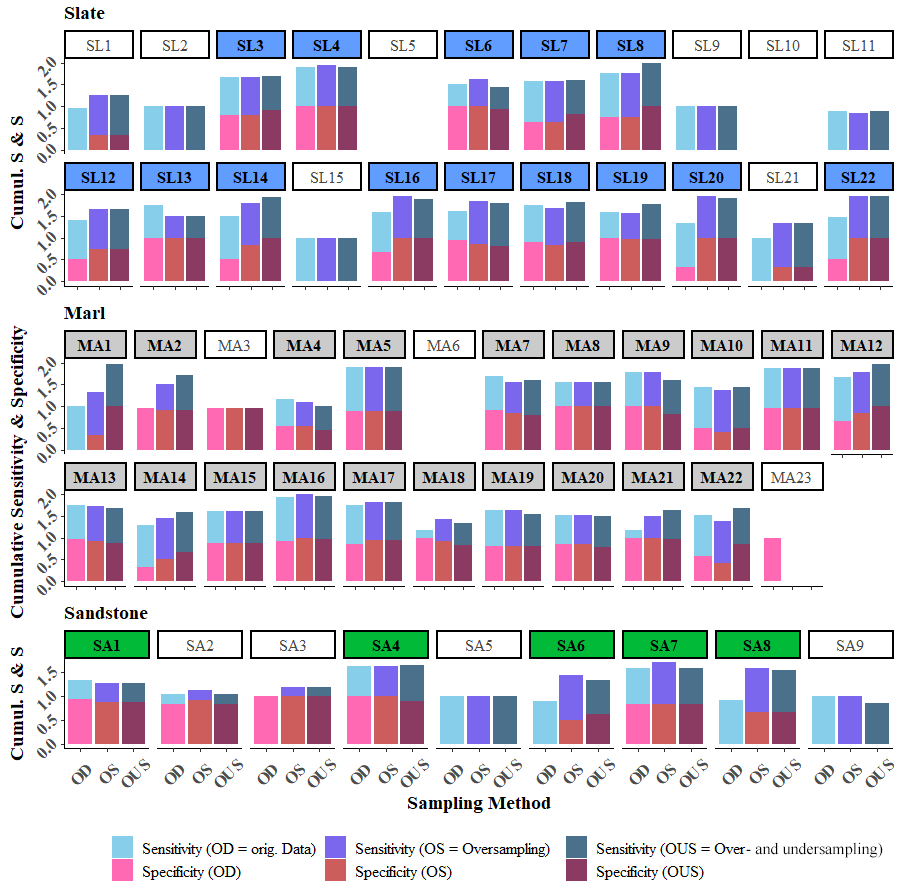
Figure 7Cumulative sensitivity and specificity of the random forest models for the different sites using the original data (OD), oversampling dataset (OS), and over- and undersampling dataset (OUS). Sites that met the selection criteria for a good model fit are indicated with coloured boxes corresponding to the dominant geology in the catchment (blue is slate, grey is marl, and green is sandstone). Sites that did not meet the selection criteria were discarded for further analysis and are indicated with white boxes.
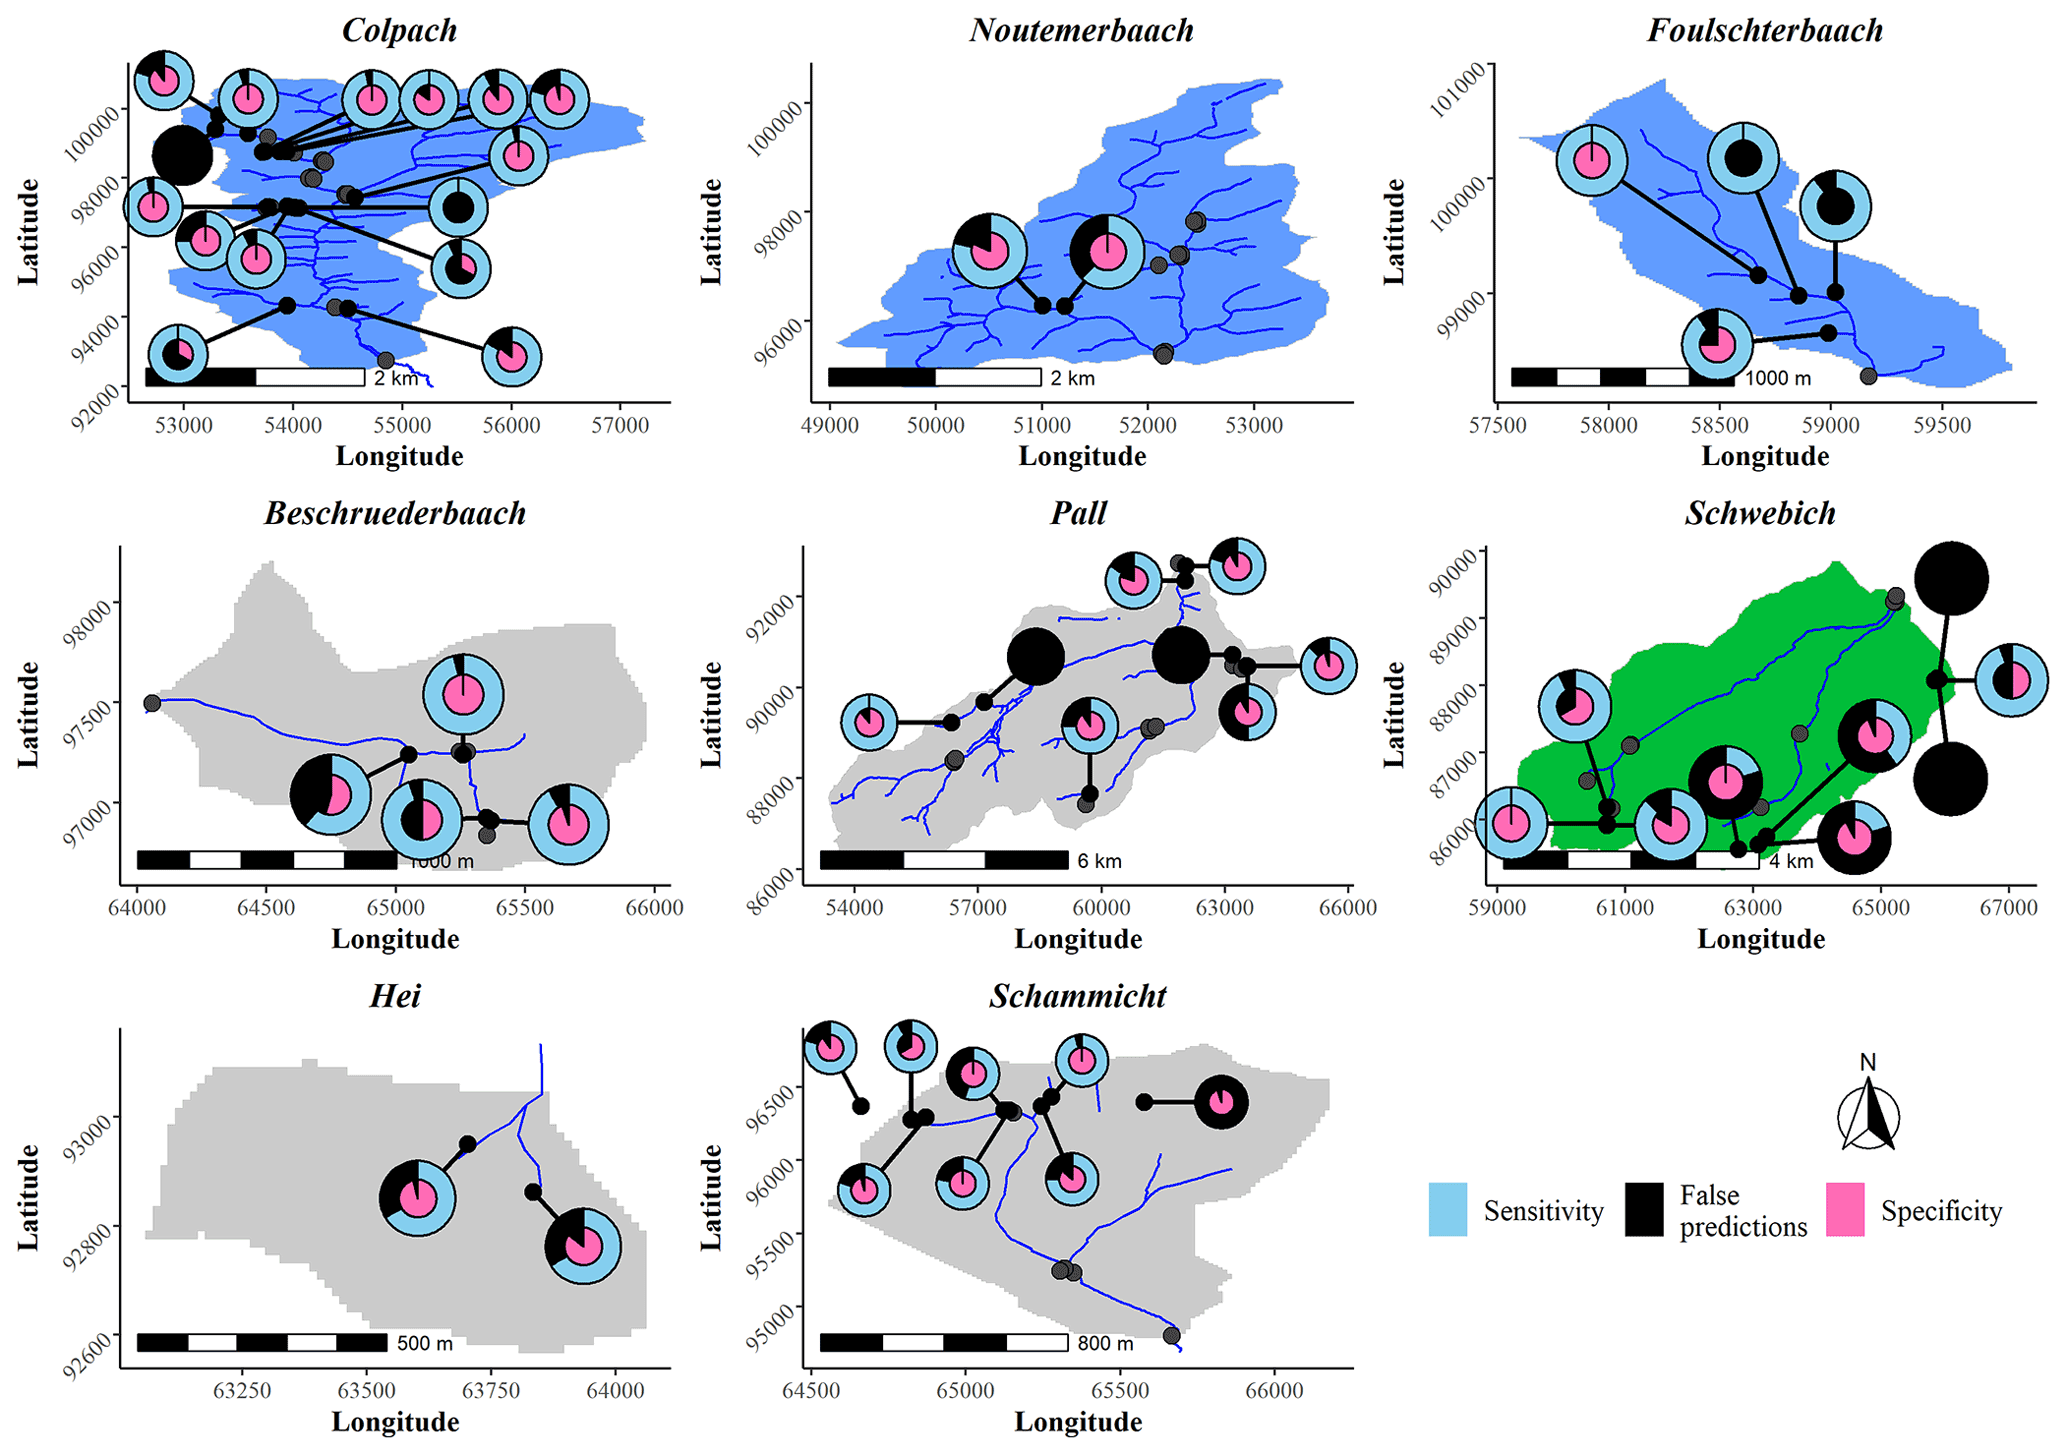
Figure 8Sensitivity (outer circle) and specificity (inner circle) of the random forest models at the different sites in the subcatchments (including the sites that did not fulfil the evaluation criteria). Both measures range from 0 to 1; thus, the larger the proportion of the circle that is filled with colour, the better the model quality.
Models for 20 out of 23 sites in the marl region did meet the evaluation criteria, with a mean model accuracy of 0.84 and a standard deviation of 0.10 (Fig. 7; Tables S5–S7). The sites were selected with datasets from all types of resampling methods (no resampling, oversampling, and over- and undersampling). The three sites that did not meet the evaluation criteria were the sites with the lowest number of observed precipitation events and which had a notably unequal distribution of flow and no-flow responses (in case of site MA6, there were only flow responses). These sites were located in the Schammicht and Pall subcatchments (Fig. 8).
For four of the nine sites in the sandstone, the models did not meet the evaluation criteria, with either very high sensitivity and very low specificity or vice versa (Fig. 7). These sites also had an unequal distribution of the flow/no-flow responses (Fig. 3). All of the sites were located on very small reaches and three of them on steep unpaved forest roads on the hillslopes (Fig. 8). The mean model accuracy over all sites in the sandstone that met the evaluation criteria was 0.79 (standard deviation of 0.12). All sites in the sandstone geology for which the models were acceptable had the best results with the over- and undersampling approach.
4.2.2 Predictor importance
The predictor importance was defined at each site by the ranked mean decrease Gini measure of the predictors in the site-specific model. The rank of a model predictor shows the relative importance in relation to the other predictors in the model, with 10 as the highest rank of the 10 predictors (Fig. 9). For the sites on slate geology, the soil moisture at 50 cm depth was on average higher ranked (8.9) than that at 10 cm depth (8.7). Both predictors were among the most important predictors for the majority of the sites on slate (top three predictor for 13 and 12 out of 14 sites). Minimum soil temperature was the third key predictor in the slate region, with two-thirds of the sites having it in the top three of most important predictors. API was on average intermediately ranked (API7 of 5.5 and API14 of 6.3) with a variability in the ranks in a low to mid range (rank 1–8). Precipitation measures were among the second to fourth most important predictors (rank 8 and 9) for one-quarter of the slate sites, while the duration of a precipitation event was not important for any of the sites on slate (average rank 1.71).
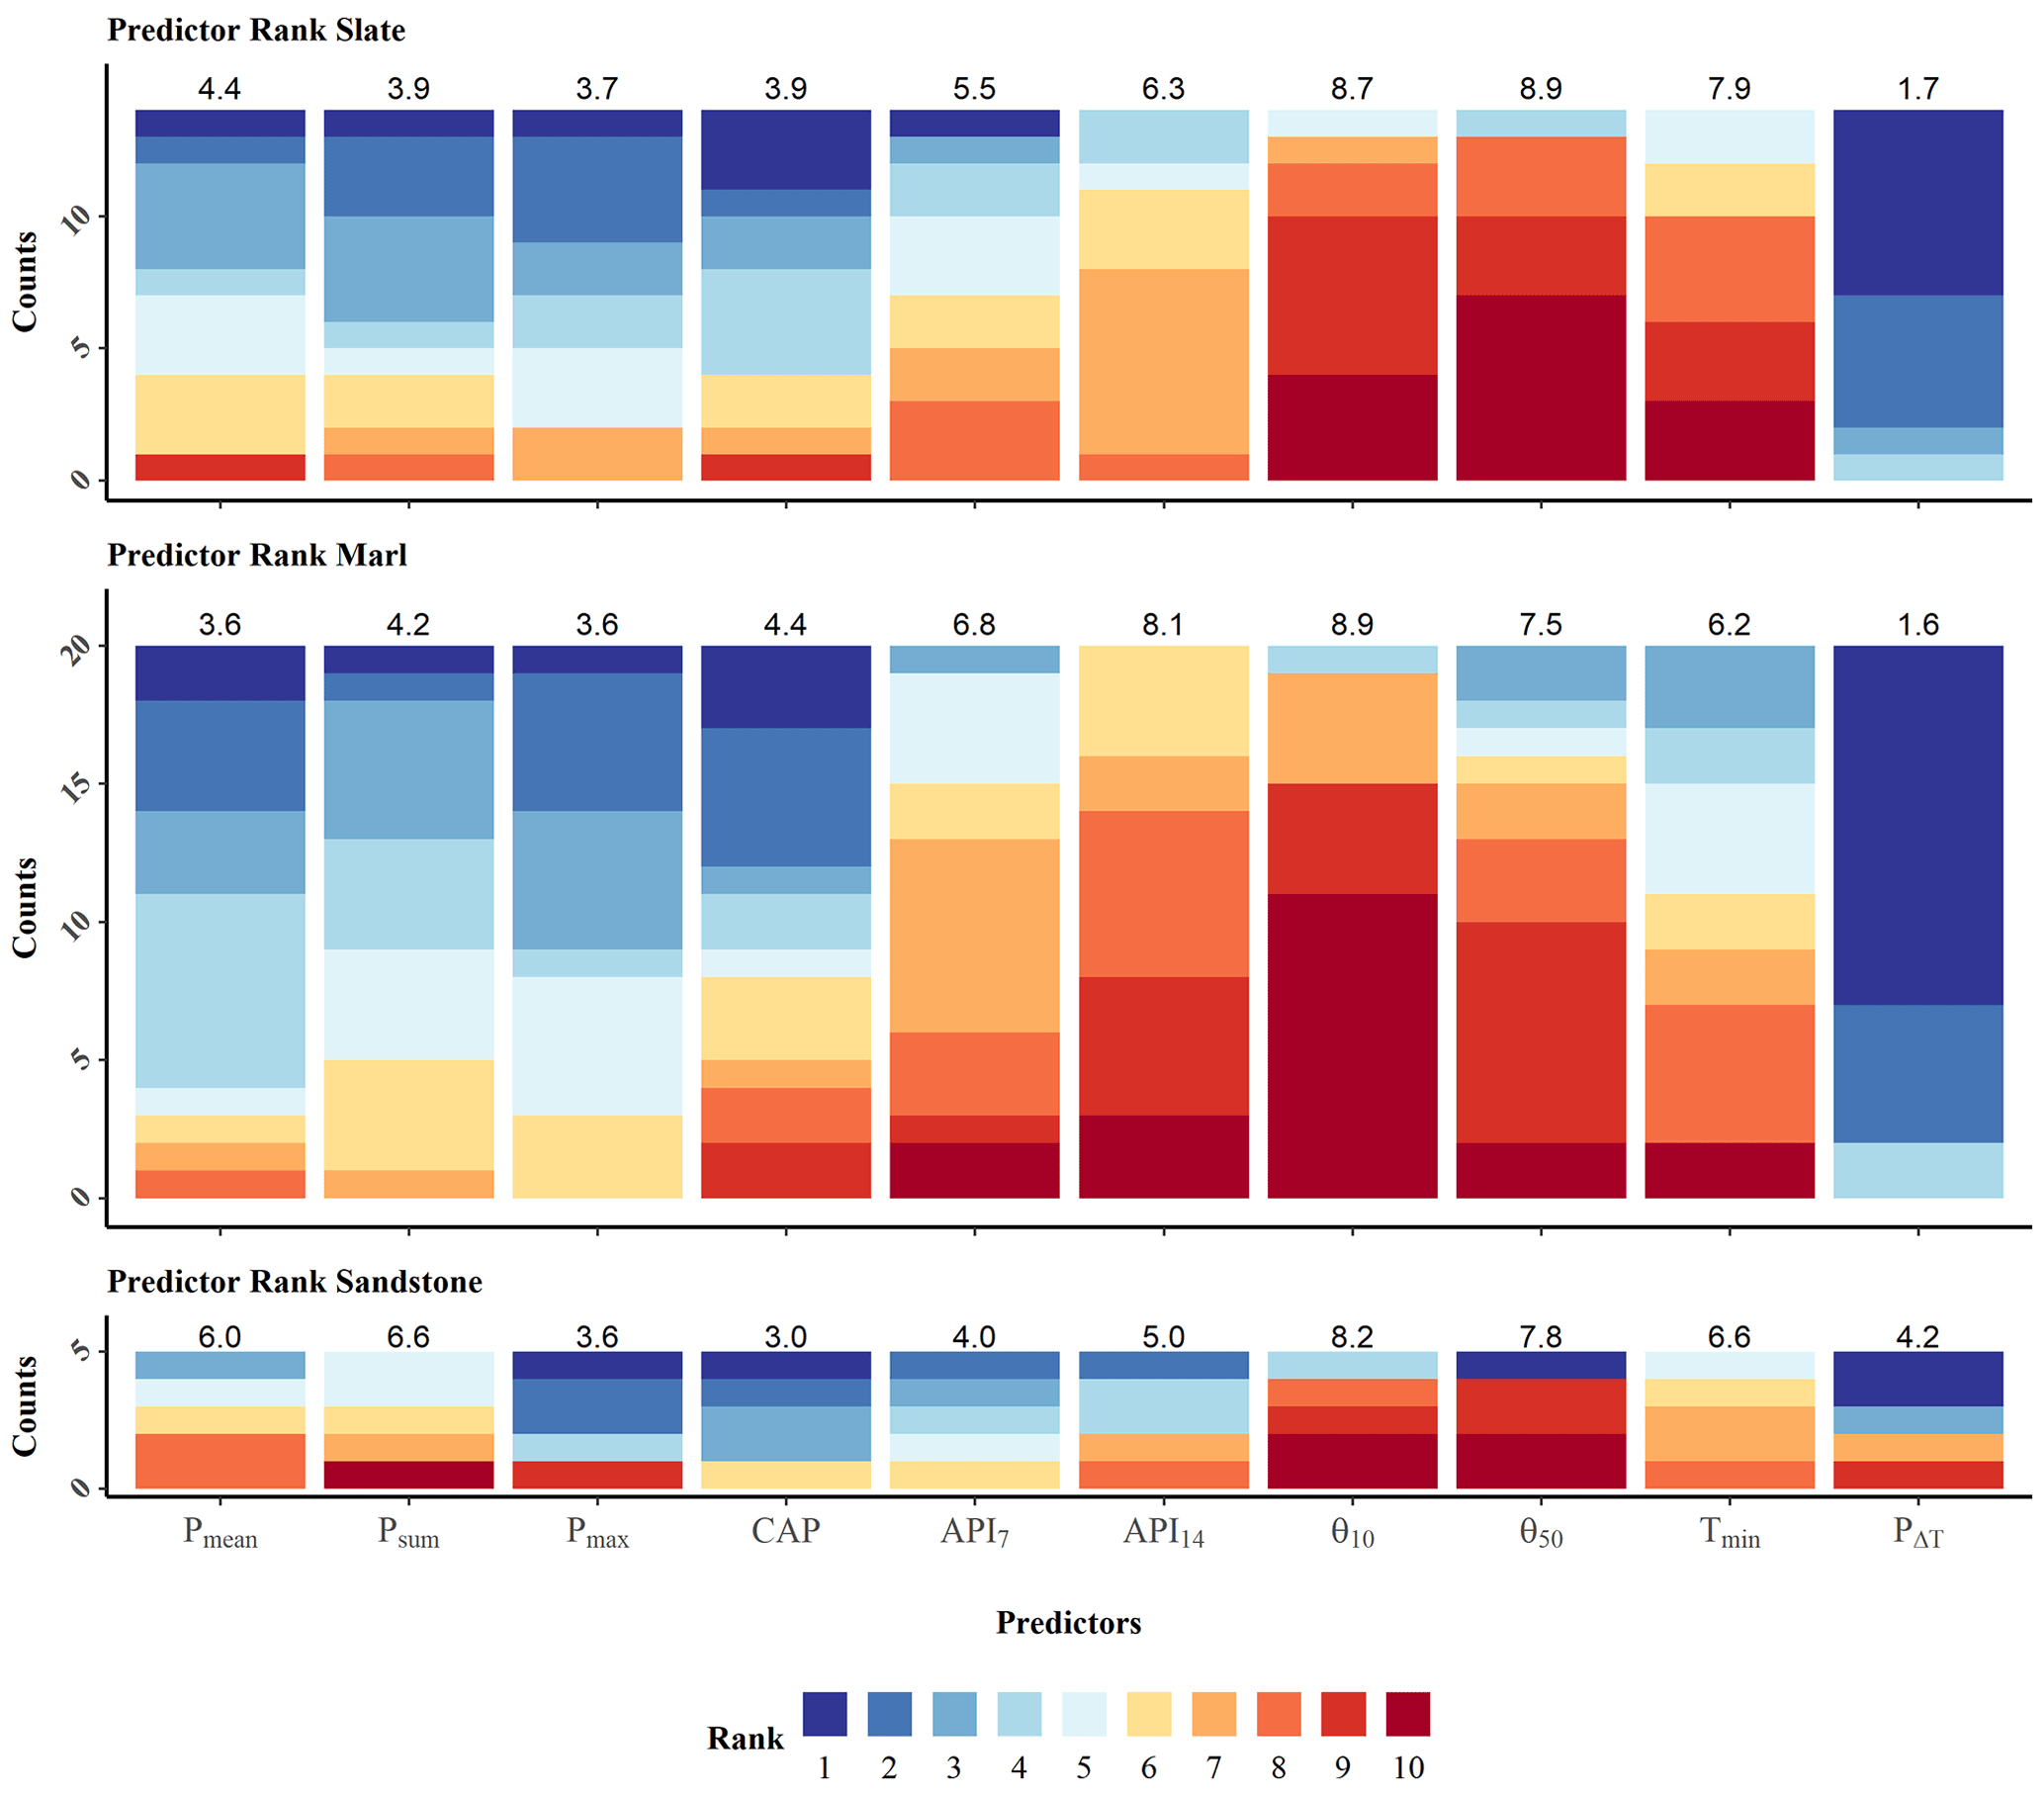
Figure 9Rank of the parameter importance of each model predictor for the different sites counted in each geology. The rank is colour-coded, with the highest rank in red (representing the most important predictor) and the lowest rank in blue (representing the least important predictor). The average rank of a predictor for all included sites in each geology is indicated at the top of each bar.
Sites on marl had similar pattern of predictor importance to those on slate (Fig. 9). For the sites located on marl, the soil moisture at 10 cm depth was the key predictor with the highest average rank (8.9) and being among the top three most important predictors for 15 out of 20 sites (Fig. 9). Soil moisture at 50 cm depth was slightly less important, with an average rank of 7.5, and in the top three predictor ranks for 13 out of 20 sites. The API measures completed the list of highly important predictors, with the 2 week API14 being on average the second most important predictor (rank 8.05) and having a slightly higher importance than the API7 (rank 6.8). Thus, the top-ranked predictors represent either directly or indirectly the soil moisture conditions during the precipitation event. However, the correlations between the two API measures and the two soil moisture content amounts were low (0.10–0.58) for the sites in marl, while the correlations were high between the two API measures API7 and API14 (0.78–0.86), as well as between the soil moisture at the two depths (0.15–0.75). While the precipitation measures (Pmean, Psum, Pmax) played only a minor role for three-quarters of the marl sites, the cumulative antecedent precipitation was ranked as important for two-thirds of the sites (average rank of 4.4). The sites in the marl geology have the lowest average ranks (6.2), and the wide spread in ranks (3–10) for the minimum soil temperature compared to the other two geologies (6.6 and 7.9) and a low importance of the precipitation event duration (average rank 1.6) indicate that precipitation events of all duration and at various temperatures were able to induce runoff responses in this geology.
The sites in the sandstone geology showed a more diverse patterns of predictor importance (Fig. 9). Soil moisture at 10 and 50 cm were among the most important predictors for most of the sites in sandstone, with ranks of 9 and 10. The precipitation sum was very important for one site (rank 10) in the sandstone geology. Additionally, the precipitation sum was notably more important for the sites on sandstone compared to the sites in the other geologies being on average the third most important predictor in the sandstone geology. Furthermore, mean event precipitation ranked high (rank 8) for two sites in the sandstone geology. Compared to the API14, which was the only important antecedent precipitation measure at two sandstone sites, the API7 and CAP had lower rankings (ranks 4 and 3). The importance of minimum temperature had an average rank of 6.6 that is between the ranks for temperature for the other geologies. One of the two sites on sandstone with high-ranking precipitation duration (ranks of 7 and 9) also showed a higher importance for the other event precipitation measures (Pmean; Psum; Pmax), while these measures were not important for the other sites. For all other sites in the sandstone geology, the duration of the precipitation event was ranked low.
5.1 Factors affecting streamflow intermittency
The three main runoff generation mechanisms resulting in event streamflow are infiltration excess (Hortonian) overland flow, saturation excess overland flow, and subsurface stormflow (Sidle et al., 1995; Zimmermann et al., 2014). The drivers that are involved in these processes are inputs of water to the system either in the form of rainfall or meltwater (e.g. Horton, 1933; Weyman, 1973; Dunne and Black, 1970; Sando and Blasch, 2015; Tolonen et al., 2019). The ability of the system to buffer the incoming precipitation is limited by the infiltration capacity, the storage capacity, and the antecedent soil moisture (e.g. Tromp-van Meerveld and McDonnell, 2006; Bachmair and Weiler, 2014; Stewart et al., 2019; Gutierrez-Jurado et al., 2019, 2021; Warix et al., 2021). This study reveals that the average soil moisture was significantly different for precipitation events that resulted in flow and for those without a flow response (Fig. 4). This was the case for the sites on all three geologies. Additionally, the antecedent precipitation (7 and 14 d API) was important for the sites on marl and slate. The high potential to distinguish the two classes of flow responses by soil moisture is confirmed by the high importance of the corresponding predictors in the random forest models (Fig. 9). The event analysis in this study indicates a seasonal timing (Fig. 6) and thresholds (Fig. 4) of soil moisture at which streamflow is initiated. Times of low or high soil moisture and respective no-flow or flow responses roughly follow the seasonal fluctuations in evapotranspiration. Thus, in the winter months with higher soil moisture, a succession of multiple precipitation events with flow responses are more common than in the summer months with lower soil moisture (Fig. 6). Annual variations in streamflow in temperate regions are usually explained by the seasonal fluctuations of evapotranspiration, which affects the soil moisture conditions of the catchment (e.g. La Torre Torres et al., 2011; Penna et al., 2011, 2015; Trancoso et al., 2016; Zimmer and McGlynn, 2017). The importance of these seasonal fluctuations on streamflow initiation in the Attert catchment is underlined by the higher soil moisture despite the lower precipitation (26 to 30 mm of average event precipitation sums) during the wet periods compared to the lower soil moisture in times of higher precipitation sums during the dry periods (43 to 50 mm of average event precipitation sums; see Fig. 6). The seasonal variations in soil moisture are visible in all geologies of the catchment. This seasonality is more pronounced for the catchments on slate and marl, while flow responses for half of the sites were dependent on soil moisture in the sandstone and for the other half were dependent on the precipitation characteristics. The lower dependency of flow responses on soil moisture at sites on sandstone potentially indicates that other sources like deeper storage and local perched groundwater have a larger influence on the streamflow responses than in the other geologies. A prolonged supply of streamflow by local perched groundwater tables on sandstone above less permeable layers was shown to control streamflow intermittency in a Mediterranean catchment (Guieterrez-Jurado et al., 2019, 2021) and on slate in a subtropical, humid climate (Zimmer and McGlynn, 2017). In contrast, the large differences in soil moisture between flow and no-flow responses at sites on marl, and the larger volatility of active sites in catchments with marl, indicate a faster saturation of the soil with quicker and shorter SOF responses.
Besides the seasonal variation, soil moisture can increase rapidly in reaction to precipitation events. These fast increases in soil moisture resulted in streamflow responses also during the dry periods. Streamflow responses to these dynamically increasing soil moisture values were mainly observed for the marl sites (Fig. 6). A majority of the sites in the marl subcatchment had streamflow responses during these short-lived phases of increased soil moisture, while the effect was less pronounced on slate and sandstone. The importance of soil moisture in both soil depths in the marl geology is reflected by the results of the random forest model, which ranks these predictors and the API the highest (Fig. 9). The importance of soil moisture in the system is in line with the findings of Kaplan et al. (2020a), who identified catchment area and curvature, which are surrogates of the topographic wetness index, as the two most important predictors in the spatial model of streamflow intermittency. Topography, hydraulic conductivity, and transmissivity, as well as the water storage capacity of a catchment defined by bedrock geology and soil type, have been identified as dominant predictors for streamflow timing and the spatial dynamics of the intermittent stream network in different climates and topographies (e.g. Tanaka et al., 2005; Jencso and McGlynn, 2011; Sando and Blasch, 2015; Ward et al., 2018; Prancevic and Kirchner, 2019; Gutiérrez-Jurado et al., 2019, 2021; Kaplan et al., 2020a; Shanafield et al., 2020). The dependency of streamflow intermittency on the seasonal dynamics of evapotranspiration, as found in this study, was also reported for a catchment with subtropical humid climate and uniform precipitation sums and associated with the catchment storage (Zimmer and McGlynn, 2017). These changes in catchment storage were reported to change the streamflow contributions from shallow perched groundwater-dominated runoff production during drier periods with low storage to deeper groundwater that was rising into the contributing soil layers at higher storage.
The importance of the event precipitation measures (Pmax; Pmean; Psum) was surprisingly low. This may result from the small share of precipitation events exceeding the infiltration capacity for all geologies (Demand et al., 2019) and thus limiting the probability for Hortonian overland flow. Gutierrez-Jurado et al. (2019) simulated intermittent streams in catchments with different soil types and demonstrated that HOF was the dominating streamflow contribution on sandy loam soils with low hydraulic conductivity. Soils with the lowest hydraulic conductivity in the Attert catchment are located on marl, but these soils are very heterogeneous and often have a higher effective hydraulic conductivity due to macropores and soil cracking (e.g. Demand et al., 2019; Kaplan et al., 2020b). A stronger influence of precipitation characteristics on the onset of intermittent streamflow was also observed in a humid tropical climate (Zimmermann et al.; 2014) and in arid climates (Ries et al., 2017) with large seasonal or spatial variability in event precipitation sums. In contrast, precipitation-related predictors become less important in situations where the fluctuations in soil moisture or groundwater control saturated conditions and the associated SOF and SSF because the high importance of predictors like groundwater, soil moisture, and antecedent precipitation will overwrite the importance of precipitation (Wrede et al., 2015; Ward et al., 2018; Jensen et al., 2019; Gutierrez-Jurado et al., 2021).
The importance of precipitation event characteristics may also result from the definition of the precipitation events and the temporal resolution of the data. Zimmer and McGlynn (2014) identified the interannual variability in evapotranspiration as being the major control of the water table and, thus, the driver of stream network dynamics. They report an increasing importance of precipitation variability in precipitation amount and timing, as they control the storage state and streamflow intermittency in the periods when the storage changes from dry to wet (and vice versa). In their study, precipitation events are defined as two events separated by at least 12 h and >8 mm of precipitation, while in this study the events were separated by 3 h and had a minimum precipitation of 1 mm. This implies that a single precipitation event in our study would be potentially merged to one large event according to the definition of Zimmer and McGlynn (2014). This effect becomes even stronger in the study of Jensen et al. (2019), who separated precipitation events by a minimum period of 24 h without rain. They found that 16 % of the variance in the stream network extent was explained by precipitation characteristics. With our precipitation event definition, the variability between precipitation events may be less pronounced because multiple short events may lead to a more even distribution of the event characteristics than if they were lumped together to few longer events, and the likelihood of having similar events in wet and dry periods is higher. Also the assignment of a specific precipitation event to its associated streamflow response and soil moisture is more precise with the use of shorter precipitation events. Thus, the relevance of soil moisture increases, while the precipitation event characteristics become less relevant. Event definitions that support prolonged periods of multiple precipitation events as one event hamper the identification of the actual precipitation that triggered the streamflow response. Thus, the characteristic of the precipitation event gains in relevance because it potentially has pre-event precipitation merged within the actual event. This also means that pre-event saturation measures (e.g. API/soil moisture) just before the triggering precipitation event may be less relevant, as this information is partially included in the event precipitation for the entire period.
5.1.1 Factors affecting streamflow responses on slate geology
The most important model predictors for the sites on slate are soil moisture in the upper and the lower soil layer followed by temperature and the API measures, while precipitation-related predictors play a minor role (Fig. 9). The soil moisture at 50 cm depth was slightly more important than soil moisture at 10 cm depth for several sites. This can be caused by the high fraction of preferential flow paths in the clay-rich soils in the forested regions in the slate geology of the Attert catchment (Demand et al., 2019). This would allow event water to travel quickly into deeper soil layers and to trigger subsurface storm flow. This hypothesis is supported by the higher mean soil moisture at 50 cm depth than at 10 cm depths for which flow and no-flow responses were separated by the random forest models at most of the sites (Fig. S9). Additionally, slate bedrock is – similar to the layers of low permeability in the marl – relatively impermeable, but in contrast to the marl, the bedrock–soil interface in slate is rather fractured, and soil depths are deeper (>50 cm; Demand et al., 2019). Previous studies in the Weierbach catchment – a subcatchment of the Colpach catchment that also shows intermittent streamflow (Fig. 1) – highlighted the presence of a fill and spill mechanism of subsurface stormflow based on the isotopic signature of the streamflow and local groundwater observations (e.g. Wrede et al., 2015; Martínez-Carreras et al., 2016; Beiter et al., 2020). This mechanism appears when depressions at the bedrock surface have to be filled until water spills over the bedrock relief (Tromp-van Meerveld and McDonnell, 2006). It leads to a distinct precipitation threshold that has to be reached to cause the strong, enhanced subsurface stormflow. For the Weierbach catchment, this mechanism causes the double-peak streamflow when the catchment storage reaches a certain threshold during the dormant season or after intense precipitation events in the dry season (Martínez-Carreras et al., 2016). The dependency of the streamflow responses on the seasonal variations in the temperature and evapotranspiration which influence the catchment storage state is also supported by the importance of temperature as a predictor in the random forest model. Single-peak streamflow events occur below the threshold from direct precipitation onto the stream channel and saturation excess overland flow in the riparian areas (Martínez-Carreras et al., 2016) but also partly from subsurface stormflow through macropores and fractures on the hillslopes which are connected to the saturated riparian areas (Angermann et al., 2017; Jackisch et al., 2017). In the dry season, the storage at the soil–bedrock interface rarely becomes active. Instead, fast responses of subsurface flow in the shallow soil layers from the hillslope contribute to streamflow (Martínez-Carreras et al., 2016). This may lead to the importance of soil moisture in the upper soil layers (10 cm depth) for the intermittent streams in this storage state. During the wet season, catchment storage at the plateaus on top of the hillslopes become active and contribute to streamflow via subsurface stormflow and shallow groundwater (Martínez-Carrera et al., 2016; Schwab et al., 2017; Beiter et al., 2020). This shift from the dry to wet state of the system and the activation of flow through deeper soil layers may explain the higher importance of the soil moisture in 50 cm depth for the activation of the majority of streamflow responses in the intermittent stream network on slate. Although the soil moisture dynamics do not allow us to draw direct conclusions about groundwater dynamics, local groundwater tables in the slate catchments were found between 0.5 to 3 m depth, and the dynamics were synchronised with the soil moisture dynamics in the unsaturated zone above certain thresholds during the wet season (Martínez-Carreras et al., 2016). A similar high variability and strong intermittency of streamflow during the dry season with hillslope contributions as the predominant source of streamflow and the reconnection of the stream network with the onset of groundwater contributions in the wet season were also observed and modelled by Ward et al. (2018) and Warix et al. (2021).
5.1.2 Factors affecting streamflow responses for sites on marl geology
Overall, the models showed a good ability to separate flow and no-flow responses by soil moisture and temperature data, indicating shallow subsurface stormflow and saturation excess overland flow in the marl geology. The soils on marl geology have the highest hydraulic conductivity in the Attert catchment (Demand et al., 2019). However, marl geology is characterised by a low permeability (Wrede et al., 2015). Beiter et al. (2020) analysed the interaction between precipitation events, local groundwater, and streamflow responses in the subcatchments Beschruederbaach and Schammicht (Fig. 1). They found that, after a dry period, streamflow responses were possible after only a few precipitation events that raised the groundwater level to a threshold level near the surface and thus a transmissivity feedback process. Below that threshold, the dynamics of the groundwater and streamflow were less synchronised. For lower antecedent soil moisture conditions, they found a change towards higher incidences of overland flow and runoff contributions through preferential subsurface flow paths during precipitation events. Also, Wrede et al. (2015) linked the fast responses of event water in the Wollefsbach catchment – a subcatchment in the marl region of the Attert catchment – to the lateral subsurface flow of pre-event water and contributions of event water through preferential pathways. This process is accompanied by saturation-excess overland flow during periods of higher saturation (Wrede et al., 2015). They assume that the deeper groundwater table does not raise above the highly impermeable boundary layer even during the wet season, while the stream ceased to flow during the dry season without major streamflow responses during storm events. Wrede et al. (2015) describe the streamflow responses on marl as flashy, which also agrees with the fast response times for the streamflow responses in the event analysis (Fig. 4f). During low catchment storage, a fast expansion of the stream network followed by a quick but lagging saturation of the upper soil, as described by Jensen et al. (2019), may sustain short-lived streamflow responses during the dry period. In contrast, during the dormant season, a perched saturated zone above the less permeable soil layer, as described by Gutiérrez-Jurado et al. (2019), may develop and sustain the streamflow in the intermittent streams. The findings of Wrede et al. (2015), Demand et al. (2019), and Beiter et al. (2020), combined with the strong dependence of streamflow initiation on soil moisture as indicated by the random forest model, suggest that saturation excess overland flow and shallow subsurface stormflow, which are supported by shallow perched groundwater, are the dominant processes controlling the streamflow responses in the catchments on marls. This finding is supported by the importance of the 14 d API, which indicates an increased probability of streamflow initiation and continuation following larger antecedent precipitation. Demand et al. (2019) also analysed precipitation events for a time period that overlaps with the one in this study and found no events that exceeded the infiltration capacity of the soil matrix for sites in the forests. This finding is in accordance with the low importance of all precipitation measures in the models for sites located in the marl region, which were predominantly forested. This suggests that, in case the shallow storage system becomes saturated, smaller and larger precipitation events can trigger SOF, and this hinders the random forest models from splitting the dataset based on the precipitation characteristics leading to the low importance of these predictors.
Soil temperature was important in the random forest model for the majority of sites in the marl geology (Fig. 9). This underlines the dependency of flow initiation on the seasonal changes in temperature and evapotranspiration in the Attert catchment, which were also found in other temperate catchments (Wrede et al., 2015; Zimmer and McGlynn, 2017).
5.1.3 Factors affecting streamflow responses on sandstone geology
Sandstone is generally characterised by a high permeability which provides a large aquifer storage that feeds permanent springs (Colbach, 2005). The high infiltration capacity limits surface runoff during precipitation events (Wrede et al., 2015). In fact, identifying monitoring sites with a regular intermittency of streamflow was challenging (Kaplan et al., 2019a). As intermittent streamflow in the sandstone is less common, and the relatively low number of initial sites in this geology had to be reduced further after the model evaluation (Fig. 7), a general pattern of typical controls of intermittent streamflow in this geology could not be identified. Thus, the predictor importance and the potential controls on streamflow intermittency are discussed at the site scale rather than for the entire geology.
The sites SA5 and SA9 were quasi-perennial, and the number of events showing no flow was too small for a balanced class representation in the random forest model. However, for site SA6 (Fig. 1), which was located downstream of the two springs feeding the reaches at SA5 and SA9, the dependence on soil moisture, the duration of precipitation events, and the antecedent precipitation was strong. This indicates that either a specific soil moisture threshold or a long period of precipitation is required to produce streamflow and to compensate for the transmission losses. This type of flow cessation through transmission losses has been reported for small catchments with low or moderate channel gradients and coarse sediments (e.g. Constantz et al., 2002; Costa et al., 2013). Streamflow in the perennial streams in the Luxembourg sandstone were associated with the contributions of a large aquifer that provides the necessary storage to sustain continuous baseflow (Wrede et al., 2015). However, in the case of intermittent streams, the existence of shallow perched groundwater storages that develop at the boundary layer between less permeable geology and the overlying permeable sandy geology, as described by Gutiérrez-Jurado et al. (2019, 2021), are likely the source for streamflow at the sites SA5 and SA9.
Sites SA7 and SA8 are located in the marly zones at the foot of sandstone hillslopes (Fig. 1). Both sites may acquire flow from nearby groundwater springs which are also used for drinking water. The two sites also share the same important model predictors, i.e. soil moisture at both depths and temperature. At these sites, the controls on flow cessation during dry periods can either relate to natural controls caused by seasonal fluctuations in soil moisture and transmission losses in the marl layer or can be amplified by higher rates of water withdrawal during the summer. This kind of anthropogenically induced alteration of streamflow intermittency has been reported for many rivers (e.g., Chiu et al., 2017).
The most important predictors for site SA4 were soil moisture at the two depths followed by maximum precipitation intensity and precipitation sum. The geological setting characterised by marl in the upstream part and sandstone in the lower part of the catchment may influence streamflow at this site. In contrast to the other sites, which show a high importance of soil moisture, the streamflow response of SA4 is always flashy, with longer events during periods of high soil moisture. The predictor ranks of maximum and cumulative event precipitation are also comparably high at this site (rank 7 and 8), indicating that large precipitation events are needed to compensate for the transmission losses through the sandy streambed. This assumption is supported by the regularly ceasing streamflow 100 to 150 m downstream of the gauging site (Fig. 1), which is also indicated in the topographic map of the region (Le Gouvernement du Grand-Duché de Luxembourg, 2009).
The stream channel at the site SA1 is characterised by a steeply inclined logging track. The most important predictors at this site are precipitation sum and maximum precipitation intensity, while mean precipitation intensity and cumulative antecedent precipitation and soil moisture are less important predictors. This is a clear indication for infiltration excess overland flow being the main process at this site. This contradicts the findings of Wrede et al. (2015), who considered infiltration excess overland flow to not be a relevant process in the sandstone subcatchment of the Attert, Huewelerbaach. The different result at SA1 might result from the specific setting, where a logging track had been eroded down to the bedrock. Notable traces of finer sediment were found at the flow tracks at the foot of the hillslope, which potentially caused clogging, similar to that described by Shanafield et al. (2020), for intermittent streams crossing different geologies. The most likely reason for the initiation of HOF are the high precipitation sums during the events and the steep slopes of the tracks, as similar conditions were observed to cause HOF on steep slopes in a sandstone catchments (Scherrer and Naef, 2003; Tanaka et al., 2005; Gutiérrez-Juardo et al., 2019, 2021).
5.2 Uncertainties of event analysis and random forest model
This study relied on the availability of precipitation, soil temperature, and soil moisture data. The event classification was based on two assumptions, i.e. (a) the presence of snow can be neglected and (b) every flow response is induced by a rainfall event.Misclassification of the events could happen if (1) precipitation occurs as snowfall, delaying the flow response (e.g. Floyd and Weiler, 2008), (2) water in the channel ceases to flow during a period of temperatures below zero (Tolonen et al., 2019) so that the flow response is not related to a precipitation event and thus ignored by the event analysis, or (3) inaccuracies or gaps in the streamflow observations, as described by Kaplan et al. (2019a). However, scenarios (1) and (2) occur only for short time spans in the studied period, and the streamflow data from time-lapse photography were carefully quality checked. The occurrence of snowfall and frozen water in the channel was validated by the time-lapse images from which the binary streamflow information was obtained (Kaplan et al., 2019a). Freezing and thawing of water in the channel was only the main control of flow cessation and reactivation at the sites MA6, SL21, and potentially influenced the flow responses of SL2 and SL5 (Fig. 3). These sites were rejected by the model evaluation procedure.
Uncertainty of the models can also arise from simplifications or misrepresentation of the predictor data. Soil moisture is highly heterogeneous in space and time. The approach of using averaged soil moisture measured at multiple sites per geology tries to overcome this spatial heterogeneity. The temporal succession of infiltration signals along the sensors in the three depths (10, 30, and 50 cm) was used by Demand et al. (2019) to differentiate between infiltration processes at the plot scale. However, at the scale of a geological unit, the dynamic of soil moisture did not differ as significantly for all depths, so we decided to exclude the soil moisture at 30 cm depth. While the correlation between soil moisture at 10 and 50 cm depth for a whole time series was weaker, that of the soil moisture measures at the event scale extracted for each site were highly correlated for some sites (Figs. S6–S8). Limits in the representability of geology-wide soil moisture were revealed at the sites of the Foulschterbaach catchment, where soil moisture and antecedent precipitation indices were poorly correlated. All sites in the Foulschterbaach have a lower total number of events due to a delayed installation (Fig. 5), but the reason for poor model performance is most likely the non-representative soil moisture data (see also Sect. 5.1.2). Mälicke et al. (2020) identified rainfall and the seasonal dynamics of evapotranspiration as the two major controls of soil moisture in the Colpach catchment. While the seasonal component is expected to be similar in the Colpach and the Foulschterbaach catchment, soil moisture responses to rainfall differ (Fig. 6). Despite the weak representation of soil moisture in this catchment, the value of the general soil moisture dynamics in a catchment geology over the proxy variable API is underlined by the predictor importance of soil moisture in the random forest models. It may be possible that a better representation of the soil moisture dynamics through API can be reached by extending the represented precipitation periods to 30, 64, or 128 d as, for example, used by Zimmermann et al. (2014) or Jensen et al. (2019). However, it needs to be investigated which parameterisation of the API measure fits best for a certain geology or soil type to adequately represent the soil moisture dynamics.
Cases where the random forest models were not able to represent flow responses correctly, were usually caused either by a small test dataset (Ließ et al., 2012) or an imbalance of the modelled classes (Lunardon et al., 2014) and, in the Foulschterbaach watershed, potentially also by the differences between the locations where the predictor data (soil moisture and temperature) were collected and the locations of the gauging sites (i.e. the response variables). The misrepresentation of the soil moisture in the Foulschterbaach catchment by the soil moisture obtained in the Colpach catchment is supported by the very low correlation between the API and soil moisture for the sites in this catchment.
The comparison between the mapped event responses (Fig. 5) and the model specificity and sensitivity (Fig. 8) reveals that the number of events has a large effect on the accuracy of the model. Sites with low numbers of events are MA3, MA23, SA2, and SA3 (Fig. 3). The flow responses classes at the sites SL1 and SL15 (both in the Colpach subcatchment) were highly imbalanced, with significantly more flow (>100) than no-flow responses (4–10). This reduced the likelihood for selecting a representative dataset for the training datasets for these sites. The class imbalance is generally a major problem of all statistical approaches and for those sites that cannot be adequately represented due to small datasets. If resampling approaches, as used in this study, are not able to balance out the classes, then longer study periods with additional events need to be used to overcome this drawback. In cases where the classes are well balanced and sufficient events are available, but the model still has a low performance, it might be an indication that either the data do not match or alternative predictors are needed to describe the modelled dependencies.
Overall, the model accuracy was generally quite high (geology averages from 0.79–0.90) for the selection of models used in the predictor importance analysis. The models for a majority of the sites had excellent performance in predicting flow and no-flow responses, with the test dataset leading to high values of cumulative sensitivity and specificity close to the maximum of 2 (Fig. 7). Despite the good predictions at the sites with the test data, model transfer between sites is not possible due to the site-specific statistics of each random forest. Generally, the random forest approach and the selected predictors were capable of predicting the flow responses at most of the sites. However, for future studies, it would be interesting to see how different event definitions would affect the outcome of model predictor importance and if additional event-based predictors would allow for even higher accuracies of the models. The inclusion of spatial and event-based predictors in future models can provide further interesting insights into the temporal and spatial dynamics of the intermittent stream network. Recent advances of modelling approaches show promising results (Gutiérrez-Jurado et al., 2021; Botter et al., 2021). Ultimately, the model selection has to be tailored to the available data, as data imbalance will remain a challenge for future studies choosing random forest or other statistical approaches.
Uncertainty may also arise from the variation in the catchment sizes. According to the findings of Kaplan et al. (2020a), catchment size is among the strongest spatial predictors of intermittent streamflow occurrence in space in the Attert catchment, thus superimposing the effect of geology. The catchments included in this study have a notable range in size for each geology ranging between 450 and 734 223 m2 (Fig. S1). Catchment size was not included in the analyses when the importance of model predictors at each site was compared to the other sites on the same geology. However, there was no significant correlation between catchment size and parameter importance or mean decrease Gini (Figs. S11–S13).
This study provides insight into the characteristics of rainfall events that either do or do not trigger a streamflow response in intermittent streams in watersheds with a temperate climate. The results underline that controls on intermittent streamflow depend on the geological setting of the catchment. The main findings are summarised as follows:
-
The classification of precipitation events into flow and no-flow responses provided an appropriate basis for further analysis in a random forest model. The random forest model was applied to model flow response classes for each site based on the predictors of precipitation characteristics (Pmean, Pmax, Psums, and PD), antecedent precipitation indices (7 and 14 d API), maximum soil moisture at two depths (θ10 and θ50), and minimum soil temperature. For the majority of the random forest models, maximum soil moisture during the precipitation event was identified as being the main temporal control that could explain the streamflow response.
-
The controls of streamflow responses to precipitation events differed for the three geological regions. In regions characterised by marl geology, the dominant controls were soil moisture in the top soil layer, followed by antecedent precipitation, soil moisture in the deeper soil layer, and soil temperature, suggesting that saturation excess overland flow is the most important processes for streamflow generation. A soil layer of very low permeability at 20 to 50 cm depth may support the development of shallow perched groundwater on marl during the wet periods, which contributes to streamflow. For the slate catchments, soil moisture at 50 cm depth constitutes a slightly stronger predictor and had, on average, higher values to differentiate between flow/no flow in the random forest models than soil moisture in 10 cm depth. This finding corresponds with results from earlier studies that hypothesised that shallow subsurface flow during the drier periods and a fill and spill mechanism at the soil–bedrock interface during the wet periods with higher soil moisture are the dominant control of streamflow generation in the slate region of the Attert. The marl and slate geologies share the importance of the temperature predictor, which is interpreted as an indicator of seasonal changes in evapotranspiration that is known to control of the storage dynamics in the Attert catchment.
-
Overall, soil moisture was the most prominent predictor for intermittency in the random forest models for the sites in the sandstone region in this study. However, a detailed evaluation of sites in the sandstone regions revealed either parts of marl geology in the contributing area or the presence of permanent springs, which are likely to be located at the marl–sandstone boundary. In both cases, streamflow intermittency is likely caused by transmission losses. Only one site, which might be the most representative site for streamflow intermittency in sandstone, showed ephemeral streamflow controlled solely by precipitation and infiltration excess overland flow. Due to the limited number of sites with intermittent streamflow in the sandstone geology, no overarching pattern of streamflow controls could be identified.
The combined dataset of intermittent streamflow observations, precipitation, soil moisture, and soil temperature and the methodology of using classified events in a random forest modelling approach allowed us to identify characteristic controls of streamflow intermittency in the marl and slate geologies. Overall, the results of this study highlight the importance of soil moisture and temperature as controls of intermittency in a temperate climate and the different controls in the three geological settings. This study demonstrates the value of high temporal resolution data which capture the changes in flow/no flow in intermittent streams. Future studies are needed to increase the understanding of the spatiotemporal controls of streamflow intermittency by analysing it at geological boundary zones in the headwater catchments of the temperate climates and require data at an adequately high temporal and spatial resolution.
The underlying streamflow intermittency data are available at https://doi.org/10.5880/FIDGEO.2019.010 and are described in detail by Kaplan et al. (2019b). Data and the analysis code are available from the authors upon request.
The supplement related to this article is available online at: https://doi.org/10.5194/hess-26-2671-2022-supplement.
NHK installed the monitoring network of time-lapse cameras, prepared the data, and designed the analysis and carried it out. TB and MW designed the overall study and the sensor cluster monitoring network. NHK prepared the paper, with contributions from the co-authors TB and MW.
At least one of the (co-)authors is a member of the editorial board of Hydrology and Earth System Sciences. The peer-review process was guided by an independent editor, and the authors also have no other competing interests to declare.
Publisher's note: Copernicus Publications remains neutral with regard to jurisdictional claims in published maps and institutional affiliations.
This study was funded by the German Research Foundation (DFG) within the Research Unit FOR 1598 Catchments As Organized Systems (CAOS) – subproject G – “Hydrological connectivity and its controls on hillslope and catchment scale streamflow generation”. We thank Malte Neuper and Uwe Ehret, for providing the precipitation data. We are grateful for the work of Britta Kattenstroth and Tobias Vetter, who were responsible for the installation, maintenance, and data processing at the soil moisture and temperature sensor measurement sites. We thank our project partners from the Catchment and Eco-hydrology group at the Luxembourg Institute for Science and Technology (LIST), who provided the geodata for the catchment overview. Special thanks to Dominic Demand and Daniel Beiter, for the helpful discussions about event classification. We would like to thank Karina Gutierrez and one anonymous referee, who provided suggestions for significant improvements to the study and the paper.
This research has been supported by the Deutsche Forschungsgemeinschaft (grant no. Research Unit FOR 1598).
This open-access publication was funded by the University of Freiburg.
This paper was edited by Roberto Greco and reviewed by Karina Gutierrez and one anonymous referee.
Angermann, L., Jackisch, C., Allroggen, N., Sprenger, M., Zehe, E., Tronicke, J., Weiler, M., and Blume, T.: Form and function in hillslope hydrology: characterization of subsurface flow based on response observations, Hydrol. Earth Syst. Sci., 21, 3727–3748, https://doi.org/10.5194/hess-21-3727-2017, 2017.
Bachmair, S. and Weiler, M.: Interactions and connectivity between runoff generation processes of different spatial scales, Hydrol. Process., 28, 1916–1930, https://doi.org/10.1002/hyp.9705, 2014.
Beiter, D., Weiler, M., and Blume, T.: Characterising hillslope–stream connectivity with a joint event analysis of stream and groundwater levels, Hydrol. Earth Syst. Sci., 24, 5713–5744, https://doi.org/10.5194/hess-24-5713-2020, 2020.
Bhamjee, R., Lindsay, J. B., and Cockburn, J.: Monitoring ephemeral headwater streams: a paired-sensor approach, Hydrol. Process., 30, 888–898, https://doi.org/10.1002/hyp.10677, 2016.
Botter, G., Vingiani, F., Senatore, A., Jensen, C., Weiler, M., McGuire, K., Mendicino, G., and Durighetto, N.: Hierarchical climate-driven dynamics of the active channel length in temporary streams, Sci. Rep., 11, 21503, https://doi.org/10.1038/s41598-021-00922-2, 2021.
Boulton, A. J., Rolls, R. J., Jaeger, K. L., and Datry, T.: Chapter 2.3 – Hydrological Connectivity in Intermittent Rivers and Ephemeral Streams, in: Intermittent Rivers and Ephemeral Streams, edited by: Datry, T., Bonada, N., and Boulton, A., Academic Press, 79–108, ISBN 9780128038352, https://doi.org/10.1016/B978-0-12-803835-2.00004-8, 2017.
Breiman, L.: Random Forests, Mach. Learn., 45, 5–32, 2001.
Budyko, M. I.: Climate and life, in: International geophysics series, 18, Academic Press, New York, ISBN 9780080954530, 1974.
Busch, M. H., Costigan, K. H., Fritz, K. M., Datry, T., Krabbenhoft, C. A., Hammond, J. C., Zimmer, M., Olden, J. D., Burrows, R. M., Dodds, W. K., Boersma, K. S., Shanafield, M., Kampf, S. K., Mims, M. C., Bogan, M. T., Ward, A. S., Perez Rocha, M., Godsey, S., Allen, G. H., Blaszczak, J. R., Jones, C. N., and Allen, D. C.: What's in a Name? Patterns, Trends, and Suggestions for Defining Non-Perennial Rivers and Streams, Water, 12, 1980, https://doi.org/10.3390/w12071980, 2020.
Buttle, J. M., Boon, S., Peters, D. L., Spence, C., van Meerveld, H. J. (I.), and Whitfield, P. H.: An Overview of Temporary Stream Hydrology in Canada, Can. Water Resour. J., 37, 279–310, https://doi.org/10.4296/cwrj2011-903, 2012.
Calle, M. L. and Urrea, V.: Letter to the Editor: Stability of Random Forest importance measures, Brief. Bioinform., 12, 86–89, https://doi.org/10.1093/bib/bbq011, 2010.
Cammeraat, L. H., Sevink, J., Hissler, C., Juilleret, J., Jansen, B., Kooijman, A. M., Pfister, L., and Verstraten, J. M.: Soils of the Luxembourg Lias Cuesta Landscape, in: Kooijman, A. M., Seijmonsbergen, A. C., and Cammeraat, L. H., The Luxembourg Gutland Landscape, Springer, 107–130, https://doi.org/10.1007/978-3-319-65543-7_6, 2018.
Chiu, M., Leigh, C., Mazor, R., Cid, N., and Resh, V.: Chapter 5.1 – Anthropogenic Threats to Intermittent Rivers and Ephemeral Streams, in: Intermittent Rivers and Ephemeral Streams, edited by: Datry, T., Bonada, N., and Boulton, A., Academic Press, 433–454, ISBN 9780128038352, https://doi.org/10.1016/B978-0-12-803835-2.00017-6, 2017.
Colbach, R.: Overview of the geology of the Luxembourg Sandstone(s), Ferrantia, 44, 155–160, 2005.
Constantz, J., Stewart, A. E., Niswonger, R., and Sarma, L.: Analysis of temperature profiles for investigating stream losses beneath ephemeral channels, Water Resour. Res., 38, 1316, https://doi.org/10.1029/2001WR001221, 2002.
Costa, A. C., Foerster, S., de Araújo, J. C., and Bronstert, A.: Analysis of channel transmission losses in a dryland river reach in north-eastern Brazil using streamflow series, groundwater level series and multi-temporal satellite data, Hydrol. Process., 27, 1046–1060, https://doi.org/10.1002/hyp.9243, 2013.
Costigan, K. H., Jaeger, K. L., Goss, C. W., Fritz, K. M., and Goebel, P. C.: Understanding controls on flow permanence in intermittent rivers to aid ecological research: integrating meteorology, geology and land cover, Ecohydrology, 9, 7, https://doi.org/10.1002/eco.1712, 2016.
Datry, D., Larned, S. T., and Tockner, K.: Intermittent Rivers: A Challenge for Freshwater Ecology, BioScience 64, 229–235, https://doi.org/10.1093/biosci/bit027, 2014.
Datry, T., Bondana, N., and Boulton, A. J.: Chapter 1 – General introduction, in: Intermittent Rivers and Ephemeral Streams – Ecology and Management, edited by: Datry, T., Bondana, N., and Boulton, A. J., Academic Press, London, https://doi.org/10.1016/B978-0-12-803835-2.00001-2, 2017.
Demand, D., Blume, T., and Weiler, M.: Spatio-temporal relevance and controls of preferential flow at the landscape scale, Hydrol. Earth Syst. Sci., 23, 4869–4889, https://doi.org/10.5194/hess-23-4869-2019, 2019.
Dunne, T. and Black, R. D.: Partial area contributions to storm runoff in a Small New England Watershed, Water Resour. Res., 6, 1296–1311, 1970.
Durighetto, N., Vingiani, F.,Bertassello, L. E., Camporese, M., and Botter, G.: Intraseasonal drainage network dynamics in a headwater catchment of the Italian Alps, Water Resour. Res., 56, e2019WR025563, https://doi.org/10.1029/2019WR025563, 2020.
Eng, K., Wolock, D. M., and Dettinger, M. D.: Sensitivity of intermittent streams to climate variations in the USA, River Res. Appl., 32, 885–895, https://doi.org/10.1002/rra.2939, 2016.
Floyd, W. and Weiler, M.: Measuring snow accumulation and ablation dynamics during rain-on-snow events: innovative measurement techniques, Hydrol. Process., 22, 4805–4812, https://doi.org/10.1002/hyp.7142, 2008.
Fritz, K. M., Nadeau, T.-L., Kelso, J. E., Beck, W. S., Mazor, R. D., Harrington, R. A., and Topping B. J.: Classifying Streamflow Duration: The Scientific Basis and an Operational Framework for Method Development, Water 12, 2545, https://doi.org/10.3390/w12092545, 2020.
Godsey, S. E. and Kirchner, J. W.: Dynamic, discontinuous stream networks: hydrologically driven variations in active drainage density, flowing channels and stream order, Hydrol. Process., 28, 5791–5803, https://doi.org/10.1002/hyp.10310, 2014.
Goodrich, D. C., Kepner, W. G., Levick, L. R., and Wigington Jr., P. J.: Southwestern intermittent and ephemeral stream connectivity, J. Am. Water Resour. Assoc., 54, 400–422, https://doi.org/10.1111/1752-1688.12636, 2018.
Gutiérrez-Jurado, K. Y., Partington, D., Batelaan, O., Cook, P., and Shanafield, M.: What triggers streamflow for intermittent rivers and ephemeral streams in low-gradient catchments in Mediterranean climates, Water Resour. Res., 55, 9926–9946, https://doi.org/10.1029/2019WR025041, 2019.
Gutiérrez-Jurado, K. Y., Partington, and Shanafield, M.: Taking theory to the field: streamflow generation mechanisms in an intermittent Mediterranean catchment, Hydrol. Earth Syst. Sci., 25, 4299–4317, https://doi.org/10.5194/hess-25-4299-2021, 2021.
Heggen, J. R.: Normalized Antecedent Precipitation Index, J. Hydrol. Eng., 6, 377–381, 2001.
Hellebrand, H., van den Bos, R., Hoffmann, L., Juilleret, J., and Pfister, L.: The potential of winter stormflow coefficients for hydrological regionalization purposes in poorly gauged basins of the middle Rhine region, Hydrolog. Sci. J., 53, 773–788, https://doi.org/10.1623/hysj.53.4.773, 2008.
Horton, R. E.: The role of infiltration in the hydrological cycle, Eos Trans. Am. Geophys. Union, 14, 460–466, 1933.
Jackisch, C., Angermann, L., Allroggen, N., Sprenger, M., Blume, T., Tronicke, J., and Zehe, E.: Form and function in hillslope hydrology: in situ imaging and characterization of flow-relevant structures, Hydrol. Earth Syst. Sci., 21, 3749–3775, https://doi.org/10.5194/hess-21-3749-2017, 2017.
Jaeger, K. L. and Olden, J. D.: Electrical Resistance Sensor Arrays as a Means to Quantify Longitudinal Connectivity of Rivers, River Res. Appl., 28, 1843–1852, https://doi.org/10.1002/rra.1554, 2012.
Jaeger, K. L., Sando, R., McShane, R. R., Dunham, J. B., Hockman-Wert, D. P., Kaiser, K. E., Hafen, K., Risley, J. C., and Blasch, K. W.: Probability of Streamflow Permanence Model (PROSPER): A spatially continuous model of annual streamflow permanence throughout the Pacific Northwest, J. Hydrol., 2, 100005, https://doi.org/10.1016/j.hydroa.2018.100005, 2019.
James, A. L. and Roulet, N. T.: Antecedent moisture conditions and catchment morphology as controls on spatial patterns of runoff generation in small forest catchments, J. Hydrol., 377, 351–366, https://doi.org/10.1016/j.jhydrol.2009.08.039, 2009.
Jencso, K. G. and McGlynn, B. L.: Hierarchical controls on runoff generation: Topographically driven hydrologic connectivity, geology, and vegetation, Water Resour. Res., 47, W11527, https://doi.org/10.1029/2011WR010666, 2011.
Jensen, C. K., McGuire, K. J., and Prince, P. S.: Headwater stream length dynamics across four physiographic provinces of the Appalachian Highlands, Hydrol. Process., 31, 3350–3363, https://doi.org/10.1002/hyp.11259, 2017.
Jensen, C. K., McGuire, K. J., Shao, Y., and Dolloff, C. A.: Modeling wet headwater stream networks across multiole flow conditions in the Appalachian Highlands, Earth Surf. Proc. Land., 43, 2762–2778, https://doi.org/10.1002/esp.4431, 2018.
Jensen, C. K., McGuire, K. J., McLaughlin, D. L., and Scott, D. T.: Quantifying spatiotemporal variation in headwater stream length using flow intermittency sensors, Environ. Monit. Assess., 191, 226, https://doi.org/10.1007/s10661-019-7373-8, 2019.
Kaplan, N. H., Sohrt, E., Blume, T., and Weiler, M.: Monitoring ephemeral, intermittent and perennial streamflow: a dataset from 182 sites in the Attert catchment, Luxembourg, Earth Syst. Sci. Data, 11, 1363–1374, https://doi.org/10.5194/essd-11-1363-2019, 2019a.
Kaplan, N. H., Sohrt, E., Blume, T., and Weiler, M.: Time series of streamflow occurrence from 182 sites in ephemeral, intermittent and perennial streams in the Attert catchment, Luxembourg, V. 2.0, GFZ Data Services [data set], https://doi.org/10.5880/FIDGEO.2019.010, 2019b.
Kaplan, N. H., Blume, T., and Weiler, M.: Predicting probabilities of streamflow intermittency across a temperate mesoscale catchment, Hydrol. Earth Syst. Sci., 24, 5453–5472, https://doi.org/10.5194/hess-24-5453-2020, 2020a.
Kaplan, N. H., Blume, T., and Weiler, M.: Supplement of Predicting probabilities of streamflow intermittency across a temperate mesoscale catchment, Hydrol. Earth Syst. Sci., 24, 5453–5472, https://doi.org/10.5194/hess-24-5453-2020, 2020b.
Kohler, M. A. and Linsley Jr., R. K.: Predicting runoff from storm rainfall. Res. Paper 34, US Weather Bureau, Washington, DC, https://www.nrc.gov/docs/ML0819/ML081900279.pdf (last access: 17 May 2022), 1951.
Kuhn, M., Wing, J., Weston, S., Williams, A., Keefer, C., Engelhardt, A., Cooper, T., Mayer, Z., Kenkel, B., the R Core Team, Benesty, M., Lescarbeau, R., Ziem, A., Scrucca, L., Tang, Y., and Candan, C.: caret: Classification and Regression Training, R package version 6.0-71, https://CRAN.R-project.org/package=caret (last access: 16 November 2020), 2015.
La Torre Torres, I. B. L. T., Amatya, D. M., Sun, G., and Callahan, T. J.: Seasonal rainfall–runoff relationships in a lowland forested watershed in the southeastern USA, Hydrol. Process., 25, 2032–2045, https://doi.org/10.1002/hyp.7955, 2011.
Le Gouvernement du Grand-Duché de Luxembourg – Administration du cadastre et de la topographie: Carte Topographique régionale touristique, R4 Steinfort, Redange, Luxembourg, 2009.
Liaw, A. and Wiener, M.: Classification and Regression by randomForest, R News, 2, 18–22, 2002.
Ließ, M., Glaser, B., and Huwe, B.: Uncertainty in the spatial prediction of soil texture: Comparison of regression tree and Random Forest models, Geoderma, 170, 70–79, https://doi.org/10.1016/j.geoderma.2011.10.010, 2012.
Louppe, G., Wehenkel, L., Sutera, A., and Geurts, P.: Understanding variable importances in forests of randomized trees, in: Volume 1, NIPS'13: Proceedings of the 26th International Conference on Neural Information Processing Systems, December 2013, 431–439, https://proceedings.neurips.cc/paper/2013/file/e3796ae838835da0b6f6ea37bcf8bcb7-Paper.pdf (last access: 17 May 2022), 2013.
Lunardon, N., Menardi, G., and Torelli, N.: ROSE: a Package for Binary Imbalanced Learning, R Journal, 6, 82–92, 2014.
Mälicke, M., Hassler, S. K., Blume, T., Weiler, M., and Zehe, E.: Soil moisture: variable in space but redundant in time, Hydrol. Earth Syst. Sci., 24, 2633–2653, https://doi.org/10.5194/hess-24-2633-2020, 2020.
Martínez-Carreras, N., Krein, A., Gallart, F., Iffly, J.-F., Hissler, C., Pfister, L., Hoffmann, L., and Owens, P. N.: The Influence of Sediment Sources and Hydrologic Events on the Nutrient and Metal Content of Fine-Grained Sediments (Attert River Basin, Luxembourg), Water Air Soil Poll., 223, 5685–5705, https://doi.org/10.1007/s11270-012-1307-1, 2012.
Martínez-Carreras, N., Hissler, C., Gourdol, L., Klaus, L., Juilleret, J., Iffly, J. F., and Pfister, L.: Storage controls on the generation of double peak hydrographs in a forested headwater catchment, J. Hydrol., 543, 255–269, https://doi.org/10.1016/j.jhydrol.2016.10.004, 2016.
Moreno-de-las-Heras, M., Merino-Martín, L., Saco, P. M., Espigares, T., Gallart, F., and Nicolau, J. M.: Structural and functional control of surface-patch to hillslope runoff and sediment connectivity in Mediterranean dry reclaimed slope systems, Hydrol. Earth Syst. Sci., 24, 2855–2872, https://doi.org/10.5194/hess-24-2855-2020, 2020.
Müller, B., Bernhardt, M., Jackisch, C., and Schulz, K.: Estimating spatially distributed soil texture using time series of thermal remote sensing – a case study in central Europe, Hydrol. Earth Syst. Sci., 20, 3765–3775, https://doi.org/10.5194/hess-20-3765-2016, 2016.
Neuper, M. and Ehret, U.: Quantitative precipitation estimation with weather radar using a data- and information-based approach, Hydrol. Earth Syst. Sci., 23, 3711–3733, https://doi.org/10.5194/hess-23-3711-2019, 2019.
Olson, S. A. and Brouillette, M. C.: A logistic regression equation for estimating the probability of a stream in Vermont having intermittent flow, US Geological Survey Scientific Investigations Report 2006-5217, US Geological Survey, p. 15, https://pubs.usgs.gov/sir/2006/5217/ (last access: 16 November 2020), 2006.
Penna, D., Tromp-van Meerveld, H. J., Gobbi, A., Borga, M., and Dalla Fontana, G.: The influence of soil moisture on threshold runoff generation processes in an alpine headwater catchment, Hydrol. Earth Syst. Sci., 15, 689–702, https://doi.org/10.5194/hess-15-689-2011, 2011.
Penna, D., van Meerveld, H. J., Oliviero, O., Zuecco, G., Assendelft, R. S., Dalla Fontana, G., and Borga, M.: Seasonal changes in runoff generation in a small forested mountain catchment, Hydrol. Process., 29, 2027–2042, https://doi.org/10.1002/hyp.10347, 2015.
Pfister, L., Martínez-Carreras, N., Hissler, C., Klaus, J., Carrer, G. E., Stewart, M. K., and McDonnell, J. J.: Bedrock geology controls on catchment storage, mixing, and release: A comparative analysis of 16 nested catchments, Hydrol. Process., 31, 1828–1845, https://doi.org/10.1002/hyp.11134, 2017.
Pfister, L., Hissler, C., Iffly, J. F., Coenders, M., Teuling, R., Arens, A., and Cammeraat, L. H.: Contrasting Hydrologic Response in the Cuesta Landscapes of Luxembourg, in: The Luxembourg Gutland Landscape, edited by: Kooijman, A., Cammeraat, L., and Seijmonsbergen, A., Springer, Cham, https://doi.org/10.1007/978-3-319-65543-7_4, 2018.
Prancevic, J. P. and Kirchner, J. W.: Topographic Controls on the Extension and Retraction of Flowing Streams, Geophys. Res. Lett., 46, 2084–2092, https://doi.org/10.1029/2018GL081799, 2019.
Reynolds, L. V., Shafroth P. B., and Poff, N. L.: Modeled intermittency risk for small streams in the Upper Colorado River Basin under climate change, J. Hydrol., 523, 768–780, https://doi.org/10.1016/j.jhydrol.2015.02.025, 2015.
Ries, F., Schmidt, S., Sauter, M., and Lange, J.: Controls on runoff generation along a steep climatic gradientin the Eastern Mediterranean, J. Hydrol.: Reg. Stud., 9, 18–33, https://doi.org/10.1016/j.ejrh.2016.11.001, 2017.
Sando, R. and Blasch, K. W.: Predicting alpine headwater stream intermittency: a case study in the northern Rocky Mountains, Ecohydrol. Hydrobiol., 15, 68–80, https://doi.org/10.1016/j.ecohyd.2015.04.002, 2015.
Schaich, H., Karier, J., and Konold, W.: Rivers, Regulation and Restoration: Land Use History of Floodplains in a Peri-Urban Landscape in Luxembourg, 1777–2000, Europ. Countrys, 4, 241–264, https://doi.org/10.2478/v10091-012-0007-6, 2011.
Scherrer, S. and Naef, F.: A decision scheme to indicate dominant hydrological flow processes on temperate grassland, Hydrol. Process., 17, 391–401, https://doi.org/10.1002/hyp.1131, 2003.
Schwab, M. P., Klaus, J., Pfister, L., and Weiler, M.: How runoff components affect the export of DOC and nitrate: a long-term and high-frequency analysis, Hydrol. Earth Syst. Sci. Discuss. [preprint], https://doi.org/10.5194/hess-2017-416, 2017.
Shanafield, M., Gutiérrez-Jurado, K., White, N., Hatch, M., and Keane R.: Catchment-scale characterization of intermittent stream infiltration; a geophysics approach, J. Geophys. Res.-Earth, 125, e2019JF005330, https://doi.org/10.1029/2019JF005330, 2020.
Shaw, S. B.: Investigating the linkage between streamflow recession rates and channel network contraction in a mesoscale catchment in New York state, Hydrol. Process., 30, 479–492, https://doi.org/10.1002/hyp.10626, 2016.
Sidle, R. C., Tsuboyama, Y., Noguchi, S., Hosoda, I., Fujieda, M., and Shimizu, T.: Seasonal hydrologic response at various spatial scales in a small forested catchment, Hitachi Ohta, Japan, J. Hydrol., 168, 227–250, https://doi.org/10.1016/0022-1694(94)02639-S, 1995.
Sophocleous, M.: Interactions between groundwater and surface water: the state of the science, Hydrogeol. J., 10, 52–67, https://doi.org/10.1007/s10040-001-0170-8, 2002.
Sprenger, M., Volkmann, T. H. M., Blume, T., and Weiler, M.: Estimating flow and transport parameters in the unsaturated zone with pore water stable isotopes, Hydrol. Earth Syst. Sci., 19, 2617–2635, https://doi.org/10.5194/hess-19-2617-2015, 2015.
Stewart, R. D., Bhaskar, A.S., Parolari, A. J., Herrmann, D. L., Jian, J., Schifman, L. A., and Shuster, W. D.: An analytical approach to ascertain saturation-excess versus infiltration-excess overland flow in urban and reference landscapes, Hydrol. Process., 33, 3349–3363, https://doi.org/10.1002/hyp.13562, 2019.
Tanaka, Y., Matsukura, Y., Batnasan, N., and Tuvshinjargal, D.: Distinct runoff processes in granite and sandstone drainage basins near Ulaanbaatar, Mongolia, Environ. Geol., 47, 640–646, https://doi.org/10.1007/s00254-004-1189-7, 2005.
Tolonen, K. E., Picazo, F., Vilmi, A., Datry, T., Stubbington, R., Pařil, P., Rocha, M. P., and Heino, J.: Parallels and contrasts between intermittently freezing and drying streams: From individual adaptations to biodiversity variation, Freshwater Biol., 64, 1679–1691, https://doi.org/10.1111/fwb.13373, 2019.
Trancoso, R., Phinn, S., McVicar, T. R., Larsen, J. R., and McAlpine, C. A.: Regional variation in streamflow drivers across a continental climatic gradient, Ecohydrology, 10, 1816, https://doi.org/10.1002/eco.1816, 2016.
Tromp-van Meerveld, H. J. and McDonnell, J. J.: On the interrelations between topography, soil depth, soil moisture, transpiration rates and species distribution at the hillslope scale, Adv. Water Resour., 29, 293–310, 2006.
Uys, M. C. and O'Keeffe, J. H.: Simple Words and Fuzzy Zones: Early Directions for Temporary River Research in South Afrika, Environ. Manage., 21, 517–531, 1997.
Ward, A. S., Schmadel, N. M., and Wondzell, S. M.: Simulation of dynamic expansion, contraction, and connectivity in a mountain stream network. Adv. Water Resour., 114, 64–82, 2018.
Warix, S. R., Godsey, S. E., Lohse, K. A., and Hale, R. L.: Influence of groundwater and topography on stream drying in semi-arid headwater streams, Hydrol. Process., 35, e14185, https://doi.org/10.1002/hyp.14185, 2021.
Weyman, D. R.: Measurements of the downslope flow of water in a soil. J. Hydrol., 20, 267–288, 1973.
Wiekenkamp, I., Huisman, J. A., Bogena, H. R., Lin, H. S., and Vereecken, H.: Spatial and temporal occurrence of preferential flow in a forested headwater catchment, J. Hydrol., 534, 139–149, https://doi.org/10.1016/j.jhydrol.2015.12.050, 2016.
Wrede, S., Fenicia, F., Martínez-Carreras, N., Juilleret, J., Hissler, C., Krein, A., Savenije, H. H. G., Uhlenbrook, S., Kavetski, D., and Pfister, L.: Towards more systematic perceptual model development: a case study using 3 Luxembourgish catchments, Hydrol. Process., 29, 2731–2750, https://doi.org/10.1002/hyp.10393, 2015.
Zehe, E., Elsenbeer, H., Lindenmaier, F., Schulz, K., and Blöschl, G.: Patterns of predictability in hydrological threshold systems, Water Resour. Res., 43, W07434, https://doi.org/10.1029/2006WR005589, 2007.
Zehe, E., Ehret, U., Pfister, L., Blume, T., Schröder, B., Westhoff, M., Jackisch, C., Schymanski, S. J., Weiler, M., Schulz, K., Allroggen, N., Tronicke, J., van Schaik, L., Dietrich, P., Scherer, U., Eccard, J., Wulfmeyer, V., and Kleidon, A.: HESS Opinions: From response units to functional units: a thermodynamic reinterpretation of the HRU concept to link spatial organization and functioning of intermediate scale catchments, Hydrol. Earth Syst. Sci., 18, 4635–4655, https://doi.org/10.5194/hess-18-4635-2014, 2014.
Zimmer, M. A. and McGlynn, B. L.: Ephemeral and intermittent runoff generation processes in a low relief, highly weathered catchment, Water Resour. Res., 53, 7055–7077, https://doi.org/10.1002/2016WR019742, 2017.
Zimmermann, B., Zimmermann, A., Turner, B. L., Francke, T., and Elsenbeer, H.: Connectivity of overland flow by drainage network expansion in a rain forest catchment, Water Resour. Res., 50, 1457–1473, https://doi.org/10.1002/2012WR012660, 2014.