the Creative Commons Attribution 4.0 License.
the Creative Commons Attribution 4.0 License.
 | 02 May 2022
Coupled modelling of hydrological processes and grassland production in two contrasting climates
Jannis Groh
Elisabet Lewan
Katharina H. E. Meurer
Walter Durka
Cornelia Baessler
Thomas Pütz
Elvin Rufullayev
Harry Vereecken
Projections of global climate models suggest that ongoing human-induced climate change will lead to an increase in the frequency of severe droughts in many important agricultural regions of the world. Eco-hydrological models that integrate current understanding of the interacting processes governing soil water balance and plant growth may be useful tools to predict the impacts of climate change on crop production. However, the validation status of these models for making predictions under climate change is still unclear, since few suitable datasets are available for model testing. One promising approach is to test models using data obtained in “space-for-time” substitution experiments, in which samples are transferred among locations with contrasting current climates in order to mimic future climatic conditions. An important advantage of this approach is that the soil type is the same, so that differences in soil properties are not confounded with the influence of climate on water balance and crop growth. In this study, we evaluate the capability of a relatively simple eco-hydrological model to reproduce 6 years (2013–2018) of measurements of soil water contents, water balance components and grass production made in weighing lysimeters located at two sites within the TERENO-SoilCan network in Germany. Three lysimeters are located at an upland site at Rollesbroich with a cool, wet climate, while three others had been moved from Rollesbroich to a warmer and drier climate on the lower Rhine valley floodplain at Selhausen. Four of the most sensitive parameters in the model were treated as uncertain within the framework of the GLUE (generalized likelihood uncertainty estimation) methodology, while the remaining parameters in the model were set according to site measurements or data in the literature.
The model satisfactorily reproduced the measurements at both sites, and some significant differences in the posterior ranges of the four uncertain parameters were found. In particular, the results indicated greater stomatal conductance as well an increase in dry-matter allocation below ground and a significantly larger maximum root depth for the three lysimeters that had been moved to Selhausen. As a consequence, the apparent water use efficiency (above-ground harvest divided by evapotranspiration) was significantly smaller at Selhausen than Rollesbroich. Data on species abundance on the lysimeters provide one possible explanation for the differences in the plant traits at the two sites derived from model calibration. These observations showed that the plant community at Selhausen had changed significantly in response to the drier climate, with a significant decrease in the abundance of herbs and an increase in the proportion of grass species. The differences in root depth and leaf conductance may also be a consequence of plasticity or acclimation at the species level. Regardless of the reason, we may conclude that such adaptations introduce significant additional uncertainties into model predictions of water balance and plant growth in response to climate change.
- Article
(2671 KB) - Full-text XML
-
Supplement
(672 KB) - BibTeX
- EndNote


Projections of global climate models suggest that ongoing human-induced climate change will lead to an increase in the frequency of severe droughts (Ruane et al., 2018). This may seriously impact production in many important agricultural regions of the world (Tubiello et al., 2007), including managed grasslands (e.g. Kipling et al., 2016; Stanimirova et al., 2019), since key forage species are known to be sensitive to drought (Norris, 1982; Coleman et al., 1989; Silvertown et al., 1994; Jenkinson et al., 1994; Volaire et al., 1998; Meurer et al., 2019). Grasslands are also of major importance in the context of climate change mitigation, since they cover ca. 70 % of the global agricultural land area (Foley et al., 2011) and represent a large store of soil organic carbon (SOC) (Li et al., 2018; Bossio et al., 2020). Soil water status affects plant growth through a complex web of direct and indirect mechanisms (Körner, 2015; White et al., 2016; Tardieu et al., 2018; Loka et al., 2019; Gupta et al., 2020). In turn, plant growth, both above and below ground, influences the soil water balance through important feedback mechanisms, particularly the regulation of transpiration by leaf area as well as the control of water supply from the soil by root length density and its distribution with depth (Monteith, 1986, 1988; Tardieu et al., 2017). Thus, realistic models of the coupled processes of root water uptake, transpiration and plant growth are required to predict reliably the impacts of climate change on the future productive potential of grassland. Eco-hydrological models that attempt to capture these interactions in the soil–plant system are widely used in climate change studies that focus on the prediction of latent and sensible heat fluxes and CO2 exchange between the land surface and the atmosphere (e.g. Fatichi et al., 2016; Klein et al., 2017; Kellner et al., 2017). Similarly, soil–crop models that integrate current understanding of the interacting processes governing water balance, SOC and nutrient cycling and crop growth (e.g. Robertson et al., 2015; Wu et al., 2016; Stöckle and Kemanian, 2020) are often used as tools to predict the impacts of land use or climate change on crop production and the environment (e.g. Eckersten et al., 2012). These two types of simulation model share many similarities. In the following, we refer to them collectively as SVAT (soil–vegetation–atmosphere transfer) models.
SVAT models employ empirical (or phenomenological) approaches to describe many of the key processes in the soil–plant system. This is especially the case for the processes governing plant growth because the underlying mechanisms are extremely complex and not easily amenable to fundamental descriptions (Boote et al., 2013; Wu et al., 2016). This means that great care is needed in model calibration exercises, given the usual paucity of experimental data in relation to the number of model parameters. In such cases, parameter errors may often compensate for model deficiencies, leading to non-unique solutions or “equifinality” (Beven and Binley, 1992; Beven, 2006). Parameter uncertainty has not always been considered in SVAT model applications (Seidel et al., 2018). Thus, even though a model performs satisfactorily, it may be doing so for the wrong reasons (Kirchner, 2006). As a consequence, model predictions, for example, for a future climate, can be seriously in error (Kersebaum et al., 2007, 2015; Bellocchi et al., 2010; He et al., 2017). In this respect, despite their great potential, it is not yet clear how accurately SVAT models can predict the soil water balance and production potential of grasslands in a changing climate because few suitably comprehensive datasets have been available to unequivocally constrain them in model calibration exercises. Several SVAT models specifically designed for grassland agro-ecosystems have been developed (e.g. Jouven et al., 2006a, b; Johnson et al., 2008; Jing et al., 2012; Persson et al., 2014). However, with only a few exceptions, previous studies have focused on calibrating these models against data on above-ground biomass production at single sites, with scant focus on hydrological processes and below-ground biomass, and with little attention paid to parameter uncertainty. In a test of the “PaSim” grassland model at the regional scale, Ma et al. (2015) found that although CO2 and water fluxes between the land surface and atmosphere were reasonably well matched, soil water contents were not accurately simulated during dry periods. Similarly, in a multi-model and multi-site validation exercise, Sándor et al. (2017) noted a variable model performance at sites with contrasting climates. In particular, they demonstrated a failure of the models to correctly simulate root water uptake patterns and biomass production in dry summers and at dry sites. Even though most grassland species are generally comparatively shallow-rooted (Jackson et al., 1996), several previous studies have highlighted the role of sparsely distributed deeper roots in maintaining water uptake, transpiration and growth during droughts (e.g. Kemp and Culvenor, 1994; Volaire et al., 1998; Bonos and Murphy, 1999; Zwicke et al., 2015). This suggests that models of root water uptake for grass must account for compensatory mechanisms, whereby water uptake increases from sparsely rooted wetter soil layers to compensate for reductions in water uptake in densely rooted but dry soil (Jarvis, 2011; Cai et al., 2017).
Manipulation experiments have been carried out to simulate the effects of climate change on grasslands in which plant growth has been monitored following controlled alterations in the precipitation regime (e.g. reduced rainfall amount or frequency). However, nearly all of these experiments are of a short-term nature, and the treatments imposed have often been extreme and thus not well adapted to climate model projections (e.g. Beier et al., 2012; Hoover et al., 2018). Furthermore, with only a few exceptions (e.g. Bollig and Feller, 2014), drought manipulation experiments have not focused much on the complex interactions between soil hydrological processes, water stress and plant growth, despite their importance. Thus, in most cases, the mechanisms controlling the observed growth responses have not been elucidated in detail, while few data are available from these experiments that could support and test model predictions (Beier et al., 2012; Hoover et al., 2018). An alternative approach is to test model performance against data obtained in “space-for-time” substitution experiments, in which samples are transferred among sites with contrasting current climates in order to approximately mimic likely future climate conditions (Ineson et al., 1998; Pütz et al., 2016). One important advantage of this approach is that the soil type is the same, so that differences in soil properties are not confounded with the influence of climate on soil hydrology and crop growth. Weighing lysimeters are highly suitable study objects in this context, since they enable the measurement of a complete (closed) water balance (Wegehenkel et al., 2008; Heinlein et al., 2017; Groh et al., 2020a). Provided that they are sufficiently large in terms of both depth and diameter, weighing lysimeters also represent a relatively natural environment for plant growth as well as allowing for the installation of instrumentation to measure soil water status.
In this study, we make use of data from the TERENO-SoilCan network, in which large weighing lysimeters containing undisturbed soil monoliths have been transferred among several locations in Germany to emulate expected changes in climate (Zacharias et al., 2011; Pütz et al., 2016; Groh et al., 2020b). Here, we compare 6 years of measurements of the soil water balance and grassland production made in replicate lysimeters containing the same soil type but located at two different sites with contrasting climates with simulations using a simple eco-hydrological model. Our main objective with this modelling exercise was to explore and identify some plausible mechanisms that would explain the observed responses of the grassland to a change in climate, in terms of biomass production and water use efficiency.
2.1 Site descriptions, vegetation, soil properties and lysimeter data
We make use of measurements made in six undisturbed lysimeters that were sampled at an upland site (Rollesbroich) in the Eifel/Lower Rhine Valley observatory (Zacharias et al., 2011; Pütz et al., 2016; Bogena et al., 2018). Three of these lysimeters were kept at Rollesbroich, while the three others were moved to a warmer, drier climate in the Rhine valley at Selhausen. The station at Rollesbroich (50∘37′ N, 6∘18′ E) is located on a hilltop site at an elevation of 511 m, while Selhausen (50∘52′ N, 6∘27′ E) is located on a relatively flat alluvial flood plain in the lower Rhine valley at an altitude of 104 m. The mean annual air temperature at Rollesbroich is 8 ∘C, and the mean annual precipitation is 1150 mm. At Selhausen, the mean annual air temperature is 10 ∘C, and the mean annual precipitation is 720 mm. A weather station at each site records precipitation, solar radiation, air temperature, air humidity and wind speed at a height of 2 m at a 10 min time resolution (Pütz et al., 2016), which we aggregated to a daily time step. From these meteorological variables, we calculated daily reference (potential) evapotranspiration for grass with the FAO Penman–Monteith equation (Allen et al., 1998) as a simple comparative measure of the atmospheric demand for water in the two climates. The meteorological data and calculated reference evapotranspiration at the two sites for the period 2013–2018 are shown in the Supplement (Fig. S1).
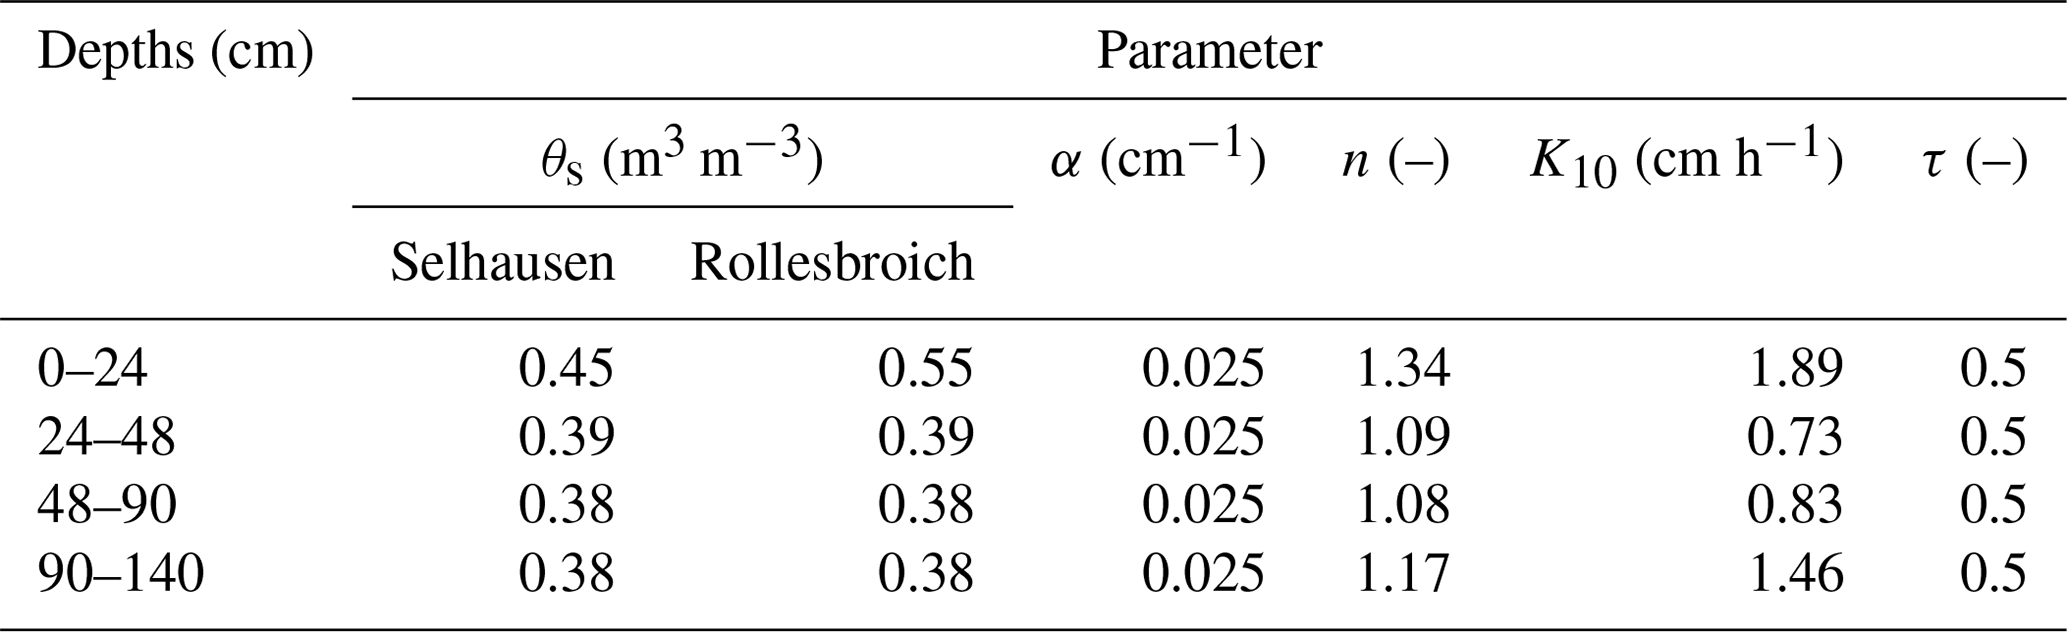
The soil at Rollesbroich is a Stagnic Cambisol, with the basic properties shown in Table 1. The soil is a sandy loam in the topsoil, changing abruptly to a clay loam at 24 cm depth. The texture becomes coarser again (sandy loam/loam) in the deep subsoil below 93 cm (Table 1). The original grassland community on the lysimeters extracted at Rollesbroich is classified as a mesic grassland of the Arrhenatheretalia alliance without any clear affiliation to classical plant associations. The community is dominated by Lolium perenne L., Ranunculus repens L., Rumex acetosa L., Taraxacum officinale L., Dactylis glomerata L. and Trifolium repens L. During the extraction of the lysimeters at Rollesbroich, grassland roots were observed to extend to ca. 40–50 cm depth (Jannis Groh and Thomas Pütz, personal communication, 2021). This is supported by SOC contents measured in the soil profile, which decline abruptly below 50 cm depth (Table 1). The lysimeters are supplied with fertilizer as liquid manure, and the vegetation is cut three to four times per growing season to characterize above-ground biomass production, following the local management practice. During the first 4 years (2013–2016) of the experimental period, leaf area index was measured on multiple occasions with an LAI-2200C Plant Canopy Analyzer from Licor. Plant height was also measured using a conventional ruler. Plant communities present in the lysimeters were assessed annually during the period 2011 to 2016. Plant species abundance was estimated as the number of grid cells occupied of 64 rectangular cells (10 × 10 cm). Based on these data, the relative abundances of three plant functional types (i.e. grasses, legumes and non-legume herbs) were quantified. These observations showed that plant communities changed significantly at both sites, with a general decrease in the abundance of herbs and an increase in the proportion of grass species (Fig. S2). This change was much less pronounced at Rollesbroich than in the lysimeters transferred to Selhausen, where the plant community composition diverged continuously from the original resident community composition, presumably in response to the move to the warmer and drier climate. The small changes in community composition found at Rollesbroich may be a consequence of the experimental set-up. For example, the lysimeters do not allow for root ingrowth of rhizomatous herb species.
The lysimeters have a surface area of 1 m2 and are 1.5 m deep. Weighing devices (load cells) measure weight changes equivalent to a water depth of 0.01 mm. Application of a filter routine to separate signal from noise enables accurate estimations of both precipitation and evapotranspiration from each lysimeter (Peters et al., 2017). Missing precipitation data were filled in a first step using the mean value calculated for all available lysimeters. In a second step, any remaining gaps were then filled using the precipitation measured by the reference precipitation gauge. Water fluxes into and out of the lysimeters at the base are measured and are controlled by continuous measurements of pressure heads made in the surrounding soil at 1.4 m depth. Soil water contents and pressure heads are measured at a 10 min time resolution at three depths (10, 30 and 50 cm depth) in the lysimeters using TDR probes and conventional tensiometers (30 and 50 cm depth) or MPS1 matric potential sensors (only at 10 cm depth). A detailed description of the design, construction and extraction of the lysimeters and their installation in the lysimeter stations of the SoilCan network can be found in Pütz et al. (2016). Three lysimeters were moved from Rollesbroich to Selhausen in November 2011. In this study, we make use of measurements made in a 6-year period from 2013 to 2018.
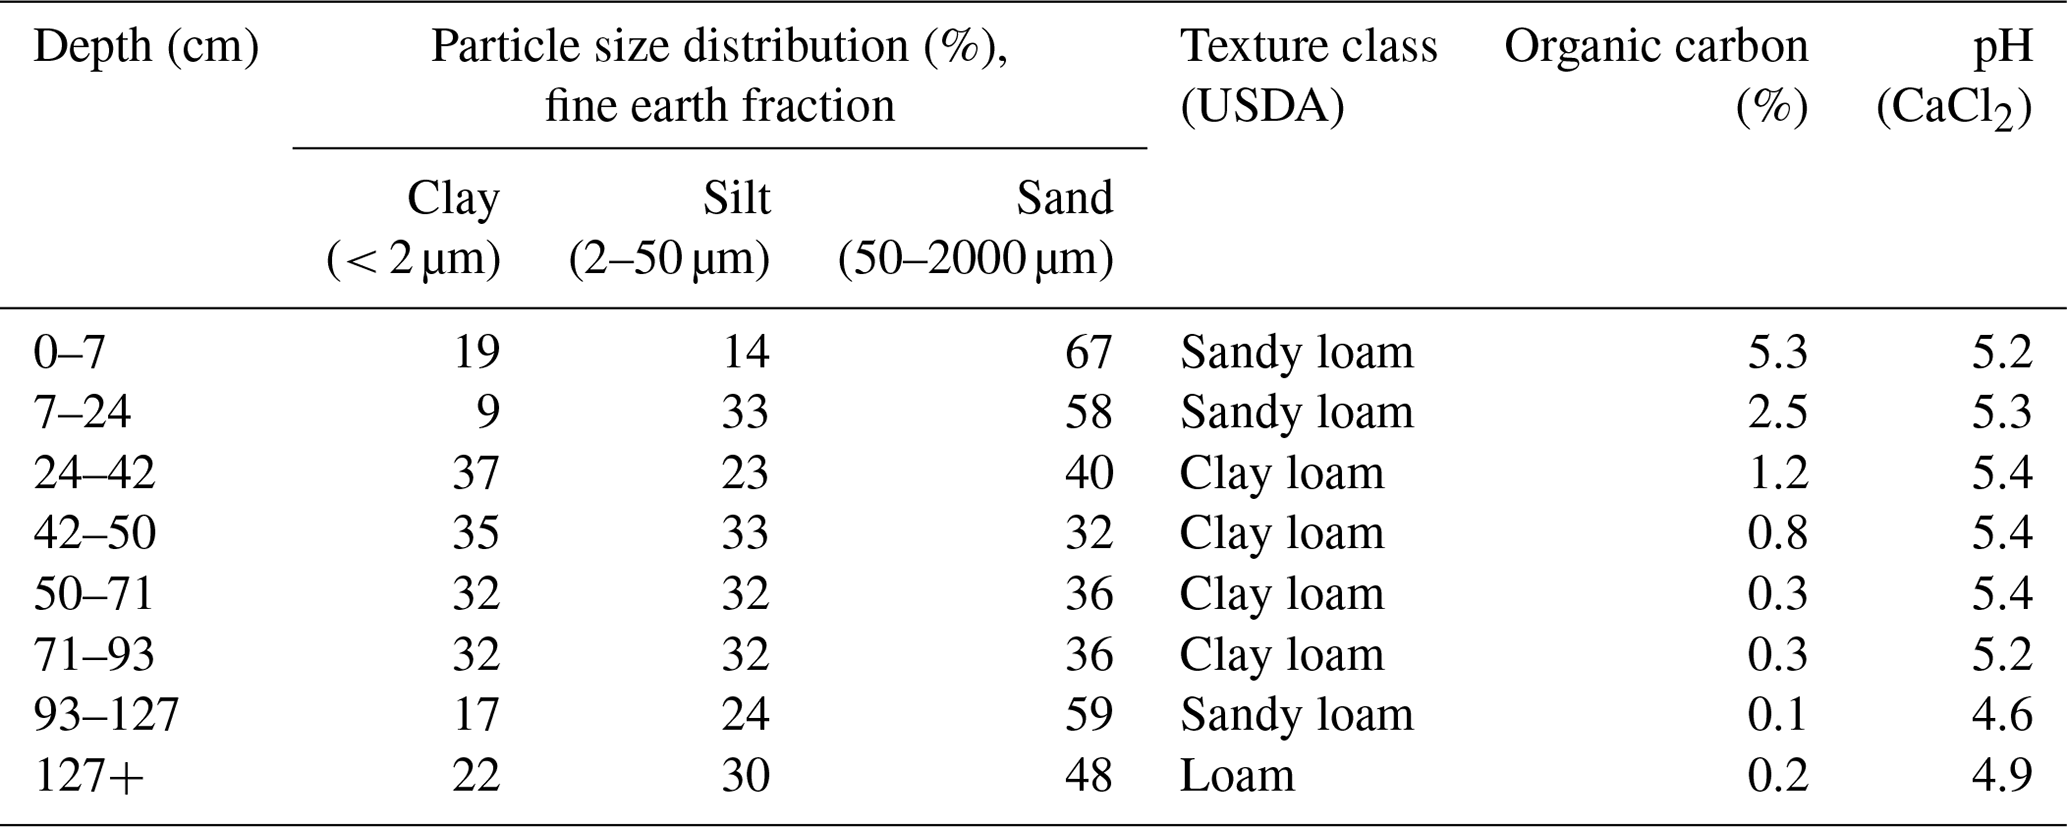
Table 2 summarizes the annual average water balances measured in the six lysimeters in the 6-year period from 2013 to 2018, as well as the average annual harvested biomass and calculations of the water use efficiency, defined as the ratio of harvest to evapotranspiration. In the wet climate at Rollesbroich, actual evapotranspiration was ca. 90 % of the potential rate calculated by the FAO version of the Penman–Monteith equation for the period 2013–2018 (641 and 710 mm yr−1 respectively), while percolation from the lysimeters was on average 42 % of the precipitation (442 and 1062 mm yr−1 respectively). Thus, evapotranspiration at Rollesbroich is mostly limited by the available energy and is only rarely limited by water supply (Gebler et al., 2015; Rahmati et al., 2020). Notably, the ratio of actual to potential evapotranspiration was only slightly smaller in the much drier climate of Selhausen than at Rollesbroich (on average 86 %; Table 2). Figure 1 shows that a strong limitation of the water supply on evapotranspiration at Selhausen can only be seen in the very dry year of 2018, when the ratio between actual and potential rates fell to ca. 60 %. It is also striking that the actual evapotranspiration slightly exceeds precipitation at Selhausen, so that the net percolation at the base of the lysimeters is negative (i.e. upwards directed flow; Table 2). This is probably a result of the topographical position of the site on a low-lying flood plain, such that lateral groundwater flow from surrounding higher land is sufficient to maintain the supply of water to the drying plant root zone (i.e. the Selhausen site lies in a discharge area in the landscape).
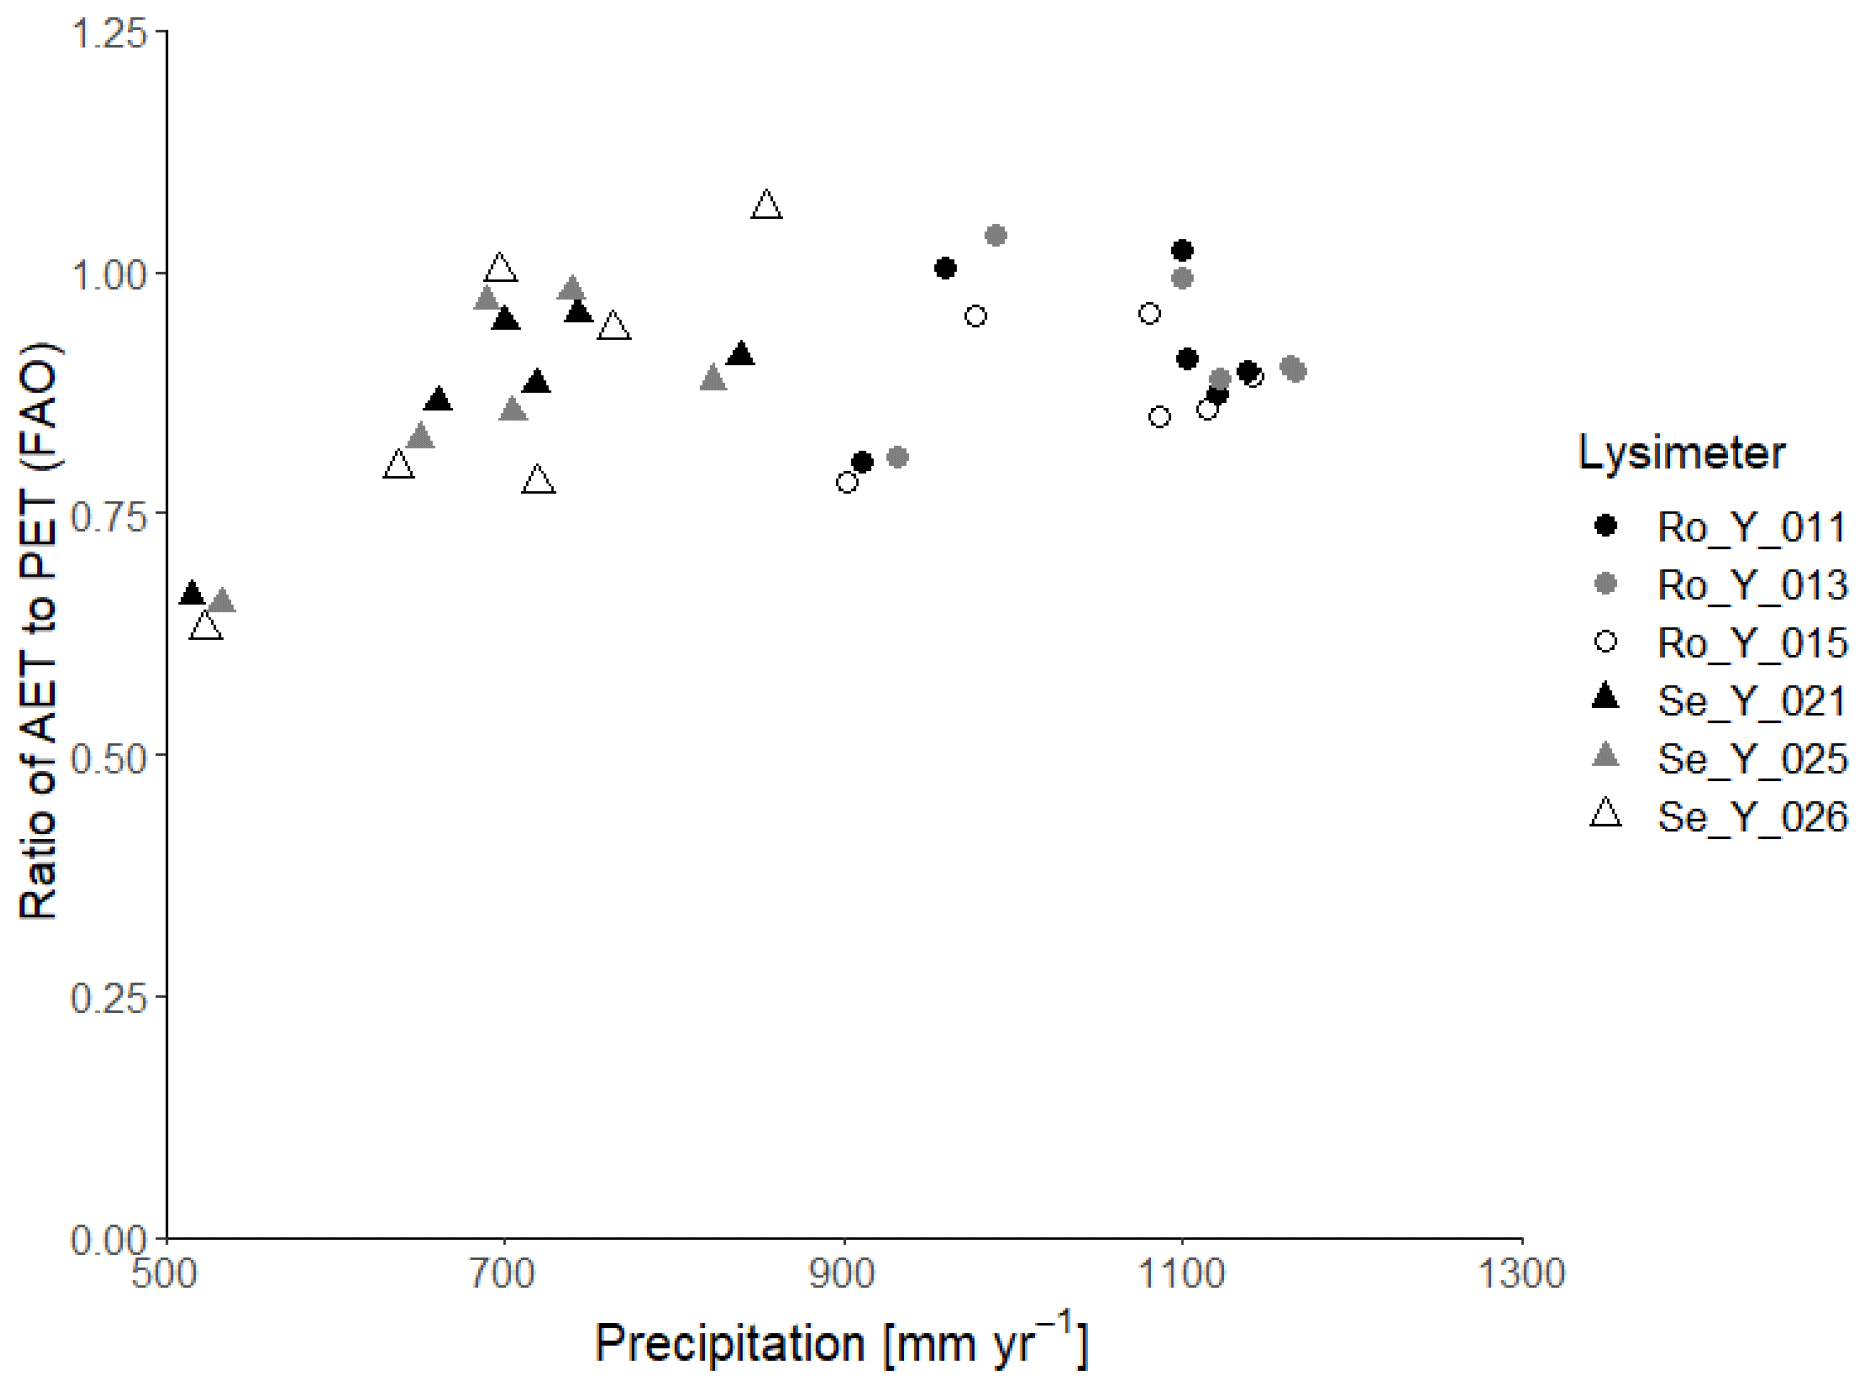
Figure 1Ratio of actual evapotranspiration (AET) to potential evapotranspiration (PET : FAO) calculated with the FAO Penman–Monteith method (Allen et al., 1998) as a function of precipitation at Selhausen and Rollesbroich on an annual basis for the period 2013–2018.
Table 2Measured water balance, harvested biomass and water use efficiency for the lysimeters (annual averages for the period 2013–2018; P is precipitation, PET is potential evapotranspiration calculated with the FAO Penman–Monteith method, AET is actual evapotranspiration, ΔS is the change of water storage calculated as P−AET−percolation and WUE is water use efficiency defined as harvested biomass (harvest) divided by AET).
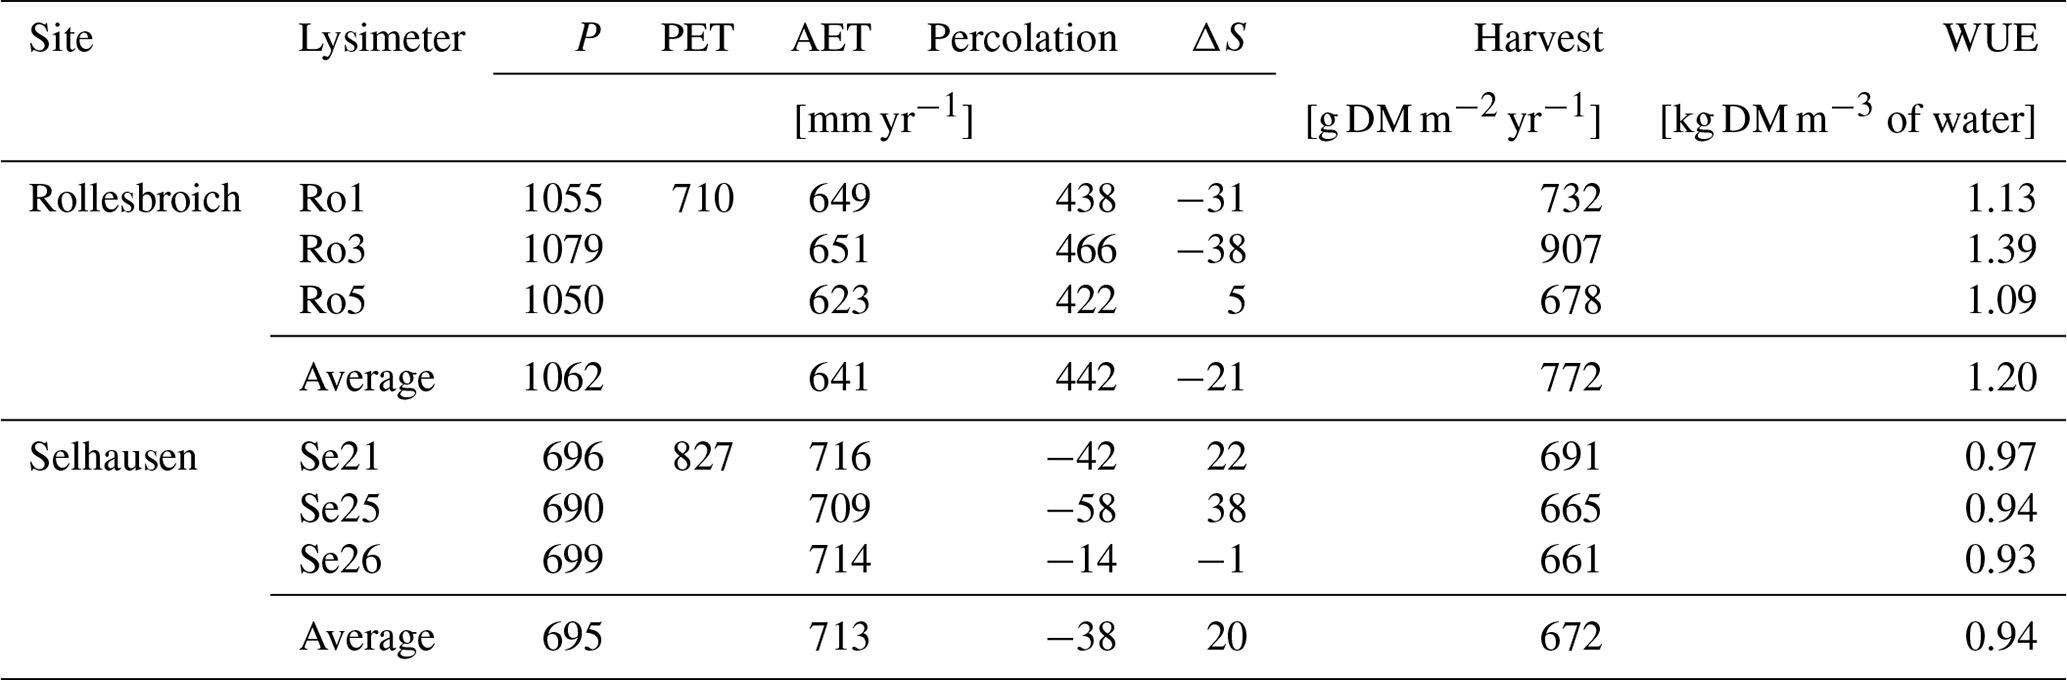
Table 2 shows that the differences in water balance components among the three replicate lysimeters at both sites are very small. For precipitation, the difference between the largest and smallest measured totals among the replicates at Rollesbroich and Selhausen is only ca. 3 % and 1 % of the mean value respectively. Furthermore, the difference in evapotranspiration between the two lysimeters with the largest and smallest values is equivalent to only 1 % of the precipitation at Selhausen and 2.6 % of the precipitation at Rollesbroich. This limited within-site variation in hydrologic response appears to be consistent with the available data for soil water contents and pressure heads. The “in situ” water retention data (Fig. S3 and Table S1) suggest that there is limited spatial variation in soil hydraulic properties among the six lysimeters. Percolation is somewhat more variable (Table 2), despite the fact that the pressure heads in the surrounding soil at 1.4 m depth controlling water flow at the base of the lysimeter are also quite similar among the replicates, especially at Rollesbroich (see Fig. S4).
Likewise, harvested biomass at Selhausen was similar in all three replicate lysimeters, whereas it varied more at Rollesbroich, with one lysimeter clearly an outlier (Ro_Y_013, Table 2). Much larger nitrate nitrogen concentrations were consistently found at the beginning of the experiment in the leachate from this lysimeter (Giraud et al., 2021), which suggests that the larger harvest from Ro_Y_ 013 may be due to a better nutrient supply from the soil. Table 2 and Fig. 2 show that the water use efficiency (WUE) of the grassland in the drier climate at Selhausen was smaller than for the lysimeters at Rollesbroich (Forstner et al., 2021), since harvests were somewhat smaller, and evapotranspiration was larger.
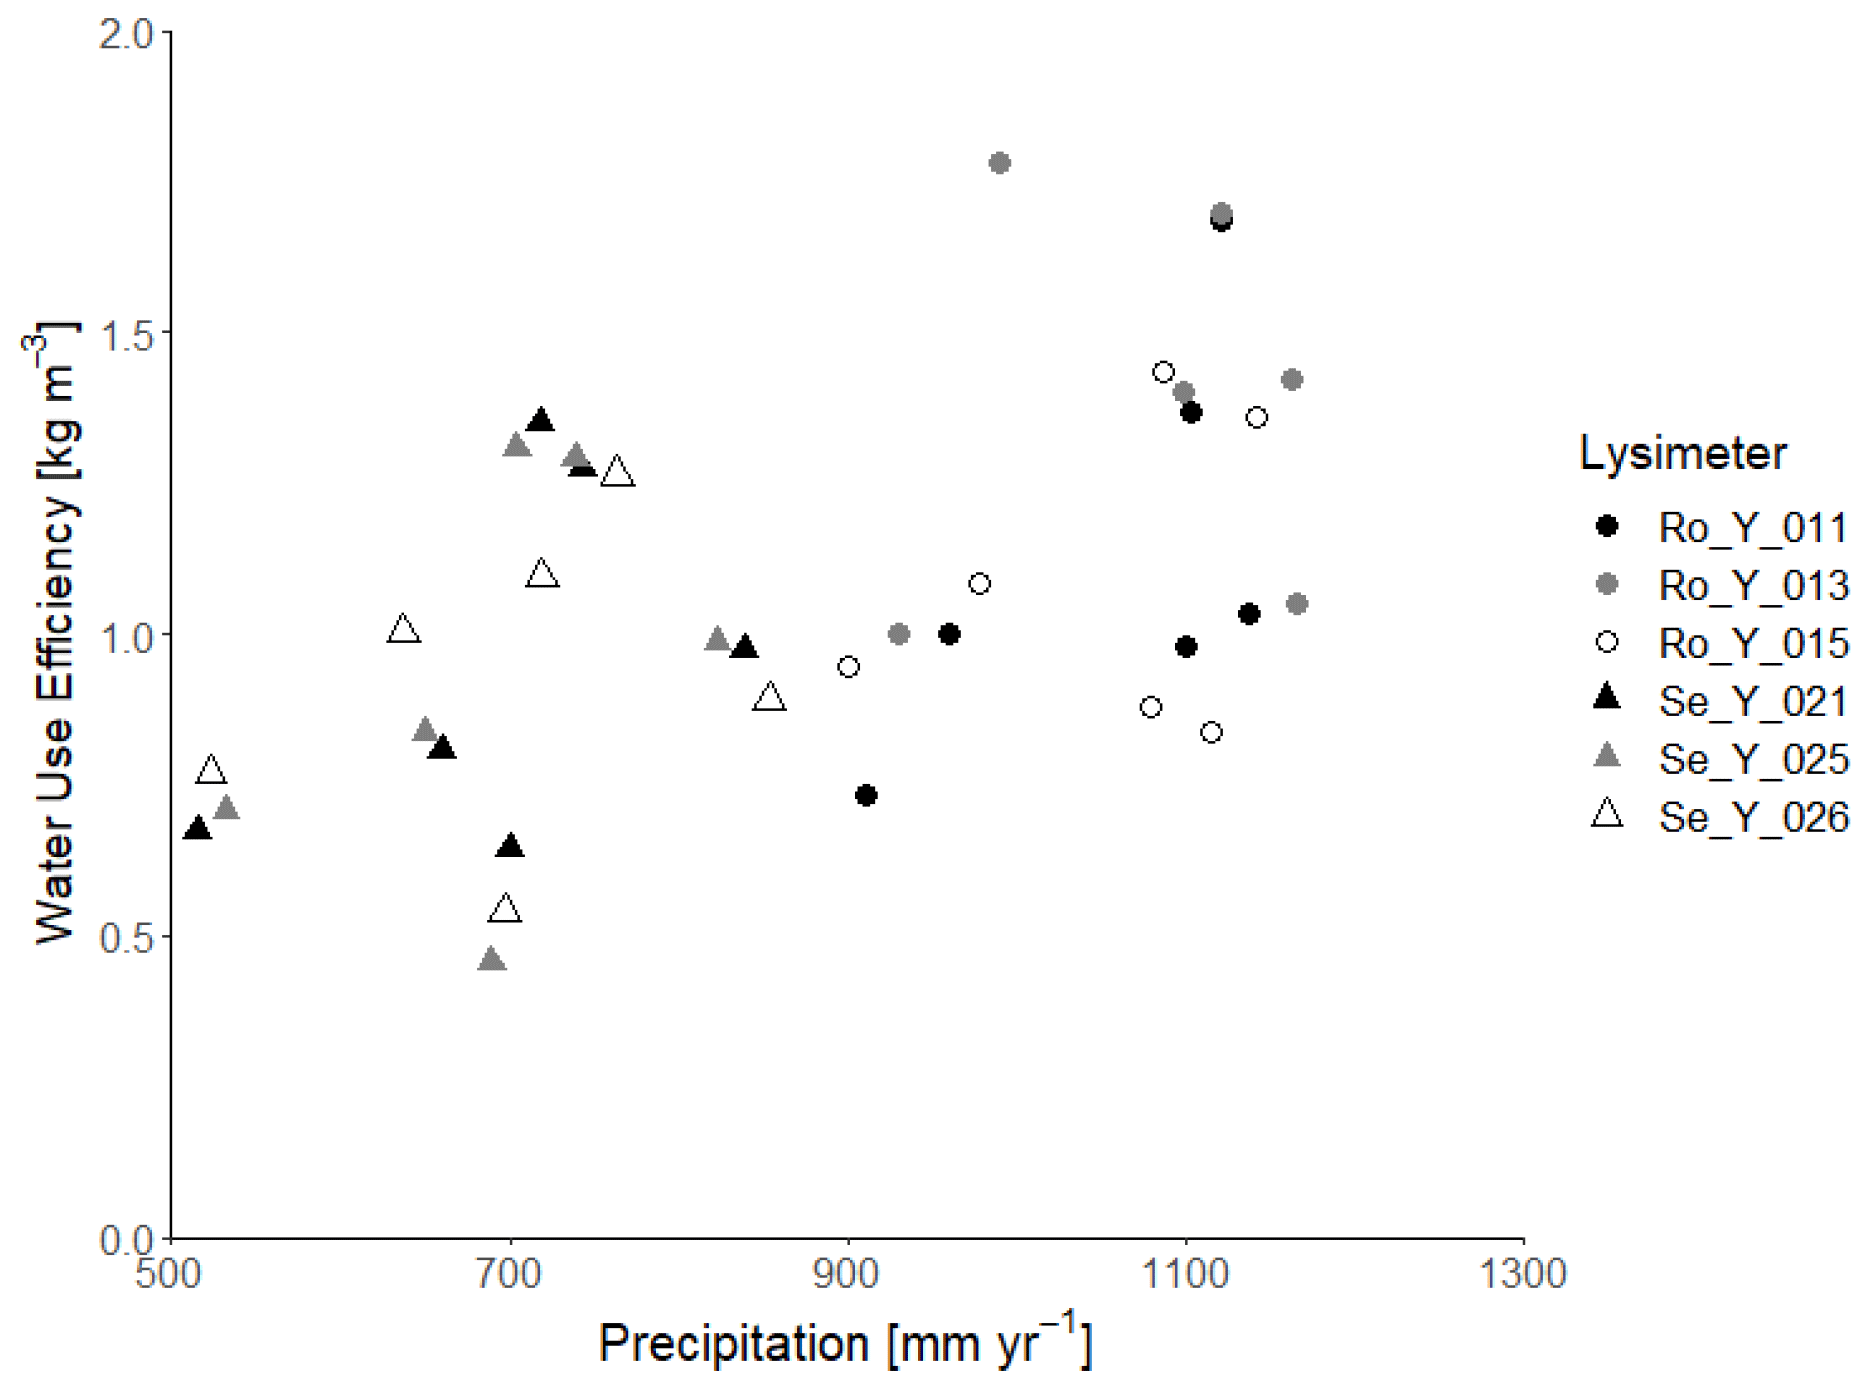
Figure 2Water use efficiency (i.e. annual harvest divided by annual evapotranspiration) as a function of annual precipitation at Selhausen and Rollesbroich.
In the following, we assess the capability of a relatively simple (parsimonious) eco-hydrological model to match the data measured in the replicate lysimeters in the two contrasting climates at Rollesbroich and Selhausen. We also use the model to identify plausible reasons for the differences in soil hydrology and grassland growth observed between the sites.
2.2 Model description
2.2.1 Potential evapotranspiration
In the longer term, the extent of grass cover can be affected by a changing climate, which will alter the energy balance partitioning at the land surface. We therefore employ the dual-source Penman–Monteith equation (Shuttleworth and Wallace, 1985; Shuttleworth and Gurney, 1990), which enables the estimation of potential soil evaporation Ep (m d−1) and potential transpiration Tp (m d−1) from dynamic plant properties and meteorological variables:
where λ is the latent heat of vaporization (J kg−1), ρ is the air density (kg m−3), Cp is the specific heat of air (J kg−1 ∘C−1), VPD is the vapour pressure deficit (Pa), Δ is the slope of the saturation vapour pressure curve (Pa ∘C−1), γ is the psychrometer constant (Pa ∘C−1), is the surface resistance of wet soil (here fixed at 20 s m−1), and are the bulk unstressed stomatal and boundary layer resistances of the canopy (s m−1), Rn and Rn(s) are the net radiation above and below the canopy (J m−2 s−1), and and are the aerodynamic resistances from soil to canopy and canopy to the reference height (i.e. 2 m) respectively (s m−1), both of which are estimated from wind speed and crop height following the approach described by Shuttleworth and Gurney (1990) and Zhou et al. (2006). Assuming that only half the leaf area contributes to transpiration, the canopy surface resistance can be expressed as
where ksto(max) is the maximum leaf stomatal conductance (m s−1), LAI is the leaf area index (m2 m−2), ft(c) is a function describing the response of conductance to air temperature (see “Environmental stress functions”) and fL is a light response function given by
where Ri is the incoming radiation (MJ m−2 d−1) and R50 is the half-saturation constant for light (here fixed at 5 MJ m−2 d−1). The bulk boundary layer resistance (m s−1) is given by
where rb is the leaf boundary layer resistance (here fixed at 25 s m−1). Radiation interception by the plant canopy is calculated using Beer's law:
where fint is the fraction of the net radiation intercepted by the plant canopy, and β is the extinction coefficient. Net radiation is estimated from incoming solar radiation Ri using the algorithms described in Allen et al. (1998).
Rainfall interception is at present not considered in the model. Although net interception losses have been reported, even for reasonably short grassland plant communities (Ataroff and Naranjo, 2009; Hu et al., 2009; Groh et al., 2019), we assume that the errors introduced by ignoring the net increase in evaporation due to rainfall interception will be negligible.
2.2.2 Water flow, root water uptake and transpiration
Some SVAT models use tipping-bucket or reservoir models to describe water storage and flow in the soil, even though physical approaches based on Richards' equation are not difficult to parameterize and usually perform better (e.g. Diekkrüger et al., 1995; Kröbel et al., 2010; Guest et al., 2017). Water uptake by plant roots is also represented empirically in many widely used SVAT models (Wang and Smith, 2004; Smithwick et al., 2014). These two issues are to some extent linked, as physics-based models of root water uptake require information on soil water pressures and conductances, while tipping-bucket or reservoir models only simulate soil water contents. In principle, water uptake by roots also depends on the 3D architecture of the plant root system as well as the hydraulic properties along multiple flow pathways in the soil and plant (e.g. Raats, 2007). Physics-based models have been developed that can calculate water flow and uptake by a root system explicitly defined in 3D (e.g. Dunbabin et al., 2013; Schnepf et al., 2018). Although some attempts have been made (e.g. Postma et al., 2017; Mboh et al., 2019), these models are not so well suited to coupling to SVAT models due to their high parameter and computational requirements. However, some parsimonious physics-based macroscopic approaches have been developed (e.g. de Jong van Lier et al., 2008, 2013; Couvreur et al., 2012; Javaux et al., 2013; Sulis et al., 2019) that contain no more parameters than the empirical models. The parameters of these models are also easier to estimate since they have a stronger physical basis (de Willigen et al., 2012; Javaux et al., 2013). For the same reason, the predictive use of these models should also be more robust in principle. The simplest physics-based models (e.g. Raats, 2007; de Jong van Lier et al., 2008) only describe flow to the roots and neglect flow and resistances within the plant. In this study, we use the model of root water uptake described by de Jong van Lier (2008), which is coupled with Richards' equation to calculate transient water flow soil water content, θ (m m−3), in a one-dimensional soil profile:
where t is time (d), z is height (m), K is the soil hydraulic conductivity (m d−1), ψ is the pressure head (m) and U (d−1) is the so-called sink term which accounts for root water uptake. The bottom boundary condition required to solve Richards' equation is specified as the known (measured) pressure head at the base of the simulated soil profile, i.e. at 1.4 m depth. The upper boundary condition to Eq. (13) is specified as a flux given by the difference between the known precipitation rate and the actual soil evaporation, Ea, which in turn is given by
where qmax is the maximum flow rate towards the soil surface calculated using Darcy's law from the pressure head in the uppermost soil layer. It can be noted that it was not necessary to include surface runoff in the model because the soil infiltration capacity was never exceeded. The soil water retention and hydraulic conductivity functions required to solve Eq. (13) are given by the Mualem–van Genuchten model (Mualem, 1976; van Genuchten, 1980), with the matching point hydraulic conductivity, K10 (m d−1) set at a pressure head of −0.1 m (Luckner et al., 1989) and assuming that the residual water content is negligible:
where S is the degree of saturation (–), S10 is the value of S at a pressure head of −0.1 m, θs is the saturated water content (m3 m−3), α (m−1) and n (–) are shape parameters, and τ is a parameter that reflects the tortuosity and connectivity of the pore network. Equation (13) was solved by explicit finite differences and Runge–Kutta integration, with the soil profile divided into 25 numerical layers, with thicknesses varying from 1 cm (the uppermost layer) to 6 cm. A constant time step of 1 min was employed to maintain numerical stability. The hydraulic conductivity regulating flow between two adjacent numerical layers in the soil profile was estimated by arithmetic averaging.
Neglecting water storage changes in the plants, the total water uptake from the root zone equals the actual transpiration rate, Ta, such that
where the subscript i refers to a layer in the root zone, and Δz is its thickness. To calculate the sink term Ui and actual transpiration Ta, we make use of the parsimonious physics-based model of root water uptake proposed by de Jong van Lier et al. (2008), which implicitly accounts for compensatory uptake (Jarvis, 2011). Neglecting plant resistances, they derived the macroscopic water uptake sink term to Richards' equation by upscaling a model of water flow to a single root based on the concept of matric flux potential M (m2 d−1):
where ψw is the soil water pressure head at which water uptake by plants ceases. At the microscopic scale in the soil, M will continuously decrease towards its value at the root/soil interface Mo. In this study, we used the approximate solution derived by de Jong van Lier et al. (2009) to calculate M for the van Genuchten–Mualem model of soil hydraulic properties. Assuming that Mo is constant in the root zone, and neglecting the effects of root and plant resistances on flow through the soil–plant system, de Jong van Lier et al. (2008) showed that the sink term for water uptake by roots in each soil layer can be expressed as
where ρ is a composite root parameter (m−2) given by (de Jong van Lier, 2008)
where ro is the root radius, a is the distance to the root (normalized by rm) at which the soil water content is equal to the average value in layer i (fixed here at 0.53; de Jong van Lier et al., 2008) and rm is the mean half distance to the root surface, which can be calculated from the effective root length density RLD(i) (m m−2) as
Actual transpiration is determined by the minimum of the potential transpiration rate, Tp, and the maximum possible flow rate of water to the root system, Tmax, which occurs when Mo= 0 (see Eqs. 18 and 20). Thus, actual transpiration can also be expressed as
where Tmax is obtained by combining Eqs. (18) and (20) with Mo= 0:
For unstressed plants, Tmax≥Tp and Ta=Tp. In this case, the unknown value of Mo in Eq. (20) is calculated by combining Eqs, (18), (20) and (24) and knowing that Ta=Tp, which gives
It can be seen from Eqs. (24) and (25) that in any given soil, plant water stress will set in earlier when potential transpiration rates are high and total root length density is low.
2.2.3 Growth model for perennial grassland
Even though detailed growth models designed for perennial forage grass are already available (e.g. Schapendonk et al., 1998; Jing et al., 2012; Persson et al., 2014; Kellner et al., 2017), we developed a simple generic model for the purpose of this study, which only simulates vegetative growth. This model is intended to be able to capture the main longer-term feedback mechanisms between soil water status and grass growth (Tardieu and Parent, 2017) and is designed to be compatible with simpler water uptake models that do not simulate water potentials, resistances and flows within plants.
In the model, net assimilation is calculated using the concept of radiation use efficiency (e.g. Sinclair and Muchow, 1999), which implicitly assumes a constant ratio of respiration to photosynthesis (i.e. carbon use efficiency; Gifford, 2003). Furthermore, we assume that assimilation is limited by light, water and temperature but not by variations in plant nutrition. The allocation of assimilates to above- and below-ground biomass depends on environmental stressors. In this respect, based on empirical knowledge, we assume that water stress and suboptimal temperatures will increase the partitioning of assimilates to roots (e.g. Jones et al., 1980a; Kahmen et al., 2005; Hui and Jackson, 2006; Wedderburn et al., 2010; Skinner and Comas, 2010; Padilla et al., 2013; Nosalewicz et al., 2018; Meurer et al., 2019). Excess carbohydrates produced by grasses during periods of “sink-limited” growth are stored as non-structural reserves, mostly in the tiller bases and roots (Thomas, 1991; Johansson, 1993; Volaire et al., 1998; Thomas and James, 1999; Østrem et al., 2011; Martínez-Vilalta et al., 2016; Hofer et al., 2017; Katata et al., 2020). These non-structural carbohydrates contribute to rapid recovery of growth after drought or defoliation by grazing or harvesting (Morvan-Bertrand et al., 1999; Jing et al, 2012; Schmitt et al., 2013; Benot et al., 2019). However, for the sake of simplicity, our growth model only tracks total biomasses in above- and below-ground compartments and does not explicitly account for reserves of non-structural carbohydrates.
The loss of both above- and below-ground biomass by diverse mechanisms (e.g. herbivory, exudation, root decay) is modelled in a simple way as a lumped first-order process. Although root longevity can be affected by drought (e.g. Chen and Brassard, 2013), this is neglected in the model for reasons of simplicity. Root systems also show plastic responses to environmental conditions, such that growth of new roots takes place where water is easily available, while root dieback occurs in dry soil (e.g. Jupp and Newman, 1987; DaCosta et al., 2004; Wedderburn et al., 2010). Dynamic modelling of root proliferation and loss in response to soil conditions remains a very difficult task (e.g. Wang and Smith, 2004; Boote et al., 2013; Smithwick et al., 2014; Stöckle and Kemanian, 2020). Here, for the sake of simplicity, we assume that the distribution of root biomass and length within the root zone is constant, as well as the maximum depth of roots in the profile. With these assumptions, changes in the below-ground (root) biomass in any soil layer i, Bbg(i) (kilograms of dry matter per square metre), are given by
where kbg is a first-order rate constant for root biomass loss (d−1), A (kg m−2 d−1) is the dry-matter assimilation rate, fbg is the fraction of dry-matter production partitioned to roots and fr(i) is the fraction of this root production allocated to layer i, which is prescribed by a logistic dose response function (Schenk and Jackson, 2002; Fan et al., 2016; Metselaar et al., 2019):
where c is a shape factor, DU and DL are the depths to the upper and lower boundaries of layer i, Dr is an effective root depth, which we define as the depth above which 95 % of the roots are located and D50 is the depth above which 50 % of the root biomass is found such that
With this approach, 5 % of the roots are located below the maximum root depth. In the model, we distribute this extra root biomass to the uppermost two numerical layers in equal amounts.
The assimilation rate A in Eq. (26) is calculated as a function of incoming solar radiation Rs (MJ m−2 d−1) and two dimensionless stress functions, ft(p) and fw(p), varying between zero and unity to represent the effects of temperature and water stress on dry-matter production:
where RUEmax is the maximum radiation use efficiency (kg MJ−1). The root allocation fraction fbg in Eq. (26) is calculated as a function of plant stressors (i.e. air temperature, water stress) and “sink strength”, represented here by the fraction of radiation intercepted, fint, using an approach based on the simple model concept outlined by Friedlingstein et al. (1999):
where fbg(opt) is the fraction of assimilates partitioned below ground when the conditions for above-ground production are optimal (i.e. full canopy, optimal temperature and no water stress), and ft(a) and fw(a) are response functions to account for the effects of suboptimal conditions of temperature and water on allocation. With this approach, suboptimal environmental conditions (extreme air temperatures and plant water stress) increase the proportion of assimilates partitioned to roots, whereas a loss of leaf area (e.g. due to harvest) triggers an increased allocation of assimilates to the above-ground biomass (see Fig. S5).
Changes in above-ground biomass, Bag (kg m−2), are given by
where Γ is a binary variable, indicating the occurrence of harvest of above-ground biomass (zero for no harvest and 1 for harvest), Hcut is the cutting height at harvest (here set to 0.01 m), H is the grass height at harvest (m), Δt is the time step in the model and kag is a rate coefficient (d−1) regulating the loss of above-ground biomass by senescence and leaf fall, which is also promoted by suboptimal temperatures or plant water stress, employing the same empirical functions used for assimilate partitioning between above- and below-ground biomass. In this model, we do not account for standing dead above-ground biomass, which would alter the partitioning of solar radiation between soil and plant, without contributing to transpiration and assimilation, since we assume that the loss of green leaf area results in immediate litterfall. However, it would be straightforward to incorporate standing dead biomass in future versions of the model, for example, in the way described by Montaldo et al. (2005).
Feedbacks from the plant growth model to the hydrological model are provided by the leaf area index, LAI, and effective root length density, RLD(i), which are calculated as
where Sleaf (m2 kg−1) and Sroot (m kg−1) are the specific leaf area and specific root length, and ε is the fraction of the total root length that is effective for water uptake (Faria et al., 2010). The root length density affects the soil resistance to water uptake by roots (Eqs. 21 and 22), while the leaf area index affects both canopy and aerodynamic resistances (Eqs. 8 and 10) as well as the interception of radiation by the canopy (Eq. 12). The height of the crop also acts as a feedback control on the water balance, since it affects the aerodynamic resistances to evapotranspiration (Eqs. 1 to 7). The height of the grass cover is not explicitly simulated in our relatively simple growth model. Instead, we calculate plant height as a function of simulated LAI, based on the data from both sites (see Fig. S6).
2.2.4 Environmental stress functions
As in other models of crop growth (Wu et al., 2016), we use the ratio of actual to potential transpiration to represent the effects of water stress on assimilation via stomatal closure:
Water stress also limits crop growth without affecting photosynthesis by several different mechanisms (Körner, 2015; White et al., 2016; Tardieu et al., 2018; Loka et al., 2019; Gupta et al., 2020). Many crop models calculate limitations on leaf growth as a threshold function of the soil water deficit in the root zone. Here, we make use of the matric flux potential at the root surface Mo (see Eqs. 20 and 25) as a measure of plant water stress, since it should be more physically and physiologically meaningful. We therefore define a second water stress index as a threshold response function of Mo, varying between zero and unity, which regulates dry-matter allocation and leaf loss in the model (Eqs. 30 and 31):
where Mo(crit) is a critical value of Mo, which is in turn calculated from a user-defined value of a critical pressure head at the soil–root interface, ψo(crit).
As in many soil–crop models (Wu et al., 2016), the temperature response function in Eqs. (8) and (29) to (31) is modelled with a piecewise linear function (Fig. S7):
where T is the mean air temperature (∘C), To(low) and To(high) define the optimum temperature (∘C) range at which ft(p,a) equals unity, and Tb and Tc are the base and ceiling temperatures (∘C) at which the function equals zero. Different values for the parameters in Eq. (36) can be assigned for transpiration (ft(c)), assimilation (ft(p)) and allocation and leaf fall (ft(a)).
2.3 Model application
2.3.1 Modelling strategy
In this study, uncertainty in the model parameterization has been addressed through Monte Carlo simulations following the GLUE methodology (see “Sensitivity and uncertainty analysis”). In principle, it would be possible to apply the model individually to each lysimeter in such an approach. However, this would have been far too demanding of computer resources. Instead, recognizing the comparatively small differences in hydrological behaviour among the three replicates at each site (Table 1) and the fact that the same soil type is present at both sites, we decided to simplify the analysis by assuming a common parameterization for the soil hydraulic properties in the replicate lysimeters at each site. Similarly, we also neglected the small differences in boundary conditions among the replicate lysimeters at each site. Thus, precipitation (Table 1; Fig. S1) and pressure heads at the bottom boundary (Fig. S4) measured for one lysimeter at each site (Ro_Y_015 at Rollesbroich and Se_Y_026 at Selhausen) were used to represent all three replicates. This approach also implicitly assumes that we can neglect the likelihood of small differences in initial conditions among the replicates at each site. Initial soil water pressure head profiles at each site were set according to the results of preliminary simulations involving “trial and error” calibration to measured early time water outflows from the lysimeters. Initial above- and below-ground plant biomasses were calculated assuming that the roots constituted 80 % of the total biomass and that the initial leaf area index was 1.5. It can be noted that model predictions quickly become independent of these initial guesses.
2.3.2 Soil hydraulic parameters
Four horizons were identified from a soil profile description at the Rollesbroich site (Table 1). Common parameters of the Mualem–van Genuchten model were estimated for each horizon from a combination of direct measurements and pedotransfer functions (Table 3). The paired TDR and tensiometer measurements obtained in the lysimeters at 30 and 50 cm depth were utilized to estimate common water retention parameters at the two sites for the horizons at 24–48 and 48–90 cm depth by least-squares fitting (Table 3 and Fig. S3). We used the HYPRES class pedotransfer functions (Wösten et al., 1999) to estimate the van Genuchten water retention parameters from the soil textural class in the deep subsoil (90–140 cm depth) where no data were available. The measurements from the matric potential sensors installed in the uppermost soil horizon (0–24 cm depth) appeared to be unreliable. We therefore also used the HYPRES pedotransfer functions to estimate the shape parameter n in the topsoil, while α was set equal to the same value as the deeper horizons. Saturated water contents clearly differed between the two sites in the uppermost horizon and were estimated from the data by eye. The reasons for this are not clear. With only three replicates, it could be a result of chance spatial variation. However, at least two physical explanations appear plausible. It is possible that more optimal soil moisture conditions at Selhausen have led to faster mineralization rates of soil organic matter, leading to a decline in the organic matter content and a concomitant increase in soil bulk density (i.e. a loss of porosity, Meurer et al., 2020). It may also be the case that the drier soil surface conditions at Selhausen have reduced soil wettability (Robinson et al., 2019). Hydraulic conductivity at a pressure head of −10 cm (see Table 3) was estimated from clay content in each horizon using the pedotransfer function developed by Jarvis et al. (2013).
2.3.3 Sensitivity and uncertainty analysis
A comprehensive uncertainty analysis treating a large number of model parameters as uncertain was not feasible in this study from the point of view of both data support and computational capacity, even for the comparatively parsimonious model used in this study. We therefore performed a preliminary Monte Carlo sensitivity analysis to support the selection of a limited number of parameters to include in the uncertainty analysis. We ran 500 simulations for each site for the period 2013–2018 with parameter values obtained by Latin hypercube sampling from uniform distributions (Table S2 in the Supplement). We quantified the sensitivity of two target outputs (i.e. total evapotranspiration and harvest during the experimental period) to model parameters using Spearman rank partial correlation coefficients. The sampled ranges for the plant parameters in the model were selected to reflect variations based on information in the literature. Three soil hydraulic parameters were also included in this analysis (K10, α and n). This was done by applying scaling factors (see Table S2) to the parameter values in Table 3 to broadly reflect the uncertainty arising from the use of pedotransfer functions as well as the spatial variations in the water retention curves derived from the lysimeter measurements (Fig. S3). It should be noted here that the resulting ranges adopted for the two van Genuchten parameters encompass the differences found among the six lysimeters at both depths. Table S2 shows the results. In general, evapotranspiration and harvest are much more sensitive to many of the plant parameters than to variation in the soil hydraulic properties, which lends support to a modelling strategy in which soil hydraulic properties are set to identical values for all lysimeters. We therefore focused the uncertainty analysis on investigating differences in key plant parameters between the two sites.
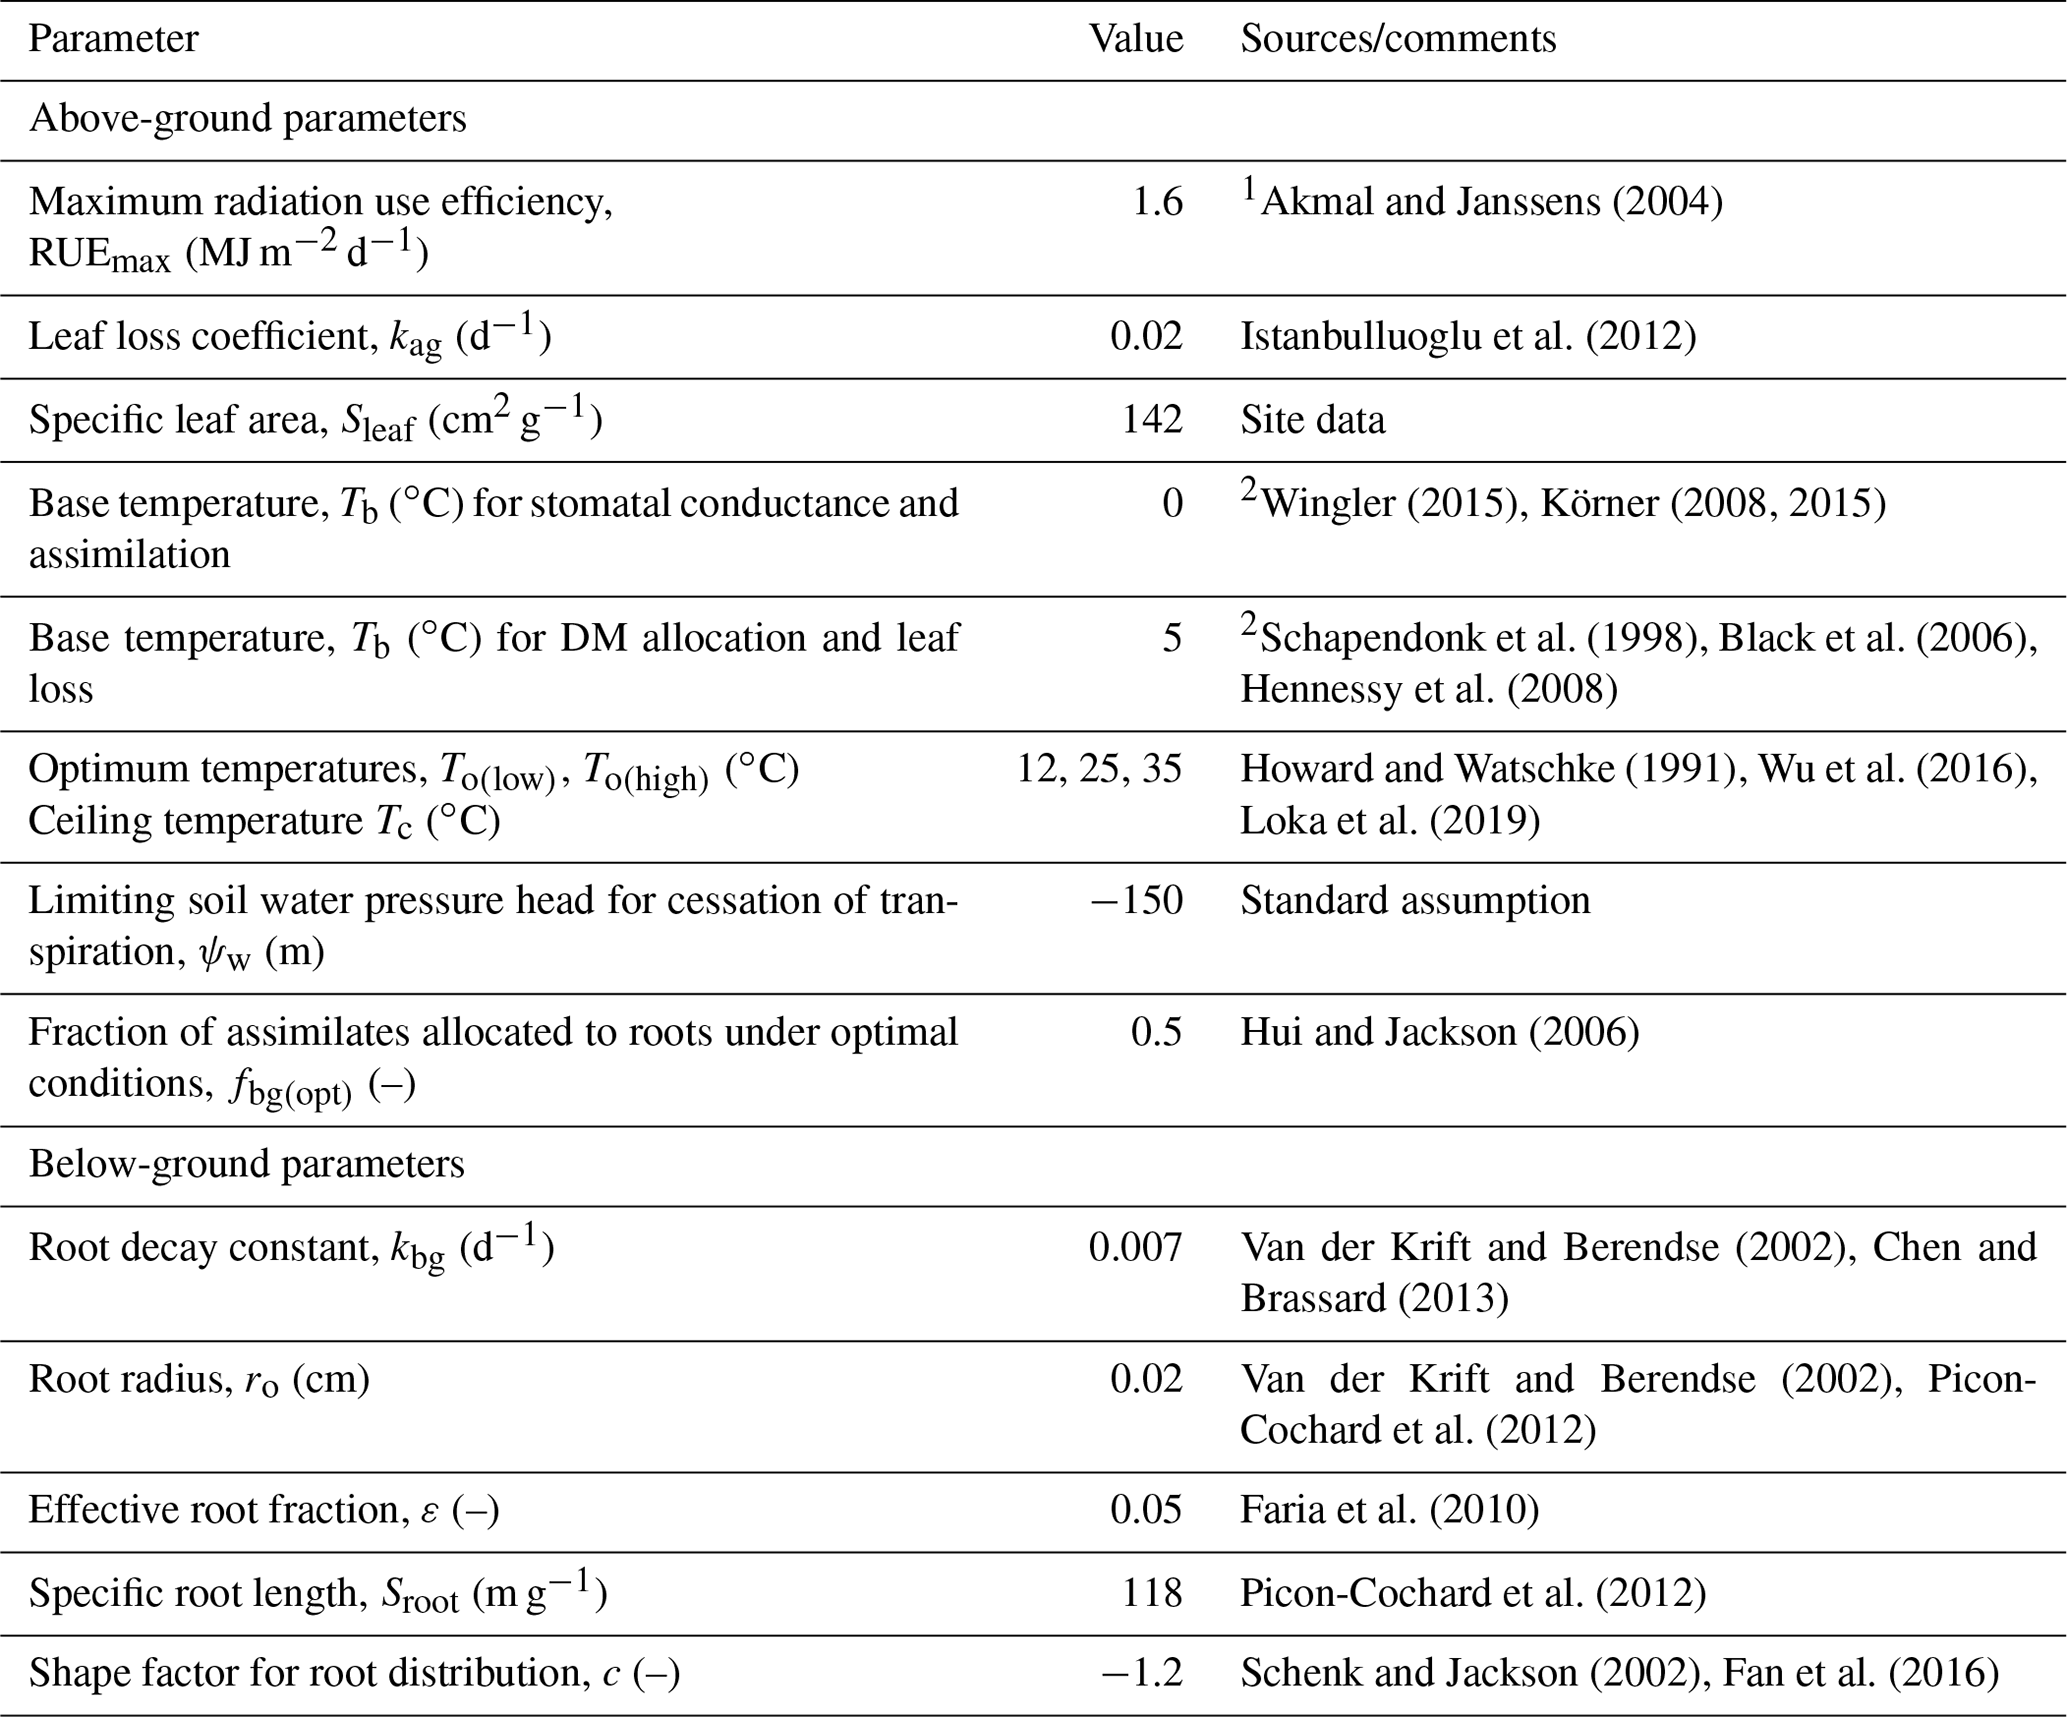
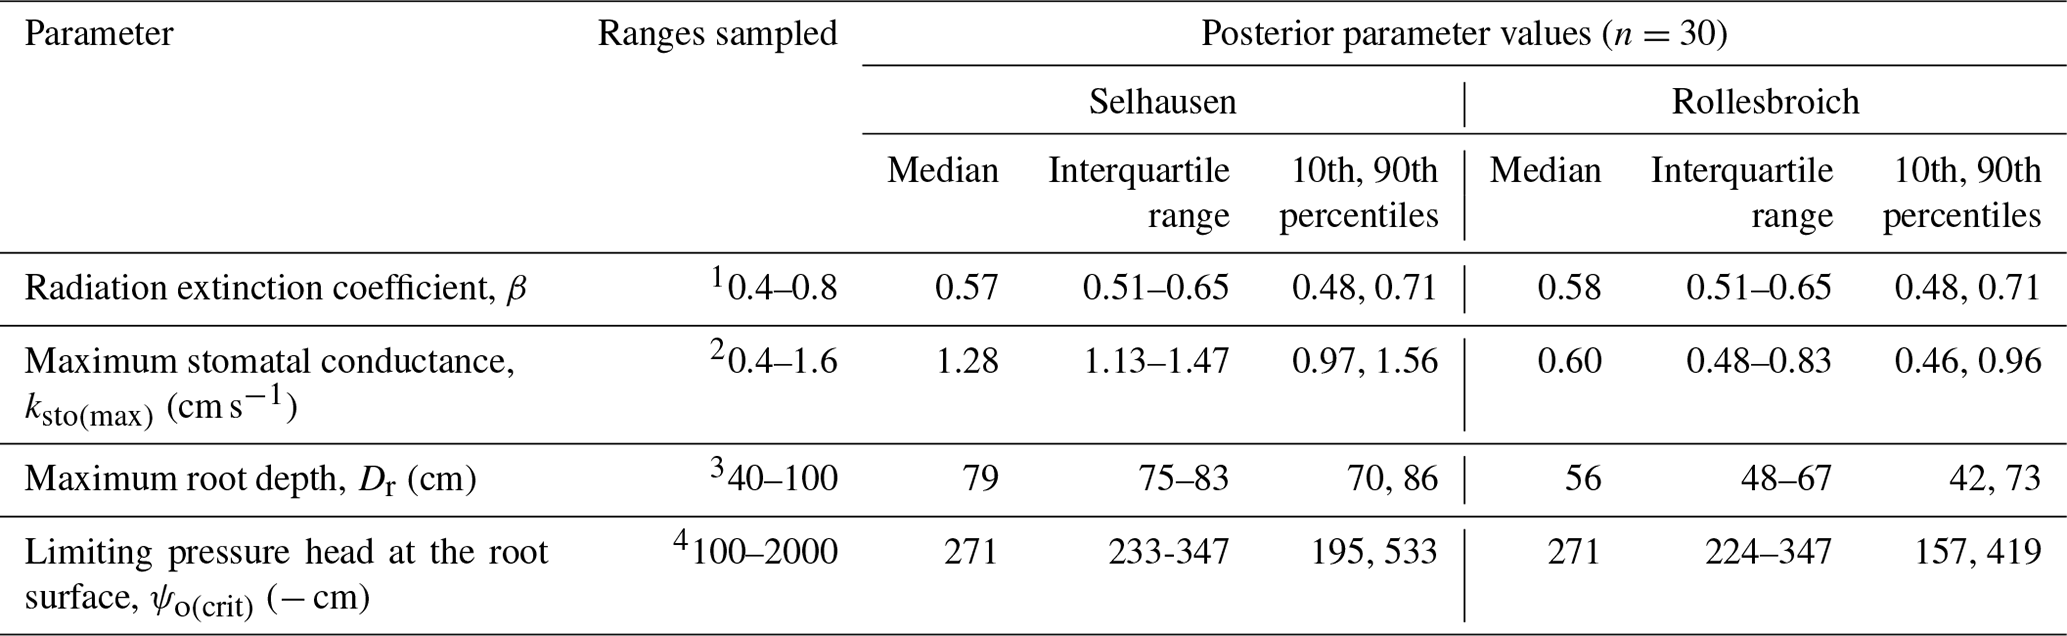
Of the many highly sensitive plant parameters (Table S2), we decided to treat four as uncertain: the radiation extinction coefficient β, the maximum stomatal conductance ksto(max), the maximum root depth Dr and the limiting pressure head ψo(crit) that controls dry-matter (DM) allocation between above- and below-ground compartments as well as the rate of leaf loss. Several subjective criteria underpin this selection. Firstly, they are among the most highly sensitive parameters for both evapotranspiration and harvest yields (Table S2). In this respect, with the exception of To(low), it seems that plant parameters controlling temperature response are much less sensitive than those regulating water stress (Table S2). Secondly, in addition to the changes in plant community composition, there are also some known mechanisms of plant acclimation (e.g. Vincent et al., 2020) that could explain why these four parameters might plausibly take different values at the two sites. Finally, the effects on these four model parameters on the model outputs are unlikely to be strongly correlated with one another. This would not be the case for some of the other sensitive parameters. For example, the radiation extinction coefficient β would be correlated with the maximum radiation use efficiency, while ψo(crit) would be correlated with both the parameter controlling DM allocation under optimal conditions, fbg(opt), as well as the effective root fraction, ε. The remaining plant parameters in the model were therefore set to fixed values estimated from data in the literature (Table 4), prioritizing field studies rather than pot experiments, as the development of drought and the plant response to stress are known to be strongly affected by restricted root zones (Jones et al., 1980a, b). Specific leaf area was set to 142 cm2 g−1 based on the measurements of above-ground biomass and leaf area index for the combined dataset at both sites (see Fig. S6). The relationship shown in Fig. S6 shows some scatter, but no systematic difference between the sites is apparent. In this respect, Norris (1982) also found no significant differences in specific leaf area for Lolium perenne in droughted, control and irrigated plots.
Table 4Fixed values for plant parameters at both sites.
1 Assuming PAR = 50 % of incoming solar radiation. 2 Transpiration/assimilation is less sensitive to low temperatures than growth.
We used the GLUE (generalized likelihood uncertainty estimation; Beven and Binley, 1992; Beven 2006) methodology to account for parameter uncertainty. The objective of this informal Bayesian approach is not to find a single optimum parameter set by calibration, as it acknowledges that many different parameterizations will perform equally well (so-called equifinality), not least as a consequence of the inevitability of model (structural) error. The objective of GLUE is therefore to identify acceptable (“behavioural”) parameterizations. To support this analysis, we ran 2000 simulations for each site, with parameter sets determined using Latin hypercube sampling from the prior uncertainty ranges for the four uncertain parameters shown in Table 5. GLUE involves several subjective decisions, two of the most important ones being the choice of a likelihood function (i.e. a measure of goodness of fit) and deciding on the criteria that should be used to determine whether a simulation is acceptable or not. We considered that a parameterization was acceptable if two criteria were satisfied. The first uses calculations of the model efficiency, ME, for the six observed time series of data (i.e. water contents at three depths, evapotranspiration rates, LAI, and harvests):
where O and P are the observed and simulated values for a given data type, and m is the number of observations. The maximum value of ME is 1, when predictions and observations are identical, while a negative value implies a poor model, since it means that taking the average of the observations would give a better prediction. A simulation was considered acceptable if (i) the model efficiency for all six data types was within 0.5 of the maximum value for that data series and (ii) both the simulated annual average evapotranspiration AET (mm yr−1) and overall (apparent) water use efficiency WUE (kilograms of dry matter per cubic metre) were within acceptable limits roughly defined by the observations (see Table 2).
This second criterion ensures that the acceptable parameterizations respect the overall broad differences observed in the water balance components and harvest yields between the two sites. Note that the acceptable limit for WUE at Rollesbroich makes no attempt to “honour” the data from lysimeter Ro_Y_013, since it is considered an outlier, as discussed earlier. In total, 35 simulations at Rollesbroich and 57 at Selhausen satisfied these criteria. It is desirable to have the same number of acceptable parameter sets at each site. From these acceptable simulations, we therefore selected the 30 best simulations at each site (i.e. 1.5 % of the total number of simulations) according to the average model efficiency for the six data types.
Table 5Uncertain parameters: initial ranges, data sources and posterior parameter ranges.
1 Schapendonk et al. (1998), Akmals and Janssens (2004), White and Snow (2012), and Zhang et al. (2014). 2Nijs et al. (1997), Allen et al. (1998), Wang and Huang (2003), DaCosta et al. (2004), Dong et al. (2011), Holloway-Phillips and Brodribb (2011), and Hu et al. (2013). 3 Site observations; Jackson et al. (1996), Schenk and Jackson (2002), and Fan et al. (2016). 4 No information is available, and hence a wide a priori uncertainty range was selected.
3.1 Acceptable parameter values
The distributions of the acceptable values for the four uncertain parameters are shown in Fig. 3, while posterior parameter ranges defined by different percentiles of these distributions are presented in Table 5. The posterior uncertainty ranges are much smaller than the prior uncertainty ranges, which suggests that values for all four uncertain parameters were clearly identifiable from the data. No differences between the two sites were found for two of the parameters, the radiation extinction coefficient β and ψo(crit) the parameter controlling dry-matter allocation and leaf loss as a function of water stress (p= 0.98 and 0.16 respectively). The derived values of ψo(crit) (median value of −271 cm at both sites; Table 5) are much larger than ψw (i.e. −150 m; Table 4), which indicates that water stress affects above-ground plant growth long before stomatal closure limits transpiration and assimilation (Staniak and Kocoń 2015; Körner, 2015; Loka et al., 2019). This has been shown experimentally for droughted field-grown grass/clover pastures by Jones et al. (1980a, b) and Hofer et al. (2017). The values of the radiation extinction coefficient (interquartile range = 0.51–0.65 at both sites) are typical of values reported for grassland ecosystems (Zhang et al., 2014).
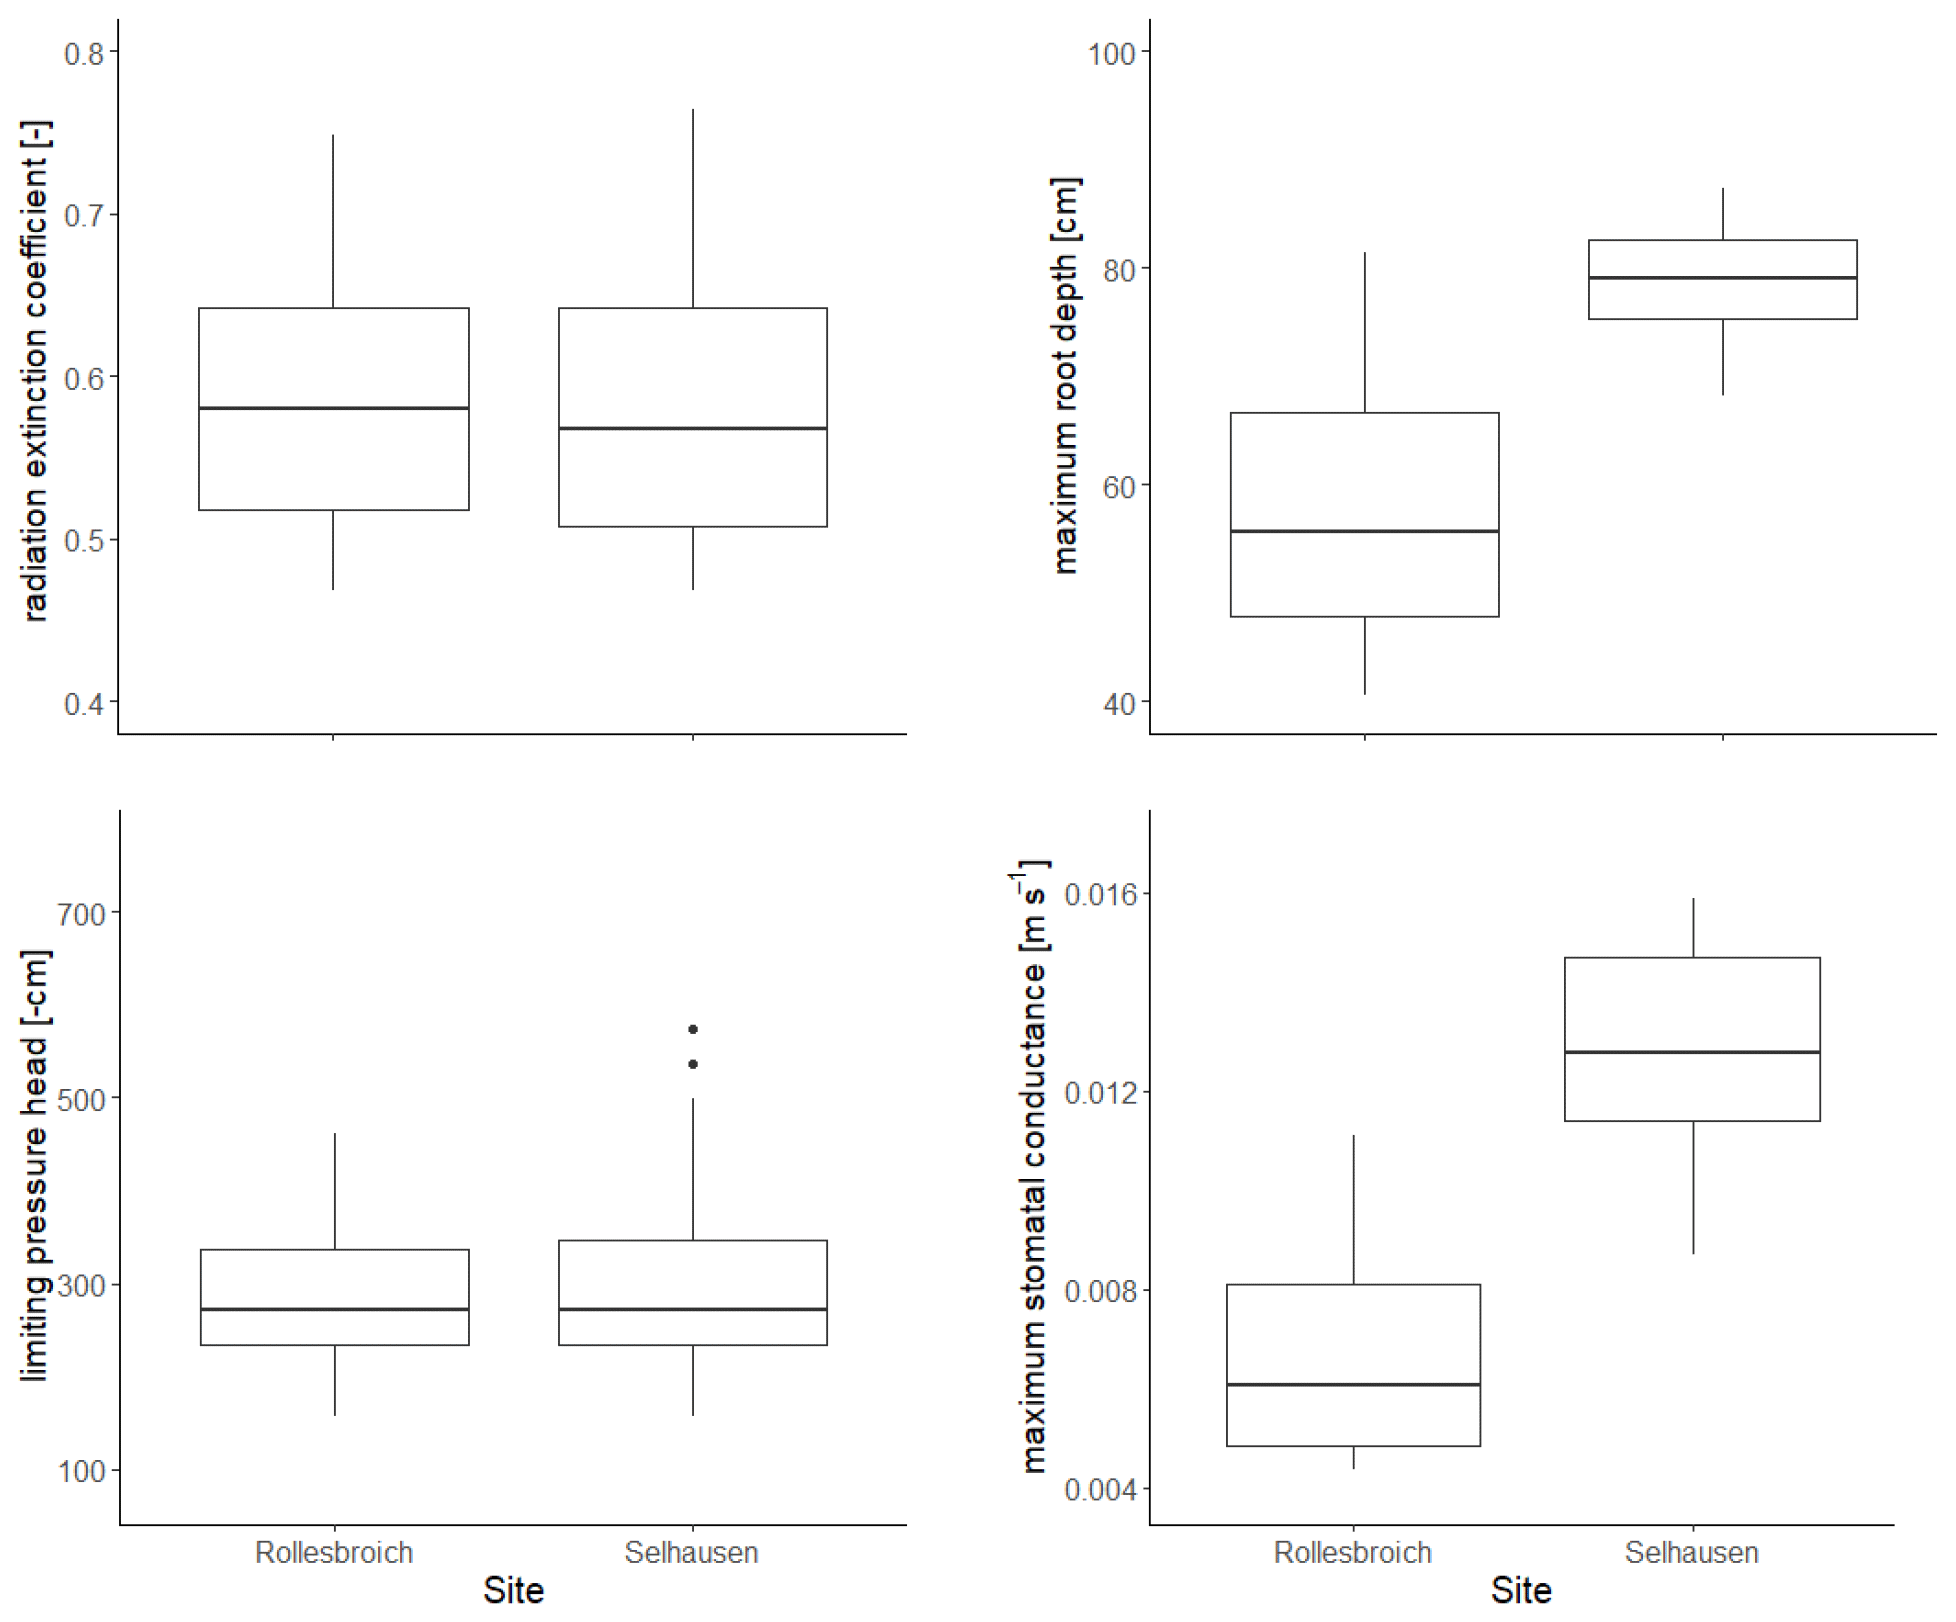
Figure 3Posterior distributions of the four parameters treated as uncertain in the GLUE analysis. The horizontal line is the median value for the acceptable parameter sets, the box denotes 25th and 75th percentiles (interquartile range), the whiskers cover data points that lie within 1.5 times the interquartile range and solid circles represent outliers outside this range.
In contrast, the results of the GLUE analysis suggest that both the maximum root depth and the unstressed stomatal conductance have increased significantly for the lysimeters moved to Selhausen (p < 0.0001 for both). The estimated root depth at Rollesbroich (ca. 56 cm) matches observations made at the site at the time of extraction of the lysimeters reasonably well. The simulations suggest that the maximum root depth at Selhausen has increased to ca. 80 cm, while the maximum stomatal conductance has roughly doubled. The mechanisms underlying these changes are not clear. One reason may be the significant changes observed in the plant community composition at Selhausen compared with the original resident plant community (Fig. S2), as plant traits may differ significantly between herbs and grasses. Another likely reason is that one or more of the dominant species adapted to the new climate. In this respect, plants are known to acclimatize to environmental stresses by various physiological and morphological mechanisms (e.g. Nicotra et al., 2010; Tardieu et al., 2018; Vincent et al., 2020). For example, it is known that many plant species, including perennial ryegrass (Wedderburn et al., 2010), may respond to drought by developing deeper root systems. Although the mechanisms are still imperfectly understood, recent research suggests that various alterations in leaf physiology induced by heat stress may increase leaf hydraulic conductance, thereby enhancing transpiration rates and the degree of evaporative cooling (Sadok et al., 2021).
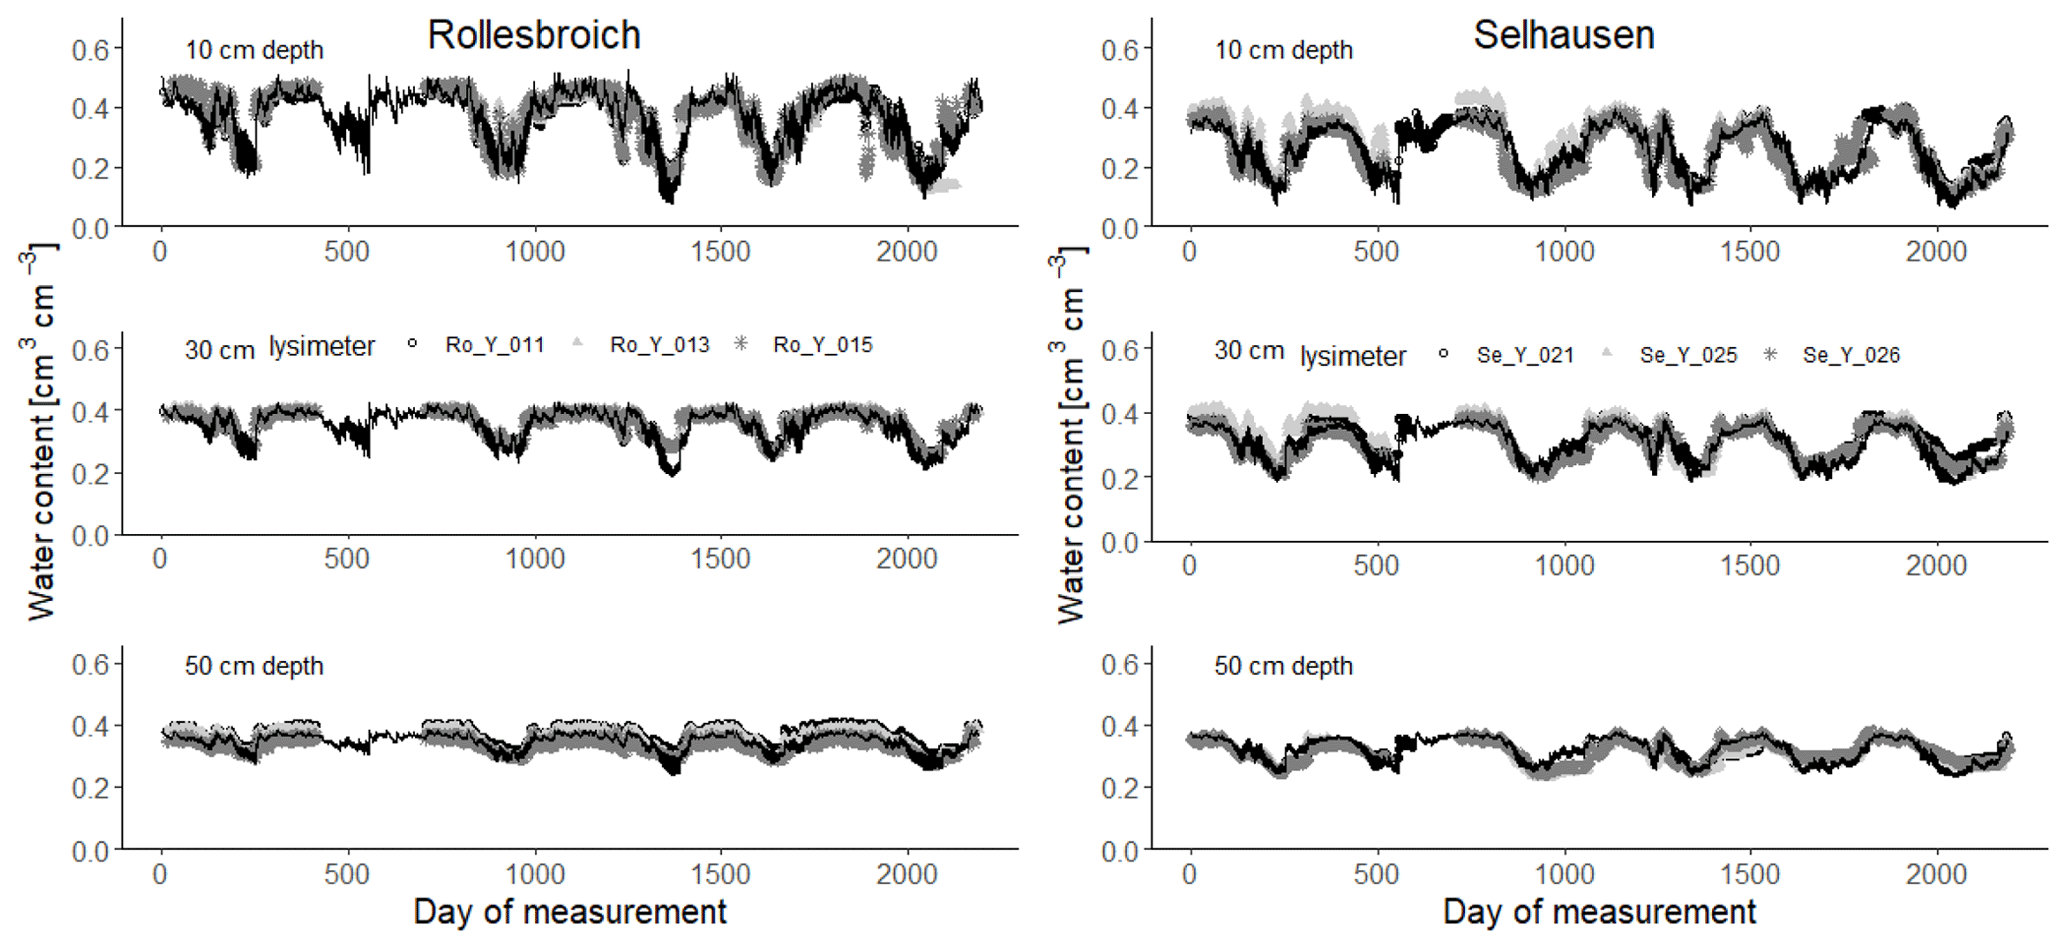
Figure 4Measured soil water contents (symbols) at 10, 30 and 50 cm depth (2013–2018) compared with simulations for the 30 acceptable parameterizations at each site (black lines). Day 1 is 1 January 2013.
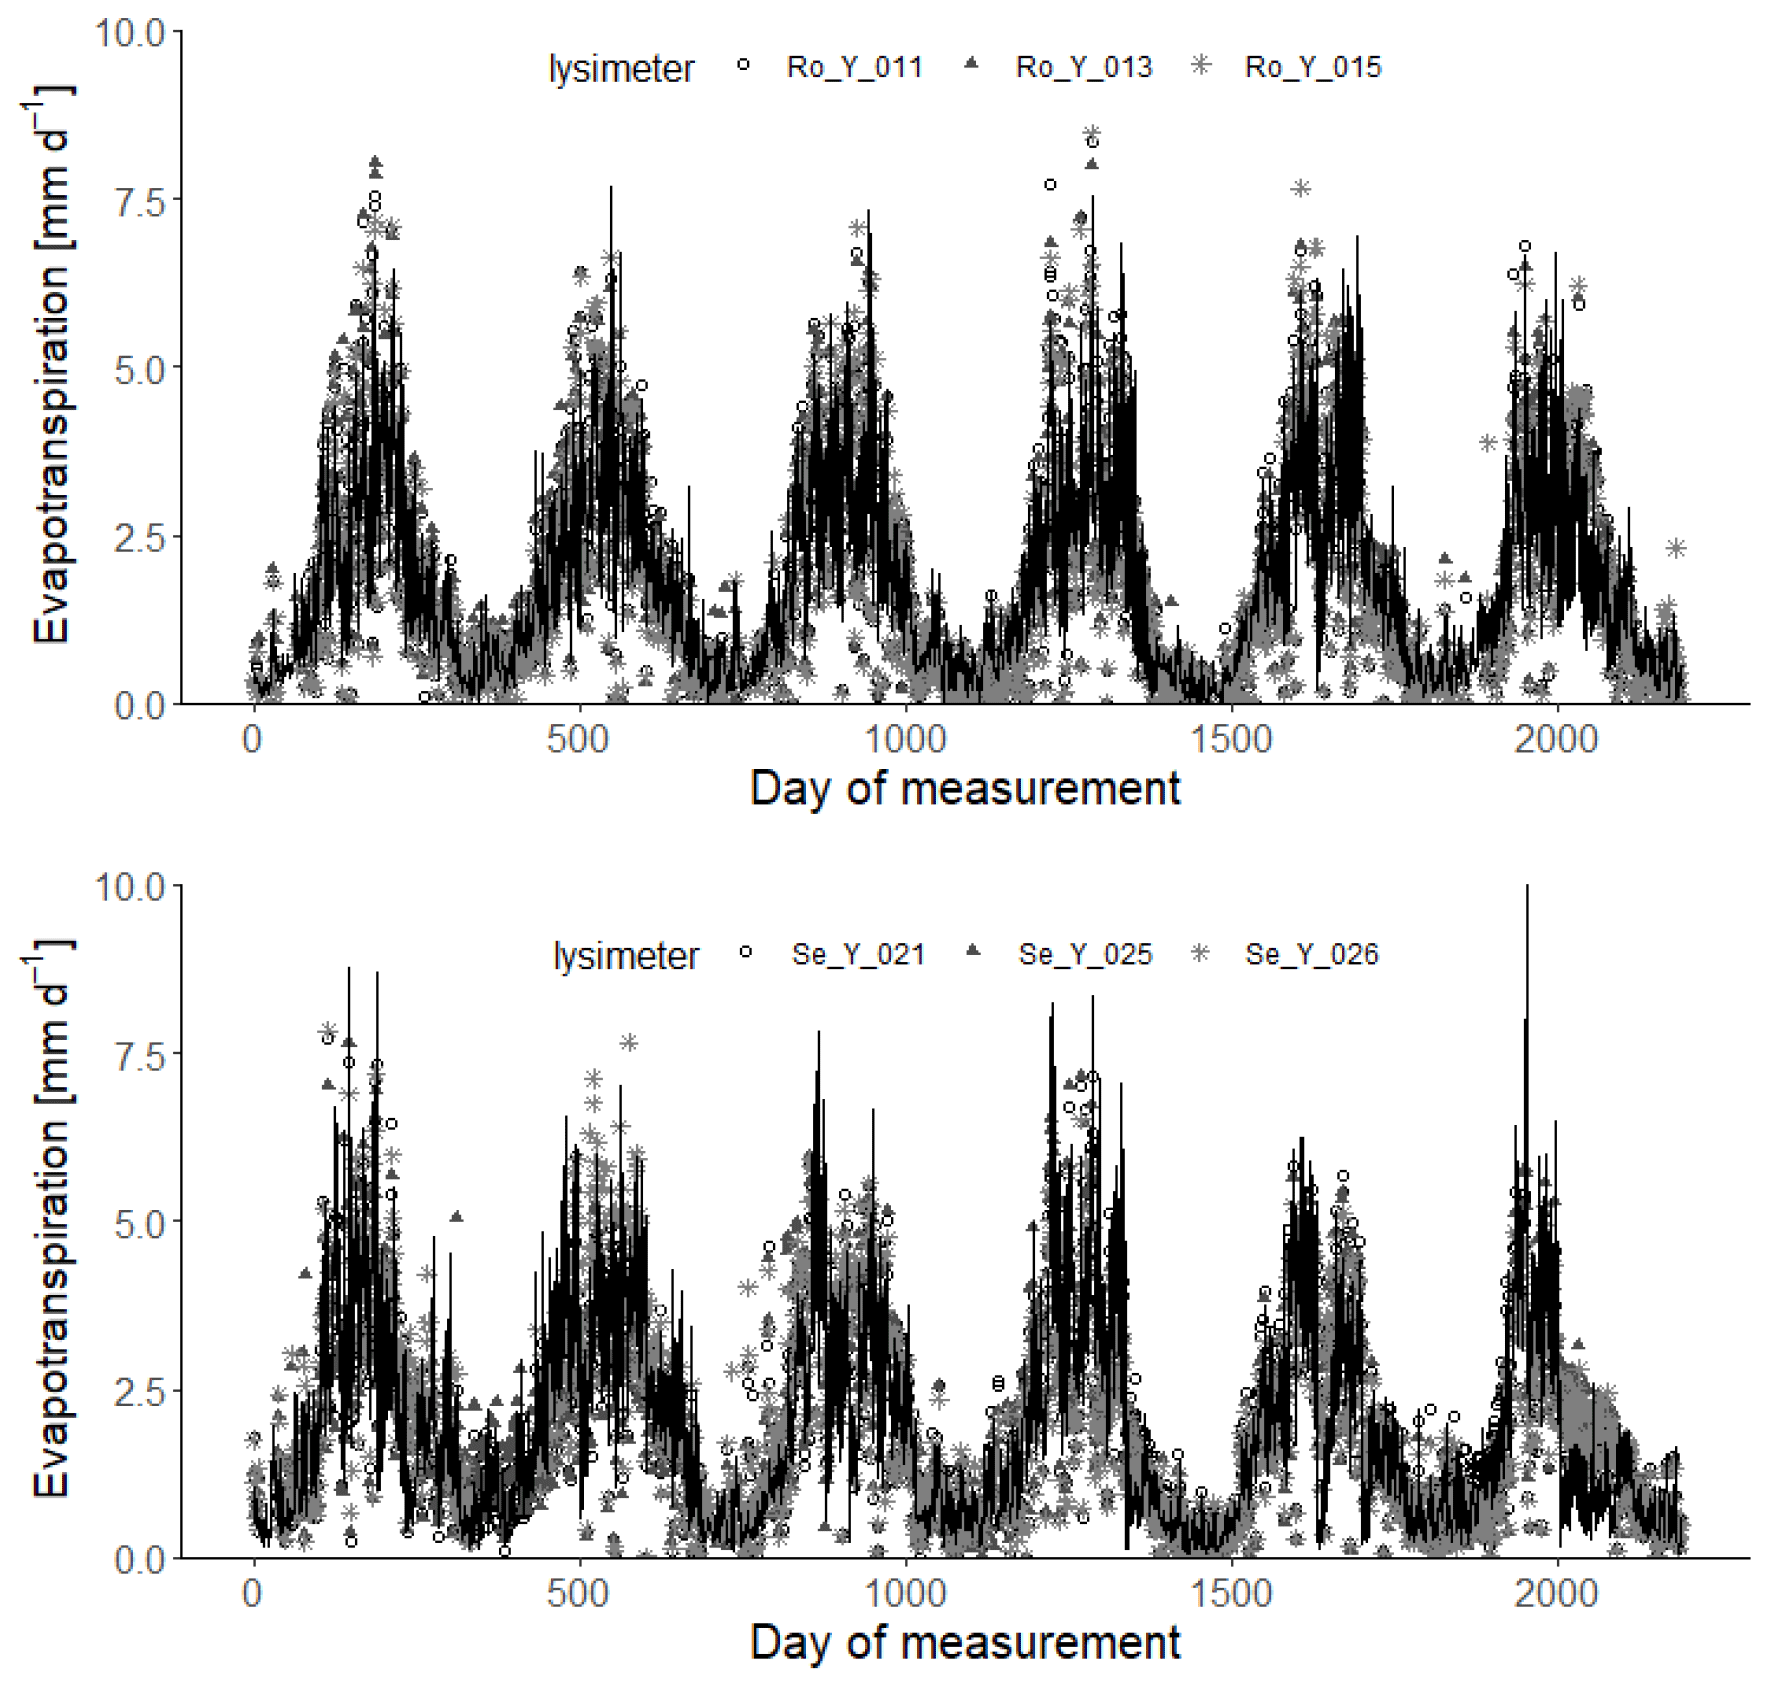
Figure 5Measured daily evapotranspiration rates (symbols; 2013–2018) compared with simulations for the 30 acceptable parameterizations at each site (black lines). Day 1 is 1 January 2013.
3.2 Soil hydrology
Figures 4 and 5 show comparisons of the acceptable simulations at the two sites with the soil water contents measured at the three depths in the lysimeters and daily evapotranspiration rates respectively. The model efficiencies for these simulations are shown in Table 6. Figure S8 shows measured and simulated values of accumulated evapotranspiration. Figure 6 compares measured annual average evapotranspiration and percolation in the period 2013–2018 with the simulations. Figure 7 shows some terms of the simulated water balances that were not measured. Potential evapotranspiration calculated in the model by the Shuttleworth–Wallace version of the Penman–Monteith equation as a dynamic function of leaf area development at the two sites is very similar to the estimates obtained by the FAO version (Fig. 7; Table 2), which only treats the vegetation implicitly. This is in spite of the fact that the balance between simulated soil evaporation and transpiration differs strongly between the two sites, with soil evaporation being a much larger component of the water balance at Rollesbroich (Fig. 7), where it comprises ca. 70 % of the total evapotranspiration. There may be several reasons why soil evaporation is such an important term in the water balance at Rollesbroich, including the wet climate with high wind speeds (Groh et al., 2019) and the fact that the grassland is harvested three to four times during the growing season, which exposes the soil surface to evaporation. In contrast, soil evaporation is much smaller (ca. 50 % of total evapotranspiration) in the drier climate at Selhausen despite greater incoming radiation, presumably because drying of the soil surface in summer frequently reduced evaporation below the potential rate (Fig. 7).
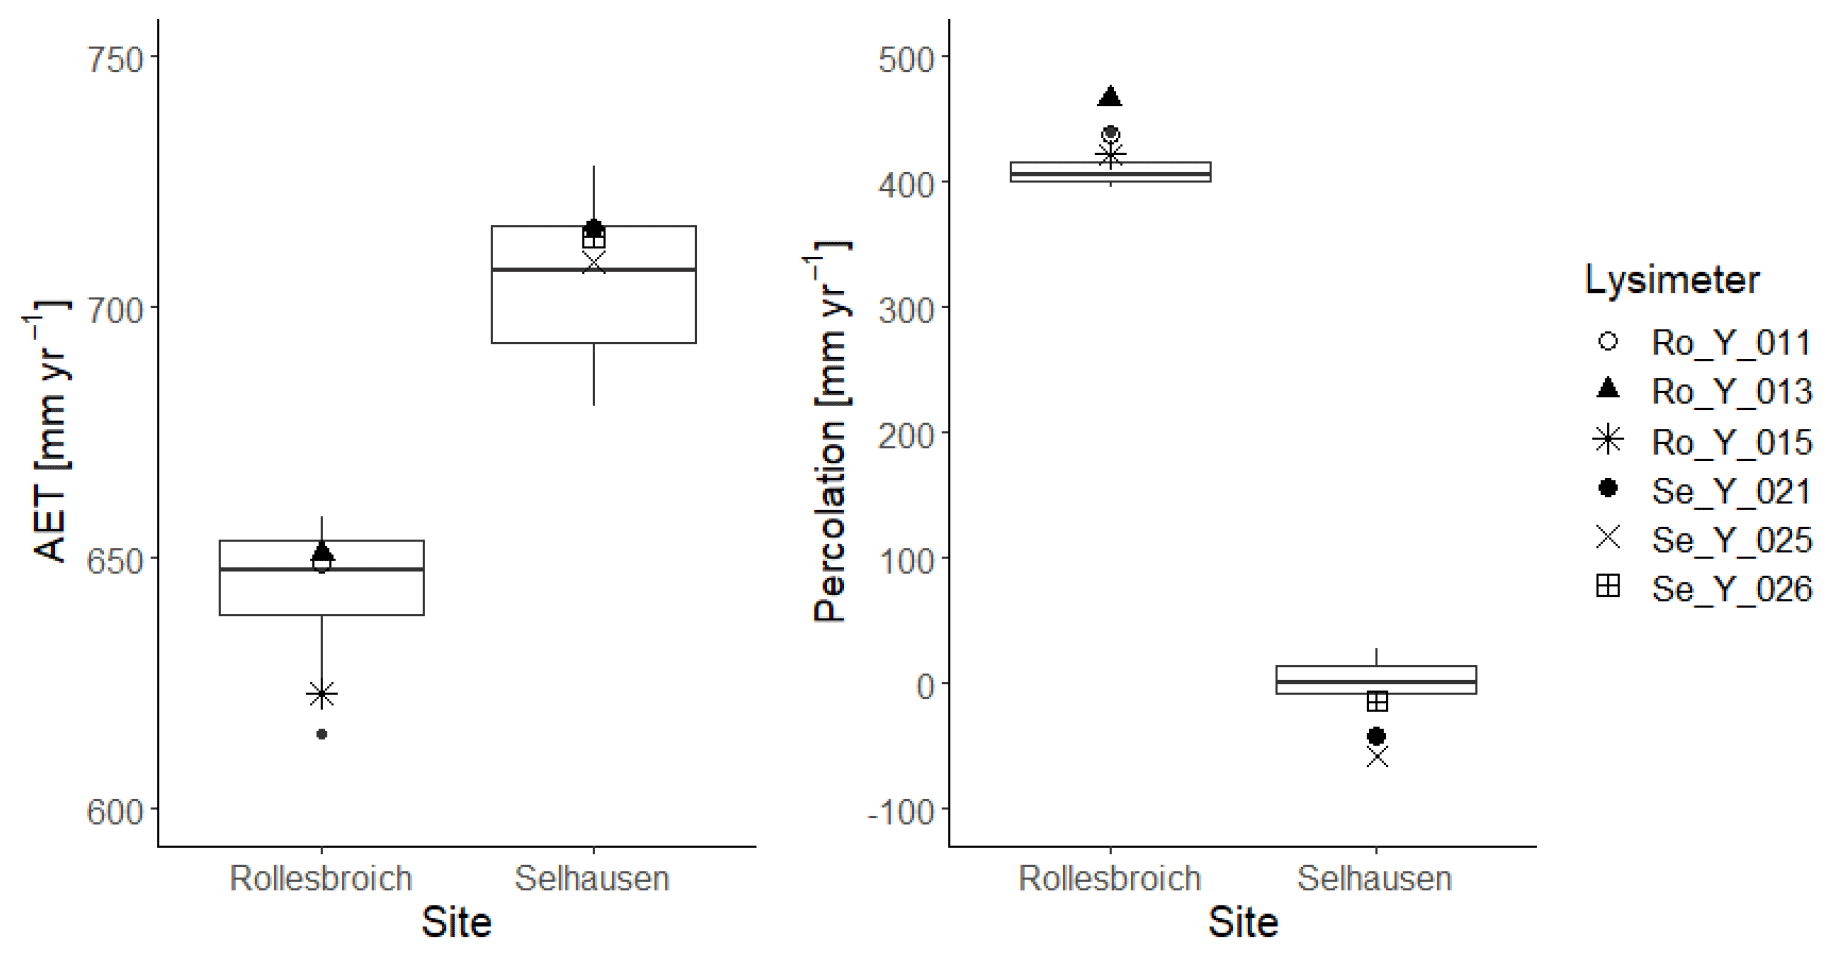
Figure 6Box-and-whisker plots of simulated annual average evapotranspiration (AET) and percolation at Selhausen and Rollesbroich for the period 2013–2018 for the 30 acceptable simulations compared with the lysimeter measurements (large symbols). For an explanation of the box-and-whisker plots, see the caption of Fig. 3.

Figure 7Simulated water balance terms for the 30 acceptable simulations at each site. For an explanation of the box-and-whisker plots, see the caption of Fig. 3.
Table 6Model efficiencies for the different data types (median values of the 30 acceptable parameter sets, with minimum and maximum values in parentheses).
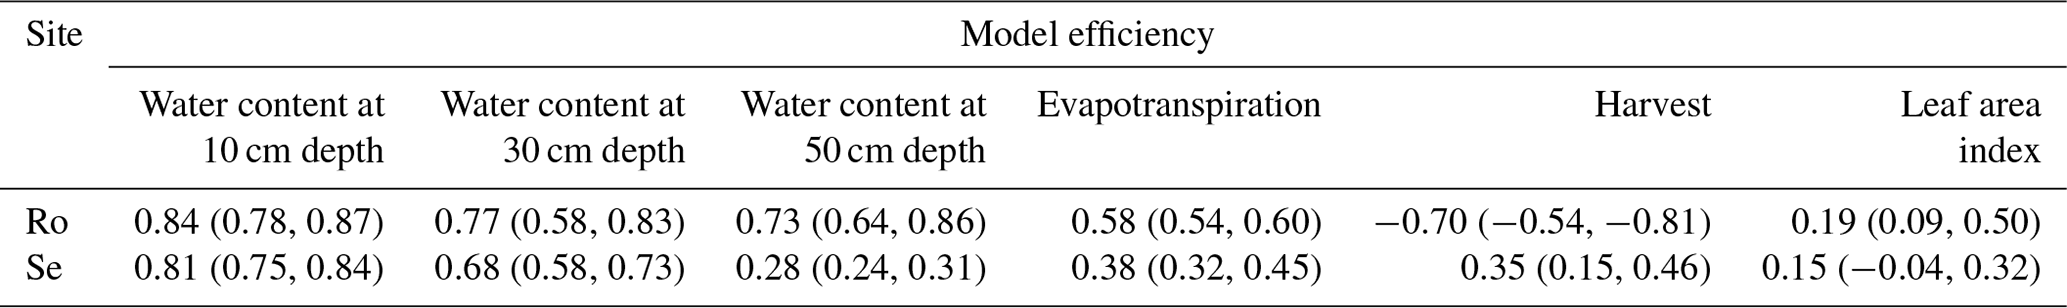
Figure 7 shows that the model simulates only small reductions of transpiration due to water stress and stomatal closure at both sites (Ta < Tp), which matches the inference derived from comparing the lysimeter data with the FAO estimates of potential evaporation (Fig. 1). This result is not especially surprising for the grassland growing in the wet climate at Rollesbroich, but the inference of very limited reductions in water uptake and transpiration in the Selhausen lysimeters despite the extensive drying observed in the root zone (Fig. 4) does require further analysis and explanation. The macroscopic sink term describing root water uptake that we coupled to Richards' equation implicitly accounts for “compensatory” root water uptake (Jarvis, 2011). Our results suggest these that compensation mechanisms are extremely efficient at the Selhausen site. One reason for this is clearly the deeper root system. Another reason becomes apparent from a comparison of the results for the two highlighted simulations in Fig. 8, which shows the simulated time courses of the two water stress functions in the model. This comparison shows that simulations with strong reductions in the dry-matter allocation function have correspondingly small reductions in the stress function regulating transpiration or, as in this example (simulation number 6), none at all. This is because an increased rate of leaf loss and a greater allocation of assimilates to the below-ground biomass during drought reduce the transpiration demand as well as increasing the potential rate of water uptake by the root system. These adaptation mechanisms in response to soil drying conserve soil water and reduce the likelihood of stomatal closure, so that transpiration can be maintained during extended dry summer periods. Shorter periods of stomatal closure induced by water stress do occur every summer at Selhausen in most of the acceptable model simulations, with one more extended period of drought stress (ca. 1 to 2 weeks) in 2018. However, overall, the extent and severity of reductions in transpiration due to water stress simulated at Selhausen is not much larger than at Rollesbroich.
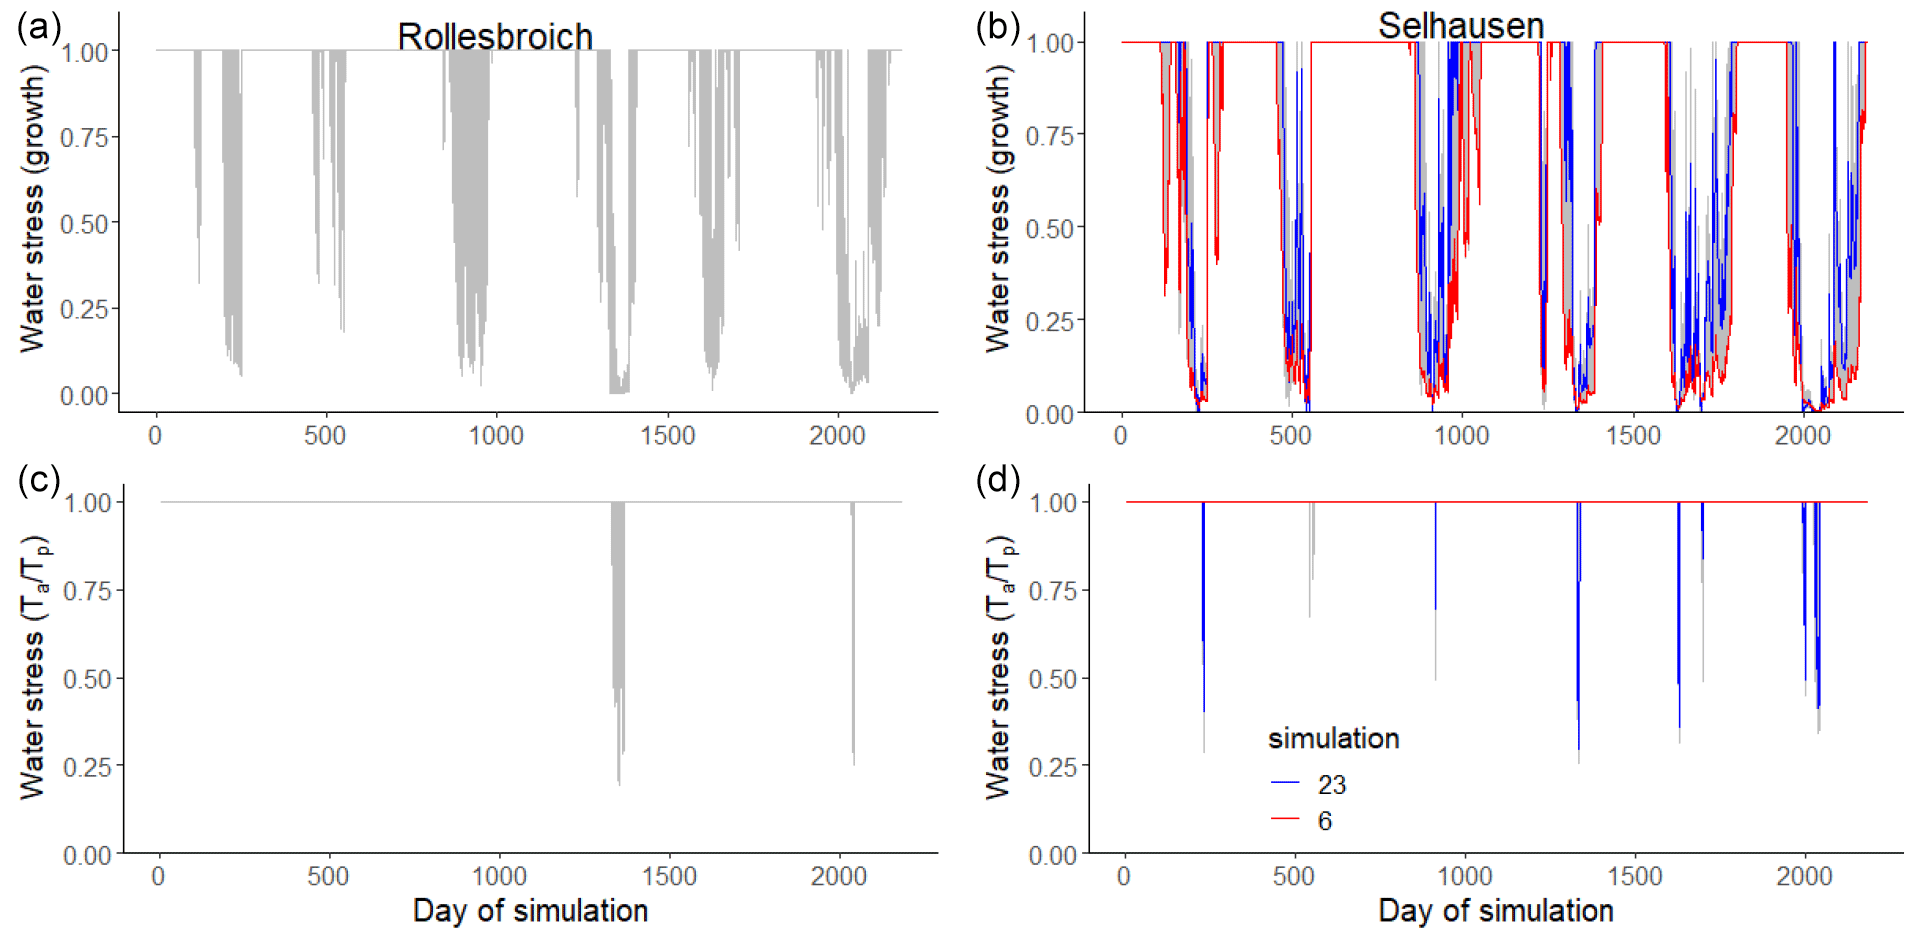
Figure 8Plots of the two water stress functions in the model for the acceptable simulations. The uppermost figures show the threshold function of the pressure head at the root surface (Eq. 35) controlling dry-matter allocation and leaf loss, while the figures at the bottom show the ratio of actual to potential transpiration, which controls assimilation (Eq. 34). Two contrasting acceptable simulations for the Selhausen site are highlighted in red and blue. Day 1 is 1 January 2013.
3.3 Grassland growth
Figures 9 and 10 show comparisons of the acceptable simulations with the measurements of leaf area index and harvested biomass on the lysimeters at Selhausen and Rollesbroich. The model efficiencies for these two data types are shown in Table 6. Figure 11 shows box-and-whisker plots of the simulated total harvest and overall water use efficiency (WUE; defined as total harvest divided by evapotranspiration) at the two sites. The results suggest that the model performed satisfactorily for leaf area development at both sites and for harvested biomass at Selhausen but not for harvests at Rollesbroich (Table 6). These poorer results can largely be explained by the fact that lysimeter Ro_Y_013 was considered an outlier, so no effort was made to match these data by loosening the constraints in the GLUE analysis.
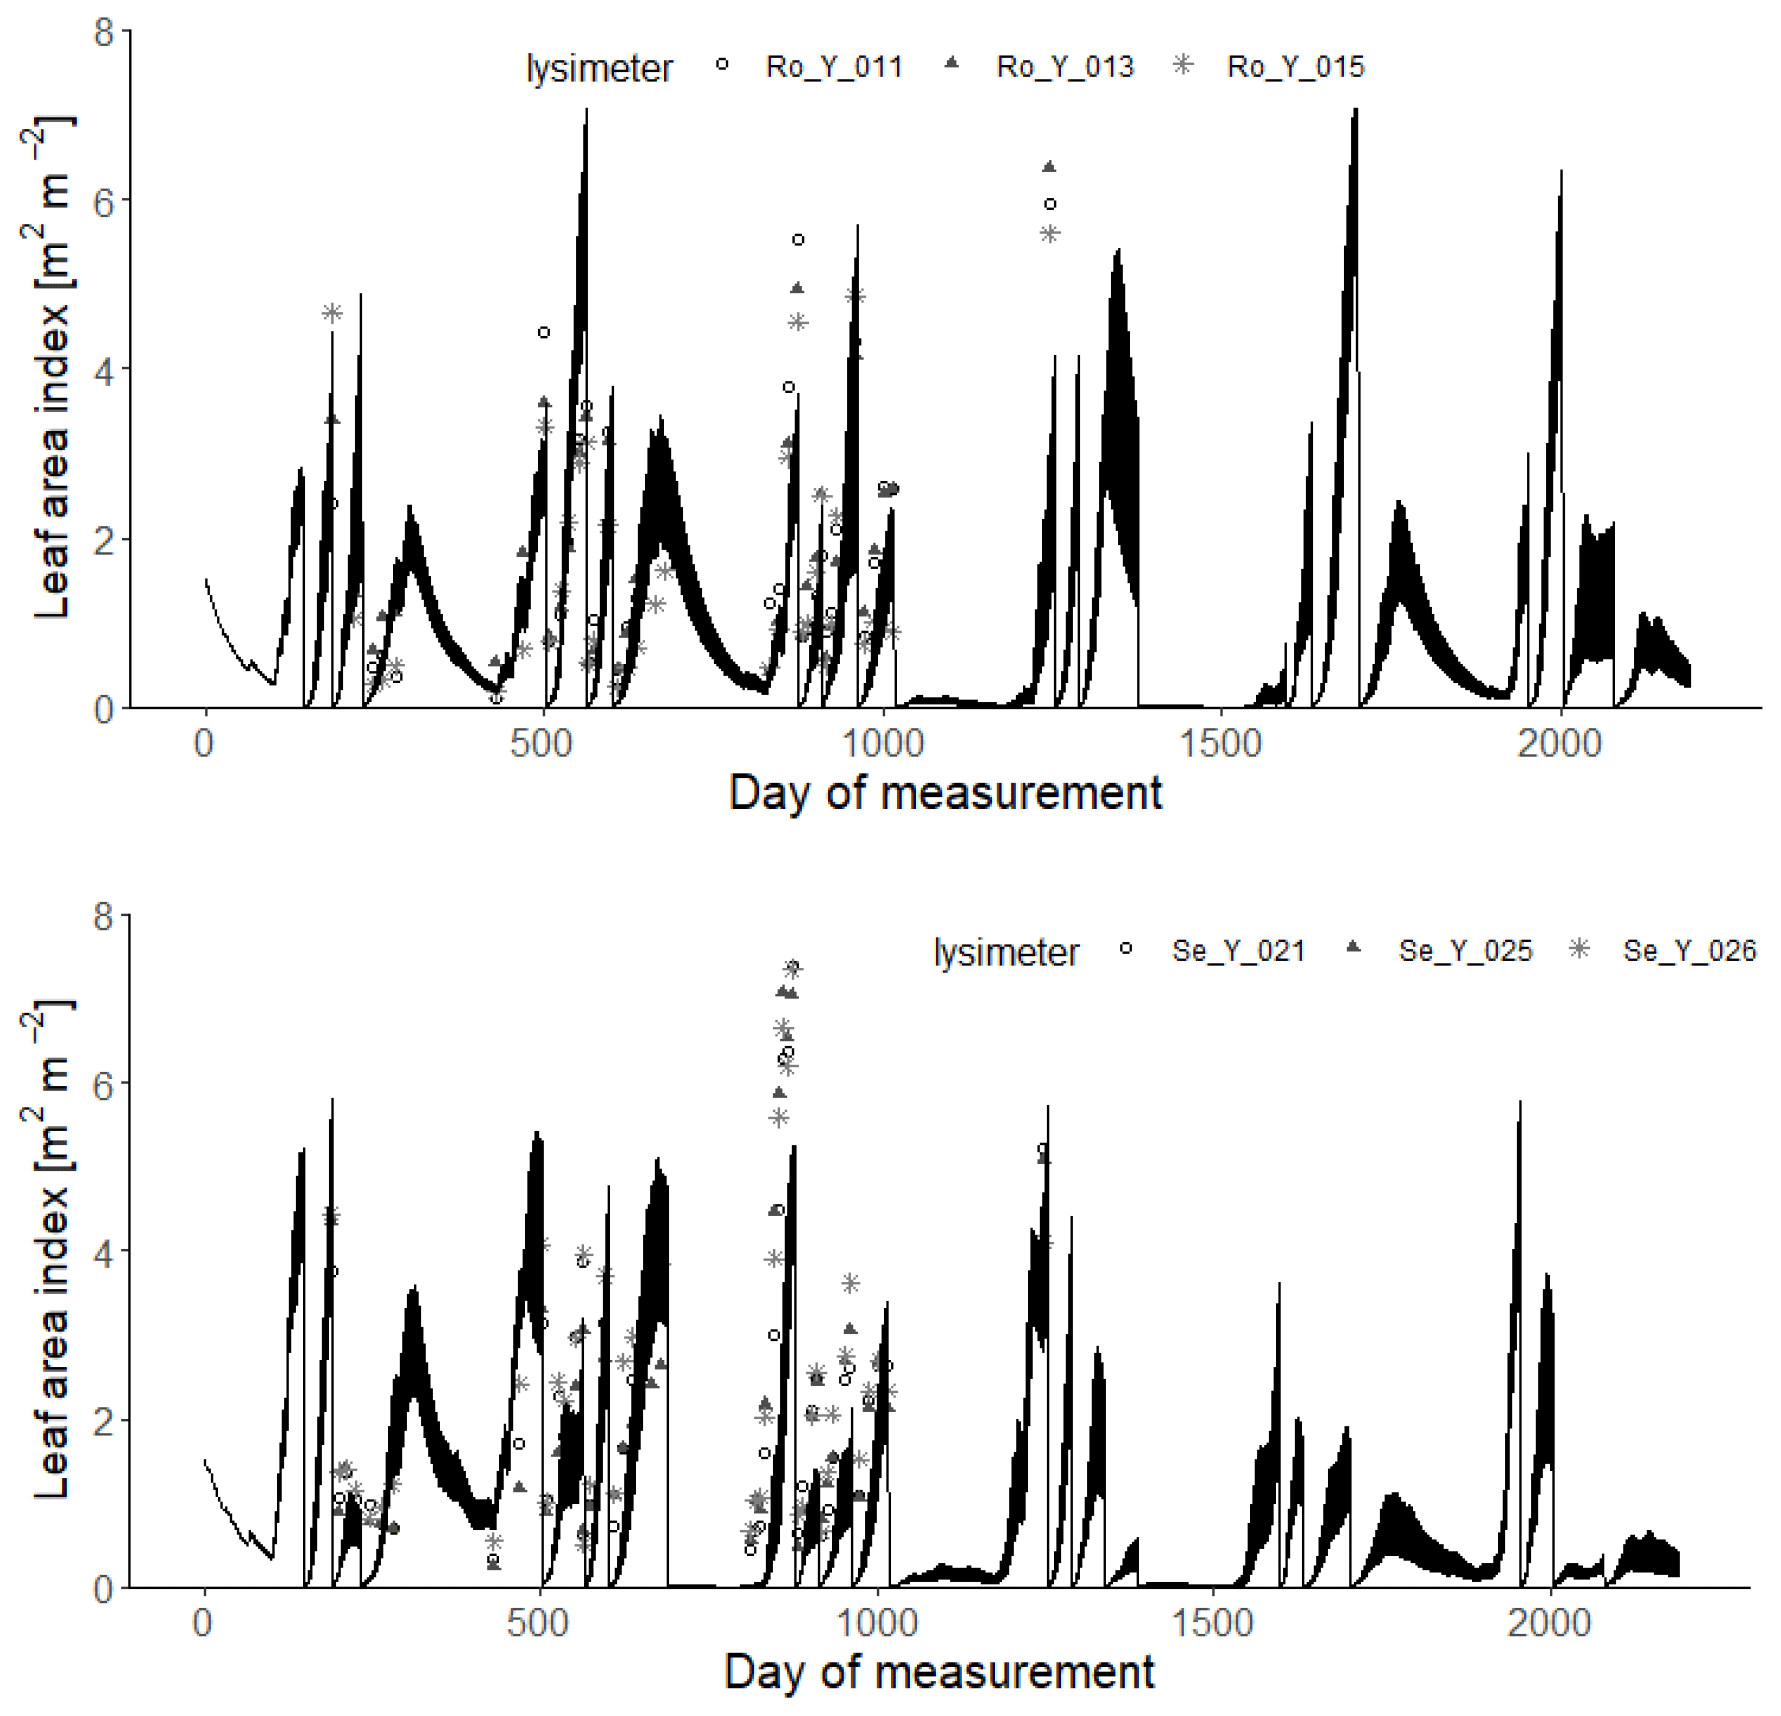
Figure 9Measured daily leaf area index (symbols; 2013–2018) compared with simulations for the 30 acceptable parameterizations at each site (black lines). Day 1 is 1 January 2013.
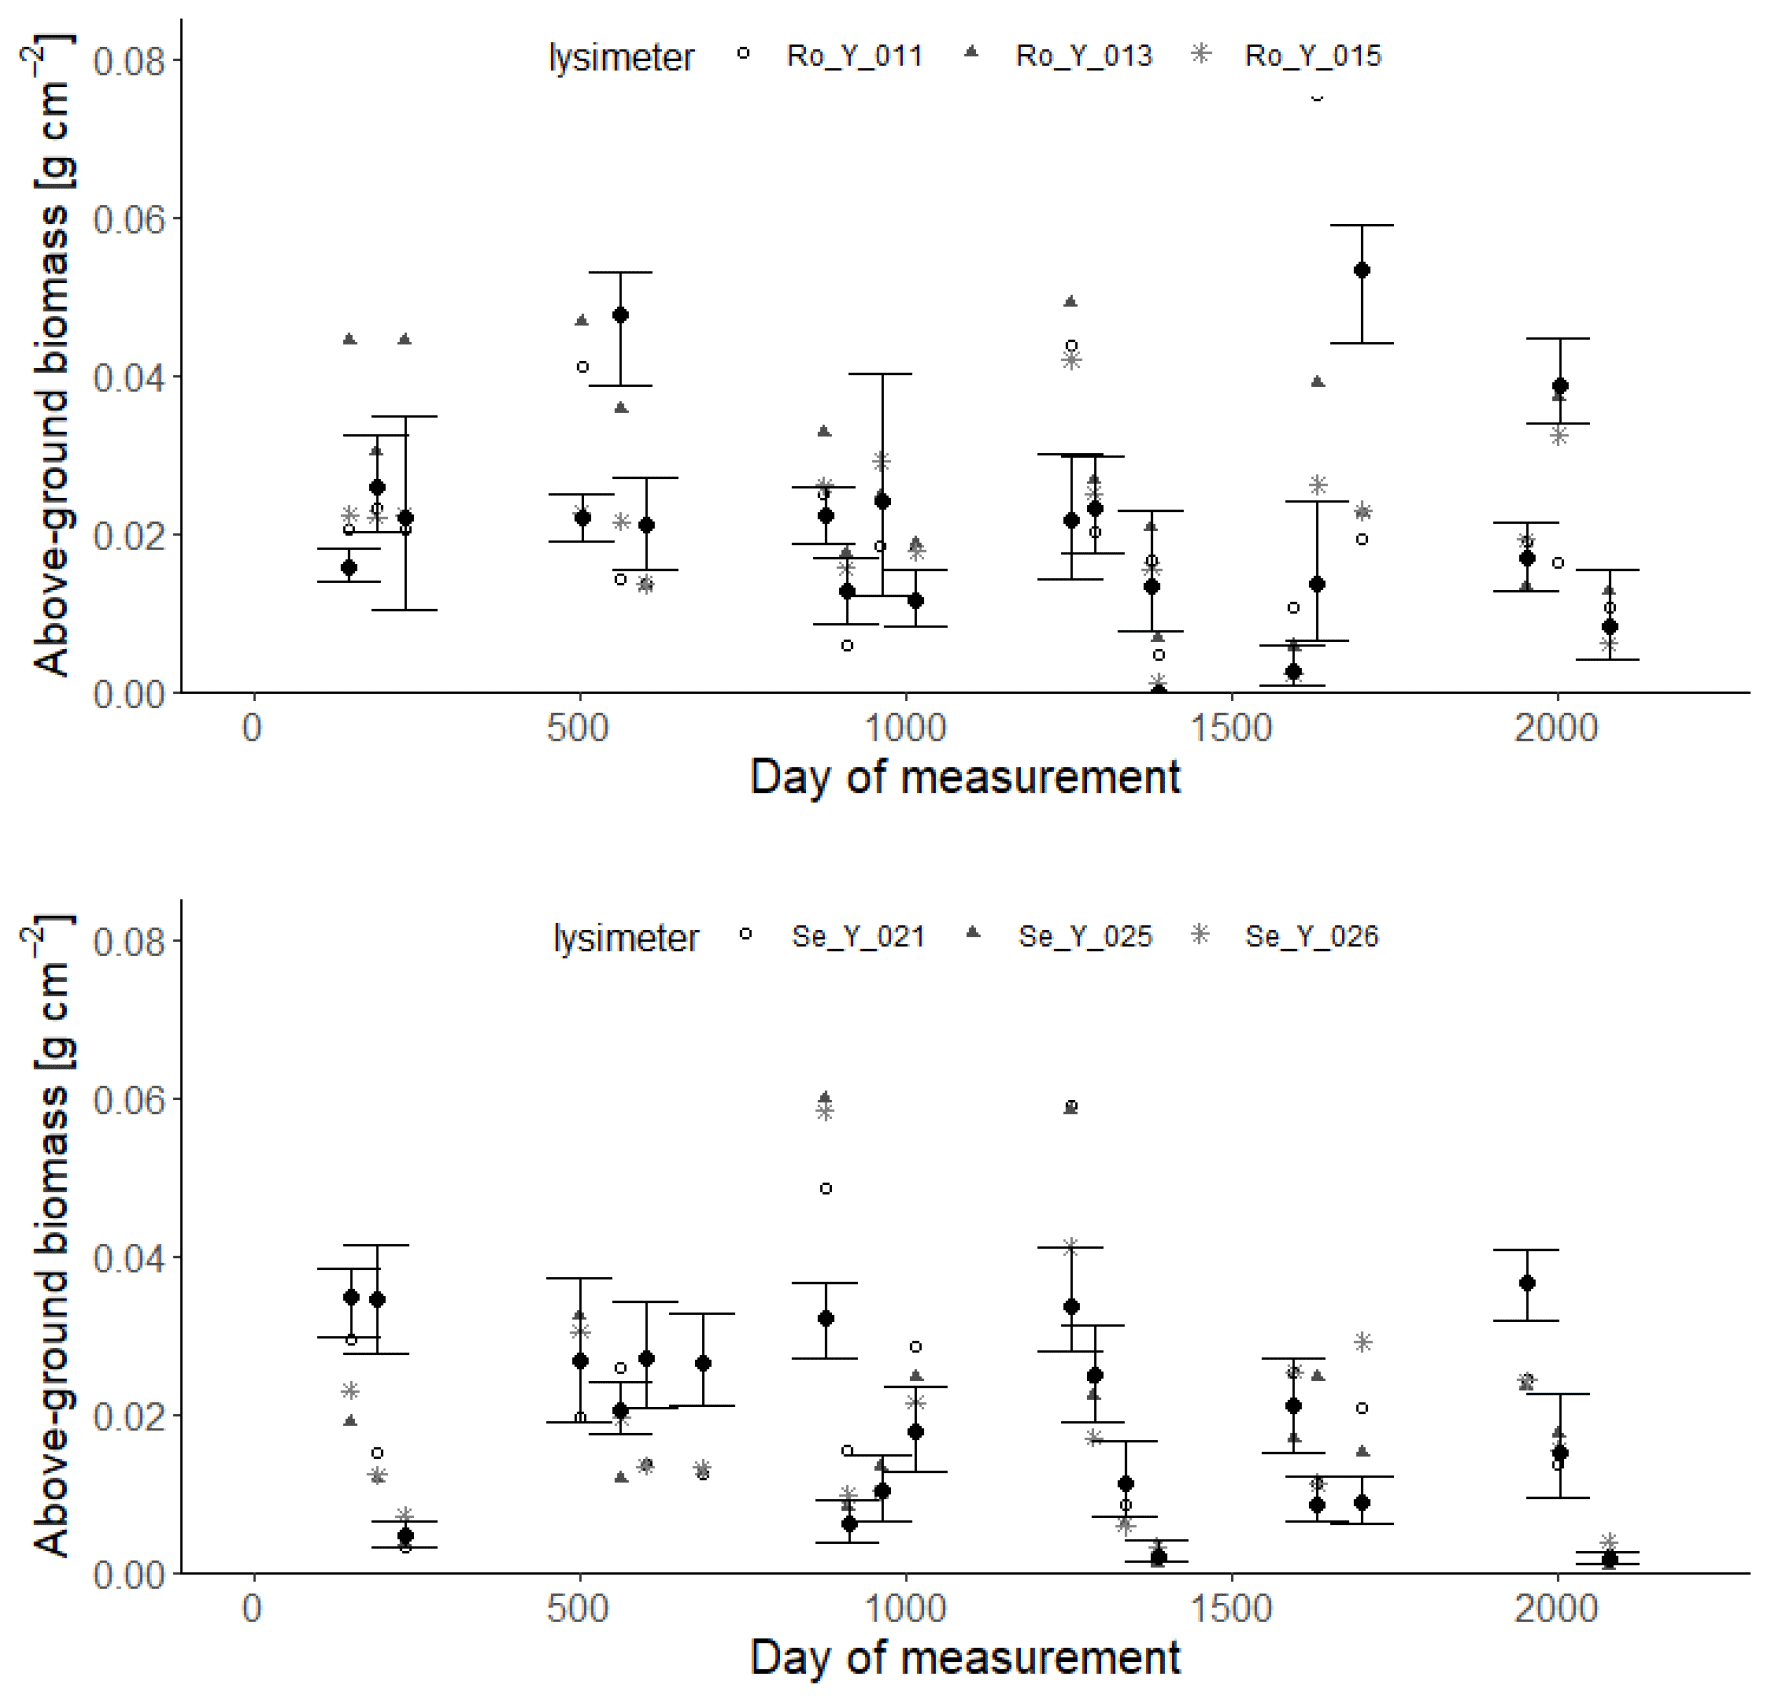
Figure 10Measured harvests of above-ground biomass (symbols; 2013–2018) compared with simulations at each site (black symbols indicate means of the 30 acceptable parameterizations, and the vertical lines denote minimum and maximum values). Day 1 is 1 January 2013.

Figure 11Box-and-whisker plots of simulated harvests and water use efficiency (WUE; defined as total harvest divided by evapotranspiration) at Selhausen and Rollesbroich for the period 2013–2018 for the 30 acceptable simulations compared with lysimeter measurements (symbols). For an explanation of the box-and-whisker plots, see the caption of Fig. 3.
Figure 12 shows the gain and loss terms in the dry-matter balances simulated with the 30 best parameterizations at each site. Simulated assimilation was ca. 10 % larger at Selhausen compared with Rollesbroich as a consequence of the greater radiation input and higher temperatures (Fig. S1) and the fact that water stress is only slightly more prevalent (Fig. 8). Leaf loss is a relatively small term in the mass balance (10 %–12 % of assimilation) and is similar at both sites (Fig. 12). Root production and decay (i.e. turnover) are more significant terms, with root decay closely mirroring production, since it is modelled as a first-order function of biomass. Expressed as a proportion of assimilation, simulated root production and decay are somewhat larger at Selhausen compared with Rollesbroich (ca. 58 % and 53 % of assimilation respectively, on average, for both), while root biomass is also somewhat larger at Selhausen (see Fig. S9). This is in agreement with experimental studies that have demonstrated increases in below-ground biomass production in grasslands as a consequence of drought (e.g. Jones et al., 1980a; Kahmen et al., 2005; Wedderburn et al., 2010; Skinner and Comas, 2010; Padilla et al., 2013; Nosalewicz et al., 2018; Meurer et al., 2019). It was not possible to make measurements of root biomass and production in the lysimeters at the two sites due to the constraints of the experimental set-up. However, literature data on root biomass and production in similar temperate grassland environments can serve as an approximate “reality check”, suggesting that our simulations (Fig. S9) are reasonable. For example, in northern Germany, Chen et al. (2016) measured a root biomass of ca. 500 g m−2 at 0–30 cm depth and a growth rate of 450 g m−2 yr−1, while in central Sweden, Meurer et al. (2019) found a root biomass of 250–330 g m−2 in the same depth interval. In central France, Picon-Cochard et al. (2012) reported summer peak root biomasses of 13 perennial grasses grown in monoculture varying between ca. 400 and 800 g m−2, with a temporal pattern matching that simulated by our model (Fig. S9). Likewise, Wedderburn et al. (2010) reported peak root counts in early summer and a minimum in winter for Lolium perenne pastures in New Zealand. The values of below-ground production simulated by our model are also within the range reported by Hui and Jackson (2006) for temperate grasslands in a global meta-analysis.
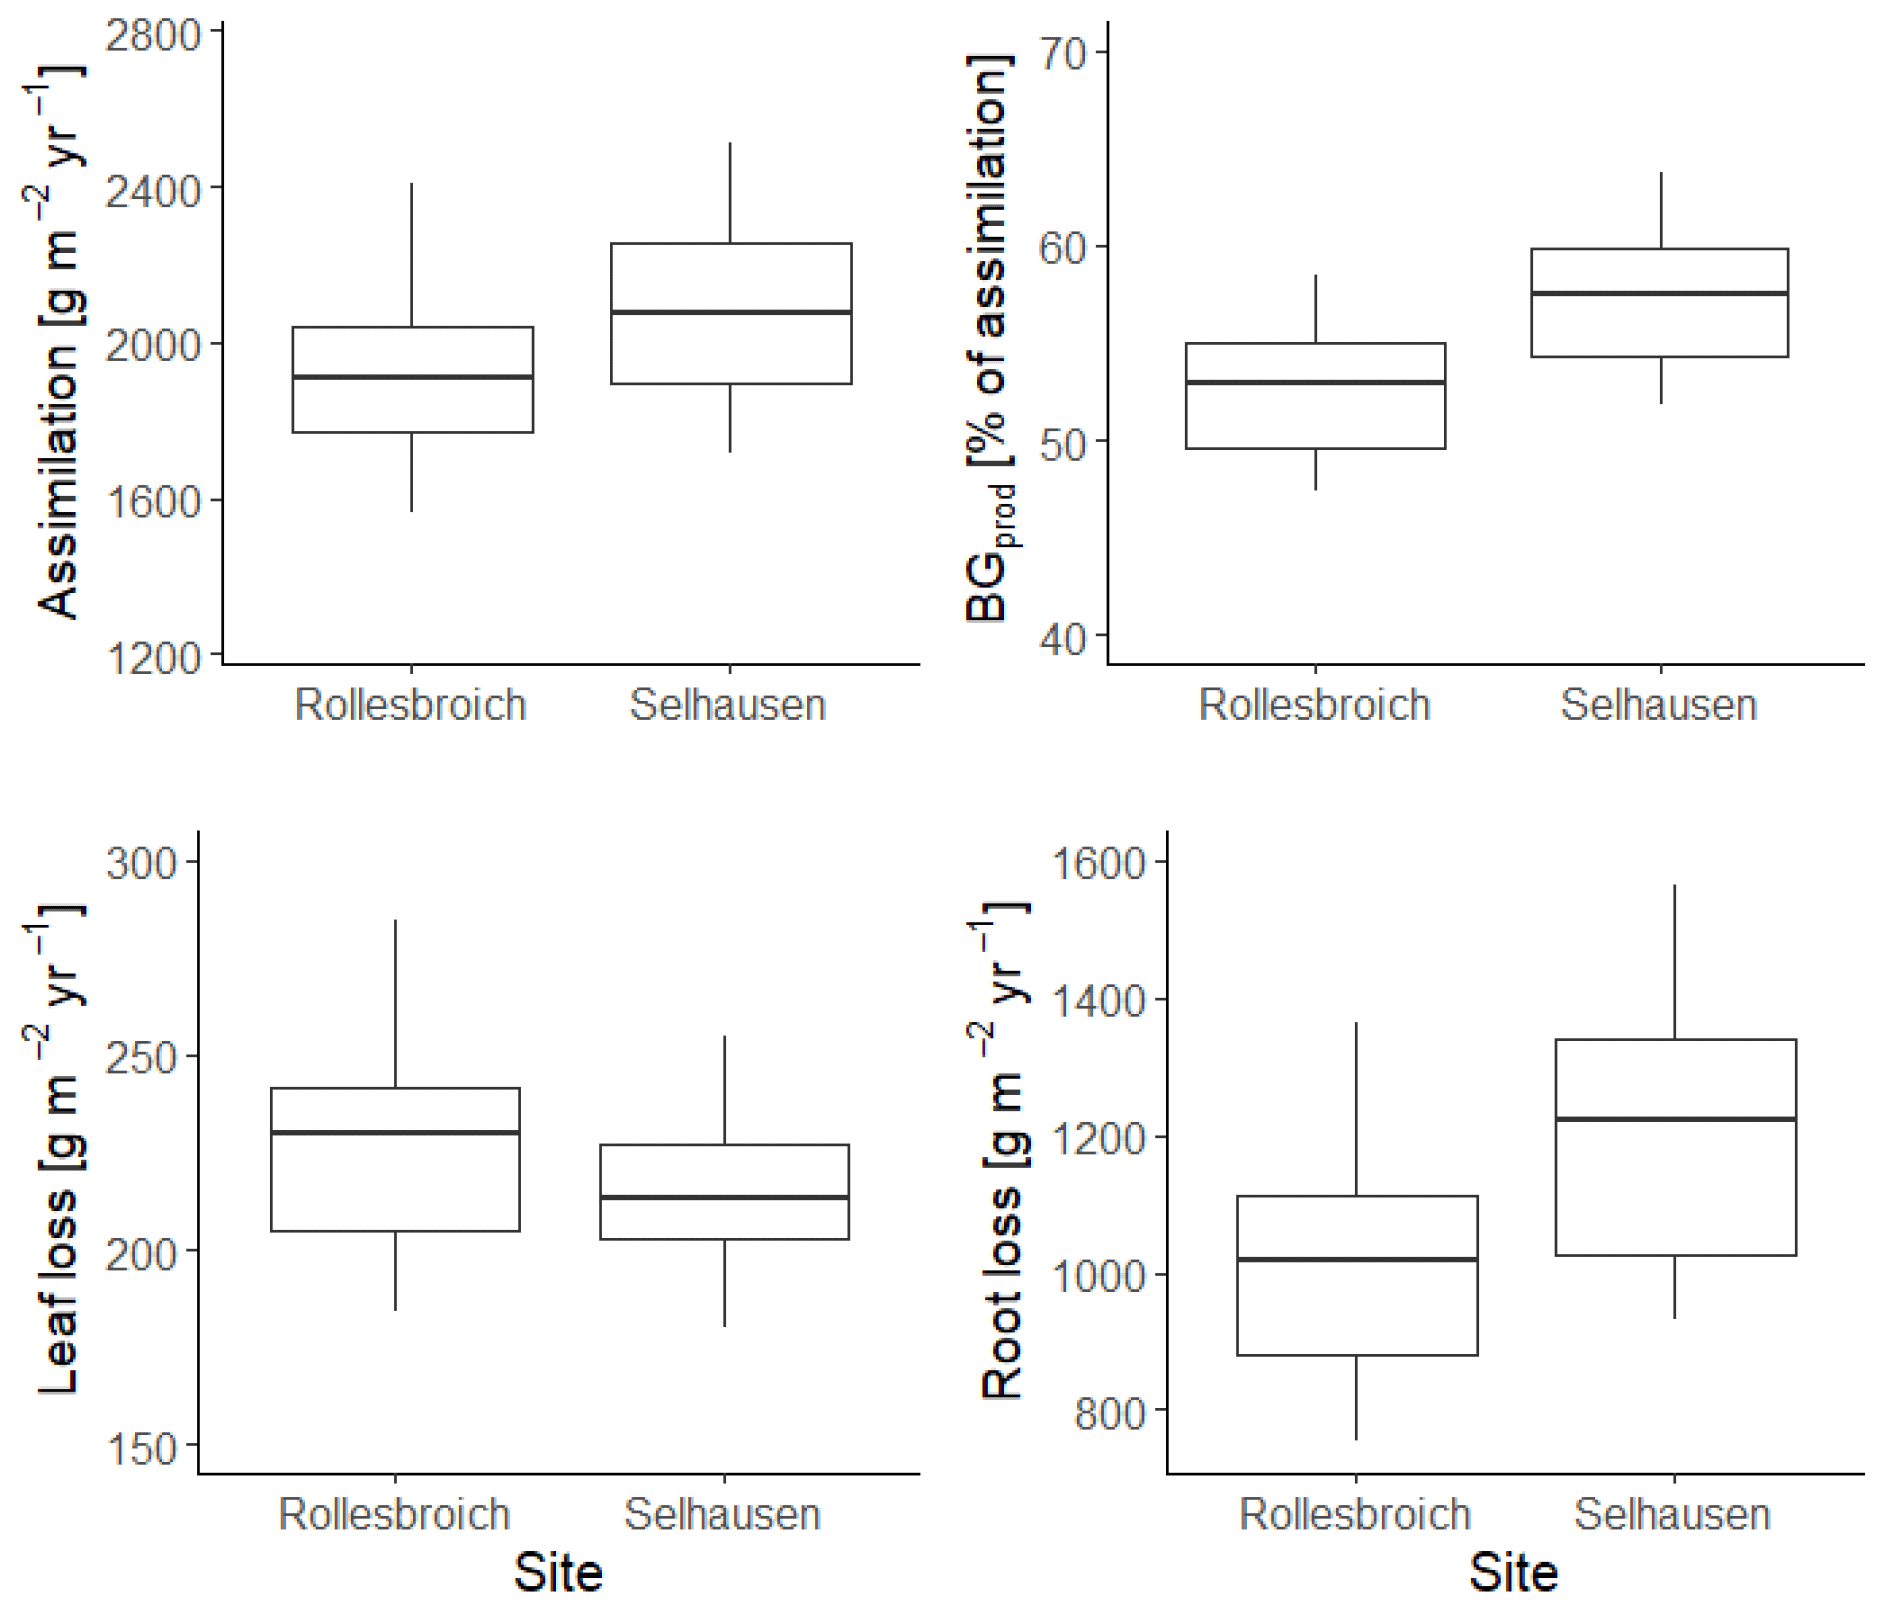
Figure 12Box-and-whisker plots showing the simulated terms in the dry-matter balance for the 30 acceptable model parameterizations at Selhausen and Rollesbroich for the period 2013–2018. For an explanation of the box-and-whisker plots, see the caption of Fig. 3.
In this study, we made use of an eco-hydrological model to analyse the impacts on soil water balance and grassland production of climate change triggered by the transfer of weighing lysimeters from a wet, cool climate (Rollesbroich) to a drier, warmer climate (Selhausen). The relatively simple model employed in this study gave satisfactory simulations of soil water contents (model efficiency, ME, between 0.24 and 0.87) and evapotranspiration rates (ME between 0.32 and 0.60) measured at a daily resolution at both sites during a 6-year period, as well as acceptable simulations of leaf area development (ME between −0.04 and 0.50). In this model application, we assumed identical static root distributions for the grassland at the two sites and inferred different (constant) values of the maximum root depth, with deeper roots in the drier climate at Selhausen. We also concluded from the modelling that more frequent and intense soil drying at Selhausen led to a shift towards a greater production of below-ground biomass, thus mitigating drought stress. A major challenge for the future will be to further develop crop and eco-hydrological models to enable them to predict these dynamic responses of plant roots to changing soil and climatic conditions as emergent phenomena. In this respect, it should be worthwhile to test simple empirical approaches to link root distribution with maximum root depth and biomass (e.g. Arora and Boer, 2003) as well as developing improved architectural models of root growth (e.g. Postma et al., 2017; Schnepf et al., 2018; Mboh et al., 2019). Regardless of modelling approach, it seems clear that plastic responses of plant traits to climate change of the kind we inferred from our study (e.g. in root depth or leaf conductance) introduce significant uncertainties into model predictions of water balance and plant growth.
Processed data developed during this study can be acquired upon request from Jannis Groh or Katharina H. E. Meurer.
The supplement related to this article is available online at: https://doi.org/10.5194/hess-26-2277-2022-supplement.
The study was conceived by NJ, HV, KHEM and EL. NJ built the model. TP, JG, WD and CB supplied data and advised on its use. Initial data analyses and model applications were carried out by ER as part of his thesis project, supervised by KHEM, NJ and EL. NJ and KHEM carried out the final simulations. NJ prepared the manuscript with contributions from all authors.
The contact author has declared that neither they nor their co-authors have any competing interests.
Publisher’s note: Copernicus Publications remains neutral with regard to jurisdictional claims in published maps and institutional affiliations.
This work was partly funded by the Swedish Research Council for Sustainable Development (FORMAS, grant no. 2018-02319). We also acknowledge the support of the TERENO-SoilCan programme funded by the Helmholtz Association (HGF) and the Federal Ministry of Education and Research (BMBF). We would also like to thank Werner Küpper, Ferdinand Engels, Philipp Meulendick, Rainer Harms and Leander Fürst at the Selhausen and Rollesbroich lysimeter stations for their support.
This research has been supported by the Svenska Forskningsrådet Formas (grant no. 2018-02319).
This paper was edited by Loes van Schaik and reviewed by Quirijn de Jong van Lier and one anonymous referee.
Akmal, M. and Janssens, M.: Productivity and light use efficiency of perennial ryegrass with contrasting water and nitrogen supplies, Field Crop. Res., 88, 143–155, 2004.
Allen, R., Pereira, L., Raes, D., and Smith, M.: Crop evapotranspiration – guidelines for computing crop water requirements, FAO Irrigation and Drainage Paper 56, FAO Food and Agricultural Organization of the United Nations, Rome, ISBN 92-5-104219-5, 1998.
Arora, V. and Boer, G.: A representation of variable root distribution in dynamic vegetation models, Earth Int., 7, 1–19, 2003.
Ataroff, M. and Naranjo, M.: Interception of water by pastures of Pennisetum clandestinum Hochst. ex Chiov. and Melinis minutiflora Beauv, Agr. Forest Meteorol., 149, 1616–1620, 2009.
Beier, C., Beierkuhnlein, C., Wohlgemuth, T., Penuelas, J., Emmett, B., Körner, C., de Boeck, H., Hesselbjerg Christensen, J., Leuzinger, S., Janssens, I., and Hansen, K.: Precipitation manipulation experiments – challenges and recommendations for the future, Ecol. Lett., 15, 899–911, 2012.
Bellocchi, G., Rivington, M., Donatelli, M., and Matthews, K.: Validation of biophysical models: issues and methodologies. A review, Agron. Sustain. Dev., 30, 109–130, 2010.
Benot, M.-L., Morvan-Bertrand, A., Mony, C., Huet, J., Sulmon, C., Decau, M.-L., Prud'homme, M.-P., and Bonis, A.: Grazing intensity modulates carbohydrate storage pattern in five grass species from temperate grasslands, Acta Oecol., 95, 108–115, 2019.
Beven, K.: A manifesto for the equifinality thesis, J. Hydrol., 320, 18–36, 2006.
Beven, K. and Binley, A.: The future of distributed models: model calibration and uncertainty prediction, Hydrol. Process., 6, 279–298, 1992.
Black, A., Moot, D., and Lucas, R.: Development and growth characteristics of Caucasian and white clover seedlings, compared with perennial ryegrass, Grass Forage Sci., 61, 442–453, 2006.
Bogena, H., Montzka, C., Huisman, J., Graf, A., Schmidt, M., Stockinger, M., von Hebel, C., Hendricks-Franssen, H., van der Kruk, J., Tappe, W., Lücke, A., Baatz, R., Bol, R., Groh, J., Pütz, T., Jakobi, J., Kunkel, R., Sorg, J., and Vereecken, H.: The TERENO-Rur hydrological observatory: a multiscale multi-compartment research platform for the advancement of hydrological science, Vadose Zone J., 17, 180055, https://doi.org/10.2136/vzj2018.03.0055, 2018.
Bollig, C. and Feller, U.: Impacts of drought stress on water relations and carbon assimilation in grassland species at different altitudes, Agr. Ecosyst. Environ., 188, 212–220, 2014.
Bonos, S. and Murphy, J.: Growth responses and performance of Kentucky Bluegrass under summer stress, Crop Sci., 39, 770–774, 1999.
Boote, K., Jones, J., White, J., Asseng, S., and Lizaso, J.: Putting mechanisms into crop production models, Plant Cell Environ., 36, 1658–1672, 2013.
Bossio, D., Cook-Patton, S., Ellis, P., Fargione, J., Sanderman, J., Smith, P., Wood, S., Zomer, R., von Unger, M., Emmer, I., and Griscom, B.: The role of soil carbon in natural climate solutions, Nat. Sustain., 3, 391–398, https://doi.org/10.1038/s41893-020-0491-z, 2020.
Cai, G., Vanderborght, J., Couvreur, V., Mboh, C., and Vereecken, H.: Parameterization of root water uptake models considering dynamic root distributions and water uptake compensation, Vadose Zone J., 17, 160125, https://doi.org/10.2136/vzj2016.12.0125, 2017.
Chen, H. and Brassard, B.: Intrinsic and extrinsic controls of fine root life span, Crit. Rev. Plant Sci., 32, 151–161, 2013.
Coleman, S., Shiel, R., and Evans, D.: The effects of weather and nutrition on the yield of hay from Palace Leas meadow hay plots, at Cockle Park experimental farm, over the period from 1897 to 1980, Grass Forage Sci., 42, 353–358, 1989.
Chen, S., Lin, S., Reinsch, T., Loges, R., Hasler, M., and Taube, F.: Comparison of ingrowth core and sequential soil core methods for estimating belowground net primary production in grass–clover swards, Grass Forage Sci., 71, 515–528, 2016.
Couvreur, V., Vanderborght, J., and Javaux, M.: A simple three-dimensional macroscopic root water uptake model based on the hydraulic architecture approach, Hydrol. Earth Syst. Sci., 16, 2957–2971, https://https://doi.org/10.5194/hess-16-2957-2012, 2012.
DaCosta, M., Wang, Z., and Huang, B.: Physiological adaptation of Kentucky Bluegrass to localized soil drying, Crop Sci., 44, 1307–1314, 2004.
de Jong van Lier, Q., Dourado Neto, D., and Metselaar, K.: Modeling of transpiration reduction in van Genuchten–Mualem type soils, Water Resour. Res., 45, W02422, https://doi.org/10.1029/2008WR006938, 2009.
de Jong van Lier, Q., van Dam, J., Durigon, A., dos Santos, M., and Metselaar, K.: Modeling water potentials and flows in the soil-plant system comparing hydraulic resistances and transpiration reduction functions, Vadose Zone J., 12, https://doi.org/10.2136/vzj2013.02.0039, 2013.
de Jong van Lier, Q., van Dam, J., Metselaar, K., de Jong, R., and Duijnisveld, W.: Macroscopic root water uptake distribution using a matric flux potential approach, Vadose Zone J., 7, 1065–1078, 2008.
de Willigen, P., van Dam, J., Javaux, M., and Heinen, M.: Root water uptake as simulated by three soil water flow models, Vadose Zone J., 11, https://doi.org/10.2136/vzj2012.0018, 2012.
Diekkrüger, B., Söndgerath, D., Kersebaum, K., and McVoy, C.: Validity of agroecosystem models a comparison of results of different models applied to the same data set, Ecol. Modell., 81, 3–29, 1995.
Dong, X., Patton, B., Nyren, P., Limb, R., Cihacek, L., Kirby, D., and Deckard, E.: Leaf-water relations of a native and an introduced grass species in the mixed-grass prairie under cattle grazing, Appl. Ecol. Environ. Res., 9, 311–331, 2011.
Dunbabin, V., Postma, J., Schnepf, A., Pagès, L., Javaux, M., Wu, L., Leitner, D., Chen, Y., Rengel, Z., and Diggle, A.: Modelling root-soil interactions using three-dimensional models of root growth, architecture and function, Plant Soil, 372, 93–124, 2013.
Eckersten, H., Herrmann, A., Kornher, A., Halling, M., Sindhøj, E., and Lewan, E.: Predicting silage maize yield and quality in Sweden as influenced by climate change and variability, Acta Agric. Scand. B-S. P., 62, 151–165, 2012.
Fan, J., McConkey, B., Wang, H., and Janzen, H.: Root distribution by depth for temperate agricultural crops, Field Crop. Res., 189, 68–74, 2016.
Faria, L., da Rocha, M., de Jong van Lier, Q., and Casaroli, D.: A split-pot experiment with sorghum to test a root water uptake partitioning model, Plant Soil, 331, 299–311, 2010.
Fatichi, S., Pappas, C., and Ivanov, V.: Modeling plant-water interactions: an ecohydrological overview from the cell to the global scale, WIREs Water 3, 327–368, https://doi.org/10.1002/wat2.1125, 2016.
Foley, J., Ramankutty, N., Brauman, K., Cassidy, E., Gerber, J., Johnston, M., Mueller, N., O'Connell, C., Ray, D., West, P., Balzer, C., Bennett, E., Carpenter, S., Hill, J., Monfreda, C., Polasky, S., Rockström, J., Sheehan, J., Siebert, S., Tilman, D., and Zaks, D.: Solutions for a cultivated planet, Nature, 7369, 337–342, 2011.
Forstner, V., Groh, J., Vremec, M., Herndl, M., Vereecken, H., Gerke, H. H., Birk, S., and Pütz, T.: Response of water fluxes and biomass production to climate change in permanent grassland soil ecosystems, Hydrol. Earth Syst. Sci., 25, 6087–6106, https://https://doi.org/10.5194/hess-25-6087-2021, 2021.
Friedlingstein, P., Joel, G., Field, C., and Fung, I.: Toward an allocation scheme for global terrestrial carbon models, Glob. Change Biol., 5, 755–770, 1999.
Gebler, S., Hendricks Franssen, H.-J., Pütz, T., Post, H., Schmidt, M., and Vereecken, H.: Actual evapotranspiration and precipitation measured by lysimeters: a comparison with eddy covariance and tipping bucket, Hydrol. Earth Syst. Sci., 19, 2145–2161, https://https://doi.org/10.5194/hess-19-2145-2015, 2015.
Gifford, R.: Plant respiration in productivity models: conceptualisation, representation and issues for global terrestrial carbon-cycle research, Funct. Plant Biol., 30, 171–186, 2003.
Giraud, M., Groh, J., Gerke, H. H., Brüggemann, N., Vereecken, H., and Pütz, T.: Soil nitrogen dynamics in a managed temperate grassland under changed climatic conditions, Water, 13, 931, https://doi.org/10.3390/w13070931, 2021.
Groh, J., Pütz, T., Gerke, H., Vanderborght, J., and Vereecken, H.: Quantification and prediction of nighttime evapotranspiration for two distinct grassland ecosystems, Water Resour. Res., 55, 2961–2975, 2019.
Groh, J., Diamantopoulos, E., Duan, X., Ewert, F., Herbst, M., Holbak, M., Kamali, B., Kersebaum, K.-C., Kuhnert, M., Lischeid, G., Nendel, C., Priesack, E., Steidl, J., Sommer, M., Pütz, T., Vereecken, H., Wallor, E., Weber, T., Wegehenkel, M., Weihermüller, L., and Gerke, H.: Crop growth and soil water fluxes at erosion-affected arable sites: using weighing lysimeter data for model intercomparison, Vadose Zone J., 19, e20058, https://doi.org/10.1002/vzj2.20058, 2020a.
Groh, J., Vanderborght, J., Pütz, T., Vogel, H.-J., Gründling, R., Rupp, H., Rahmati, M., Sommer, M., Vereecken, H., and Gerke, H. H.: Responses of soil water storage and crop water use efficiency to changing climatic conditions: a lysimeter-based space-for-time approach, Hydrol. Earth Syst. Sci., 24, 1211–1225, https://doi.org/10.5194/hess-24-1211-2020, 2020b.
Guest, G., Kröbel, R., Grant, B., Smith, W., Sansoulet, J., Pattey, E., Desjardins, R., Jégo, G., Tremblay, N., and Tremblay, G.: Model comparison of soil processes in eastern Canada using DayCent, DNDC and STICS, Nutr. Cycl. Agroecosys., 109, 211–232, 2017.
Gupta, A., Rico Medina, A., and Caño Delgado, A.: The physiology of plant responses to drought, Science, 368, 266–269, 2020.
He, D, Wang, E., Wang, J., and Robertson, M.: Data requirement for effective calibration of process-based crop models, Agr. Forest Meteorol., 234–235, 136–148, 2017.
Heinlein, F., Biernath, C., Klein, C., Thieme, C., and Priesack, E.: Evaluation of simulated transpiration from maize plants on lysimeters, Vadose Zone J., 16, https://doi.org/10.2136/vzj2016.05.0042, 2017.
Hennessy, D., O'Donovan, M., French, P., and Laidlaw, A.: Factors influencing tissue turnover during winter in perennial ryegrass-dominated swards, Grass Forage Sci., 63, 202–211, 2008.
Hofer, D., Suter, M., Buchmann, N., and Lüscher, A.: Severe water deficit restricts biomass production of Lolium perenne L. and Trifolium repens L. and causes foliar nitrogen but not carbohydrate limitation, Plant Soil, 421, 367–380, 2017.
Holloway-Phillips, M. and Brodribb, T.: Minimum hydraulic safety leads to a maximum water-use efficiency in a forage grass, Plant Cell Environ., 34, 302–313, https://doi.org/10.1111/j.1365-3040.2010.02244.x, 2011.
Hoover, D., Wilcox, K., and Young, K.: Experimental droughts with rainout shelters: a methodological review, Ecosphere, 9, e02088, https://doi.org/10.1002/ecs2.2088, 2018.
Howard, H. and Watschke, T.: Variable high-temperature tolerance among Kentucky Bluegrass cultivars, Agron. J., 83, 689–693, 1991.
Hu, L., Wang, Z., and Huang, B.: Effects of cytokinin and potassium on stomatal and photosynthetic recovery of Kentucky Bluegrass from drought stress, Crop Sci., 53, 221–231, https://doi.org/10.2135/cropsci2012.05.0284, 2013.
Hu, Z., Yu, G., Zhou, Y., Sun, X., Li, Y., Shi, P., Wang, Y., Song, X., Zheng, Z., Zhang, L., and Li, S.: Partitioning of evapotranspiration and its controls in four grassland ecosystems: application of a two-source model, Agr. Forest Meteorol., 149, 1410–1420, 2009.
Hui, D. and Jackson, R.: Geographical and interannual variability in biomass partitioning in grassland ecosystems: a synthesis of field data, New Phytol., 169, 85–93, 2006.
Ineson, P., Taylor, K., Harrison, A., Poskitt, J., Benham D., Tipping, E., and Woof C.: Effects of climate change on nitrogen dynamics in upland soils. 1. A transplant approach, Glob. Change Biol., 4, 143–152, 1998.
Istanbulluoglu, E., Wang, T., and Wedin, D.: Evaluation of ecohydrologic model parsimony at local and regional scales in a semiarid grassland ecosystem, Ecohydrology, 5, 121–142, 2012.
Jackson, R., Canadell, J., Ehleringer, J., Mooney, H., Sala, O., and Schulze, E.: A global analysis of root distributions for terrestrial biomes, Oecologia, 108, 389–411, 1996.
Javaux, M., Couvreur, V., Vanderborght, J., and Vereecken, H.: Root water uptake: from three-dimensional biophysical processes to macroscopic modeling approaches, Vadose Zone J., 12, https://doi.org/10.2136/vzj2013.02.0042, 2013.
Jarvis, N., Koestel, J., Messing, I., Moeys, J., and Lindahl, A.: Influence of soil, land use and climatic factors on the hydraulic conductivity of soil, Hydrol. Earth Syst. Sci., 17, 5185–5195, https://doi.org/10.5194/hess-17-5185-2013, 2013.
Jarvis, N. J.: Simple physics-based models of compensatory plant water uptake: concepts and eco-hydrological consequences, Hydrol. Earth Syst. Sci., 15, 3431–3446, https://doi.org/10.5194/hess-15-3431-2011, 2011.
Jenkinson, D., Potts, J., Perry, J., Barnett, V., Coleman, K., and Johnston, A.: Trends in herbage yields over the last century on the Rothamsted long-term continuous hay experiment, J. Agr. Sci., 122, 365–374, 1994.
Jing, Q., Bélanger, G., Baron, V., Bonesmo, H., Virkajärvi, P., and Young, D.: Regrowth simulation of the perennial grass timothy, Ecol. Modell., 232, 64–77, 2012.
Johansson, G.: Carbon distribution in grass (Festuca pratensis L.) during regrowth after cutting- utilization of stored and newly assimilated carbon, Plant Soil, 151, 11–20, 1993.
Johnson, I., Chapman, D., Snow, V., Eckard, R., Parsons, A., Lambert, M., and Cullen, B.: DairyMod and EcoMod: biophysical pasture-simulation models for Australia and New Zealand, Aust. J. Exp. Agr., 48, 621–631, 2008.
Jones, M., Leafe, E., and Stiles, W.: Water stress in field-grown perennial ryegrass I. Its effect on growth, canopy photosynthesis, and transpiration, Ann. Appl. Biol., 96, 87–101, 1980a.
Jones, M., Leafe, E., and Stiles, W.: Water stress in field-grown perennial ryegrass I. Its effect on leaf water status, stomatal-resistance, and leaf morphology, Ann. Appl. Biol., 96, 103–110, 1980b.
Jouven, M., Carrère, P., and Baumont, R.: Model predicting dynamics of biomass, structure and digestibility of herbage in managed permanent pastures. 1. Model description, Grass Forage Sci., 61, 112–124, 2006a.
Jouven, M., Carrère, P., and Baumont, R.: Model predicting dynamics of biomass, structure and digestibility of herbage in managed permanent pastures. 1. Model evaluation, Grass Forage Sci., 61, 125–133, 2006b.
Jupp, A. and Newman, E.: Morphological and anatomical effects of severe drought on the roots of Lolium perenne L., New Phytol., 105, 393–402, 1987.
Kahmen, A., Perner, J., and Buchmann, N.: Diversity-dependent productivity in semi-natural grasslands following climate perturbations, Func. Ecol., 19, 594–601, 2005.
Katata, G., Grote, R., Mauder, M., Zeeman, M. J., and Ota, M.: Wintertime grassland dynamics may influence belowground biomass under climate change: a model analysis, Biogeosciences, 17, 1071–1085, https://doi.org/10.5194/bg-17-1071-2020, 2020.
Kellner, J., Multsch, S., Houska, T., Kraft, P., Müller, C., and Breuer, L.: A coupled hydrological-plant growth model for simulating the effect of elevated CO2 on a temperate grassland, Agr. Forest Meteorol., 246, 42–50, 2017.
Kemp, D. and Culvenor, R.: Improving the grazing and drought tolerance of temperate perennial grasses, New Zealand J. Agr. Res., 37, 365–378, 1994.
Kersebaum, K., Hecker, J., Mirschel, W., and Wegehenkel, M.: Modelling water and nutrient dynamics in soil–crop systems: a comparison of simulation models applied on common data sets, in: Modelling water and nutrient dynamics in soil–crop systems, edited by: Kersebaum, K., Hecker, J., Mirschel, W., and Wegehenkel, M., Springer, Dordrecht, https://doi.org/10.1007/978-1-4020-4479-3, 2007.
Kersebaum, K., Boote, K., Jorgenson, J., Nendel, C., Bindi, M., Frühauf, C., Gaiser, T., Hoogenboom, G., Kollas, C., Olesen, J., Rötter, R., Ruget, F., Thorburn, P., Trnka, M., and Wegehenkel, M.: Analysis and classification of data sets for calibration and validation of agro-ecosystem models, Environ. Modell. Softw., 72, 402–417, 2015.
Kipling, R., Virkajärvi, P., Breitsameter, L., Curnel, Y., De Swaef, T., Gustavsson, A.-M., Hennart, S., Höglind, M., Järvenranta, K., Minet, J., Nendel, C., Persson, T., Picon-Cochard, C., Rolinski, S., Sandars, D., Scollan N., Sebek, L., Seddaiu, G., Topp, C., Twardy, S., Van Middelkoop, J., Wu, L., and Bellocchi, G.: Key challenges and priorities for modelling European grasslands under climate change, Sci. Total Environ., 566–567, 851–864, 2016.
Kirchner, J.: Getting the right answers for the right reasons: linking measurements, analyses, and models to advance the science of hydrology, Water Resour. Res., 42, W03S04, https://https://doi.org/10.1029/2005WR004362, 2006.
Klein, C., Biernath, C., Heinlein, F., Thieme, C., Gilgen, A., Zeeman, M., and Priesack, E.: Vegetation growth models improve surface layer flux simulations of a temperate grassland, Vadose Zone J., 16, https://doi.org/10.2136/vzj2017.03.0052, 2017.
Körner, C.: Winter crop growth at low temperature may hold the answer for alpine treeline formation, Plant Ecol. Divers., 1, 3–11, 2008.
Körner, C.: Paradigm shift in plant growth control, Curr. Opin. Plant Biol., 25, 107–114, 2015.
Kröbel, R., Sun, Q., Ingwersen, J., Chen, X., Zhang, F., Müller, T., and Römheld, V.: Modelling water dynamics with DNDC and DAISY in a soil of the North China Plain: a comparative study, Environ. Modell. Softw., 25, 583–601, 2010.
Li, W., Ciais, P., Guenet, B., Peng, S., Chang, J., Chaplot, V., Khudyaev, S., Peregon, A., Piao, S., Wang, Y., and Yue, C.: Temporal response of soil organic carbon after grassland-related land-use change, Glob. Change Biol., 24, 4731–4746, 2018.
Loka, D., Harper, J., Humphreys, M., Gasior, D., Wootton-Beard, P., Gwynn-Jones, D., Scullion, J., John Doonan, J., Kingston-Smith, A., Dodd, R., Wang, J., Chadwick, D., Hill, P., Jones, D., Mills, G., Hayes, F., and Robinson, D.: Impacts of abiotic stresses on the physiology and metabolism of cool-season grasses: a review, Food & Energy Security, 8, e00152, https://doi.org/10.1002/fes3.152, 2019.
Luckner, L., van Genuchten, M., and Nielsen, D.: A consistent set of parametric models for the two-phase flow of immiscible fluids in the subsurface, Water Resour. Res., 25, 2187–2193, 1989.
Ma, S., Lardy, R., Graux, A.-I., Ben Touhami, H., Klumpp, K., Martin, R., and Bellocchi, G.: Regional-scale analysis of carbon and water cycles on managed grassland systems, Environ. Modell. Softw., 72, 356–371, 2015.
Martínez-Vilalta, J., Sala, A., Asensio, D., Galiano, L., Hoch, G., Palacio, S., Piper F., and Lloret, F.: Dynamics of non-structural carbohydrates in terrestrial plants: a global synthesis, Ecol. Monogr., 86, 495–516, 2016.
Mboh, C., Srivastava, A., Gaiser, T., and Ewert, F.: Including root architecture in a crop model improves predictions of spring wheat grain yield and above-ground biomass under water limitations, J. Agron. Crop Sci., 205, 109–128, 2019.
Metselaar, K., Pinheiro, E., and de Jong van Lier, Q.: Mathematical description of rooting profiles of agricultural crops and its effect on transpiration prediction by a hydrological model, Soil Syst., 3, 44, https://doi.org/10.3390/soilsystems3030044, 2019.
Meurer, K., Bolinder, M., Andren, O., Hansson, A.-C., Pettersson, R., and Kätterer, T.: Shoot and root production in mixed grass ley under daily fertilization and irrigation: validating the N productivity concept under field conditions, Nutr. Cycl. Agroecosys., 115, 85–99, 2019.
Meurer, K. H. E., Chenu, C., Coucheney, E., Herrmann, A. M., Keller, T., Kätterer, T., Nimblad Svensson, D., and Jarvis, N.: Modelling dynamic interactions between soil structure and the storage and turnover of soil organic matter, Biogeosciences, 17, 5025–5042, https://doi.org/10.5194/bg-17-5025-2020, 2020.
Montaldo, N., Rondena, R., Albertson, J., and Mancini, M.: Parsimonious modeling of vegetation dynamics for ecohydrologic studies of water-limited ecosystems. Water Resour. Res., 41, W10416, https://doi.org/10.1029/2005WR004094, 2005.
Monteith, J.: How do crops manipulate water supply and demand?, Philos. T. R. Soc. A, 316, 245–259, 1986.
Monteith, J.: Does transpiration limit the growth of vegetation or vice versa?, J. Hydrol., 100, 57–68, 1988.
Morvan-Bertrand, A., Pavis, N., Boucaud, J., and Prud'homme, M.-P.: Partitioning of reserve and newly assimilated carbon in roots and leaf tissues of Lolium perenne during regrowth after defoliation: assessment by 13C steady-state labelling and carbohydrate analysis, Plant Cell Environ., 22, 1097–1108, 1999.
Mualem, Y.: New model for predicting hydraulic conductivity of unsaturated porous-media, Water Resour. Res., 12, 513–522, 1976.
Nicotra, A., Atkin, O., Bonser, S., Davidson, A., Finnegan, E., Mathesius, U., Poot, P., Purugganan, M., Richards, C., Valladares, F., and van Kleunen, M.: Plant phenotypic plasticity in a changing climate, Trends Plant Sci., 15, 684–692, 2010.
Nijs, I., Ferris, R., Blum, H., Hendrey, G., and Impens, I.: Stomatal regulation in a changing climate: a field study using Free Air Temperature Increase (FATI) and Free Air CO2 enrichment (FACE), Plant Cell Environ., 20, 1041–1050, 1997.
Norris, I.: Soil moisture and growth of contrasting varieties of Lolium, Dactylis and Festuca species, Grass Forage Sci., 37, 273–283, 1982.
Nosalewicz, A., Siecińska, J., Kondracka, K., and Nosalewicz, M.: The functioning of Festuca arundinacea and Lolium perenne under drought is improved to a different extend by the previous exposure to water deficit, Environ. Exp. Bot., 156, 271–278, 2018.
Østrem, L., Rapacz, M., Jørgensen, M., and Höglind, M.: Effect of developmental stage on carbohydrate accumulation patterns during winter of timothy and perennial ryegrass, Acta Agric. Scand. B-S. P., 61, 153–163, 2011.
Padilla, F., Aarts, B., Roijendijk, Y., de Caluwe, H., Mommer, L., Visser, E., and de Kroon, H.: Root plasticity maintains growth of temperate grassland species under pulsed water supply, Plant Soil, 369, 377–386, 2013.
Persson, T., Höglind, M., Gustavsson, A.-M., Halling, M., Jauhiainen, L., Niemeläinen, O., Thorvaldsson, G., and Virkajärvi, P.: Evaluation of the LINGRA timothy model under Nordic conditions, Field Crop. Res., 161, 87–97, 2014.
Peters, A., Groh, J., Schrader, F., Durner, W., Vereecken, H., and Pütz, T.: Towards an unbiased filter routine to determine precipitation and evapotranspiration from high precision lysimeter measurements, J. Hydrol., 549, 731–740, 2017.
Picon-Cochard, C., Pilon, R., Tarroux, E., Pagès, L., Robertson, J., and Dawson, L.: Effect of species, root branching order and season on the root traits of 13 perennial grass species, Plant Soil, 353, 47–57, 2012.
Postma, J., Kuppe, C., Owen, M., Mellor, N., Griffiths, M., Bennett, M., Lynch, J., and Watt, M.: OPENSIMROOT: widening the scope and application of root architectural models, New Phytol., 215, 1274–1286, 2017.
Pütz, T., Kiese, R., Wollschläger, U., Groh, J., Rupp, H., Zacharias, S., Priesack, E., Gerke, H., Gasche, R., Bens, O., Borg, E., Baessler, C., Kaiser, K., Herbrich, M., Munch, J.-C., Sommer, M., Vogel, H.-J., Vanderborght, J., and Vereecken, H.: TERENO-SOILCan: a lysimeter-network in Germany observing soil processes and plant diversity influenced by climate change, Environ. Earth Sci., 75, 1242, https://doi.org/10.1007/s12665-016-6031-5, 2016.
Raats, P.: Uptake of water from soils by plant roots, Transport Porous Med., 68, 5–28, 2007.
Rahmati, M., Groh, J., Graf, A., Pütz, T., Vanderborght, J., and Vereeecken, H.: On the impact of increasing drought on the relationship between soil water content and evapotranspiration of a grassland, Vadose Zone J., 19, e20029, https://doi.org/10.1002/vzj2.20029, 2020.
Robertson, M., Rebetzke, G., and Norton, R.: Assessing the place and role of crop simulation modelling in Australia, Crop Pasture Sci., 66, 877–893, 2015.
Robinson, D., Hopmans, J., Filipovic, V., van der Ploeg, M., Lebron, I., Jones, S., Reinsch, S., Jarvis, N., and Tuller, M.: Gobal environmental changes impact soil hydraulic functions through biophysical feedbacks, Glob. Change Biol., 25, 1895–1904, 2019.
Ruane, A., Phillips, M., and Rosenzweig, C.: Climate shifts within major agricultural seasons for +1.5 and +2.0 ∘C worlds: HAPPI projections and AgMIP modeling scenarios, Agr. Forest Meteorol., 259, 329–344, 2018.
Sadok, W., Lopez, J., and Smith, K.: Transpiration increases under high-temperature stress: potential mechanisms, trade-offs and prospects for crop resilience in a warming world, Plant Cell Environ., 44, 2102–2116, 2021.
Sándor, R., Barcza, Z., Acutis, M., Doro, L., Hidy, D., Köchy, M., Minet, J., Lellei-Kovács, E., Ma, S., Perego, A., Rolinski, S., Ruget, F., Sanna, M., Seddaiu, G., Wu, L., and Bellocchi, G.: Multi-model simulation of soil temperature, soil water content and biomass in Euro-Mediterranean grasslands: uncertainties and ensemble performance, Eur. J. Agron., 88, 22–40, 2017.
Schapendonk, A., Stol, W., van Kraalingen, D., and Bouman, B.: LINGRA, a sink/source model to simulate grassland productivity in Europe, Eur. J. Agron., 9, 87–100, 1998.
Schenk, H. and Jackson, R.: The global biogeography of roots, Ecol. Monogr., 73, 311–328, 2002.
Schmitt, A., Pausch, J., and Kuzyakov, Y.: Effect of clipping and shading on C allocation and fluxes in soil under ryegrass and alfalfa estimated by 14C labelling, Appl. Soil Ecol., 64, 228–236, 2013.
Schnepf, A., Leitner, D., Landl, M., Lobet, G., Mai, T-H., Morandage, S., Sheng, C., Zorner, M., Vanderborght, J., and Vereecken, H.: CRootBox: a structural-functional modelling framework for root systems, Ann. Bot., 121, 1033–1053, 2018.
Seidel, S., Palosuo, T., Thorburn, P., and Wallach, D.: Towards improved calibration of crop models – where are we now and where should we go?, Eur. J. Agron., 94, 25–35, 2018.
Shuttleworth, W. and Gurney, R.: The theoretical relationship between foliage temperature and canopy resistance in sparse crops, Q. J. Roy. Meteorol. Soc., 116, 497–519, 1990.
Shuttleworth, W. and Wallace, J.: Evaporation from sparse crops – an energy combination approach, Q. J. Roy. Meteor. Soc., 111, 839–855, 1985.
Silvertown, J., Dodd, M., McConway, K., Potts, J., and Crawley, M.: Rainfall, biomass variation, and community composition in the Park Grass experiment, Ecology, 75, 2430–2437, 1994.
Sinclair, T. and Muchow, R.: Radiation use efficiency, Adv. Agron., 65, 215–265, 1999.
Skinner, R. and Comas, L.: Root distribution of temperate forage species subjected to water and nitrogen stress, Crop Sci., 50, 2178–2185, 2010.
Smithwick, E., Lucash, M., McCormack, M., and Sivandran, G.: Improving the representation of roots in terrestrial models, Ecol. Model., 291, 193–204, 2014.
Staniak, M. and Kocoń, A.: Forage grasses under drought stress in conditions of Poland, Acta Physiol. Plant., 37, 116, https://doi.org/10.1007/s11738-015-1864-1, 2015.
Stanimirova, R., Arévalo, P., Kaufmann, R., Maus, V., Lesiv, M., Havlík, P., and Friedl, M.: Sensitivity of global pasturelands to climate variation, Earth's Future, 7, 1353–1366, 2019.
Stöckle, C. and Kemanian, A.: Can crop models identify critical gaps in genetics, environment, and management interactions?, Front. Plant Sci., 11, 737, https://doi.org/10.3389/fpls.2020.00737, 2020.
Sulis, M., Couvreur, V., Keune, J., Cai, G., Trebs, I., Junk, J., Shrestha, P., Simmer, C., Kollet, S., Vereecken, H., and Vanderborght, J.: Incorporating a root water uptake model based on the hydraulic architecture approach in terrestrial systems simulations, Agr. Forest Meteorol., 269–270, 28–45, 2019.
Tardieu, F. and Parent, B.: Predictable “meta-mechanisms” emerge from feedbacks between transpiration and plant growth and cannot be simply deduced from short-term mechanisms, Plant Cell Environ., 40, 846–857, 2017.
Tardieu, F., Draye, X., and Javaux, M.: Root water uptake and ideotypes of the root system: whole-plant controls matter, Vadose Zone J., 16, https://doi.org/10.2136/vzj2017.05.0107, 2017.
Tardieu, F., Simonneau, T., and Muller, B.: The physiological basis of drought tolerance in crop plants: a scenario-dependent probabilistic approach, Annu. Rev. Plant Biol., 69, 733–759, 2018.
Thomas, H.: Accumulation and consumption of solutes in swards of Lolium perenne during drought and after rewatering, New Phytol., 118, 35–48, 1991.
Thomas, H. and James, A.: Partitioning of sugars in Lolium perenne (perennial ryegrass) during drought and on rewatering, New Phytol., 142, 295–305, 1999.
Tubiello, F., Soussana, J., and Howden, S.: Crop and pasture response to climate change, P. Natl. Acad. Sci. USA, 104, 19686–19690, 2007.
van der Krift, T., and Berendse, F.: Root life spans of four grass species from habitats differing in nutrient availability, Funct. Ecol., 16, 198–203, 2002.
van Genuchten, M.: A closed-form equation for predicting the hydraulic conductivity of unsaturated soils, Soil Sci. Soc. Am. J., 44, 892–898, 1980.
Vincent, C., Rowland, D., Schaffer, B., Bassil, E., Racette, K., and Zurweller, B.: Primed acclimation: a physiological process offers a strategy for more resilient and irrigation-efficient crop production, Plant Sci., 295, 110240, https://doi.org/10.1016/j.plantsci.2019.110240, 2020.
Volaire, F., Thomas, H., and Lelievre, F.: Survival and recovery of perennial forage grasses under prolonged Mediterranean drought I. Growth, death, water relations and solute content in herbage and stubble, New Phytol., 140, 439–449, 1998.
Wang, Z. and Huang, B.: Genotypic variation in abscisic acid accumulation, water relations, and gas exchange for Kentucky Bluegrass exposed to drought stress, J. Amer. Soc. Hortic. Sci., 128, 349–355, 2003.
Wang, E. and Smith, C.: Modelling the growth and water uptake function of plant root systems: a review, Aust. J. Agr. Res., 55, 501–523, 2004.
Wedderburn, M., Crush, J., Pengelly, W., and Walcroft, J.: Root growth patterns of perennial ryegrasses under well-watered and drought conditions, New Zealand J. Agr. Res., 53, 377–388, 2010.
Wegehenkel, M., Zhang, Y., Zenker, T., and Diestel, H. The use of lysimeter data for the test of two soil–water balance models: a case study, J. Plant Nutr. Soil Sci., 171, 762–776, 2008.
White, T. and Snow, V.: A modelling analysis to identify plant traits for enhanced water-use efficiency of pasture, Crop and Pasture Science, 63, 63–76, https://doi.org/10.1071/CP11250, 2012.
White, A., Rogers, A., Rees, M., and Osborne, C.: How can we make plants grow faster? A source-sink perspective on growth rate, J. Exp. Bot., 67, 31–45, 2016.
Wingler, A.: Comparison of signaling interactions determining annual and perennial plant growth in response to low temperature, Front. Plant Sci., 5, 794, https://doi.org/10.3389/fpls.2014.00794, 2015.
Wösten J., Lilly, A., Nemes, A., and Le Bas, C.: Development and use of a database of hydraulic properties of European soils, Geoderma, 90, 169–185, 1999.
Wu, A., Song, Y., van Oosterom, E., and Hammer, G.: Connecting biochemical photosynthesis models with crop models to support crop improvement, Front. Plant Sci. 7, 1518, https://doi.org/10.3389/fpls.2016.01518, 2016.
Zacharias, S., Bogena, H., Samaniego, L., Mauder, M., Fuß, R., Pütz, T., Frenzel, M., Schwank, M., Baessler, C., Butterbach-Bahl, K., Bens, O., Borg, E., Brauer, A., Dietrich, P., Hajnsek, I., Helle, G., Kiese, R., Kunstmann, H., Klotz, S., Munch, J-C., Papen H., Priesack, E., Schmid, H-P., Steinbrecher, R., Rosenbaum, U., Teutsch, G., and Vereecken, H.: A network of terrestrial environmental observatories in Germany, Vadose Zone J., 10, 955–973, 2011.
Zhang, L., Hu, Z., Fan, J., Zhou, D., and Tang, F.: A meta-analysis of the canopy light extinction coefficient in terrestrial ecosystems, Front. Earth Sci., 8, 599–609, 2014.
Zhou, M., Ishidaira, H., Hapuarachchi, H., Magome, J., Kiem, A., and Takeuchi, K.: Estimating potential evapotranspiration using Shuttleworth–Wallace model and NOAA-AVHRR NDVI data to feed a distributed hydrological model over the Mekong River basin, J. Hydrol., 327, 151–173, 2006.
Zwicke, M., Picon-Cochard, C., Morvan-Bertrand, A., Prud'homme, M.-P., and Volaire, F.: What functional strategies drive drought survival and recovery of perennial species from upland grassland?, Ann. Bot., 116, 1001–1015, 2015.