the Creative Commons Attribution 4.0 License.
the Creative Commons Attribution 4.0 License.
 | 11 Apr 2022
Assessing hydrological sensitivity of grassland basins in the Canadian Prairies to climate using a basin classification-based virtual modelling approach
Christopher Spence
Zhihua He
Kevin R. Shook
Balew A. Mekonnen
John W. Pomeroy
Colin J. Whitfield
Jared D. Wolfe
Significant challenges from changes in climate and land use face sustainable water use in the Canadian Prairies ecozone. The region has experienced significant warming since the mid-20th century, and continued warming of an additional 2 ∘C by 2050 is expected. This paper aims to enhance understanding of climate controls on Prairie basin hydrology through numerical model experiments. It approaches this by developing a basin-classification-based virtual modelling framework for a portion of the Prairie region and applying the modelling framework to investigate the hydrological sensitivity of one Prairie basin class (High Elevation Grasslands) to changes in climate. High Elevation Grasslands dominate much of central and southern Alberta and parts of south-western Saskatchewan, with outliers in eastern Saskatchewan and western Manitoba. The experiments revealed that High Elevation Grassland snowpacks are highly sensitive to changes in climate but that this varies geographically. Spring maximum snow water equivalent in grasslands decreases 8 % ∘C−1 of warming. Climate scenario simulations indicated that a 2 ∘C increase in temperature requires at least an increase of 20 % in mean annual precipitation for there to be enough additional snowfall to compensate for enhanced melt losses. The sensitivity in runoff is less linear and varies substantially across the study domain: simulations using 6 ∘C of warming, and a 30 % increase in mean annual precipitation yields simulated decreases in annual runoff of 40 % in climates of the western Prairie but 55 % increases in climates of eastern portions. These results can be used to identify those areas of the region that are most sensitive to climate change and highlight focus areas for monitoring and adaptation. The results also demonstrate how a basin classification-based virtual modelling framework can be applied to evaluate regional-scale impacts of climate change with relatively high spatial resolution in a robust, effective and efficient manner.
- Article
(8050 KB) - Full-text XML
- BibTeX
- EndNote


Hydrological models are essential tools to understand hydrological processes and functions at the basin scale and can also be used to diagnose how specific hydrological processes control catchment responses to change (Rasouli et al., 2014). Modelling a specific basin to evaluate processes or to simulate the effects of change entails large computational and labour costs and requires observations of the basin response with sufficient spatial and temporal coverage. Modelling of many individual basins is not efficient when attempting to predict regional responses to changes in climate and/or land use. Basin classification can regionalize hydrological model outputs, based on the assumption that basins can be classified by their characteristics and that basins of the same class respond similarly to changes in climate inputs or their landscapes (e.g. McDonnell and Woods, 2004; Wagener et al., 2007). Parameterizing a model based upon a representative or stylized basin of a given class allows the output to be considered representative of all basins of that class. This assumption facilitates regionalization as it does not necessarily require simulation of the distinctive characteristics of every basin, reducing the cost and time required for large-domain studies. Such a regionalization approach can be used to assess the sensitivity of large diverse areas to stressors, such as land use and climate change.
One such region is the Canadian Prairie ecozone, that portion of the Great Plains of North America that includes southern parts of the provinces of Alberta, Saskatchewan, and Manitoba and Treaties 1, 2, 4, 6 and 7 in western Canada (Spence et al., 2019). This region has a cold sub-humid to semi-arid climate and was covered by grassland and sparse woodlands until colonization of the region promoted conversion of large expanses of natural grassland to cultivated agriculture in the late 19th and early 20th centuries. The region's geomorphology was formed by glacial and post-glacial processes which left numerous internally drained depressions and poorly defined drainage networks. Most of the Canadian Prairies are in the Saskatchewan–Nelson River Basin, but relatively little runoff is provided to the major rivers that traverse the region downstream of their mountain headwaters. Local streams and prairie-derived rivers often have intermittent and highly variable streamflow. These streams are important local sources of freshwater and are often managed to provide farm, agricultural and municipal water supply and support natural lakes and reservoirs (Pomeroy et al., 2005). Because they connect to larger systems only intermittently, a small headwater–basin-scale approach is necessary to generate information about how their behaviour might be impacted by the aforementioned stressors.
Western Canada, including the Canadian Prairies, has been subject to substantial climate warming since the mid 20th century (Johnson et al., 2005; Bush and Lemmen, 2019). Prairie precipitation trends indicate more rain and less snow in the spring and autumn (Shook and Pomeroy, 2012), and runoff generation has been shown to be shifting from snowmelt- to rainfall-driven in eastern Saskatchewan (Dumanski et al., 2015). Recent analysis of hydrometric stations across the region identified sub-regional trends in streamflow associated with drying in the west and south and wetting in the east and north, associated with physical landscape characteristics and climate (Whitfield et al., 2020). However, it is difficult to attribute streamflow response solely to climate change because of impoundment of streams, widespread changes in agricultural practices and wetland drainage since the 1950s (Ehsanzadeh, 2016). Wetland drainage has become widespread in portions of the region (van Meter and Basu, 2015), and the loss of depressional storage capacity associated with drainage enhances streamflow volumes (Tiner, 2003; Wilson et al., 2019) and may alter the frequency, timing, and duration of regional streamflow (Ehsanzadeh et al., 2012; Spence and Mengistu, 2019). Extrapolating intensive studies of wetland drainage impact in individual basins (Wilson et al., 2019) can be challenging, because basin response is a function of wetland distributions that control contributing area dynamics (Stichling and Blackwell, 1957; Shaw et al., 2012; Shook and Pomeroy, 2011; Haque et al., 2017; Spence and Mengistu, 2019). It is uncertain how hydrological fluxes and states in Canadian Prairie basins will respond to continued climate change and wetland drainage. The statistical modelling and small basin modelling studies cited here have provided an excellent foundation, but an improved approach is needed to evaluate how changes in climate and agricultural practices impact hydrological regimes more broadly across the region.
Here, a classification-based virtual modelling framework is proposed as a means to examine hydrological sensitivity to different climate, land use and wetland drainage. In this approach, each basin class is modelled in a virtual manner (Weiler and McDonnell, 2004; Armstrong et al., 2015) as a synthetic or generic basin with characteristics defined by the average or typical condition of all basins from the same class. In this way, the basin characteristics can be manipulated to determine how a typical basin may respond to change. There is evidence that such an approach is viable, as virtual experiments have been used to evaluate hydrological response to different conditions (Di Giammarco et al., 1996; Horn et al., 2005; Dunn et al., 2007; Mallard et al., 2014; Seo and Schmidt, 2013; López-Moreno et al., 2020), identify factors influencing hydrological processes (e.g. Weiler and McDonnell, 2004), and study hydrological controls on water chemistry (Weiler and McDonnell, 2006). This paper aims to demonstrate the utility of a basin classification-based virtual modelling approach for assessing the sensitivity of Canadian Prairie catchments to climate. Two steps were taken to achieve these objectives: (1) development of a robust class-based virtual basin model for a portion of the Canadian Prairie and (2) exploration of virtual basin sensitivity of hydrological response to climate within this portion of the Canadian Prairie. This work provides a foundation to extend the virtual basin modelling approach more broadly across the Canadian Prairie to assess response to climate and land management scenarios.
2.1 Framework of classification-based virtual basin modelling
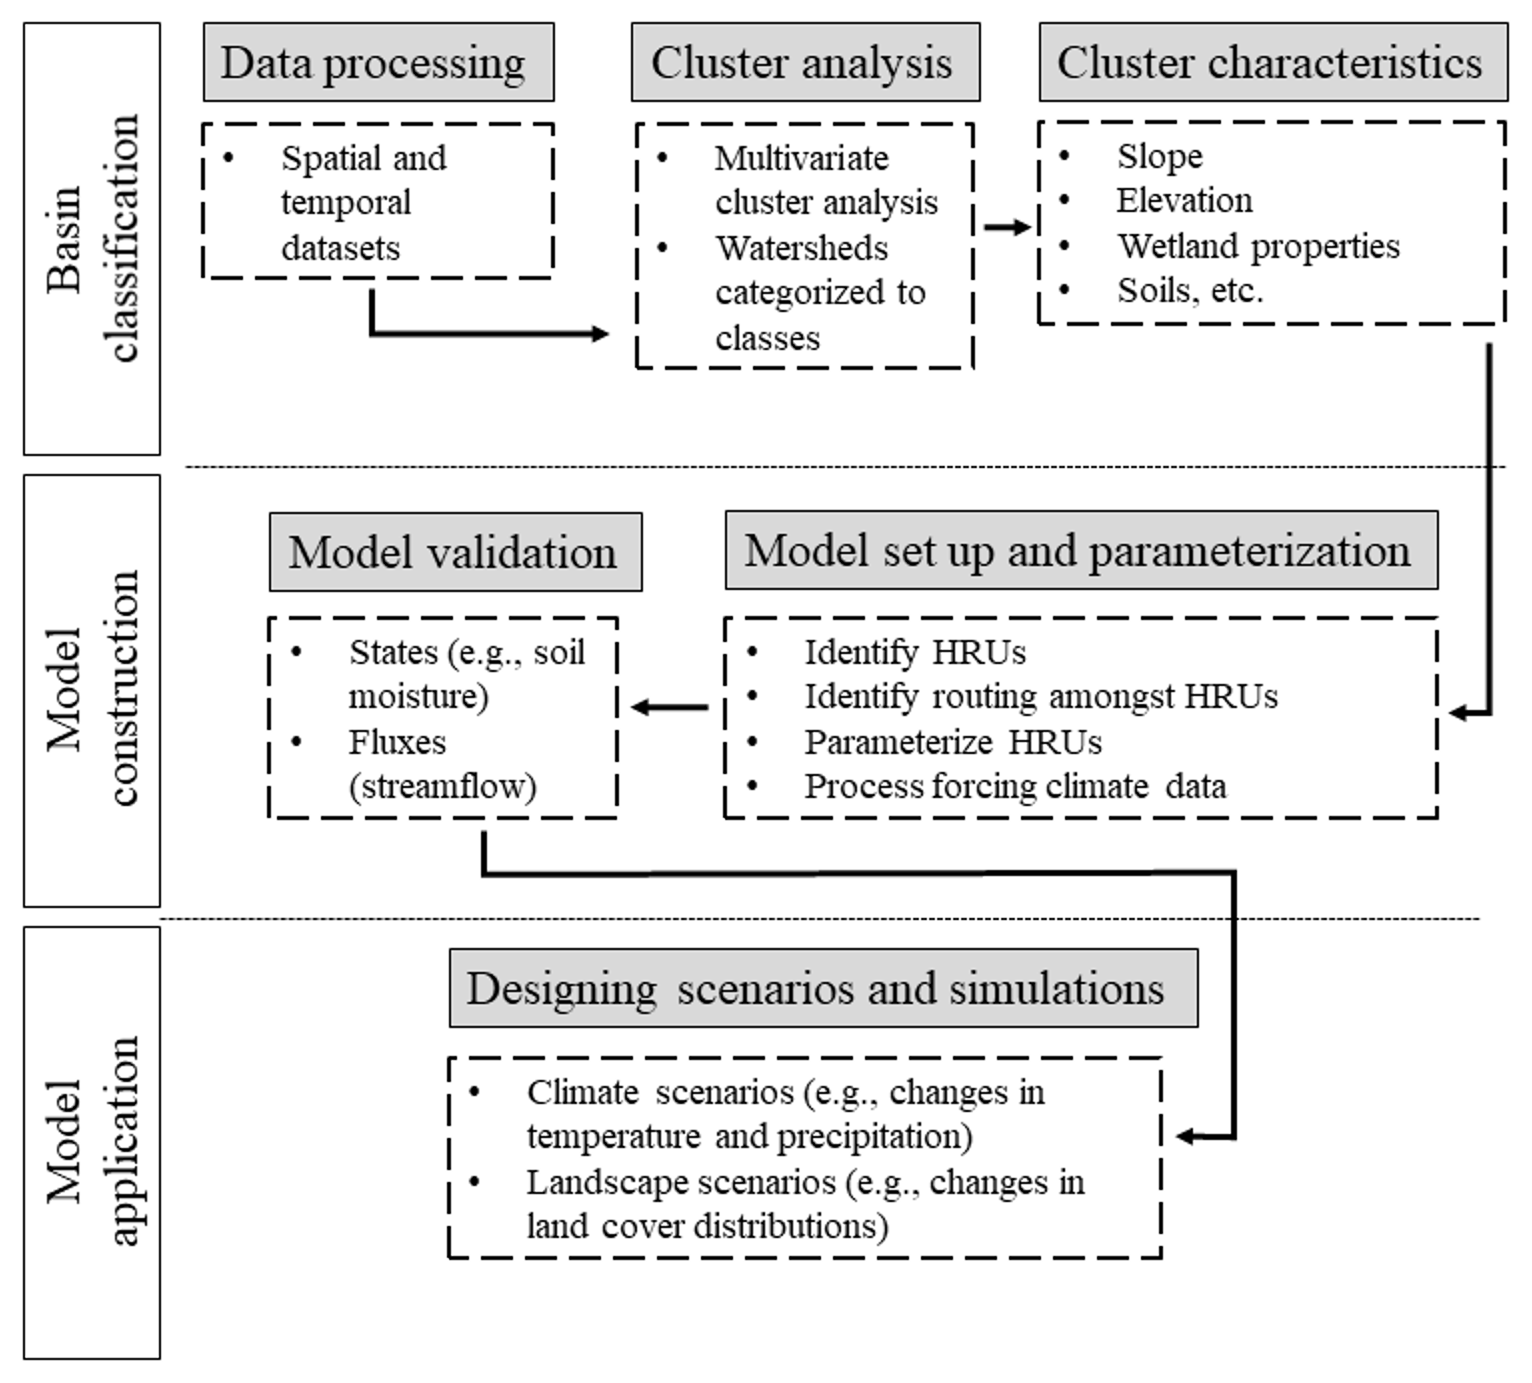
A basin classification-based virtual modelling platform has three main components: (1) a classification analysis to derive virtual basin characteristics, (2) parameterization and evaluation of a hydrological model of the virtual basin and (3) application of the model to evaluate response to multiple scenarios (Fig. 1). This approach was selected because other regionalization approaches had particular disadvantages. For example, the low density of gauged non-regulated streams in the region makes extrapolation of observed streamflow data highly uncertain. An alternative was to use gridded climate and climate scenario data to model numerous individual catchments across the region and then regionalize those results. However, we were unable to find a gridded climate product that performed as well over a multi-decadal period as the climate station data that were ultimately selected.
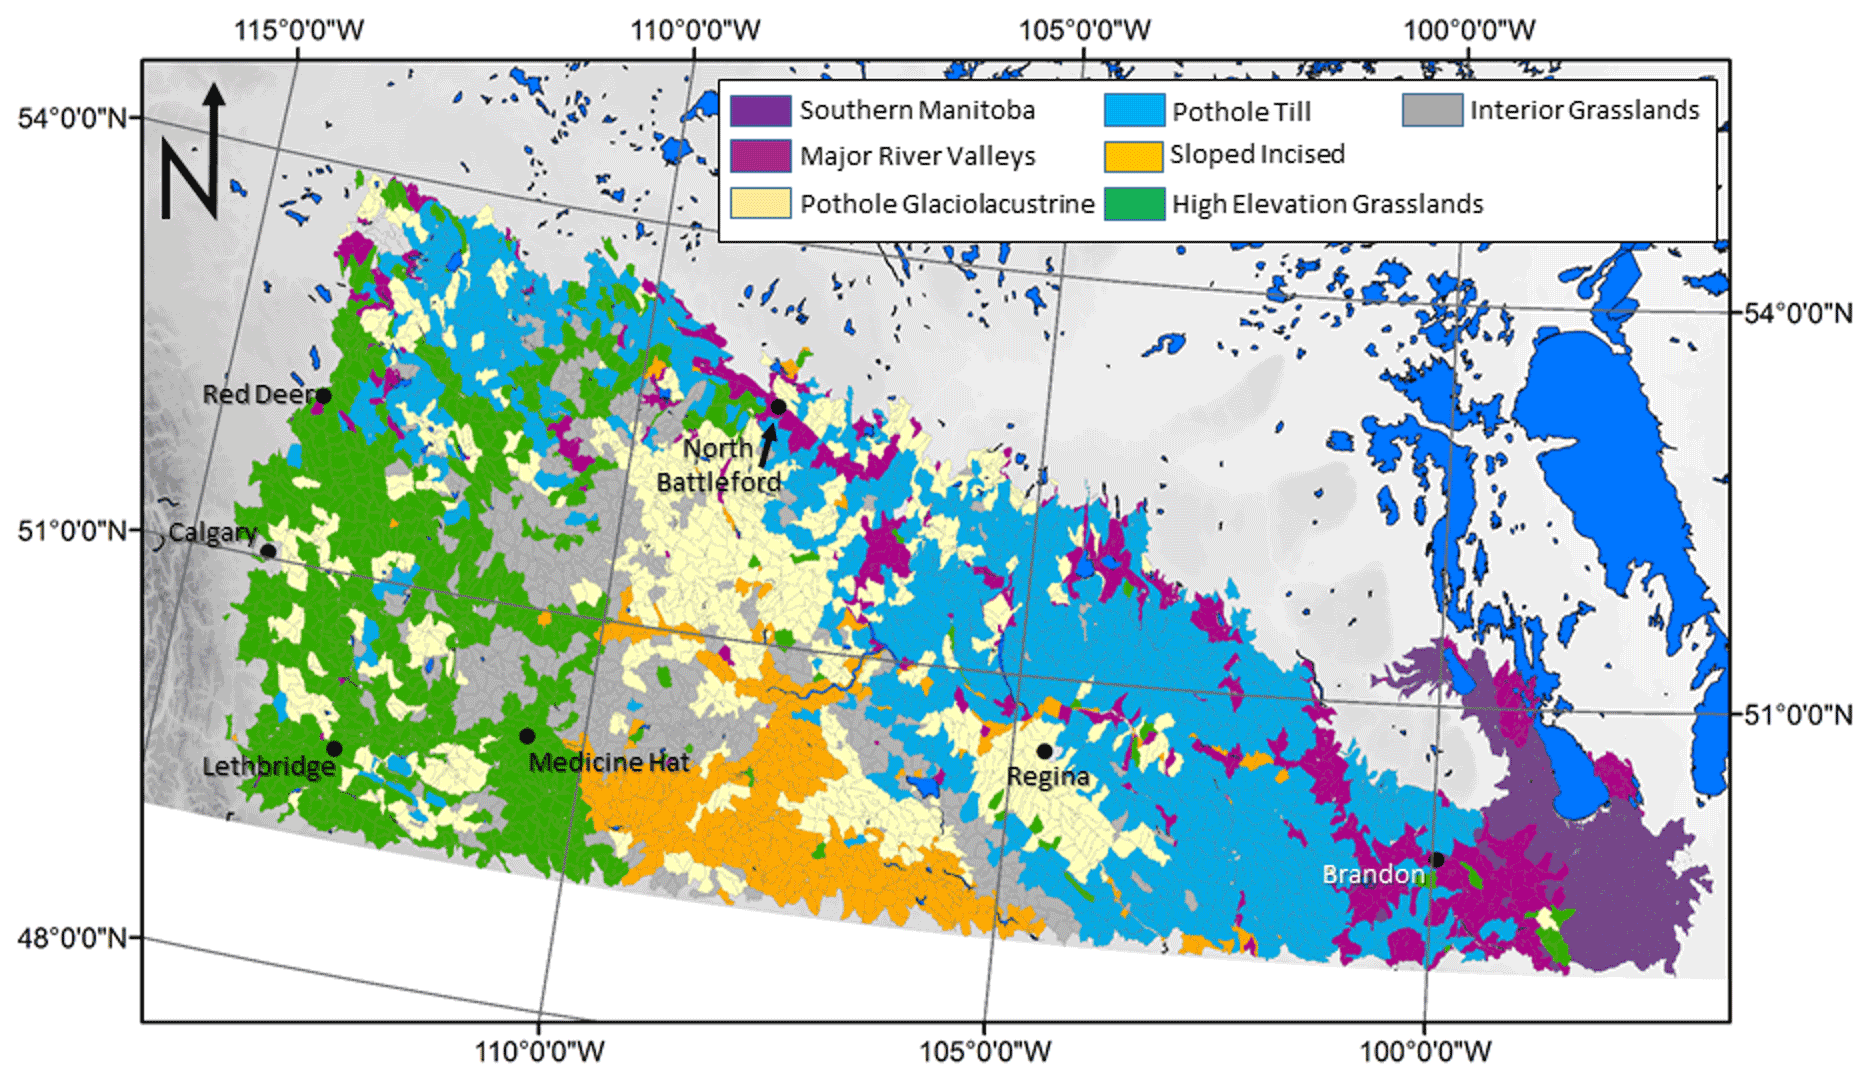
Figure 2Basin classification map for the Prairie ecozone in western Canada. Colours represent the seven basin classes and excluded areas (lakes and urban areas) are shown in white. The focus of this paper is on the High Elevation Grasslands, shown in green. Climate data from the cities noted in this figure were used to drive the virtual model. Boundaries of the basins used in the classification are shown in grey.
2.2 Basin classification
The classification of Canadian Prairie basins was based on the analyses of Wolfe et al. (2019), which identified over 4000 basins, each approximately 100 km2 in area, as being in one of seven broad classes, based on a suite of physio-geographic characteristics (Fig. 2). A more thorough detailed approach is needed within this region because methods such as Knoben et al. (2018) are too coarse to differentiate functional differences over this region. This classification was intended to elucidate and define these differences for the purpose of hydrological model design and parameterization. The basin delineations used in the study were taken from the HydroSHEDs dataset (Lehner and Grill, 2013), which provides geographically contiguous delineations of basins for the world, including the Prairie ecozone. Physio-geographic characteristics, including climate, streamflow, geology, topography, wetland distribution, and land cover, among others, were compiled and used to classify basins that would be expected to respond in a hydrologically coherent manner (Wolfe et al., 2019). Urban areas and large lakes were excluded from the analysis. A revised classification that excluded climate parameters but that retained the streamflow regime parameters was conducted and is used herein, following the same hierarchical classification of principal components (HCPC) approach. This was done because including climate could bias the results of the climate scenarios by “hard-wiring” some functionality into the model parameters. The influence of recent climate, historical climate change and how this interacts with Prairie biogeophysical features and wetland drainage to influence basin hydrology behaviour was recently explored by Whitfield et al. (2021). They showed the coherence between climate effects and biogeophysical and drainage effects on basin classification. Therefore, bias could be introduced from a classification that includes climate when applying future climates to force the virtual basin model. For example, a current climate classification might create a virtual basin class that precluded semi-arid basins: this would become non-functional with projected increases in precipitation and temperature for the region which could change to be semi-arid. By excluding the direct impact of climate in the classification and restricting it to topography, biogeophysical features and drainage systems, the new climates of Prairie basins can be more fully explored.
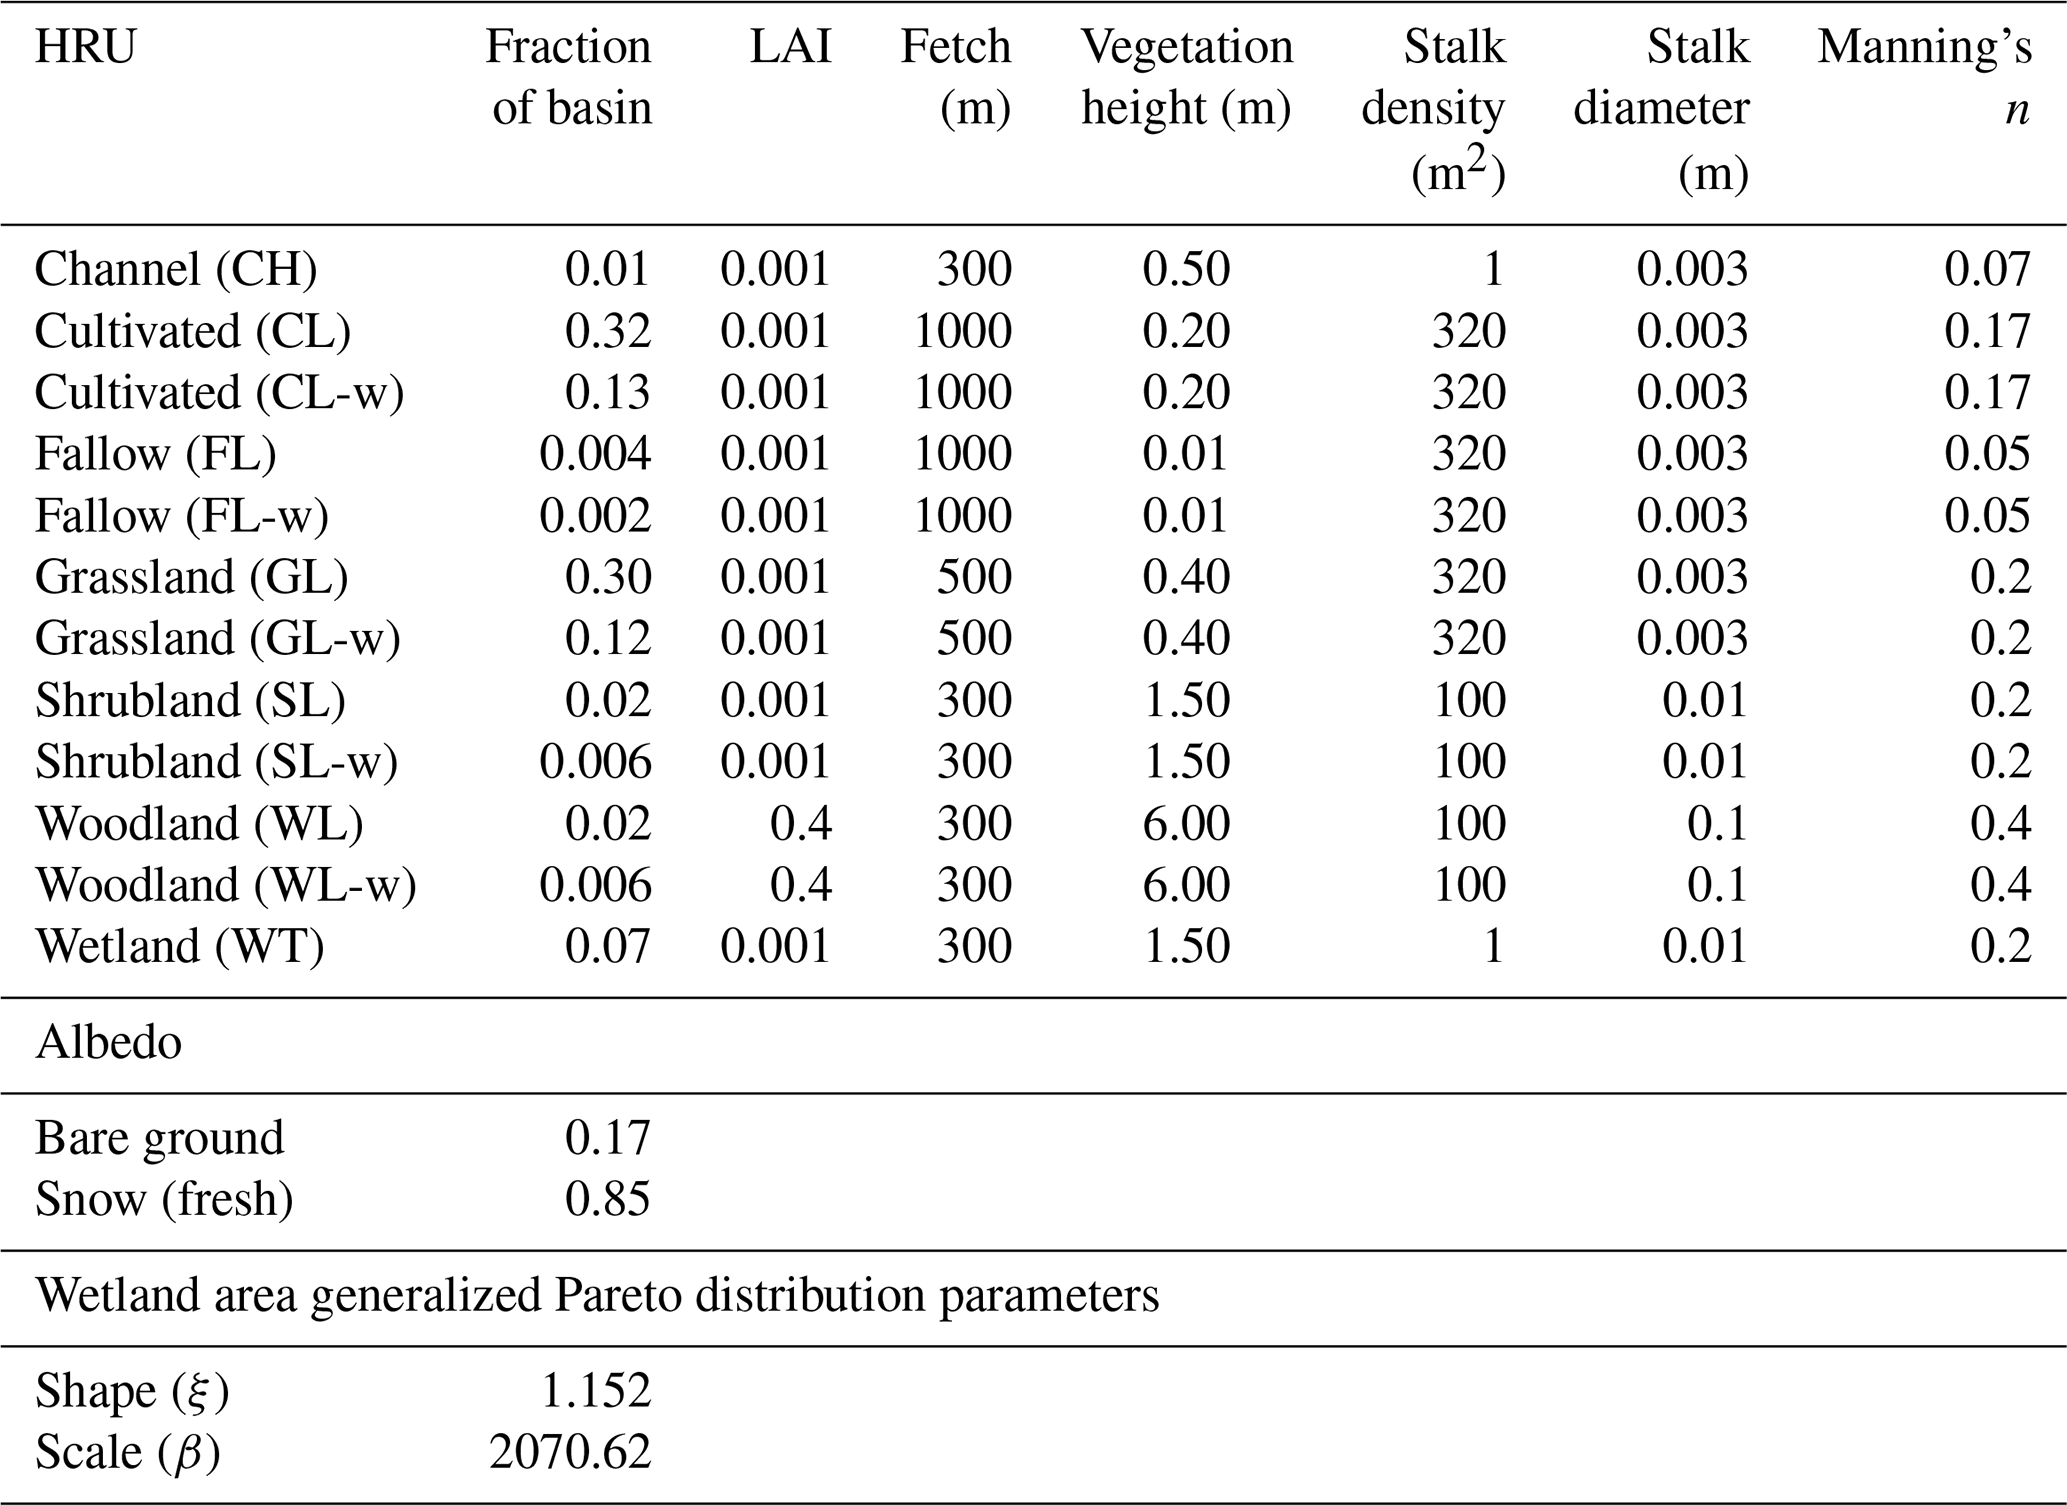
The High Elevation Grasslands (HEG) class (Fig. 2) was selected for the development of the virtual basin model. This class featured 751 basins with an average size of ∼100 km2. Median basin characteristics, including land cover fractions, basin slope and elevation, and soil type, were determined and used for virtual basin model parameterization. Wetland areas derived from the Global Surface Water maximum water extent dataset (https://global-surface-water.appspot.com/download, last access: 31 March 2022) were used to determine the shape and scale parameters of a generalized Pareto distribution (Shook et al., 2013, Table 1). These parameters were used to characterize the wetland complex within the virtual model, where the wetland complex is represented by multiple individual wetlands of different sizes.
Table 1Cold Regions Hydrological Model parameters for the High Elevation Grassland virtual basin model. The suffix “-w” in the hydrologic response unit (HRU) name indicates HRUs in the wetland catena. LAI denotes leaf area index.
2.3 Model set-up and parameterization
The Cold Regions Hydrological Modelling platform (CRHM) was selected to develop the virtual basin model, as CRHM is particularly suited for simulating the hydrology of the Canadian Prairies. CRHM is a modular, process-based, spatially semi-distributed hydrological model, which includes the key cold regions and warm season hydrological processes that operate in western Canada and elsewhere (Pomeroy et al., 2007). With the correct suite of modules, each representing a key hydrological process, CRHM has proven very capable of representing prairie hydrological processes and accurately emulating water fluxes in this landscape (Fang and Pomeroy, 2009; Fang et al., 2010). Most of the process modules in CRHM, particularly the surface processes, are strongly physically based, and hence CRHM does not require model calibration, making it suitable for simulations under non-stationary conditions. As a virtual basin has no specific location, it cannot be calibrated to field observations from a particular basin, so setting parameters based on regional hydrological studies rather than calibration is advantageous.
The virtual basin area was set to 100 km2, which aligns with the average basin size used in the classification. The virtual basin was divided into hydrological response units (HRUs), each of which has a single set of parameter values and for which water budgets are calculated. The HRU sequence by which runoff is routed follows a catena of land cover from cultivated fields at the highest elevation, followed by grasslands, shrublands, woodlands, and wetlands at successively lower elevations. Areas were set according to the median for that land cover observed across all HEG basins. Summer-fallow fields, whilst also included, cover a very small area (<1 %; Table 1).
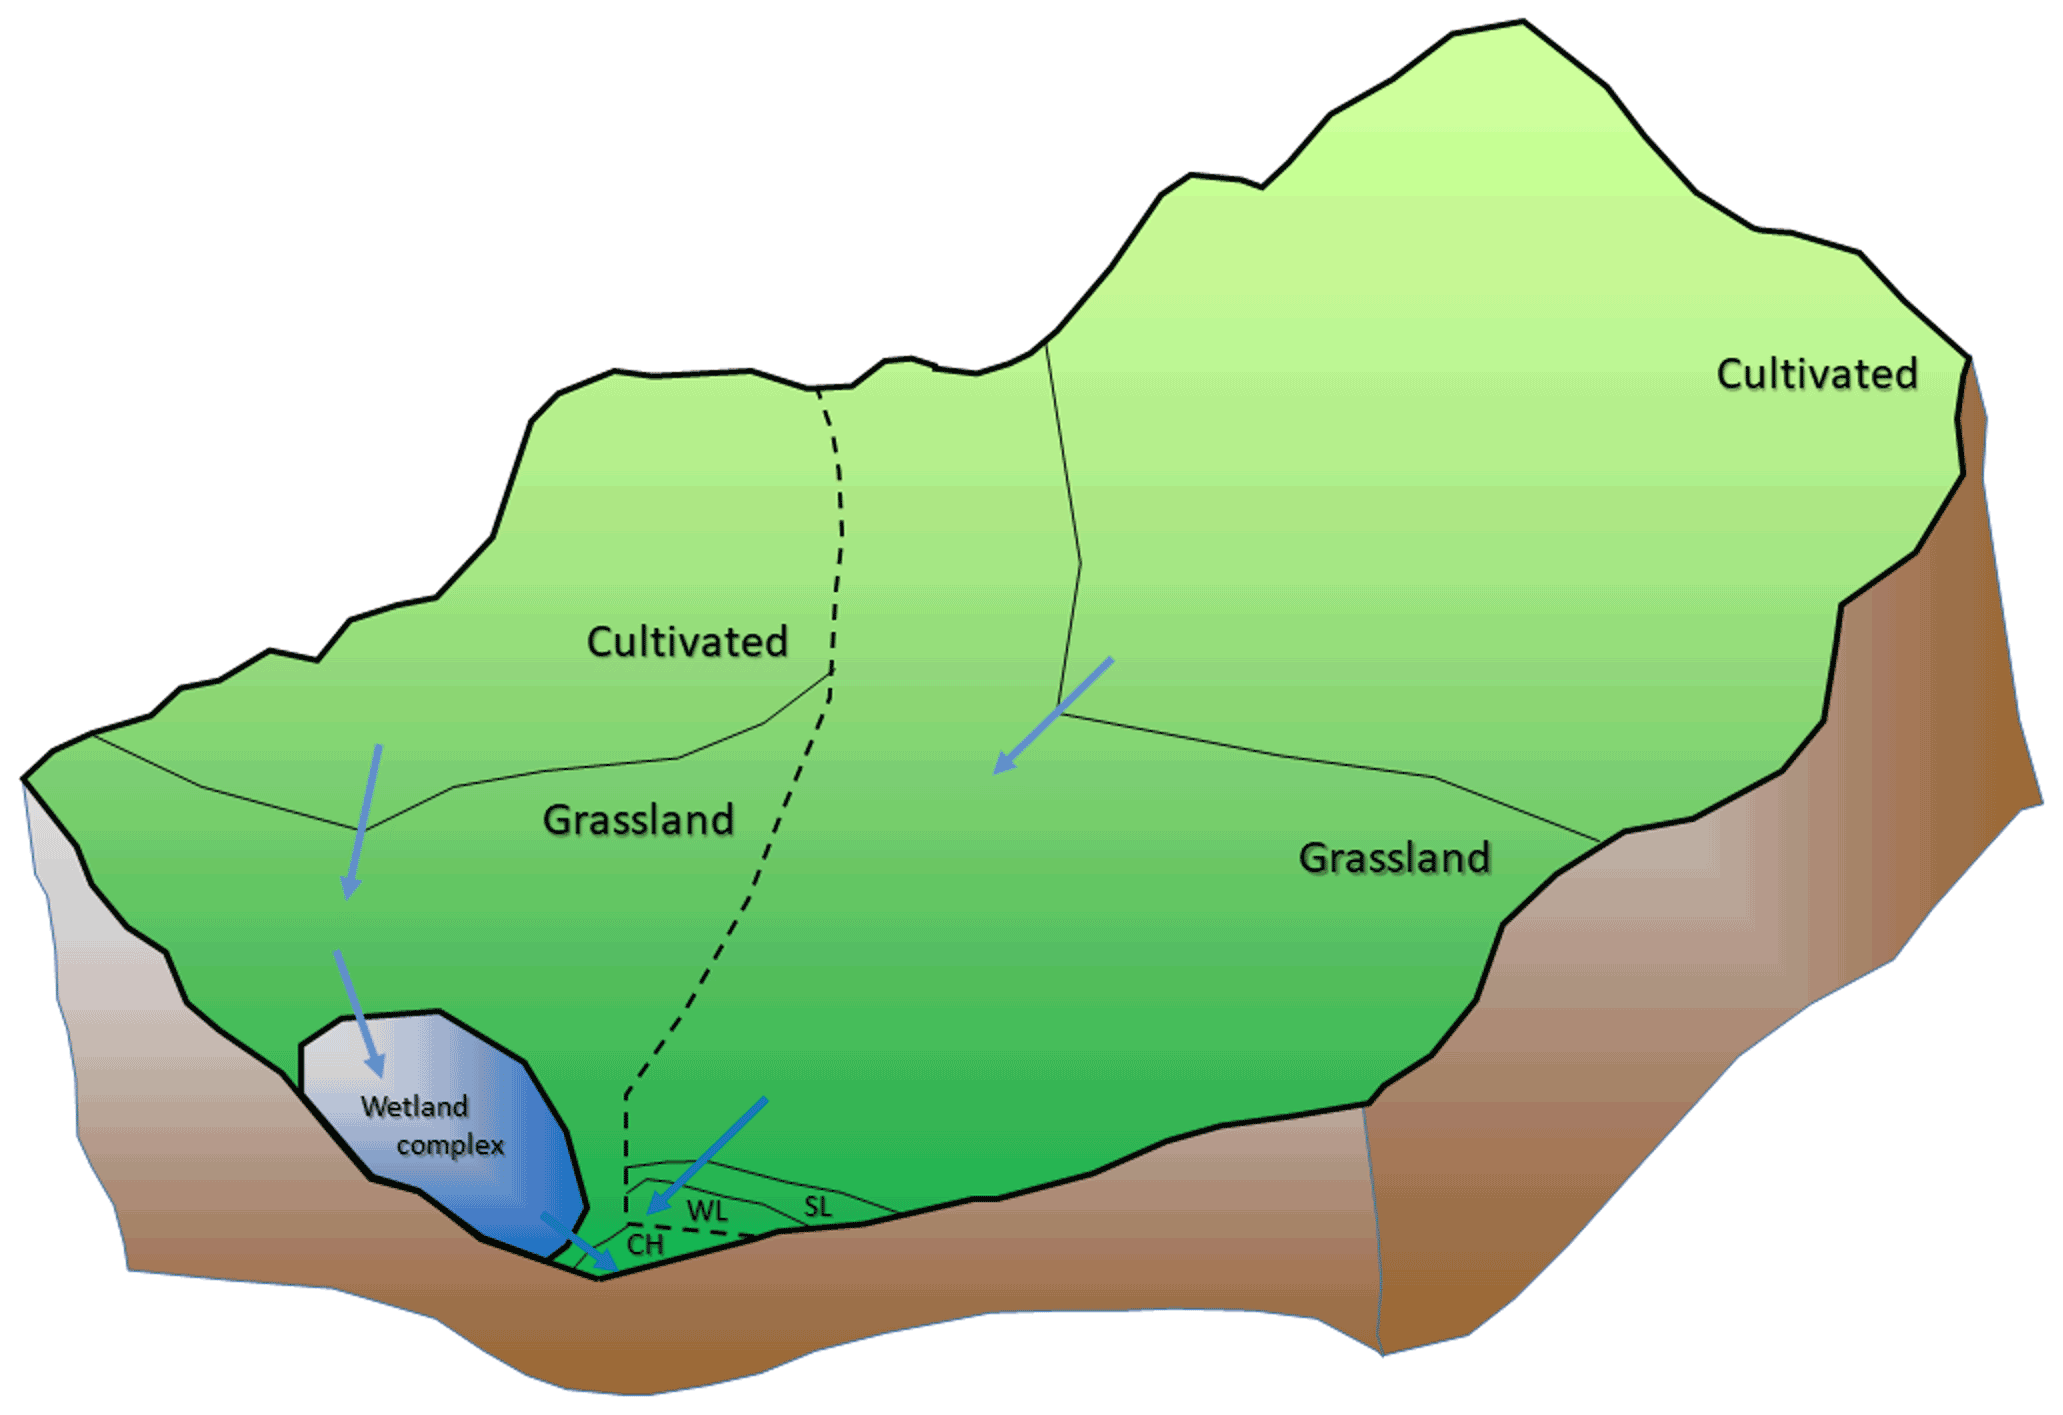
Figure 3Illustration of HRU distribution in the virtual model of a typical High Elevation Grasslands basin. The illustration depicts two catenas, one with a wetland complex and one without, separated by the dashed line. Relative areas are meant to approximate those listed in Table 1. SL denotes shrublands, WL woodlands, and CH a channel HRU (see Table 1). The fallow and shrubland and woodland HRUs directed through the wetland complex are too small to be shown at this scale.
The virtual basin was separated into non-wetland and wetland catenas (Fig. 3) according to effective and non-effective fractions of HEG basins, respectively. The first, “non-wetland” catena portion (i.e. cultivated, grassland, shrubland, woodland HRUs) of the basin (∼67 % of area) is considered to contribute flows directly to the HRU outlet (stream channel). Runoff from the “wetland” catena portion of the virtual basin (∼33 % of area) features a wetland complex HRU within a landscape catena following a sequence from cultivated to grassland, shrubland, and woodland HRUs (Fig. 3). Runoff is routed through a wetland complex comprised of 46 individual wetlands; their areas follow a selection of 46 wetlands that was based on the work of Shook and Pomeroy (2011) and Shook et al. (2013), who found that this was the minimum number of wetlands to represent crucial hydrological behaviour (e.g. hysteresis) that controls the dynamic area contributing flow downstream for a Prairie basin of similar size. The total wetland area was based on the fractional area from basin classification. The distribution of this area among the 46 wetlands followed a generalized Pareto distribution, as it has been used successfully to characterize the distribution of open-water areas in similar landscapes in North Dakota and central Saskatchewan (Zhang et al., 2009; Shook et al., 2013).
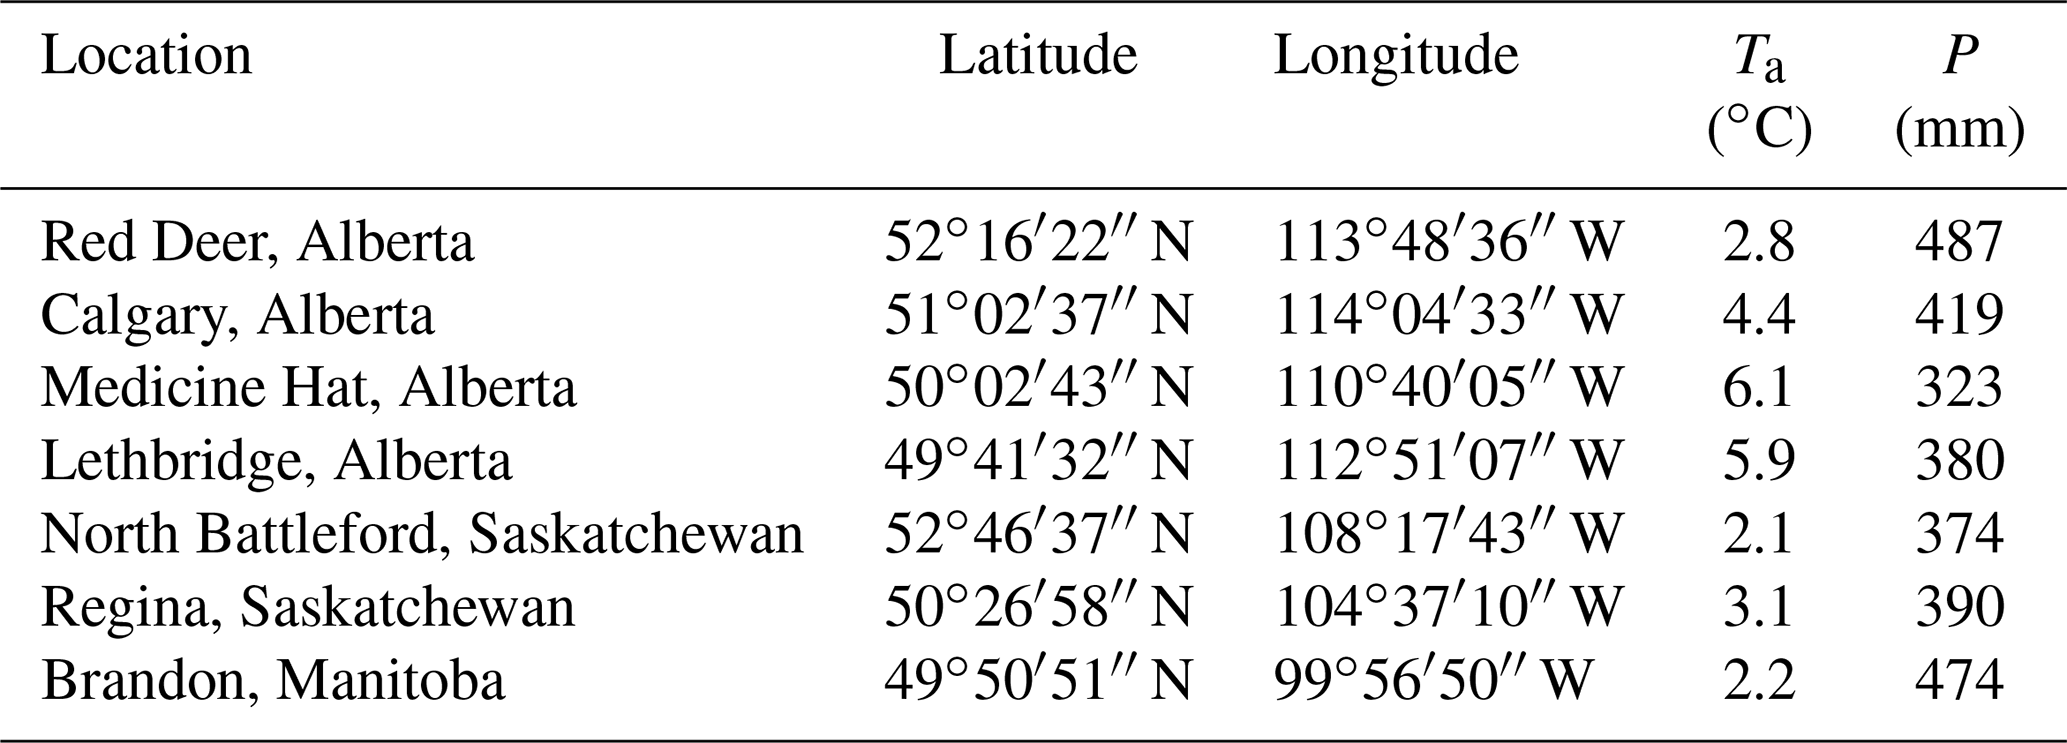
Table 2Climate characteristics (1981–2010 climate normal) of the seven selected locations located in and near the High Elevation Grassland class. Ta is mean annual temperature, and P denotes mean annual precipitation.
The Prairie Hydrological Model (PHM), created using CRHM (Pomeroy et al., 2010, 2012), was used to simulate virtual basin hydrological response. The PHM includes a specific set of physically based modules linked sequentially to represent the dominant hydrological processes for the virtual basin. The Observation module reads in meteorological data and calculates the precipitation phase using a maximum temperature threshold of 0 ∘C for 100 % snow and a minimum temperature threshold of +2 ∘C for 100 % rainfall and distributes these to each HRU along with lapse rates for temperature and precipitation and temporal interpolation to adjust observation time steps to hourly data. The Radiation module outputs incoming shortwave radiation to slopes, longwave radiation, and net radiation. The Canopy module (Sicart et al., 2004; Ellis et al., 2010) was used to adjust the effects of vegetation canopies on sub-canopy net radiation reaching underlying snow. The leaf area index was assigned a value of 0.4 for woodland HRUs, which is a typical value for aspen trees during winter (Pomeroy et al., 1999). For other HRUs, a minimum value of 0.001 was set to simulate the canopy effects of Prairie vegetation (crop residue, grass) on radiation for snowmelt. The values of the initial albedos for bare ground and fresh snow were set to 0.17 and 0.85, respectively (Table 1), based on suggested values by Armstrong et al. (2008) for summer conditions and Male and Gray (1981) for snow.
To simulate snow redistribution processes, the Prairie Blowing Snow Model (PBSM) (Pomeroy and Li, 2000) and Walmsley's windflow model (Walmsley et al., 1989) modules were used. Fetch distances were set using values recommended in Pomeroy et al. (2007). Fetch distance was set to 1000 m for exposed sites such as cultivated and fallow HRUs. A 500 m fetch was assigned for grassland HRUs. For other HRUs, a 300 m fetch was selected. The distribution factor parameterizes the allocation of blowing snow transport from a aerodynamically smoother (or windier) HRU to aerodynamically rougher (or calmer) ones and was selected according to the prairie landscape aerodynamic sequencing of Fang and Pomeroy (2009). Vegetation height, stalk density, and stalk diameter were set to represent the values for the prairie environment during autumn and winter (Table 1) (Pomeroy and Li, 2000).
The Energy-Budget Snowmelt Model (EBSM) (Gray and Landine, 1988) module includes algorithms applicable to the Canadian Prairies and was used to simulate snowmelt by calculating the balance of radiation, sensible heat, latent heat, ground heat, advection from rainfall, and change in internal energy. Infiltration to unfrozen and frozen soils was calculated by the Prairie Infiltration module with algorithms based on Ayers (1959) and Gray et al. (1985), respectively. Actual evapotranspiration was simulated using the Penman–Monteith equation (Monteith, 1965), and evaporation from typically saturated surfaces subject to advection, such as wetlands and stream channels, was calculated using the Priestley and Taylor equation (Priestley and Taylor, 1972).
The Soil module calculates the water balance for the soil column, which is divided into two layers: the top layer (called the recharge zone) and the lower layer. The depth of the recharge layer was set at 1.4 m as this is typically a zone of higher hydraulic conductivity in the glacial till-derived soils of the region (Brannen et al., 2015). Wolfe et al. (2019) identified the predominant HEG soil texture as loam, which was then assigned as the soil type for all HRUs. The Muskingum routing method was used for the routing amongst HRUs. The routing length for each HRU was calculated using the modified Hack's law length–area relationship, which was derived from a previous CRHM-PHM modelling study of Smith Creek in Saskatchewan (Fang et al., 2010; Pomeroy et al., 2010).
2.4 Model application
To ensure that the role of climate variability across HEG was captured in streamflow simulations, the model was run over a 46-year baseline period (1960–2006) driven using data from seven locations. The locations were within and nearby the geographical extent of the HEG classification and represented the variation in climate across the region (Fig. 2; Table 2). The mean annual average temperature at these seven sites ranged from +2.1 to +6.1 ∘C and mean annual precipitation ranged from 323 to 487 mm (Table 2). The virtual basin model of HEG catchments was run using daily precipitation data from the Adjusted and Homogenized Canadian Climate Data (AHCCD) (Mekis and Vincent, 2011; Vincent et al., 2012) collected at these seven locations. This dataset corrects shifts identified due to station relocation and changes in observing practices and automation. Other discontinuities are adjusted with multiple linear regression using a penalized maximal t-test and a quantile-matching algorithm. For precipitation, corrections are applied to account for wind undercatch, evaporation, and gauge-specific wetting losses. Snowfall density corrections are derived based on coincident ruler and Nipher measurements. Trace precipitation is added. The daily precipitation data were converted to hourly data required by CRHM using linear interpolation using the Observation module. The other hourly forcing variables (temperature, relative humidity and wind speed) were taken from Environment and Climate Change Canada observations for stations for the same seven locations. The data were quality controlled and infilled using nearby station data.
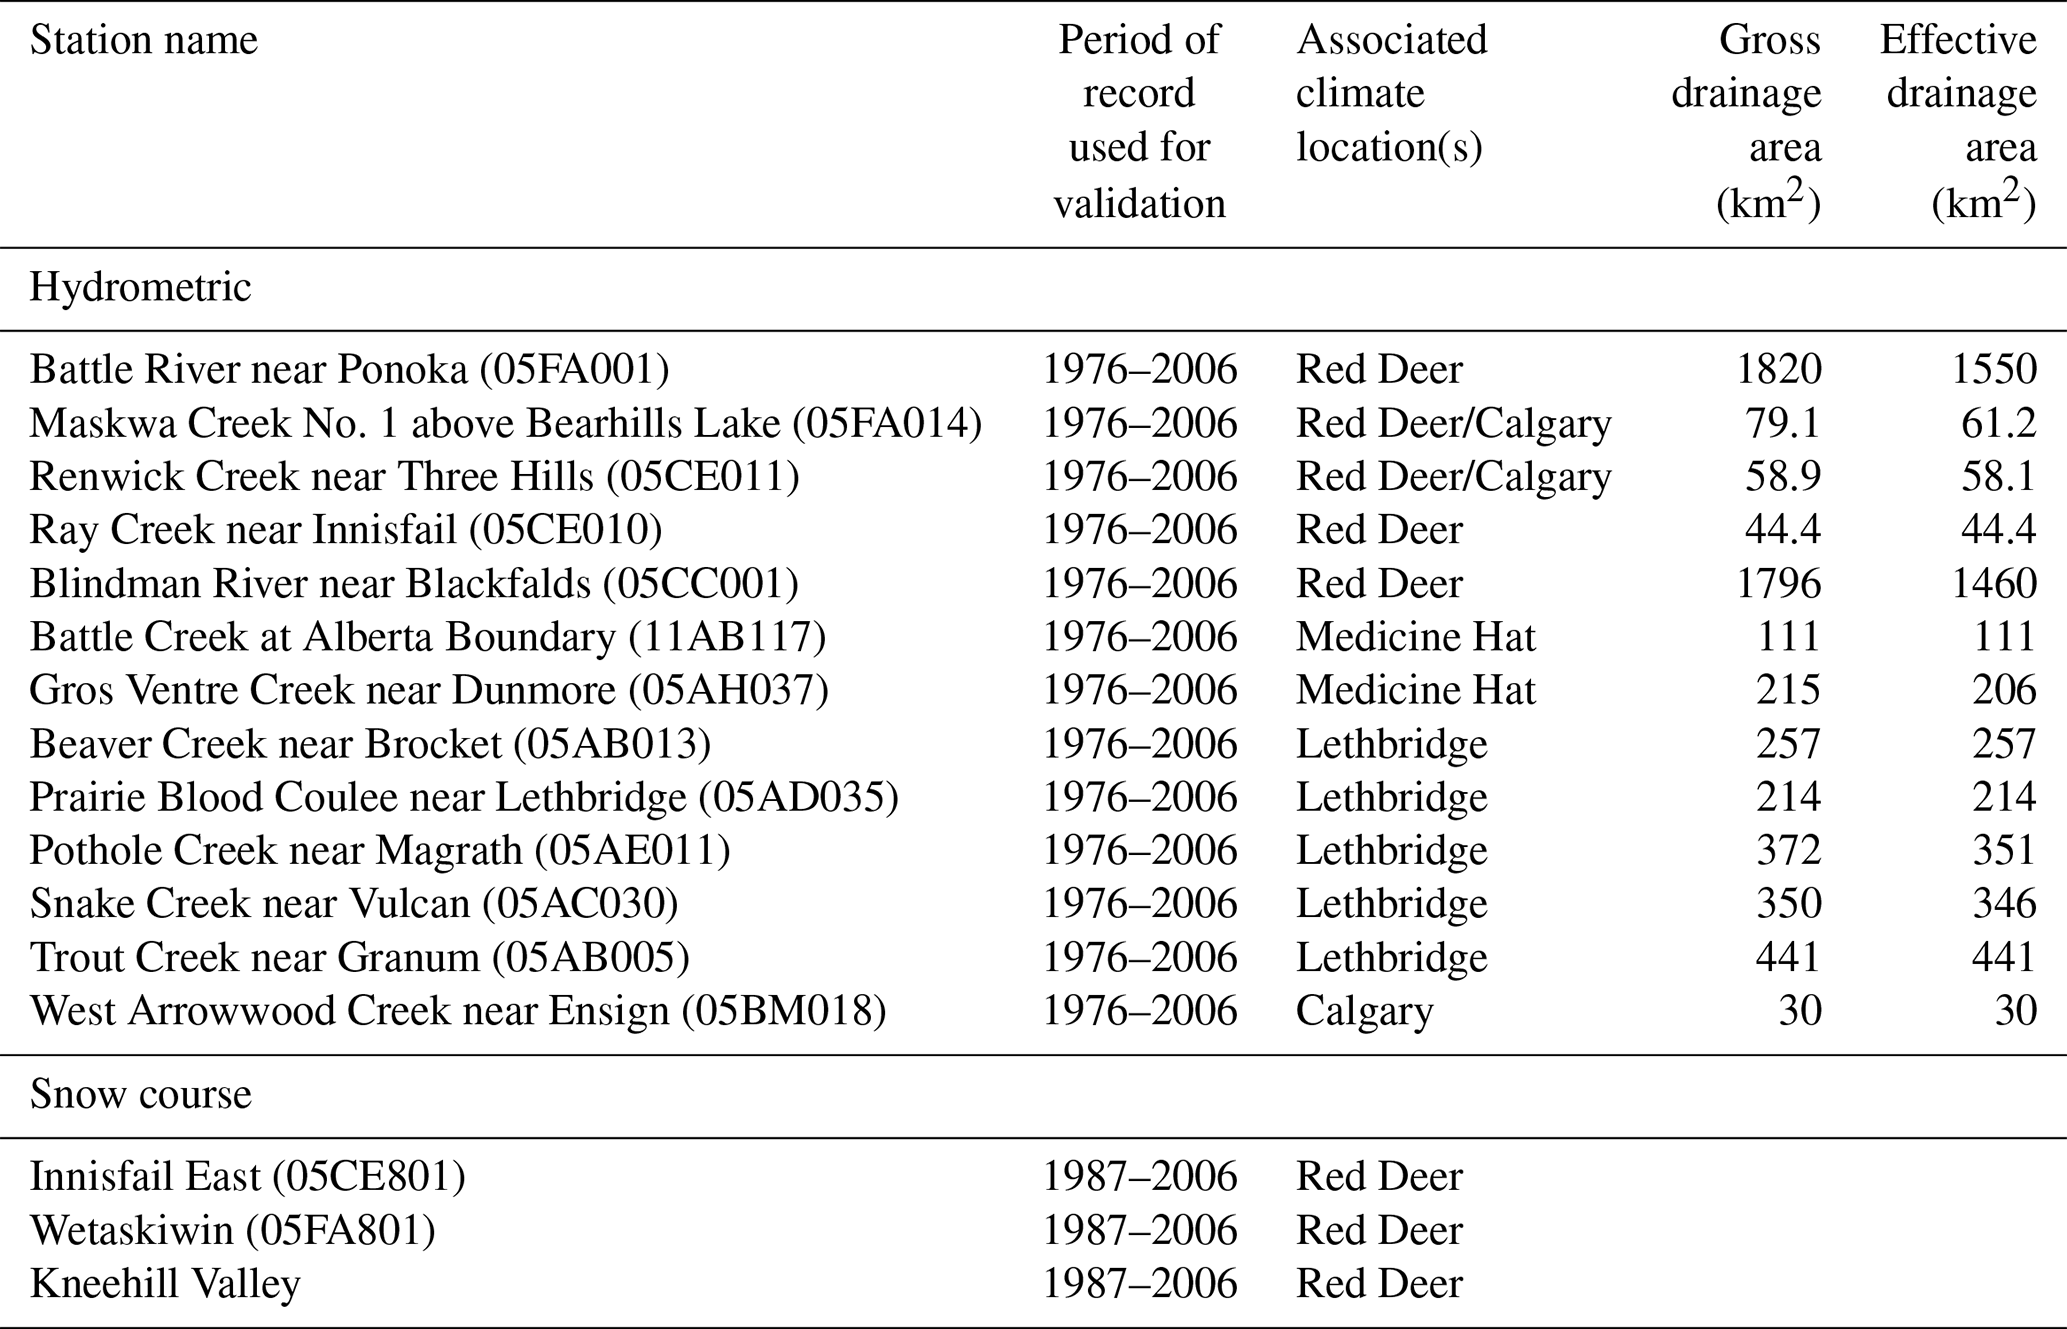
Table 3Sources of observed data for model evaluation. Water Survey of Canada (WSC) hydrometric data were obtained from the HYDAT database, available at https://collaboration.cmc.ec.gc.ca/cmc/hydrometrics/www/ (last access: 31 March 2022). Effective drainage area is defined by Godwin and Martin (1975) as the drainage area that contributes streamflow to the gauged location during the median annual flood and that was also obtained from HYDAT. The snow water equivalent data were obtained from Alberta Environment and Parks snow courses.
Outputs from the baseline simulations (1965–2006) were used to assess whether the virtual HEG basin model captured typical behaviour of real-world HEG basins. The first 5 years of simulations were excluded from the analysis to avoid the potential of misrepresenting initial conditions due to lag effects associated with antecedent conditions. Because the virtual basin is designed to represent typical behaviour of a basin class, it does not reproduce the hydrology of any specific basin, and there is no direct physical analogue for which observations can be used to completely assess performance. Previous studies have described the application of CRHM to Canadian Prairie basins, and its ability to represent the region's predominant hydrological processes is well established (Fang et al., 2010). These findings lend confidence that the virtual basin model, informed by these other CRHM applications, can be applied for the diagnostic purposes of this study. Furthermore, the aim of the simulations was not to simulate specific basins in the region but to assess the sensitivity of the hydrological regime to changes in climate forcings. For this reason, spring snow water equivalent (SWE) values from snow courses and mean annual hydrographs from hydrometric gauges at multiple sites within the HEG class were compared to virtual basin model outputs to establish that the virtual basin model was capturing the correct timing and magnitudes of important states and fluxes. The cluster median was not used for comparison, as the range better demonstrates that model simulations are within the envelope of plausible hydrological functioning as represented by snow on the ground and streamflow, rather than being comparable to an individual basin within the class. Runoff ratios were also compared to establish whether the virtual model was dividing the water budget in a reasonable manner.
To evaluate spring snow accumulation, measured SWE at the Alberta Environment and Parks Wetaskiwin, Kneehill Valley and Innisfail East snow courses (Table 3) was compared against modelled SWE values for the cultivated HRU on the same day measurements were taken, using climate data from the nearest station (Red Deer) (Table 2), for the period during which there was data overlap (1987–2006). It is recognized that snow accumulation in this region is not continuous throughout the winter as there can be significant ablation events; however, measurements are not taken earlier than late February. Mean monthly discharge depths from basins 100 % within the HEG class were generated using climate data from four nearby meteorological stations (Table 2) and were plotted and visually compared to the 14 Water Survey of Canada hydrometric stations gauging a stream within 100 km of 1 of the meteorological stations (Table 3). The selected basins and meteorological stations used for these evaluations were all in Alberta as this was where the class was most common and contiguous. These tests were to discern whether the virtual basin model was capturing streamflow seasonality, variability and annual runoff ratios.
After evaluation, the virtual basin model was used to explore (1) the role of climate variability within the HEG class and (2) how hydrological patterns in the HEG class may change in response to potential future shifts in climate. Future climate scenarios were investigated using the delta method, which applies uniform changes to historic daily air temperature and total precipitation records (López-Moreno et al., 2012; Rasouli et al., 2014). This method has the advantages of being computationally inexpensive, while avoiding bias and preserving the covariances among variables, which are important in modelling cold-region processes (Shook and Pomeroy, 2010). It has the disadvantage of not assessing sensitivity to changing extreme events and does not account for seasonal differences associated with climate change. Temperature increases of up to +6 ∘C and precipitation decreases of 20 % and increases of up to 30 %, based on model projections for southern Alberta by 2050 (Zhang et al., 2019) were investigated. Within these ranges, multiple scenarios were run using increments of 1 ∘C (temperature) and 10 % (precipitation), totalling 35 scenarios for each of the seven climate locations. For each 46-year run (1960 to 2006), the model takes around 7 min on a PC with an Intel Core i7-8650U CPU. The model could not be run for each of the 796 catchments in the HEG class as no adequate (i.e. low-uncertainty, long-period of record) gridded climate dataset was found. This limited the approach to running the model with the observations from seven stations. The 35 climate scenarios run for each of seven stations took approximately 7 h to complete, running four simulations at a time on separate threads. These scenarios were used with the baseline runs to quantify sensitivity of snow accumulation and annual runoff to climate change. The spatial distributions of the sensitivities were mapped by extrapolating the values for these seven model locations (Table 2, Fig. 2) in ArcGIS using ordinary kriging, assuming a spherical semivariogram and a lag value of 0.01964.
The basin classification aligns well with previous and more recent classifications of Canadian Prairie basins based solely on streamflow regime (Ellis and Gray, 1966; Whitfield et al., 2021). The HEG class occupies much of the western portion of the Canadian Prairies and includes the majority of southern Alberta and several isolated patches in both Saskatchewan and Manitoba (Fig. 2). Basins in this class tend to have a high fraction of native grasslands (40 % of the basin area). The elevations of these basins are amongst the highest in the Canadian Prairies. The mean wetland density of 0.8 km−2 is amongst the smallest of the virtual basin classes (Wolfe et al., 2019). Relatively dense drainage networks, coupled with the low wetland densities, result in 67 % of the gross drainage area of a typical HEG basin contributing to runoff to the outlet in a median flow year. This is a relatively high percentage for a Canadian Prairie basin.
3.1 Virtual basin model performance
3.1.1 Spring snow water equivalent
The virtual model captured the intra- and inter-annual variability in snow water equivalent (SWE) quite well, as indicated by comparison of CRHM HEG model-simulated SWE (Red Deer forcing data) and snow survey course data (Fig. 4). The simulated values were calculated on the same days as the snow surveys, with dates varying between February and April. The agreement is quite good considering that (a) the forcing meteorological data were collected up to 60 km from the snow survey site and (b) that a virtual model, not tuned to the specific traits of the snow survey location (e.g. vegetation height), was used. Simulated and observed means and standard deviations were similar, but in two instances the model-simulated SWE values were notably larger than those observed during the comparison period (Fig. 4). A best-fit line with a slope of 1.1 and r2 of 0.53 can be drawn among the simulated and observed data.
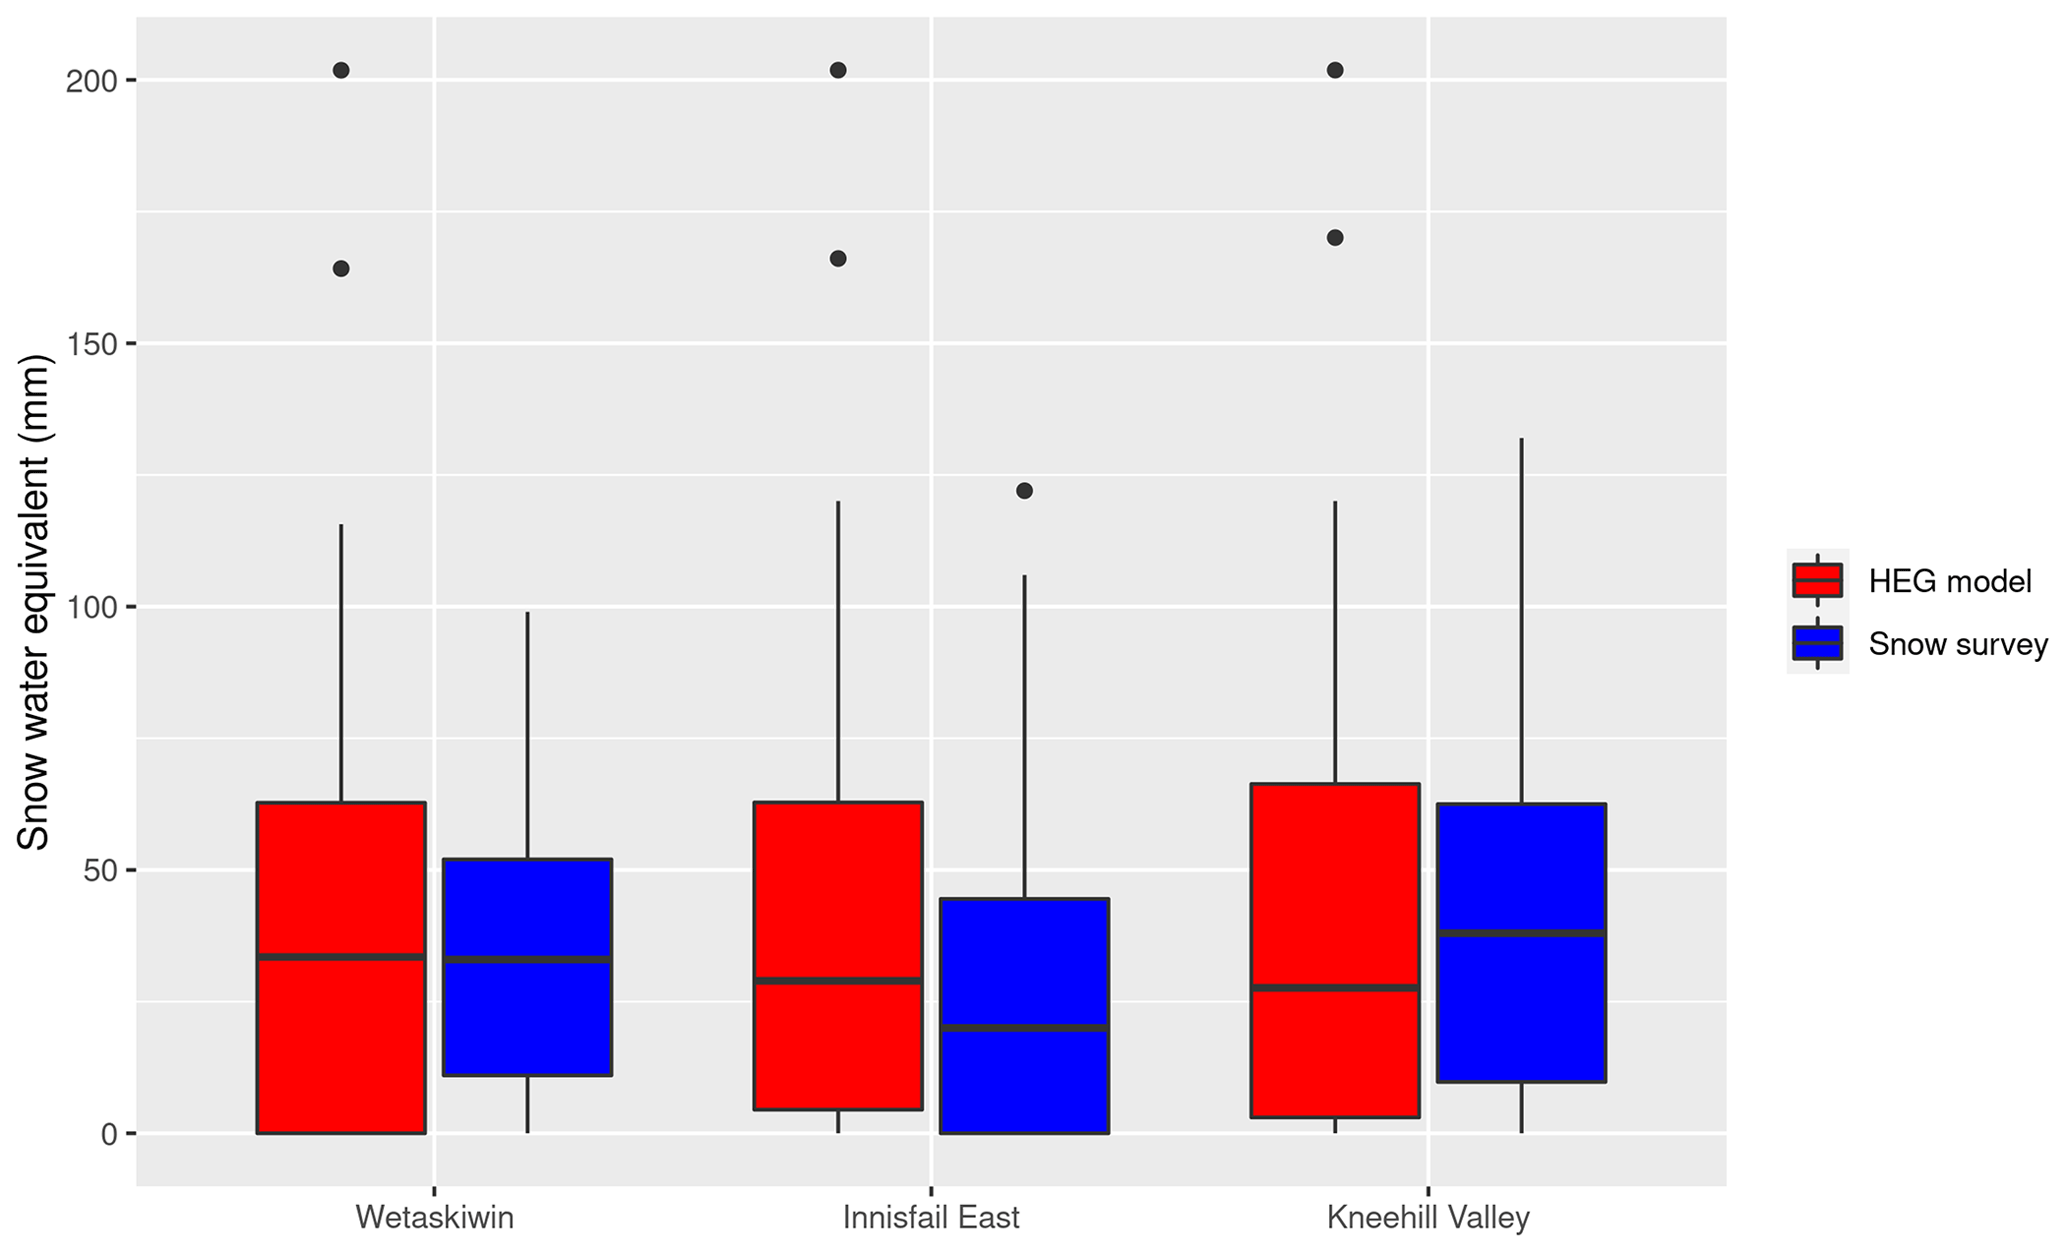
Figure 4Comparison of 1987–2006 simulated SWE using the Red Deer climate forcings and SWE observed at the three Alberta Environment and Parks (AEP) snow courses near Red Deer.
3.1.2 Runoff ratios and mean annual hydrographs
Runoff ratios were evaluated to determine whether the virtual model was dividing the water budget correctly and producing reasonable values of annual runoff. The mean simulated annual runoff ratios for HEG basins during 1965–2006 were 0.08±0.11. These values are slightly lower than those from the literature. Most documented values of runoff ratios from this landscape are from hillslope and agricultural field scales. Woo and Rowsell (1993) estimated the mean value of annual runoff ratios from a grassland slope in Saskatchewan to be 0.13, which is within the range estimated by the model. Rainfall–runoff ratios never exceeded 0.11 from grassland slopes observed by Naeth and Chanasyk (1996) in the fescue grasslands of southern Alberta, which aligns well with the small discharges simulated by the model after spring melt (Fig. 5). Pavlovskii et al. (2019) observed hillslope-scale runoff ratios for snowmelt events over a wide range of values, with smaller values experienced in mid winter (∼0.3) (i.e. January and February) versus those in spring (∼0.5).
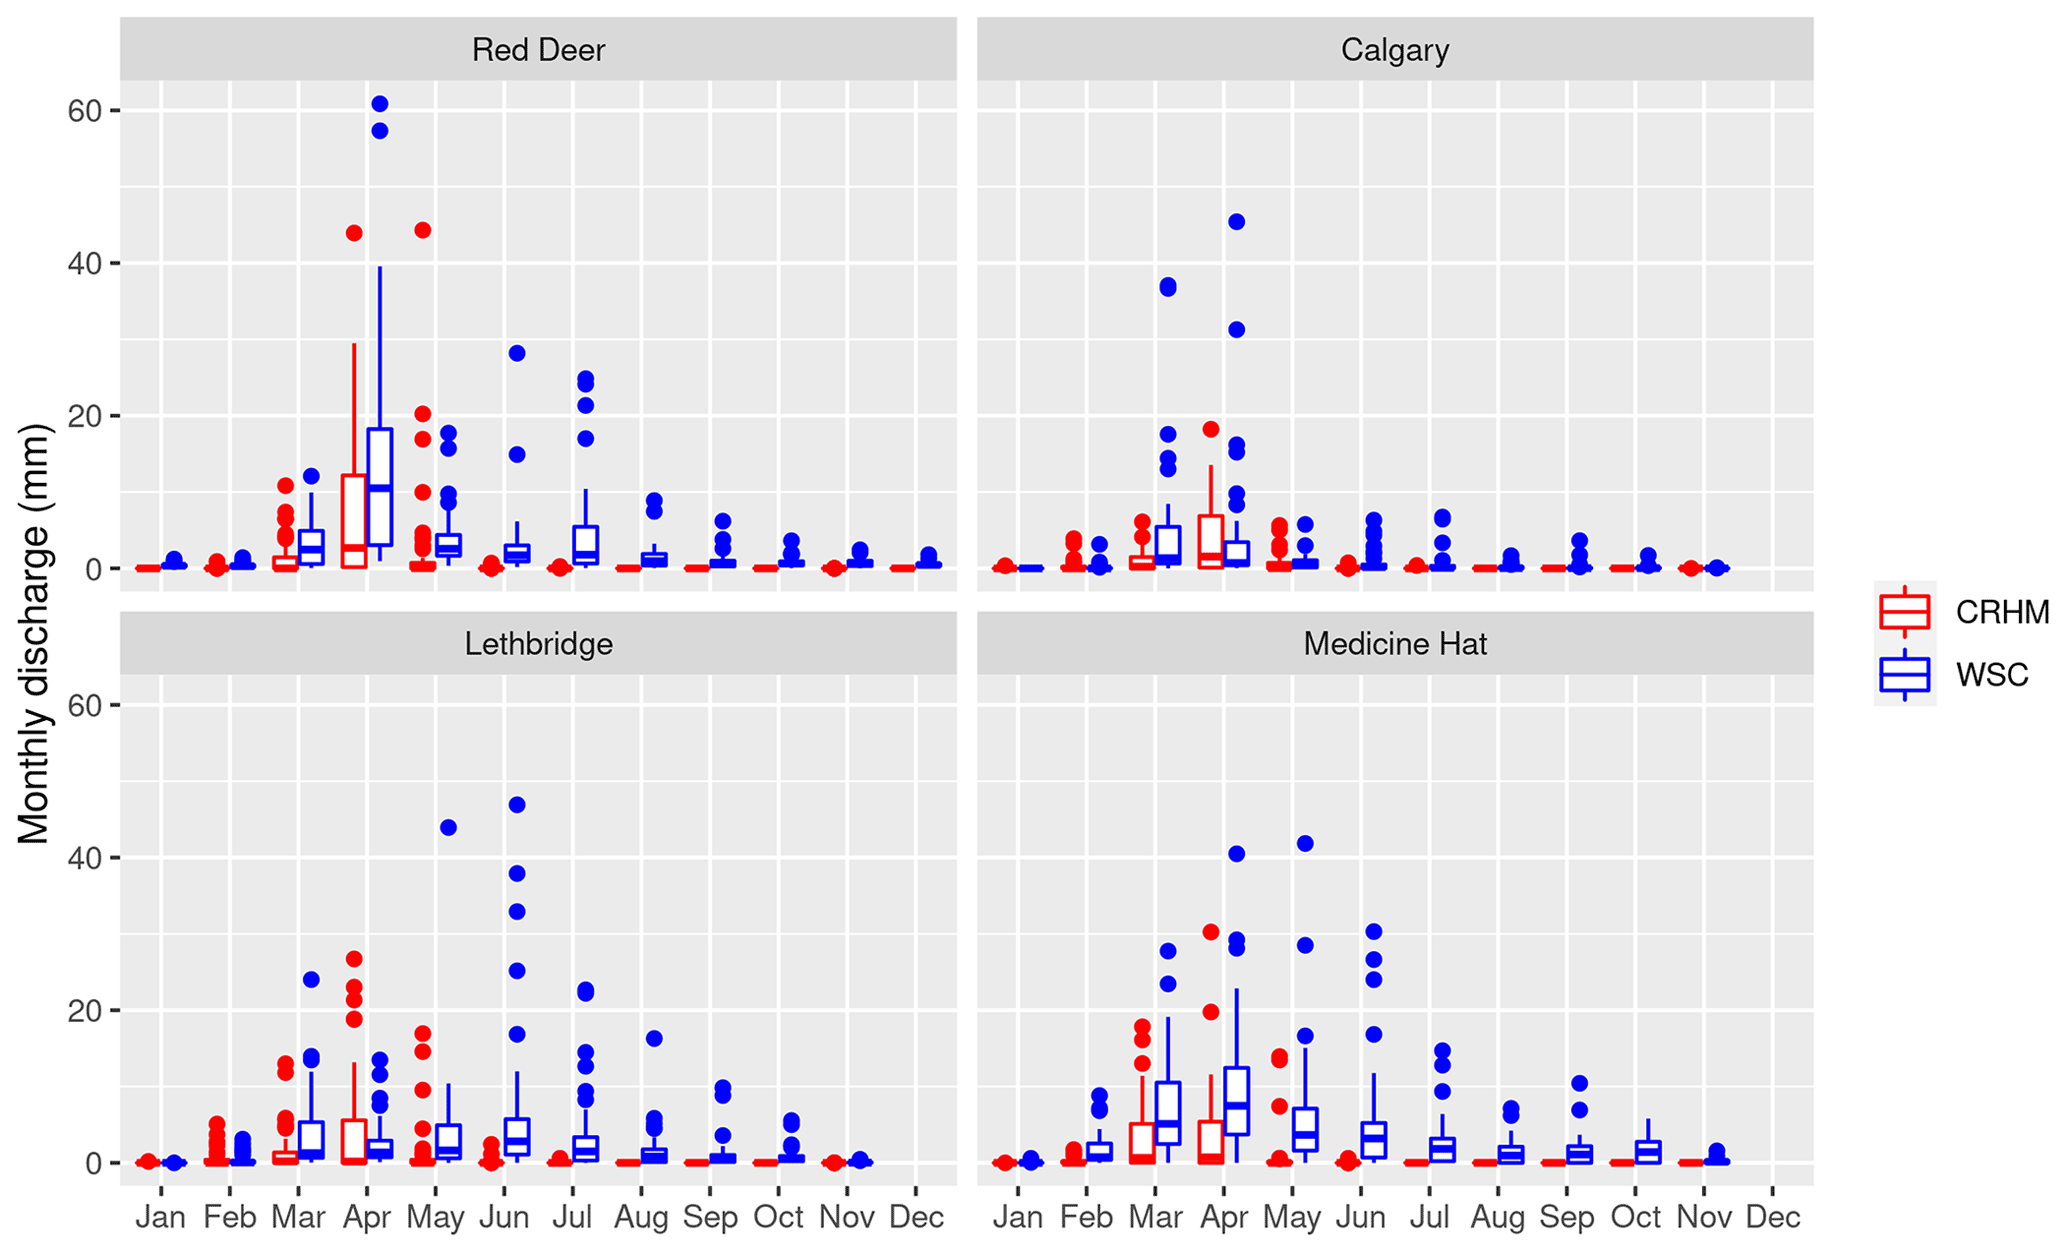
Figure 5Simulated (CRHM) monthly simulated discharge depths (red) using forcing from four of the climate locations compared with those from WSC gauged streams (blue). The horizontal line in the middle of the box denotes the mean, and the top and bottom of the box denote plus or minus 1 standard deviation. The whiskers denote 10 % and 90 % percentiles. Circles represent values beyond these percentiles.
Table 4Simulated annual peak snow water equivalent (SWE) for different hydrologic response units (HRUs) and basin runoff under different climate scenarios (temperature and precipitation expressed as degrees C or percentage change from the reference scenario, respectively), with a climate similar to that at Medicine Hat.
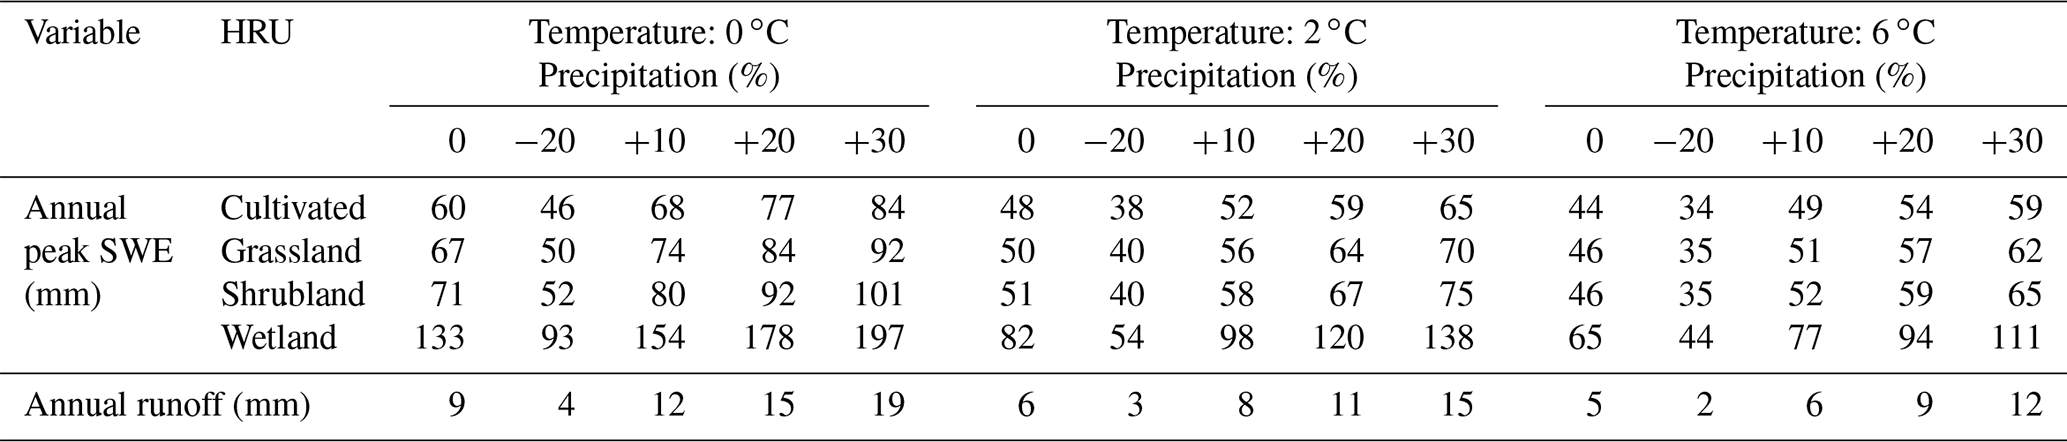
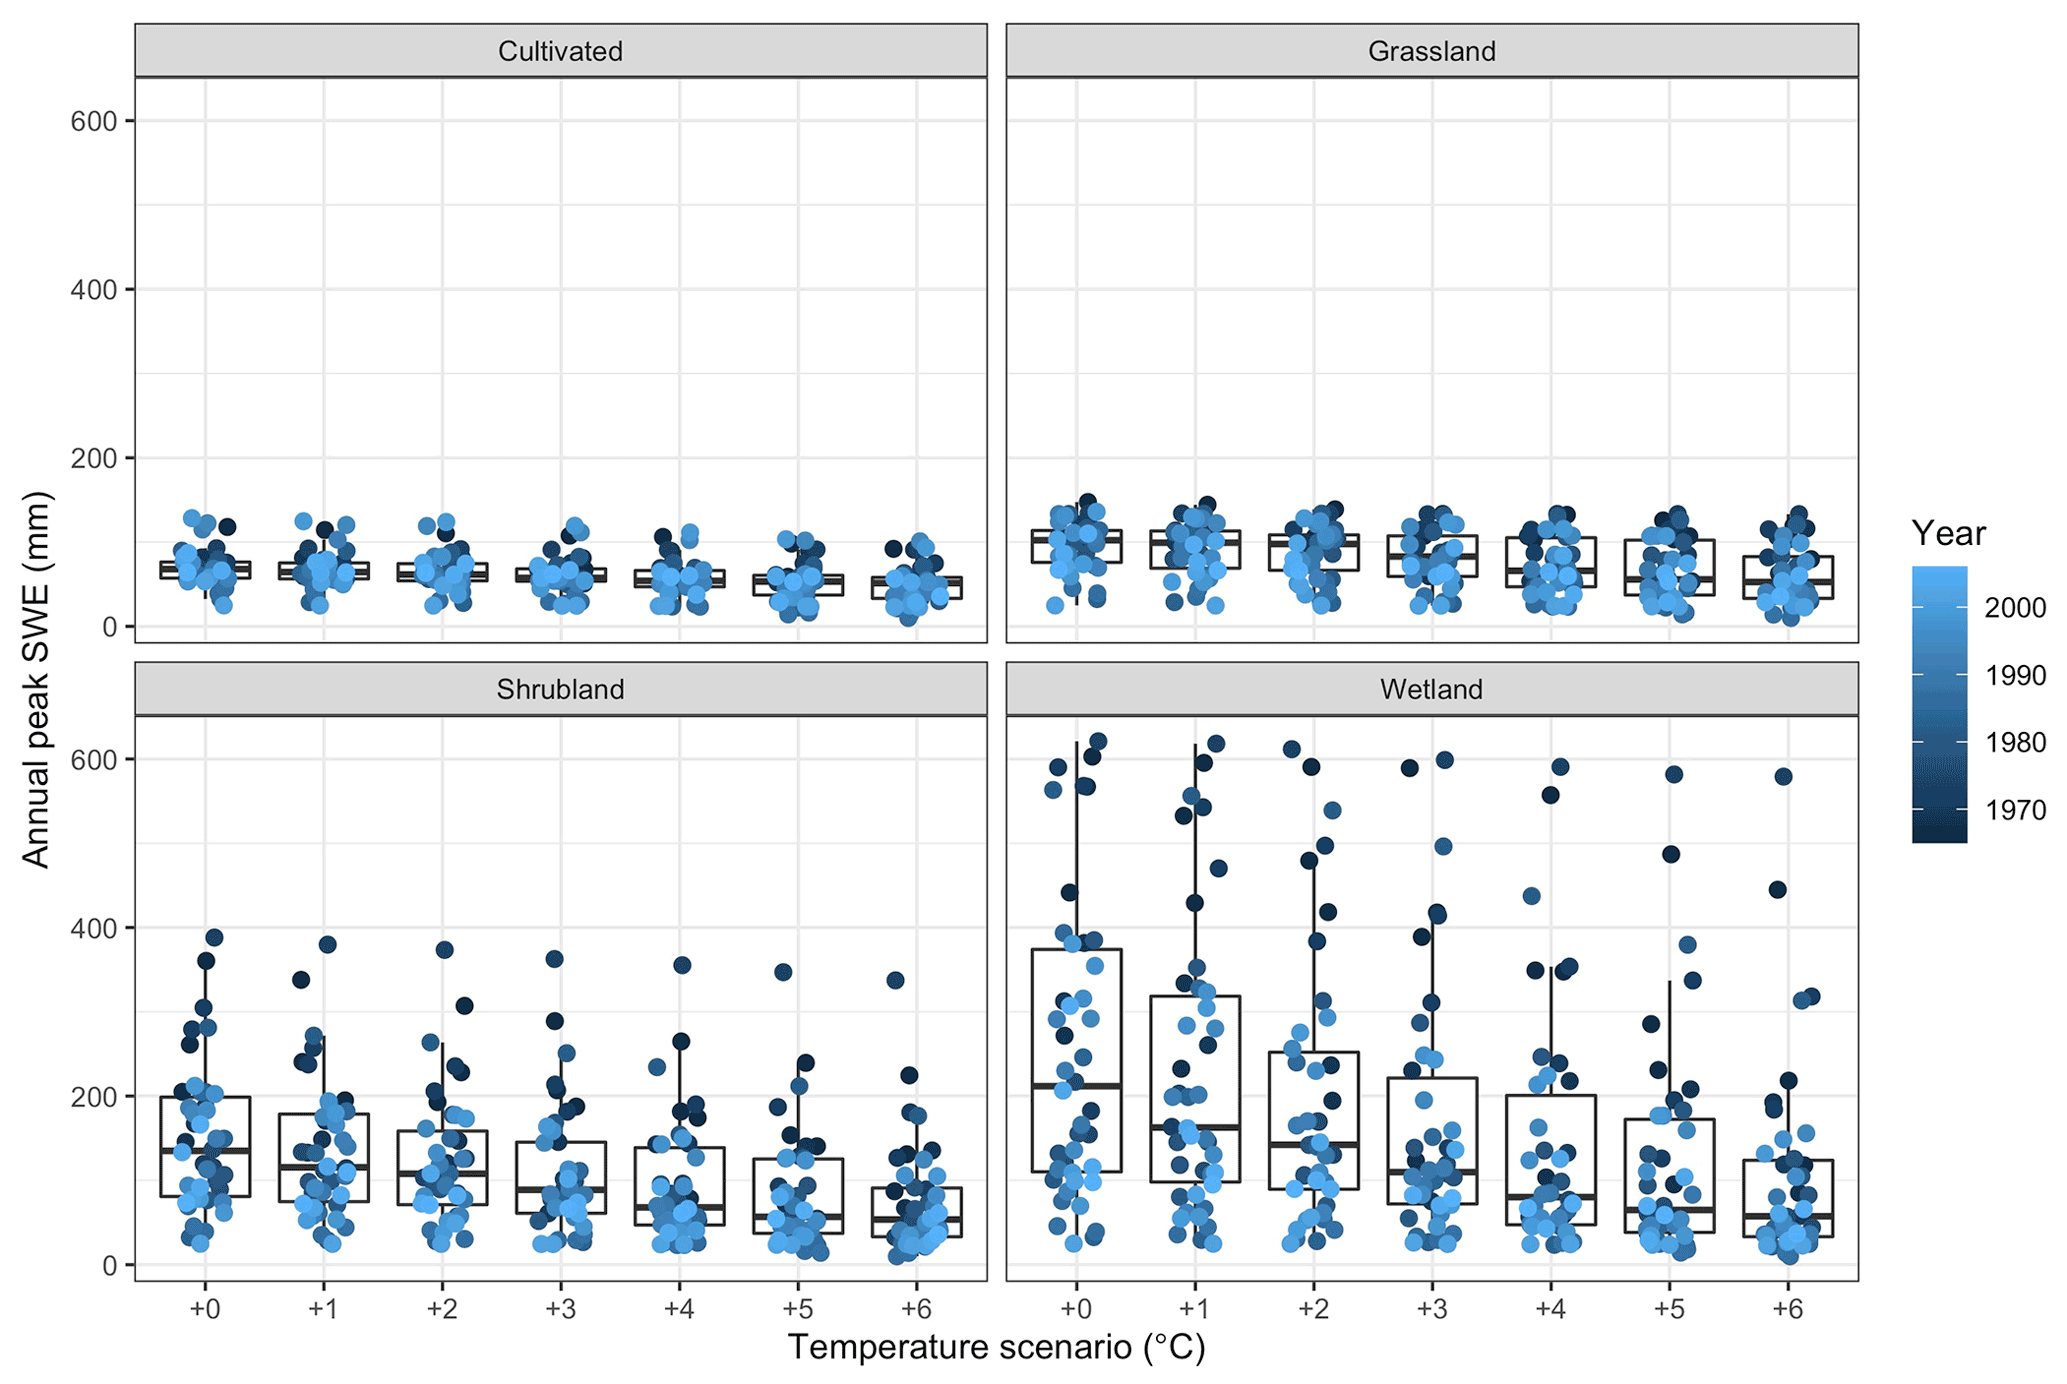
Figure 6Peak virtual model-simulated annual snow accumulation (SWE) for cultivated, grassland, shrubland, and wetland HRUs for Medicine Hat climate under baseline conditions (1965–2006: 0 ∘C) and warming of air temperature up to 6 ∘C.
The patterns of monthly discharge depths for the HEG model driven by climate forcings from the four Albertan climate locations were in good agreement with WSC-gauged streams in the HEG classification (Fig. 5). The monthly means were computed only from those years for which data were available for the HEG virtual model and for all gauging sites. As would be expected, the largest median monthly discharges are found in March through May, due to the spring melt of the accumulated snowpacks. The HEG virtual model did a good job of reproducing the timing and magnitudes of monthly discharge depths, particularly for March and April. This is impressive considering that the meteorological data were collected up to 60 km away from the stream gauging sites. The agreement between the simulated and gauged discharge depths was poorer in the summer, particularly in June and July. Mean conditions are well simulated, but there are numerous instances of outliers in the observed time series, especially in May and June (e.g. Lethbridge – Fig. 5) not captured by the simulations. These events are undoubtedly the result of small, fast-moving, short-duration and intense convective rainfall events. The use of daily precipitation reduces rainfall intensities in the meteorological forcings. Mean annual runoff simulated over the HEG class was 10 mm, while that of the observed runoff from the Water Survey of Canada gauges (Table 3) was 17 mm for the verification period of 1976–2006. This bias of simulated discharge to small values aligns with the low runoff ratios and the poor representation of convective rainfall events in the meteorological forcing discussed earlier. Furthermore, the Water Survey of Canada often selects basins with contributing area fractions that approach 1.0, as these are more efficient at producing streamflow and are easier to gauge (Whitfield et al., 2020; Table 3). This differs from the contributing area fraction of 0.67 (Wolfe et al., 2019) measured as the median across the HEG class and used in the virtual model, and this too could account for some of this low bias.
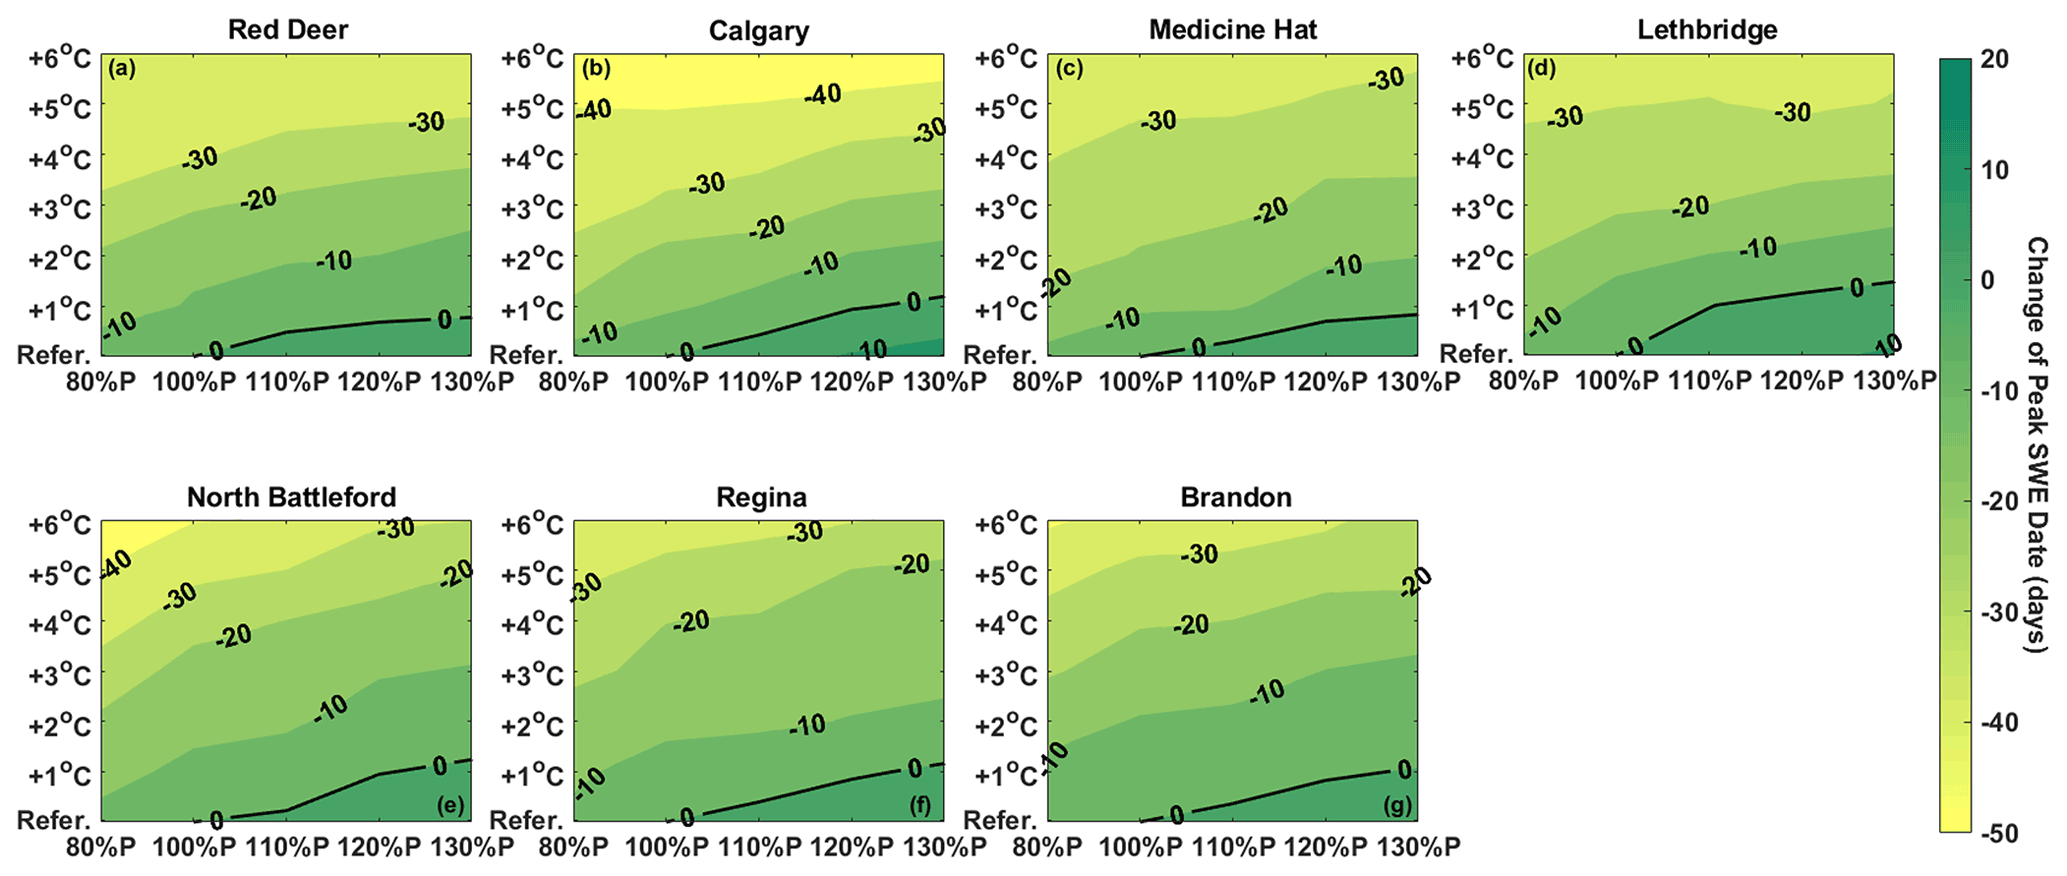
Figure 7Change in peak annual snow water equivalent date at the wetland HRU under warming and changes in precipitation for simulations using the perturbed 30-year climate data. Negative signs in the peak SWE date plot represent advances in time and positive signs and denote a delay in the date of peak SWE accumulation.
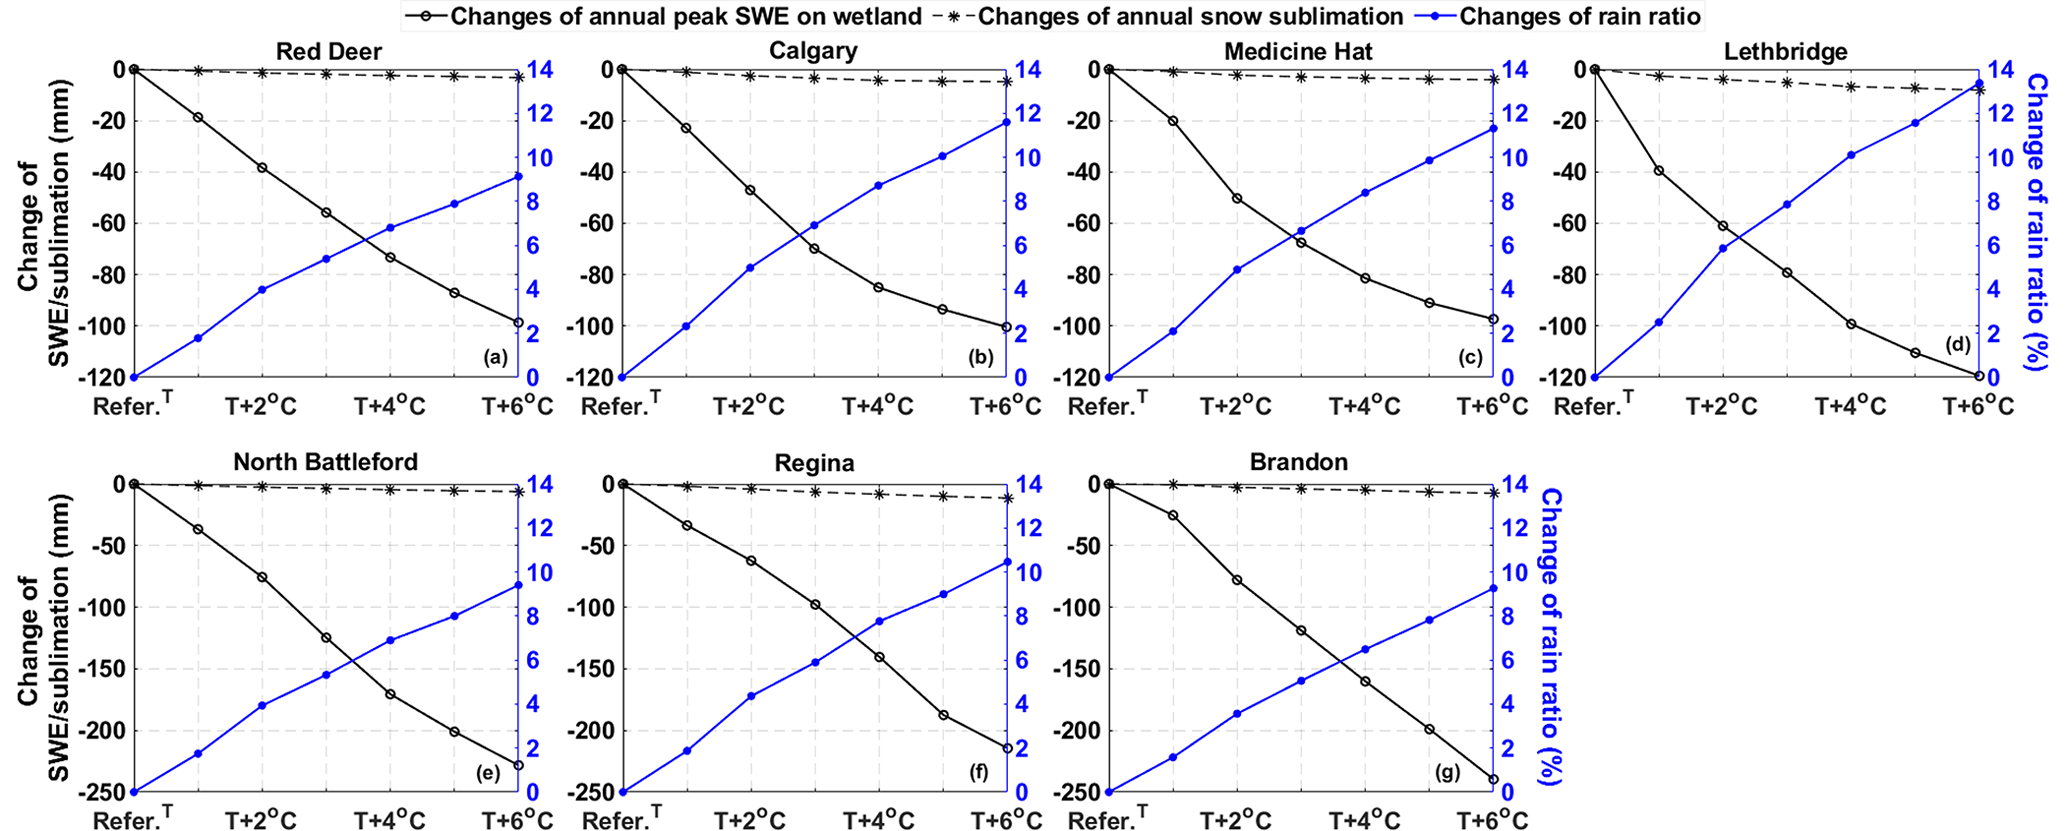
Figure 8Changes in mean annual peak snow water equivalent (mm) in a wetland HRU, annual blowing snow sublimation (mm) and the change in the mean ratio of rain in annual precipitation (%). Change in rain ratio was calculated by the rain ratio of scenario (%) minus the rain ratio of reference (%).
3.2 Hydrological sensitivity to climate
3.2.1 Snow cover
According to Li et al. (2019) and Zhang et al. (2019) future climates at the end of the 21st century for the region could be as much as 30 % wetter and 6 ∘C warmer than the mid 20th century. The effects of these changes on snow cover differ among HRUs (Fig. 6; Table 4). The virtual basin model results support the well-documented cold region phenomenon that the annual peak SWE declines with warming (Najafi et al., 2017; Fang and Pomeroy, 2008). Source HRUs for redistribution of snow (e.g. cultivated HRUs) experience small absolute changes. This may be because blowing snow is affected by vegetation height, and a 6 ∘C temperature rise does not reduce the depth of accumulated snow below this threshold. HRUs receiving blowing snow, such as wetlands, are more sensitive to warming (Fig. 6). Warming of 6 ∘C with no change in mean annual precipitation decreased the simulated annual peak SWE by 27 % in the cultivated HRU and 51 % in the wetland HRU in a climate comparable to Medicine Hat's – this is similar to the sensitivity of snowdrift SWE to warming found by Fang and Pomeroy (2007, 2009) and is due to the temperature sensitivity of the occurrence of blowing snow (Li and Pomeroy, 1997).
The date of annual peak SWE advances as annual air temperature warms (Fig. 7). The maximum advance in the date of the annual SWE peak (with no change in precipitation) is about 40 d. The date of peak SWE is more sensitive for climates typical of western Alberta (e.g. Calgary) than those further east (e.g. Regina, Brandon). For example, an increase of 2 ∘C is needed to advance peak SWE date by 20 d near Calgary, while a similar change requires 4 ∘C in Saskatchewan or Manitoba. This could be due to the colder initial temperatures further east and north (Table 2). The nearly horizontal isochrones in Fig. 7 suggest that the peak SWE date is less a function of potential changes in precipitation amount and more a function of anticipated temperature increases.
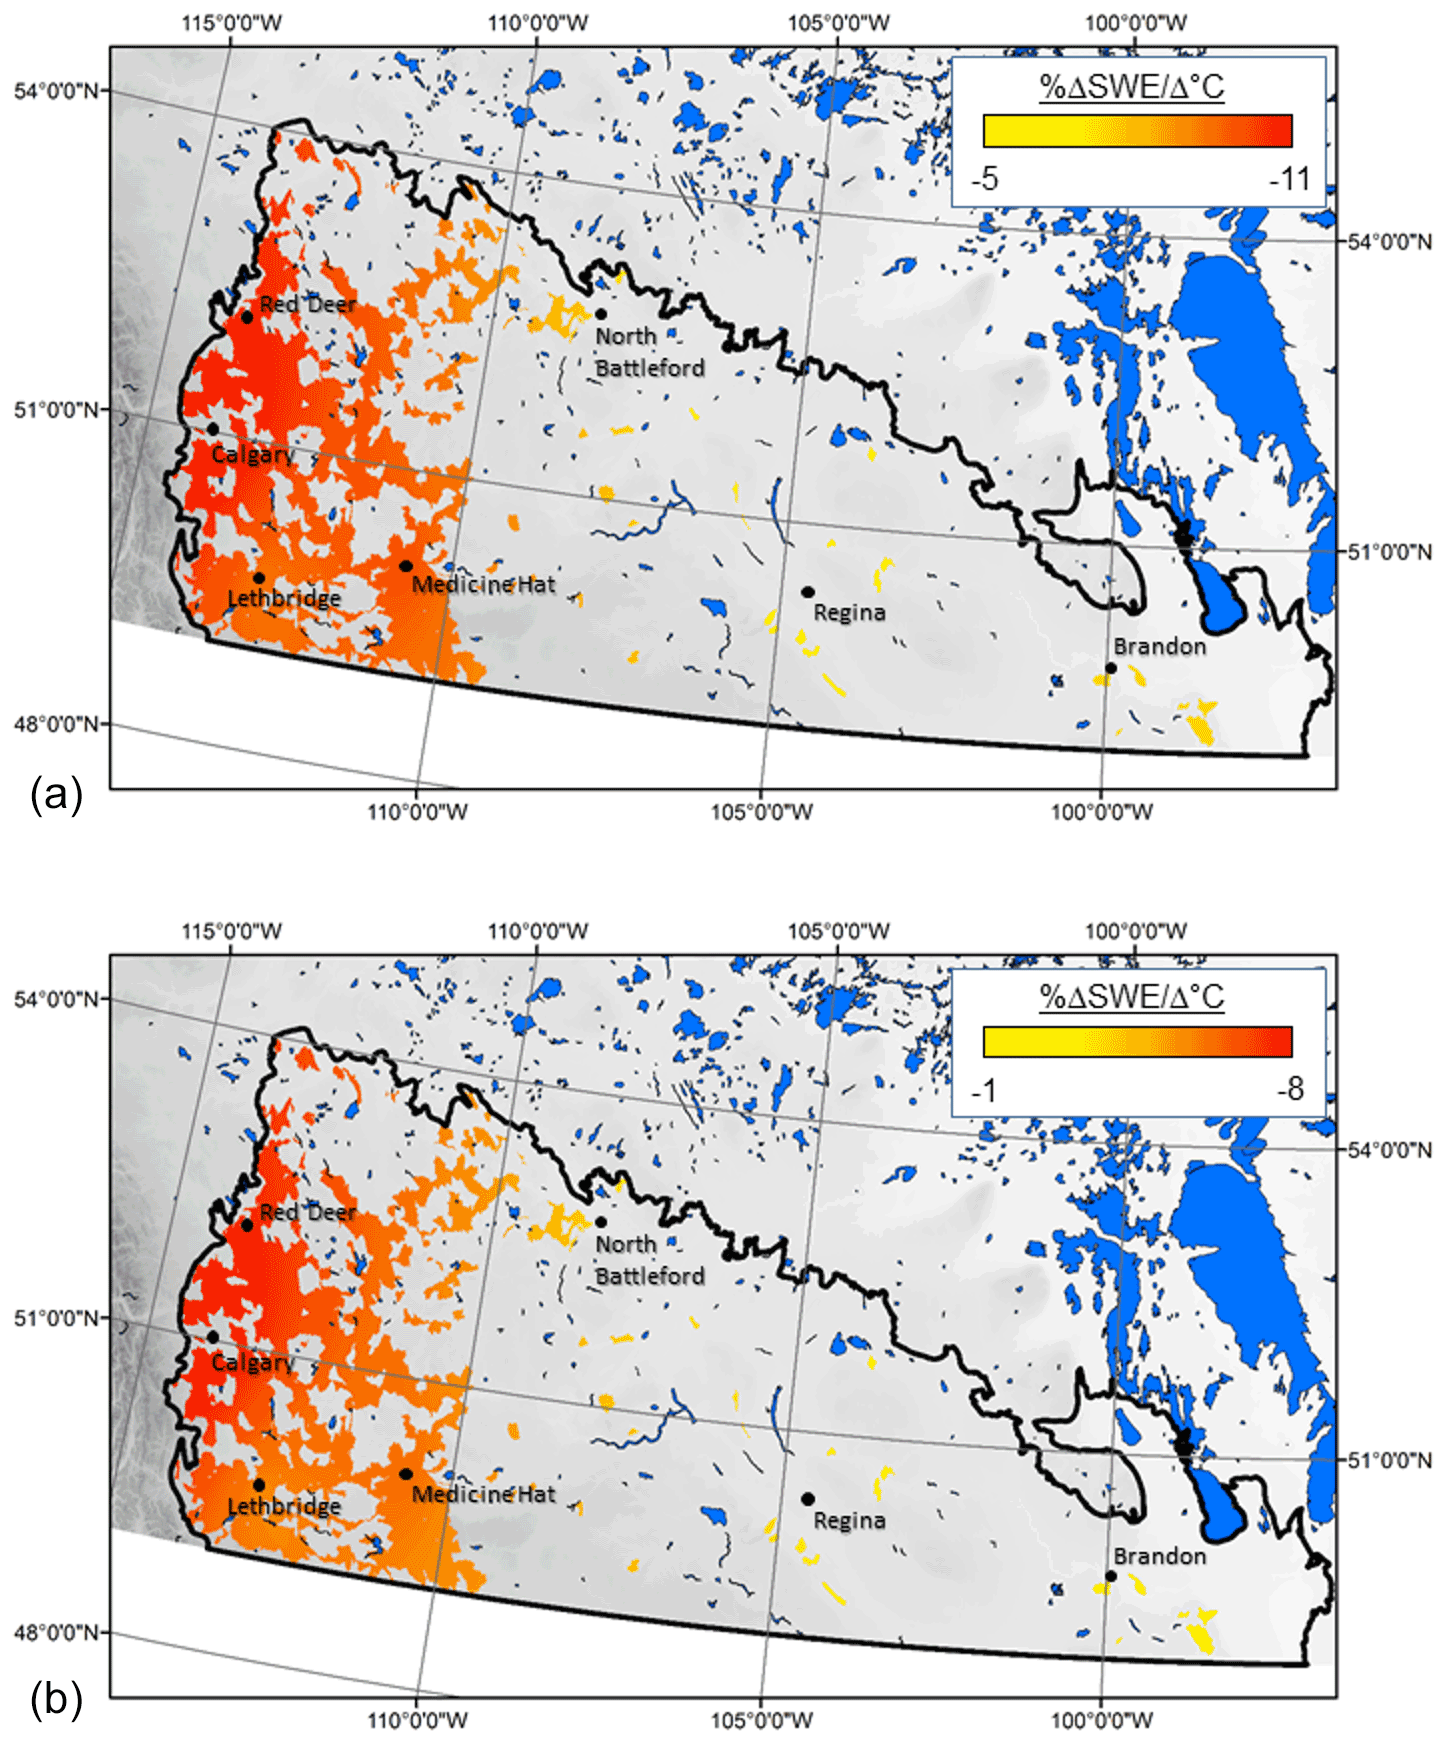
Figure 9Sensitivity of annual maximum snow water equivalent (SWE) in the grassland HRU to warming, assuming no change in precipitation (a), and a 30 % increase in mean annual precipitation (b).
Warming is associated with an unequivocal decrease in the amount of snowfall, as the ratio of rain to annual precipitation can increase by more than 10 % with warming of 6 ∘C (Fig. 8). Greater absolute decreases in wetland HRU SWE with warming were simulated using climate from the eastern and northern edges of the class (i.e. Brandon, North Battleford and Regina) (Fig. 8). Under warming of 6 ∘C annual peak SWE in the wetland HRU decreased by 100 mm in a climate such as Medicine Hat's and by as much as 220 mm in a climate such as Brandon's. The absolute differences are due to the drier climates of the western locations (Table 2) that produce smaller baseline annual peak SWE (157 mm at Medicine Hat vs. 409 mm at Brandon). The dry climates also tended to be warmer, with a rain ratio more sensitive to warming (e.g. Lethbridge vs. North Battleford, Fig. 8). This results in a higher rate of loss in SWE in a climate such as southern Alberta's (11 % loss in annual peak SWE per ∘C) compared to climates from the eastern portions (5 % loss in annual peak SWE per ∘C) (Fig. 9).
The changes in rainfall ratio illustrated in Fig. 8 are evident when model simulations are extrapolated across the HEG class (Fig. 9). In much of the class, the annual maximum spring SWE declines by more than 7 % for each ∘C of warming. The most sensitive regions are in western Alberta. When temperature change is held constant in the model, annual maximum SWE changes almost proportionally with precipitation (Table 4). When the effects of temperature and increasing precipitation are combined, there is a trend from east to west of larger decreases in annual maximum SWE (Fig. 9) with a warming and wetting climate. The predicted increase of 30 % in annual precipitation does not offset the impact of increases in temperature on SWE, but the maximum annual SWE reductions per degree are slow and range from 8 % to 1 %. The most sensitive regions become concentrated in western Alberta as these become relatively drier.
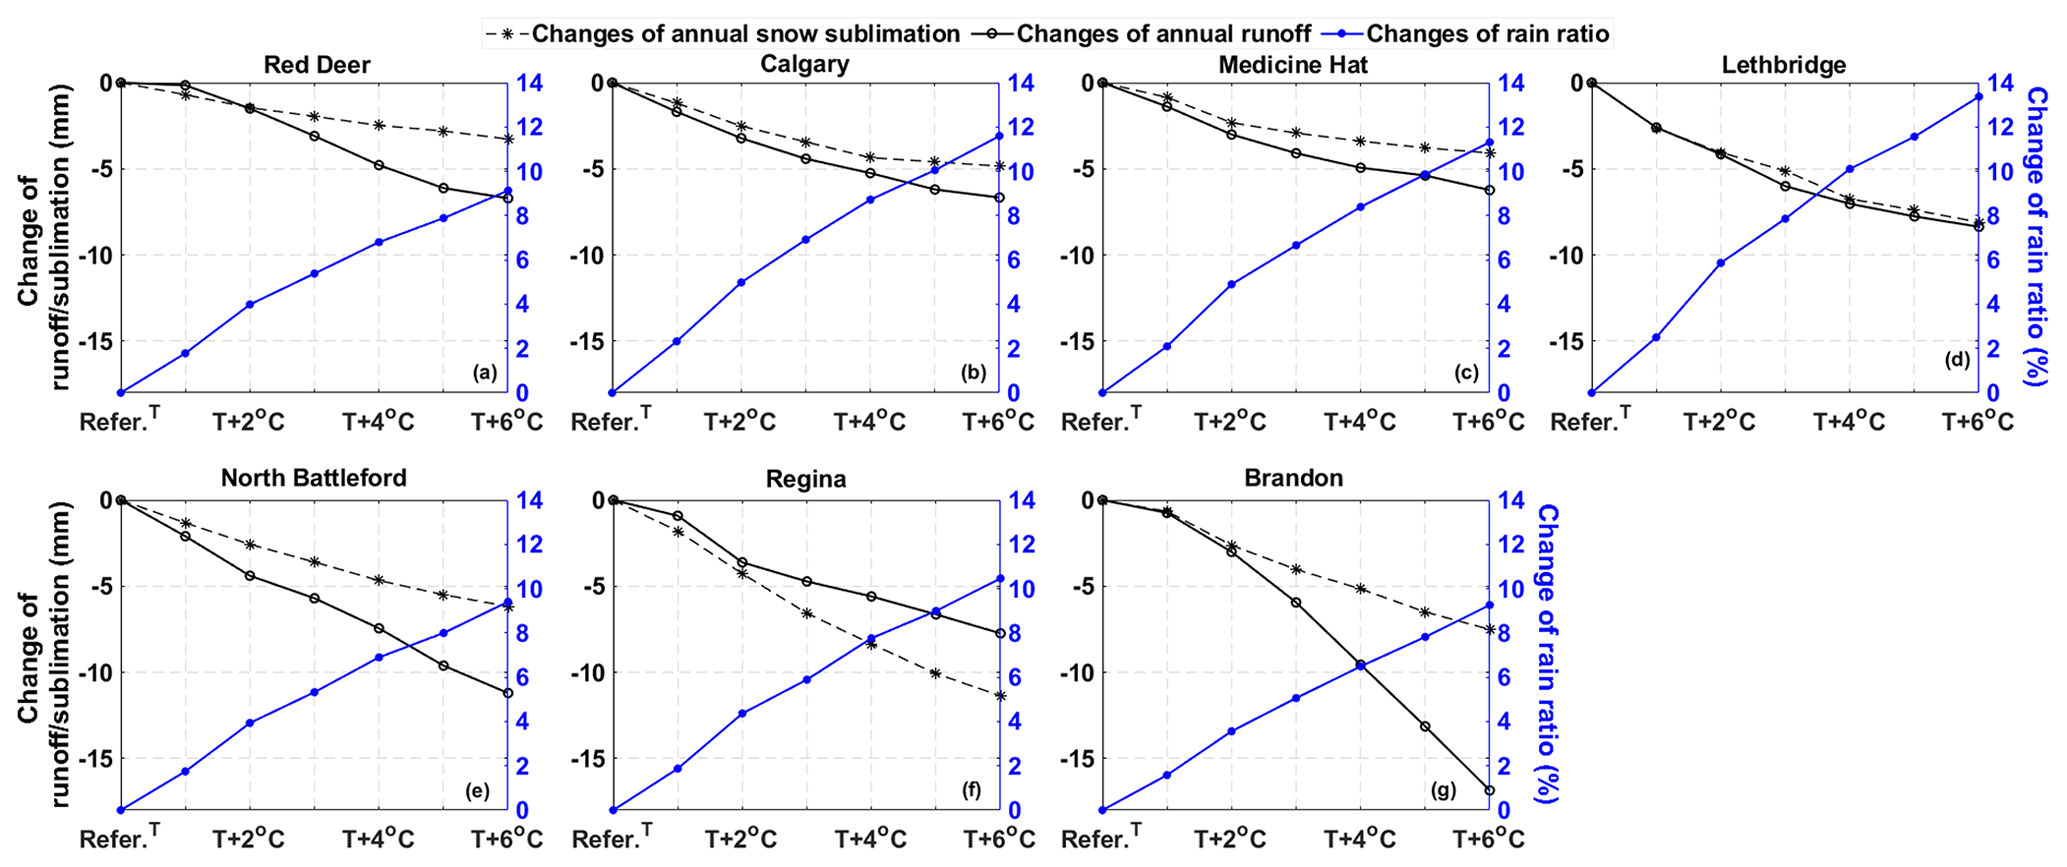
Figure 10Change in runoff (mm), annual blowing snow sublimation (mm) and change in the ratio of rain in annual precipitation (%) for each climate (annual blowing snow sublimation and ratio of rain as in Fig. 8).
3.2.2 Streamflow
Absolute decreases in runoff in the climates of Red Deer, Calgary and Lethbridge are all similar under a warmer climate (Fig. 10). Similar but larger absolute decreases were simulated for the colder climates of Brandon, Regina and North Battleford. These colder sites do not see as large an increase in the rainfall ratio (Fig. 10). The smallest absolute change in annual runoff (7 mm) was found for areas with a Medicine Hat climate; however, this represents a 78 % decrease in runoff, as baseline runoff (9 mm; Table 4) was the smallest of the seven climates investigated. Two reference conditions can result in lower relative change in runoff with warming, either a dry or cold climate. This is evident in Fig. 10. For each degree Celsius of warming, streamflow from HEG basins with western Alberta climates decreases 15 %, but in those with climates from the east and north, this impact diminishes to decreases of 7 % ∘C−1 of warming. Under a warmer and wetter climate (6 ∘C warming and 30 % increase in annual precipitation) runoff in western portions still experiences decreases, but runoff in climates such as Brandon's increase and remain the same in climates such as Saskatchewan's (Fig. 11).
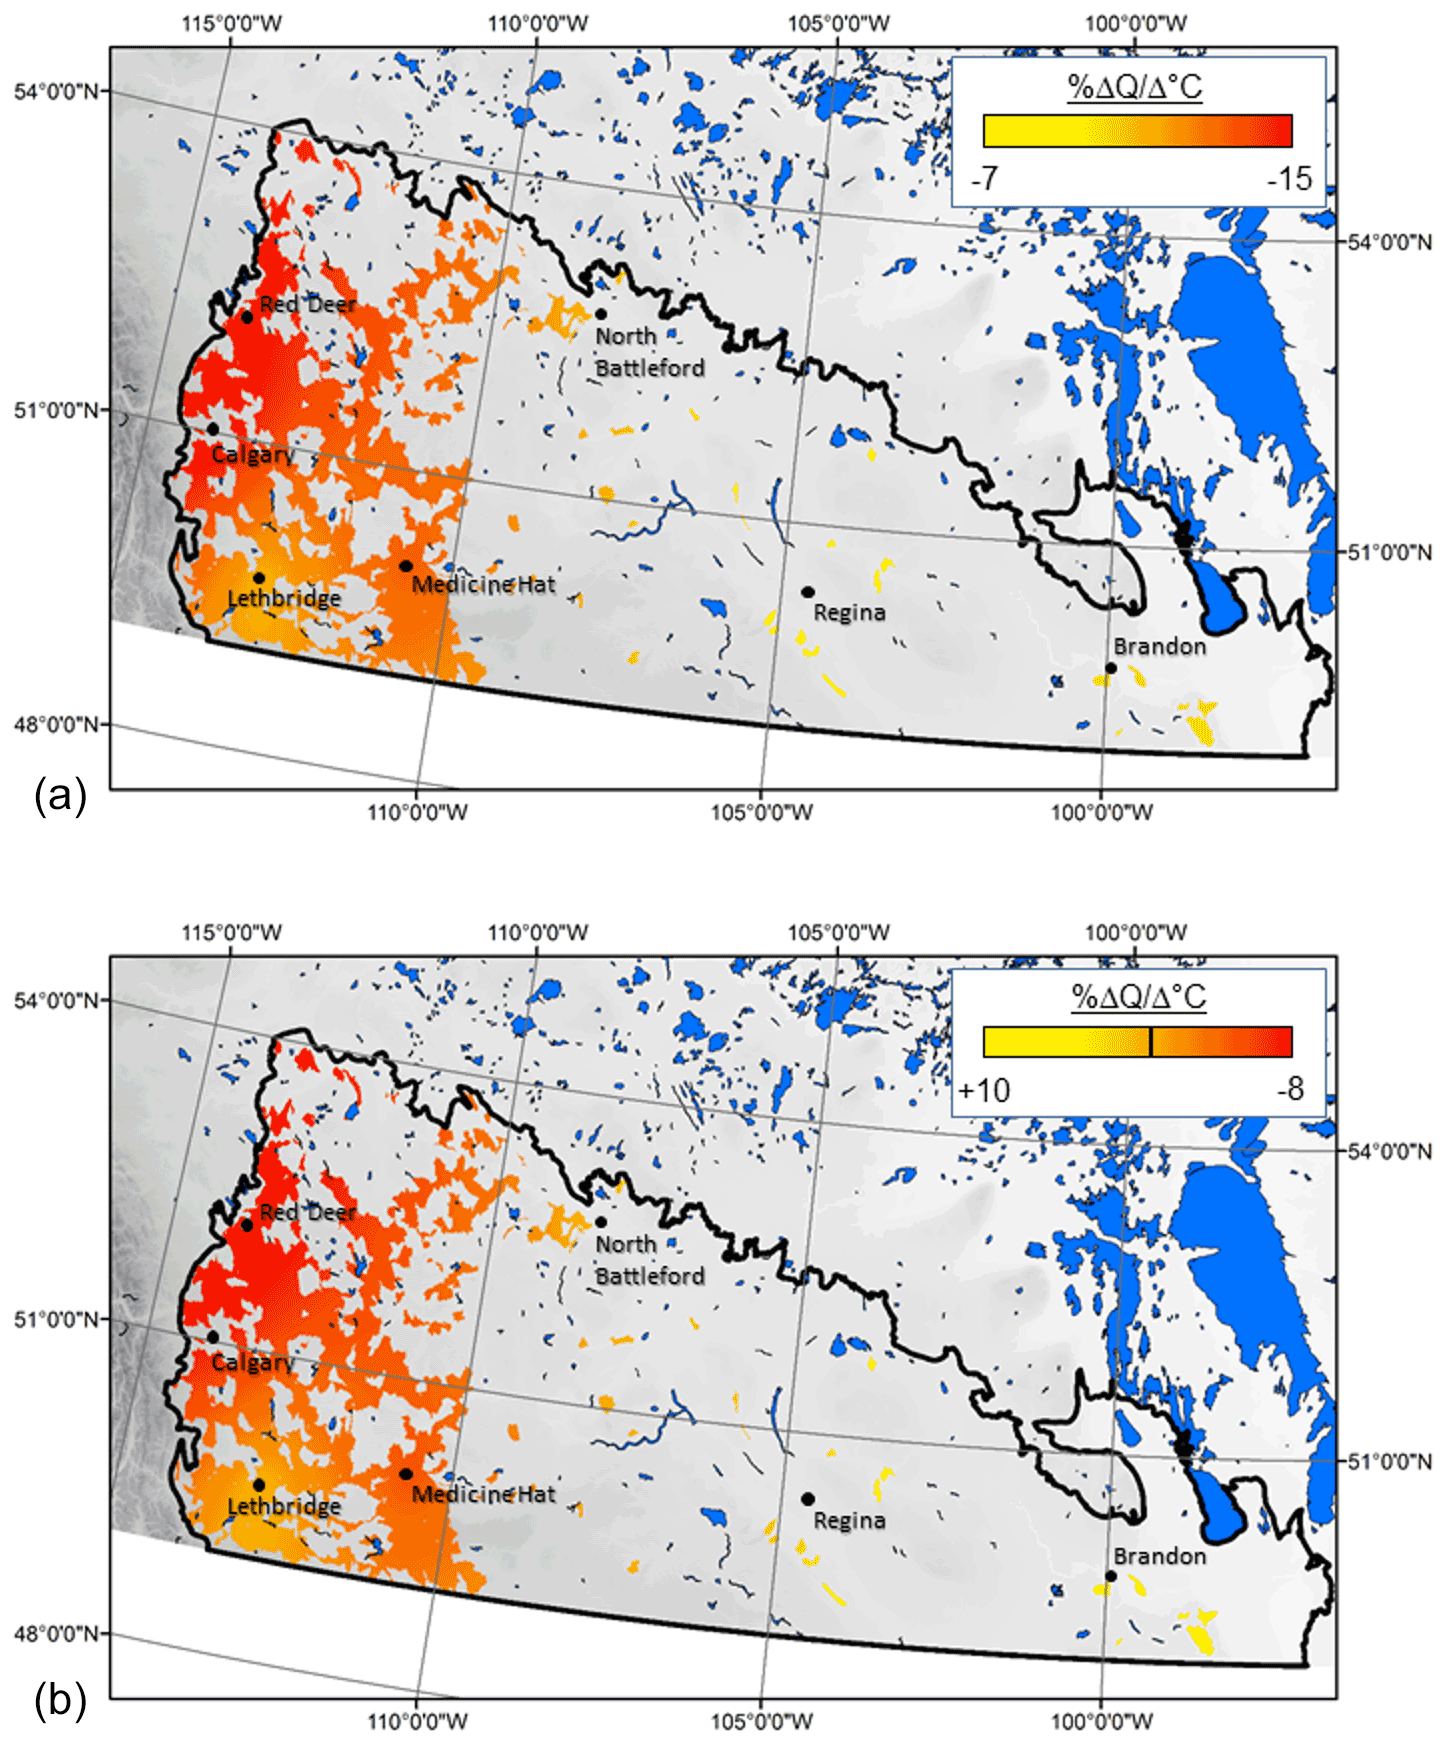
Figure 11Sensitivity of annual runoff from HEG basins to warming assuming no change in precipitation (a) and a 30 % increase in mean annual precipitation (b). Note that the black bar in the legend for (b) denotes the colour at which there is no change.
The value of using a classification-based virtual basin approach is that it can be more efficient than running models over each catchment in the region. Running the model with one parameterization for a prototypical basin seven times for each climate record and with the 35 climate scenarios took 7 h. The subsequent kriging added another 2 h for a total of 9 h. Had there been reasonable climate data and all 796 basins in the HEG class were run, the simulations would have taken 33 d. A value of using a virtual basin model approach rather than statistically extrapolating observed streamflow records and subsequently attempting to disentangle controls on streamflow is the ability to isolate the influence of individual drivers such as climate on hydrological responses. It can be difficult to glean from observations alone how Canadian Prairie basins respond to change (Ehsanzadeh, 2016), because neither climate nor land use has remained stationary over the last half century. The model results imply that the effects of temperature and precipitation changes will differ amongst HRUs. Increases in precipitation may also cancel the direction and slow the magnitude of changes in streamflow caused by increased temperatures, and these patterns vary across the region.
The climate of the Canadian Prairie has been warming since the mid 20th century, with more variable and greater precipitation (Gan, 1998; Millett et al., 2009), which has altered water availability and flood characteristics (Pomeroy et al., 2009), which are of interest to water managers and others. The uncertainty in future climate change projections, particularly in precipitation (Bush and Lemmen, 2019), can be partially mitigated by the type of sensitivity analysis conducted here, which can provide some information on how hydrological states and fluxes may respond to alternate future climate conditions and to identify potential thresholds in hydrological response. On the Canadian Prairie, the sensitivity to climate varies among landscape components. There is confidence that annual warming of 6 ∘C coupled with increases in precipitation of 30 % for HEG basins will induce detectable changes in spring snow condition, with snowpacks in cultivated fields being less sensitive than wetlands. This type of change could happen by the late 21st century (Bush and Lemmen, 2019). The sensitivity analysis implies that a 6 ∘C warming alone could result in a 27 % decline in annual maximum SWE in cultivated areas and a 51 % decline in depressions (Table 4). Blowing snow redistribution to depressions is particularly sensitive to warming temperatures (Fig. 8). The increase in temperature reduces snow accumulation and, in turn, the redistribution of blowing snow to sink areas such as depressions. Rasouli et al. (2014) also documented a non-linear response in annual peak SWE to changes in temperature and precipitation, albeit in a mountain basin, where even a 30 % increase in precipitation could not compensate for the impacts of a 6 ∘C warming on peak annual SWE. The reduction in depression SWE has important implications for groundwater recharge as depressions provide recharge at volumes disproportionate to their area on the landscape (Hayashi and van der Kamp, 2005). Given that wetland depressions of the region are well known as biodiversity hotspots (Mantyka-Pringle et al., 2019), these changes could have cascading effects for biophysical systems.
Warming in the spring and reduced winter snow accumulation advance the timing of annual peak SWE. With an increase of 6 ∘C, annual peak SWE (with no change in precipitation) arrives 40 d earlier. This lengthening of the snow-free season enhances the opportunity for evaporative losses. The consequence for streamflow is a 44 % decline in annual volume in a relatively dry HEG climate such as Medicine Hat's (Table 4). Year-to-year variation may be more extreme than suggested by the model because streamflow variability in the virtual basin model simulations is less sensitive to inter-annual variation in climate than streamflow records for gauged basins within the classification indicate. The results imply that changes in streamflow due to warming can be offset by rising precipitation. Warming of this magnitude has occurred in the last 60 years in southern Alberta (DeBeer et al., 2016), and the influence can be seen in the smallest simulated SWE values typically appearing later in the simulation period (Fig. 6). Whitfield et al. (2020) found that basins that align with the HEG class are already responding to this kind of climate change, exhibiting earlier and smaller runoffs, implying the area is becoming drier. This is expected to continue with a further 2 ∘C increase from current conditions (i.e. ∼4–5 ∘C from the mid 20th century) predicted by 2040 (Zhang et al., 2019). The value in understanding the dynamics of combined impacts of temperature and precipitation changes on SWE and streamflow is that it can highlight conditions that require more attention for mitigation. The diversity in streamflow response across the class, with greater decreases in streamflow simulated in the west and possibly increases in the east (Fig. 11), is similar to patterns observed by Johnson et al. (2005) across the entire Prairie Pothole Region over the last half of the 20th century. This kind of regional diversity may require a variety of policies and practices to be implemented across the region. This information could be helpful to water managers and policymakers in the region, including informing how small dams are operated (Muzik, 2001) and wetlands are managed (Wilson et al., 2019).
The sensitivity of hydrological regimes documented here is similar to those of other studies conducted in the HEG classification and other nearby Prairie basins. Fang and Pomeroy (2007) and Pomeroy et al. (2007) attempted to determine the sensitivities of snow accumulation and runoff to drought at Bad Lake, Saskatchewan. They adjusted initial soil moistures, vegetation heights and winter temperature and precipitation in ways that were informed by previous droughts and by the Global Climate Model predictions of the time. In their work, simulated snow cover duration decreased by 40 d given a 1 ∘C winter warming and a 15 % increase in winter precipitation, which may suggest greater sensitivity to changing winter climate than our results under similar climate perturbations (single-digit advancement of timing and modest decreases in the amount of peak annual SWE; Fig. 8). Muzik (2001) altered precipitation in a simulation of the Little Red Deer River, Alberta, and also found disproportionate changes in streamflow. Using downscaled values from Providing Regional Climates for Impacts Studies (PRECIS) and the Canadian Regional Climate Model (CRCM) and stochastic weather generator data to force an application of the Soil Water Assessment Tool (SWAT) Model to a Prairie Pothole basin in Saskatchewan, Zhang et al. (2011) found winter runoff increases to be a function of how frequently the air temperature exceeds 0 ∘C. Using a similar approach, Muhammad et al. (2018) show how warming can increase winter runoff, but this will not offset large decreases in spring and summer runoff. Simulations of Beaver Creek, Alberta, to quantify climate change impacts on snow accumulation and streamflow indicated that changes in precipitation of more than 10 % are needed to alter annual runoff (Forbes et al., 2011). Rasouli et al. (2014) suggest that in mountainous areas of Alberta, runoff is more sensitive to changes in precipitation than temperature; however, our results in the Canadian Prairies imply a more dynamic system. When there is warming and drying, runoff is sensitive to both precipitation and temperature, but as conditions become wetter, the Prairie system becomes less sensitive to temperature. This is not necessarily due to changes in the snowpack, which responds in a more linear manner (Fig. 9), but is perhaps due to higher amounts of rainfall relative to the storage capacity of the landscape.
Virtual experiments have proven to be suitable for diagnosing the hydrological response of basins in this landscape. This work introduces a modelling approach that can be used to generate new knowledge of hydrological behaviours at a regional scale under different boundary conditions. Where previous studies have focused on the sensitivity of individual basins in cold regions and conclusions about wider applicability were made by assuming the basins to be representative, this approach is meant to provide a methodology to assess how regional hydrology may respond to change by modelling a prototypical virtual basin that represents one type of basin in a region. The results of this study can be used, in part, to address demands for regional-scale information. Such information is required to develop informed policies for climate change mitigation but also more broadly for water resource management in this landscape where land use is predominantly for intensive agriculture. However, there are some limitations as the model assumes a homogenous basin with an area of 100 km2. It also does not account for second-order changes such as how agricultural practices will adapt in response to a warmer and wetter environment over time and the role these landscape changes play in influencing hydrological processes. Outputs of virtual experiments are less useful in predicting exact future system states than in specifying how alternative climate possibilities would alter hydrological behaviour. Therefore, the model output should be interpreted with some caution as the approach is less useful in predicting exact future system states than in specifying how alternative choices could alter the tendency to move towards each of those conditions.
The simulations provide novel insights into the interactions that influence the hydrological response of the High Elevation Grasslands classification to different climates. The experimental design was successful in simulating the sensitivity of a basin class in the Canadian Prairie to expected climate change. The scenario results show that the hydrology of HEG basins in the Canadian Prairies is highly sensitive to changes in climate. What should be considered is that the changes simulated by the virtual basin model are already underway. For instance, the mean annual temperature at Medicine Hat for the baseline simulation period (1960–2006) was 5.5 ∘C. The region is expected to warm 2 ∘C above the 1976–2005 climate normal (6.1 ∘C) to 8.1 ∘C by 2040 (Zhang et al., 2019). It is reasonable to expect that the 2 ∘C warming scenario presented here will be the normal by the end of this decade. Water managers should expect 38 % less snow in depressions and 20 % less snow in cultivated fields in the spring and 33 % less annual runoff. Of course, this depends on how wet the next 10 years are. Simulations imply that a 10 %–20 % increase in average annual precipitation would be needed to offset the warming. These are profound differences in the response of the hydrological regime of the region to a warmer and wetter climate. Water managers and agricultural producers need to consider carefully how they can adapt their practices in light of such changes.
All climate data inputs, model outputs and model parameter files in formats ready for use in CRHM are available from He et al. (2021) in the Federate Research Data Repository at https://doi.org/10.20383/102.0517 (He et al., 2021). All model forcing datasets used in this research are publicly available and can be accessed via the references and links provided.
CS and CJW conceived the study. ZH, BM and KRS led the modelling effort and data analysis. JDW led the catchment classification. All the authors contributed to writing.
The contact author has declared that neither they nor their co-authors have any competing interests.
Publisher's note: Copernicus Publications remains neutral with regard to jurisdictional claims in published maps and institutional affiliations.
The authors wish to thank all the partners and stakeholders in the Canadian Prairie water resource community that have helped co-develop the Prairie Water research program.
This research was funded by the Canada First Research Excellent Funds' Global Water Futures programme and managed as part of the Prairie Water research project.
This paper was edited by Laurent Pfister and reviewed by two anonymous referees.
Armstrong, R. N., Pomeroy, J. W., and Martz, L. W. Evaluation of three evaporation estimation methods in a Canadian prairie landscape, Hydrol. Process., 22, 2801–2815, 2008.
Armstrong, R. N., Pomeroy, J. W., and Martz, L. W.: Variability in evaporation across the Canadian Prairie region during drought and non-drought periods, J. Hydrol., 521, 182–195, 2015.
Ayers, H. D.: Influence of soil profile and vegetation characteristics on net rainfall supply to runoff, in: Proceedings of Hydrology Symposium No. 1: Spillway Design Floods, NRCC, Ottawa, 198–205, 1959.
Brannen, R., Spence, C., and Ireson, A.: Influence of shallow groundwater-surface water interactions on the hydrological connectivity and water budget of a wetland complex, Hydrol. Process., 29, 3862–3877, 2015.
Bush, E. and Lemmen, D. S.: Canada's Changing Climate Report, Government of Canada, Ottawa, ON, p. 444, https://changingclimate.ca/CCCR2019/ (last access: 31 March 2022), 2019.
DeBeer, C. M., Wheater, H. S., Carey, S. K., and Chun, K. P.: Recent climatic, cryospheric, and hydrological changes over the interior of western Canada: a review and synthesis, Hydrol. Earth Syst. Sci., 20, 1573–1598, https://doi.org/10.5194/hess-20-1573-2016, 2016.
Di Giammarco, P., Todini, E., and Lamberti, P.: A conservative finite elements approach to overland flow: the control volume finite element formulation, J. Hydrol., 175, 267–291, 1996.
Dumanski, S., Pomeroy, J. W., and Westbrook, C. J.: Hydrological regime changes in a Canadian Prairie basin, Hydrol. Process., 29, 3893–3904, 2015.
Dunn, S. M., McDonnell, J. J., and Vaché, K. B.: Factors influencing the residence time of catchment waters: A virtual experiment approach, Water Resour. Res., 43, W06408, https://doi.org/10.1029/2006WR005393, 2007.
Ehsanzadeh, E.: Impact of climate variability and wetland drainage on watershed response in depression dominated landscapes, Int. J. River Basin Manage., 16, 169–178, 2016.
Ehsanzadeh, E., Spence, C., van der Kamp, G., and McConkey, B.: On the behaviour of dynamic contributing areas and flood frequency cures in North American Prairie watersheds, J. Hydrol., 414–415, 364–373, 2012.
Ellis, C. R., Pomeroy, J. W., Brown, T., and MacDonald, J.: Simulation of snow accumulation and melt in needleleaf forest environments, Hydrol. Earth Syst. Sci., 14, 925–940, https://doi.org/10.5194/hess-14-925-2010, 2010.
Ellis, W. H. and Gray, D. M.: Interrelationships between the peak instantaneous and average daily discharges of small prairie streams, Canadian Agricultural Engineering, 1–3, 1966.
Fang, X. and Pomeroy, J. W.: Snowmelt runoff sensitivity analysis to drought on the Canadian prairies, Hydrol. Process., 21, 2594–2609, 2007.
Fang, X. and Pomeroy, J. W.: Drought impacts on Canadian prairie wetland snow hydrology, Hydrol. Process., 22, 2858–2873, 2008.
Fang, X. and Pomeroy, J. W.: Modelling blowing snow redistribution to prairie wetlands, Hydrol. Process., 23, 2557–2569, 2009.
Fang, X., Pomeroy, J. W., Westbrook, C. J., Guo, X., Minke, A. G., and Brown, T.: Prediction of snowmelt derived streamflow in a wetland dominated prairie basin, Hydrol. Earth Syst. Sci., 14, 991–1006, https://doi.org/10.5194/hess-14-991-2010, 2010.
Forbes, K. A., Kienzle, S. W., Coburn, C. A., Byrne, J. M., and Rasmussen, J. Simulating the hydrological response to predicted climate change on a watershed in southern Alberta, Canada, Climatic Change, 105, 555–576, 2011.
Gan, T. Y.: Hydroclimatic trends and possible climatic warming in the Canadian Prairies, Water Respur. Res., 34, 3009–3015, 1998.
Godwin, R. B. and Martin, F. R. J.: Calculation of gross and effective drainage areas for the Prairie Provinces, in: Canadian Hydrology Symposium – 1975 Proceedings, 11–14 August 1975, Winnipeg, Manitoba, Associate Committee on Hydrology, National Research Council of Canada, 219–223, 1975.
Gray, D. M. and Landine, P. G.: An energy-budget snowmelt model for the Canadian Prairies, Can. J. Earth Sci., 25, 1292–1303, 1988.
Gray, D. M., Landine, P. G., and Granger, R. J.: Simulating infiltration into frozen prairie soils in streamflow models, Can. J. Earth Sci., 22, 464–472, 1985.
Haque, A., Ali, G., and Badiou, P.: Hydrological dynamics of prairie pothole wetlands: Dominant processes and landscape controls under contrasted conditions, Hydrol. Process., 32, 2405–2422, 2017.
Hayashi, M. and van der Kamp, G.: Snowmelt contribution to groundwater recharge, in: The Science, Impacts and Monitoring of Drought in Western Canada, edited by: Sauchyn, D., Khandekar, M., and Garnett, E. R., Great Plains Research Centre, Regina, 2005.
He, Z., Spence, C., Shook, K., Whitfield, C., Pomeroy, J., and Wolfe, J.: Virtual Watershed Model Simulations for Typified Prairie Watersheds in High Elevation Grasslands, Federated Research Data Repository [data set and code], https://doi.org/10.20383/102.0517, 2021.
Horn, A. L., Hörmann, G., and Fohrer, N.: Application of a virtual watershed in academic education, Adv. Geosci., 5, 137–141, https://doi.org/10.5194/adgeo-5-137-2005, 2005.
Johnson, W. C., Millett, B. V., Gilmanov, T., Voldseth, R. A., Guntenspergen, G. R., and Naugle, D. E.: Vulnerability of northern prairie wetlands to climate change, Bioscience, 55, 863–872, 2005
Knoben, W. J. M., Woods, R. A., and Freer, J. E.: A Quantitative Hydrological Climate Classification Evaluated With Independent Streamflow Data, Water Resour. Res., 54, 5088–5109, 2018.
Lehner, B. and Grill, G.: Global river hydrography and network routing: baseline data and new approaches to study the world's large river systems, Hydrol. Process., 27, 2171–2186, 2013.
Li, L. and Pomeroy, J. W.: Probability of occurrence of blowing snow, J. Geophys. Res., 102, 21955–21964, 1997.
Li, Y., Li, Z., Zhang, Z., Chen, L., Kurkute, S., Scaff, L., and Pan, X.: High-resolution regional climate modeling and projection over western Canada using a weather research forecasting model with a pseudo-global warming approach, Hydrol. Earth Syst. Sci., 23, 4635–4659, https://doi.org/10.5194/hess-23-4635-2019, 2019.
López-Moreno, J. I., Pomeroy, J. W., Revuelto, J., and Vicente-Serrano, S. M.: Response of snow processes to climate change: spatial variability in a small basin in the Spanish Pyrenees, Hydrol. Process., 27, 2637–2650, 2012.
López-Moreno, J. I., Pomeroy, J. W., Alnso-González, E., Morán-Tejeda, E., and Revuelto, J.: Decoupling of warming mountain snowpacks from hydrological regimes, Environ. Res. Lett., 15, 114006, https://doi.org/10.1088/1748-9326/abb55f, 2020.
Male, D. H. and Gray, D. M. (Eds.): Snowcover ablation and runoff, in: Handbook of Snow: Principles, Processes, Management and Use, Pergamon Press, Toronto, 776 pp., ISBN 10 1932846069, 1981.
Mallard, J., McGlynn, B., and Covino, T.: Lateral inflows, stream-groundwater exchange, and network geometry influence stream water composition, Water Resour. Res., 50, 4603–4623, 2014.
Mantyka-Pringle, C., Leston, L., Messmer, D., Asong, E., Bayne, E. M., Bortolotti, L. E., Sekulic, G., Wheater, H., Howerter, D. W., and Clark, R. G.: Antagonistic, synergistic and direct effects of land use and climate on prairie wetland ecosystems: Ghosts of the past or present?, Divers. Distrib., 25, 1924–1940, https://doi.org/10.1111/ddi.12990, 2019.
McDonnell, J. J. and Woods, R.: On the need for catchment classification, J. Hydrol., 299, 2–3, 2004.
Mekis, É. and Vincent, L. A.: An overview of the second generation adjusted daily precipitation dataset for trend analysis in Canada, Atmos.-Ocean, 49, 163–177, 2011.
Millett, B., Johnson, W. C., and Guntenspergen, G.: Climate trends of the North American prairie pothole region 1906–2000, Climatic Change, 93, 243–267, 2009.
Monteith, J. L.: Evaporation and environment, in: Symposia of the Society for Experimental Biology, V. 19, Cambridge University Press, Cambridge, 205–234, 1965.
Muhammad, A., Evenson, G. R., Stadnyk, T. A., Boluwade, A., Jha, S. K., and Coulibaly, P.: Assessing the importance of potholes in the Canadian Prairie Region under future climate change scenarios, Water, 10, 1657, https://doi.org/10.3390/w10111657, 2018.
Muzik, I.: Sensitivity of hydrologic systems to climate change, Can. Water Resour. J., 26, 233–252, 2001.
Naeth, M. A. and Chanasyk, D. S.: Runoff and sediment yield under grazing in foothills fescue grasslands of Alberta, J. Am. Water Resour. Assoc., 32, 89–95, 1996.
Najafi, M. R., Zwiers, F., and Gillett, N.: Attribution of the observed spring snowpack decline in British Columbia to anthropogenic climate change, J. Climate, 30, 4113–4130, 2017.
Pavlovskii, I., Hayashi, M., and Itenfisu, D.: Midwinter melts in the Canadian prairies: energy balance and hydrological effects, Hydrol. Earth Syst. Sci., 23, 1867–1883, https://doi.org/10.5194/hess-23-1867-2019, 2019.
Pomeroy, J., Fang, X., Shook, K., Westbrook, C., and Brown, T.: Informing the Vermilion River watershed plan through application of the Cold Regions Hydrological Model platform, Centre for Hydrology Report No. 12, University of Saskatchewan, Saskatoon, 155 pp., https://research-groups.usask.ca/hydrology/publications/reports.php (last access: 31 March 2022), 2012.
Pomeroy, J. W. and Li, L.: Prairie and arctic areal snow cover mass balance using a blowing snow model, J. Geophys. Res.-Atmos., 105, 26619–26634, 2000.
Pomeroy, J. W., Granger, R., Pietroniro, A., Elliott, J., Toth, B., and Hedstrom, N.: Classification of the boreal forest for hydrological processes, in: Proceedings of the Ninth International Boreal Forest Research Association Conference, edited by: Woxholtt, S., 21–23 September 1998, Oslo, 49–59, 1999.
Pomeroy, J. W., de Boer, D., and Martz, L. W.: Hydrology and Water Resources of Saskatchewan, Centre for Hydrology Report No. 1, University of Saskatchewan, Saskatoon, 25 pp., https://research-groups.usask.ca/hydrology/publications/reports.php (last access: 31 March 2022), 2005.
Pomeroy, J. W., Gray, D. M., Brown, T., Hedstrom, N. H., Quinton, W. L., Granger, R. J., and Carey, S. K.: The cold regions hydrological model: a platform for basing process representation and model structure on physical evidence, Hydrol. Process., 21, 2650–2667, 2007.
Pomeroy, J. W., Fang, X., and Williams, B.: Impacts of Climate Change on Saskatchewan's Water Resources, Centre for Hydrology Report No. 6, University of Saskatchewan, Saskatoon, 46 pp., https://research-groups.usask.ca/hydrology/publications/reports.php (last access: 31 March 2022), 2009.
Pomeroy, J. W., Fang, X., Westbrook, C., Minke, A., Guo, X., and Brown, T.: Prairie Hydrological Model Study Final Report, Centre for Hydrology Report No. 7, University of Saskatchewan, Saskatoon, 113 pp., https://research-groups.usask.ca/hydrology/publications/reports.php (last access: 31 March 2022), 2010.
Priestley, C. H. B. and Taylor, R. J.: On the assessment of surface heat flux and evaporation using large-scale parameters, Mon. Weather Rev., 100, 81–92, 1972.
Rasouli, K., Pomeroy, J. W., Janowicz, J. R., Carey, S. K., and Williams, T. J.: Hydrological sensitivity of a northern mountain basin to climate change, Hydrol. Process., 28, 4191–4208, 2014.
Seo, Y. and Schmidt, A. R.: Network configuration and hydrograph sensitivity to storm kinematics, Water Resour. Res., 49, 1812–1827, 2013.
Shaw, D. A., Vanderkamp, G., Conly, F. M., Pietroniro, A., and Martz, L.: The fill–spill hydrology of prairie wetland complexes during drought and deluge, Hydrol. Process., 26, 3147–3156, 2012.
Shook, K. R. and Pomeroy, J. W.: Hydrological effects of the temporal variability of the multiscaling of snowfall on the Canadian prairies, Hydrol. Earth Syst. Sci., 14, 1195–1203, https://doi.org/10.5194/hess-14-1195-2010, 2010.
Shook, K. R. and Pomeroy, J. W.: Memory effects of depressional storage in Northern Prairie hydrology, Hydrol. Process., 25, 3890–3898, https://doi.org/10.1002/hyp.8381, 2011.
Shook, K. R. and Pomeroy, J. W.: Changes in the hydrological character of rainfall on the Canadian prairies, Hydrol. Process., 26, 1752–1766, 2012.
Shook, K. R., Pomeroy, J. W., Spence, C., and Boychuk, L.: Storage dynamics simulations in prairie wetland hydrology models: evaluation and parameterization, Hydrol. Process., 27, 1875–1889, 2013.
Sicart, J. E., Essery, R. L., Pomeroy, J. W., Hardy, J., Link, T., and Marks, D.: A sensitivity study of daytime net radiation during snowmelt to forest canopy and atmospheric conditions, J. Hydrometeorol., 5, 774–784, 2004.
Spence, C. and Mengistu, S. G.: On the relationship between flood and contributing area, Hydrol. Process., 33, 1980–1992, 2019.
Spence, C., Wolfe, J. D., Whitfield, C. J., Baulch, H. M., Basu, N. B., Bedard-Haughn, A. K., Belcher, K. W., Clark, R. G., Ferguson, G. A., Hayashi, M., Liber, K., McDonnell, J. J., Morrisey, C .A., Pomeroy, J. W., Reed, M. G. and Strickert, G.: Prairie water: a global water futures project to enhance the resilience of prairie communities through sustainable water management, Can. Water Resour. J., 44, 115–126, 2019.
Stichling, W. and Blackwell, S. R.: Drainage area as a hydrologic factor on the Canadian prairies, IUGG Proceedings, Toronto, Ontario, 1957.
Tiner, R. W.: Geographically isolated wetlands of the United States, Wetlands, 23, 494–516, 2003.
van Meter, K. J. and Basu, N.: Signatures of human impact: size distribution and spatial organization of wetlands in the Prairie Pothole landscape, Ecol. Appl., 25, 451–465, 2015.
Vincent, L. A., Wang, X. L., Milewska, E. J., Wan, H., Yang, F., and Swail, V.: A second generation of homogenized Canadian monthly surface air temperature for climate trend analysis, J. Geophys. Res., 117, D18110, https://doi.org/10.1029/2012JD017859, 2012.
Wagener, T., Sivapalan, M., Troch, P., and Woods, R.: Catchment classification and hydrologic similarity, Geogr. Compass, 1, 901–931, 2007.
Walmsley, J. L., Taylor, P. A., and Salmon, J. R.: Simple guidelines for estimating windspeed variations due to small-scale topographic features – an update, Climatolog. Bull., 23, 3–14, 1989.
Weiler, M. and McDonnell, J. J.: Virtual experiments: a new approach for improving process conceptualization in hillslope hydrology, J. Hydrol., 285, 3–18, 2004.
Weiler, M. and McDonnell, J. J.: Testing nutrient flushing hypotheses at the hillslope scale: A virtual experiment approach, J. Hydrol., 319, 339–356, 2006.
Whitfield, P. H., Shook, K. R., and Pomeroy, J. W.: Spatial patterns of temporal changes in Canadian Prairie streamflow using an alternative trend assessment approach, J. Hydrol., 582, 124541, https://doi.org/10.1016/j.jhydrol.2020.124541, 2020.
Whitfield, P. H., Kraaijenbrink, P. D. A., Shook, K. R., and Pomeroy, J. W.: The spatial extent of hydrological and landscape changes across the mountains and prairies of Canada in the Mackenzie and Nelson River basins based on data from a warm-season time window, Hydrol. Earth Syst. Sci., 25, 2513–2541, https://doi.org/10.5194/hess-25-2513-2021, 2021.
Wilson, H. F., Casson, N. J., Glenn, A. J., Badiou, P., and Boychuk, L.: Landscape controls on nutrient expot during snowmelt and an extreme rainfall runoff event in northen agricultural watersheds, J. Environm. Qual., 48, 841–849, 2019.
Wolfe, J. D., Shook, K. R., Spence, C., and Whitfield, C. J.: A watershed classification approach that looks beyond hydrology: application to a semi-arid, agricultural region in Canada, Hydrol. Earth Syst. Sci., 23, 3945–3967, https://doi.org/10.5194/hess-23-3945-2019, 2019.
Woo, M. K. and Rowsell, R. D.: Hydrology of a prairie slough, J. Hydrol., 146, 175–207, 1993.
Zhang, B., Schwartz, F. W., and Liu, G.: Systematics in the size structure of prairie pothole lakes through drought and deluge, Water Resour. Res., 45, 1–12, 2009.
Zhang, H., Huang, G. H., Wang, D., and Zhang, X:. Uncertainty assessment of climate change impacts on the hydrology of small prairie wetlands, J. Hydrol., 396, 94–103, 2011.
Zhang, X., Flato, G., Kirchmeier-Young, M.,Vincent, L., Wan, H., Wang, X., Rong, R., Fyfe, J., Li, G., and Kharin, V. V.: Changes in Temperature and Precipitation Across Canada in: Chap. 4, Canada's Changing Climate Report, edited by: Bush, E. and Lemmen, D. S., Government of Canada, Ottawa, Ontario, 112–193, https://changingclimate.ca/CCCR2019/ (last access: 31 March 2022), 2019.