the Creative Commons Attribution 4.0 License.
the Creative Commons Attribution 4.0 License.
 | 13 Jan 2022
Performance of the Global Forecast System's medium-range precipitation forecasts in the Niger river basin using multiple satellite-based products
Haowen Yue
Mekonnen Gebremichael
Vahid Nourani
Accurate weather forecast information has the potential to improve water resources management, energy, and agriculture. This study evaluates the accuracy of medium-range (1–15 d) precipitation forecasts from the Global Forecast System (GFS) over watersheds of eight major dams (Selingue Dam, Markala Dam, Goronyo Dam, Bakolori Dam, Kainji Dam, Jebba Dam, Dadin Kowa Dam, and Lagdo Dam) in the Niger river basin using NASA's Integrated Multi-satellitE Retrievals (IMERG) Final Run merged satellite gauge rainfall observations. The results indicate that the accuracy of GFS forecast varies depending on climatic regime, lead time, accumulation timescale, and spatial scale. The GFS forecast has large overestimation bias in the Guinea region of the basin (wet climatic regime), moderate overestimation bias in the Savannah region (moderately wet climatic regime), but has no bias in the Sahel region (dry climate). Averaging the forecasts at coarser spatial scales leads to increased forecast accuracy. For daily rainfall forecasts, the performance of GFS is very low for almost all watersheds, except for Markala and Kainji dams, both of which have much larger watershed areas compared to the other watersheds. Averaging the forecasts at longer timescales also leads to increased forecast accuracy. The GFS forecasts, at 15 d accumulation timescale, have better performance but tend to overestimate high rain rates. Additionally, the performance assessment of two other satellite products was conducted using IMERG Final estimates as reference. The Climate Hazards Group InfraRed Precipitation with Station data (CHIRPS) merged satellite gauge product has similar rainfall characteristics to IMERG Final, indicating the robustness of IMERG Final. The IMERG Early Run satellite-only rainfall product is biased in the dry Sahel region; however, in the wet Guinea and Savannah regions, IMERG Early Run outperforms GFS in terms of bias.
- Article
(10014 KB) - Full-text XML
- BibTeX
- EndNote


Global climate forecasts, with lead times ranging from hours to several months, are becoming increasingly available (Saha et al., 2014; Haiden et al., 2021; NCEP, 2015; JMA, 2019). Significant societal benefit could be realized from research to reduce common barriers in climate forecast utilization that block the path to improving water resources management, energy, and agriculture. One such a barrier is the lack of understanding of climate forecast accuracy in different regions of the world. This focus is timely, given the recent advances in numerical atmospheric models and in the wealth of new observing capabilities, including satellite remote sensing. These combined models and observational datasets provide an opportunity for researchers to quantify the accuracy of climate forecasts.
The Niger river is the principal river of West Africa and is shared among nine riparian countries (Fig. 1), namely Benin, Burkina Faso, Cameroon, Chad, Guinea, Côte D'Ivoire, Mali, Niger, and Nigeria. The basin is facing multiple pressures from increasing population, water abstraction for irrigation, and the risk of extreme hydrological events due to climate change (Sylla et al., 2018). A number of hydropower dams exist in the region, and additional dam projects are envisaged in order to alleviate chronic power shortages in the countries of the Niger basin. Optimal management of water resources is key to maximizing the benefits, such as hydropower generation, and minimizing the disasters, such as flooding. Climate forecast information has the potential to improve water resources management, energy, and agriculture (e.g., Patt et al., 2007; Breuer et al., 2010; Mase and Prokopy, 2014; Pandya et al., 2015; Koppa et al., 2019; Alexander et al., 2020). For example, in a recent study, Koppa et al. (2019) showed that the use of seasonal precipitation forecasts in the reservoir planning of the Omo Gibe I in Ethiopia can increase annual hydropower generation by around 40 %.
Several studies have investigated the accuracy of seasonal forecasts in West Africa (e.g., Bliefernicht et al., 2019; Pirret et al., 2020). Seasonal forecasts are important for water resource planning, while medium-range (1 to 15 d) forecasts are important for operational decisions, such as reservoir operations. The availability of medium-range global climate forecasts has grown in recent years. Examples of such forecast products include the Global Forecast System (GFS; NCEP, 2015), NCEP (National Centers for Environmental Prediction) Climate Forecast System (CFS; Saha et al., 2014), the European Centre for Medium-Range Weather Forecasts (ECMWF; Haiden et al., 2021), and the Global Spectral Model (GSM; JMA, 2019). For these precipitation forecasts to be effectively used in applications, their accuracy must be known, which is usually performed through comparison of precipitation forecasts to observations (e.g., Tian et al., 2017; Yuan et al., 2014). Wang et al. (2019) performed a numerical experiment to examine the sensitivity of GFS to the inclusion or exclusion of additional observations collected over the eastern Pacific during the El Niño Rapid Response (ENRR) field campaign, the type of data assimilation method to prepare the initial conditions, and the inclusion or exclusion of stochastic parameterizations in the forecast model. They reported that the GFS forecast errors are only slightly sensitive to the additional ENRR observations, more sensitive to the DA methods, and most sensitive to the inclusion of stochastic parameterizations in the model. In addition, they reported that GFS forecasts have difficulty in capturing the location and magnitude of heavy rain rates. Sridevi et al. (2018) evaluated the performance of GFS in India by using a rain gauge and satellite rainfall product and reported that the GFS forecast shows some skills with 1 and 2 d lead times but low skills from 3 d onwards. Lien et al. (2016) compared the statistical properties of GFS forecasts and Tropical Rainfall Measuring Mission (TRMM) Multisatellite Precipitation Analysis (TMPA; Huffman et al., 2007, 2010) observations. They reported that the GFS model has a positive bias in the precipitation amount compared to TMPA observations, and that the GFS forecasts have large random errors at higher resolutions, especially for convective precipitation. According to Jiang et al. (2017) the lack of consideration of the aerosol–cloud interactions (ACIs) in the GFS model leads to significant bias in the GFS precipitation forecasts.
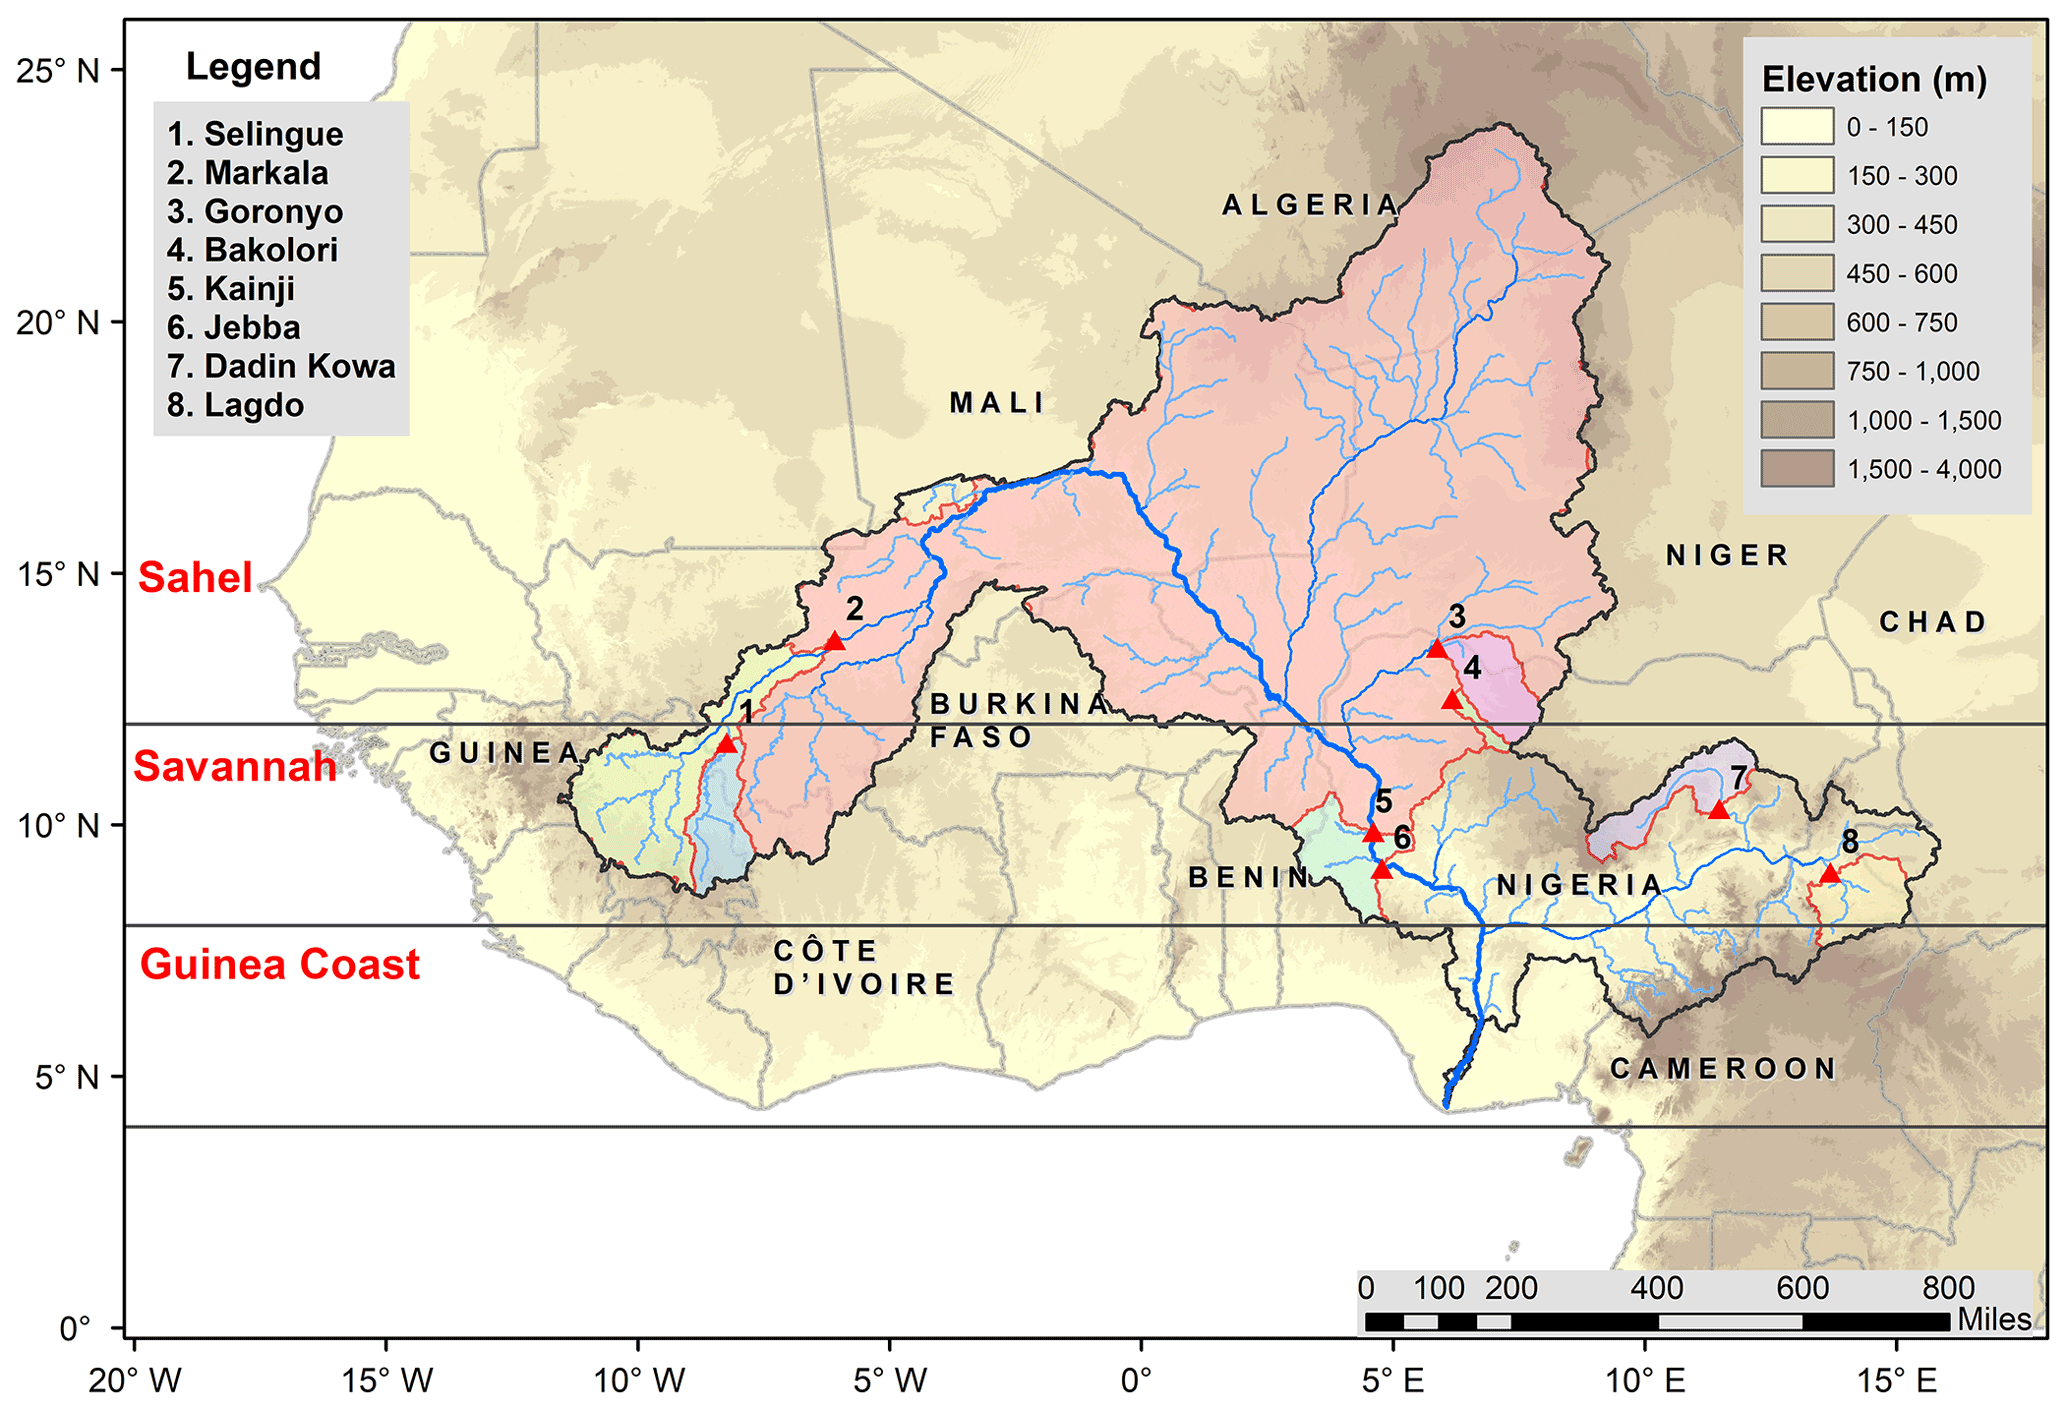
Figure 1The Niger river basin and locations of major reservoir dams in the basin. (1) Selingue, (2) Markala, (3) Goronyo, (4) Bakolori, (5) Kainji, (6) Jebba, (7) Dadin Kowa, and (8) Lagdo.
In our study region of the Niger river basin, there has not been any performance evaluation of GFS precipitation forecasts to date. The Niger basin lies in three different climate regimes (wet regime, moderately wet regime, and dry regime) and is home to nine major irrigation and hydropower dams (Selingue, Markala, Goronyo, Bakolori, Kainji, Jebba, Dadin Kowa, and Lagdo). Recent advances in satellite rainfall products, particularly following the Global Precipitation Measurement mission (GPM; Hou et al., 2014), and an extensive evaluation of GPM rainfall products in West Africa provides us with an opportunity to use GPM rainfall products as a reference for our evaluation. Many studies have been conducted to evaluate the accuracy of the satellite rainfall estimates in West Africa. Dezfuli et al. (2017a) evaluated the performance of NASA's Integrated Multi-satellitE Retrievals (IMERG) Final Run (IMERG Final; version 4; Huffman et al., 2019a, b) through comparison with two, high-resolution, experimental rain gauge station datasets, provided by the Trans-African Hydro-Meteorological Observatory (TAHMO; van de Giesen et al., 2014), and reported the capability of IMERG Final to represent the diurnal cycle of rainfall well. Using the same dataset, Dezfuli et al. (2017b) showed that IMERG Final is able to capture the propagation of large mesoscale convective systems (MCSs), a significant advantage over its predecessor's (TMPA) 3 h temporal resolution, which misses the time evolution of most of these systems. Gossett et al. (2018) evaluated the performance of a number of satellite rainfall products (focusing only on versions that do not include rain gauge data), through comparison with rain gauge station networks in Benin and Niger, and reported that the satellite products (especially IMERG Early) exhibit a high performance in Niger but a relatively lower performance in Benin. Satgé et al. (2020) evaluated the accuracy of a number of gridded precipitation datasets over West Africa through comparison against rain gauge station data and reported that the Climate Hazards Group InfraRed Precipitation with Station data (CHIRPS) and TMPA (the predecessor to IMERG) provided reliable estimates at both daily and monthly timescales, while the remaining satellite products considered (Climate Prediction Center MORPHing – CMORPH; Precipitation Estimates from Remotely Sensed Information using Artificial Neural Network and Climate Data Record – PERSIANN; Global Satellite Mapping of Precipitation standard – GSMaP; Africa Rainfall Climatology – ARC; Tropical Applications of Meteorology using SATellite and ground-based observation – TAMSAT) and all atmospheric reanalysis products considered (Modern-Era Retrospective analysis for Research and Applications – MERRA; Japanese 55-year Reanalysis – JRA-55) were deemed unreliable. Furthermore, they found out that satellite products that incorporated rain gauge information outperformed satellite-only products. Maranan et al. (2020) compared the IMERG Final products against experimental rain gauge station data in the moist forest region of Ghana, West Africa, and showed that IMERG Final datasets are able to capture monthly rainfall with a correlation coefficient close to unity.
The objective of this study is to evaluate the accuracy of medium-range precipitation forecasts derived from the Global Forecast System (GFS) for the major reservoir dams of the Niger basin through comparison against IMERG Final. We chose GFS model due to its relatively high spatial (0.25∘ × 0.25∘) and temporal resolution (3 to 6 h), as well as the free-of-charge data availability to users. The main questions addressed in this study are as follows. First, how does the accuracy of GFS forecast vary across different reservoir dams in the same basin? Second, how does the accuracy vary with lead time in the range 1 to 15 d? Third, what is the effect of spatial averaging (from 0.25∘ all the way to basin scale) and temporal aggregation (from 1 to 15 d) on the forecast accuracy? Fourth, how does the accuracy of GFS forecast compare with the accuracy of satellite-only rainfall products that are available in near-real time, as the latter may have the potential to calibrate and improve the accuracy of GFS?
2.1 Global Forecast System (GFS) medium-range precipitation forecasts
The Global Forecast System (GFS) is a global numerical weather prediction system run by the U.S. National Weather Service (NWS). The GFS forecast products, with a resolution of 0.25∘ by 0.25∘, are obtained from National Center for Atmospheric Research (NCAR) Research Data Archive (RDA) GFS 0.25∘ Global Forecast Grids Historical Archive (NCEP, 2015). The GFS is run 4 times a day at 00:00, 06:00, 12:00, and 18:00 UTC. One of the GFS model output variables is accumulated precipitation, where the precipitation forecasts are accumulations starting from the model runtime. We obtained the 1 d lead daily rainfall forecast by subtracting the 24 h rainfall accumulation forecast from the 48 h rainfall accumulation forecast. Similarly, in order to obtain the 5 d lead daily rainfall forecast, we subtracted the 120 h rainfall accumulation forecast from the 144 h rainfall forecast. We only considered the model runs at 00:00 UTC.
The GFS model went through a major upgrade, and its version 15 forecasts have been available since 12 June 2019. In version 15, the Finite-Volume Cubed-Sphere (FV3) dynamical core replaced the Global Spectral Model (GSM) as the core model. In the GSM model, the horizontal resolutions were T1543 (12.5 km), from 0 to 240 h (0–10 d), and T574 (∼ 34 km), from 240 to 384 h (10–16 d; NCEP, 2021a). However, in the FV3 model, the horizontal resolution of the model is about 13 km for days 0–16 (NCEP, 2021b). The model runs are regridded to produce precipitation forecasts at 0.25∘ resolution (NCEP, 2015). The key FV3 model schemes include the following (Putman and Lin, 2007): (1) the rapid radiative transfer method for GCMs (RRTMG) scheme for shortwave/longwave radiation (Mlawer et al., 1997; Iacono et al., 2000; Clough et al., 2005), (2) the hybrid eddy-diffusivity mass-flux (EDMF) scheme for planetary boundary layer (PBL; NCEP, 2021a), (3) the Noah land surface model (LSM) scheme for land surface option (Chen et al., 1997), (4) the Simplified Arakawa–Schubert (SAS) deep convection for cumulus parameterization (Arakawa and Schubert, 1974; Grell, 1993), and (5) an advanced Geophysical Fluid Dynamics Laboratory (GFDL) microphysics scheme for microphysics (NCEP, 2021b).
2.2 IMERG Final satellite precipitation products
IMERG Final rainfall products are used in this study as a reference to evaluate the performance of GFS precipitation forecasts. IMERG Final combines all available microwave precipitation estimates, microwave-calibrated infrared estimates, and rain gauge data to provide rainfall estimates at very high resolution (30 min, 0.10∘; Hou et al., 2014; Huffman et al., 2015). The IMERG products are categorized into three types, namely early run, late run, and final run. It is only the final run or final version that incorporates rain gauge data. The data latency of IMERG Final is about 3.5 months. Details of the IMERG algorithm developed by NASA are available in Huffman et al. (2019a, b). The latest version (V6B) of the IMERG datasets has been accessed from the NASA's Earth Data Goddard Earth Sciences Data and Information Services Center (GES DISC) web portal (Huffman et al., 2019a, b; see the data availability section at the end of the paper for details).
2.3 Other satellite precipitation products
In order to put the GFS forecast performance into perspective, we also evaluated two other state-of-the-art satellite rainfall products.
-
IMERG Early provides uncalibrated IMERG rainfall fields which do not include correction from rain gauges. The data latency of IMERG Early is near-real time (about 4 h). We have used the latest version (V6B) of IMERG Early datasets. Post-processing calibration of GFS forecasts (in order to improve the accuracy of GFS forecasts) requires the use of relatively better performing and available in near-real time independent rainfall observations to correct real-time dynamical GFS model forecasts. A comparison of the performance of IMERG Early with the performance of GFS would indicate to what extent the IMERG Early products could be used for the calibration of GFS forecasts.
-
The Climate Hazards Group InfraRed Precipitation with Station data (CHIRPS) are derived primarily from thermal infrared data using the cold cloud duration (CCD) approach, which is calibrated using TRMM Multisatellite Precipitation Analysis (TMPA 3B42-V7; Huffman et al., 2007) precipitation datasets by local regression, and include rain gauge station data from multiple sources (regional and national meteorological services). CHIRPS data are available at a spatial resolution of 0.05∘ and a temporal resolution of 1 d, with a data latency period of about 3 weeks. Details of the CHIRPS algorithm are available in Funk et al. (2015). The agreement between the reference (IMERG Final) and CHIRPS would indicate that the IMERG Final estimates are robust.
2.4 Study region
The Niger river, with a drainage basin of 2 117 700 km2, is the third-longest river in Africa. The source of the main river is in the Guinea Highlands, and it runs through Mali, Niger, on the border with Benin, and then through Nigeria, discharging through a massive delta, known as the Niger Delta (the world's third-largest wetland), into the Atlantic Ocean. The rainfall regimes in the region follow the seasonal migration of the Intertropical Convergence Zone (ITCZ), which brings rainfall primarily in the summer season (Animashaun et al., 2020; Sorí et al., 2017). Climatologically, the Niger basin lies in the following three latitudinal subregions (Akinsanola et al., 2015, 2017): (1) the Guinea coast (latitude 4–8∘ N), which borders the tropical Atlantic Ocean in the south; (2) the Savannah (latitude 8–12∘ N), which is an intermediate subregion; and (3) the Sahel (latitude >12∘ N), which lies to the north. The Guinea coast experiences a bimodal rainfall regime that is centered in the summer monsoon period of June–September, with August being the period of a short dry season, while the Savannah and Sahel subregions experience a unimodal rainfall regime, with maximum rainfall occurring in August (Akinsanola and Zhou, 2018). The ranges of annual rainfall amounts are 400–600 mm in the Sahel, 900–1200 mm in the Savannah, and 1500–2000 mm in the Guinea coast (Akinsanola et al., 2017).
The Niger basin is home to eight major reservoir dams (see Table 1 and Fig. 1), including the following: (1) Selingue Dam in Mali, which is primarily a hydropower dam; (2) Markala Dam in Mali, which is primarily an irrigation dam that serves about 75 000 ha of farmland; (3) Goronyo Dam in Nigeria, which is a multipurpose dam for flood control, the provision of downstream water supply, and the release of water for irrigation in the dry season; (4) Bakolori Dam in Nigeria, which is primarily an irrigation dam with a command area of about 23 000 ha; (5) Kainji Dam in Nigeria, which is the largest dam on the Niger supplying power for most towns in Nigeria; (6) Jebba Dam in Nigeria, which is primarily a hydropower dam; (7) Dadin Kowa Dam, which is a multipurpose dam for water supply, electricity, and irrigation; and (8) Lagdo Dam in Cameroon, which is a multipurpose dam providing electricity to the northern part of the country and supplying irrigation water for 15 000 ha of cropland. The watersheds of the dams are primarily either in the Savanna (Selingue, Markala, Jebba, Dadin Kowa, and Lagdo), in the Sahel (Goronyo and Kainji), or partly in both (Bakolori). The watershed sizes vary over a large range, from 4887 km2 (Bakolori) to 1 464 092 km2 (Kainji). The average elevations of the watersheds are close to each other at 500±50 m a.s.l. (above sea level).
In order to make the results of this study meaningful to reservoir managers, the Niger basin was divided into watersheds according to the locations of the dam reservoirs (see Fig. 1). Then the subbasin of each dam was defined as the drainage between the dam itself and the upstream dam. For example, the drainage basin of the Markala Dam does not include the drainage basin of the Selingue Dam.
Table 1Selected dams and their watershed characteristics.
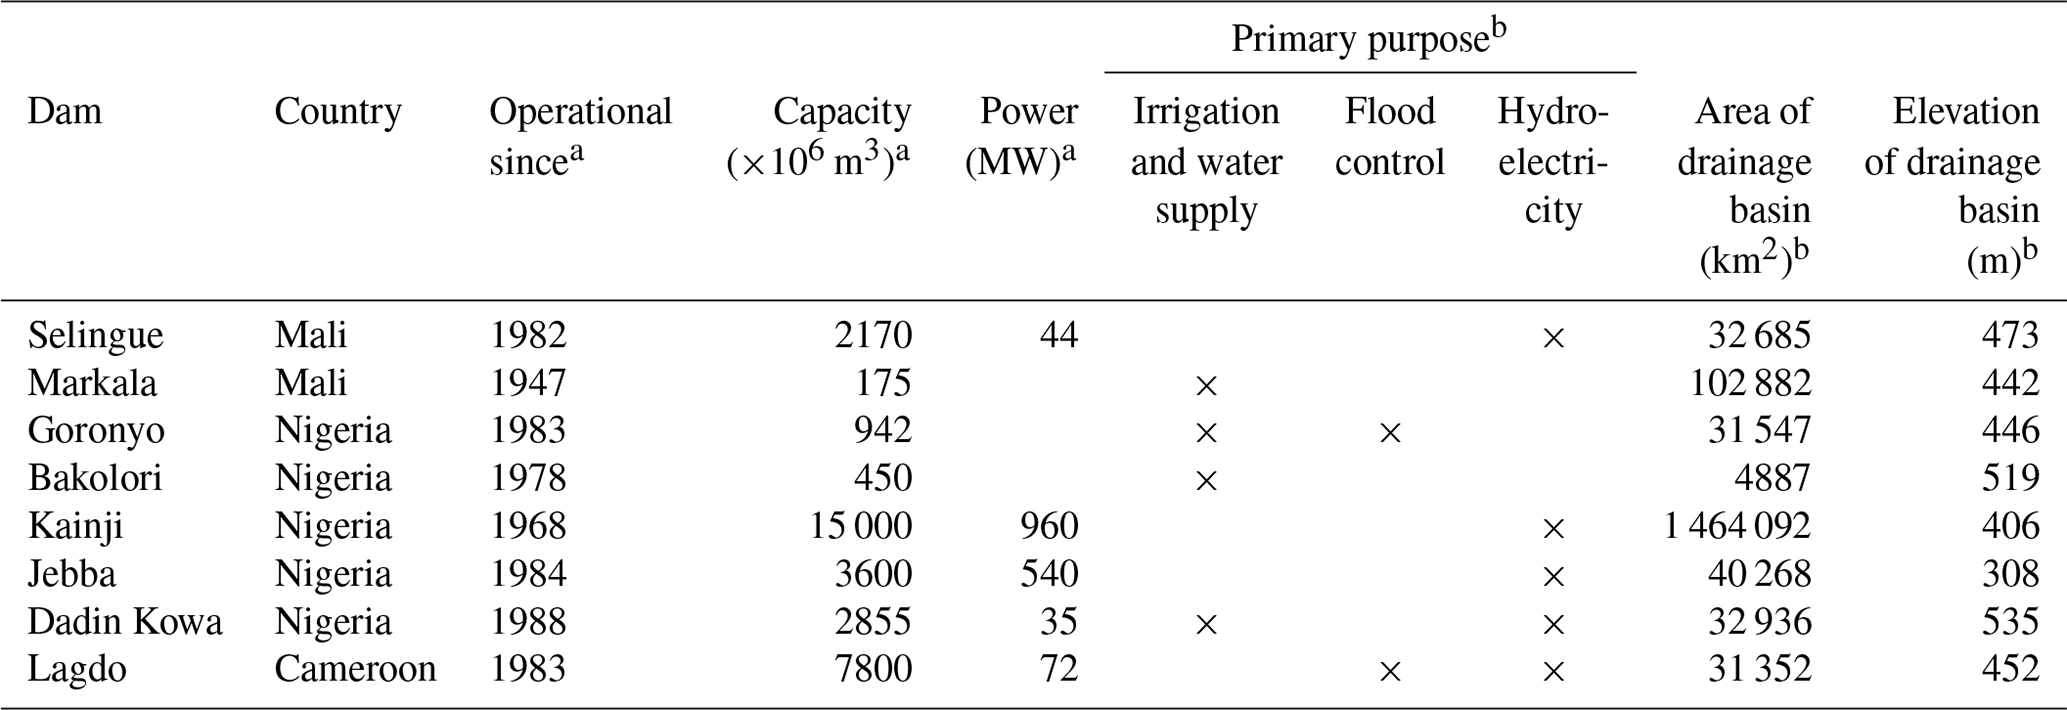
a Information obtained from the Global Reservoir and Dam Database (Lehner et al., 2011) and the Global Information System on Water and Agriculture (AQUASTAT) of the Food and Agriculture Organization (FAO) of the United Nations. b Calculated from HydroSHEDS (Lehner et al., 2008).
2.5 Evaluation
IMERG Final rainfall products are used in this study as a reference to evaluate the performance of GFS precipitation forecasts. The comparison period is 15 June 2019 to 15 June 2020 to match the period for which version 15 of GFS model forecasts is available. The spatial resolutions of the forecast and satellite products are different, namely 0.25∘ (GFS), 0.10∘ (IMERG Final and IMERG Early), and 0.05∘ (CHIRPS). The temporal resolutions of the satellite products are 30 min (IMERG Final and IMERG Early) and daily (CHIRPS). Our comparison is mostly based on the subbasin (i.e., watershed for each dam) average values, for which case we average all the datasets to the subbasin spatial scale. In some cases, where we compare the spatial patterns of rainfall, we resample both IMERG products and CHIRPS to 0.25∘, using the bilinear interpolation technique to match the spatial resolution of GFS.
For evaluation metrics, we used the modified Kling–Gupta efficiency (KGE; Gupta et al., 2009; Kling et al., 2012) and its components, i.e., the bias ratio (BR), correlation (R), and variability ratio (γ). KGE measures the goodness of fit between estimates of precipitation forecasts and reference observations as follows:
where R is the linear correlation coefficient between forecasted and observed precipitation, BR is the bias ratio, γ is the variability ratio, μ is the mean precipitation, CV is the coefficient of variation, and the indices f and o represent forecasted and observed precipitation values, respectively. KGE values range from −∞ to 1, with values closer to 1 indicating better model performance. Towner et al. (2019) suggested the following classifications: good (KGE ≥ 0.75), intermediate (0.75 ≥ KGE ≥ 0.5), poor (0.5 ≥ KGE > 0), and very poor (KGE ≤ 0). The BR values greater than 1 indicate a positive bias, whereby forecasts overestimate precipitation relative to the observed data, while values less than 1 represent an underestimation. The γ values greater than 1 indicate that the variability in the forecast time series is higher than that observed, and values less than 1 show the opposite effect. The R measures the strength and direction of the linear relationship between the forecast and observed values, and to what extent the temporal dynamics of observed rainfall is captured in the forecasts. The correlation values of 0.6 or more are considered to be skillful (e.g., Alfieri et al., 2013). In addition, the root mean square error normalized by reference precipitation mean (NRMSE) was also used.
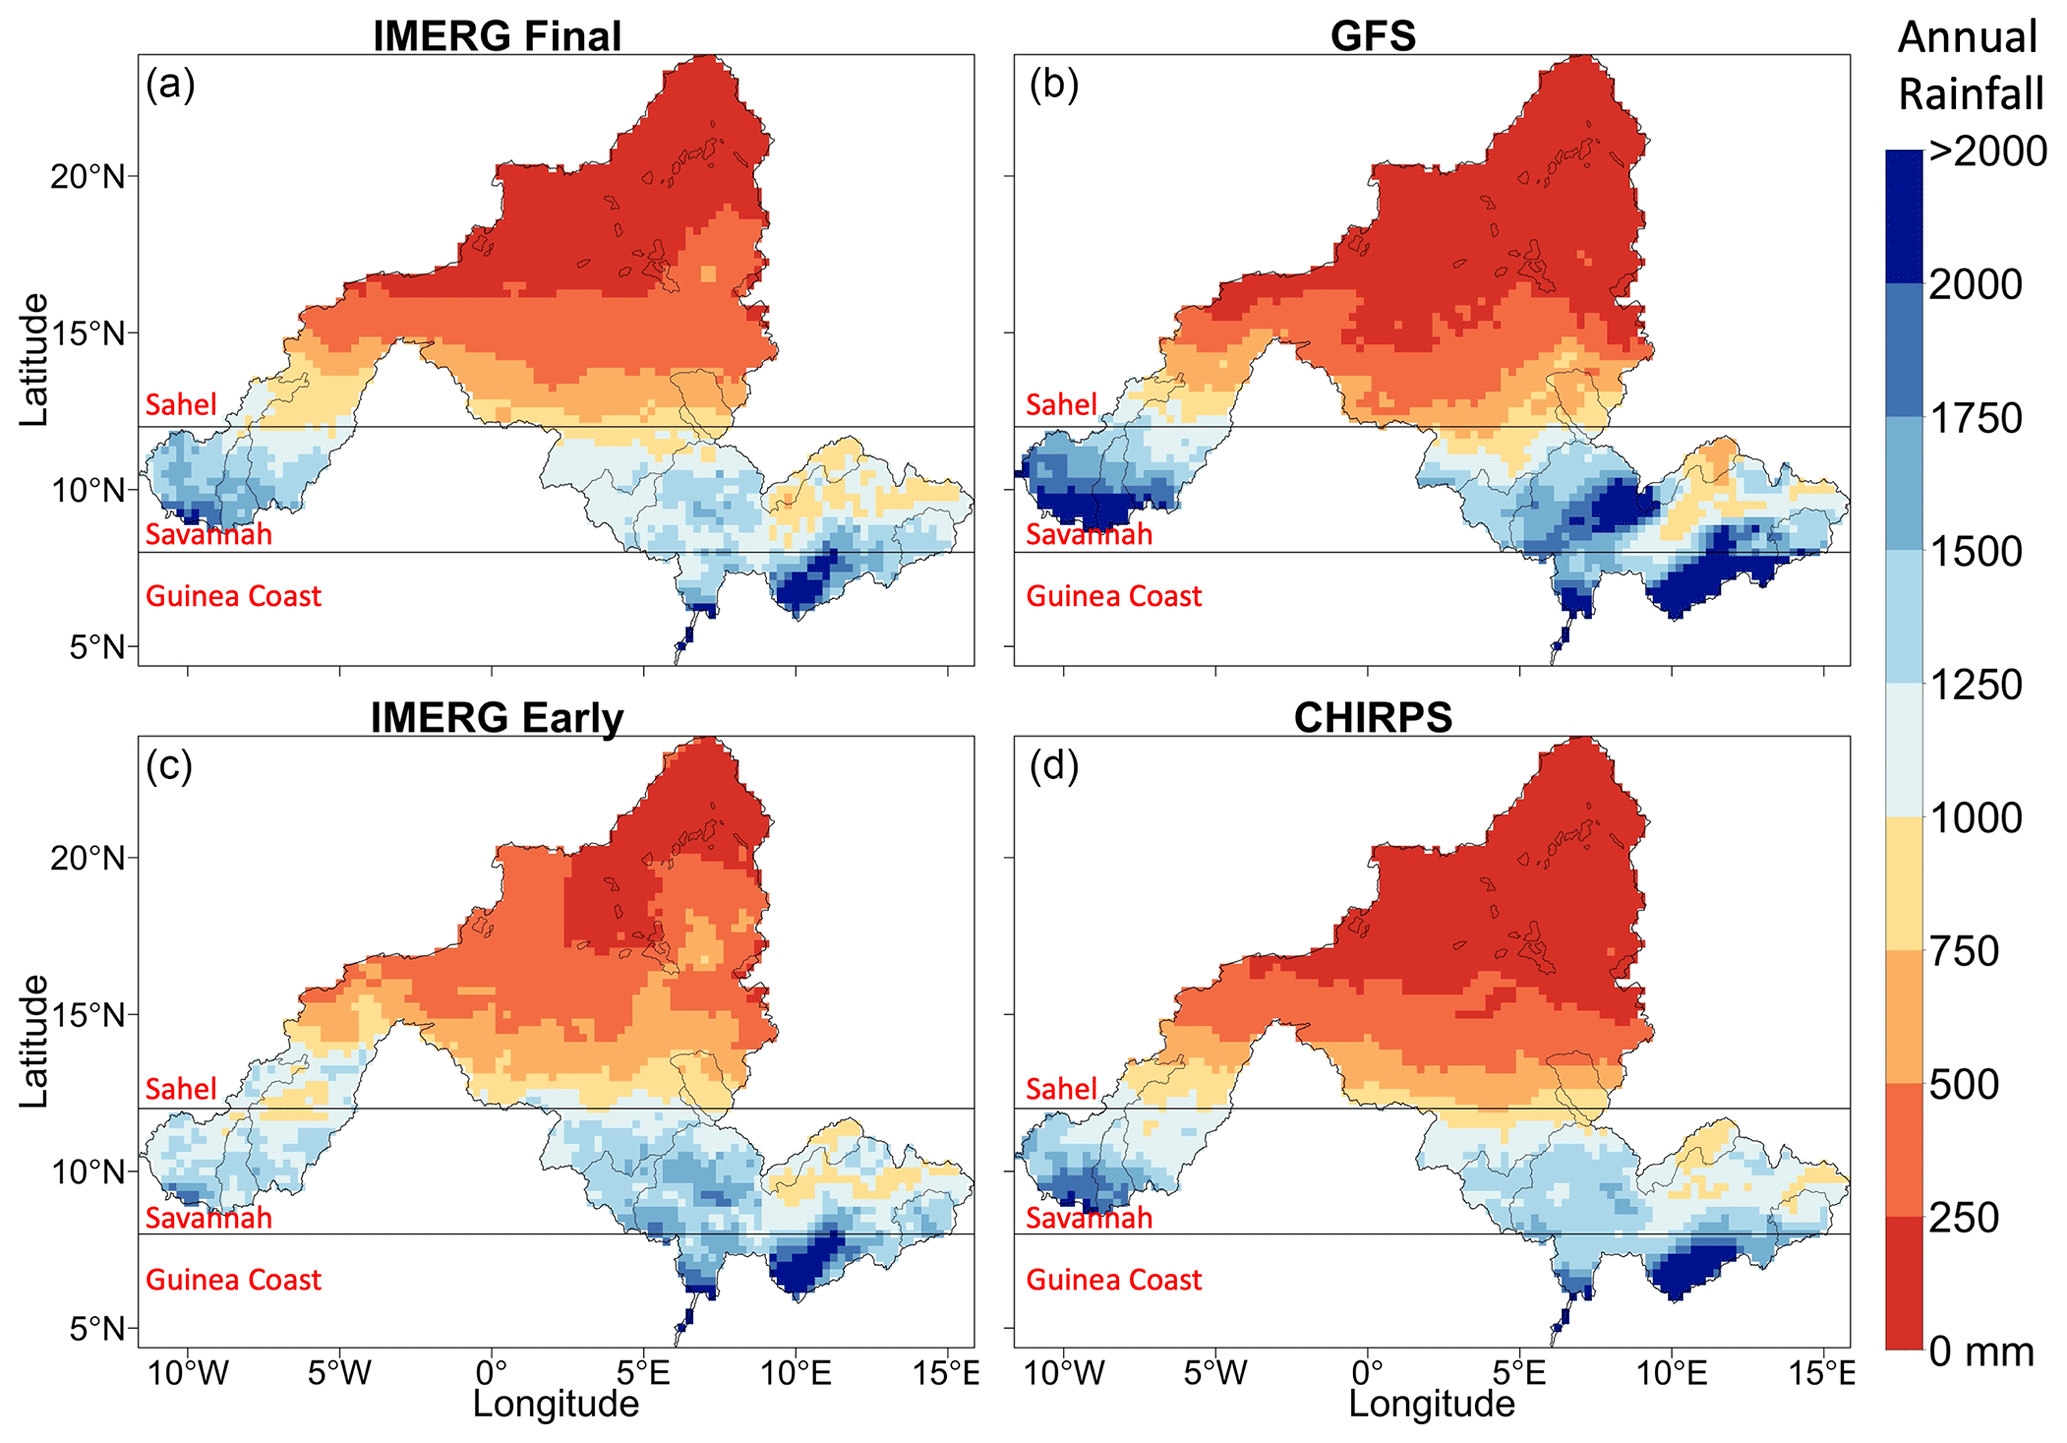
Figure 2Spatial map of annual rainfall (in millimeters), for the period 15 June 2019 to 15 June 2020, derived from (a) IMERG Final, (b) GFS (1 d lead time), (c) IMERG Early, and (d) CHIRPS.
3.1 Annual spatial variability and seasonal characteristics
The spatial map of annual (15 June 2019–15 June 2020) rainfall from the various rainfall products is given in Fig. 2. According to the reference rainfall product (i.e., IMERG Final), the Niger basin experiences an average annual rainfall of 700 mm. The spatial rainfall distribution shows a north-to-south increasing gradient, with the Sahel region (>12∘ N) receiving, on average, 346 mm per year, the Savanna region (8–12∘ N) receiving, on average, 1206 mm per year, and the Guinea region (4–8∘ N) receiving, on average, 1620 mm per year. The spatial structures (climatology and north–south gradient in rainfall) of GFS, IMERG, and CHIRPS rainfall fields are quite similar to those of IMERG Final. However, the 1 d GFS tends to overestimate in the wet Guinea region of the basin, whereas both IMERG Early and CHIRPS give values that are very close to IMERG Final.
Figure 3 shows the seasonal rainfall pattern for each climatological region. According to the reference IMERG Final, as one goes from north to south, the rainy season expands from 3 months (June–September) in the Sahel to 6 months (March–November) in the Savanna and Guinea regions. The peak rainfall also shows a north–south gradient, with peak rainfall of 130 mm in the Sahel to 269 mm in the Savanna and 350 mm in the Guinea region. The rainfall pattern is unimodal, with a peak rainfall value in August for both the Sahel and Savanna, but becomes bimodal with one peak in May and the other in September for Guinea.

Figure 3Monthly precipitation regime for the three climatological zones of the Niger river basin. (a) Sahel, (b) Savanna, and (c) Guinea. Analyses are based on rainfall fields derived from IMERG Final, GFS (1 d lead time), IMERG Early, and CHIRPS. The time period covers 15 June 2019 to 15 June 2020.
When validated against IMERG Final, the performance of GFS in capturing the seasonal rainfall characteristics deteriorates as one goes from north to south. GFS captures both the seasonal rainfall pattern and rainfall peak in the Sahel and captures the seasonal rainfall pattern but tends to moderately overestimate the peak in the Savannah, while it has a large overestimation (almost twice as much as the reference) in the Guinea region, particularly during summer. As far as the other satellite products are concerned, IMERG Early tends to slightly overestimate in the Sahel across all rainy months but performs relatively well in the Savannah and Guinea regions. CHIRPS is very close to IMERG Final in all regions and months, with the exception of a modest overestimation of the July rainfall in Guinea.
3.2 How well do GFS forecasts capture annual rainfall?
Here, we aggregate the 1 d lead GFS forecasts to an annual timescale and compare the results against corresponding annual precipitation estimates from IMERG Final. Figure 4 presents the watershed-averaged annual rainfall for each dam watershed. According to IMERG Final, the annual rainfall varies from 434 mm (in Kainji) to 1481 mm (in Selingue). Watersheds 1 (Selingue) and 2 (Markala), located in the western part of the Savannah, receive the largest amount of rainfall, i.e., 1481 and 1406 mm, respectively. Watershed 3 (Markala), located in the eastern part of the Sahel, receives 741 mm of annual rainfall. Watershed 4 (Bakolori), characterized by the smallest watershed area compared to the rest of the watersheds, lies partly in the Sahel and partly in the Savannah region and receives 921 mm of annual rainfall. Watershed 5 (Kainji), characterized by the largest watershed area of all, lies mostly in the Sahel region and receives the lowest amount of annual rainfall (434 mm). Watersheds 6 (Jebba), 7 (Dadin Kowa), and 8 (Lagdo), located in the Savannah, receive annual rainfall amounts of 1190, 941, and 1295 mm, respectively.
Validated against IMERG Final, the GFS tends to overestimate rainfall in all watersheds located in the Savannah (or watersheds that receive relatively large rainfall amounts), with an overestimation varying in the range from 8 % to 33 %, with a larger bias for watersheds receiving higher rainfall amount. For watersheds in the Sahel (watersheds receiving a low rainfall amount), GFS gives less bias (−11 % for the driest Kainji watershed and +10 % for Bakolori).
In contrast, IMERG Early tends to underestimate rainfall in all watersheds located in the Savannah (with a larger negative bias in watersheds with a large rainfall amount) but tends to overestimate in all watersheds located in the Sahel (with a very large overestimation bias for the driest watershed) Therefore, GFS and IMERG Early have different bias characteristics; whereas GFS outperforms IMERG Early in the Sahelian climate where well-organized convective systems dominate the monsoon, IMERG Early outperforms GFS in the Savannah and Guinea climates, which are characterized by short-lasting and localized systems and wet land surface conditions. CHIRPS estimates are reasonably close to IMERG Final, indicating that the choice of reference product between CHIRPS and IMERG Final would not substantially affect the findings on the accuracy of GFS forecasts.
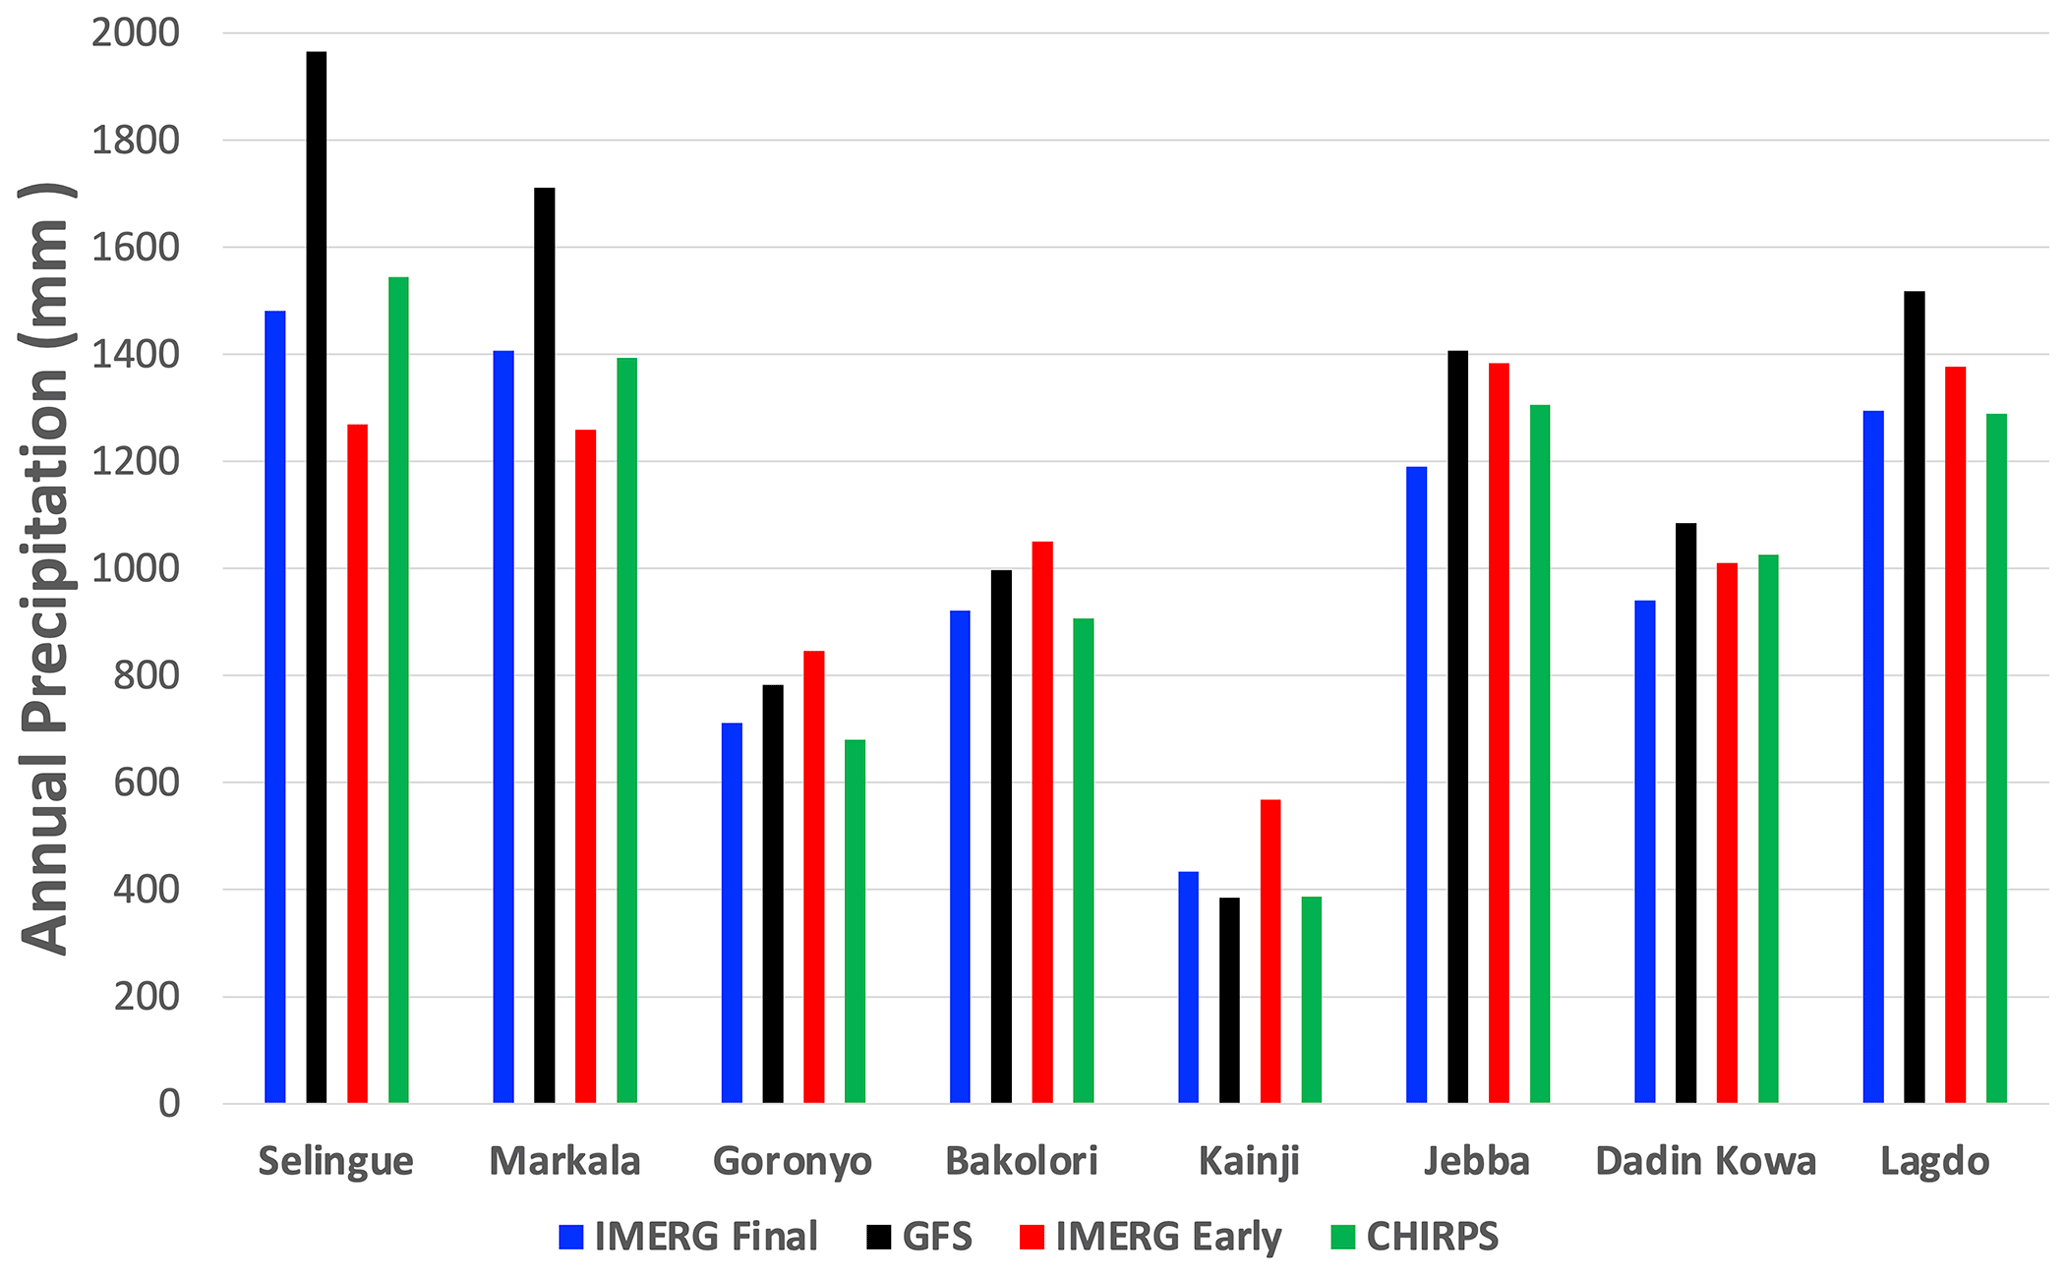
Figure 4Subbasin-averaged annual precipitation (millimeters) for the period 15 June 2019 to 15 June 2020, for each of the Niger's subbasins, derived from the 1 d lead time GFS forecast and different satellite precipitation products.
3.3 How well is the time series of daily precipitation forecasted?
Figures 5 and 6 present the time series of watershed-averaged daily rainfall for the wet period of June–October. According to IMERG Final, the temporal variability (as measured through coefficient of variation or CV) varies from 1.22 to 2.60. Validated against IMERG Final, the GFS tends to underestimate the temporal variability, and particularly underestimate large spikes in rainfall, at almost all sites except at Kainji. The GFS's relatively better performance for Kainji could be attributed to the watershed's large area that results in a relatively smooth temporal variability. Both IMERG Early and CHIRPS provide CV values that are very close to IMERG Final.
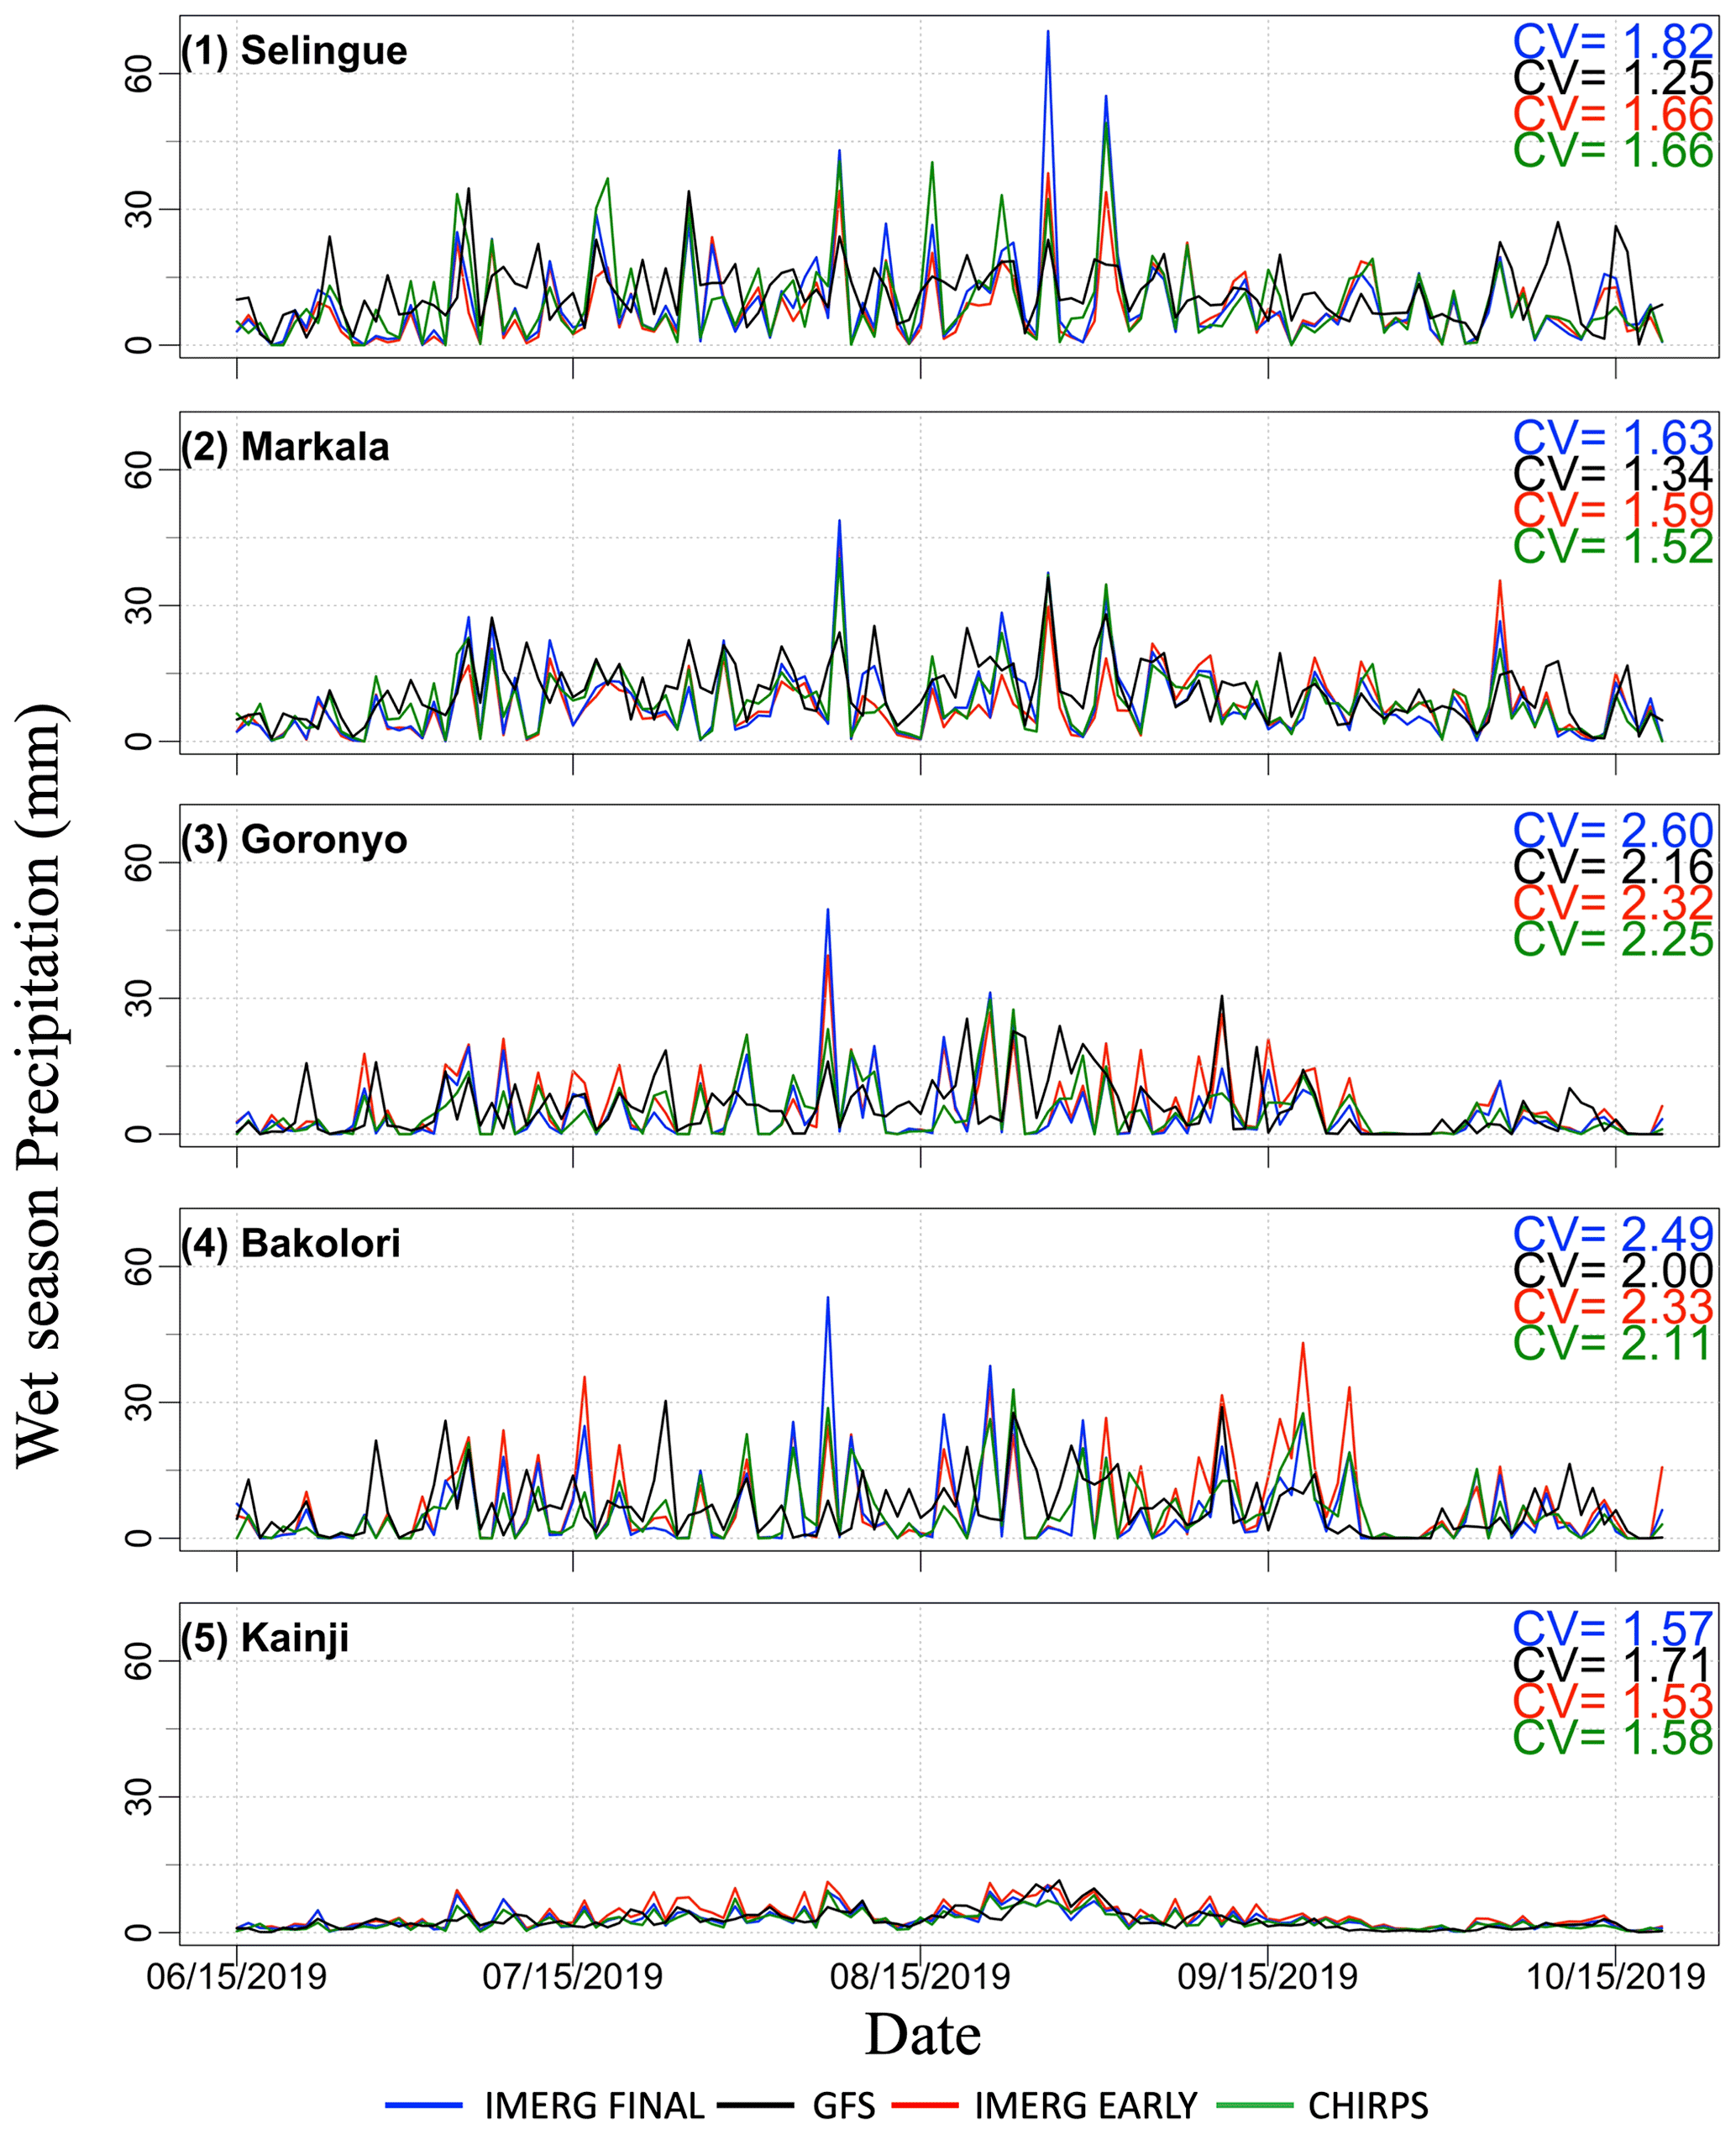
Figure 5Time series of subbasin-averaged precipitation total (millimeters) for the wet period (June–September 2019) for all subbasins and derived from various precipitation products for five subbasins. The figure also shows the coefficient of variation (CV) as a measure of the temporal variation.
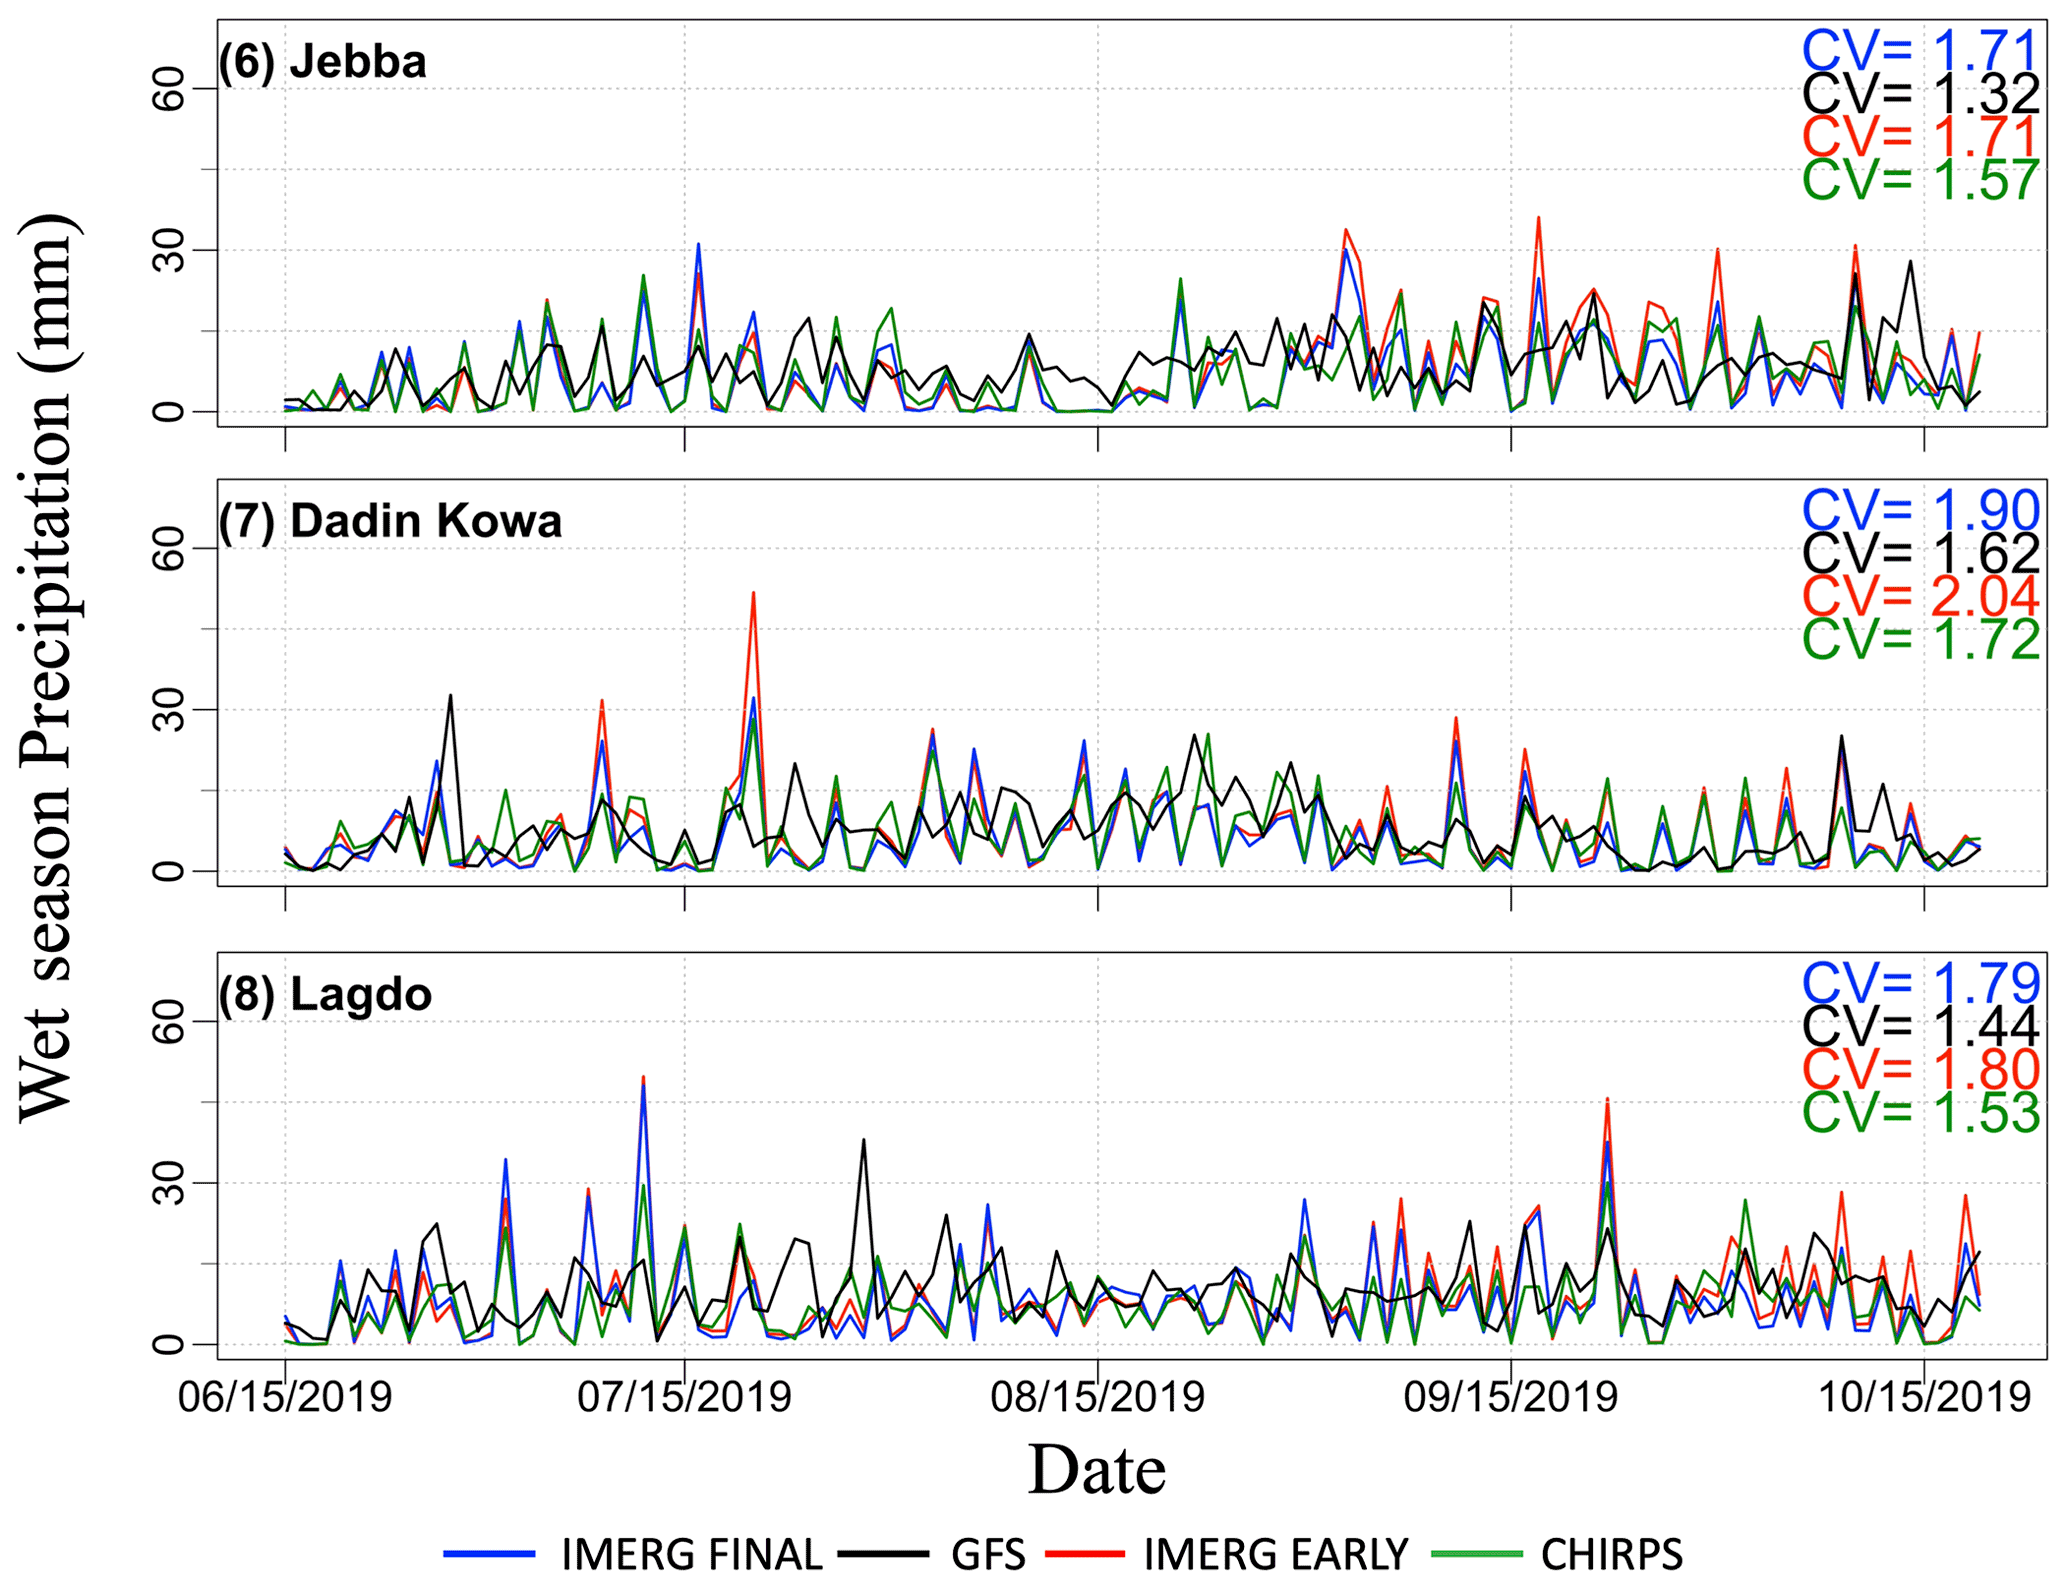
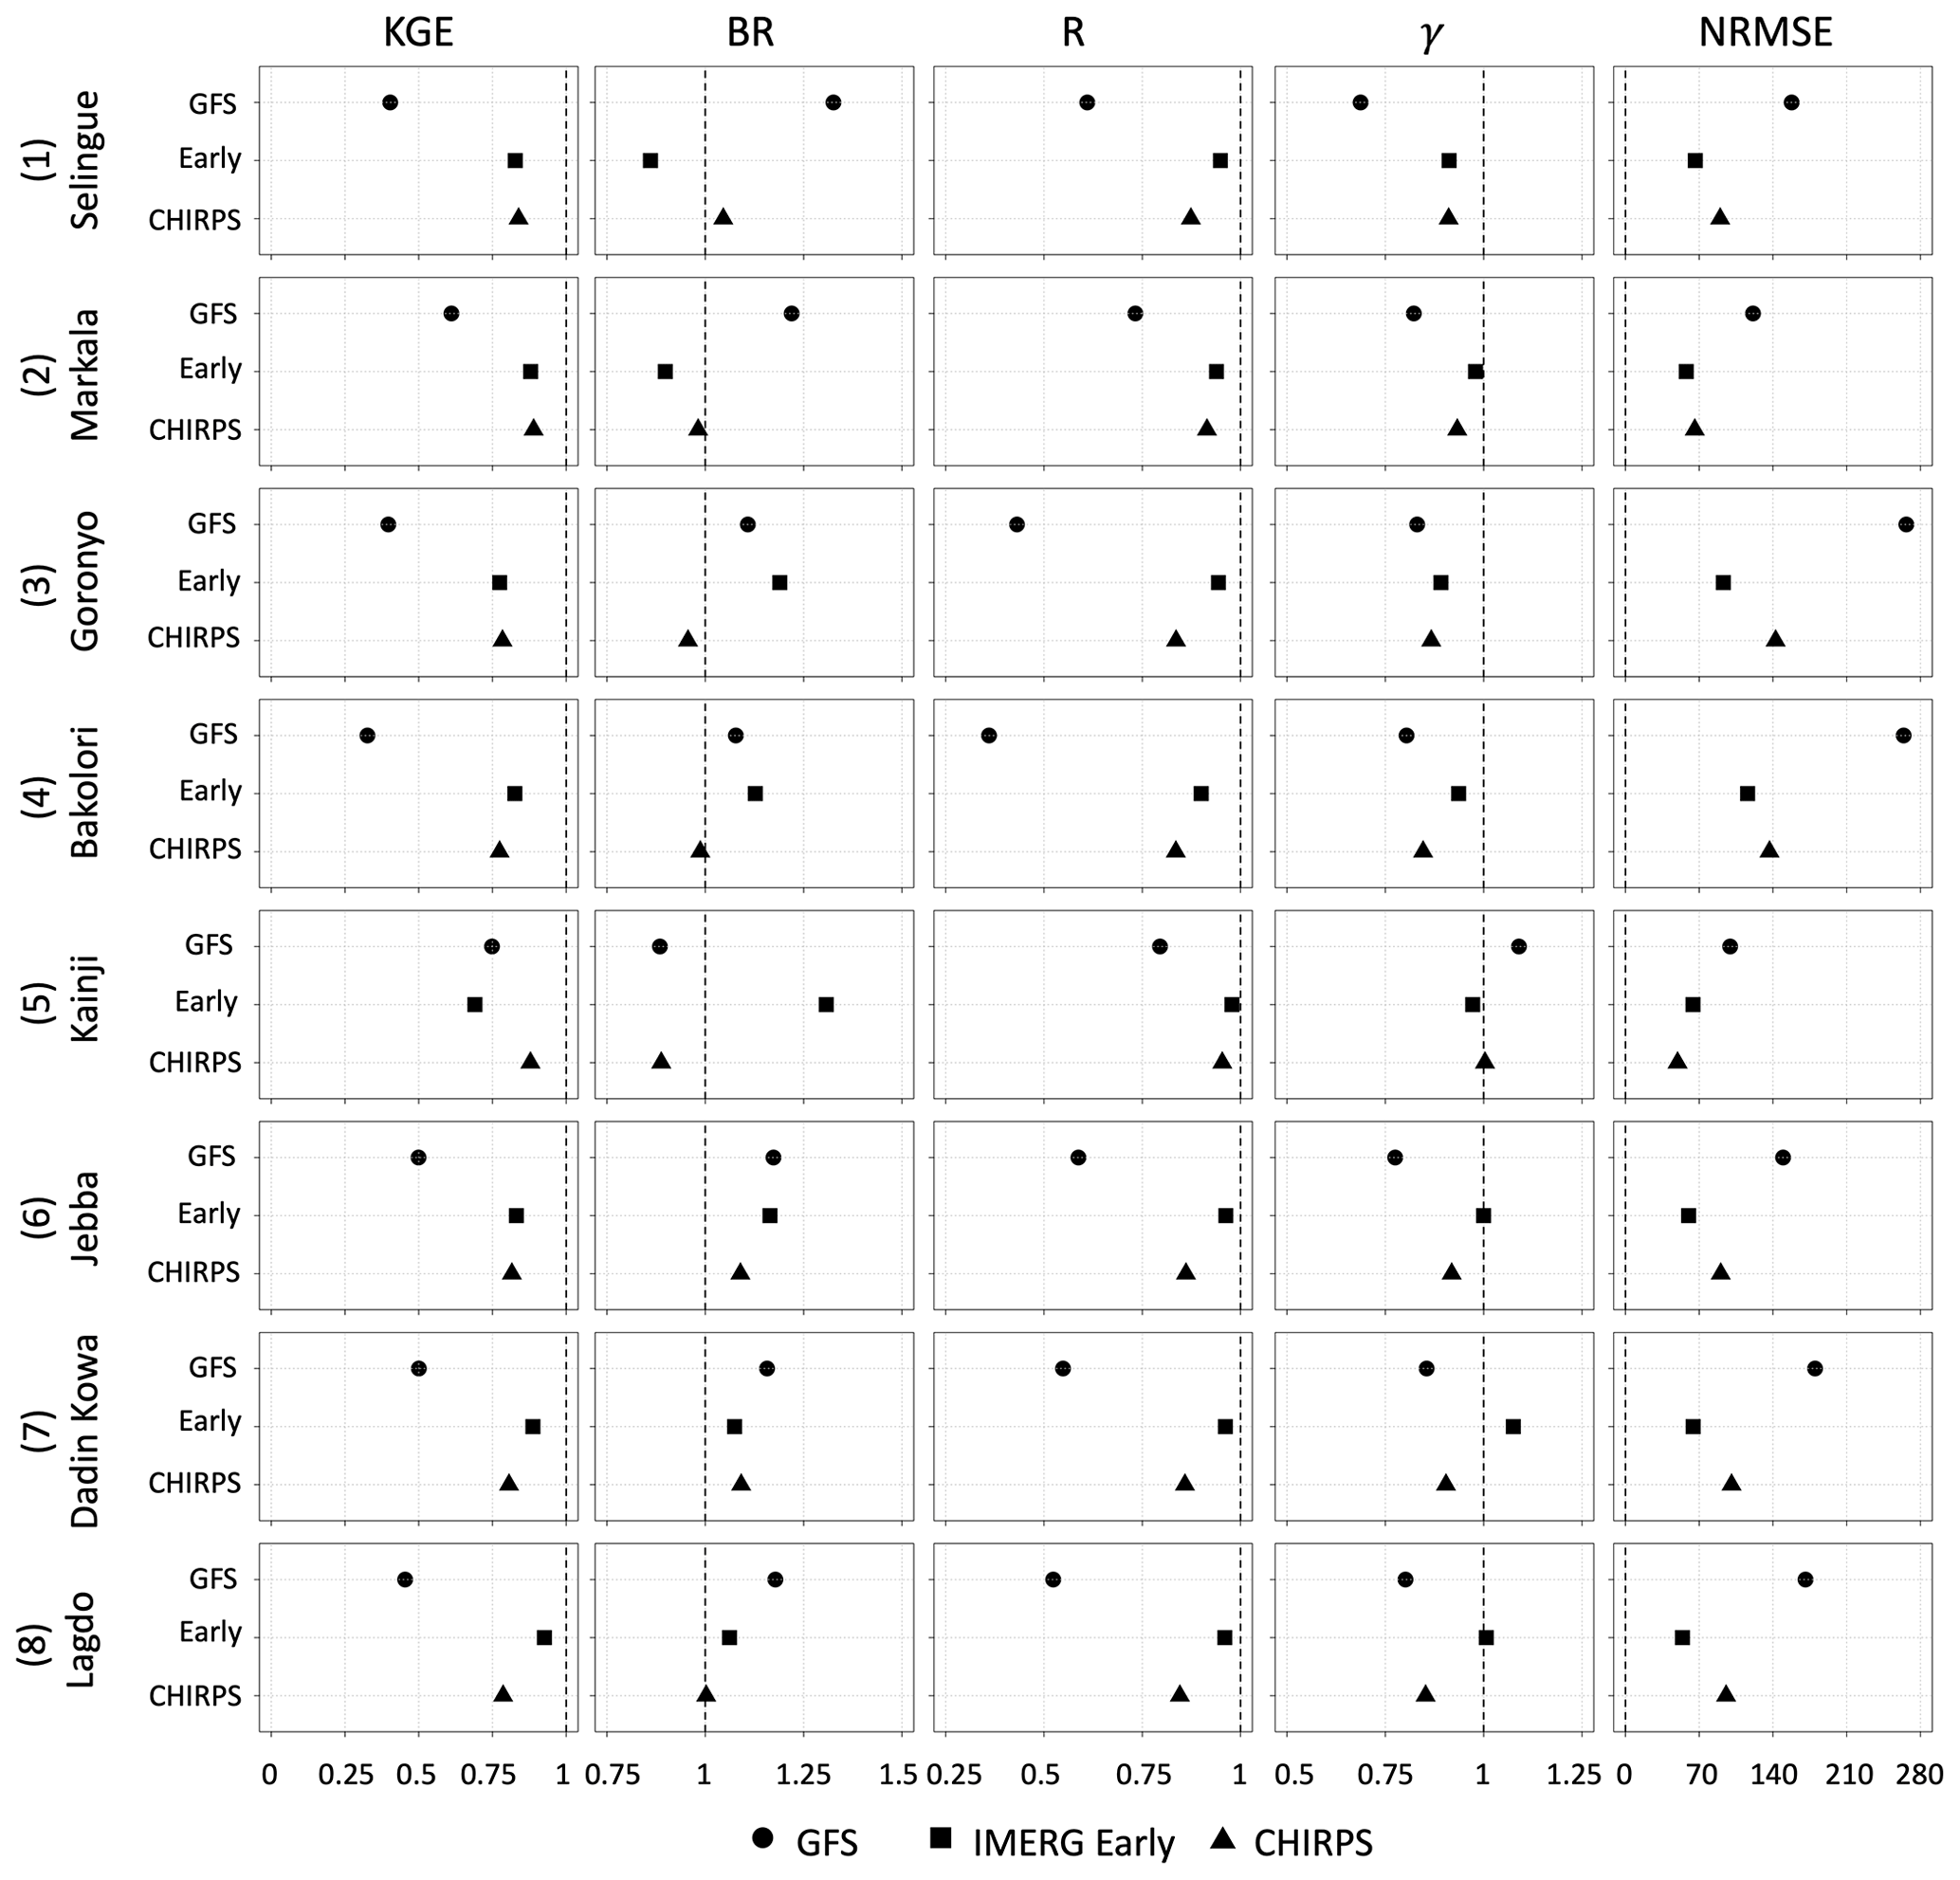
Figure 7Summary of performance statistics (Kling–Gupta efficiency, KGE, bias ratio, BR, correlation, R, variability ratio, γ, and root mean square error normalized (NRMSE) by reference rainfall (percent) for the 1 d lead time GFS forecasts and other satellite products. The time period considered was 15 June 2019–15 June 2020.
Figure 7 displays the performance statistics of watershed-averaged daily rainfall (validated against IMERG Final) in terms of the Kling–Gupta efficiency (KGE), bias ratio (BR), correlation (R), variability ratio (γ), and root mean square error normalized by reference precipitation mean (NRMSE). First, the performance results for the 1 d lead GFS are considered. The KGE scores are poor () for half of the watersheds considered (Selingue, Goronyo, Bakolori, and Lagdo) and intermediate () for the remaining half of the watersheds (Markala, Kainji, Jebba, and Dadin Kowa). The breakdown of the KGE scores (BR, R, and γ) reveals the key factors contributing to the KGE estimates. The GFS tends to overestimate the daily precipitation for most subbasins, as the BR is higher than 1, except for Kainji. The overestimation is particularly high for Selingue and Markala, where BR is 1.33 and 1.22, respectively. The correlation coefficient between GFS and IMERG Final is mostly low (R<0.60) and is particularly lower for Bakolori (R=0.36) and Goronyo (R=0.43). The variability ratio of GFS is mostly between 0.69 and 0.83 (except for Kainji, where γ is 1.09), indicating that the GFS tends to give a lower temporal variability in rainfall. The NRMSE is very high, ranging from 100 % to 266 %, and is particularly high for Goronyo (266 %) and Bakolori (264 %), which are relatively small-sized watersheds.
Next, the performance of IMERG Early was examined with respect to IMERG Final, mainly to assess if it is possible to use the near-real-time IMERG Early product to calibrate and improve the accuracy of GFS forecasts. The IMERG Early performs much better with KGE values higher than 0.75 (except for Kainji, where KGE is 0.69), a correlation higher than 0.90, and a variability ratio close to the optimum value. The high performance of IMERG Early is due to its similarity with the IMERG Final product, as the main difference between the two products is that IMERG Early, unlike IMERG Final, does not use monthly rain gauge observations for bias correction. Such monthly bias correction techniques would not alter the pattern and variability of IMERG Early compared to IMERG Final. Therefore, the performance of IMERG Early should be evaluated using bias statistics; the other statistics (correlation and variability ratio) are presented for completeness. IMERG Early overestimates rainfall in most watersheds in the range of 11 % (Lagdo) to 28 % (Kainji), except for two watersheds where it slightly underestimates by 14 % (Selingue) and 11 % (Markala). Comparison of the performance of GFS and IMERG Early indicates that both products have different bias characteristics. In some watersheds (e.g., Kainji), GFS outperforms IMERG Early in terms of bias, whereas in other watersheds (e.g., Markala), IMERG Early outperforms GFS.
CHIRPS was also compared with IMERG Final to assess how the use of different reference products may affect the finding about the performance of GFS forecasts. The KGE scores of CHIRPS are higher than 0.75 in all cases, indicating that CHIRPS and IMERG Final have comparable KGE performance. Therefore, the performance of GFS is expected to be about the same, even if the reference product used this in this study (IMERG Final) changes to CHIRPS.

Figure 8Scatterplot of watershed-averaged and daily precipitation forecast obtained from 1 d lead GFS forecasts against corresponding values from IMERG Final.
3.4 Dependence of forecast performance on precipitation rate
Figure 8 presents the scatterplot of 1 d lead GFS forecasts and IMERG Final at daily and watershed-averaged scales. The performance of GFS varies between watersheds. In the Markala and Kainji watersheds, GFS forecasts agree well with IMERG Final at almost all rain rates. In the Selingue watershed, GFS agrees well with IMERG Final for rain rates under 30 mm/d−1 but GFS substantially underestimates all rain rates above 30 mm/d−1. In the remaining five watersheds, GFS has a poor performance, replete with a large scatter, high false alarm, and large underestimation bias of heavy rain rates.
3.5 Dependence of daily forecast performance on lead time and spatial scale
In order to assess the effect of various lead times and spatial scales on forecast performance, we obtained daily GFS forecasts at various lead times (1, 5, 10, and 15 d) and aggregated the forecasts at spatial scales from 0.25∘ to coarser scales (0.5, 0.75, and 1∘) by averaging the grids. The purpose of degrading the resolution is to determine at which resolution the forecasts have an acceptable performance. The KGE value at each spatial resolution was calculated with the following steps: (i) average the data at the required spatial resolution, (ii) extract pairs of data (one from IMERG Final and the other from GFS), (iii) concatenate the pairs to form one large series of data, and (iv) compute a single KGE from this data series. The resulting KGE values are shown in Fig. 9.
With regard to the effect of spatial scales, the KGE at the GFS native resolution (i.e., 0.25∘) is very low. As the spatial scale increases, KGE increases, as expected. For instance, for the Markala watershed, KGE increases from 0.27 (0.25∘) to 0.40 (1∘) for a 1 d lead. This indicates that the variation in KGE values between the watersheds could be partly explained by the watershed size. For example, based on Fig. 5, the KGE for the 1 d lead daily GFS forecast was the highest for the largest Kainji watershed (watershed area of 1 464 092 km2) and the lowest for the smallest Bakolori watershed (4887 km2). With regard to the effect of the lead time for daily forecasts, KGE decreases significantly as lead time increases. For instance, for the Markala watershed and a grid size of 1∘, KGE decreases from 0.40 (1 d lead) to 0.21 (15 d lead).
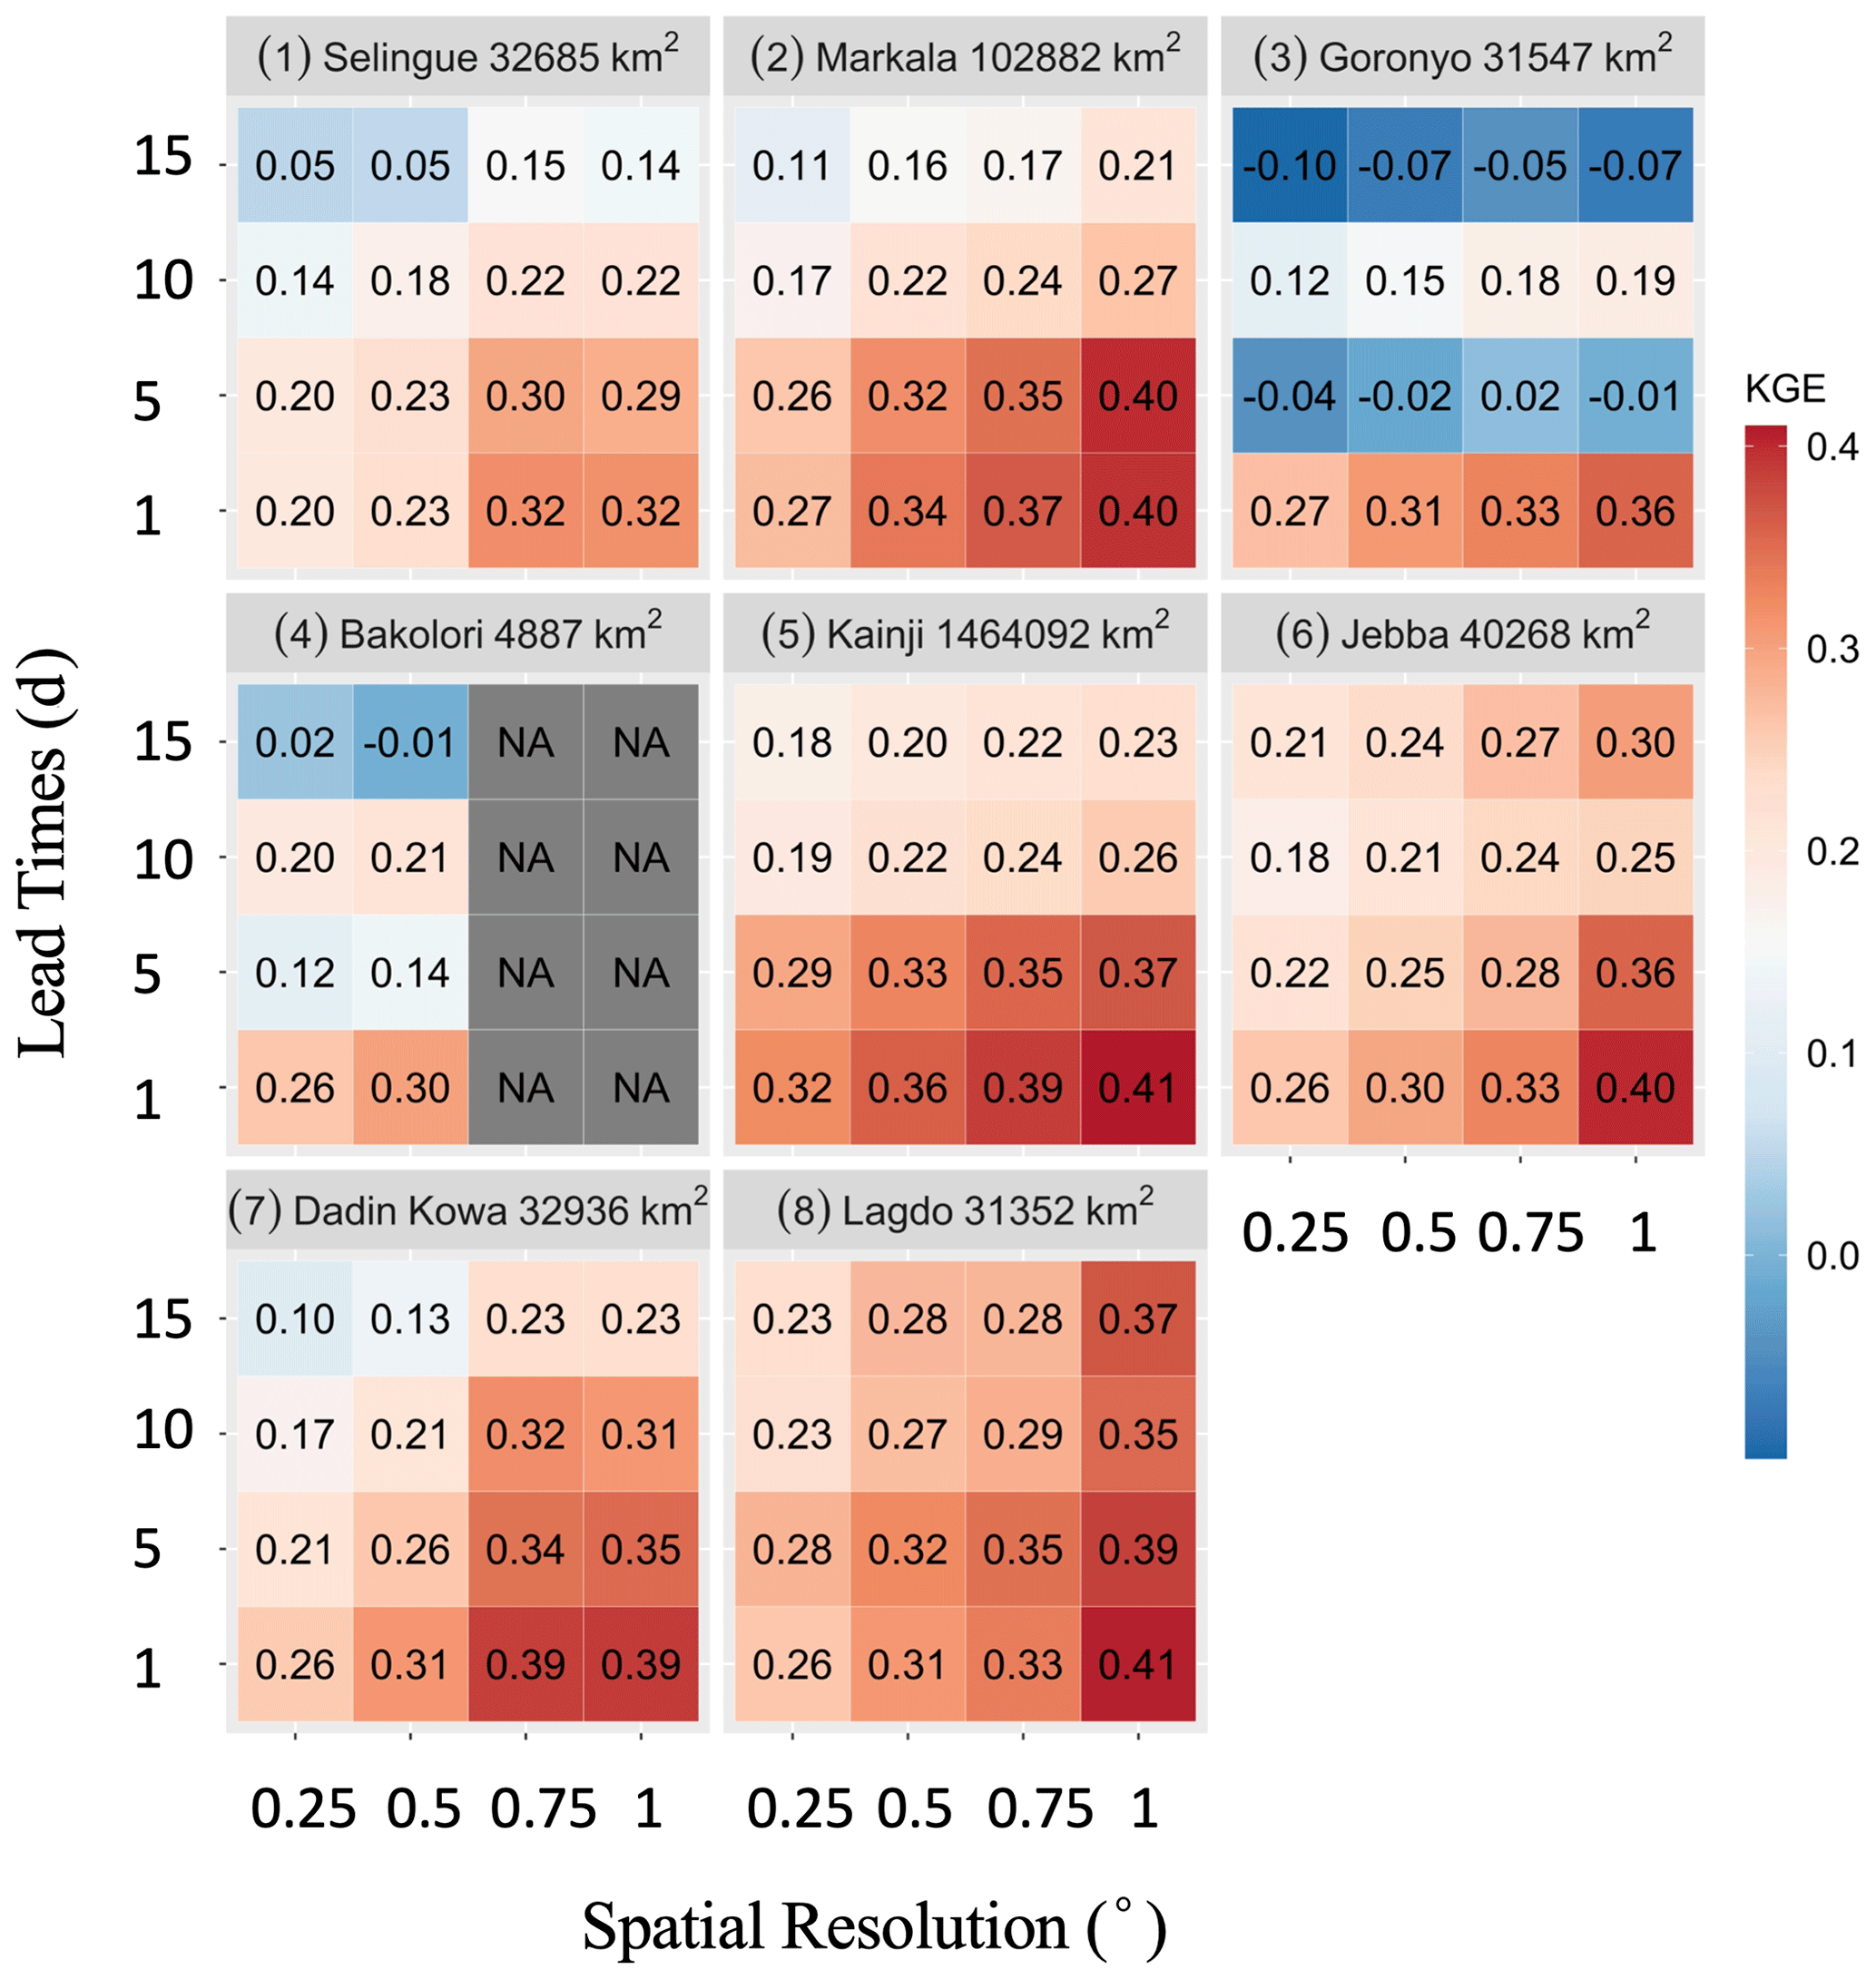
Figure 9Kling–Gupta efficiency (KGE) for daily precipitation of GFS as a function of lead time (1, 5, 10, and 15 d) and spatial scale (0.25, 0.50, 0.75, and 1.0∘). The dam names and corresponding watershed areas are given in the titles.
3.6 Effect of temporal aggregation scale on forecast performance
To assess the effect of temporal aggregation scale, we obtained the 1 d total, 5 d total, 10 d total, and 15 d total GFS precipitation forecasts. These multiday forecasts are constructed by combining multiple lead time forecasts. For instance, the 5 d total forecast is obtained by adding the 1 d lead, 2 d lead, 3 d lead, 4 d lead, and 5 d lead daily forecasts. Figure 10 presents the KGE values for GFS forecasts over different temporal aggregation scales and different grid sizes. Temporal aggregation substantially increases KGE at all spatial scales. For example, at the grid size of 1∘ over Markala watershed, the KGE values jump from 0.40 at the daily timescale to 0.73 at 15 d total timescale.
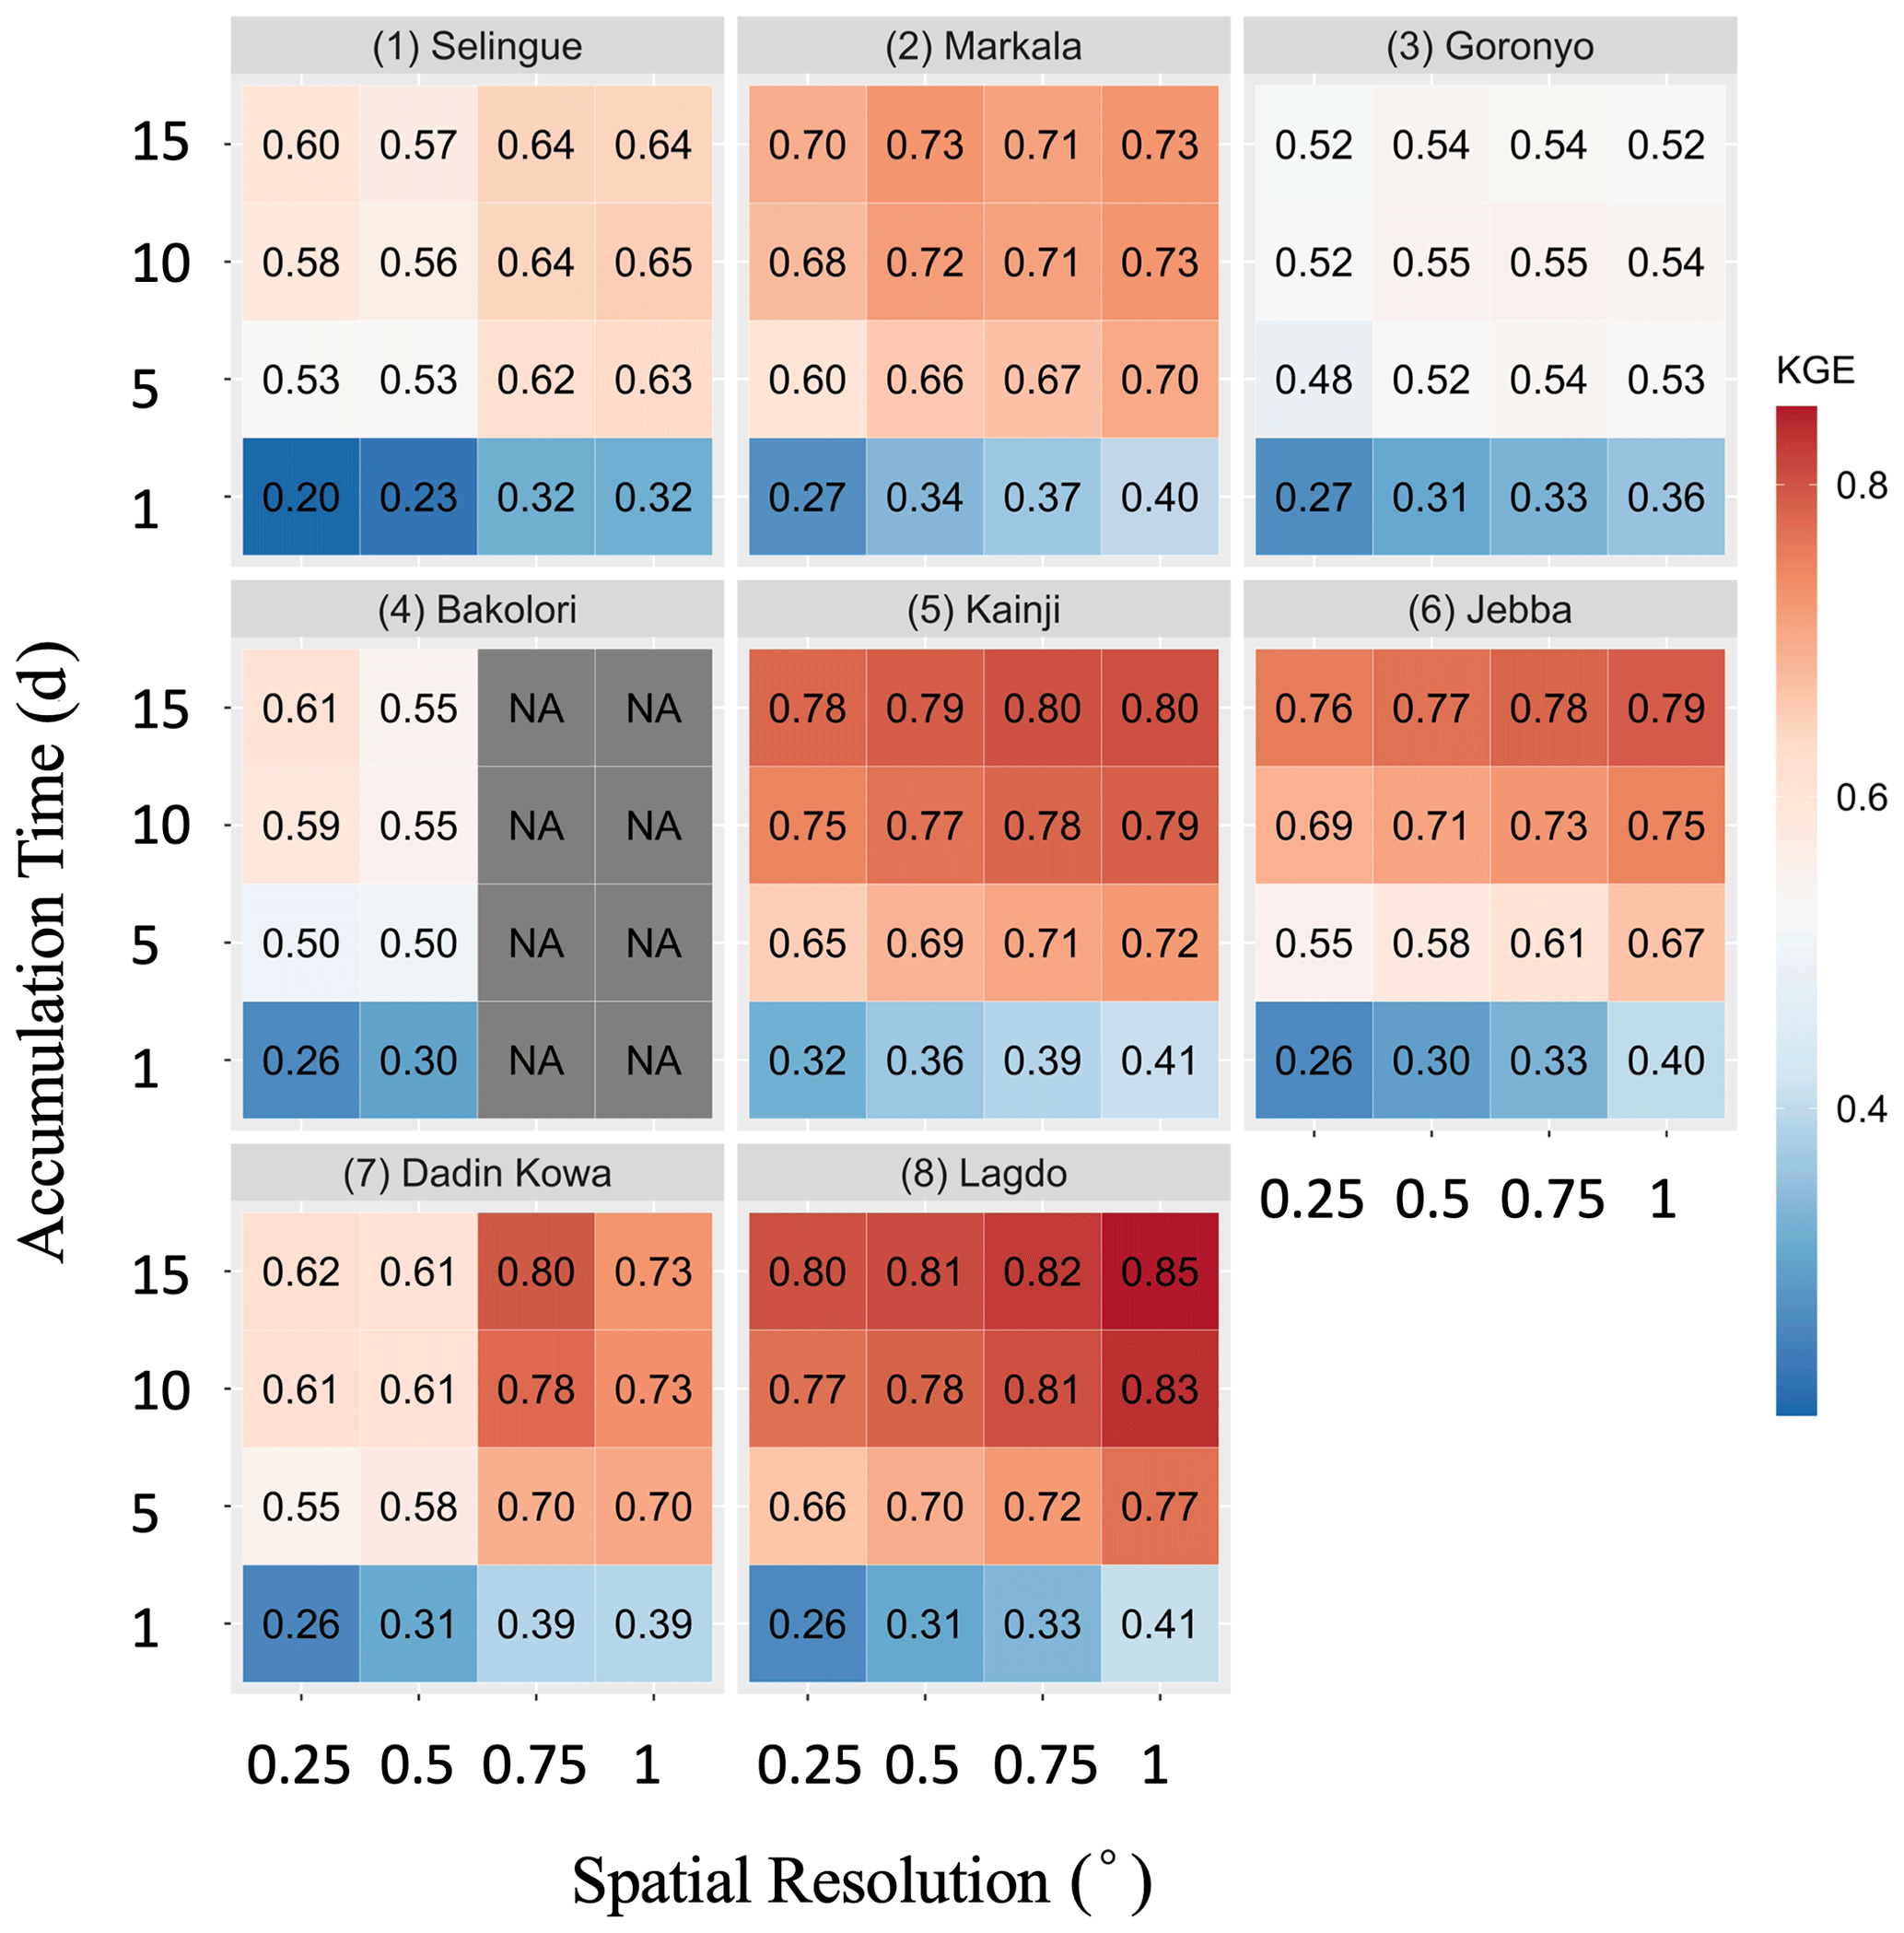
Figure 10Kling–Gupta efficiency (KGE) of GFS as a function of the accumulation timescale (1, 5, 10, and 15 d) and spatial scale (0.25, 0.50, 0.75, and 1.0∘).
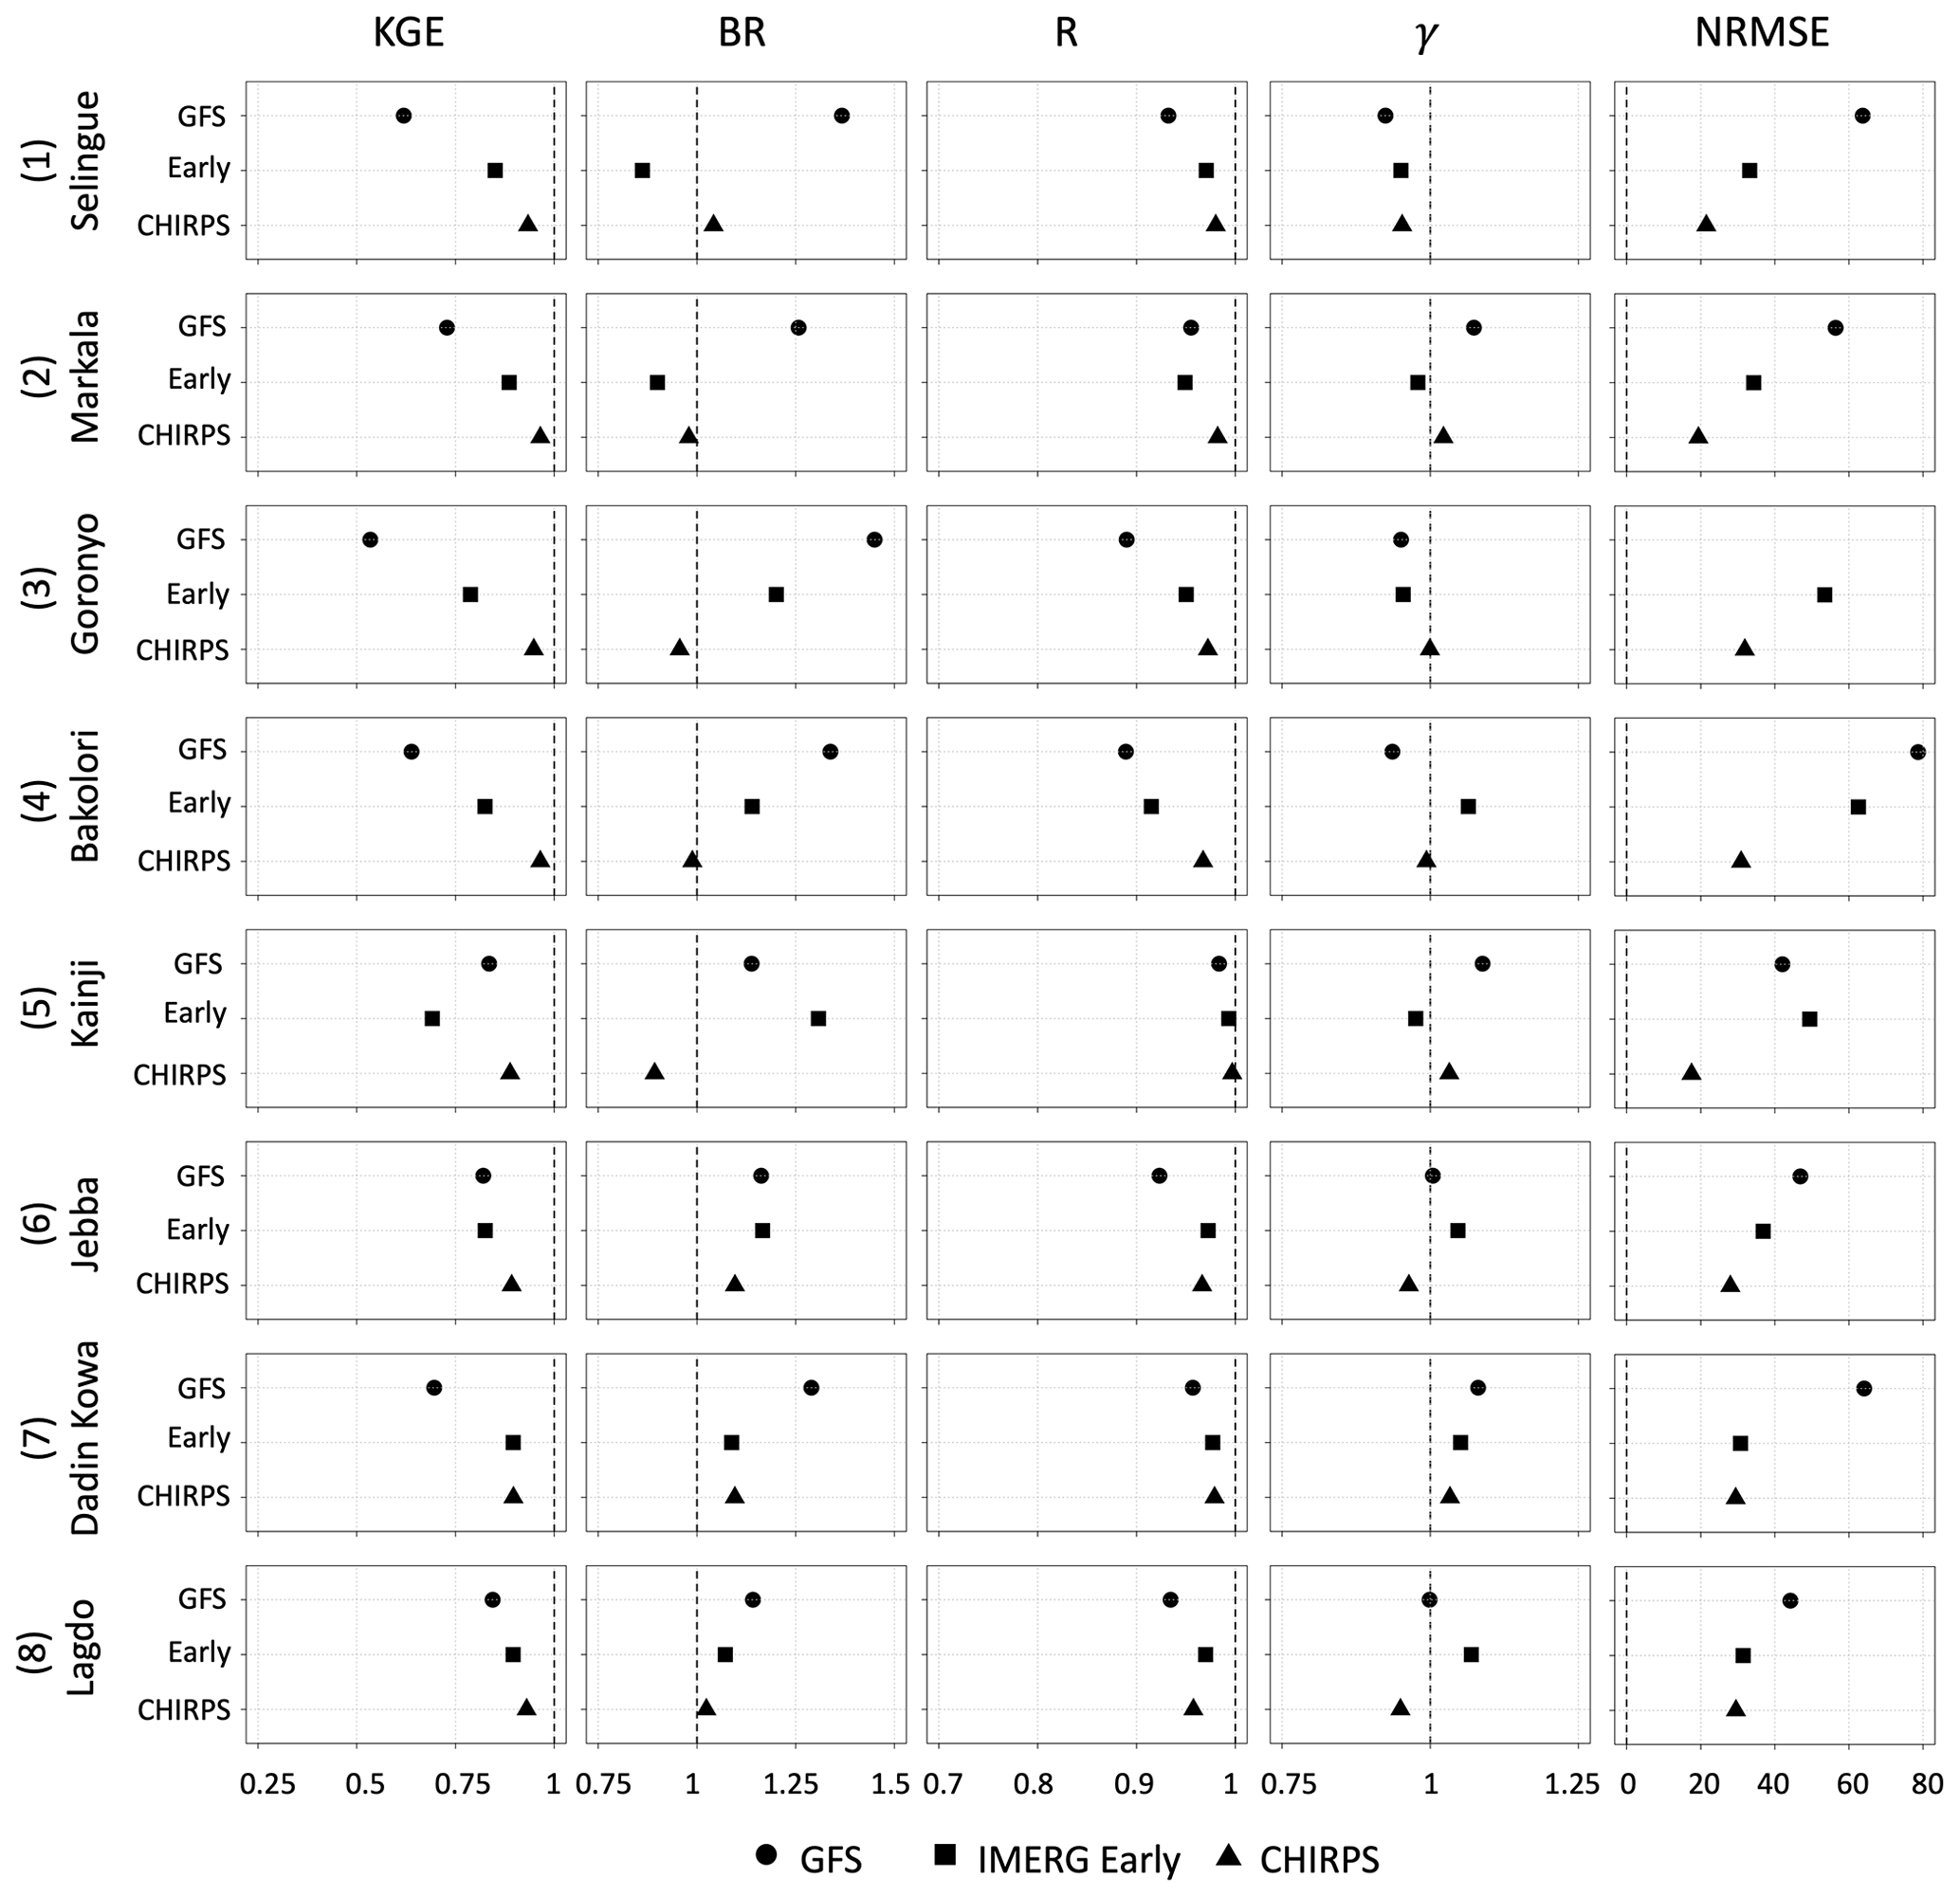
Figure 11Summary of the performance statistics (Kling–Gupta efficiency, KGE, bias ratio, BR, correlation, R, variability ratio, γ, and root mean square error normalized (NRMSE) by reference rainfall (percent) for the 15 d accumulated GFS forecast and other satellite products.
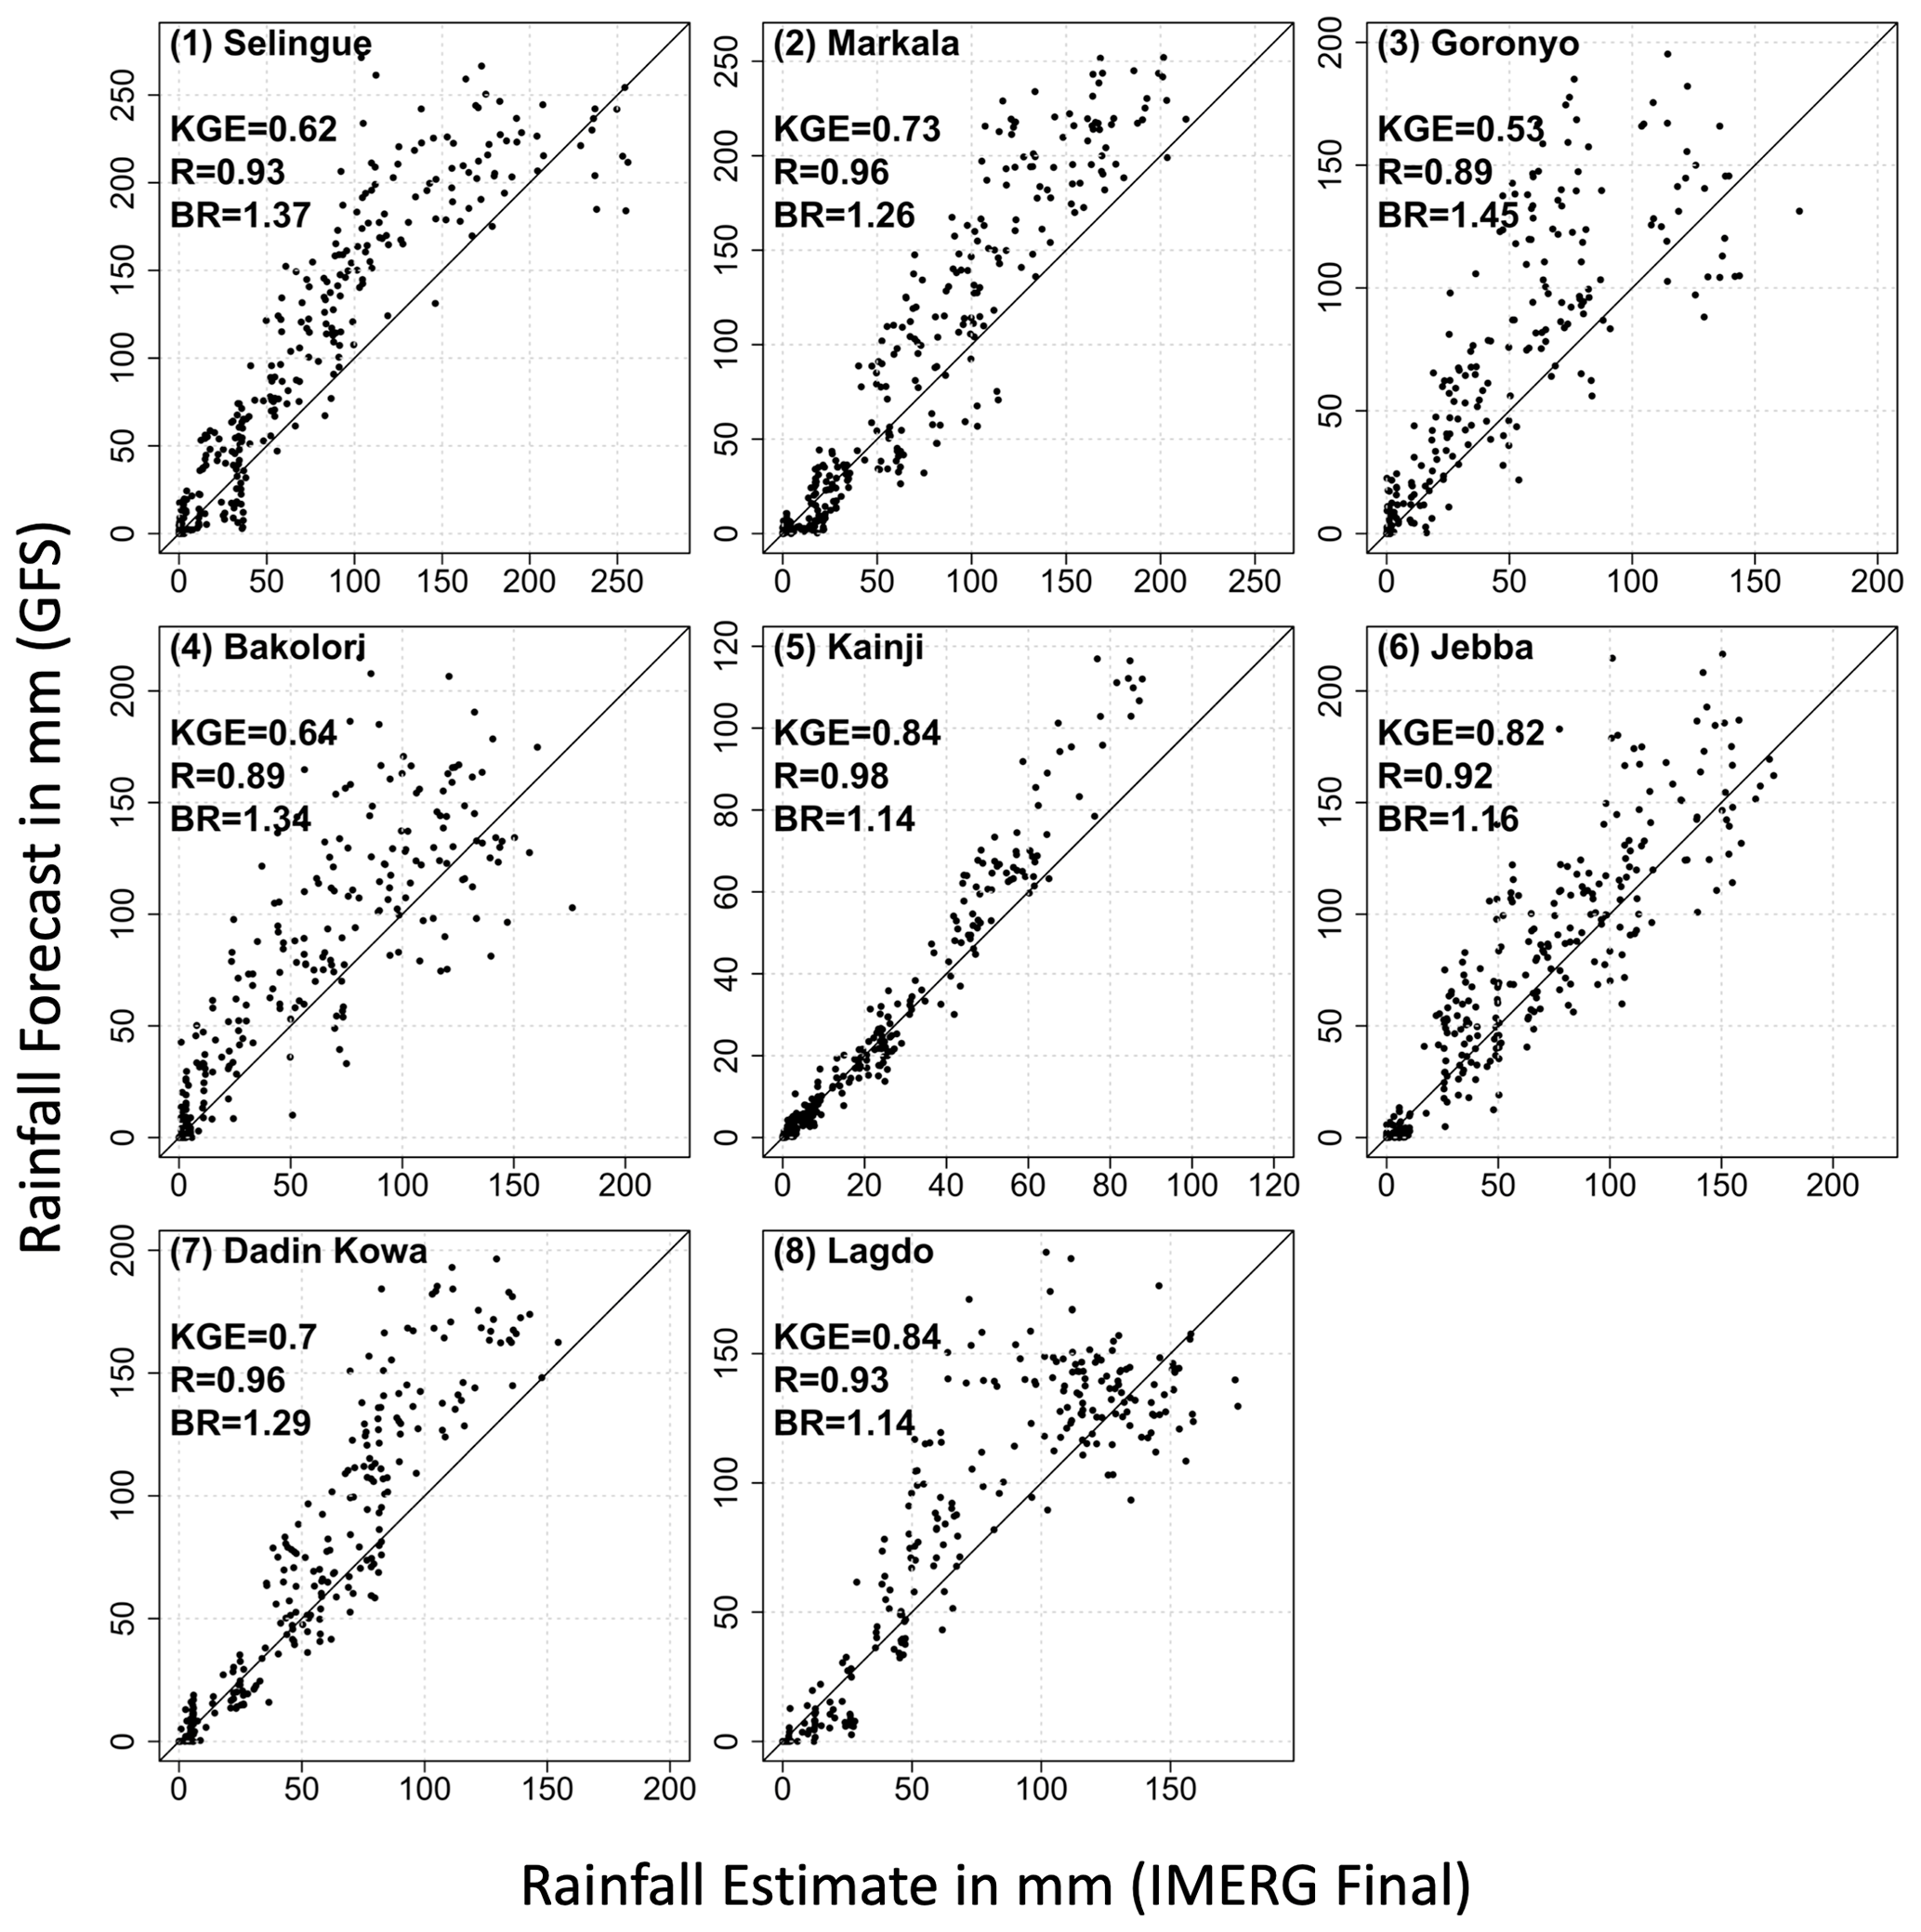
Figure 12Scatterplot of watershed-averaged 15 d accumulated precipitation forecast obtained from GFS forecast against corresponding values from IMERG Final.
In Fig. 11, we show the performance statistics of GFS for the 15 d accumulated watershed-averaged rainfall forecast. The KGE values are intermediate (0.5 < KGE < 0.75) for four watersheds and good (KGE > 0.75) for the remaining four watersheds. An analysis of the components of KGE reveals that the improvement of KGE at longer timescales comes as a result of the improved correlation and variability ratio. At the 15 d accumulation timescale, IMERG Early estimates have less bias than GFS at all watersheds, except at Kainji watershed. Figure 12 presents the scatterplot of 15 d accumulated GFS forecast vs. IMERG Final. In general, the GFS estimates perform well for low to moderate rain rates but tend to overestimate higher rain rates. This is consistent with Wang et al. (2019), who reported the difficulty in capturing the magnitude of high rain rates in the GFS model.
This study has evaluated the accuracy of medium-range (1 to 15 d lead time) forecasts available from the Global Forecast System (GFS) for the watersheds of large dams in the Niger river basin. Despite the limited temporal coverage, some consistent features emerged from this evaluation. The accuracy of the GFS forecast depends on climatic regime, lead time, accumulation timescale, and spatial scale. With regard to the role of climatic regimes, the GFS forecast has a large overestimation bias in the Guinea region (wet climatic regime), a moderate overestimation bias in the Savannah (moderately wet climatic regime), but has no bias in the Sahel (dry climate). With regard to lead time, as the lead time increases, the forecast accuracy decreases. Averaging the forecasts at coarser spatial scales leads to increased forecast accuracy. For daily rainfall forecasts, the performance of GFS is very low (KGE < 0.32) at almost all watersheds, except at Markala (KGE = 0.44) and Kainji (KGE = 0.68) as both have much larger watershed areas compared to the other watersheds. Averaging the forecasts at longer timescales also leads to increased forecast accuracy. For the 15 d rainfall accumulation timescale, the KGE values are either intermediate (i.e., 0.50 ≤ KGE ≤ 0.75) for half of the watersheds (Selingue, Goronyo, Bakolori, and Dadin Kowa) or good (i.e., KGE ≥ 0.75) for the remaining half (Markala, Kainji, Jebba, and Lagdo). With regard to the effect of rainfall rate, the 15 d accumulated GFS forecasts tend to perform better for low to medium rain rates but contain large overestimation bias at high rain rates.
The performance statistics of GFS indicate the need for calibrating GFS forecasts in order to improve their accuracy. Post-processing calibration of GFS forecasts requires the use of independent rainfall observations that are relatively better performing and available in near-real time to correct the real-time dynamical GFS model forecasts. This study has compared the performance of IMERG Early satellite rainfall products with the performance of GFS in terms of bias. In the Guinea and Savannah regions, IMERG Early outperforms GFS in terms of bias, while in the dry Sahel region, IMERG Early is outperformed by GFS.
We acknowledge that the reference dataset used in our evaluation (i.e., IMERG Final) has its own estimation errors. We conducted an additional assessment to evaluate the performance of IMERG Final with respect to another independent and high-quality (i.e., merged satellite gauge) rainfall product (i.e., CHIRPS). Our results show that IMERG Final and CHIRPS have similar rainfall characteristics, indicating the robustness of IMERG Final.
Overall, we conclude that the GFS forecasts, at the 15 d accumulation timescale, have acceptable performance, although they tend to overestimate high rain rates. The shorter the timescale, the lower the GFS performance is. Given that IMERG Early outperforms GFS particularly in the wet region of the Niger, we recommend testing the suitability of IMERG Early to serve as input into post-processing of GFS in order to improve the accuracy of GFS forecasts. Possible post-processing techniques that could be explored include simple bias (multiplicative) correction (Gumindoga et al., 2019), multiresolution bias correction through wavelet analysis (Xu et al., 2019), or the empirical mode decomposition method (Wang et al., 2020; Prasad et al., 2019), and artificial-intelligence-based methods, such as the feedforward neural network (Cloud et al., 2019), support vector machine (Du et al., 2017; Yu et al., 2017), and adaptive neuro-fuzzy inference system (Jehanzaib et al., 2021).
We acknowledge the National Center for Atmospheric Research (NCAR), for providing public access to the GFS rainfall forecast data products (https://doi.org/10.5065/D65D8PWK; NCEP, 2015), NASA, for providing public access to IMERG Final and IMERG Early rainfall data products (https://disc.gsfc.nasa.gov, last access: 10 January 2022; Huffman et al., 2019a, https://doi.org/10.5067/GPM/IMERGDF/DAY/06, Huffman et al., 2019b, https://doi.org/10.5067/GPM/IMERGDE/DAY/06), and the University of California Santa Barbara's (UCSB) Climate Hazards group, for providing public access to the CHIRPS rainfall data (https://www.chc.ucsb.edu/data, Funk et al., 2015).
HY was responsible for the data processing, data analysis, and preparing the paper. MG oversaw the project and, together with VN, designed the method and contributed to writing the text.
The contact author has declared that neither they nor their co-authors have any competing interests.
Publisher’s note: Copernicus Publications remains neutral with regard to jurisdictional claims in published maps and institutional affiliations.
We acknowledge funding support from the NASA Precipitation Measurement Mission (grant no. 80NSSC19K0688). We thank the two reviewers, for their constructive comments which have improved the article.
This research has been supported by the National Aeronautics and Space Administration (grant no. 80NSSC19K0688).
This paper was edited by Xing Yuan and reviewed by Limon Reza Ahmad and one anonymous referee.
Akinsanola, A. A. and Zhou, W.: Projections of West African summer monsoon rainfall extremes from two CORDEX models, Clim. Dynam., 52, 2017–2028, https://doi.org/10.1007/s00382-018-4238-8, 2018.
Akinsanola, A. A., Ogunjobi, K. O., Gbode, I. E., and Ajayi, V. O.: Assessing the capabilities of three regional climate models over CORDEX Africa in simulating West African summer monsoon precipitation, Adv. Meteorol., 2015, 935431, https://doi.org/10.1155/2015/935431, 2015.
Akinsanola, A. A., Ajayi, V. O., Adejare, A. T., Adeyeri, O. E., Gbode, I. E., Ogunjobi, K. O., Nikulin, G., and Abolude, A. T.: Evaluation of rainfall simulations over West Africa in dynamically downscaled CMIP5 global circulation models, Theor. Appl. Climatol., 132, 437–450, https://doi.org/10.1007/s00704-017-2087-8, 2017.
Alexander, S., Yang, G., Addisu, G., and Block, P.: Forecast-informed reservoir operations to guide hydropower and agriculture allocations in the Blue Nile basin, Ethiopia, Int. J. Water Resour. D., 37, 208–233, https://doi.org/10.1080/07900627.2020.1745159, 2020.
Alfieri, L., Burek, P., Dutra, E., Krzeminski, B., Muraro, D., Thielen, J., and Pappenberger, F.: GloFAS – global ensemble streamflow forecasting and flood early warning, Hydrol. Earth Syst. Sci., 17, 1161–1175, https://doi.org/10.5194/hess-17-1161-2013, 2013.
Animashaun, I. M., Oguntunde, P. G., Akinwumiju, A. S., and Olubanjo, O. O.: Rainfall Analysis over the Niger Central Hydrological Area, Nigeria: Variability, Trend, and Change point detection, Scientific African, 8, e00419, https://doi.org/10.1016/j.sciaf.2020.e00419, 2020.
Arakawa, A. and Schubert, W. H.: Interaction of a cumulus cloud ensemble with the large-scale environment, Part I, J. Atmos. Sci., 31, 674–701, 1974.
Bliefernicht, J., Waongo, M., Salack, S., Seidel, J., Laux, P., and Kunstmann, H.: Quality and value of seasonal precipitation forecasts issued by the West African regional climate outlook forum, J. Appl. Meteorol. Clim., 58, 621–642, https://doi.org/10.1175/JAMC-D-18-0066.1, 2019.
Breuer, N. E., Fraisse, C. W., and Cabrera, V. E.: The Cooperative Extension Service as a boundary organization for diffusion of climate forecasts: A 5-year study, J. Extension, 48, 4RIB7, 5 pp., available at: https://www.joe.org/joe/2010august/rb7.php (last access: 21 September 2021), 2010.
Chen, F., Janjić, Z., and Mitchell, K.: Impact of atmospheric surface-layer parameterizations in the new land-surface scheme of the NCEP mesoscale Eta model, Bound.-Lay. Meteorol., 85, 391–421, https://doi.org/10.1023/A:1000531001463, 1997.
Cloud, K. A., Reich, B. J., Rozoff, C. M., Alessandrini, S., Lewis, W. E., and Delle Monache, L.: A feed forward neural network based on model output statistics for short-term hurricane intensity prediction, Weather Forecast., 34, 985–997, https://doi.org/10.1175/WAF-D-18-0173.1, 2019.
Clough, S., Shephard, M., Mlawer, E., Delamere, J., Iacono, M., Cady-Pereira, K., Boukabara, S., and Brown, P.: Atmospheric radiative transfer MODELING: A summary of the AER codes, J. Quant. Spectrosc. Ra., 91, 233–244, https://doi.org/10.1016/j.jqsrt.2004.05.058, 2005.
Dezfuli, A. K., Ichoku, C. M., Huffman, G. J., Mohr, K. I., Selker, J. S., Van De Giesen, N., Hochreutener, R., and Annor, F. O.: Validation of IMERG precipitation in Africa, J. Hydrometeorol., 18, 2817–2825, https://doi.org/10.1175/JHM-D-17-0139.1, 2017a.
Dezfuli, A. K., Ichoku, C. M., Mohr, K. I., and Huffman, G. J.: Precipitation characteristics in West and East Africa from satellite and in situ observations, J. Hydrometeorol., 18, 1799–1805, https://doi.org/10.1175/JHM-D-17-0068.1, 2017b.
Du, J., Liu, Y., Yu, Y., and Yan, W.: A prediction of precipitation data based on support vector machine and particle swarm optimization (PSO-SVM) algorithms, Algorithms, 10, 57, https://doi.org/10.3390/a10020057, 2017.
Funk, C., Peterson, P., Landsfeld, M., Pedreros, D., Verdin, J., Shukla, S., Husak, G., Rowland, J., Harrison, L., Hoell, A., and Michaelsen, J.: The climate hazards infrared precipitation with stations – a new environmental record for monitoring extremes, Sci. Data, 2, 1–21, https://doi.org/10.1038/sdata.2015.66, 2015 (data available at: https://www.chc.ucsb.edu/data, last access: 10 January 2022).
Gossett, M., Alcoba, M., Roca, R., Cloche, S., and Urbani, G.: Evaluation of TAPEER daily estimates and other GPM-era products against dense gauge networks in West Africa, analysing ground reference uncertainty, Q. J. Roy. Meteor. Soc., 144, 255–269, https://doi.org/10.1002/qj.3335, 2018.
Grell, G. A.: Prognostic evaluation of assumptions used by cumulus parameterizations, Mon. Weather Rev., 121, 764–787, https://doi.org/10.1175/1520-0493(1993)121<0764:PEOAUB>2.0.CO;2, 1993.
Gumindoga, W., Rientjes, T. H. M., Haile, A. T., Makurira, H., and Reggiani, P.: Performance of bias-correction schemes for CMORPH rainfall estimates in the Zambezi River basin, Hydrol. Earth Syst. Sci., 23, 2915–2938, https://doi.org/10.5194/hess-23-2915-2019, 2019.
Gupta, H. V., Kling, H., Yilmaz, K. K., and Martinez, G. F.: Decomposition of the mean squared error and NSE performance criteria: Implications for improving hydrological modelling, J. Hydrol., 377, 80–91, https://doi.org/10.1016/j.jhydrol.2009.08.003, 2009.
Haiden, T., Janousek, M., Vitart, F., Ben-Bouallegue, Z., Ferranti, L., Prates, C., and Richardson, D.: Evaluation of ECMWF forecasts, including the 2020 upgrade, ECMWF Tech. Memo 880, 54 pp., https://doi.org/10.21957/6njp8byz4, 2021.
Hou, A. Y., Kakar, R. K., Neeck, S., Azarbarzin, A. A., Kummerow, C. D., Kojima, M., Oki, R., Nakamura, K., and Iguchi, T.: The global precipitation measurement mission, B. Am. Meteorol. Soc., 95, 701–722, https://doi.org/10.1175/BAMS-D-13-00164.1, 2014.
Huffman, G. J., Bolvin, D. T., Nelkin, E. J., Wolff, D. B., Adler, R. F., Gu, G., Hong, Y., Bowman, K. P., and Stocker, E. F.: The TRMM Multisatellite Precipitation Analysis (TMPA): Quasi-Global, Multiyear, Combined-Sensor Precipitation estimates at fine scales, J. Hydrometeorol., 8, 38–55, https://doi.org/10.1175/jhm560.1, 2007.
Huffman, G. J., Adler, R., Bolvin, D., and Nelkin, E.: The TRMM Multi-Satellite Precipitation Analysis (TMPA), in: Satellite Rainfall Applications for Surface Hydrology, edited by: Gebremichael, M. and Hossain, F., Springer, Dordrecht, 3–22, https://doi.org/10.1007/978-90-481-2915-7_1, 2010.
Huffman, G. J., Bolvin, D. T., Braithwaite, D., Hsu, K., Joyce, R., Xie, P., and Yoo, S. H.: NASA Global Precipitation Measurement (GPM) Integrated Multi-satellite Retrievals for GPM (IMERG), Algorithm Theoretical Basis Document (ATBD), NASA/GSFC, Greenbelt, MD 20771, USA, 2015.
Huffman, G. J., Stocker, E. F., Bolvin, D. T., Nelkin, E. J., and Jackson J.: GPM IMERG Final Precipitation L3 1 day 0.1 degree × 0.1 degree V06, edited by: Savtchenko, A., Greenbelt, MD, Goddard Earth Sciences Data and Information Services Center (GES DISC) [data set], https://doi.org/10.5067/GPM/IMERGDF/DAY/06, 2019a.
Huffman, G. J., Stocker, E. F., Bolvin, D. T., Nelkin, E. J., and Jackson, J.: GPM IMERG Early Precipitation L3 1 day 0.1 degree × 0.1 degree V06, edited by: Savtchenko, A., Greenbelt, MD, Goddard Earth Sciences Data and Information Services Center (GES DISC) [data set], https://doi.org/10.5067/GPM/IMERGDE/DAY/06, 2019b.
Iacono, M. J., Mlawer, E. J., Clough, S. A., and Morcrette, J. J.: Impact of an improved longwave radiation model, RRTM, on the energy budget and thermodynamic properties of the NCAR community climate model, CCM3, J. Geophys. Res.-Atmos., 105, 14873–14890, https://doi.org/10.1029/2000JD900091, 2000.
Jehanzaib, M., Bilal Idrees, M., Kim, D., and Kim, T. W.: Comprehensive Evaluation of Machine Learning Techniques for Hydrological Drought Forecasting, J. Irrig. Drain. E., 147, 04021022, https://doi.org/10.1061/(ASCE)IR.1943-4774.0001575, 2021.
Jiang, M., Feng, J., Li, Z., Sun, R., Hou, Y.-T., Zhu, Y., Wan, B., Guo, J., and Cribb, M.: Potential influences of neglecting aerosol effects on the NCEP GFS precipitation forecast, Atmos. Chem. Phys., 17, 13967–13982, https://doi.org/10.5194/acp-17-13967-2017, 2017.
JMA: Outline of the operational numerical weather prediction at the Japan Meteorological Agency (Appendix to WMO numerical weather prediction progress report), Japan Meteorological Agency, 47 pp., available at: https://www.jma.go.jp/jma/jma-eng/jma-center/nwp/outline2019-nwp/index.htm (last access: February 2021), 2019.
Kling, H., Fuchs, M., and Paulin, M.: Runoff conditions in the upper Danube basin under an ensemble of climate change scenarios, J. Hydrol., 424, 264–277, 2012.
Koppa, A., Gebremichael, M., Zambon, R. C., Yeh, W. W. G., and Hopson, T. M.: Seasonal Hydropower Planning for Data-Scarce Regions Using Multimodel Ensemble Forecasts, Remote Sensing Data, and Stochastic Programming, Water Resour. Res., 55, 8583–8607, https://doi.org/10.1029/2019WR025228, 2019.
Lehner, B., Verdin, K., and Jarvis, A.: New global hydrography derived from spaceborne elevation data, EOS T. Am. Geophys. Un., 89, 93–94, 2008.
Lehner, B., Reidy Liermann, C., Revenga, C., Vörösmarty, C., Fekete, B., Crouzet, P., Döll, P., Endejan, M., Frenken, K., Magome, J., Nilsson, C., Robertson, J. C., Rodel, R., Sindorf, N., and Wisser, D.: High-resolution mapping of the world's reservoirs and dams for sustainable river-flow management, Front. Ecol. Environ., 9, 494–502, https://doi.org/10.1890/100125, 2011.
Lien, G. Y., Kalnay, E., Miyoshi, T., and Huffman, G. J.: Statistical properties of global precipitation in the NCEP GFS model and TMPA observations for data assimilation, Mon. Weather Rev., 144, 663–679, https://doi.org/10.1175/MWR-D-15-0150.1, 2016.
Maranan, M., Fink, A. H., Knippertz, P., Amekudzi, L. K., Atiah, W. A., and Stengel, M.: A process-based validation of GPM IMERG and its sources using a mesoscale rain gauge network in the West African forest zone, J. Hydrometeorol., 21, 729–749, 2020.
Mase, A. S. and Prokopy, L. S.: Unrealized Potential: A review of perceptions and use of weather and climate infor- mation in agricultural decision making, Weather Clim. Soc., 6, 47–61, https://doi.org/10.1175/Wcas-D-12-00062.1, 2014.
Mlawer, E. J., Taubman, S. J., Brown, P. D., Iacono, M. J., and Clough, S. A.: Radiative transfer for inhomogeneous atmospheres: RRTM, a validated correlated-k model for the longwave, J. Geophys. Res.-Atmos., 102, 16663–16682, 1997.
NCEP (National Centers for Environmental Prediction/National Weather Service/NOAA/U.S. Department of Commerce): NCEP GFS 0.25 Degree Global Forecast Grids Historical Archive, updated daily, Research Data Archive at the National Center for Atmospheric Research, Computational and Information Systems Laboratory [data set], https://doi.org/10.5065/D65D8PWK, 2015.
NCEP (National Centers for Environmental Prediction): National Centers for Environmental Prediction: The Global Forecast System (GFS)-Global Spectral Model (GSM), available at: https://www.emc.ncep.noaa.gov/emc/pages/numerical_forecast_systems/gfs/documentation.php, last access: September 2021a.
NCEP (National Centers for Environmental Prediction): National Centers for Environmental Prediction: FV3: The GFDL Finite-Volume Cubed-Sphere Dynamical Core, available at: https://www.gfdl.noaa.gov/fv3/, last access: September 2021b.
Pandya, R., Hodgson, A., Hayden, M. H., Akweongo, P., Hopson, T., Forgor, A. A., Yoksas, T., Dalaba, M. A., Dukic, V., Mera, R., and Dumont, A., McCormack, K., Anaseba, D., Awine, T., Boehnert, J., Nyaaba, G., Laing, A., and Semazzi, F.: Using weather forecasts to help manage meningitis in the West African Sahel, B. Am. Meteorol. Soc., 96, 103–115, https://doi.org/10.1175/Bams-D-13-00121.1, 2015.
Patt, A. G., Ogallo, L., and Hellmuth, M.: Sustainability – Learning from 10 years of climate outlook forums in Africa, Science, 318, 49–50, https://doi.org/10.1126/science.1147909, 2007.
Pirret, J. S., Daron, J. D., Bett, P. E., Fournier, N., and Foamouhoue, A. K.: Assessing the skill and reliability of seasonal climate forecasts in Sahelian West Africa, Weather Forecast., 35, 1035–1050, https://doi.org/10.1175/WAF-D-19-0168.1, 2020.
Prasad, R., Deo, R. C., Li, Y., and Maraseni, T.: Weekly soil moisture forecasting with multivariate sequential, ensemble empirical mode decomposition and Boruta-random forest hybridizer algorithm approach, Catena, 177, 149–166, https://doi.org/10.1016/j.catena.2019.02.012, 2019.
Putman, W. M. and Lin, S.-J.: Finite-volume transport on various cubed-sphere grids, J. Comput. Phys., 227, 55–78, https://doi.org/10.1016/j.jcp.2007.07.022, 2007.
Roudier, P., Alhassane, A., Baron, C., Louvet, S., and Sultan, B.: Assessing the benefits of weather and seasonal forecasts to millet growers in Niger, Agr. Forest Meteorol., 223, 168–180, https://doi.org/10.1016/j.agrformet.2016.04.010, 2016.
Saha, S., Moorthi, S., Wu, X., Wang, J., Nadiga, S., Tripp, P., Behringer, D., Hou, Y.-T., Chuang, H.-Y., Iredell, M., Ek, M., Meng, J., Yang, R., Mendez, M. P., van den Dool, H., Zhang, Q., Wang, W., Chen, M., and Becker, E.: The NCEP climate forecast system version 2, J. Climate, 27, 2185–2208, https://doi.org/10.1175/JCLI-D-12-00823.1, 2014.
Satgé, F., Defrance, D., Sultan, B., Bonnet, M. P., Seyler, F., Rouché, N., and Paturel, J. E.: Evaluation of 23 gridded precipitation datasets across West Africa, J. Hydrol., 581, 124412, https://doi.org/10.1016/j.jhydrol.2019.124412, 2020.
Sorí, R., Nieto, R., Drumond, A., and Gimeno, L.: The Niger River Basin Moisture Sources: A Lagrangian Analysis, Atmosphere, 8, 38, https://doi.org/10.3390/atmos8020038, 2017.
Sridevi, C., Singh, K. K., Suneetha, P., Durai, V. R., and Kumar, A.: Rainfall forecast skill of Global Forecasting System (GFS) model over India during summer monsoon 2015, Geofizika, 35, 39–52, https://doi.org/10.15233/gfz.2018.35.4, 2018.
Sylla, M. B., Faye, A., Giorgi, F., Diedhiou, A., and Kunstmann, H.: Projected heat stress under 1.5 ∘C and 2 ∘C global warming scenarios creates unprecedented discomfort for humans in West Africa, Earth's Future, 6, 1029–1044, https://doi.org/10.1029/2018EF000873, 2018.
Tian, D., Wood, E. F., and Yuan, X.: CFSv2-based sub-seasonal precipitation and temperature forecast skill over the contiguous United States, Hydrol. Earth Syst. Sci., 21, 1477–1490, https://doi.org/10.5194/hess-21-1477-2017, 2017.
Towner, J., Cloke, H. L., Zsoter, E., Flamig, Z., Hoch, J. M., Bazo, J., Coughlan de Perez, E., and Stephens, E. M.: Assessing the performance of global hydrological models for capturing peak river flows in the Amazon basin, Hydrol. Earth Syst. Sci., 23, 3057–3080, https://doi.org/10.5194/hess-23-3057-2019, 2019.
van de Giesen, N., Hut, R., and Selker, J.: The trans-African hydro-meteorological observatory (TAHMO), WIRES Water, 1, 341–348, https://doi.org/10.1002/wat2.1034, 2014.
Wang, J. W. A., Sardeshmukh, P. D., Compo, G. P., Whitaker, J. S., Slivinski, L. C., McColl, C. M., and Pegion, P. J.: Sensitivities of the NCEP global forecast system, Mon. Weather Rev., 147, 1237–1256, https://doi.org/10.1175/MWR-D-18-0239.1, 2019.
Wang, T., Chu, C., Sun, X., and Li, T.: Improving real-time forecast of intraseasonal variabilities of Indian summer monsoon precipitation in an empirical scheme, Front. Earth Sci., 408, 577311, https://doi.org/10.3389/feart.2020.577311, 2020.
Xu, L., Chen, N., Zhang, X., Chen, Z., Hu, C., and Wang, C.: Improving the North American multi-model ensemble (NMME) precipitation forecasts at local areas using wavelet and machine learning, Clim. Dynam., 53, 601–615, https://doi.org/10.1007/s00382-018-04605-z, 2019.
Yu, P. S., Yang, T. C., Chen, S. Y., Kuo, C. M., and Tseng, H. W.: Comparison of random forests and support vector machine for real-time radar-derived rainfall forecasting, J. Hydrol., 552, 92–104, https://doi.org/10.1016/j.jhydrol.2017.06.020, 2017.
Yuan, X., Wood, E. F., and Liang, M.: Integrating weather and climate prediction: toward seamless hydrologic forecasting, Geophys. Res. Lett., 41, 5891–5896, https://doi.org/10.1002/2014GL061076, 2014.