the Creative Commons Attribution 4.0 License.
the Creative Commons Attribution 4.0 License.
 | 18 Mar 2022
Contrasting changes in hydrological processes of the Volta River basin under global warming
Mathieu Vrac
Natalie Ceperley
Sander J. Zwart
Josh Larsen
Simon J. Dadson
Grégoire Mariéthoz
Bettina Schaefli
A comprehensive evaluation of the impacts of climate change on water resources of the West Africa Volta River basin is conducted in this study, as the region is expected to be hardest hit by global warming. A large ensemble of 12 general circulation models (GCMs) from the fifth Coupled Model Intercomparison Project (CMIP5) that are dynamically downscaled by five regional climate models (RCMs) from the Coordinated Regional-climate Downscaling Experiment (CORDEX)-Africa is used. In total, 43 RCM–GCM combinations are considered under three representative concentration pathways (RCP2.6, RCP4.5, and RCP8.5). The reliability of each of the climate datasets is first evaluated with satellite and reanalysis reference datasets. Subsequently, the Rank Resampling for Distributions and Dependences (R2D2) multivariate bias correction method is applied to the climate datasets. The bias-corrected climate projections are then used as input to the mesoscale Hydrologic Model (mHM) for hydrological projections over the 21st century (1991–2100).
Results reveal contrasting dynamics in the seasonality of rainfall, depending on the selected greenhouse gas emission scenarios and the future projection periods. Although air temperature and potential evaporation increase under all RCPs, an increase in the magnitude of all hydrological variables (actual evaporation, total runoff, groundwater recharge, soil moisture, and terrestrial water storage) is only projected under RCP8.5. High- and low-flow analysis suggests an increased flood risk under RCP8.5, particularly in the Black Volta, while hydrological droughts would be recurrent under RCP2.6 and RCP4.5, particularly in the White Volta. The evolutions of streamflow indicate a future delay in the date of occurrence of low flows up to 11 d under RCP8.5, while high flows could occur 6 d earlier (RCP2.6) or 5 d later (RCP8.5), as compared to the historical period.
Disparities are observed in the spatial patterns of hydroclimatic variables across climatic zones, with higher warming in the Sahelian zone. Therefore, climate change would have severe implications for future water availability with concerns for rain-fed agriculture, thereby weakening the water–energy–food security nexus and amplifying the vulnerability of the local population. The variability between climate models highlights uncertainties in the projections and indicates a need to better represent complex climate features in regional models. These findings could serve as a guideline for both the scientific community to improve climate change projections and for decision-makers to elaborate adaptation and mitigation strategies to cope with the consequences of climate change and strengthen regional socioeconomic development.
- Article
(4439 KB) - Full-text XML
-
Supplement
(6786 KB) - BibTeX
- EndNote


Climate warming is projected to occur faster in West Africa than the global average during the 21st century (Todzo et al., 2020). Anthropogenic greenhouse gas emissions have led to an unprecedented increase in surface air temperature, which has resulted in the intensification of the hydrological cycle (Sylla et al., 2016). Therefore, recurrent floods and droughts could persist in the future because rainfall is projected to decrease in frequency but increase in intensity (Aich et al., 2014; Dosio et al., 2020; Chagnaud et al., 2022). In the face of climate change and variability, West Africa is particularly vulnerable because of its high reliance on rain-fed agriculture and limited institutional capacities to cope with climate change and variability (Karambiri et al., 2011; Sultan and Gaetani, 2016; Yira et al., 2017). Climate change and anthropogenic pressures increase stress on water resources (Sood et al., 2013). Freshwater shortages that lead to a decline in basin-scale irrigation water availability could have dire consequences for sustainable agriculture (Sylla et al., 2018b). Consequently, global warming is a serious threat to water and food security in West Africa. However, addressing this threat is currently difficult given the high variability in climate projections, which can impose very different hydrological implications for West Africa (Dosio et al., 2020), thus imposing greater urgency for further investigations on the impacts of climate change on hydrological processes.
In the transboundary Volta River basin (VRB) located in West Africa, water resources are fundamental for agriculture, hydropower generation, fisheries, and other ecosystem services (Williams et al., 2016). Most of the agriculture is rain fed, but many regions rely on irrigated agriculture (Roudier et al., 2014). Hydropower is a major source of electricity production, with the potential to grant more access to energy in the region (Kling et al., 2016; Stanzel et al., 2018). Future water resource developments in the VRB focus primarily on hydroelectricity and irrigation (McCartney et al., 2012). However, severe impacts of climate change on water resources in the VRB will impede future socioeconomic development (Sood et al., 2013). Anticipation of the future evolution of the hydrological cycle in the VRB is essential to ensure the adaptive capacities of the riparian countries to the regional consequences of global warming (Jin et al., 2018). However, there is relatively little knowledge of the impacts of climate change on the future water resources in West Africa in general (e.g. Kasei, 2010; Oyerinde et al., 2016; Yira et al., 2017) and only a few studies targeted the VRB (Jung et al., 2012; Okafor et al., 2019; Roudier et al., 2014). These studies usually focused on climatic variables (i.e. precipitation and temperature), and when considering hydrological modelling, they usually focused on one variable (e.g. streamflow). The limitations of climate change impacts studies on water resources in West Africa arise from the lack of hydrological and meteorological observations to drive models, in addition to uncertainties related to climate projection data and hydrological models (Dembélé et al., 2019; Oyerinde et al., 2016; Sylla et al., 2018a). Despite considerable progress in improving climate projections and the efforts in investigating climate change in West Africa (e.g. Diallo et al., 2016; Kebe et al., 2017; Mahé et al., 2013; Nikiema et al., 2017), the need for understanding the future evolution of the hydrological cycle under varying scenarios still exists (Eyring et al., 2019; Sidibe et al., 2020; Sylla et al., 2016).
The goal of this study is to analyse the repercussions of projected changes in rainfall and temperature on the seasonal and annual trends of various components of the hydrological cycle (i.e. streamflow, total runoff, potential and actual evaporation, groundwater recharge, soil moisture, and terrestrial water storage) and water availability in the 21st century under multiple future scenarios. Therefore, this study investigates the evolutions of various hydrological processes in the VRB under a changing climate and the implications for water availability and extreme events like floods and droughts. The results can inform research and water planning to develop and implement adaptation and mitigation measures that alleviate the impacts of global warming in the VRB.
The Volta River basin (VRB) is a major transboundary basin in West Africa (Fig. 1), and the ninth-largest drainage basin in sub-Saharan Africa (UNEP-GEF, 2013). It is located between latitudes 5∘40′ and 14∘55′ N and longitudes 5∘25′ W and 2∘20′ E, and covers approximately 415,600 km2 shared among six countries (Benin, Burkina Faso, Côte d'Ivoire, Ghana, Mali, and Togo). The population of the VRB was estimated to 23.8 × 10⁶ people in 2010, and it is projected to reach 56.1 × 10⁶ in 2050 (Williams et al., 2016). The altitude ranges from zero to 940 m a.s.l. (above sea level), but the topography is predominantly flat, with a mean altitude of about 255 m a.s.l., as most of the basin lies below 400 m a.s.l. (Dembélé et al., 2020c). The land cover of the basin area is composed of savannah (75 %), cropland (13 %), forest (9 %), water bodies (2 %), and bare land and settlements (1 %). The climate is driven by the latitudinal and seasonal oscillation of the Intertropical Convergence Zone (ITCZ), which governs rainfall occurrence in the VRB. Rainfall depicts a south–north gradient of increasing aridity, with four eco-climatic zones (i.e. Sahelian, Sudano-Sahelian, Sudanian, and Guinean), and it is characterized by interannual and multidecadal variabilities (Nicholson et al., 2018). The Volta River flows north–south over 1850 km and drains into the Atlantic Ocean at the Gulf of Guinea after transiting into the Lake Volta formed by the Akosombo Dam. The drainage system is composed of four sub-basins known as Black Volta (152 800 km2), White Volta (113 400 km2), Oti (74 500 km2), and Lower Volta (74 900 km2; Dembélé, 2020).

Figure 1Physical and hydroclimatic characteristics of the Volta River basin. (a) Hydrographic network and climatic zones, (b) digital elevation model, and (c) land cover. Adapted from Dembélé et al. (2020b).
3.1 Overview of the methodology
The methodology adopted for assessing climate change impacts on water resources in the VRB is summarized in Fig. 2. The main steps consist of the bias correction of the RCMs forced by the GCMs, the modelling of hydrological processes based on the climate projection datasets, and the analysis of the future changes in the modelled hydrological processes.

Figure 2Overview of the procedure for assessing the impacts of climate change on hydrological processes.
Uncertainties in the climate projections are addressed by employing a large ensemble of 12 general circulation models (GCMs) downscaled by five regional climate models (RCMs) under three Representative Concentration Pathways (RCPs; Moss et al., 2010; Van Vuuren et al., 2011). The RCMs are obtained from the Coordinated Regional-climate Downscaling Experiment (CORDEX) for Africa (Giorgi et al., 2009). Only considering the highest RCP8.5 scenario as the business-as-usual scenario in climate change studies is increasingly criticized because the assumption of the heavy use of coal in RCP8.5 is unrealistic (Hausfather and Peters, 2020; Ritchie and Dowlatabadi, 2017). However, the current emissions are found to be in line with the RCP8.5 scenario (Peters et al., 2013), and there are suggestions for giving RCP8.5 a high priority (O'Neill et al., 2016).
The RCM–GCM datasets are first evaluated by comparing them to the best-performing satellite and reanalysis datasets of rainfall and temperature for hydrological modelling in the VRB. Subsequently, a multivariate bias correction is applied to the climate projection datasets using the Rank Resampling for Distributions and Dependences (R2D2) method (Vrac and Thao, 2020). Finally, the bias-corrected climate projection datasets are used as input in the fully distributed mesoscale Hydrologic Model (mHM) to assess the impact of climate change on multiple hydrological fluxes and state variables. Although the performance of a model during past and present conditions does not guarantee its reliability for future projections (Stanzel et al., 2018), having a well-performing model that simulates realistic hydrological processes is a prerequisite for any sound impact study (Krysanova et al., 2018).
3.2 Climate projection datasets
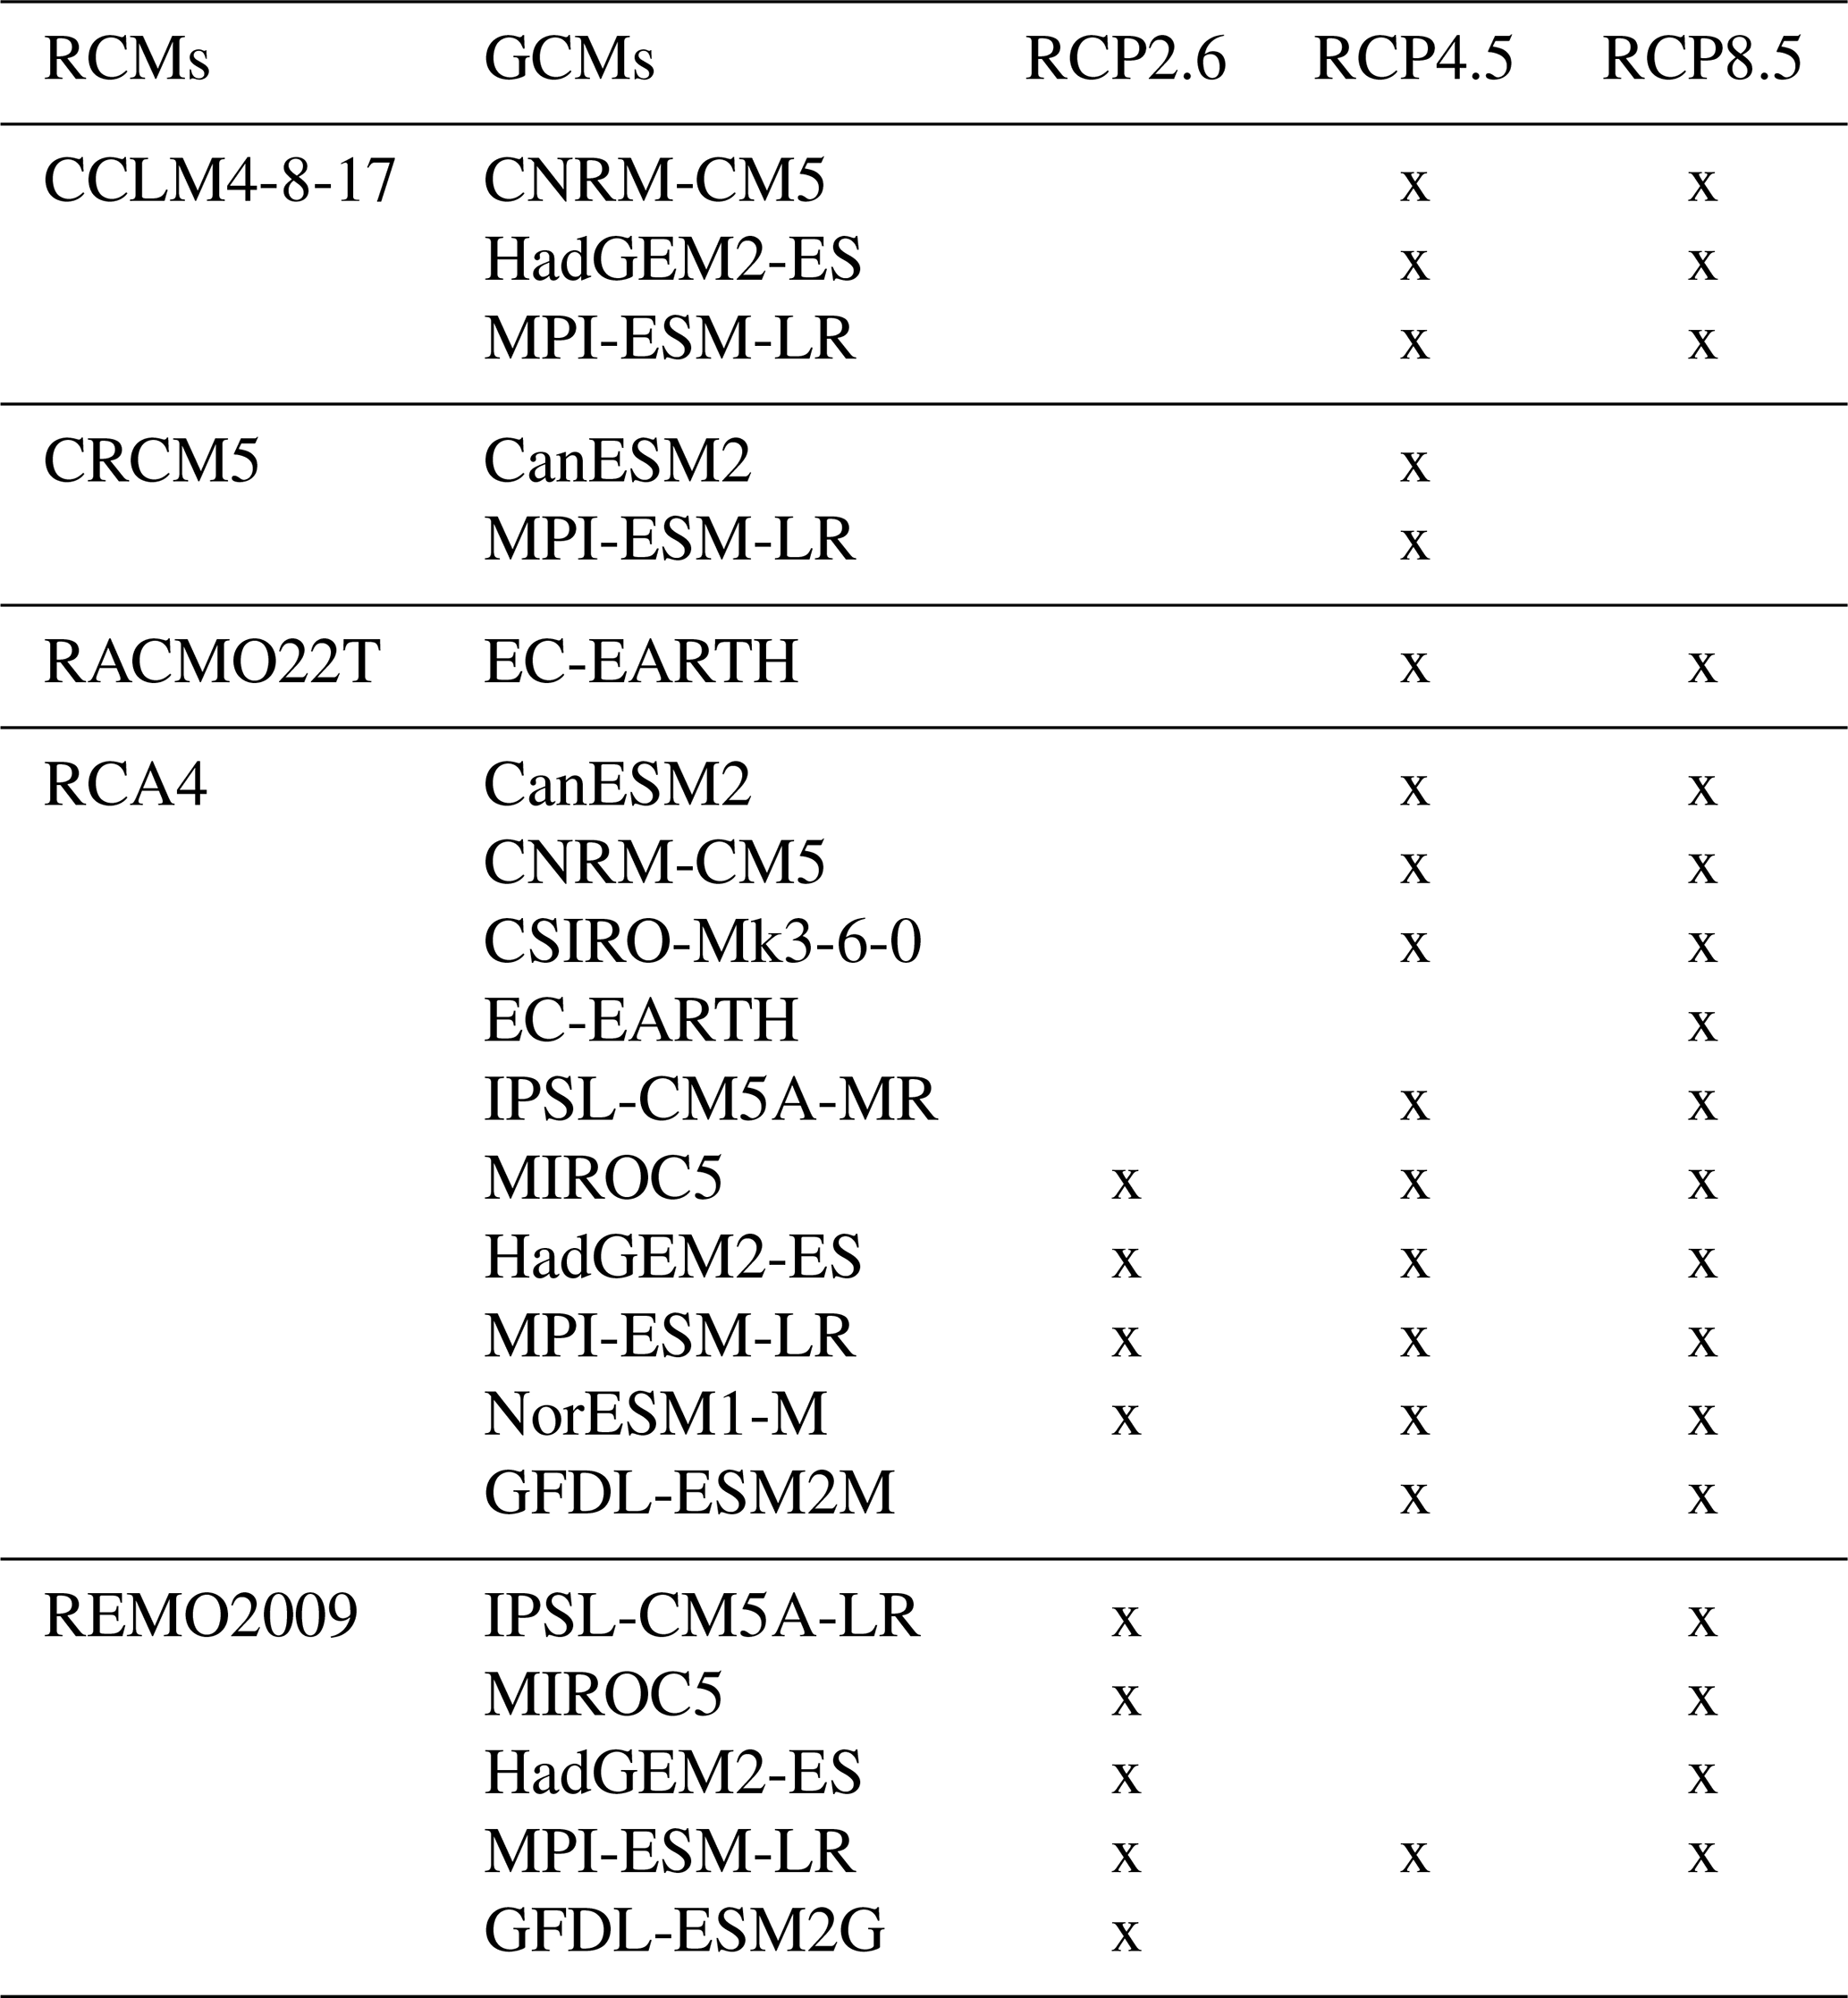
CORDEX generates high-resolution historical and future climate projections for regional domains, by downscaling GCMs participating in the fifth Coupled Model Intercomparison Project (CMIP5; Taylor et al., 2012). Based on data availability on the Earth System Grid Federation (ESGF) platform (https://esgf-data.dkrz.de, last access: 22 March 2020), 12 GCMs from CMIP5 dynamically downscaled with five RCMs available from the CORDEX-Africa initiative are selected for this study (Table 1). The spatial resolution of the RCMs is 0.44∘ (∼ 50 km) in latitude and longitude. As the RCMs do not downscale all the GCMs, there are 21 RCM–GCM combinations available for the global runs in the historical period (1951–2005), while 43 RCM–GCM combinations are available for the future projections (2006–2100) under various representative concentration pathways (RCP2.6, RCP4.5, and RCP8.5). The RCPs correspond to different scenarios of future concentrations and emissions of greenhouse gases and air pollutants, and land use change until 2100, relative to the preindustrial times (Moss et al., 2010; Van Vuuren et al., 2011). The three RCPs used in this study are (i) RCP2.6, corresponding to a mitigation scenario with a very low radiative forcing level that peaks at ∼ 3 W m−2 (∼ 490 ppm CO2 eq.) and declines to ∼ 2.6 W m−2 by 2100; (ii) RCP4.5, representing a medium stabilization scenario without overshoot pathway to 4.5 W m−2 (∼ 650 ppm CO2 eq.) at stabilization after 2100; and (iii) RCP8.5, corresponding to a very high emission scenario with rising radiative forcing pathway leading to 8.5 W m−2 (∼ 1370 ppm CO2 eq.) by 2100. Approximatively, RCP2.6 corresponds to a +2 ∘C global temperature stabilization by 2100, while RCP4.5 and RCP8.5 correspond to +3.5 and +5 ∘C increase in global temperature by 2100 (Konapala et al., 2020). The climate variables used in this study are daily data of rainfall and minimum, maximum, and average air temperature, which are obtained for the climate model realization r1i1p1.
Table 1List of the CORDEX-Africa general circulation models (GCMs) datasets downscaled by regional climate models (RCMs) and their availability per Representative Concentration Pathways (RCPs) marked with a cross (x).
3.3 Multivariate bias correction of climate data
Assessing the reliability of climate projections data for reproducing observations is a precondition to impact studies (Eyring et al., 2019). However, observations are also subject to uncertainties. To address these uncertainties, the climate projection datasets are evaluated with respect to 10 satellite-based and reanalysis-based rainfall datasets and six temperature datasets (Table 2). The selected satellite-based and reanalysis-based rainfall datasets demonstrated the best performances for large-scale hydrological modelling in the VRB, as shown by Dembélé et al. (2020c). Hereafter, the datasets composed of both satellite and reanalysis products will be referred to as observations.
Table 2Satellite- and reanalysis-based rainfall and temperature products for climate projection data evaluation. Note: P rainfall; T – temperature; NP – near present.
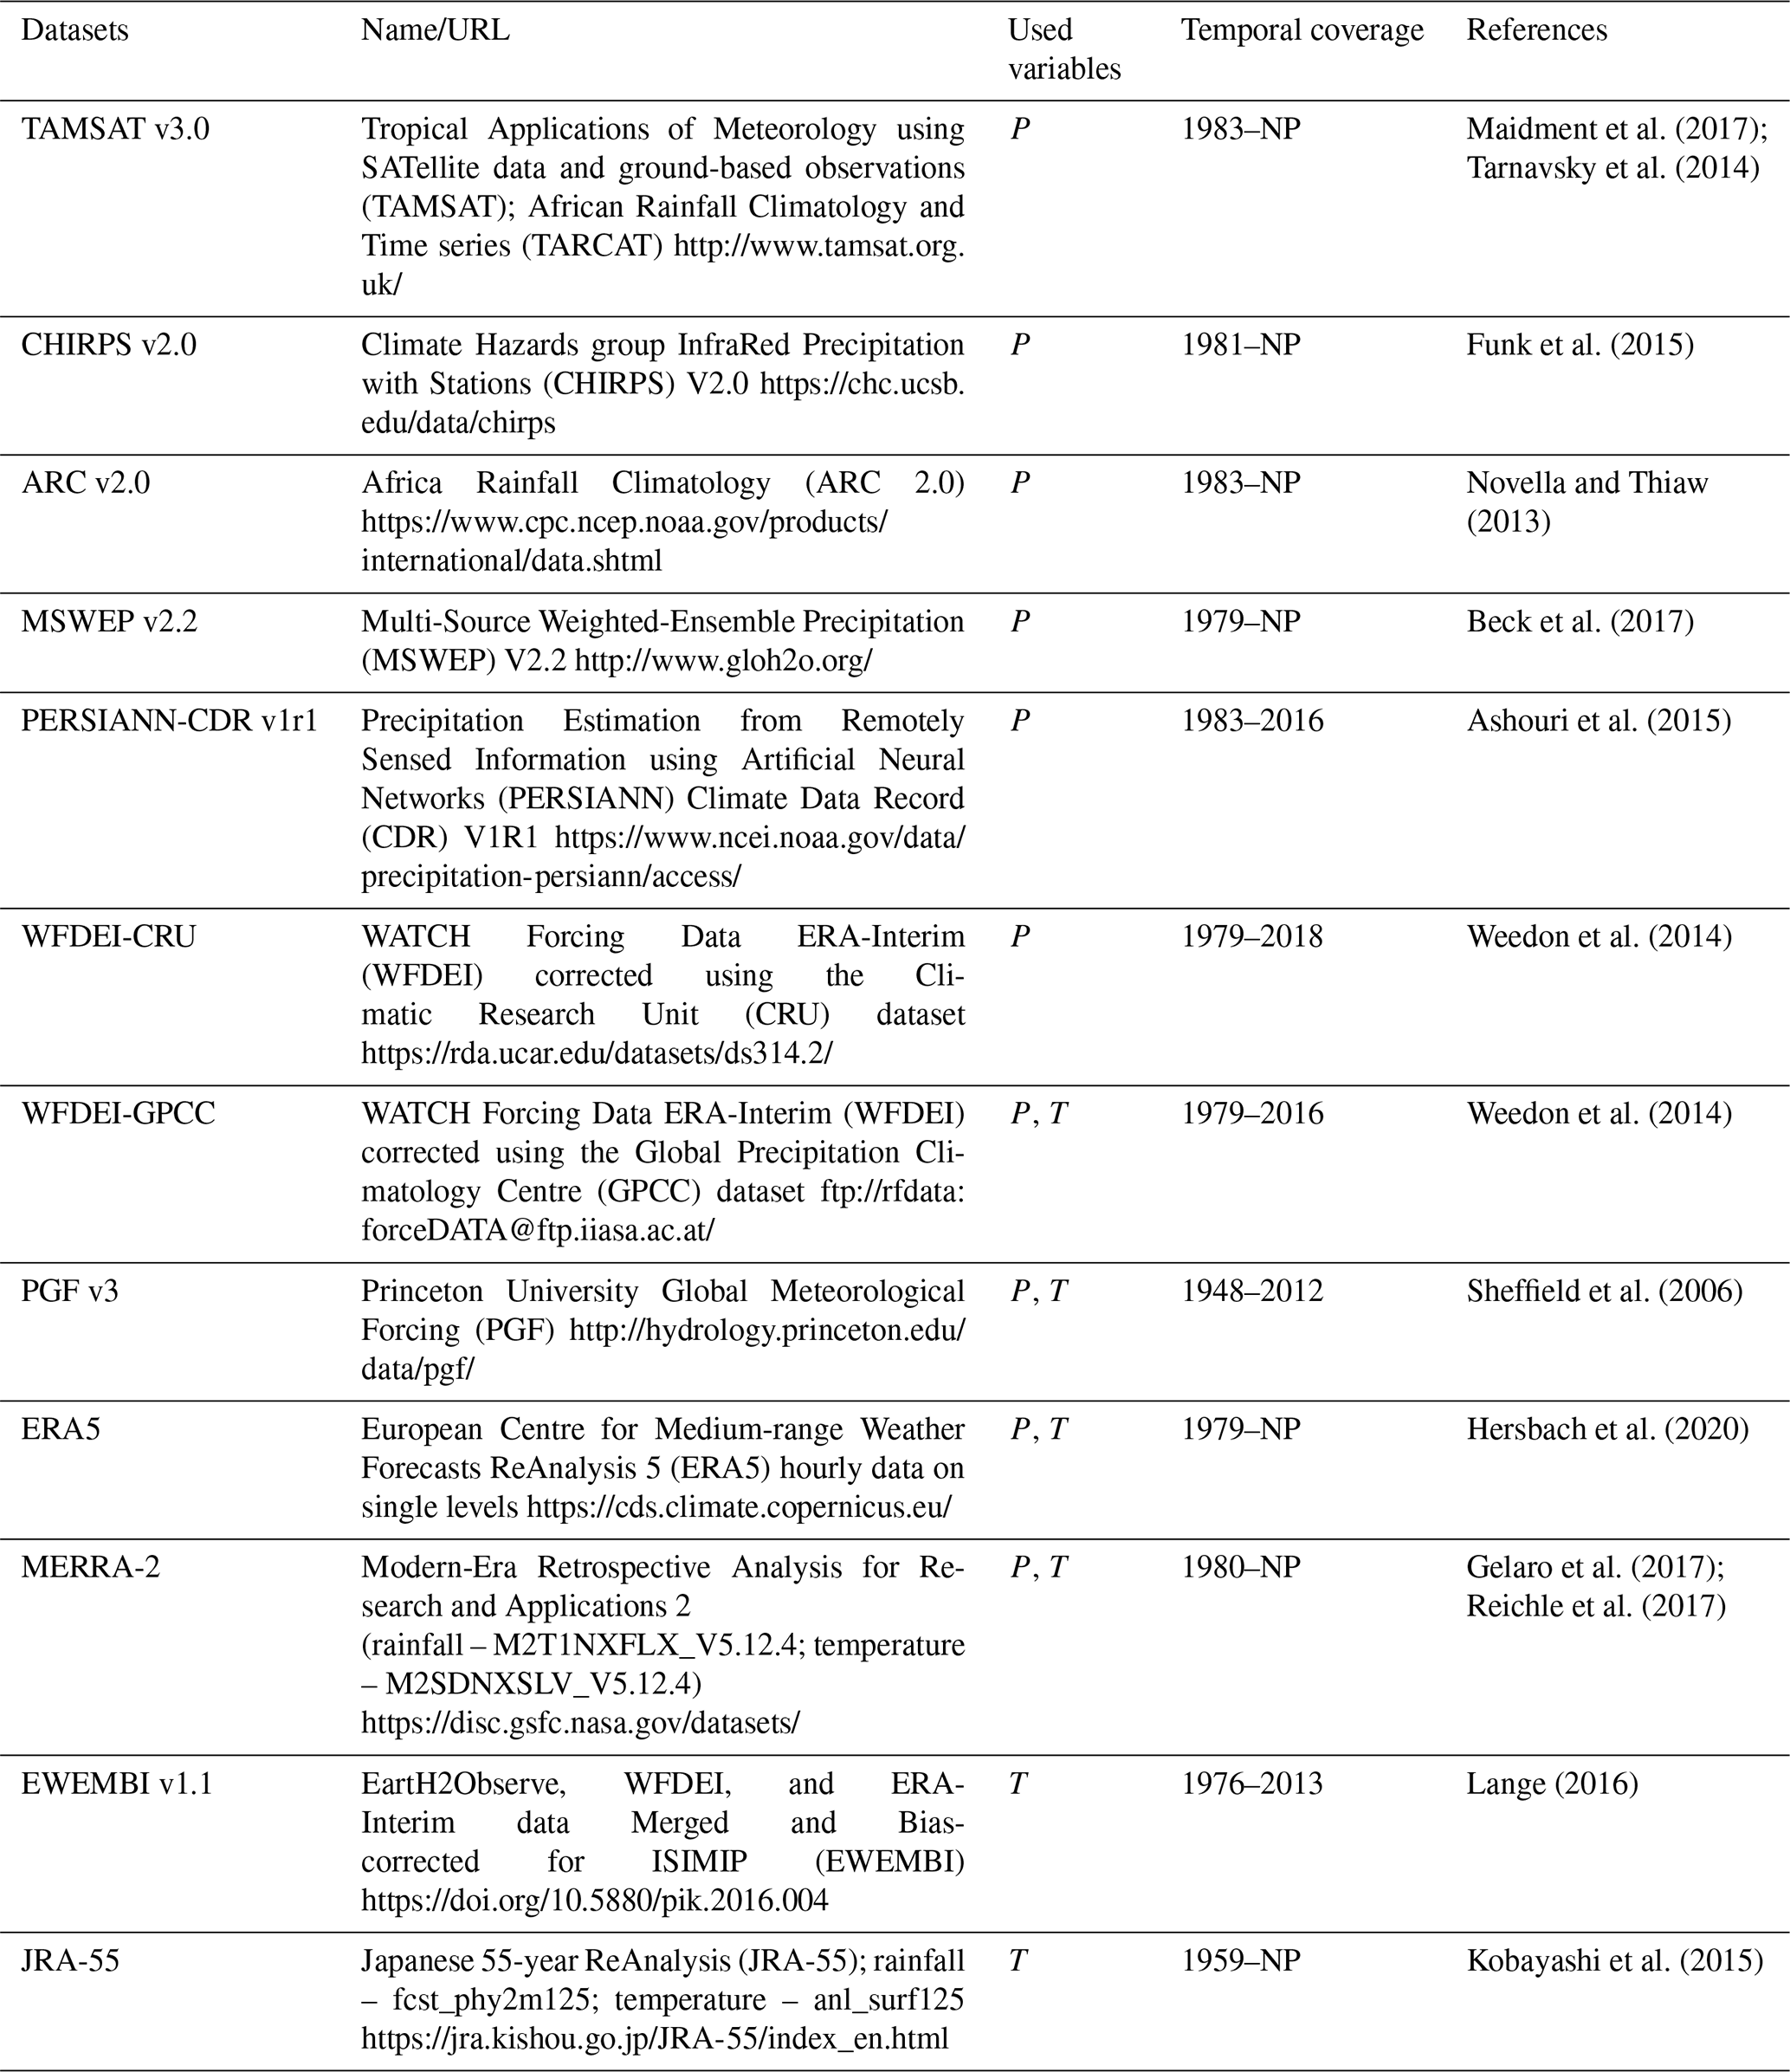
All links were last accessed on 14 March 2022.
As discrepancies are observed between the cumulative distribution functions of the observations and the climate projection datasets (Fig. 3), a bias correction is applied before using the climate datasets for hydrological modelling, as usually recommended (Hakala et al., 2018; Teutschbein and Seibert, 2012). The R2D2 method (Vrac and Thao, 2020) is adopted for a multivariate bias correction of the climatic variables. R2D2 is a rank analogue-based method that adjusts not only the univariate distributions of climatic variables but also the inter-variable and inter-site dependence structures (Vrac, 2018). Bias correction with the R2D2 approach is achieved in two steps. First, the marginal distributions of univariate time series are adjusted using any univariate bias correction method. Here, the cumulative distribution function transform (CDF-t) approach (e.g. Vrac et al., 2012) is used to adjust the marginal properties of the univariate time series. Second, R2D2 is used to adjust the dependence structure between several variables, independently of their marginal distribution (i.e. empirical copula function). R2D2 has performed better compared to other bias correction methods, as demonstrated by François et al. (2020).
In the current multivariate bias correction, rainfall and temperature datasets are corrected simultaneously to preserve the temporal and spatial dependences between the climatic variables. The bias correction is done using only one of the observational datasets as reference data, the WFDEI, because it has both rainfall and temperature data over a long period (1979–2016). Furthermore, the WFDEI dataset previously demonstrated good performances in the VRB (Dembélé et al., 2020b). Therefore, it is chosen as reference data to limit uncertainties in the bias correction (Tarek et al., 2021). The period 1981–2005 is taken as the reference period for training the bias correction of the climate projection datasets, whose time series are divided into several 25-year periods over the period 1951–2100 to correspond to the length of the reference period. The multivariate bias correction is applied by grouping the data per calendar month in each sub-period of 25 years, which improves seasonality in the corrected data.
3.4 Hydrological modelling
3.4.1 Model set-up and modelling period
The fully distributed mesoscale Hydrologic Model (mHM) simulates dominant hydrological processes with seamless spatiotemporal patterns in the modelling domain (Kumar et al., 2013; Samaniego et al., 2010, 2017). Telteu et al. (2021) provide a description of the formulation of hydrological processes in mHM. The model configuration is similar to the study of Dembélé et al. (2020b), which provides full details on the model set-up, calibration, evaluation, and performance across scales (see Fig. 8). The study also demonstrates the ability of the mHM model to reproduce reliable spatiotemporal patterns of various hydrological processes after a robust multivariate model calibration with streamflow and satellite data of evaporation, soil moisture, and water storage.
The calibrated model is run over the entire data availability period (1951–2100) of the RCM–GCM datasets, with 1951–1960 as spin-up period. The baseline or historical period for climate change impact assessment is 1991–2020, which is chosen to have a more recent context for understanding climate change (Hawkins and Sutton, 2016). Projections are assessed for the near-term future (2021–2050), the long-term future (2051–2080), and the late century (2071–2100). In total, 21 RCM–GCM combinations are available for the historical runs, while for future projections, 9 RCM–GCM combinations are available for the RCP2.6, 16 for RCP4.5, and 18 for RCP8.5 (Table 1). Although future land use and land cover (LULC) scenarios are not used in this study, the temporal dynamic of LULC is accounted for by using different maps over the modelling period. Based on high-resolution LULC data available between 1992 and 2015 from the European Space Agency Climate Change Initiative (ESA, 2017), LULC maps for 1992, 2005, and 2015 are used for the periods 1951–1990, 1991–2020, and 2021–2100, respectively. The Hargreaves and Samani (1985) method is used to calculate potential evaporation. Here, the term evaporation involves all sources of evaporation, including transpiration (Miralles et al., 2020; Savenije, 2004).
3.4.2 Model reliability
The realism of the hydrological simulations is verified with the Budyko framework (Budyko, 1974), which helps to estimate mean annual water availability as a function of aridity. The supply–demand framework, which is increasingly used in hydrological modelling (Greve et al., 2020; Wang et al., 2016), is valid for large catchments under a steady state, considering long-term water balance and energy balance (Donohue et al., 2010; McVicar et al., 2012). The exercise consists of verifying if the ratio of the long-term mean annual potential evaporation to precipitation (aridity index) and the ratio of long-term mean actual evaporation to precipitation (evaporative index) of the climate projections are coherent with the energy and water limits for a given climate (Sposito, 2017; Donohue et al., 2011). The Budyko curve is formulated with Eq. (1), after Budyko (1974), as follows:
where is the long-term mean annual precipitation, is the long-term mean annual actual evaporation, and ϕ is the aridity index.
3.4.3 Timing of high and low flows
The streamflow (Q) projections at the outlets of the sub-basins in the VRB are used for the analysis of high and low flows. Here, high flows correspond to streamflow with a return period of 10 years, i.e. streamflow peaks that are equalled or exceeded for 10 % of the time (Q10). Low flows represent streamflow that is equalled or exceeded for 90 % of the time (Q90). Therefore, Q90 and Q10 are the 10th and 90th percentiles of daily streamflow, corresponding to the 90 % and 10 % probability of exceedance, respectively. An increase in Q10 implies an increase in flood risk, whereas a decrease in Q90 represents a higher risk for river drought (Aich et al., 2014). The streamflow gauges are Bui-Amont, Daboya, and Saboba at the outlets of the Black Volta, White Volta, and Oti sub-basins (Fig. 1), respectively. No gauge at the outlet of the Lower Volta sub-basin was available for the study.
The timing of high and low flows is assessed by first estimating the dates on which the annual Q10 and Q90 occurred for each of the individual 30-year historical period and future periods. Subsequently, the method of circular statistics (Mardia, 1972, 1975) is used to calculate the mean date of occurrence (measure of average seasonality) and the interannual variation in the date of occurrence (measure of dispersion of events) of Q10 and Q90 (e.g. Blöschl et al., 2017; Laaha and Blöschl, 2006; Vlach et al., 2020). The approach of circular statistics converts Julian dates into angular values corresponding to locations on the circumference of a circle and avoids problems with calculating the mean date when the dates of occurrence fall around the end or the beginning of a calendar year (Chen et al., 2013; Young et al., 2000; Hanus et al., 2021). The calendar date of occurrence is converted to an angular value as follows:
where θi is the angular date of occurrence in radians, Di varies between 1 and 365 (366 for leap years) and corresponds to the Julian date of occurrence of the flow event (e.g. Q10 or Q90) in the calendar year i, and mi is the number of days in that year.
The average date of occurrence is calculated as follows:
with the following:
where and represent the cosine and sine components of the average date, respectively, is the average number of days per year, and n is the total number of years.
The concentration of the dates of occurrence around the average date is given by the mean resultant R, as follows:
When R approaches 1, the timing of the flow event (Q10 or Q90) is highly seasonal (the events occur on the same day of the year), but a small value of R near 0 indicates a high interannual variability of the date of occurrence (events are evenly distributed over the year).
3.5 Analysis of changes and variability
Variability in the model inputs and outputs resulting from different climate models are assessed using the second-order coefficient of variation (V2), which addresses the limitations of the classical coefficient of variation (Kvålseth, 2017), and is defined as follows:
where s is the standard deviation, and is the mean of a sample data x= (x1, …, xn)∈Rn. V2 represents the distance between x and relative to the distance between x and the origin zero, and it varies from 0 to 1 or 0 % to 100 %.
The relative changes in hydroclimatic variables between the various future periods and the historical period are calculated as follows:
where ΔX corresponds to the relative future change in the average variable X over a given future period (2021–2050; 2051–2080; 2071–2100) as compared to the baseline or historical period (1991–2020). Only the numerator of Eq. (8) is considered for the calculation of absolute changes.
Finally, the percentage of the RCM–GCM agreement is calculated as the number of models agreeing on the same direction of change (i.e. increase or decrease) relative to the total number of models, which shows the robustness of the ensemble of climate projections.
4.1 Multivariate bias correction
The raw RCM–GCM datasets are evaluated by comparing their cumulative distribution functions to those of the observations over the period 1983–2005 corresponding to the concomitant availability period of all the observation datasets (Fig. 3). The distribution of most of the raw RCM–GCM datasets presents discrepancies with the observations, with larger gaps for temperature than rainfall. The multivariate bias correction with the R2D2 method visually performs well by adjusting the distributions of the RCM–GCM datasets to the WFDEI reference dataset for all the climatic variables. Therefore, the corrected RCM–GCM datasets are expected to provide reliable hydrological simulations in the VRB.
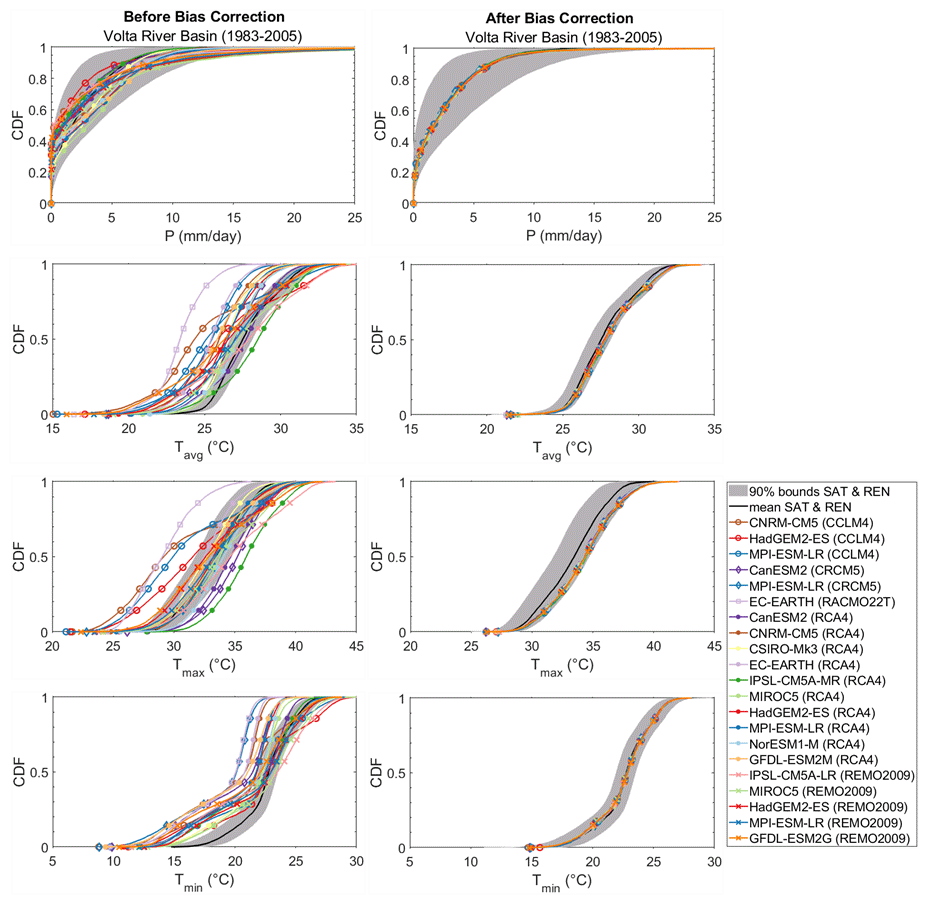
Figure 3Cumulative distribution functions (CDFs) of daily rainfall (P) and average, maximum, and minimum daily air temperature (Tavg, Tmax, and Tmin) before and after multivariate bias correction of various RCM–GCM datasets over the 1983–2005 historical period. The black line and grey shaded area represent the mean and the 90 % confidence interval of the satellite and reanalysis datasets of rainfall (10 datasets) and temperature (six datasets).
4.2 Plausibility of hydrological simulations
The general plausibility, here used to mean water and energy balance consistency within the Budyko framework, of the hydrological simulations using various RCM–GCM datasets as inputs to the mHM model under various RCPs and various periods is illustrated in Fig. 4.
All the RCM–GCM datasets provide plausible hydrological simulations, at least in terms of water and energy balance, as they respect the water and energy limits imposed within the Budyko framework. On average, the evaporative index () is between 0.86 and 0.97, while the aridity index () is between 2.2 and 4.4, which corresponds to expected values for sub-humid and semi-arid environments such as the VRB (Gunkel and Lange, 2017). It is noteworthy that future projections are shifted towards a lower evaporative index, and they have larger model-dependent variability in aridity ranges, particularly under RCP4.5 and RCP8.5.
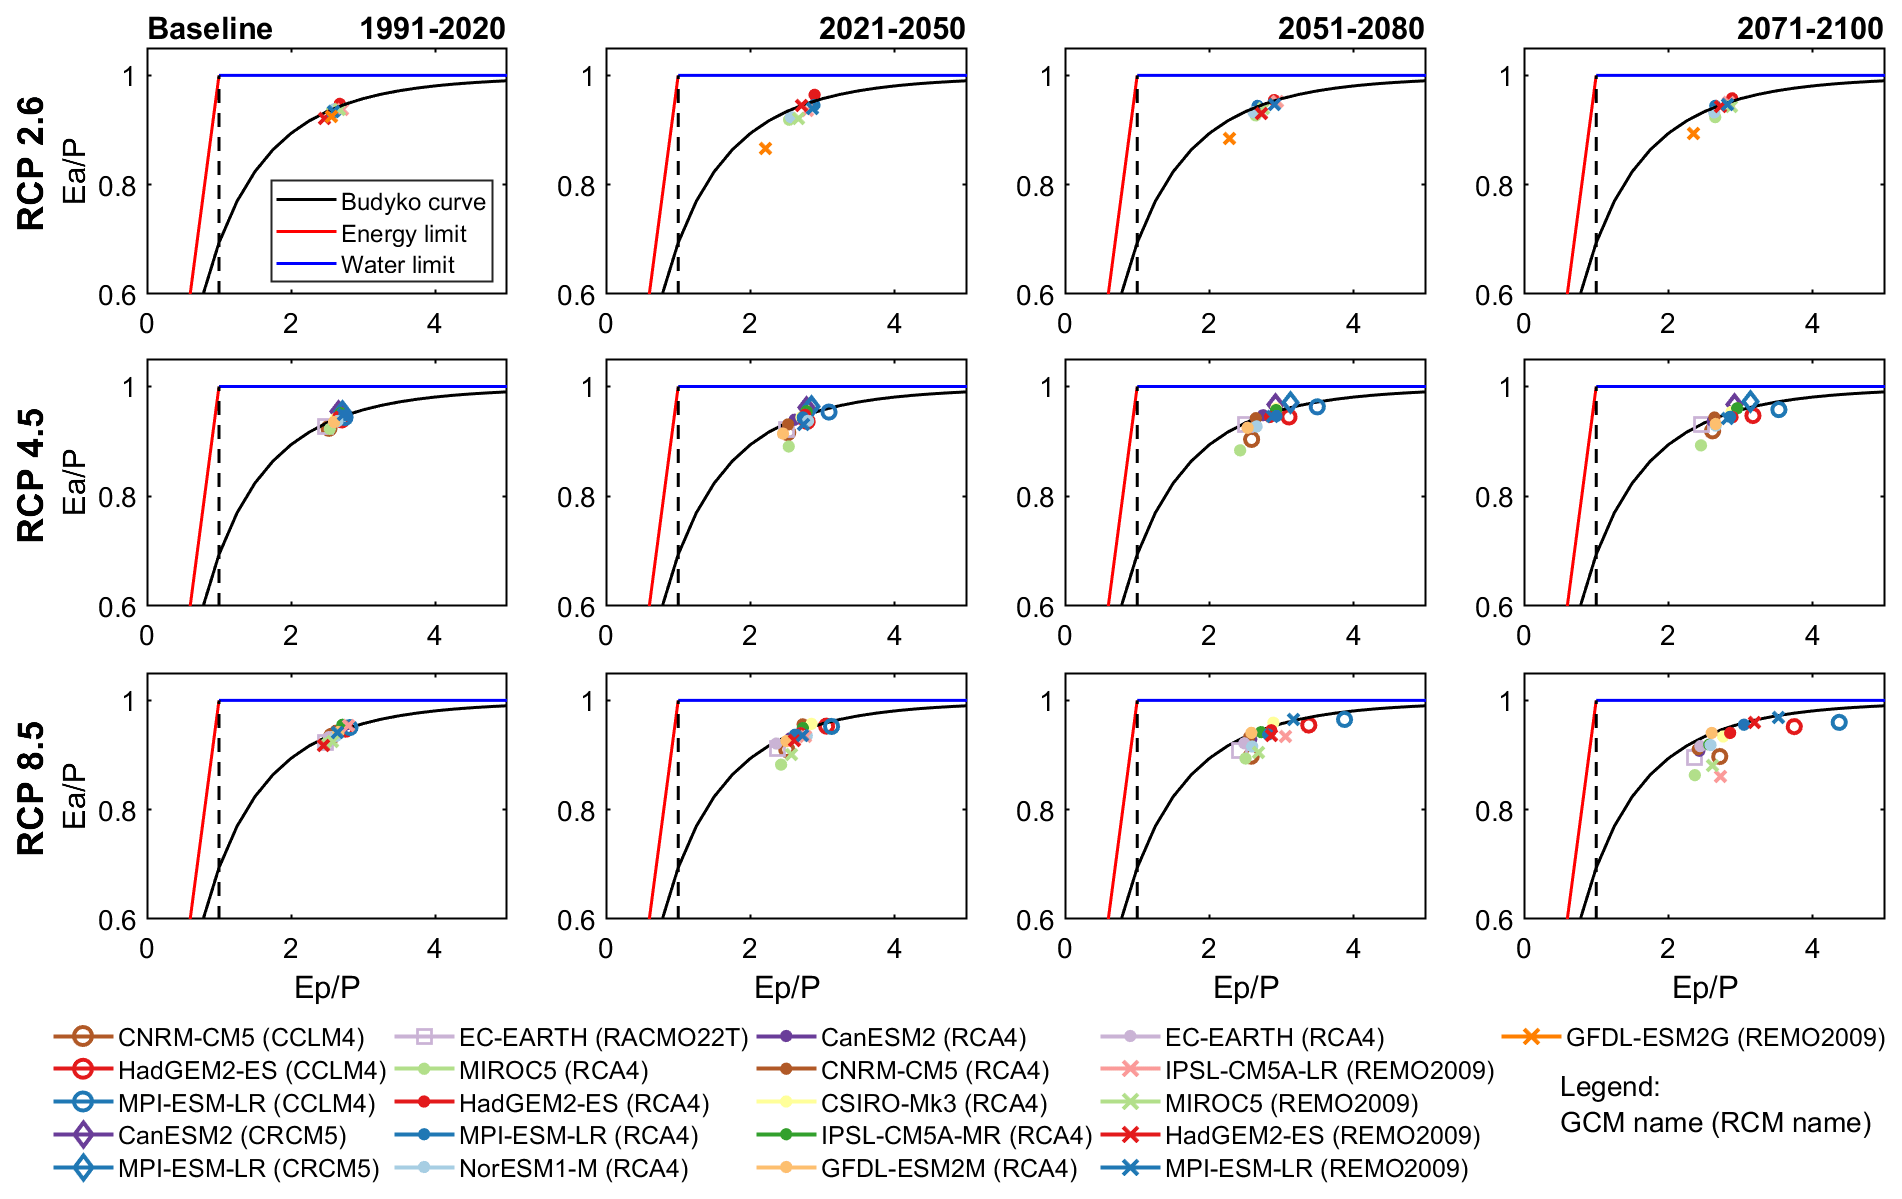
Figure 4Plausibility of hydrological processes with the Budyko framework representing the evaporative index, i.e. the ratio of actual evaporation to rainfall (), as a function of the aridity index, i.e. ratio of potential evaporation to rainfall (). The black dashed line represents the limit where precipitation equals potential evaporation.
4.3 Seasonal changes in hydroclimatic variables
The annual cycles of climatic and hydrological variables are illustrated in Fig. 5 for RCP8.5 (see Figs. S1–S10 for other RCPs). The hydroclimatic variables analysed are rainfall (P), average air temperature (Tavg), potential evaporation (Ep), actual evaporation (Ea), root zone soil moisture (Su), terrestrial water storage (St), total runoff (Qrun), and groundwater recharge (Rr). It is noteworthy that Tavg and Ep show a clear bimodal annual cycle in the VRB, with the first mode peaking between March and April, corresponding to the hottest period, while the second mode starts in September and peaks around October and November. For the hydroclimatic variables depicting a unimodal annual cycle, the peak of the cycle is observed around August and September, corresponding to the rainiest period.
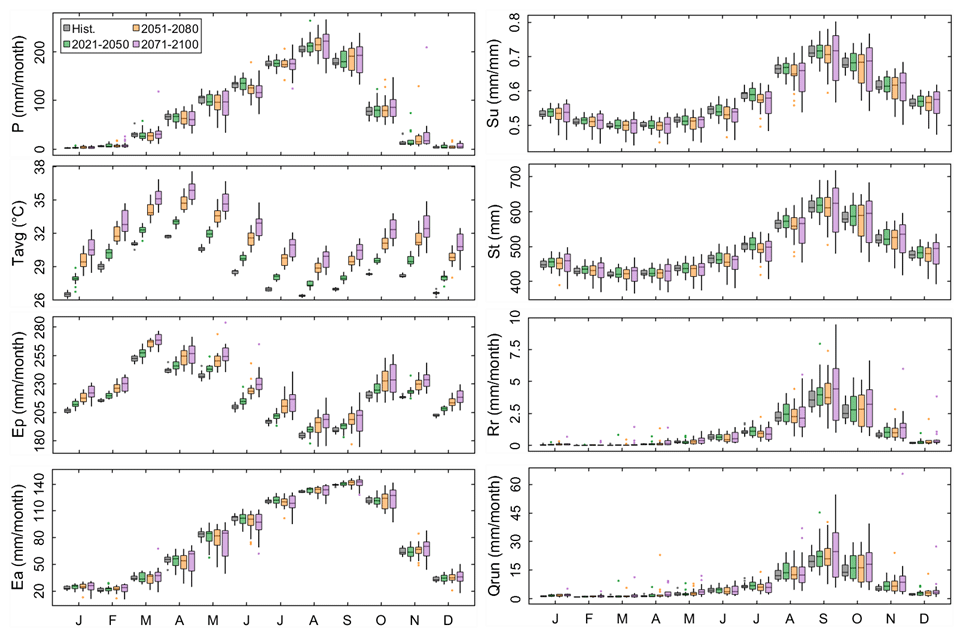
Figure 5Annual cycles of climatic and hydrological variables over the historical and future periods (under RCP8.5). Each box plot represents the spread among the RCM–GCMs combinations (18 models). P – rainfall; Tavg – average air temperature; Ep – potential evaporation; Ea – actual evaporation; Su – root zone soil moisture; St – terrestrial water storage; Qrun – total runoff; Rr – groundwater recharge. P and Tavg are RCM–GCM simulated, while the other variables come from the hydrological model.
The hydroclimatic variables depict contrasting seasonal changes across the RCPs over the future projection periods (Figs. 6 and 7). The mean monthly changes are calculated as the differences between the future periods and the historical period. Figures S11–S30 illustrate the distribution of changes in the seasonal cycle of the hydroclimatic variables across RCM–GCM combinations. Overall, monthly P is projected to increase between +2.9 % (RCP2.6) and +136.7 % (RCP8.5), on average, in the dry months (November–March) and decrease between −14 % (RCP8.5) and −0.6 % (RCP2.6) in the wet months (May–September) over the 21st century. However, the reduction in rainfall over the wet months is more accentuated from the beginning to the middle of the rainy season (May–July), whereas there is an increase in rainfall intensity over the late rainy season (August–September). Consequently, monthly rainfall is projected to be more concentrated at the end of the rainy season, i.e. in August and September, as compared to the baseline period. All RCM–GCM models agree for air temperature on the increasing trend across all RCPs over the 21st century. There is a clear increase for Tavg in all months with a similar pattern for each month, depicting an increase with time from 2021 to 2100 and with increasing radiative forcing level from RCP2.6 to RCP8.5. On average, Tavg increases between +2.4 % and 16.3 % (i.e. +0.6 and +4.4 ∘C) across RCPs and over the 21st century. Similar to future projections of Tavg, monthly Ep also shows a consistent increase across RCPs and for different periods in the 21st century. The average changes in Ep are projected from +1.1 % in 2021–2050 for RCP2.6 to +10.2 % in 2071–2100 under RCP8.5 (Fig. 6). The changes in simulated monthly Ea follow a similar pattern to P, with an average increase between +0.2 % under RCP2.6 and +8.1 % under RCP8.5 for Ea in the dry months and a reduction of −0.2 % and −9.9 %, respectively, under RCP2.6 and RCP8.5 in the wet months (Fig. 7).
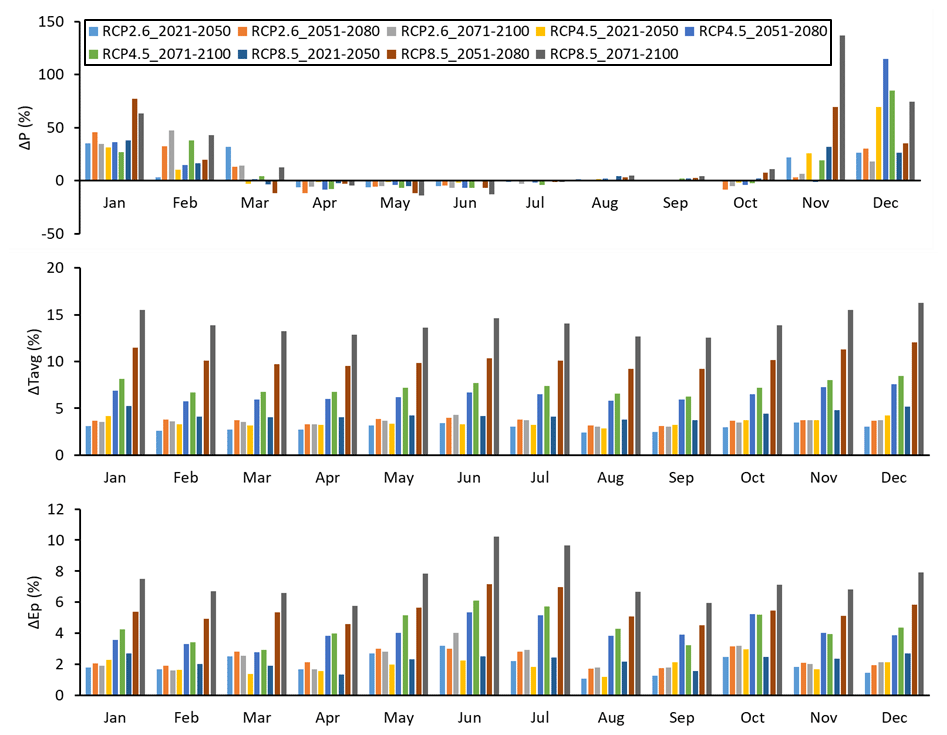
Figure 6Mean seasonal changes (%) in climatic variables (P, Tavg, and Ep) over the future periods (2021–2050, 2051–2080, and 2071–2100) relative to the historical period (1991–2020).
Projected monthly Su and monthly St (the sum of all water stored below and above land) denote a clear decline in the future for all RCPs, except for some months in the period 2021–2050 and in the period 2071–2100 under RCP8.5 (Fig. 7). The average decrease varies between −4.1 % and −0.1 % for Su and between −3.6 % and −0.2 % for St. The monthly Qrun and Rr mainly increase, with the exception of some scenarios in some months. The projected monthly changes vary between −16.5 % and +173.9 % for Qrun and between −21.8 % and +344.3 % for Rr. The strong increases in Qrun and Rr are identified in April, when all RCM–GCMs project a decrease in Ea (Fig. 7).
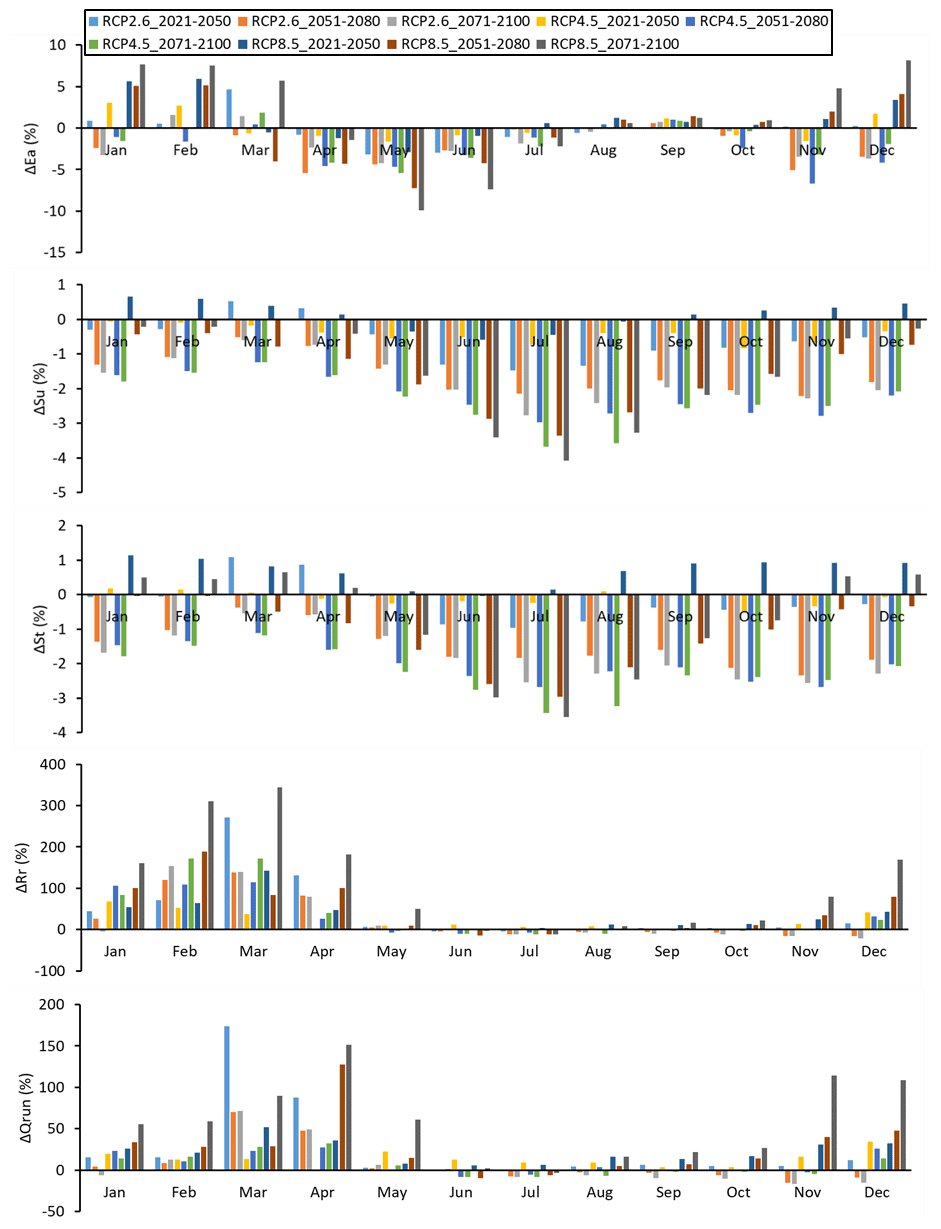
Figure 7Mean seasonal changes (%) in hydrological variables (Ea, Qrun, Rr, Su, and St) over the future periods (2021–2050, 2051–2080, and 2071–2100) relative to the historical period (1991–2020).
Overall, the inter-model (i.e. RCM–GCMs) variability is lower for the historical period than for the future periods and increases with increasing radiative forcing level from RCP2.6 to RCP8.5 (Fig. 8). Among the climatic variables, low inter-model variabilities are simulated for monthly temperatures and potential evaporation, with an average V2 varying from 1 % to 4 % over the 21st century. However, Pshows higher inter-model variabilities with V2 ranging between 30 % and 44 %, which have a direct repercussion on the simulated hydrological variables. The highest inter-model variabilities are observed for groundwater recharge, which exceed V2 of 48 %. The monthly inter-model variability for all the hydroclimatic variables and all the RCPs are illustrated in Fig. S31. It is noteworthy that the inter-model variability for monthly rainfall, actual evaporation, total runoff, and groundwater recharge is lower during the wet months (May–September) than the dry months (November–March), while an almost constant trend across months is simulated for the other variables (Fig. S31).
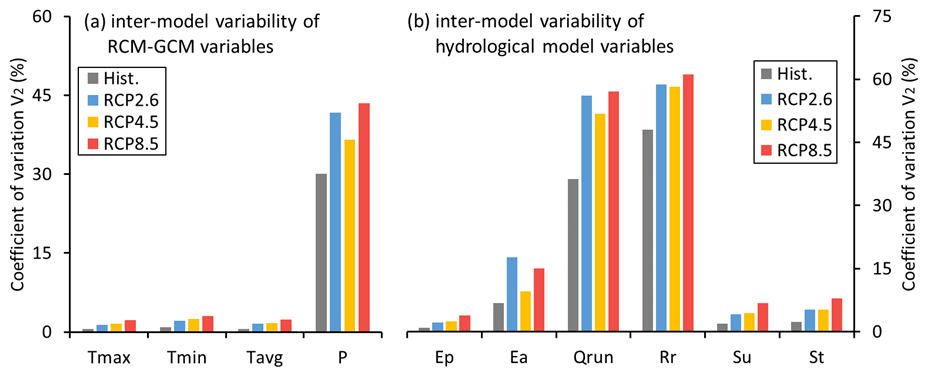
Figure 8Average inter-model (i.e. RCM–GCMs) variability expressed with the second-order coefficient of variation (V2) for monthly hydroclimatic variables (Tmax, Tmin, Tavg, P, Ep, Ea, Qrun, Rr, Su, and St) over the historical period (1991–2020) and the future period (2021–2100) under various RCPs.
4.4 Annual changes in hydroclimatic variables and water availability
Considering all RCPs over the historical period in the VRB, the multi-model ensemble mean of long-term annual estimates of climatic variables is as follows: Tavg= 28.4 ∘C, Ep= 2580 mm yr−1, P= 994 mm yr−1. The trends in annual estimates of projected hydroclimatic variables and water availability are illustrated in Fig. S32. Water availability is assessed as the net water flux into the land surface, using a proxy metric that is the difference between rainfall and actual evaporation (P−Ea) (Konapala et al., 2020; Greve and Seneviratne, 2015; Mishra et al., 2017).
The changes in the future projections of annual climatic and hydrological processes over the 21st century (2021–2100), as compared to the historical period (1991–2020) show contrasting trends between RCPs and between projection periods (Fig. 9). All climatic variables (rainfall, temperature, and potential evaporation) are projected to increase over the 21st century for all RCPs and projection periods, with the exception of rainfall that is expected to decrease under RCP2.6 and RCP4.5 and increase under RCP8.5.
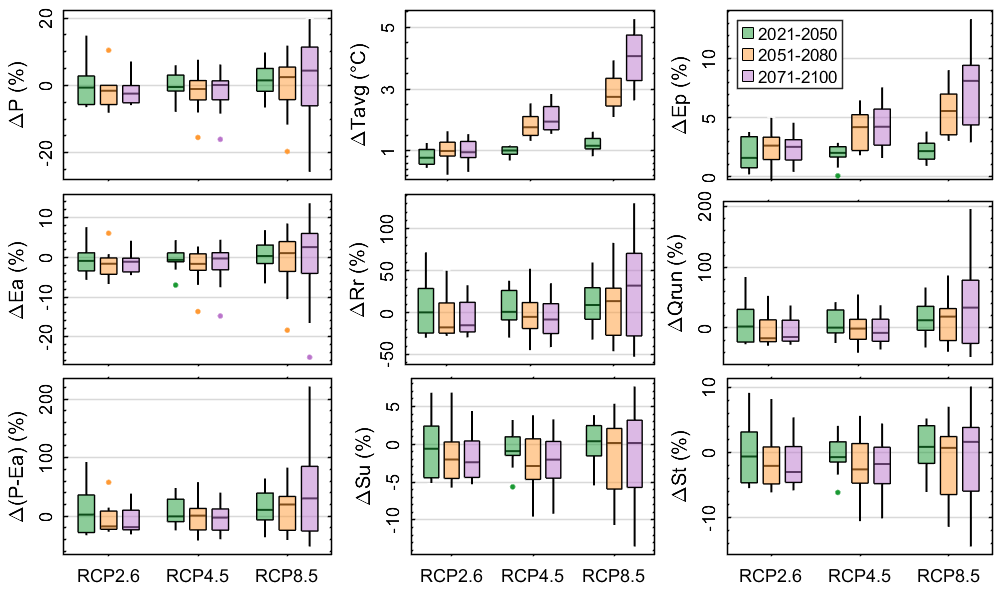
Figure 9Annual changes in future hydroclimatic variables and water availability (P−Ea) relative to the historical period for RCP2.6 (9 models), RCP4.5 (16 models), and RCP8.5 (18 models).
The median annual changes in climatic variables over 2021–2100 are amplified with increasing radiative forcing levels and vary between RCP2.6 (1 ∘C; 2.3 %; P= −1.6 %), RCP4.5 (1.6 ∘C; 3.5 %; P= −0.5 %), and RCP8.5 (2.7 ∘C; Ep= +5.3 %; 2.82 %). More importantly, there is a 100 % agreement among the RCM–GCM models concerning the increase in air temperature across all the RCPs and projection periods. Therefore, there is a high confidence in future climate warming of the VRB region in West Africa during the 21st century. These findings align with previous studies in West Africa (Dosio et al., 2020; Todzo et al., 2020; Jin et al., 2018; Yeboah et al., 2022). Similar to Dosio et al. (2019), a lower RCM–GCM agreement of 63 % is found for future changes in rainfall, thereby highlighting the complexity of modelling climate in West Africa (Fitzpatrick et al., 2020; Panthou et al., 2012).
In contrast to the climatic variables, the hydrological variables (total runoff, actual evaporation, groundwater recharge, soil moisture, and terrestrial water storage) decrease under RCP2.6 and RCP4.5, and only increase under the RCP8.5 scenario during the period 2021–2100 (Fig. 9), thereby following the patterns of the projected changes in rainfall. The multi-model ensemble mean of long-term annual estimates of hydrological variables for all RCPs over the historical period is as follows: Ea= 929 mm yr−1, Qrun= 71 mm yr−1, Rr= 11.4 mm yr−1, Su= 0.58 mm mm−1, and St= 490 mm (Fig. S32). The median annual changes in hydrological variables over 2021–2100 vary between RCP2.6 ( %; %; %; %; 1.9 %), RCP4.5 (0.8 %; %; 4.2 %; 1.9 %; 1.7 %), and RCP8.5 (1.3 %; 21.4 %; 18.3 %; 0.3 %; St= +1.1 %). It can be concluded from these findings that an intensification of the hydrological cycle (i.e. increase in the magnitude of hydrological variables) in the VRB is projected only under the RCP8.5 scenario.
The multi-model ensemble mean of water availability is 65 mm yr−1 over the historical period. The changes in water availability are driven by the variations in rainfall, with a projected median increase of +20.3 % only under RCP8.5 over the 21st century, and a reduction of −11.3 % under RCP2.6 and −0.6 % under RCP4.5.
4.5 Spatial patterns of hydroclimatic variables across climatic zones
The spatial patterns of the inter-model median of annual climatic variables show a north–south gradient of increasing rainfall and decreasing air temperature and decreasing potential evaporation (Fig. 10), which is in line with the aridity gradient of the eco-climatic zones in the VRB (Fig. 1). The spatial average of the multi-model ensemble of hydroclimatic variables per climatic zones in the VRB, considering all RCPs over the historical period, is given in Table 3.
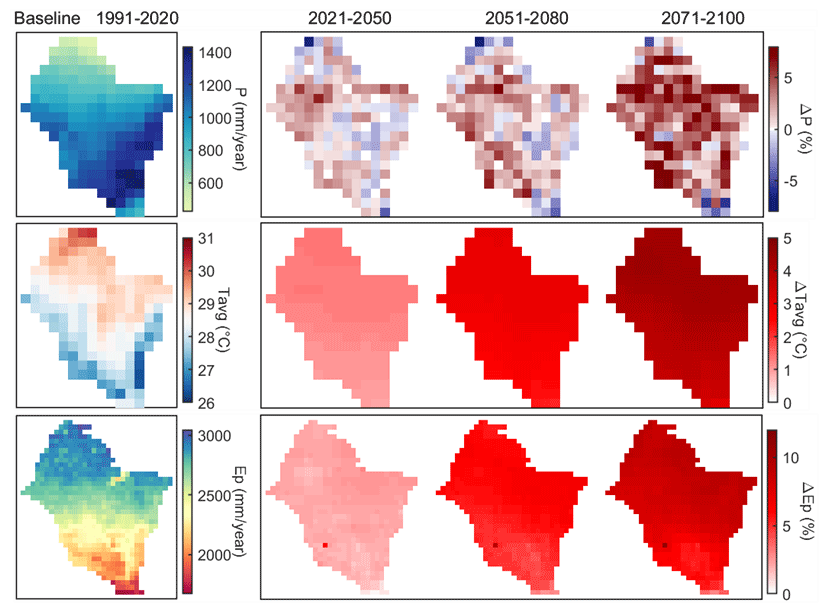
Figure 10Spatial patterns of the long-term average of annual climatic variables over the historical period (1991–2020) and changes over future periods (2021–2100) under RCP8.5 (median of 18 models).
The changes in spatial patterns of climatic variables under RCP8.5 illustrate a clear increase in air temperature and potential evaporation over the 21st century, with higher increase rates in the Sahelian zone and the northern regions of the VRB (Fig. 10; see other RCPs in Figs. S33–S37). The future projections show a decrease in rainfall under RCP2.6 and RCP4.5 from the Sahelian to the Sudanian zones, which correspond to the northern and central parts of the VRB (Figs. S33–S37). The increase in rainfall is projected mainly under RCP8.5, with higher increase rates localized from the Guinean to the Sudano-Sahelian zones, which correspond to the south and central regions of the VRB (Fig. 10).
Table 3Annual average of hydroclimatic variables per climatic zones corresponding to the median of all RCM–GCM combinations and all RCPs over the historical period.

The spatial patterns of the hydrological variables under RCP8.5 are depicted in Fig. 11 (see Figs. S38–S43 for other RCPs). Changes in annual actual evaporation, total runoff, and groundwater recharge depict similar spatial patterns to those of rainfall, with the exception that total runoff and groundwater recharge tend to increase in the Sahelian zone. Soil moisture and terrestrial water storage projections show a persistent decrease over most of the VRB area and particularly over the eastern regions. The analysis of projected future water availability per climatic zones in the VRB reveals an opposite pattern to the “dry gets drier, wet gets wetter” paradigm (Byrne and O'Gorman, 2015; Greve et al., 2014). The dry regions of the VRB (Sahelian and Sudano-Sahelian zones) are projected to become wetter, while the wet (Sudanian and Guinean zones) are projected to become drier under RCP2.6 and RCP4.5. However, all climatic zones in the VRB are projected to become wetter under RCP8.5.
The spatial inter-model variability depicts different patterns across hydroclimatic variables and across RCPs and projection periods (Figs. S44–S54). The highest differences among the simulations from climatic models are found generally in the northern dry regions (Sahelian zone) and in the forested southwestern wet region (Guinean zone) of the VRB under RCP8.5.
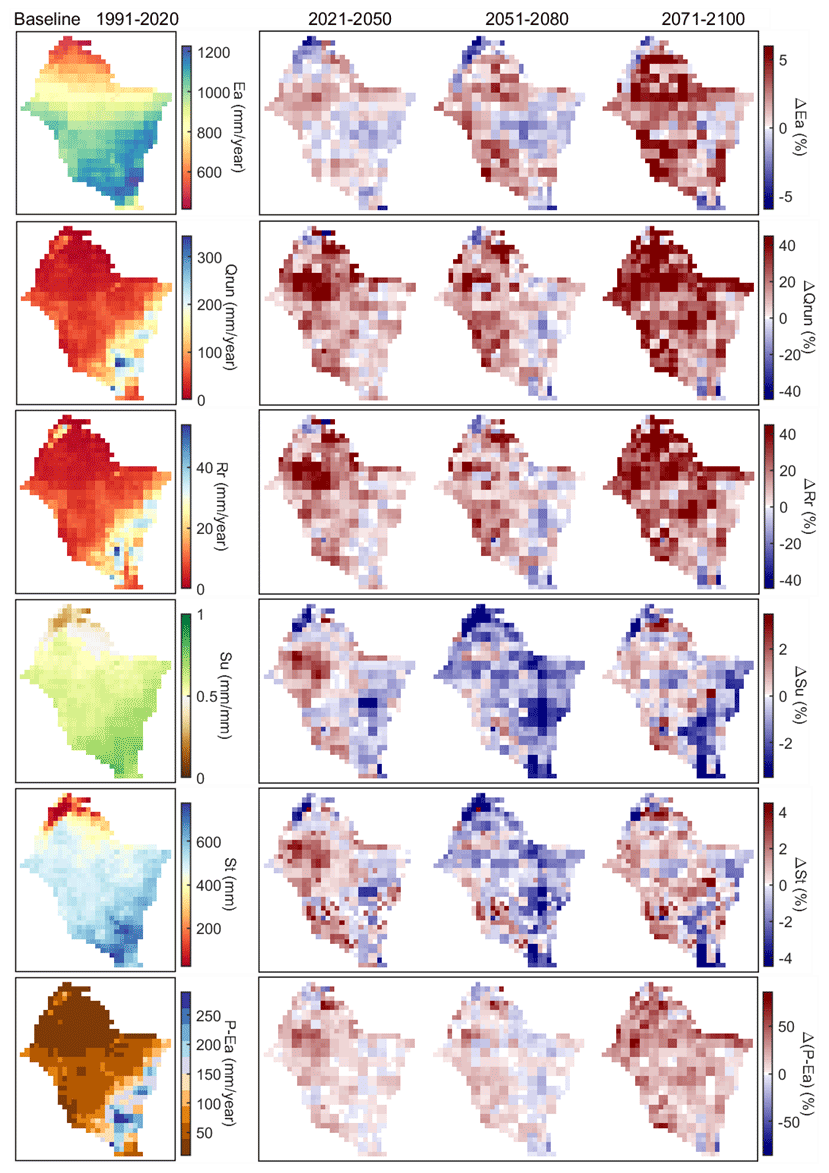
Figure 11Spatial patterns of the long-term average of annual hydrological variables and water availability over the historical period (1991–2020) and changes over future periods (2021–2100) under RCP8.5 (median of 18 models).
4.6 Changes in high and low flows
The projected future changes in high and low flows are summarized in Fig. 12 (Fig. S55 illustrates historical and future changes). Changes in low flows indicate an overall median increase in Q90 in all the sub-basins under RCP8.5 as follows: Black Volta (+30 %), White Volta (+16 %) and Oti (+14 %), with an RCM–GCM agreement on the direction of change of 69 %, 63 %, and 57 %, respectively. It is noteworthy that median Q90 is projected to decrease by −4 % in the White Volta over the period 2051–2080 under RCP8.5. The trends in the median changes in Q90 are contrasted across the future periods for RCP2.6 and RCP4.5. Tables S1–S2 provide details on the direction of change between the RCM–GCM combinations, which, on average, varies between 50 % and 78 % for Q90 and between 56 % and 75 % for Q10, depending on RCPs and climate projection periods.
For high flows, Q10 is projected to increase in all the sub-basins under RCP8.5, on average, by +20 % in the Black Volta, +2 % in the White Volta, and + 6 % in the Oti over the period 2021–2100, with an RCM–GCM agreement on the direction of change of 65 %, 63 %, and 59 %, respectively. However, it is noteworthy that Q10 for the period 2051–2080 under RCP8.5 is projected to decrease by −14 % in the White Volta and by −10 % in the Oti. Under RCP2.6 and RCP4.5, a decrease in Q10 is projected from 2051 to 2100 in all the sub-basins. The highest median decrease in Q10 over the 21st century in the sub-basins is −6 % in the Black Volta under RCP4.5, −16 % in the White Volta under RCP2.6, and −20 % in the Oti under RCP2.6. Both high and low flows are projected to increase with different magnitudes under all RCPs in the Black Volta and the White Volta over the period 2021–2050, while low flows are projected to increase under all RCPs in the Oti over the period .2051–2080.
Among the sub-basins, the Black Volta presents the highest probability of an increase in the 10-year flood over the 21st century. The White Volta is prone to an increase in flood risk in the period 2021–2050, while river drought risk is projected to increase over the period 2051–2100.
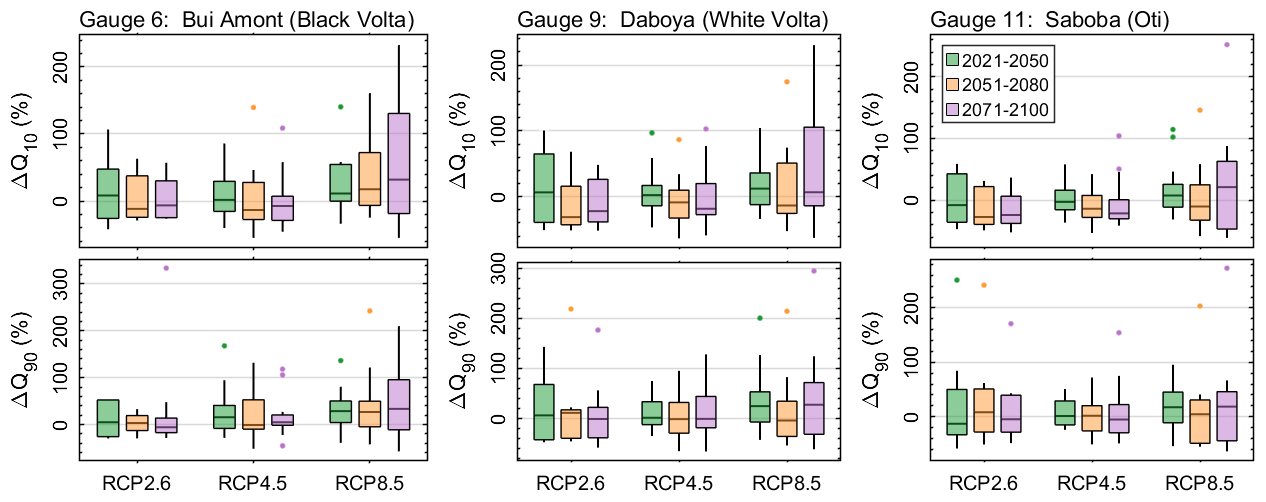
Figure 12Changes in future high flows (Q10) and low flows (Q90) in the major sub-basins of the VRB (Black Volta, White Volta, and Oti). The changes in percentage over the future periods are relative to the historical period (1991–2021).
The evolutions of the dates of occurrence and the concentration of the date of occurrence of Q10 and Q90 are illustrated in Figs. 13 and S57. The median date of occurrence of ) varies between the Julian calendar days 254 and 261 (second dekad of September), on average, across the three sub-basins (Black Volta, White Volta, and Oti) over the historical period, and it is projected to drop by −2 d under RCP2.6 and RCP4.5 and increase by +2 d under RCP8.5 over the 21st century. However, higher changes are projected in the Black Volta (ΔD d under RCP2.6), White Volta (ΔD d under RCP2.6), and the Oti (ΔD5 d under RCP8.5) over 2051–2080. The concentration of the date of occurrence (R) of shows a high seasonality in the occurrence of high flows ( 0.94) across sub-basins, which does not change considerably over the 21st century (Fig. S57).
In contrast to , the median varies between 126 and 132 (first to second dekad of May) over the historical period and rises on average by +5 d over future periods and across sub-basins. However, notable rises in are observed in each sub-basins during 2071–2100 as follows: Black Volta (ΔD9 d under RCP8.5), White Volta (ΔD11 d under RCP8.5), and Oti (ΔD10 d under RCP2.6), which might be explained by the forward shift of the rainy season. The median is 0.74 on average across sub-basins and slightly drops in the future, denoting a higher variation in the seasonality of low flows.
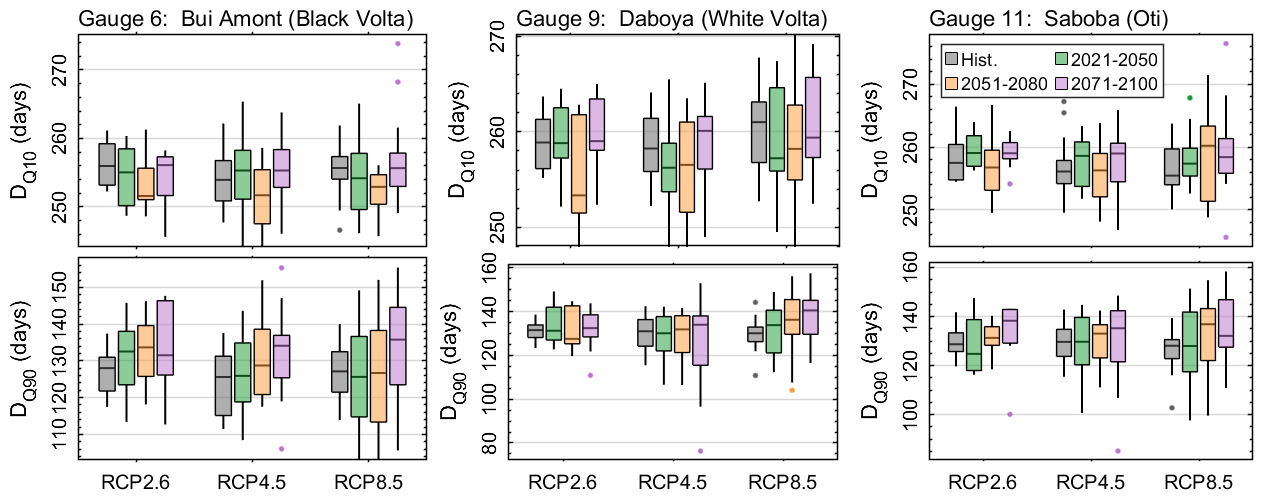
Figure 13Mean Julian dates of occurrence (D) of annual high flows (Q10) and low flows (Q90) over the historical (1991–2020) and future periods in the major sub-basins of the VRB (Black Volta, White Volta, and Oti).
4.7 Climate sensitivity
The sensitivity of selected hydrological variables to changes in climatic variables over the historical and future periods is illustrated in Fig. 14 (see Fig. S58 for additional variables). The relative changes in hydroclimatic variables are estimated in percentage over the three future periods compared to the historical period. Larger changes in hydroclimatic variables are simulated with increasing radiative forcing levels over the future period.
The VRB illustrates highly nonlinear behaviour. An increase in annual rainfall by 10 % results in an increase in total runoff by ∼ 50 % and an increase in actual evaporation by ∼ 6 %. A 10 % decrease in annual rainfall leads to ∼ 30 % decrease in total runoff and ∼ 7 % decrease in actual evaporation. Annual actual evaporation represents 93 % of annual rainfall, while total runoff represents 7 % of annual rainfall. However, small changes in the rainfall regime might strongly affect the total runoff regime. A 5 % increase in annual average air temperature leads to an increase of ∼ 3 % in potential evaporation. However, heteroscedasticity is observed for changes in air temperature and potential evaporation as the variability increases with higher rates of change (Fig. 14f). This analysis reveals a high sensitivity of major fluxes (Qrun and Ea) to even small changes in P in the VRB, a finding consistent with previous studies in the region (Roudier et al., 2014), and more generally in dryland regions globally (Berghuijs et al., 2017).
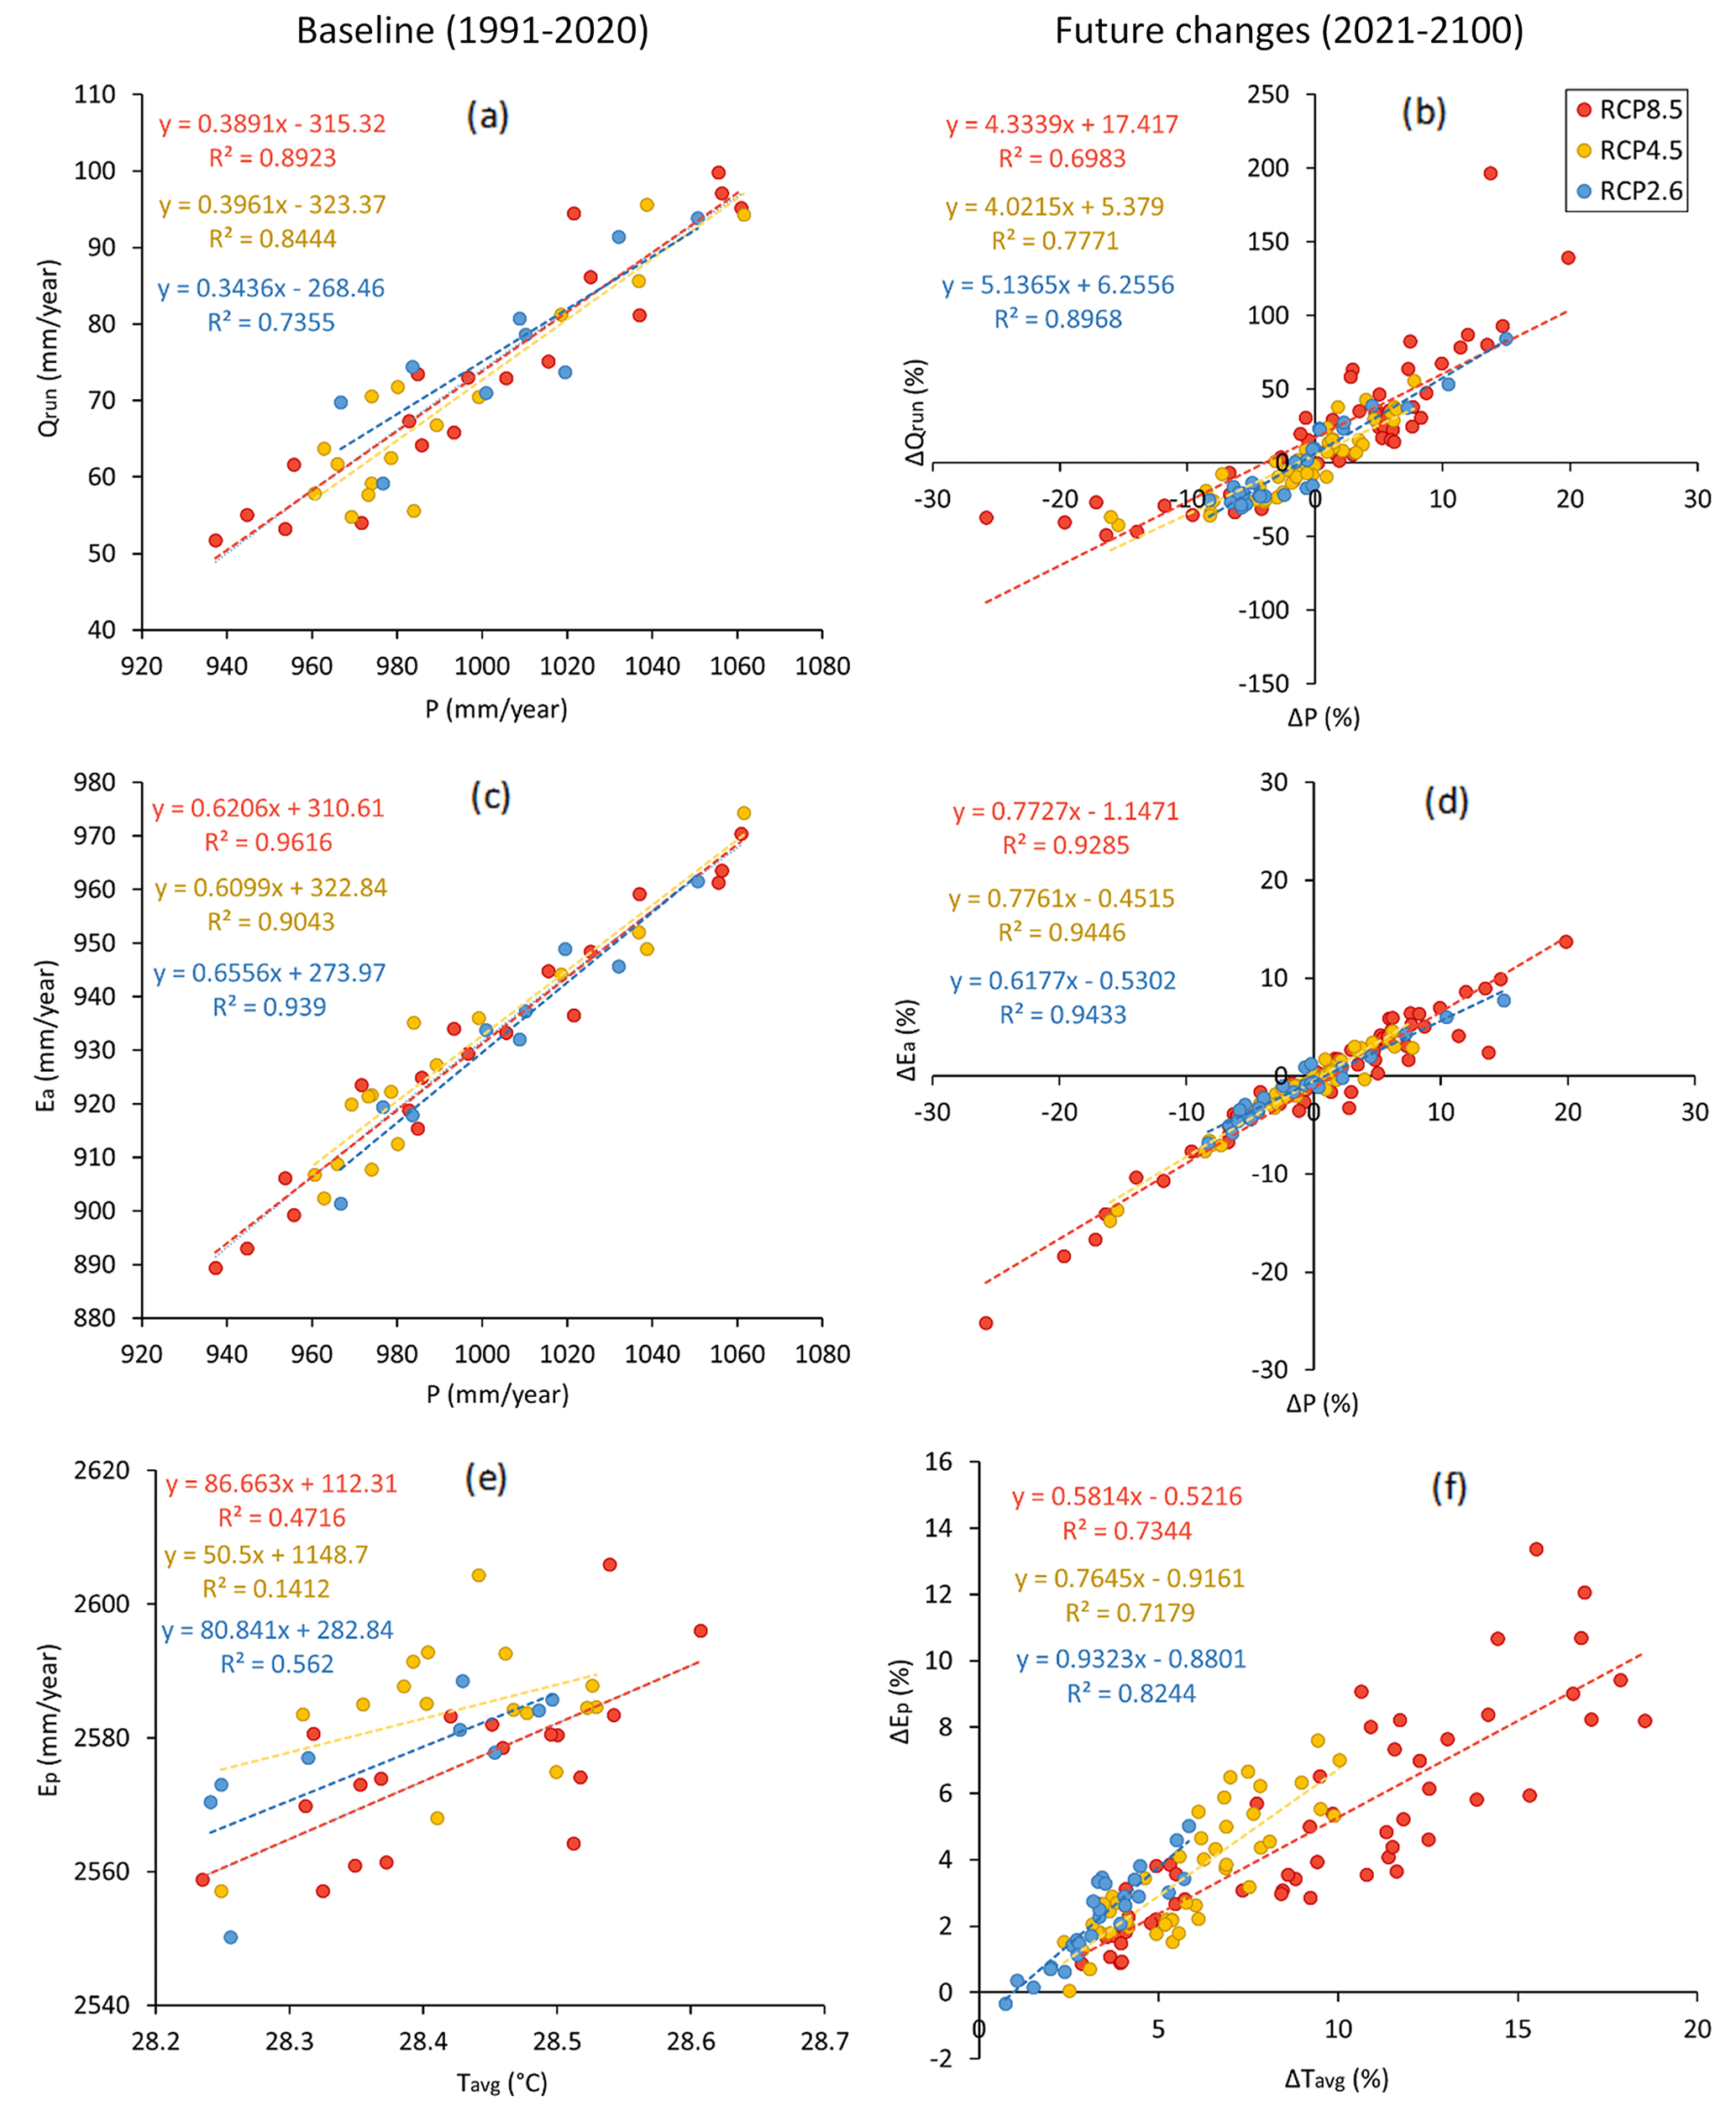
Figure 14Climate sensitivity of hydrological processes in the VRB over the historical period (a, c, e) with the associated future changes (b, d, f). The coloured dots represent RCM–GCM combinations per RCP, and the coloured dashed lines represent the fitted linear regression.
A direct comparison of our results to previous studies in the region is restricted by the differences in the choice of RCM–GCM models, RCPs, future projections periods, and the baseline period, which alone might lead to different outcomes (Liersch et al., 2020). However, our results generally corroborate with comparable previous studies in the region (Aich et al., 2016; Roudier et al., 2014; Sidibe et al., 2020; Rameshwaran et al., 2021). It is noteworthy that total runoff is projected to increase, while rainfall decreases under the RCP2.6 and RCP4.5 during the period 2021–2050. This paradoxical phenomenon of rainfall–runoff negative correlation is commonly referred to as the Sahelian paradox (Mahé and Paturel, 2009). The percentage of agreement of 63 % for hydrological projections between the climate models is similar to that of rainfall, which supports that rainfall is the key driver of hydrological processes in the VRB, thereby confirming the findings of Roudier et al. (2014). Vetter et al. (2015) also found a high variability in rainfall projections among climate models in the Upper Niger basin. Therefore, the improvement in the rainfall representation in climate models, which hardly represent the West African monsoon (Akinsanola et al., 2020; Philippon et al., 2010; Xue et al., 2010), would ultimately enhance the reliability of the assessment of climate change impacts on water resources (Dosio et al., 2021). The development of convection-permitting climate models to better capture complex climate features in the region at higher resolutions would help (Berthou et al., 2019; Kendon et al., 2017, 2019). The projected decrease of rainfall under RCP2.6 and RCP4.5, whereas an increase is projected under RCP8.5, can be explained by the higher warming level under RCP8.5. Higher warming would lead to increased evaporation, resulting in increased water vapour in the atmosphere, which would turn into increased precipitation (Donat et al., 2016; Trenberth, 2011). As the number of models varies among RCPs, bootstrapping could be used to randomly select a common number of models but that would limit our analyses to five RCM–GCM combinations, and might not lead to substantial changes in the results.
The large ensemble of RCM and GCM datasets used in this study allows the quantification of model-related projection uncertainties in terms of inter-model variabilities. In general, the selection of the best-performing climate models for hydrological modelling is not straightforward (Dosio et al., 2019; Hakala et al., 2019). Therefore, all the RCM–GCM combinations are used in this study without weighting or excluding models because the performance of models in the future is not necessarily related to their performance in the present (Dosio et al., 2020). More detailed analyses using methods for climate model selection (Kiesel et al., 2020; Ross and Najjar, 2019; Merrifield et al., 2020; Abramowitz et al., 2019; Ahmed et al., 2019) with the updated CMIP6 models (Eyring et al., 2016) and the new Shared Socioeconomic Pathways (SSPs; O'Neill et al., 2014, 2017; Riahi et al., 2017) are left for future work. For uncertainty dependence on ensemble composition, further attention should be given to single-model initial condition large ensembles (SMILEs; Milinski et al., 2020; Maher et al., 2021).
A further potential limitation arises from the imposed stationarity of the dependences between variables related to the used bias-correction method, although the used R2D2 method assumes some non-stationarity in the marginals (i.e. univariate distributions). However, predicting non-stationarity of dependence biases under climate change is not straightforward. With advances in multivariate bias correction methods (François et al., 2020), the added value of methods that consider non-stationarity in climate (e.g. dOTC; Robin et al., 2019) could be investigated in climate impact studies on water resources (Y. Yang et al., 2021).
Although multiple RCMs, GCMs, and RCPs are used in this study, a single hydrological model is used for the hydrological projections. Therefore, the results are also subject to potential deficiencies of the mHM model, as hydrological models are known to be a source of uncertainty in climate change impact studies (Vetter et al., 2017; Hattermann et al., 2018; Mendoza et al., 2015; Giuntoli et al., 2015; Hagemann et al., 2013). For instance, mHM does not explicitly consider the effect of vegetation dynamics associated with climate change that would modify runoff processes, which can be a limitation that is also observed in previous studies (Duethmann et al., 2020; Hanus et al., 2021; Wu et al., 2016). However, the mHM model used in this study has been thoroughly calibrated to provide realistic simulations of hydrological state variables and fluxes in the VRB (Dembélé et al., 2020a).
In addition to the hydrological model itself, the choice of the method for the calculation of potential evaporation can introduce uncertainties in the hydrological projections as reported in previous studies (Prudhomme and Williamson, 2013; Seiller and Anctil, 2016). The lack of atmospheric coupling between purely temperature-driven potential evaporation and the hydrological cycle in the hydrological model projections means some important feedbacks, such as surface resistance, may be missing (Milly and Dunne, 2016; Yang et al., 2019) and will not incorporate other mechanisms important in atmospheric demand. However, it is worth noting that the importance of this missing feedback has thus far only been evaluated for conditions in which water availability is not a limiting factor, a condition that is rarely met in the VRB. Moreover, even a more suitable method for estimating potential evaporation (e.g. Penman–Monteith), which can also be adjusted for surface resistance changes in future climates (Yang et al., 2019), is, to the first order, still expected to generate potential evaporation rates higher than precipitation. Therefore, the increase in soil moisture and actual evaporation will likely still be very large in response to the increase in precipitation. Nonetheless, the long-term CO2–vegetation-driven evaporation feedbacks not considered here could be very important for lower flow and drought conditions and need consideration in future work. The use of RCMs to downscale, which generally do not have the appropriate CO2–vegetation feedbacks in contrast to GCMs, is also an issue that needs to be addressed in future downscaling projects.
Furthermore, the hydrological projections generated in this study focus on changes in climate and do not explicitly account for land use and land cover change or changes in water management practices in the VRB. Although, land use and land cover changes play an important role in the hydrological processes, the primary focus in this study is constraining the impact of climate change alone. However, land use changes are assumed to be accounted for to some extent in the RCPs, as their development is based on assumptions regarding future evolution of land use and land cover (Van Vuuren et al., 2011). Nevertheless, given the dominance of the evaporation response, future work accounting for potential land use and land cover changes in response to the climate scenarios provided here will be needed. Finally, large basin studies of climate change impacts on water resources need to consider human interactions with the hydrological cycle to better integrate the co-evolution of the human–water systems across scales (D. Yang et al., 2021).
A large ensemble of 12 GCMs from CMIP5 and 5 RCMs from CORDEX-Africa is used to investigate the impacts of climate change on water resources in the Volta River basin under 3 RCPs. The climate projection datasets are used to force the fully distributed mesoscale Hydrologic Model (mHM) over the 21st century. Changes in hydrological processes over the future periods 2021–2050, 2051–2080, and 2071–2100 are estimated relatively to the historical period 1991–2020. The results reveal contrasting changes in the hydrological cycle, depending on RCPs and future projection periods. The key findings are summarized as follows:
-
Climate warming is projected in the Volta basin as all RCM–GCM projections predict an increase in air temperature under all RCPs, accompanied by an increase in annual potential evaporation.
-
Rainfall is projected to decrease under RCP2.6 and RCP4.5, while an increase is projected under RCP8.5, with a direct correlated and contrasting impact on water availability in the Volta River basin. Compared to temperature, there are more uncertainties in the trend of the changes in rainfall projections as there is only an agreement of 63 % on the direction of change between the RCM–GCM models, which leads to more uncertainty in the prediction of hydrological variables.
-
The seasonality of rainfall is projected to shift forward in the future, with the concentration period of the rainy season moving towards the months of August and September.
-
Annual actual evaporation, total runoff, groundwater recharge, soil moisture, and terrestrial water storage decline under RCP2.6 and RCP4.5, while they increase under RCP8.5 following the trends in rainfall. In fact, a strong sensitivity of hydrological processes to climate variability is found.
-
The analysis of high and low flows suggests an increased risk for floods under RCP8.5 over the 21st century, while an increased risk for hydrological drought is projected under RCP2.6 and RCP4.5 from the mid-21st century.
-
There is a higher variation in the seasonality of low flows as compared to high flows, with a delay of up to 11 d in the future occurrence of low flows. High flows could occur on average 6 d earlier or later under RCP2.6 and RCP8.5, respectively.
-
The spatial projections of future water availability per climatic zones depict a “dry gets wet, wet gets dry” pattern under RCP2.6 and RCP4.5.
-
Contrary to the other RCPs, under RCP8.5, the projected climate changes lead to a clear intensification of the entire hydrological cycle, i.e. an increase in the magnitude of hydroclimatic variables.
-
The changes in the hydrological cycle have important implications for future floods and droughts in the Volta basin, thereby amplifying the vulnerability of the local population to climate change. These findings can contribute to the elaboration of regional adaptation and mitigation strategies of climate change. However, significant inter-model variabilities of the climate models and low to moderate agreement between RCM–GCM combinations on the direction of changes highlight the complexity and uncertainties related to the assessment of climate change impacts on water resources. Therefore, more work is required to improve climate modelling in West Africa. A strong collaboration between climate and water resources scientists, practitioners, and policymakers is key for advancing knowledge and development.
The source code of the mHM model is available at https://doi.org/10.5281/zenodo.1299584 (Samaniego et al., 2018).
CORDEX data can be accessed from the ESGF database at https://esgf-data.dkrz.de (ESGF, 2020). The hydrological modelling database is accessible at https://doi.org/10.5281/zenodo.3531873 (Dembélé, 2019).
The supplement related to this article is available online at: https://doi.org/10.5194/hess-26-1481-2022-supplement.
MD designed the experiment and carried out the analyses. MV provided guidance for the use of the R2D2 method. MD drafted the paper, and all co-authors contributed to the writing, review and editing. BS and GM supervised the work.
At least one of the (co-)authors is a member of the editorial board of Hydrology and Earth System Sciences. The peer-review process was guided by an independent editor, and the authors also have no other competing interests to declare.
Publisher’s note: Copernicus Publications remains neutral with regard to jurisdictional claims in published maps and institutional affiliations.
We are grateful to the developers of mHM at CHS/UFZ (Germany), for their open-source model. We thank the providers of the streamflow data obtained from the Volta Basin Authority (VBA), the Direction Générale des Ressources en Eau (DGRE) of Burkina Faso, the Hydrological Services Department (HSD) of Ghana, and the Direction Générale de l'Eau et de l'Assainissement (DGEA) of Togo. We thank the developers of the global and regional climate models participating in the CORDEX initiative.
Moctar Dembélé has been supported by the Swiss Government Excellence Scholarship (grant no. 2016.0533/Burkina Faso/OP), the Doc.Mobility fellowship (SNF; grant no. P1LAP2_178071) of the Swiss National Science Foundation, and the Hydro-JULES visiting scientist fellowship (UKCEH; grant no. NERC NE/S017380/1). Bettina Schaefli has been supported by a research grant of the Swiss National Science Foundation (SNF; grant no. PP00P2_157611). Mathieu Vrac has been supported by the CoCliServ project, which is part of ERA4CS, an ERA-NET initiated by JPI Climate and co-funded by the European Union (grant no. 690462).
This paper was edited by Yi He and reviewed by two anonymous referees.
Abramowitz, G., Herger, N., Gutmann, E., Hammerling, D., Knutti, R., Leduc, M., Lorenz, R., Pincus, R., and Schmidt, G. A.: ESD Reviews: Model dependence in multi-model climate ensembles: weighting, sub-selection and out-of-sample testing, Earth Syst. Dynam., 10, 91–105, https://doi.org/10.5194/esd-10-91-2019, 2019.
Ahmed, K., Sachindra, D. A., Shahid, S., Demirel, M. C., and Chung, E.-S.: Selection of multi-model ensemble of general circulation models for the simulation of precipitation and maximum and minimum temperature based on spatial assessment metrics, Hydrol. Earth Syst. Sci., 23, 4803–4824, https://doi.org/10.5194/hess-23-4803-2019, 2019.
Aich, V., Liersch, S., Vetter, T., Huang, S., Tecklenburg, J., Hoffmann, P., Koch, H., Fournet, S., Krysanova, V., Müller, E. N., and Hattermann, F. F.: Comparing impacts of climate change on streamflow in four large African river basins, Hydrol. Earth Syst. Sci., 18, 1305–1321, https://doi.org/10.5194/hess-18-1305-2014, 2014.
Aich, V., Liersch, S., Vetter, T., Fournet, S., Andersson, J. C., Calmanti, S., van Weert, F. H., Hattermann, F. F., and Paton, E. N.: Flood projections within the Niger River Basin under future land use and climate change, Sci. Total Environ., 562, 666–677, https://doi.org/10.1016/j.scitotenv.2016.04.021, 2016.
Akinsanola, A. A., Zhou, W., Zhou, T., and Keenlyside, N.: Amplification of synoptic to annual variability of West African summer monsoon rainfall under global warming, npj Climate and Atmospheric Science, 3, 1–10, https://doi.org/10.1038/s41612-020-0125-1, 2020.
Ashouri, H., Hsu, K.-L., Sorooshian, S., Braithwaite, D. K., Knapp, K. R., Cecil, L. D., Nelson, B. R., and Prat, O. P.: PERSIANN-CDR: Daily precipitation climate data record from multisatellite observations for hydrological and climate studies, B. Am. Meteorol. Soc., 96, 69–83, https://doi.org/10.1175/BAMS-D-13-00068.1, 2015.
Beck, H. E., van Dijk, A. I. J. M., Levizzani, V., Schellekens, J., Miralles, D. G., Martens, B., and de Roo, A.: MSWEP: 3-hourly 0.25° global gridded precipitation (1979–2015) by merging gauge, satellite, and reanalysis data, Hydrol. Earth Syst. Sci., 21, 589–615, https://doi.org/10.5194/hess-21-589-2017, 2017.
Berghuijs, W. R., Larsen, J. R., Van Emmerik, T. H., and Woods, R. A.: A global assessment of runoff sensitivity to changes in precipitation, potential evaporation, and other factors, Water Resour. Res., 53, 8475–8486, https://doi.org/10.1002/2017WR021593, 2017.
Berthou, S., Rowell, D. P., Kendon, E. J., Roberts, M. J., Stratton, R. A., Crook, J. A., and Wilcox, C.: Improved climatological precipitation characteristics over West Africa at convection-permitting scales, Clim. Dynam., 53, 1–21, https://doi.org/10.1007/s00382-019-04759-4, 2019.
Blöschl, G., Hall, J., Parajka, J., Perdigão, R. A., Merz, B., Arheimer, B., Aronica, G. T., Bilibashi, A., Bonacci, O., and Borga, M.: Changing climate shifts timing of European floods, Science, 357, 588–590, https://doi.org/10.1126/science.aan2506, 2017.
Budyko, M.: Climate and life, International Geophysics Series, 18, Academic Press, ISBN 9780080954530, 507 pp., 1974.
Byrne, M. P. and O'Gorman, P. A.: The response of precipitation minus evapotranspiration to climate warming: Why the “wet-get-wetter, dry-get-drier” scaling does not hold over land, J. Climate, 28, 8078–8092, https://doi.org/10.1175/JCLI-D-15-0369.1, 2015.
Chagnaud, G., Panthou, G., Vischel, T., and Lebel, T.: A synthetic view of rainfall intensification in the West African Sahel, Environ. Res. Lett., 17, 044005, https://doi.org/10.1088/1748-9326/ac4a9c, 2022.
Chen, L., Singh, V. P., Guo, S., Fang, B., and Liu, P.: A new method for identification of flood seasons using directional statistics, Hydrolog. Sci. J., 58, 28–40, https://doi.org/10.1080/02626667.2012.743661, 2013.
Dembélé, M.: Database for the manuscript “Improving the predictive skill of a distributed hydrological model by calibration on spatial patterns with multiple satellite datasets”, Zenodo [data set], https://doi.org/10.5281/zenodo.3531873, 2019.
Dembélé, M., Oriani, F., Tumbulto, J., Mariethoz, G., and Schaefli, B.: Gap-filling of daily streamflow time series using Direct Sampling in various hydroclimatic settings, J. Hydrol., 569, 573–586, https://doi.org/10.1016/j.jhydrol.2018.11.076, 2019.
Dembélé, M.: Spatially explicit hydrological modelling for water accounting under climate change in the Volta River Basin in West Africa, PhD, University of Lausanne, Lausanne, Switzerland, 271 pp., https://doi.org/10.13140/RG.2.2.15664.58885, 2020.
Dembélé, M., Ceperley, N., Zwart, S. J., Mariéthoz, G., and Schaefli, B.: Potential of Satellite and Reanalysis Evaporation Datasets for Hydrological Modelling under Various Model Calibration Strategies, Adv. Water Resour., 143, 103667, https://doi.org/10.1016/j.advwatres.2020.103667, 2020a.
Dembélé, M., Hrachowitz, M., Savenije, H. H. G., Mariéthoz, G., and Schaefli, B.: Improving the Predictive Skill of a Distributed Hydrological Model by Calibration on Spatial Patterns With Multiple Satellite Data Sets, Water Resour. Res., 56, e2019WR026085, https://doi.org/10.1029/2019wr026085, 2020b.
Dembélé, M., Schaefli, B., van de Giesen, N., and Mariéthoz, G.: Suitability of 17 gridded rainfall and temperature datasets for large-scale hydrological modelling in West Africa, Hydrol. Earth Syst. Sci., 24, 5379–5406, https://doi.org/10.5194/hess-24-5379-2020, 2020c.
Diallo, I., Giorgi, F., Deme, A., Tall, M., Mariotti, L., and Gaye, A. T.: Projected changes of summer monsoon extremes and hydroclimatic regimes over West Africa for the twenty-first century, Clim. Dynam., 47, 3931–3954, https://doi.org/10.1007/s00382-016-3052-4, 2016.
Donat, M. G., Lowry, A. L., Alexander, L. V., O'Gorman, P. A., and Maher, N.: More extreme precipitation in the world's dry and wet regions, Nat. Clim. Change, 6, 508–513, https://doi.org/10.1038/nclimate2941, 2016.
Donohue, R., Roderick, M., and McVicar, T. R.: Can dynamic vegetation information improve the accuracy of Budyko's hydrological model?, J. Hydrol., 390, 23–34, https://doi.org/10.1016/j.jhydrol.2010.06.025, 2010.
Donohue, R. J., Roderick, M. L., and McVicar, T. R.: Assessing the differences in sensitivities of runoff to changes in climatic conditions across a large basin, J. Hydrol., 406, 234–244, https://doi.org/10.1016/j.jhydrol.2011.07.003, 2011.
Dosio, A., Jones, R. G., Jack, C., Lennard, C., Nikulin, G., and Hewitson, B.: What can we know about future precipitation in Africa? Robustness, significance and added value of projections from a large ensemble of regional climate models, Clim. Dynam., 53, 5833–5858, https://doi.org/10.1007/s00382-019-04900-3, 2019.
Dosio, A., Turner, A. G., Tamoffo, A. T., Sylla, M. B., Lennard, C., Jones, R. G., Terray, L., Nikulin, G., and Hewitson, B.: A tale of two futures: contrasting scenarios of future precipitation for West Africa from an ensemble of regional climate models, Environ. Res. Lett., 15, 064007, https://doi.org/10.1088/1748-9326/ab7fde, 2020.
Dosio, A., Jury, M. W., Almazroui, M., Ashfaq, M., Diallo, I., Engelbrecht, F. A., Klutse, N. A., Lennard, C., Pinto, I., and Sylla, M. B.: Projected future daily characteristics of African precipitation based on global (CMIP5, CMIP6) and regional (CORDEX, CORDEX-CORE) climate models, Clim. Dynam., 57, 1–24, https://doi.org/10.1007/s00382-021-05859-w, 2021.
Duethmann, D., Blöschl, G., and Parajka, J.: Why does a conceptual hydrological model fail to correctly predict discharge changes in response to climate change?, Hydrol. Earth Syst. Sci., 24, 3493–3511, https://doi.org/10.5194/hess-24-3493-2020, 2020.
ESA: Land Cover CCI Product User Guide Version 2. Tech. Rep., https://maps.elie.ucl.ac.be/CCI/viewer/download/ESACCI-LC-Ph2-PUGv2_2.0.pdf (last access: 16 March 2022), 2017.
ESGF: ESGF Node at DKRZ, https://esgf-data.dkrz.de, last access: 22 March 2020.
Eyring, V., Bony, S., Meehl, G. A., Senior, C. A., Stevens, B., Stouffer, R. J., and Taylor, K. E.: Overview of the Coupled Model Intercomparison Project Phase 6 (CMIP6) experimental design and organization, Geosci. Model Dev., 9, 1937–1958, https://doi.org/10.5194/gmd-9-1937-2016, 2016.
Eyring, V., Cox, P. M., Flato, G. M., Gleckler, P. J., Abramowitz, G., Caldwell, P., Collins, W. D., Gier, B. K., Hall, A. D., and Hoffman, F. M.: Taking climate model evaluation to the next level, Nat. Clim. Change, 9, 102–110, https://doi.org/10.1038/s41558-018-0355-y, 2019.
Fitzpatrick, R. G., Parker, D. J., Marsham, J. H., Rowell, D. P., Guichard, F. M., Taylor, C. M., Cook, K. H., Vizy, E. K., Jackson, L. S., and Finney, D.: What drives the intensification of mesoscale convective systems over the West African Sahel under climate change?, J. Climate, 33, 3151–3172, https://doi.org/10.1175/JCLI-D-19-0380.1, 2020.
François, B., Vrac, M., Cannon, A. J., Robin, Y., and Allard, D.: Multivariate bias corrections of climate simulations: which benefits for which losses?, Earth Syst. Dynam., 11, 537–562, https://doi.org/10.5194/esd-11-537-2020, 2020.
Funk, C., Peterson, P., Landsfeld, M., Pedreros, D., Verdin, J., Shukla, S., Husak, G., Rowland, J., Harrison, L., and Hoell, A.: The climate hazards infrared precipitation with stations – a new environmental record for monitoring extremes, Scientific Data, 2, 150066, https://doi.org/10.1038/sdata.2015.66, 2015.
Gelaro, R., McCarty, W., Suárez, M. J., Todling, R., Molod, A., Takacs, L., Randles, C. A., Darmenov, A., Bosilovich, M. G., and Reichle, R.: The modern-era retrospective analysis for research and applications, version 2 (MERRA-2), J. Climate, 30, 5419–5454, https://doi.org/10.1175/JCLI-D-16-0758.1, 2017.
Giorgi, F., Jones, C., and Asrar, G. R.: Addressing climate information needs at the regional level: the CORDEX framework, World Meteorological Organization (WMO) Bulletin, 58, 175–183, https://public.wmo.int/en/bulletin/addressing-climate-information-needs-regional-level-cordex-framework (last access: 16 March 2022), 2009.
Giuntoli, I., Vidal, J.-P., Prudhomme, C., and Hannah, D. M.: Future hydrological extremes: the uncertainty from multiple global climate and global hydrological models, Earth Syst. Dynam., 6, 267–285, https://doi.org/10.5194/esd-6-267-2015, 2015.
Greve, P. and Seneviratne, S. I.: Assessment of future changes in water availability and aridity, Geophys. Res. Lett., 42, 5493–5499, https://doi.org/10.1002/2015GL064127, 2015.
Greve, P., Orlowsky, B., Mueller, B., Sheffield, J., Reichstein, M., and Seneviratne, S. I.: Global assessment of trends in wetting and drying over land, Nat. Geosci., 7, 716–721, https://doi.org/10.1038/ngeo2247, 2014.
Greve, P., Burek, P., and Wada, Y.: Using the Budyko framework for calibrating a global hydrological model, Water Resour. Res., 56, e2019WR026280, https://doi.org/10.1029/2019WR026280, 2020.
Gunkel, A. and Lange, J.: Water scarcity, data scarcity and the Budyko curve – An application in the Lower Jordan River Basin, J. Hydrol.-Regional Studies, 12, 136–149, https://doi.org/10.1016/j.ejrh.2017.04.004, 2017.
Hagemann, S., Chen, C., Clark, D. B., Folwell, S., Gosling, S. N., Haddeland, I., Hanasaki, N., Heinke, J., Ludwig, F., Voss, F., and Wiltshire, A. J.: Climate change impact on available water resources obtained using multiple global climate and hydrology models, Earth Syst. Dynam., 4, 129–144, https://doi.org/10.5194/esd-4-129-2013, 2013.
Hakala, K., Addor, N., and Seibert, J.: Hydrological modeling to evaluate climate model simulations and their bias correction, J. Hydrometeorol., 19, 1321–1337, https://doi.org/10.1175/JHM-D-17-0189.1, 2018.
Hakala, K., Addor, N., Teutschbein, C., Vis, M., Dakhlaoui, H., and Seibert, J.: Hydrological modeling of climate change impacts, in: Encyclopedia of Water, edited by: Maurice, P., John Wiley and Sons, Inc, 1–20, https://doi.org/10.1002/9781119300762.wsts0062, 2019.
Hanus, S., Hrachowitz, M., Zekollari, H., Schoups, G., Vizcaino, M., and Kaitna, R.: Future changes in annual, seasonal and monthly runoff signatures in contrasting Alpine catchments in Austria, Hydrol. Earth Syst. Sci., 25, 3429–3453, https://doi.org/10.5194/hess-25-3429-2021, 2021.
Hargreaves, G. H. and Samani, Z. A.: Reference crop evapotranspiration from temperature, Appl. Eng. Agric., 1, 96–99, https://doi.org/10.13031/2013.26773, 1985.
Hattermann, F. F., Vetter, T., Breuer, L., Su, B., Daggupati, P., Donnelly, C., Fekete, B., Flörke, F., Gosling, S. N., and Hoffmann, P.: Sources of uncertainty in hydrological climate impact assessment: a cross-scale study, Environ. Res. Lett., 13, 015006, https://doi.org/10.1088/1748-9326/aa9938, 2018.
Hausfather, Z. and Peters, G. P.: Emissions–the “business as usual” story is misleading, Nature, 577, 618–620, https://doi.org/10.1038/d41586-020-00177-3, 2020.
Hawkins, E. and Sutton, R.: Connecting climate model projections of global temperature change with the real world, B. Am. Meteorol. Soc., 97, 963–980, https://doi.org/10.1175/BAMS-D-14-00154.1, 2016.
Hersbach, H., Bell, B., Berrisford, P., Hirahara, S., Horányi, A., Muñoz-Sabater, J., Nicolas, J., Peubey, C., Radu, R., and Schepers, D.: The ERA5 global reanalysis, Q. J. Roy. Meteor. Soc., 146, 1999–2049, https://doi.org/10.1002/qj.3803, 2020.
Jin, L., Whitehead, P. G., Addo, K. A., Amisigo, B., Macadam, I., Janes, T., Crossman, J., Nicholls, R. J., McCartney, M., and Rodda, H. J.: Modeling future flows of the Volta River system: Impacts of climate change and socio-economic changes, Sci. Total Environ., 637, 1069–1080, https://doi.org/10.1016/j.scitotenv.2018.04.350, 2018.
Jung, G., Wagner, S., and Kunstmann, H.: Joint climate–hydrology modeling: an impact study for the data-sparse environment of the Volta Basin in West Africa, Hydrol. Res., 43, 231–248, https://doi.org/10.2166/nh.2012.044, 2012.
Karambiri, H., García Galiano, S., Giraldo, J., Yacouba, H., Ibrahim, B., Barbier, B., and Polcher, J.: Assessing the impact of climate variability and climate change on runoff in West Africa: the case of Senegal and Nakambe River basins, Atmos. Sci. Lett., 12, 109–115, https://doi.org/10.1002/asl.317, 2011.
Kasei, R. A.: Modeling impacts of climate change on water resources in the Volta Basin, West Africa, Bonn, 2010, PhD Dissertation, Rheinische Friedrich-Wilhelms-Universität Bonn, https://nbn-resolving.org/urn:nbn:de:hbz:5N-19772 last access: 16 March 2022, 2010.
Kebe, I., Sylla, M. B., Omotosho, J. A., Nikiema, P. M., Gibba, P., and Giorgi, F.: Impact of GCM boundary forcing on regional climate modeling of West African summer monsoon precipitation and circulation features, Clim. Dynam., 48, 1503–1516, https://doi.org/10.1007/s00382-016-3156-x, 2017.
Kendon, E. J., Ban, N., Roberts, N. M., Fowler, H. J., Roberts, M. J., Chan, S. C., Evans, J. P., Fosser, G., and Wilkinson, J. M.: Do convection-permitting regional climate models improve projections of future precipitation change?, B. Am. Meteorol. Soc., 98, 79–93, https://doi.org/10.1175/BAMS-D-15-0004.1, 2017.
Kendon, E. J., Stratton, R. A., Tucker, S., Marsham, J. H., Berthou, S., Rowell, D. P., and Senior, C. A.: Enhanced future changes in wet and dry extremes over Africa at convection-permitting scale, Nat. Commun., 10, 1–14, https://doi.org/10.1038/s41467-019-09776-9, 2019.
Kiesel, J., Stanzel, P., Kling, H., Fohrer, N., Jähnig, S. C., and Pechlivanidis, I.: Streamflow-based evaluation of climate model sub-selection methods, Climatic Change, 163, 1267–1285, https://doi.org/10.1007/s10584-020-02854-8, 2020.
Kling, H., Stanzel, P., and Fuchs, M.: Regional assessment of the hydropower potential of rivers in West Africa, Energ. Proced., 97, 286–293, https://doi.org/10.1016/j.egypro.2016.10.002, 2016.
Kobayashi, S., Ota, Y., Harada, Y., Ebita, A., Moriya, M., Onoda, H., Onogi, K., Kamahori, H., Kobayashi, C., and Endo, H.: The JRA-55 reanalysis: General specifications and basic characteristics, J. Meteorol. Soc. Jpn.-Ser. II, 93, 5–48, https://doi.org/10.2151/jmsj.2015-001, 2015.
Konapala, G., Mishra, A. K., Wada, Y., and Mann, M. E.: Climate change will affect global water availability through compounding changes in seasonal precipitation and evaporation, Nat. Commun., 11, 1–10, https://doi.org/10.1038/s41467-020-16757-w, 2020.
Krysanova, V., Donnelly, C., Gelfan, A., Gerten, D., Arheimer, B., Hattermann, F., and Kundzewicz, Z. W.: How the performance of hydrological models relates to credibility of projections under climate change, Hydrolog. Sci. J., 63, 696–720, https://doi.org/10.1080/02626667.2018.1446214, 2018.
Kumar, R., Samaniego, L., and Attinger, S.: Implications of distributed hydrologic model parameterization on water fluxes at multiple scales and locations, Water Resour. Res., 49, 360–379, https://doi.org/10.1029/2012wr012195, 2013.
Kvålseth, T. O.: Coefficient of variation: the second-order alternative, J. Appl. Stat., 44, 402–415, https://doi.org/10.1080/02664763.2016.1174195, 2017.
Laaha, G. and Blöschl, G.: Seasonality indices for regionalizing low flows, Hydrol. Process., 20, 3851–3878, https://doi.org/10.1002/hyp.6161, 2006.
Lange, S.: EartH2Observe, WFDEI and ERA-Interim data Merged and Bias-corrected for ISIMIP (EWEMBI), GFZ Data Services, https://doi.org/10.5880/pik.2016.004, 2016.
Liersch, S., Drews, M., Pilz, T., Salack, S., Sietz, D., Aich, V., Larsen, M. A. D., Gädeke, A., Thiery, W., and Huang, S.: One simulation, different conclusions – the baseline period makes the difference!, Environ. Res. Lett., 15, 104014, https://doi.org/10.1088/1748-9326/aba3d7, 2020.
Mahé, G. and Paturel, J.-E.: 1896–2006 Sahelian annual rainfall variability and runoff increase of Sahelian Rivers, C. R. Geosci., 341, 538–546, https://doi.org/10.1016/j.crte.2009.05.002, 2009.
Mahé, G., Lienou, G., Descroix, L., Bamba, F., Paturel, J.-E., Laraque, A., Meddi, M., Habaieb, H., Adeaga, O., and Dieulin, C.: The rivers of Africa: witness of climate change and human impact on the environment, Hydrol. Process., 27, 2105–2114, https://doi.org/10.1002/hyp.9813, 2013.
Maher, N., Milinski, S., and Ludwig, R.: Large ensemble climate model simulations: introduction, overview, and future prospects for utilising multiple types of large ensemble, Earth Syst. Dynam., 12, 401–418, https://doi.org/10.5194/esd-12-401-2021, 2021.
Maidment, R. I., Grimes, D., Black, E., Tarnavsky, E., Young, M., Greatrex, H., Allan, R. P., Stein, T., Nkonde, E., and Senkunda, S.: A new, long-term daily satellite-based rainfall dataset for operational monitoring in Africa, Scientific Data, 4, 170063, https://doi.org/10.1038/sdata.2017.63, 2017.
Mardia, K. V.: Statistics of directional data, Academic Press, London, 380 pp., ISBN 9781483218663, 1972.
Mardia, K. V.: Statistics of directional data, J. Roy. Stat. Soc. B, 37, 349–371, https://doi.org/10.1111/j.2517-6161.1975.tb01550.x, 1975.
McCartney, M., Forkuor, G., Sood, A., Amisigo, B., Hattermann, F., and Muthuwatta, L.: The water resource implications of changing climate in the Volta River Basin, Colombo, Sri Lanka: International Water Management Institute (IWMI), IWMI Research Report 146, https://doi.org/10.5337/2012.219, 40 pp., 2012.
McVicar, T. R., Roderick, M. L., Donohue, R. J., and Van Niel, T. G.: Less bluster ahead? Ecohydrological implications of global trends of terrestrial near-surface wind speeds, Ecohydrology, 5, 381–388, https://doi.org/10.1002/eco.1298, 2012.
Mendoza, P. A., Clark, M. P., Mizukami, N., Newman, A. J., Barlage, M., Gutmann, E. D., Rasmussen, R. M., Rajagopalan, B., Brekke, L. D., and Arnold, J. R.: Effects of hydrologic model choice and calibration on the portrayal of climate change impacts, J. Hydrometeorol., 16, 762–780, https://doi.org/10.1175/JHM-D-14-0104.1, 2015.
Merrifield, A. L., Brunner, L., Lorenz, R., Medhaug, I., and Knutti, R.: An investigation of weighting schemes suitable for incorporating large ensembles into multi-model ensembles, Earth Syst. Dynam., 11, 807–834, https://doi.org/10.5194/esd-11-807-2020, 2020.
Milinski, S., Maher, N., and Olonscheck, D.: How large does a large ensemble need to be?, Earth Syst. Dynam., 11, 885–901, https://doi.org/10.5194/esd-11-885-2020, 2020.
Milly, P. C. and Dunne, K. A.: Potential evapotranspiration and continental drying, Nat. Clim. Change, 6, 946–949, https://doi.org/10.1038/nclimate3046, 2016.
Miralles, D. G., Brutsaert, W., Dolman, A., and Gash, J. H.: On the use of the term “evapotranspiration”, Water Resour. Res., 56, e2020WR028055, https://doi.org/10.1029/2020WR028055, 2020.
Mishra, V., Kumar, R., Shah, H. L., Samaniego, L., Eisner, S., and Yang, T.: Multimodel assessment of sensitivity and uncertainty of evapotranspiration and a proxy for available water resources under climate change, Climatic Change, 141, 451–465, https://doi.org/10.1007/s10584-016-1886-8, 2017.
Moss, R. H., Edmonds, J. A., Hibbard, K. A., Manning, M. R., Rose, S. K., Van Vuuren, D. P., Carter, T. R., Emori, S., Kainuma, M., and Kram, T.: The next generation of scenarios for climate change research and assessment, Nature, 463, 747–756, https://doi.org/10.1038/nature08823, 2010.
Nicholson, S. E., Funk, C., and Fink, A. H.: Rainfall over the African continent from the 19th through the 21st century, Global Planet. Change, 165, 114–127, https://doi.org/10.1016/j.gloplacha.2017.12.014, 2018.
Nikiema, P. M., Sylla, M. B., Ogunjobi, K., Kebe, I., Gibba, P., and Giorgi, F.: Multi-model CMIP5 and CORDEX simulations of historical summer temperature and precipitation variabilities over West Africa, International J. Climatol., 37, 2438–2450, https://doi.org/10.1002/joc.4856, 2017.
Novella, N. S. and Thiaw, W. M.: African rainfall climatology version 2 for famine early warning systems, J. Appl. Meteorol. Climatol., 52, 588–606, https://doi.org/10.1175/JAMC-D-11-0238.1, 2013.
O'Neill, B. C., Kriegler, E., Riahi, K., Ebi, K. L., Hallegatte, S., Carter, T. R., Mathur, R., and van Vuuren, D. P.: A new scenario framework for climate change research: the concept of shared socioeconomic pathways, Climatic Change, 122, 387–400, https://doi.org/10.1007/s10584-013-0905-2, 2014.
O'Neill, B. C., Tebaldi, C., van Vuuren, D. P., Eyring, V., Friedlingstein, P., Hurtt, G., Knutti, R., Kriegler, E., Lamarque, J.-F., Lowe, J., Meehl, G. A., Moss, R., Riahi, K., and Sanderson, B. M.: The Scenario Model Intercomparison Project (ScenarioMIP) for CMIP6, Geosci. Model Dev., 9, 3461–3482, https://doi.org/10.5194/gmd-9-3461-2016, 2016.
O'Neill, B. C., Kriegler, E., Ebi, K. L., Kemp-Benedict, E., Riahi, K., Rothman, D. S., van Ruijven, B. J., van Vuuren, D. P., Birkmann, J., and Kok, K.: The roads ahead: Narratives for shared socioeconomic pathways describing world futures in the 21st century, Global Environ. Chang., 42, 169–180, https://doi.org/10.1016/j.gloenvcha.2015.01.004, 2017.
Okafor, G., Annor, T., Odai, S., and Agyekum, J.: Volta basin precipitation and temperature climatology: evaluation of CORDEX-Africa regional climate model simulations, Theor. Appl. Climatol., 137, 2803–2827, https://doi.org/10.1007/s00704-018-2746-4, 2019.
Oyerinde, G. T., Wisser, D., Hountondji, F. C., Odofin, A. J., Lawin, A. E., Afouda, A., and Diekkrüger, B.: Quantifying uncertainties in modeling climate change impacts on hydropower production, Climate, 4, 34, https://doi.org/10.3390/cli4030034, 2016.
Panthou, G., Vischel, T., Lebel, T., Blanchet, J., Quantin, G., and Ali, A.: Extreme rainfall in West Africa: A regional modeling, Water Resour. Res., 48, W08501, https://doi.org/10.1029/2012WR012052, 2012.
Peters, G. P., Andrew, R. M., Boden, T., Canadell, J. G., Ciais, P., Le Quéré, C., Marland, G., Raupach, M. R., and Wilson, C.: The challenge to keep global warming below 2 ∘C, Nat. Clim. Change, 3, 4–6, https://doi.org/10.1038/nclimate1783, 2013.
Philippon, N., Doblas-Reyes, F., and Ruti, P.: Skill, reproducibility and potential predictability of the West African monsoon in coupled GCMs, Clim. Dynam., 35, 53–74, https://doi.org/10.1007/s00382-010-0856-5, 2010.
Prudhomme, C. and Williamson, J.: Derivation of RCM-driven potential evapotranspiration for hydrological climate change impact analysis in Great Britain: a comparison of methods and associated uncertainty in future projections, Hydrol. Earth Syst. Sci., 17, 1365–1377, https://doi.org/10.5194/hess-17-1365-2013, 2013.
Rameshwaran, P., Bell, V. A., Davies, H. N., and Kay, A. L.: How might climate change affect river flows across West Africa?, Climatic Change, 169, 1–27, https://doi.org/10.1007/s10584-021-03256-0, 2021.
Reichle, R. H., Liu, Q., Koster, R. D., Draper, C. S., Mahanama, S. P., and Partyka, G. S.: Land surface precipitation in MERRA-2, J. Climate, 30, 1643–1664, https://doi.org/10.1175/JCLI-D-16-0570.1, 2017.
Riahi, K., Van Vuuren, D. P., Kriegler, E., Edmonds, J., O'neill, B. C., Fujimori, S., Bauer, N., Calvin, K., Dellink, R., and Fricko, O.: The shared socioeconomic pathways and their energy, land use, and greenhouse gas emissions implications: an overview, Global Environ. Chang., 42, 153–168, https://doi.org/10.1016/j.gloenvcha.2016.05.009, 2017.
Ritchie, J. and Dowlatabadi, H.: Why do climate change scenarios return to coal?, Energy, 140, 1276–1291, https://doi.org/10.1016/j.energy.2017.08.083, 2017.
Robin, Y., Vrac, M., Naveau, P., and Yiou, P.: Multivariate stochastic bias corrections with optimal transport, Hydrol. Earth Syst. Sci., 23, 773–786, https://doi.org/10.5194/hess-23-773-2019, 2019.
Ross, A. C. and Najjar, R. G.: Evaluation of methods for selecting climate models to simulate future hydrological change, Climatic Change, 157, 407–428, https://doi.org/10.1007/s10584-019-02512-8, 2019.
Roudier, P., Ducharne, A., and Feyen, L.: Climate change impacts on runoff in West Africa: a review, Hydrol. Earth Syst. Sci., 18, 2789–2801, https://doi.org/10.5194/hess-18-2789-2014, 2014.
Samaniego, L., Kumar, R., and Attinger, S.: Multiscale parameter regionalization of a grid-based hydrologic model at the mesoscale, Water Resour. Res., 46, W05523, https://doi.org/10.1029/2008wr007327, 2010.
Samaniego, L., Kumar, R., Thober, S., Rakovec, O., Zink, M., Wanders, N., Eisner, S., Müller Schmied, H., Sutanudjaja, E. H., Warrach-Sagi, K., and Attinger, S.: Toward seamless hydrologic predictions across spatial scales, Hydrol. Earth Syst. Sci., 21, 4323–4346, https://doi.org/10.5194/hess-21-4323-2017, 2017.
Samaniego, L., Kumar, R., Thober, S., Rakovec, O., Schweppe, R., Schäfer, D., Schrön, M., Brenner, J., Demirel, C. M., Kaluza, M., Jing, M., Langenberg, B., and Attinger, S.: mesoscale Hydrologic Model (v5.9), Zenodo [code], https://doi.org/10.5281/zenodo.1299584, 2018.
Savenije, H. H.: The importance of interception and why we should delete the term evapotranspiration from our vocabulary, Hydrol. Process., 18, 1507–1511, https://doi.org/10.1002/hyp.5563, 2004.
Seiller, G. and Anctil, F.: How do potential evapotranspiration formulas influence hydrological projections?, Hydrolog. Sci. J., 61, 2249–2266, https://doi.org/10.1080/02626667.2015.1100302, 2016.
Sheffield, J., Goteti, G., and Wood, E. F.: Development of a 50-year high-resolution global dataset of meteorological forcings for land surface modeling, J. Climate, 19, 3088–3111, https://doi.org/10.1175/JCLI3790.1, 2006.
Sidibe, M., Dieppois, B., Eden, J., Mahé, G., Paturel, J.-E., Amoussou, E., Anifowose, B., Van De Wiel, M., and Lawler, D.: Near-term impacts of climate variability and change on hydrological systems in West and Central Africa, Clim. Dynam., 54, 2041–2070, https://doi.org/10.1007/s00382-019-05102-7, 2020.
Sood, A., Muthuwatta, L., and McCartney, M.: A SWAT evaluation of the effect of climate change on the hydrology of the Volta River basin, Water Int., 38, 297–311, https://doi.org/10.1080/02508060.2013.792404, 2013.
Sposito, G.: Understanding the Budyko equation, Water, 9, 236, https://doi.org/10.3390/w9040236, 2017.
Stanzel, P., Kling, H., and Bauer, H.: Climate change impact on West African rivers under an ensemble of CORDEX climate projections, Climate Services, 11, 36–48, https://doi.org/10.1016/j.cliser.2018.05.003, 2018.
Sultan, B. and Gaetani, M.: Agriculture in West Africa in the twenty-first century: climate change and impacts scenarios, and potential for adaptation, Front. Plant Sci., 7, 1262, https://doi.org/10.3389/fpls.2016.01262, 2016.
Sylla, M. B., Nikiema, P. M., Gibba, P., Kebe, I., and Klutse, N. A. B.: Climate change over West Africa: Recent trends and future projections, in: Adaptation to climate change and variability in rural West Africa, in: edited by: Yaro, J. and Hesselberg, J., Springer, 25–40, https://doi.org/10.1007/978-3-319-31499-0_3, 2016.
Sylla, M. B., Faye, A., Klutse, N. A. B., and Dimobe, K.: Projected increased risk of water deficit over major West African river basins under future climates, Climatic Change, 151, 247–258, https://doi.org/10.1007/s10584-018-2308-x, 2018a.
Sylla, M. B., Pal, J. S., Faye, A., Dimobe, K., and Kunstmann, H.: Climate change to severely impact West African basin scale irrigation in 2 ∘C and 1.5 ∘C global warming scenarios, Sci. Rep.-UK, 8, 1–9, https://doi.org/10.1038/s41598-018-32736-0, 2018b.
Tarek, M., Brissette, F., and Arsenault, R.: Uncertainty of gridded precipitation and temperature reference datasets in climate change impact studies, Hydrol. Earth Syst. Sci., 25, 3331–3350, https://doi.org/10.5194/hess-25-3331-2021, 2021.
Tarnavsky, E., Grimes, D., Maidment, R., Black, E., Allan, R. P., Stringer, M., Chadwick, R., and Kayitakire, F.: Extension of the TAMSAT satellite-based rainfall monitoring over Africa and from 1983 to present, J. Appl. Meteorol. Clim., 53, 2805–2822, https://doi.org/10.1175/JAMC-D-14-0016.1, 2014.
Taylor, K. E., Stouffer, R. J., and Meehl, G. A.: An overview of CMIP5 and the experiment design, B. Am. Meteorol. Soc., 93, 485–498, https://doi.org/10.1175/BAMS-D-11-00094.1, 2012.
Telteu, C.-E., Müller Schmied, H., Thiery, W., Leng, G., Burek, P., Liu, X., Boulange, J. E. S., Andersen, L. S., Grillakis, M., Gosling, S. N., Satoh, Y., Rakovec, O., Stacke, T., Chang, J., Wanders, N., Shah, H. L., Trautmann, T., Mao, G., Hanasaki, N., Koutroulis, A., Pokhrel, Y., Samaniego, L., Wada, Y., Mishra, V., Liu, J., Döll, P., Zhao, F., Gädeke, A., Rabin, S. S., and Herz, F.: Understanding each other's models: an introduction and a standard representation of 16 global water models to support intercomparison, improvement, and communication, Geosci. Model Dev., 14, 3843–3878, https://doi.org/10.5194/gmd-14-3843-2021, 2021.
Teutschbein, C. and Seibert, J.: Bias correction of regional climate model simulations for hydrological climate-change impact studies: Review and evaluation of different methods, J. Hydrol., 456, 12–29, https://doi.org/10.1016/j.jhydrol.2012.05.052, 2012.
Todzo, S., Bichet, A., and Diedhiou, A.: Intensification of the hydrological cycle expected in West Africa over the 21st century, Earth Syst. Dynam., 11, 319–328, https://doi.org/10.5194/esd-11-319-2020, 2020.
Trenberth, K. E.: Changes in precipitation with climate change, Clim. Res., 47, 123–138, https://doi.org/10.3354/cr00953, 2011.
UNEP-GEF: Volta Basin Transboundary Diagnostic Analysis, UNEP-GEF Volta Project, Ghana, 154, http://gefvolta.iwlearn.org/project-resources/studies-reports/tda-final/regional-tda/volta-basin-tda-english (last access: 16 March 2022), 2013.
Van Vuuren, D. P., Edmonds, J., Kainuma, M., Riahi, K., Thomson, A., Hibbard, K., Hurtt, G. C., Kram, T., Krey, V., and Lamarque, J.-F.: The representative concentration pathways: an overview, Climatic Change, 109, 5, https://doi.org/10.1007/s10584-011-0148-z, 2011.
Vetter, T., Huang, S., Aich, V., Yang, T., Wang, X., Krysanova, V., and Hattermann, F.: Multi-model climate impact assessment and intercomparison for three large-scale river basins on three continents, Earth Syst. Dynam., 6, 17–43, https://doi.org/10.5194/esd-6-17-2015, 2015.
Vetter, T., Reinhardt, J., Flörke, M., Van Griensven, A., Hattermann, F., Huang, S., Koch, H., Pechlivanidis, I. G., Plötner, S., and Seidou, O.: Evaluation of sources of uncertainty in projected hydrological changes under climate change in 12 large-scale river basins, Climatic Change, 141, 419–433, https://doi.org/10.1007/s10584-016-1794-y, 2017.
Vlach, V., Ledvinka, O., and Matouskova, M.: Changing low flow and streamflow drought seasonality in Central European headwaters, Water, 12, 3575, https://doi.org/10.3390/w12123575, 2020.
Vrac, M., Drobinski, P., Merlo, A., Herrmann, M., Lavaysse, C., Li, L., and Somot, S.: Dynamical and statistical downscaling of the French Mediterranean climate: uncertainty assessment, Nat. Hazards Earth Syst. Sci., 12, 2769–2784, https://doi.org/10.5194/nhess-12-2769-2012, 2012.
Vrac, M.: Multivariate bias adjustment of high-dimensional climate simulations: the Rank Resampling for Distributions and Dependences (R2D2) bias correction, Hydrol. Earth Syst. Sci., 22, 3175–3196, https://doi.org/10.5194/hess-22-3175-2018, 2018.
Vrac, M. and Thao, S.: R2D2 v2.0: accounting for temporal dependences in multivariate bias correction via analogue rank resampling, Geosci. Model Dev., 13, 5367–5387, https://doi.org/10.5194/gmd-13-5367-2020, 2020.
Wang, C., Wang, S., Fu, B., and Zhang, L.: Advances in hydrological modelling with the Budyko framework: A review, Prog. Phys. Geog., 40, 409–430, https://doi.org/10.1177/0309133315620997, 2016.
Weedon, G. P., Balsamo, G., Bellouin, N., Gomes, S., Best, M. J., and Viterbo, P.: The WFDEI meteorological forcing data set: WATCH Forcing Data methodology applied to ERA-Interim reanalysis data, Water Resour. Res., 50, 7505–7514, https://doi.org/10.1002/2014WR015638, 2014.
Williams, T. O., Mul, M. L., Biney, C. A., and Smakhtin, V.: The Volta River Basin: Water for food, economic growth and environment, edited by: Williams, T. O., Mul, M., Biney, C. A., and Smakhtin, V., Routledge, 302 pp., https://doi.org/10.4324/9781315707334, 2016.
Wu, M., Schurgers, G., Rummukainen, M., Smith, B., Samuelsson, P., Jansson, C., Siltberg, J., and May, W.: Vegetation–climate feedbacks modulate rainfall patterns in Africa under future climate change, Earth Syst. Dynam., 7, 627–647, https://doi.org/10.5194/esd-7-627-2016, 2016.
Xue, Y., De Sales, F., Lau, W.-M., Boone, A., Feng, J., Dirmeyer, P., Guo, Z., Kim, K.-M., Kitoh, A., and Kumar, V.: Intercomparison and analyses of the climatology of the West African Monsoon in the West African Monsoon Modeling and Evaluation project (WAMME) first model intercomparison experiment, Clim. Dynam., 35, 3–27, https://doi.org/10.1007/s00382-010-0778-2, 2010.
Yang, D., Yang, Y., and Xia, J.: Hydrological cycle and water resources in a changing world: A review, Geography and Sustainability, 2, 115–122, https://doi.org/10.1016/j.geosus.2021.05.003, 2021.
Yang, Y., Roderick, M. L., Zhang, S., McVicar, T. R., and Donohue, R. J.: Hydrologic implications of vegetation response to elevated CO2 in climate projections, Nat. Clim. Change, 9, 44–48, https://doi.org/10.1038/s41558-018-0361-0, 2019.
Yang, Y., Roderick, M. L., Yang, D., Wang, Z., Ruan, F., McVicar, T. R., Zhang, S., and Beck, H. E.: Streamflow stationarity in a changing world, Environ. Res. Lett., 16, 064096, https://doi.org/10.1088/1748-9326/ac08c1, 2021.
Yeboah, K. A., Akpoti, K., Kabo-bah, A. T., Ofosu, E. A., Siabi, E. K., Mortey, E. M., and Okyereh, S. A.: Assessing climate change projections in the Volta Basin using the CORDEX-Africa climate simulations and statistical bias-correction, Environmental Challenges, 6, 100439, https://doi.org/10.1016/j.envc.2021.100439, 2022.
Yira, Y., Diekkrüger, B., Steup, G., and Bossa, A. Y.: Impact of climate change on hydrological conditions in a tropical West African catchment using an ensemble of climate simulations, Hydrol. Earth Syst. Sci., 21, 2143–2161, https://doi.org/10.5194/hess-21-2143-2017, 2017.
Young, A. R., Round, C. E., and Gustard, A.: Spatial and temporal variations in the occurrence of low flow events in the UK, Hydrol. Earth Syst. Sci., 4, 35–45, https://doi.org/10.5194/hess-4-35-2000, 2000.