the Creative Commons Attribution 4.0 License.
the Creative Commons Attribution 4.0 License.
 | 25 Feb 2022
Modelling hourly evapotranspiration in urban environments with SCOPE using open remote sensing and meteorological data
Alby Duarte Rocha
Stenka Vulova
Christiaan van der Tol
Michael Förster
Birgit Kleinschmit
Evapotranspiration (ET) is a fundamental variable for assessing water balance and the urban heat island (UHI) effect. Terrestrial ET is deeply dependent on the land cover as it derives mainly from soil evaporation and plant transpiration. The majority of well-known process-based models based on the Penman–Monteith equation focus on the atmospheric interfaces (e.g. radiation, temperature and humidity), lacking explicit input parameters to precisely describe vegetation and soil properties. The model soil-canopy-observation of photosynthesis and energy fluxes (SCOPE) accounts for a broad range of surface–atmosphere interactions to predict ET. However, like most modelling approaches, SCOPE assumes a homogeneous vegetated landscape to estimate ET. As urban environments are highly fragmented, exhibiting a mix of vegetated and impervious surfaces, we propose a two-stage modelling approach to capture most of the spatiotemporal variability of ET without making the model overly complex. After predicting ET using the SCOPE model, the bias caused by the assumption of homogeneous vegetation is corrected using the vegetation fraction extracted by footprint modelling. Two urban sites equipped with eddy flux towers presenting different levels of vegetation fraction and imperviousness located in Berlin, Germany, were used as study cases. The correction factor for urban environments increased the model accuracy significantly, reducing the relative bias in ET predictions from 0.74 to 0.001 and 2.20 to −0.13 for the two sites considering the SCOPE model with remote sensing-derived inputs. Model errors (RMSE) were considerably reduced in both sites, from 0.061 to 0.026 and 0.100 to 0.021, while the coefficient of determination (R2) remained similar after correction, 0.82 and 0.47, respectively. The novelty of this study is to provide hourly ET predictions combining the temporal dynamics of ET in a natural environment with the spatially fragmented land cover in urban environments at a low computational cost. All model inputs are open data and available globally for most medium-sized and large cities. This approach can provide ET maps in different temporal resolutions to better manage vegetation in cities in order to mitigate the UHI effect and droughts.
- Article
(7819 KB) - Full-text XML
- BibTeX
- EndNote


Evapotranspiration (ET) is essential for understanding the water cycle and energy balance, as it regulates precipitation, temperature and vegetation productivity (Wang et al., 2020; Zheng et al., 2020). The cooling capacity of ET can mitigate the intensity of the urban heat island (UHI), which adversely impacts the health and quality of life of urban residents (Kovats and Hajat, 2008; Scherer et al., 2013). Optimising ET in urban areas could reduce the impact of extreme events such as severe heat waves, drought or flooding (Wang et al., 2020; Ward and Grimmond, 2017). Although ET plays an essential role in planning more sustainable cities, studies in urban environments are rare and very localised due to the challenges of measuring and modelling evaporation in highly heterogeneous landscapes (Nouri et al., 2015). Terrestrial ET is the sum of three primary sources of evaporation from land surfaces to the atmosphere (liquid to vapour): (1) evaporation from soil moisture and groundwater; (2) evaporation from plant transpiration; and (3) evaporation from intercepted precipitation (Miralles et al., 2020; Nouri et al., 2019). The temporal variation of ET is mainly driven by atmospheric conditions such as sunlight intensity (i.e. incoming radiation), air temperature and relative humidity (Foltýnová et al., 2020). By contrast, the quantity of ET is spatially dependent on the vegetation volume and the water availability in the soil (Dwarakish et al., 2015; Wang et al., 2020; Zheng et al., 2020).
The most suitable system for measuring ET in the urban environment is the eddy covariance (EC) method, which is based on the turbulence flux and energy balance (Liang and Wang, 2020; Nouri et al., 2013). The EC method measures latent heat flux (LE) from the atmosphere using sensors installed over a tower, which can be converted to ET later (Kotthaus and Grimmond, 2014). The observations are continually collected over regular time intervals but represented by an irregular area based on footprints that change shape, size and orientation according to atmospheric conditions (Kljun et al., 2015; Kotthaus and Grimmond, 2014). Therefore, EC measurements are affected by atmospheric stability, wind profile and surface roughness in the surroundings of the flux tower (Foltýnová et al., 2020; Schmid and Oke, 1990; Ward and Grimmond, 2017). Soil evaporation, plant transpiration and interception are not separable when measured by this method (Miralles et al., 2020). In addition, anthropogenic sources of latent heat fluxes such as car combustion or air conditioning are undistinguished from the primary sources of terrestrial ET, plant transpiration and soil evaporation (Nouri et al., 2013). Eddy covariance measurements represent a relatively small and constantly varying land cover area around the flux tower (diameter ∼ 500 m), insufficient to map ET in a heterogeneous urban environment (Kotthaus and Grimmond, 2014; Nouri et al., 2013; Vitale et al., 2020). Given the high installation and operating costs, it is also impractical to set up a widespread network of flux towers over the city (Westerhoff, 2015).
As urban ET observations are rare, costly and available only for a few cities in the world, an alternative is to estimate ET using process-based or empirical models. Fitting classic empirical models or machine-learning algorithms is relatively common in natural landscapes but relatively scarce in an urban environment (Vulova et al., 2021; Wang et al., 2020). One reason is the necessity to train the model at representative locations and conditions, which is a challenge in urban areas due to the constantly changing land cover captured by the tower's footprint and lack of flux towers at different surfaces in a highly fragmented and heterogeneous environment (Feigenwinter et al., 2018). In addition, most of the widely used empirical models are unsuitable for variables with strong spatiotemporal dependency, such as ET (Rocha et al., 2018, 2020).
The most common types of process-based models to estimate ET (i.e. latent heat flux) are surface energy balance (SEB), hydrological models, urban land-surface models (ULSM) and soil–vegetation–atmosphere transfer (SVAT) models. SEB models estimated ET as the residual of the energy balance equation. Some versions, such as surface energy balance algorithm for land (SEBAL) and surface energy balance system (SEBS), include variables as land surface temperature, albedo, and net radiation retrieved from remote sensing variables (Nouri et al., 2015; van der Tol and Norberto, 2012). However, SEB models are more suitable for the regional scale and have low performance in the urban environment (Bayat et al., 2018).
Hydrological models are focused on streamflow, soil moisture storage and runoff generation processes but often also provide estimations of plant transpiration, soil evaporation and interception loss (Devia et al., 2015; Zhao et al., 2013). Some (eco)hydrological models are designed or adapted for urban environments, such as SWMM-UrbanEVA and urban climate and hydrology (UT&C), including anthropogenic heating and urban canyon design (Hörnschemeyer et al., 2021; Meili et al., 2020). However, several parameters are difficult to supply for applications requiring a high temporal and spatial resolution. For instance, UT&C requires inputs that are possible only for experimental studies, such as the distance of the wall to a tree trunk (m), albedo and emissivity of walls, volumetric heat capacity and thickness of wall and roof layers (Meili et al., 2020). ULSMs such as surface urban energy and water balance scheme (SUEWS) and urban climate models (UCM) such as PALM-4U are specialised in heat fluxes and microclimates in cities (Järvi et al., 2011; Maronga et al., 2015). Like most urban models for ET estimation, ULSM models also require several input parameters and a demanding calibration process, hampering the model transferability. The accuracy of urban models for LE is often the lowest among all fluxes and model outputs, especially in densely built-up areas, undermining their use for estimating ET (Rafael et al., 2020; Ward et al., 2016; Ward and Grimmond, 2017).
SVAT models are based on energy balance and mass transfer, allowing for a comprehensive parameterisation of soil and vegetation surface properties (Kracher et al., 2009; Petropoulos et al., 2009). The soil-canopy-observation of photosynthesis and energy fluxes (SCOPE) is a SVAT model that accounts for surface–atmosphere interactions of both turbulent heat fluxes and radiative transfer (van der Tol et al., 2009). SCOPE has been successfully applied to predict ET in croplands and natural environments (Bayat et al., 2018; Timmermans et al., 2013). However, the effect of surface heterogeneity in the horizontal direction is not addressed by (one-dimensional) models and SCOPE was never applied to urban environments (van der Tol et al., 2009; Yang et al., 2021). The ET estimations from most model approaches cited above are based on energy balance and mass transfer methods often derived from the Penman–Monteith equation (Devia et al., 2015; Zhao et al., 2013). The Penman–Monteith equations, which are widely used for agricultural applications (Allen et al., 2005), focus mainly on the atmospheric interface for a specific vegetation cover. Therefore, most ET modelling approaches assume a landscape of homogeneous vegetation without anthropogenic elements to calculate ET from pervious soil and vegetation fractions but cannot capture plant phenology (Nouri et al., 2015; Westerhoff, 2015). However, some sophisticated urban models calculate anthropogenic latent heat flux, the effect of building shadows over vegetated areas and interception loss to provide the total ET (Järvi et al., 2011).
Urban environments present highly fragmented and heterogeneous land cover in all dimensions (vertically and horizontally) for both pervious and impervious surfaces (Feigenwinter et al., 2012; Ward and Grimmond, 2017; Zheng et al., 2020). The calibration and processing time to obtain ET in high-temporal and high-spatial resolution for large areas for all urban variations is very demanding, if not unfeasible (Zheng et al., 2020). It is also complicated to define a spatial and temporal resolution suitable for most of the required model inputs and outputs (Rafael et al., 2019). For instance, impervious areas are mainly static over a 1-year interval, while characterising the weather conditions in an hourly resolution is desirable. Thus, a model that embedded all the interactions between atmospheric conditions, vegetation and soil properties, impervious fractions and anthropogenic heating would be mostly redundant in space or time for hourly ET estimation.
This study aims to develop a robust and transferable method to map urban ET at any location in the city using a high-resolution spatiotemporal model that requires only freely available data inputs. The novelty is to provide a solution that combines the high temporal dynamics of ET in a vegetated environment with the spatial fragmentation in urban environments, producing a less computationally expensive but plausible ET product. We assume that terrestrial ET is mostly derived from plant transpiration and soil evaporation, considering these sources to be essential in mitigating the UHI and droughts by better managing green areas in the cities. We neglected interception loss from precipitation and latent heat fluxes from anthropogenic sources such as car combustion or house heating. These sources are not directly associated with the cooling effect of ET and may mislead urban planning as they are likely inversely proportional to UHI and droughts. We propose a process-based SVAT model (i.e. SCOPE) combined with a correction factor for urban environments based on the vegetation fraction to derive hourly ET. The factor corrects the model bias due to impervious surfaces using the vegetation fraction extracted by hourly footprints. The hourly predictions for an entire year (12 months, 24 h, 8760 timestamps) were compared with reference ET derived from the Penman–Monteith equation and validated with flux tower measurements from two locations in Berlin, Germany. The study focuses on modelling with open data from standard meteorological stations and remote sensing products available for most medium-sized and large cities of Europe, targeting transferability.
2.1 Study area
Two sites in Germany's biggest city and capital, Berlin, were selected for this study because they are equipped with eddy flux towers. Berlin is situated in a temperate climate zone with humid sea air, presenting mild temperatures when air masses come from southerly directions and cooler air from the (Atlantic) north (Senate Department for Urban Development and Housing, 2015). Easterly air masses or continental wind directions usually bring extremely dry air and may cause very cold periods in winter and exceptionally hot days in summer. Berlin is mainly flat with an elevation of 34 m above the sea (from 24 to 120 m). The maximum annual volume of precipitation occurs in the summer, while winter months present the highest number of hours under rainfall. The lowest precipitation (volume and occurrences) is often in the transitional seasons, with the driest month usually being April (Fig. 2).
Despite being equipped with similar eddy covariance instrumentation, the locations present different levels of vegetation cover and imperviousness. Although both sites have a clear urban character, one site is located in a relatively green neighbourhood, while the other is in a central built-up area, with the two sites 6 km apart from each other (Fig. 1a). The flux tower, referred to as Rothenburgstraße (ROTH), is located in a research garden southwest of the city. ROTH observations are measured at approximately 40 m above the ground, a few metres higher than the tree canopies and the one building nearby. The other flux tower, called TUB Campus Charlottenburg (TUCC), is located on top of the university's main building in the city centre (Fig. 1d). The TUCC measurements are taken from a tower 10 m above the roof and 56 m above the ground. With 72 % imperviousness, the TUCC site is a denser built-up area than the ROTH site with 49 % (Fig. 1b).
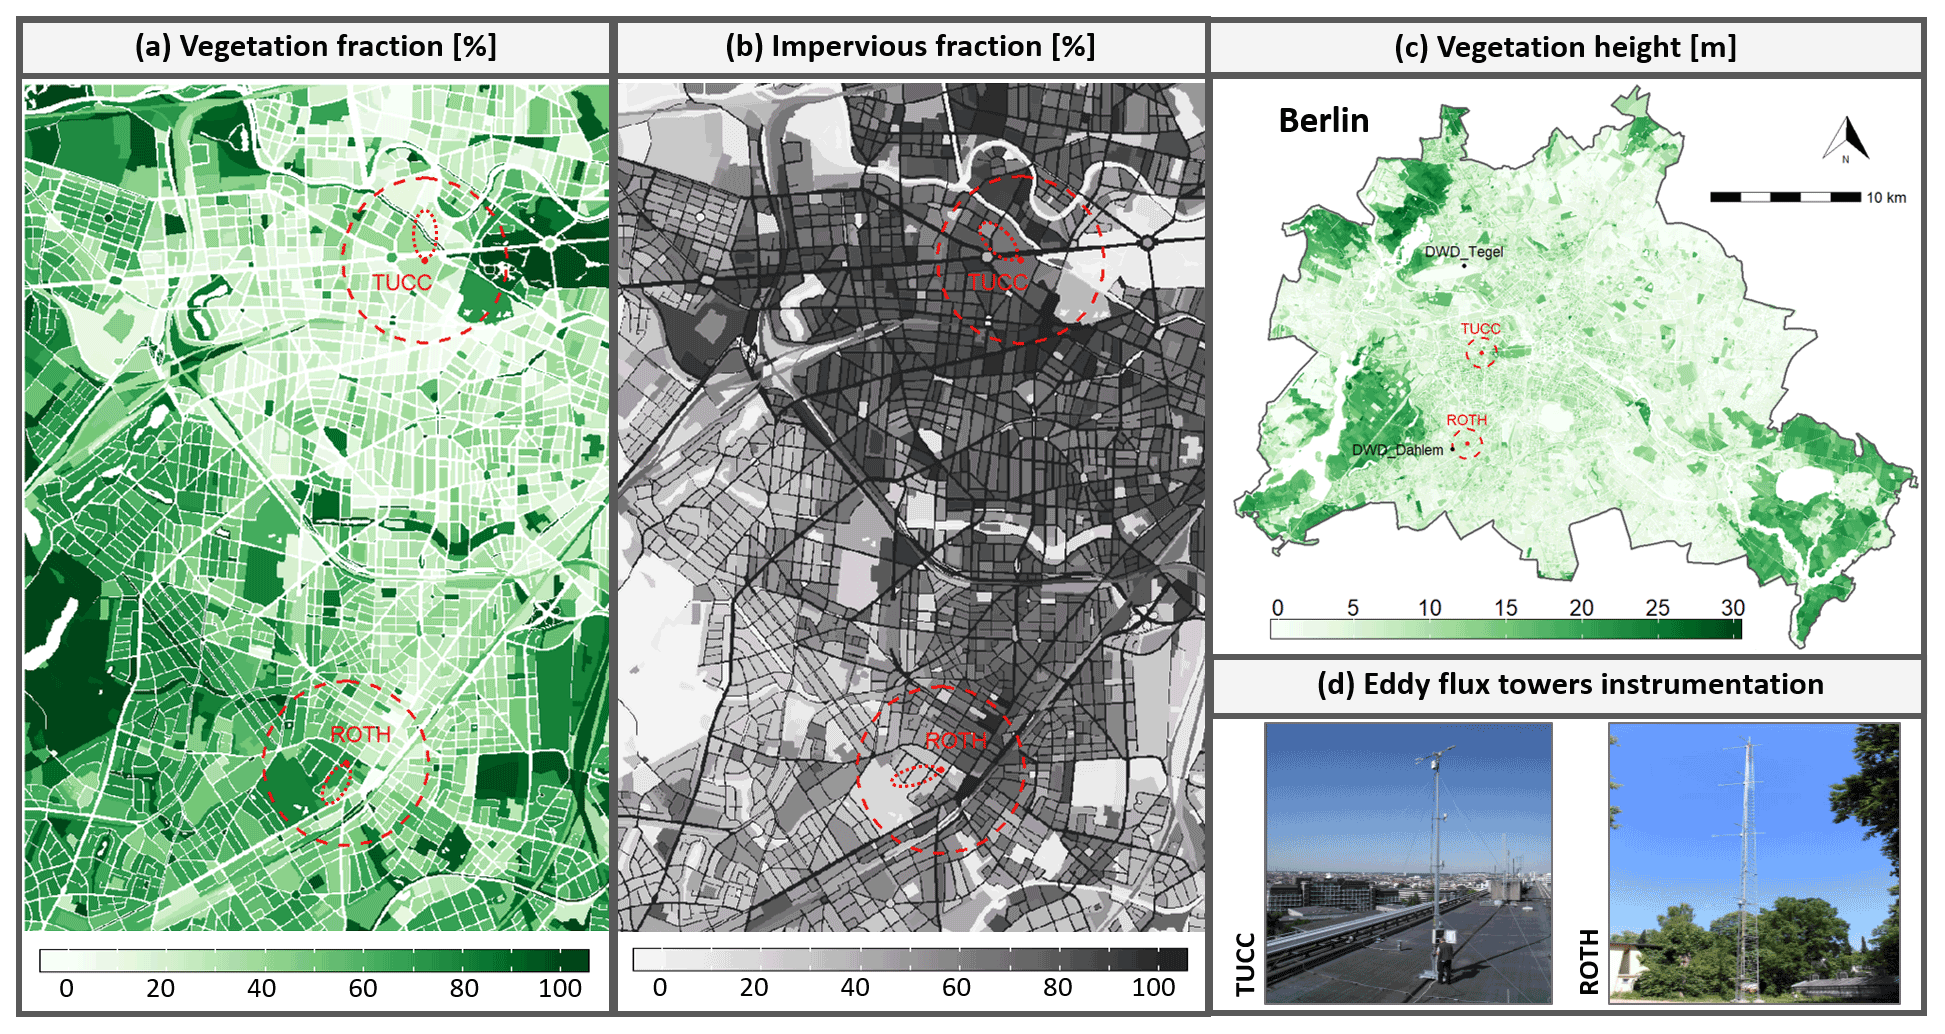
Figure 1Locations of the two sites with the respective (a) vegetation fraction (%), (b) impervious fraction (%) and (c) vegetation height (m) in the surroundings of the flux towers (d). The red dotted areas represent a buffer of 1000 m around the towers (red dot), while the red ellipses are examples of hourly footprints. The black dots on the Berlin map (c) refer to the DWD weather stations Tegel and Dahlem. The three land surface maps were extracted from the Berlin Digital Environmental Atlas (Senate Department for Urban Development and Housing, 2017; Senate Department for Urban Planning and the Environment, 2014).
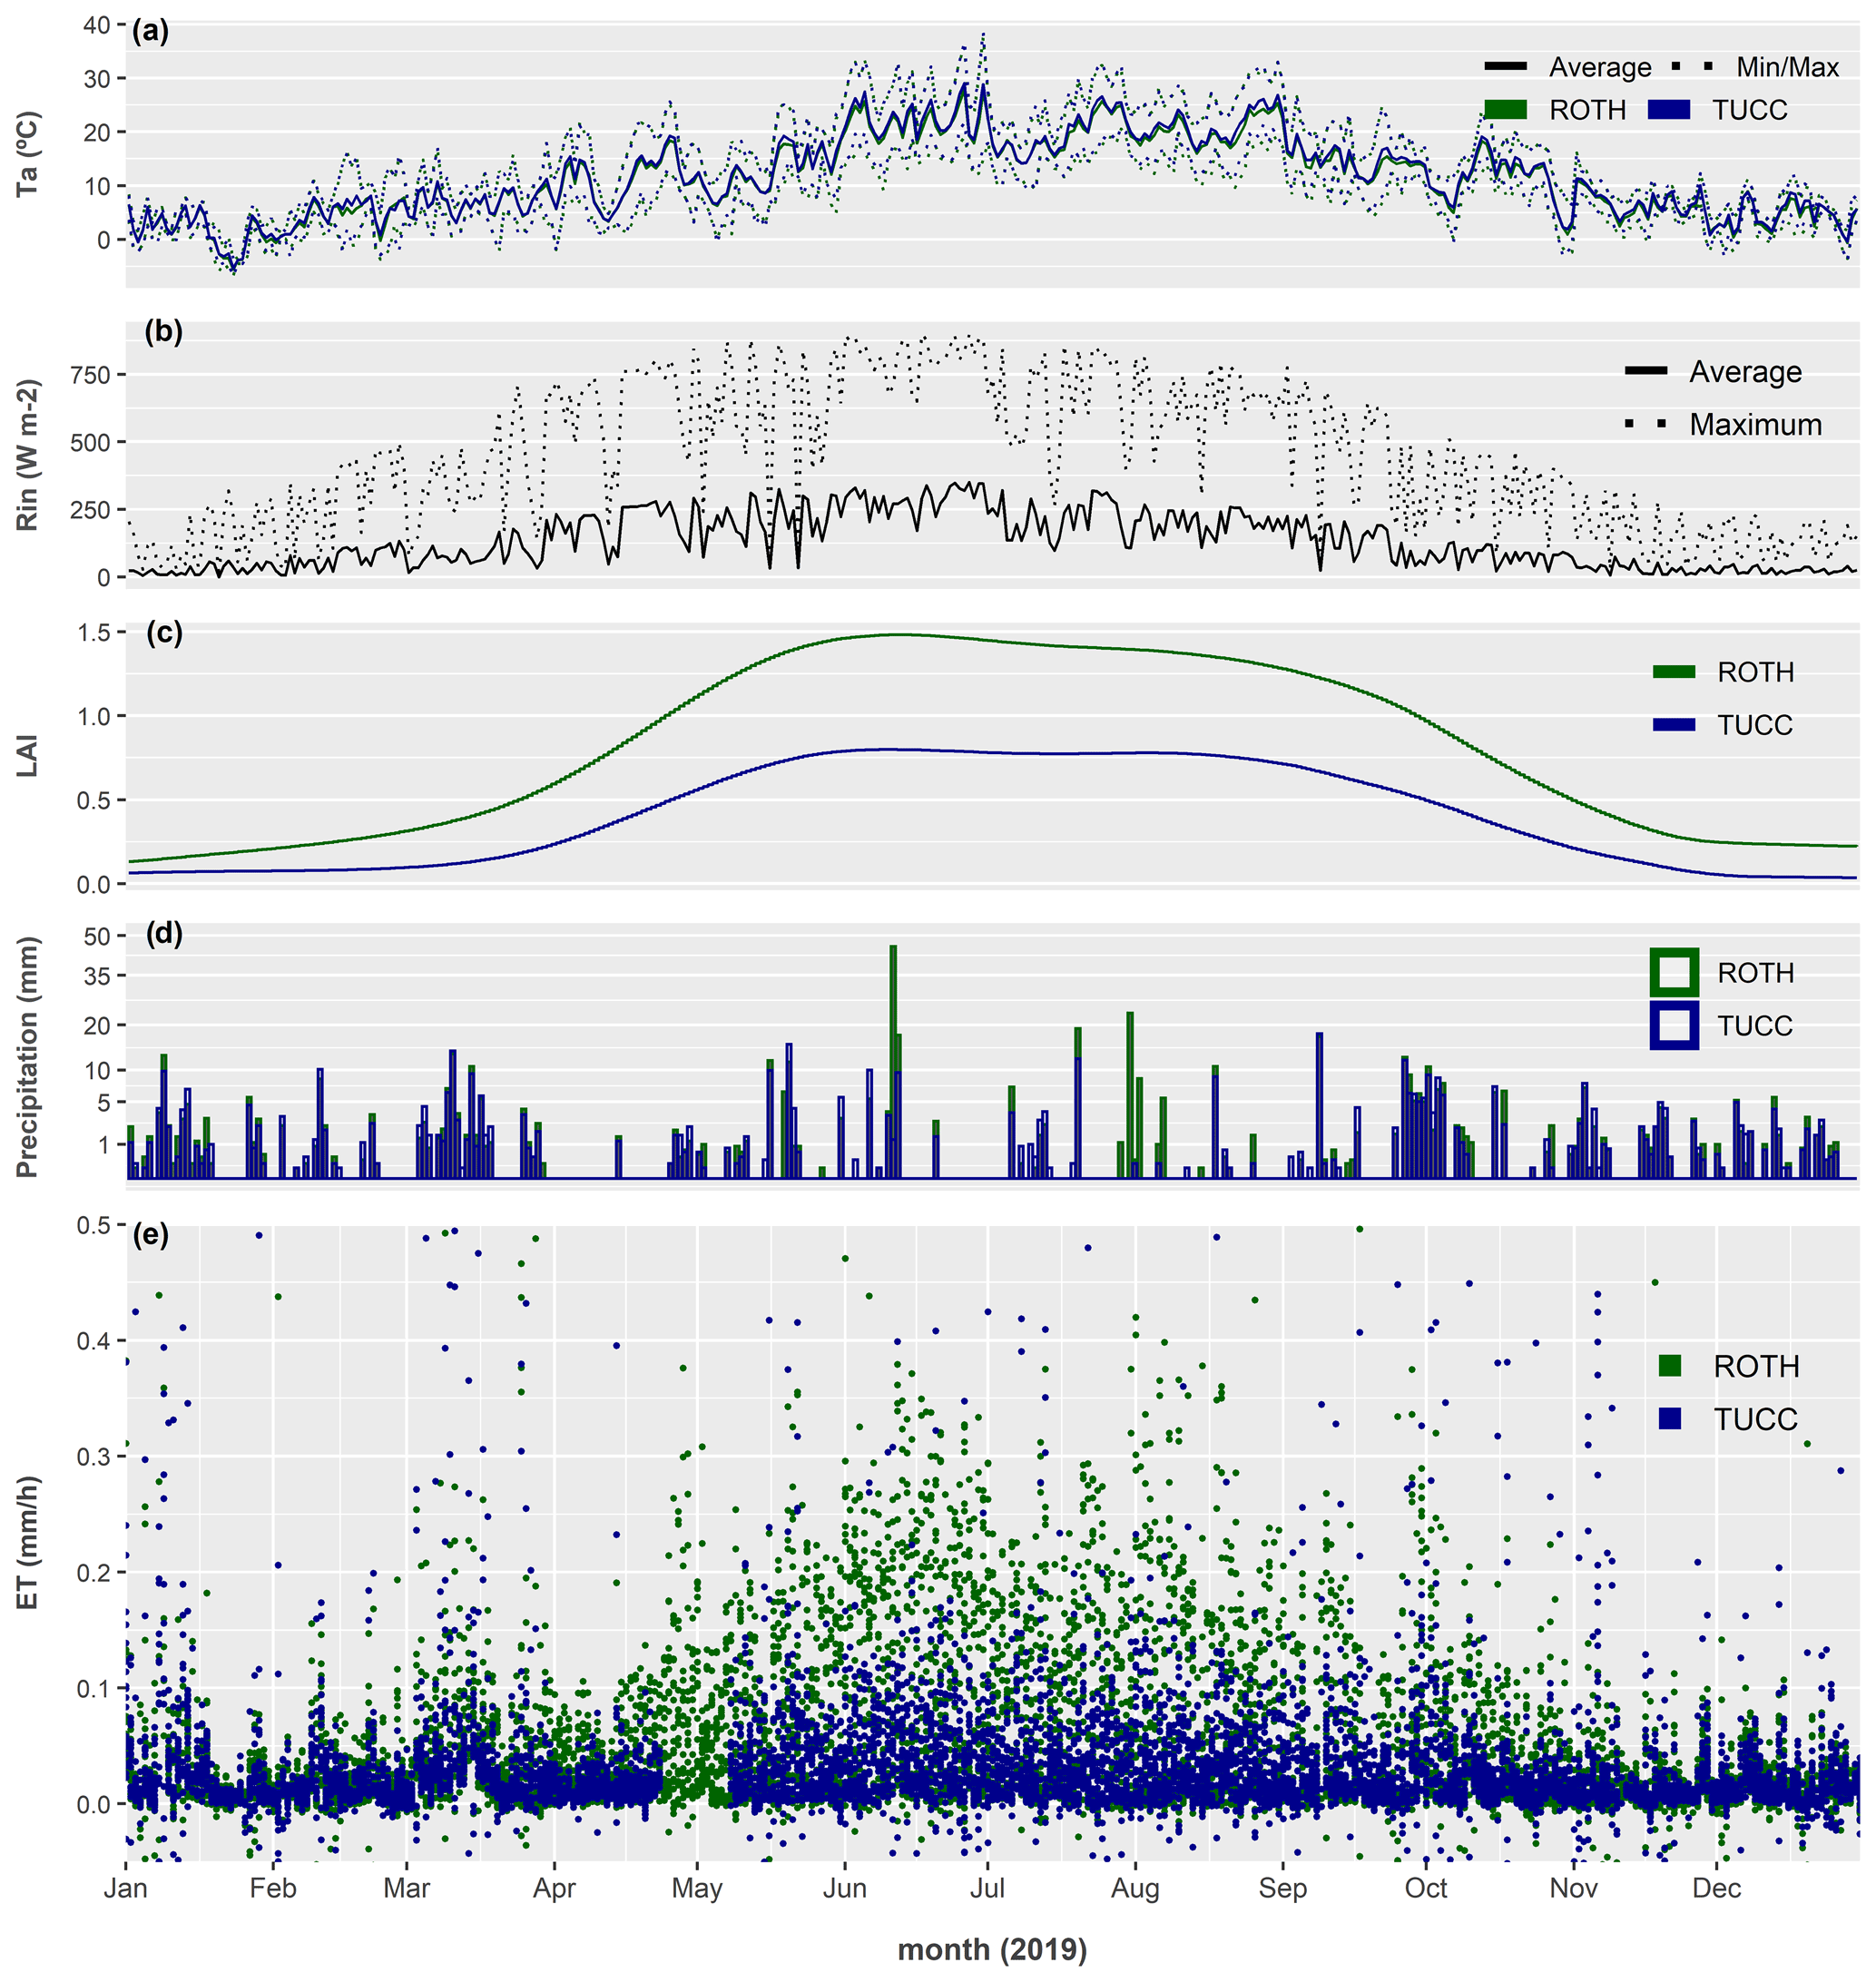
Figure 2Time series of the main variables used in this study for both sites in 2019, where the green colour represents the data from the ROTH site and blue, the TUCC site. (a) Air temperature (Ta), where the dotted lines represent the maximum and minimum daily values and solid lines represent average daily values; (b) incoming shortwave radiation (Rin) is common for both sites, where the solid black line represents the average and the dotted line, the maximum daily values; (c) LAI RS-derived values; (d) the volume of precipitation (mm); and (e) the evapotranspiration observations from the EC towers (ET).
2.2 Data
2.2.1 Eddy covariance flux towers
The two eddy covariance (EC) flux towers are operated by the Chair of Climatology at the Technische Universität Berlin (TUB) as part of the Urban Climate Observatory (UCO) Berlin (Scherer et al., 2019; Vulova et al., 2021). The EC measurement system is based on an open-path gas analyser and a three-dimensional sonic anemometer–thermometer (IRGASON, Campbell Scientific). The software EddyPro (Version 6.2.1) was used to derive turbulent fluxes of sensible and latent heat by processing the raw data sampled at 20 Hz. The pre-processing of raw data at 30 min intervals was performed as suggested by Vickers and Mahrt (1997), including physical threshold filtering, statistical screening and spike elimination. The double rotation method was applied by EddyPro for the calculation of a local streamlined coordinate system as determined by the flow statistics over the 30 min averaging period. Furthermore, EC data were corrected for air density and sonic temperature for humidity as well as high- and low-frequency spectral corrections (Moncrieff et al., 1997; Webb et al., 1980).
The 30 min values of latent heat flux (LE, W m−2) under the following conditions were excluded: (1) observations with flag quality higher than 1 (Foken, 2008); (2) values outside of the thresholds of −100 and 500 W m−2; (3) observations 6 standard deviations (SD) greater than the average (outliers), and (4) measurements during precipitation or up to 4 h after rain events. Items 1–3 were performed using functions from the R package “FREddyPro” (Xenakis, 2016). The wind directions 17–35∘ at TUCC and 54–72∘ at ROTH are susceptible to distortion due to the mounting setup of the instrument (wind coming from behind the tower). However, as we are using a deterministic model that does not require training and the effect on the model accuracy for ET was insignificant, these observations were preserved. Negative ET values (condensation) were set to 0 as annual sums in millimetres will be provided and we are only interested in the amount of water released into the atmosphere by soil evaporation and plant transpiration processes. The entire year of 2019, including winter and nighttime, was selected as there are EC observations simultaneously available for both towers in 2019.
The upward latent heat flux (LE, W m−2) observations were aggregated to hourly resolution and converted to ET by the expression , where λ is the latent heat of vaporisation (J kg−1). ET was calculated from LE as a function of air temperature using the “bigleaf” R package (Knauer et al., 2018) in order to use the same procedure for both observed and modelled LE from SCOPE. After pre-processing, from the 8760 timestamps, 43 % of the ROTH and 42 % of the TUCC data were missing. The remaining values of ET, 4993 and 5104 values, respectively, were used to assess the model accuracy. To obtain monthly and yearly estimates from the observed ET, gap-filling is required. Given the strong seasonal and diurnal variation of ET, linear interpolation is not recommended. A standard procedure uses the marginal distribution sampling (MDS) gap-filling algorithm, which considers meteorological variables to account for the daily and annual seasonality (Falge et al., 2001; Wutzler et al., 2018). We performed (MDS) gap-filling using the R package “REddyPROC” (Wutzler et al., 2018). Monthly and yearly values of ET from MDS gap-filling will later be compared with the modelled ET predictions.
2.2.2 DWD meteorological data
In order to use model inputs completely independent of the flux towers, data from the meteorological stations of the German Meteorological Service network (DWD Climate Data Center) were selected based on the distance to the flux towers (DWD, 2020). The data from the meteorological stations, Tegel (∼5 km from TUCC) and Berlin-Dahlem (∼1 km from ROTH), were used as model inputs (Table 1). The variables shortwave and longwave radiation were collected from the Potsdam station to represent both sites. The Potsdam station is located in the neighbouring city with the same name, ∼19 km and ∼23 km from the flux tower sites.
Table 1Datasets and data sources used to model ET in this study.
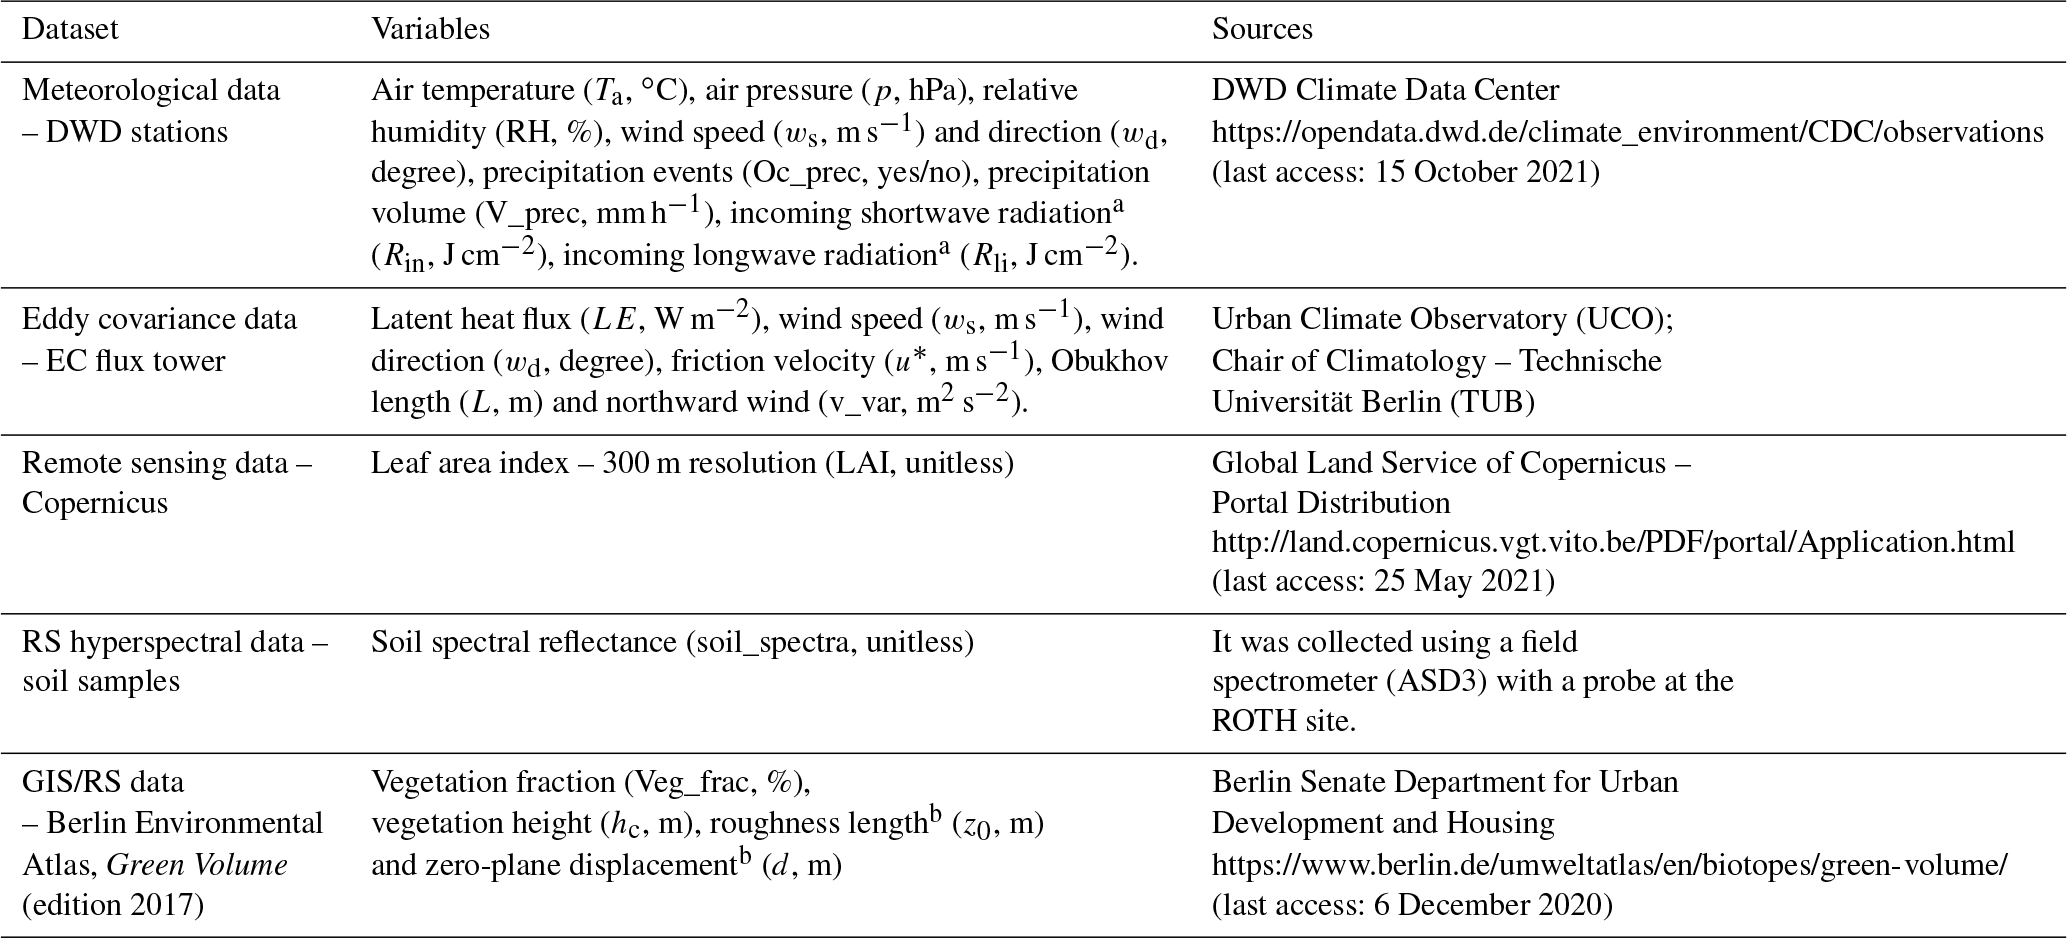
a Rin and Rli were later transformed to [W m−2]. b Calculated based on the vegetation and building height.
2.2.3 Remote sensing and GIS data
The LAI300m (V1) product generated by the Global Land Service of Copernicus, the Earth Observation Programme of the European Commission, provides a valuable estimate of an essential biophysical parameter to model ET (Table 1). The Copernicus product provides a grid of LAI values with 300 m spatial resolution and 10 d temporal resolution (Bauer-Marschallinger and Paulik, 2019). The product is based on PROBA-V data, and the LAI was estimated by neural network algorithms trained with MODIS and CYCLOPES products. The product was atmospherically corrected, with outlier removal and cloud masking. Smoothing and gap-filling operations were applied based on the land cover type and temporal performance. A time series of 36 LAI maps for 2019 were downloaded and linearly interpolated to match the timestamp of the observed ET. We assumed that in between the 10 d gap, the differences that occurred were relatively minor and irrelevant to this study.
Although the GIS data such as vegetation height and vegetation fraction maps are derived from a specific point in time, the corresponding source area (footprint) of the EC flux measurements (e.g. ET or LE) continually varies in shape, size and orientation. Therefore, these two inputs were extracted using footprints for both towers, varying hourly to capture the spatiotemporal dynamics of the surface properties. The footprint model, according to Kormann and Meixner (2001), was applied using the R package “FREddyPro” (Xenakis, 2016). The input data for footprint modelling were derived from the flux towers measurements, except for the aerodynamic parameter (zd), roughness length (z0) and zero-plane displacement (d). These parameters were calculated from building and vegetation height by seasons (i.e. winter, summer, and intermediate) to incorporate changes in tree foliage. For further information about how the parameters were calculated, see Kent et al. (2017) and Quanz (2018).
The footprints were based on a regular grid of 10 m resolution with an extent (x, y) of 1000 m from the tower locations (fetch size). For each grid pixel, the probability that the source area belongs to the influence zone of the flux measurements was calculated for every hour (Schmid and Oke, 1990). These grids of probabilities, excluding pixels outside of 90 % of the footprint likelihood, were multiplied to the raster of the surface property (e.g. vegetation height) to extract average values for each timestamp of 2019. Surface properties to characterise the two Berlin sites were derived from a publicly available GIS database. Vegetation fraction (%) and vegetation height (m) were obtained from the Green Volume publication (edition 2017) from the Berlin Digital Environmental Atlas (Senate Department for Urban Development and Housing, 2017). All the layers of GIS maps were converted to a raster with 10 m resolution and resampled to the footprint grid of each tower to extract the average surface properties per timestamp. The raster layers of each land surface were then multiplied by a footprint raster, and the resulting pixel values were summed to obtain the weighted averages for each site and timestamp.
In this study, water bodies were omitted as they represent only 2.7 % of land cover at the TUCC site and 0 % at ROTH on average. The Berlin Environmental Atlas also presents a detailed set of maps from the study “Surface runoff, percolation, total runoff and evaporation from precipitation” (Senate Department for Urban Planning and the Environment, 2019). This study will be used for comparison with our results.
Table 2Input parameters which vary hourly for each SCOPE scenario.
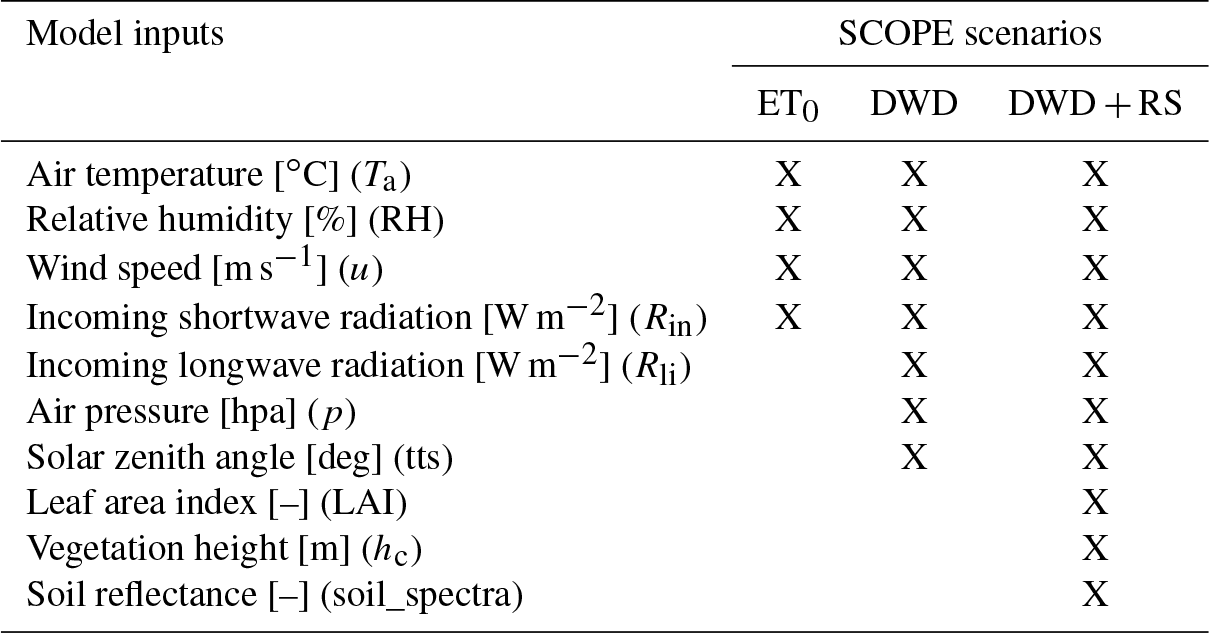
(tts) was derived from the DWD timestamp. The setting options “soil heat method” and “applTcorr” to correct Vcmax parameter by temperature were used to run the model scenarios DWD and RS.
2.3 Model approaches
2.3.1 Penman–Monteith model
A formulation based on the Penman–Monteith equation (the ASCE standardised equation for short crops) was used to calculate reference ET (ET0) (Allen et al., 1998, 2005). Hourly ET0 was calculated by providing air temperature, wind speed, relative humidity and incoming shortwave radiation as model input using the R package “water” (Olmedo et al., 2016). As this formulation of ET0 assumes a homogeneous landscape of short crops, no land surface information is required, and the model is exclusively driven by meteorological conditions (Table 2). Penman–Monteith ET0 is a well-known and established approach which will be used as a benchmarking method to evaluate to what extent including inputs that characterise surface properties can improve ET prediction accuracy.
2.3.2 SCOPE model
SCOPE is a process-based model (i.e. SVAT model), which integrates radiative transfer models (RTM) of soil, leaf and canopy with energy balance models (van der Tol et al., 2009). SCOPE is an ensemble model approach, combining one-dimensional bidirectional turbid medium radiative transfer, micrometeorology and plant physiology (van der Tol et al., 2009). This configuration allows SCOPE to account for a wide range of surface–atmosphere interactions, requiring different model inputs according to the target outputs.
Since SCOPE is a one-dimensional vertical model that assumes horizontal homogeneity, it is not designed for heterogeneous urban areas (Yang et al., 2021). However, as our focus is on soil evaporation and plant transpiration, the SCOPE model provides the necessary framework for our application due to the following reasons: (1) the capacity to integrate both high-resolution climatological and medium-resolution remote sensing data inputs for vegetation and soil such as LAI, vegetation height and soil moisture; (2) sophisticated approach to estimating energy fluxes – SCOPE calculates the essential elements of the energy fluxes, including LE, H, G, net radiation, soil and canopy temperature, friction velocity and aerodynamic resistance. It also estimates energy fluxes (LE and H) for soil and vegetation separately and warns when the energy balances cannot be closed for a specific timestamp. There are also options to correct for Monin–Obukhov atmospheric stability and maximum carboxylation capacity (Vcmax) for temperature, which is crucial to ET estimation.
The model is divided into different modules, allowing the user to focus on essential inputs for estimating heat flux outputs. SCOPE automatically calculates the effect of solar angles on the fraction of sunlit and shaded leaves, reducing the time lag difference between the spectral data and ET observations across the year driven by the fluctuation in sun zenith angle. The calibration and processing time enable high temporal resolution predictions for many different points in space and time. The most important groups of variables to estimate LE are: (1) meteorological inputs such as incoming shortwave radiation (Rin), air temperature (Ta) and atmospheric vapour pressure (ea); (2) biochemical plant traits inputs such as the Ball–Berry stomatal conductance parameter (m) and Vcmax; and (3) biophysical inputs such as leaf angle distribution (LIDFa, LIDFb) and LAI (Yang et al., 2021). No anthropogenic heat sources contribute to latent heat fluxes in SCOPE, nor does building shadow constrain it. Interception loss from precipitation is also not accounted for by the model.
A list of the model inputs that vary across the timestamp used in this study is provided in Table 2. Since changing all model inputs of SCOPE to realistic values for a time series of hourly observations is almost unfeasible, the other parameters were kept constant, except for the roughness length (z0) and zero-plane displacement (d), which were set based on the footprints. Three scenarios were tested: (1) a SCOPE model with the same input variables as used for reference ET0 (Penman–Monteith); (2) a SCOPE model with all available inputs from the DWD datasets; and (3) a SCOPE model that combines DWD data with RS data. The model output, total LE (W m−2), was converted to ET (mm h−1) using the same procedure used for the EC tower data. The modelling was performed in MATLAB R2018b using SCOPE version 2.0 (Yang et al., 2021).
2.3.3 Correction factor for urban environments
Our focus is on the primary sources of terrestrial ET (plant transpiration and soil evaporation). Climatological conditions are the main drivers of terrestrial ET, which present high temporal dynamics. On the other hand, fragmented urban land cover and impervious surfaces are the main constraints of ET released into the atmosphere. Therefore, a model to predict urban ET accurately requires high temporal and spatial resolutions. Still, processing all time–space interactions is demanding and currently unfeasible for the resolution needed for our application. However, ET predictions from SCOPE are likely to be biased if the imperviousness areas are not accounted for, as the models assume homogeneous vegetation (horizontally). Based on these assumptions, we propose this two-stage modelling approach to capture most of the spatiotemporal variability of ET without making the model overly complex. First, we predicted ET using the SCOPE model for the described scenarios. Then, we corrected the predictions to represent only vegetated areas extracted from the footprints of each timestamp.
This strategy combines hourly SCOPE predictions with high spatial resolution vegetation fraction maps to correct the assumption of homogeneous vegetation and impervious areas. Impervious areas are mainly static over a 1-year interval; therefore, embedding urban features and anthropogenic heat sources in the model would be predominantly redundant and very computationally demanding. This approach allows us to predict ET for different spatial and temporal resolutions, which would be more complicated if using a more specialised urban model for hourly ET predictions. In order to correct the ET predictions according to the surface characteristics of each site, we use the extracted vegetation fraction average from the footprints per timestamp to subtract the ET estimated in impervious areas with a 10 m resolution product.
The correction factor for urban environments is a relative value that varies from 0 to 1, where 0 means completely impervious and 1 fully vegetated. The factor is multiplied by the total ET predictions from SCOPE and ET0 from Penman–Monteith to provide the corrected estimate for each timestamp. This approach assumes zero ET coming from impervious fractions. However, none of the footprint estimations of the correction factor (i.e. vegetation fraction) was entirely impervious. The ROTH site presents an annual average (footprint) of the vegetation fraction of 0.55 (0.15–0.77) and of canopy height of 7.7 m (2.9–10.0), while the TUCC site presents an average of 0.27 (0.03–0.87) and 7.1 m (2.7–15.1), respectively. Street trees were considered for the calculation of vegetation height and fraction.
2.3.4 Model assessment
As both models are fully deterministic, no train and test splitting or cross-validation approaches are needed to select and validate the models. The model accuracy was assessed using all available ET values from the flux tower time series. To assess model precision, the metrics RMSE and the coefficient of determination (R2) between predicted and observed ET were used. Since deterministic or process-based models are more prone to prediction biases than fitted empirical models, the relative bias (rBias) was assessed. The rBias is calculated as the sum of the differences between predicted and observed values of each timestamp relative to the total ET observed in the period. In this study, bias relative to the observed ET was also used as an indicator of the correction factor efficiency in providing unbiased predictions in an urban environment. All plots and metrics for model assessment were performed using the “ggplot2” package (Wickham, 2016) and basic functions in R software (R Core Team, 2020).
3.1 ET prediction in urban environments
As atmospheric conditions are the main drivers for evapotranspiration, we first tested the similarity of the climatological variables measured by the flux towers compared to nearby standard meteorological (DWD) stations. The results (Fig. 3a) show that there is a strong relationship between the ET0 calculated using data from flux towers (x axis) and data from DWD stations (y axis), but also between the locations using the same data. For any of the six combinations of ET0 pairs, the coefficient of correlation is at least 0.96 (not shown). This result indicates that a nearby meteorological station can represent the local atmospheric conditions without losing significant accuracy. Therefore, we use only publicly available meteorological model inputs to predict ET, completely independent of the measurements from the two towers. As meteorological variables and vegetation fractions are available for most medium-sized and large cities of Europe, there is a great potential for the methodology to be transferred to other locations based on the promising results shown for the two EC towers in Berlin.
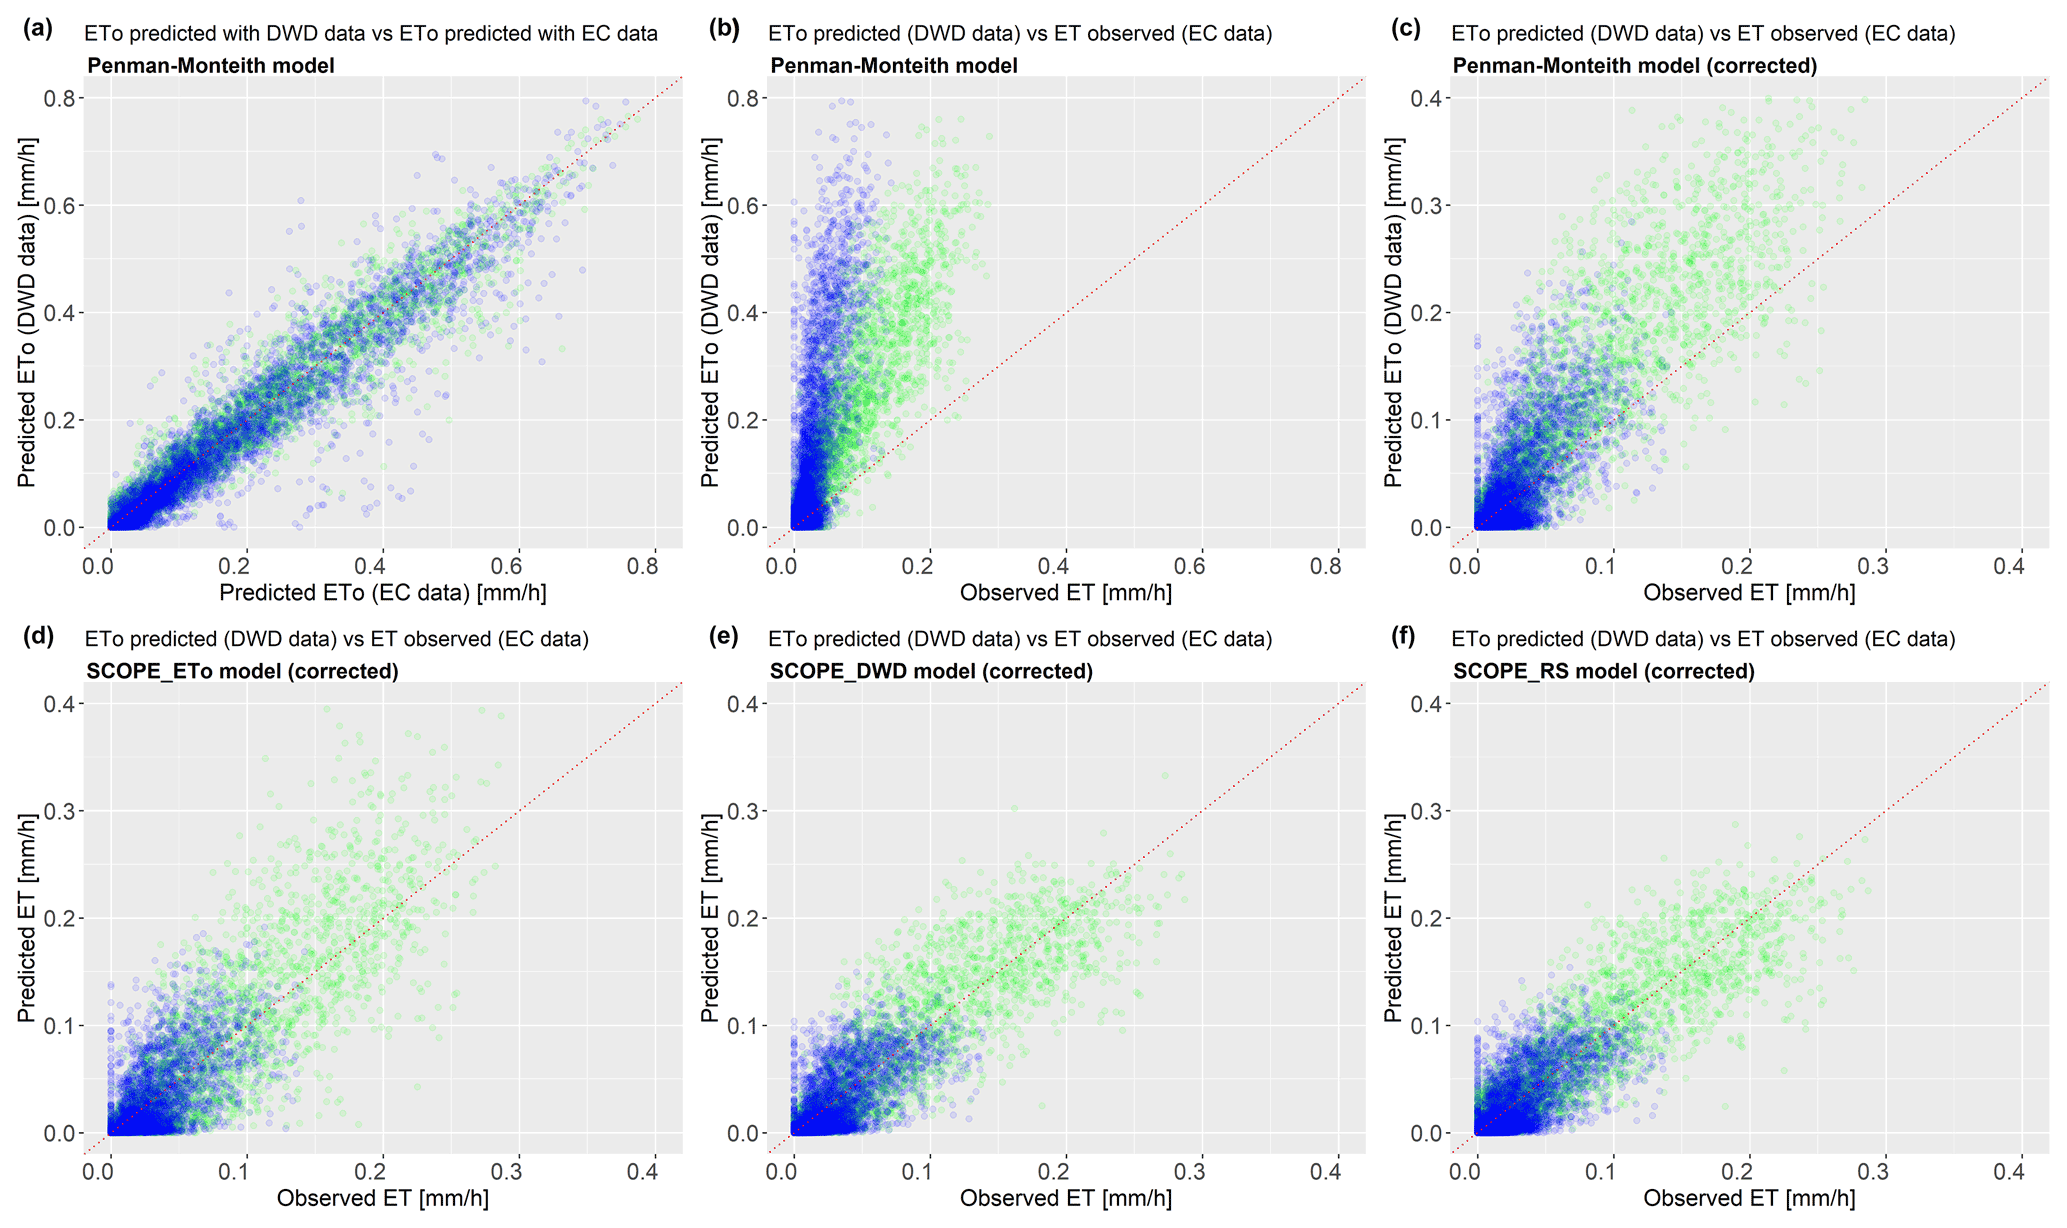
Figure 3The relationship between ET0 calculated using data from the meteorological stations and the EC towers (a), ET0 from the DWD data versus observed ET from the EC tower (b), ET0 (corrected) versus observed ET (c), corrected SCOPE_ET0 inputs versus observed ET (d), corrected SCOPE_DWD versus observed ET (e), and corrected SCOPE_RS versus observed ET (f). The green dots represent the ROTH site, and the blue dots represent the TUCC site.
Table 3Model accuracy for each scenario according to the metrics RMSE, R2 and relative bias for ET0 (Penman-Monteith) and SCOPE, with and without the correction factor for urban environments. The highlighted bold values represent the highest precision and lowest bias based on each metric.

Although atmospheric conditions and water availability mainly drive the temporal variability of ET, the spatial variability, which determines the volume of ET, depends primarily on the land surface characteristics. The models clearly overestimate ET in highly fragmented landscapes with impervious surfaces, as shown in Fig. 3b. The difference between the two towers emphasises the dependence on the vegetation fraction. The ROTH site contains a higher average of vegetation and pervious fractions (55 % and 49 %) than the TUCC site (27 % and 28 %). Therefore, the model bias at ROTH is more than twice as low as when the model is applied at TUCC without the correction factor (Table 3). As presented earlier, the ET0 of the two towers is very similar, while the observed ET is twice as low at TUCC.
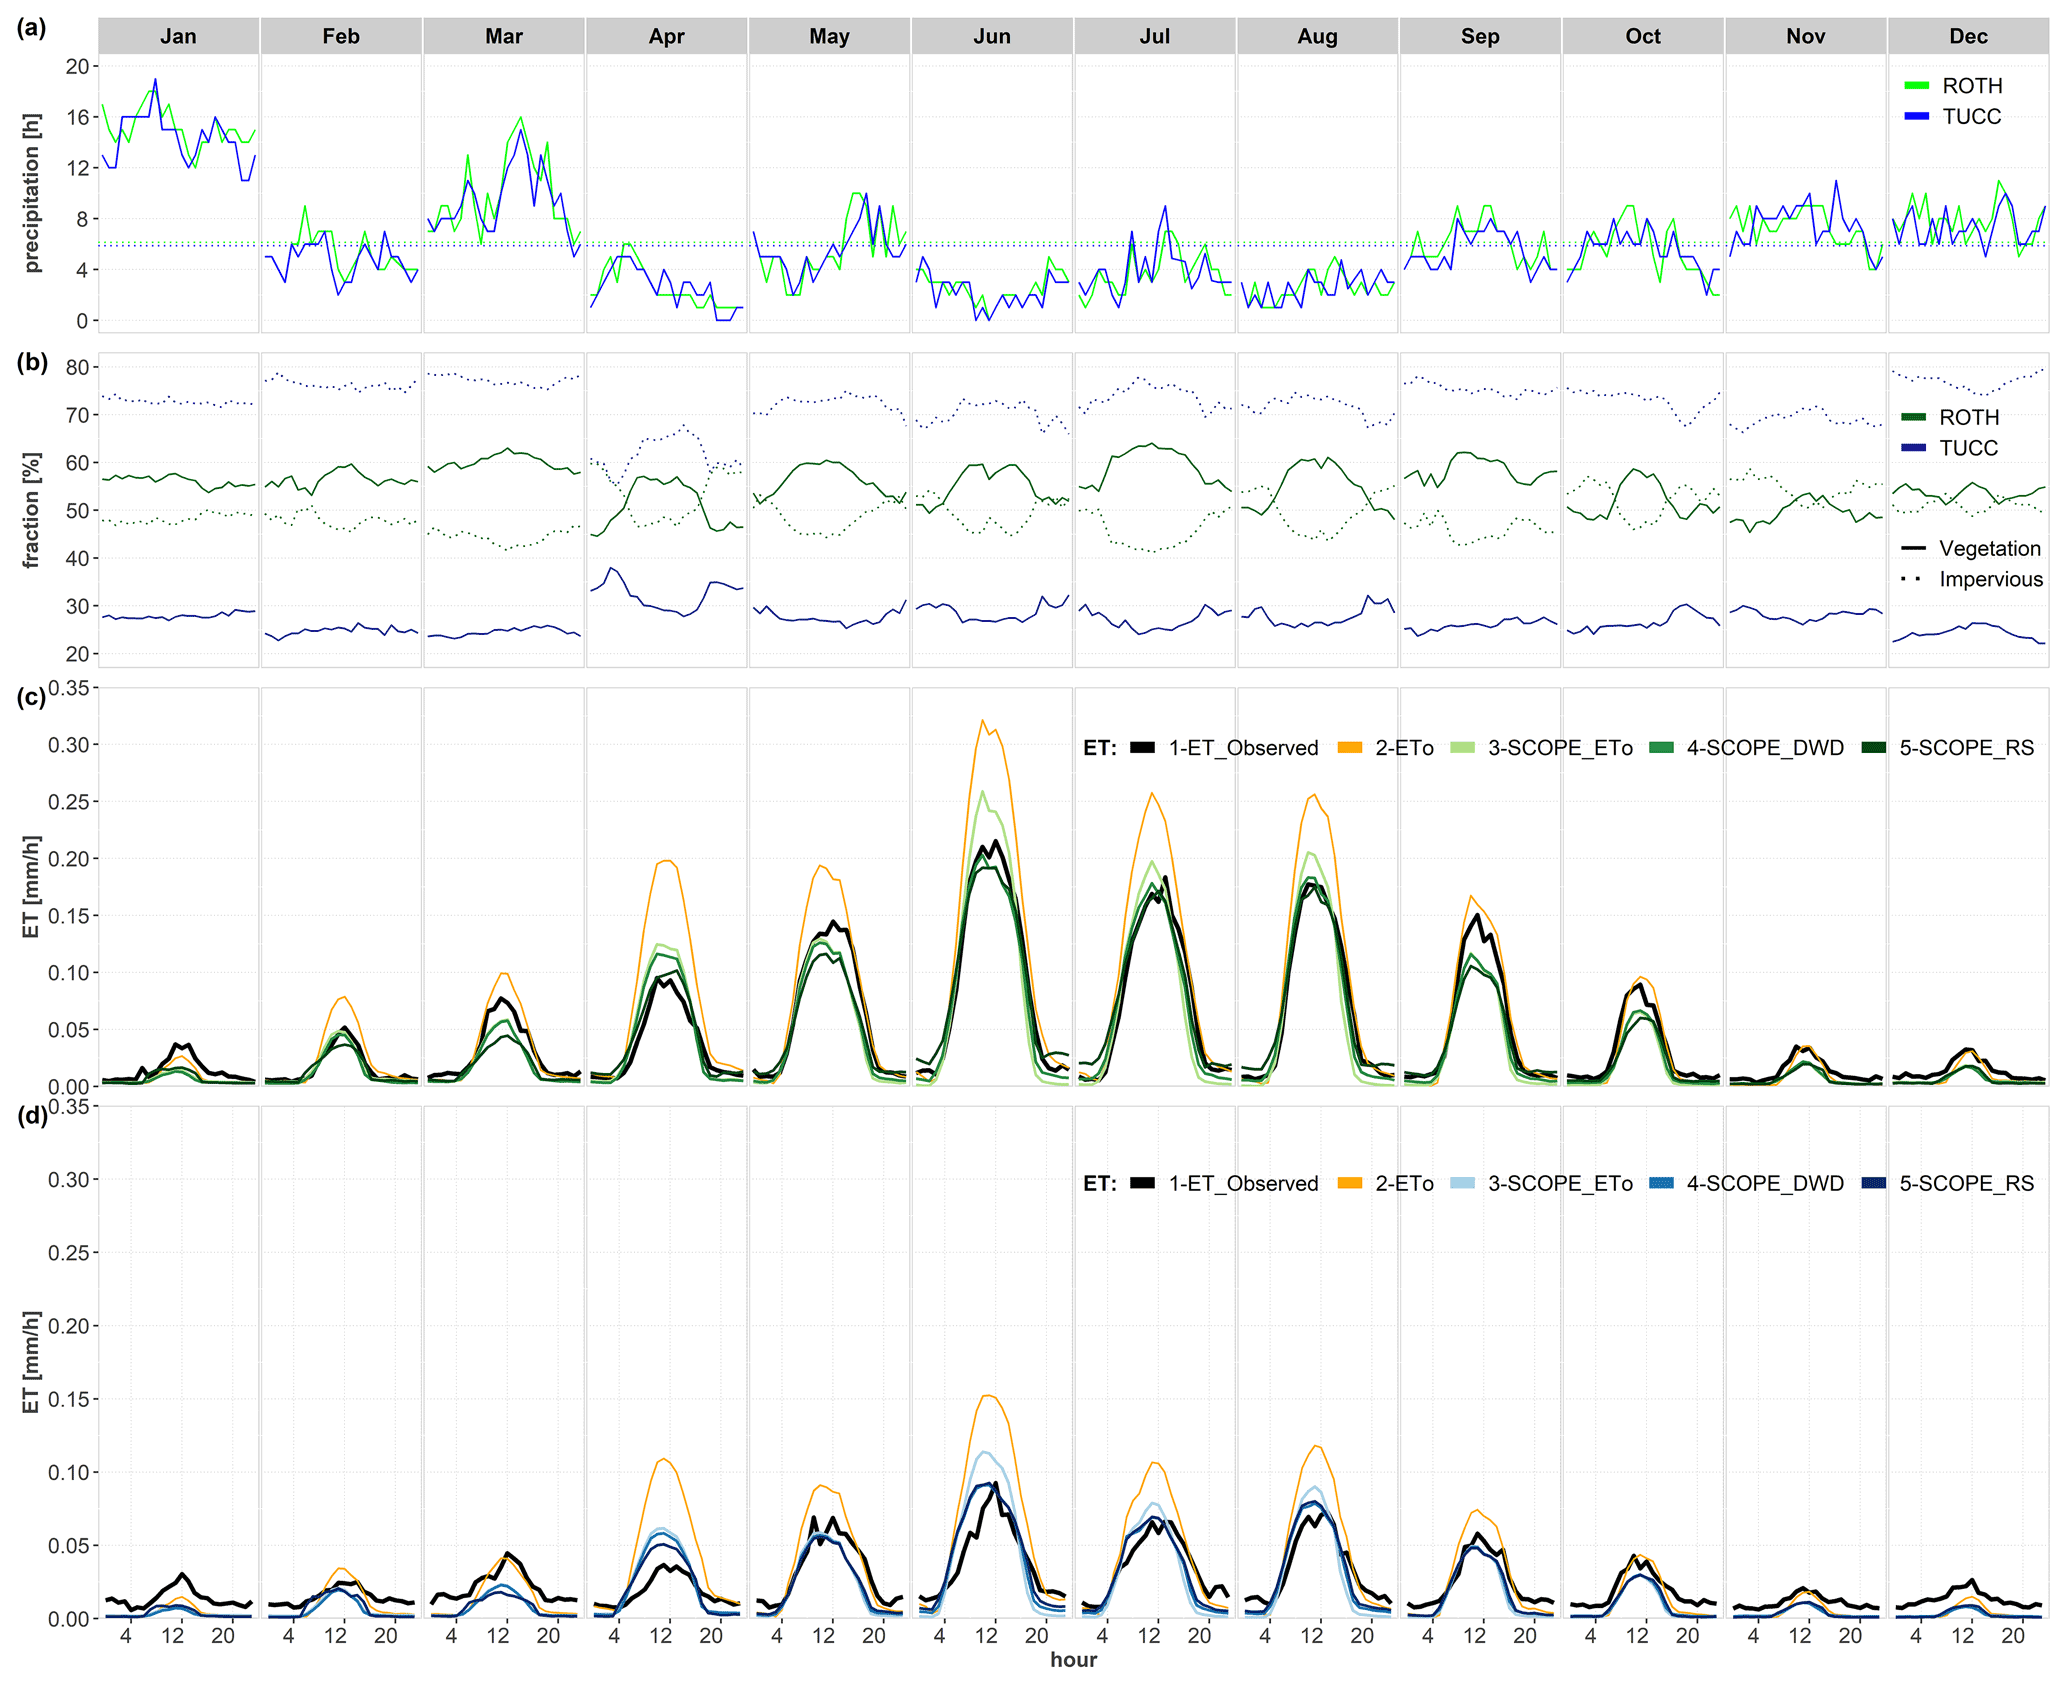
Figure 4Hourly averages per month in 2019 for: (a) precipitation events; (b) percentage of the vegetation fraction (solid line) and impervious fraction (dashed lines); (c) predictions for the ROTH site; and (d) predictions for the TUCC site. The observed ET (black line) and corrected ET0 (orange line) for both sites. The corrected SCOPE predictions are represented by green lines for ROTH and blues for the TUCC site. The light to dark colours represent SCOPE_ET0, SCOPE_DWD and SCOPE_RS, respectively, for both sites.
The proposed correction factor for urban environments reduces the prediction biases (rBias) and model errors (RMSE) significantly. The corrected ET0 prediction from Penman–Monteith, which initially presents a rBias of 1.57 and 3.83 (ROTH and TUCC), is reduced to 0.48 and 0.32, respectively (Table 3). For ROTH, while RMSE has decreased by a factor of more than 2 after the predictions were corrected, the R2 value was kept similar to the original. For TUCC, RMSE was reduced even further, but so was the R2, which was caused by a reduction in the range of values after being corrected. Despite the significant improvement using the correction factor, ET prediction based on ET0 is still biased, which agrees with other authors who have reported recurrent overestimation from Penman–Monteith models even for fully vegetated areas (Allen et al., 2005; Ortega-Farias et al., 2004).
SCOPE model outputs have similar R2 values but drastically reduce the relative bias and model error for the corrected predictions compared with ET0 predictions. The SCOPE model using the same input variables as the ET0 model is more accurate than the Penman–Monteith model. However, the model accuracy is further improved (R2 of 0.82 and RMSE of 0.026) by the inclusion of other DWD scenario input parameters such as incoming longwave radiation (Rli) and atmospheric pressure (p). The SCOPE models for the RS and DWD scenarios for ROTH present a similar accuracy but lower bias, 0.1 % (RS) versus 5 % (DWD). The reduction in bias in the RS scenario can be explained by the inclusion of LAI, which provides a more precise estimation of the vegetation structure in the early season, improving the ET predictions considerably for April. The SCOPE_RS model for TUCC presents an even smaller RMSE (0.021) but a much smaller R2 and higher bias than ROTH. The ET range partially explains these differences in R2 between the two towers, varying from 0 to 0.29 mm at ROTH and from 0 to 0.16 mm at TUCC.

Figure 5Smoothed time series of the volume (mm h−1) of precipitation (grey line) and model error (observed–predicted) for the ROTH site (a) and the TUCC site (b). Smoothing function (formula = ).
3.2 ET seasonality
ET varies greatly across the day and seasons according to changes in meteorological conditions (e.g. temperature, radiation), plant phenology (e.g. LAI, stomatal conductance) and water availability (dry and wet seasons). Figure 4c and d shows the variability in average hourly ET across the months between the two towers (black line). The differences in scale between the two sites are clear, but they present very similar behaviour across time. The predictions using corrected ET0 (orange line) overestimate ET from February to October for ROTH and from April to September for TUCC but fit well otherwise. The corrected SCOPE models exhibit the opposite behaviour, being more accurate around spring–summer and underestimating ET otherwise.
Observed ET is only higher than predicted ET0 in January and December for both sites. The periods when SCOPE models underestimate predictions correspond precisely with the months in which the number of hours of precipitation is higher than the average (Fig. 4a). April was an extremely dry month, and all models overestimated ET for both sites, as ET is limited by underground water. A second condition occurred in April, causing a significant increase in the vegetation fraction and a decrease in the impervious fraction extracted from the footprints at the TUCC site. Atmospheric conditions have led to overall greener footprints since they were atypically concentrated in a vegetated area (park), reducing the effect of the correction factor without increasing ET values. This phenomenon may occur at TUCC because the tower is located on the top of a building completely sealed with a surrounding wall (Fig. 1) and the effects of dry and wet surfaces are more noticeable there than at ROTH.
When analysing model accuracy in the time series, the error (mm h−1), as expected, is not randomly distributed around 0 across the year. The predictions, in general, are overestimated in summer and underestimated in winter. As both approaches are deterministic, there is no assumption of the independent and identical distribution residuals as in empirical models. However, temporal distribution in the residuals (autocorrelation) can help identify in which environmental conditions the precision and bias in predictions affect the overall accuracy. In our case, Fig. 5 clearly shows that model bias is strongly related to the volume of rain over the season.
The curve of the SCOPE model errors has very similar behaviour compared with the millimetres of rainfall across the year. When the volume of precipitation is over a certain threshold (around 0.5 mm h−1), the ET predictions are underestimated, while the model often overestimates ET below the threshold. The predictions based on ET0 are most overestimated during the spring and summer seasons. The year 2019 was extremely dry, Germany's third-warmest year since 1881 (German Weather Service – DWD), partially explaining the overestimated ET values, especially in the most vegetated site (ROTH, Fig. 5b).
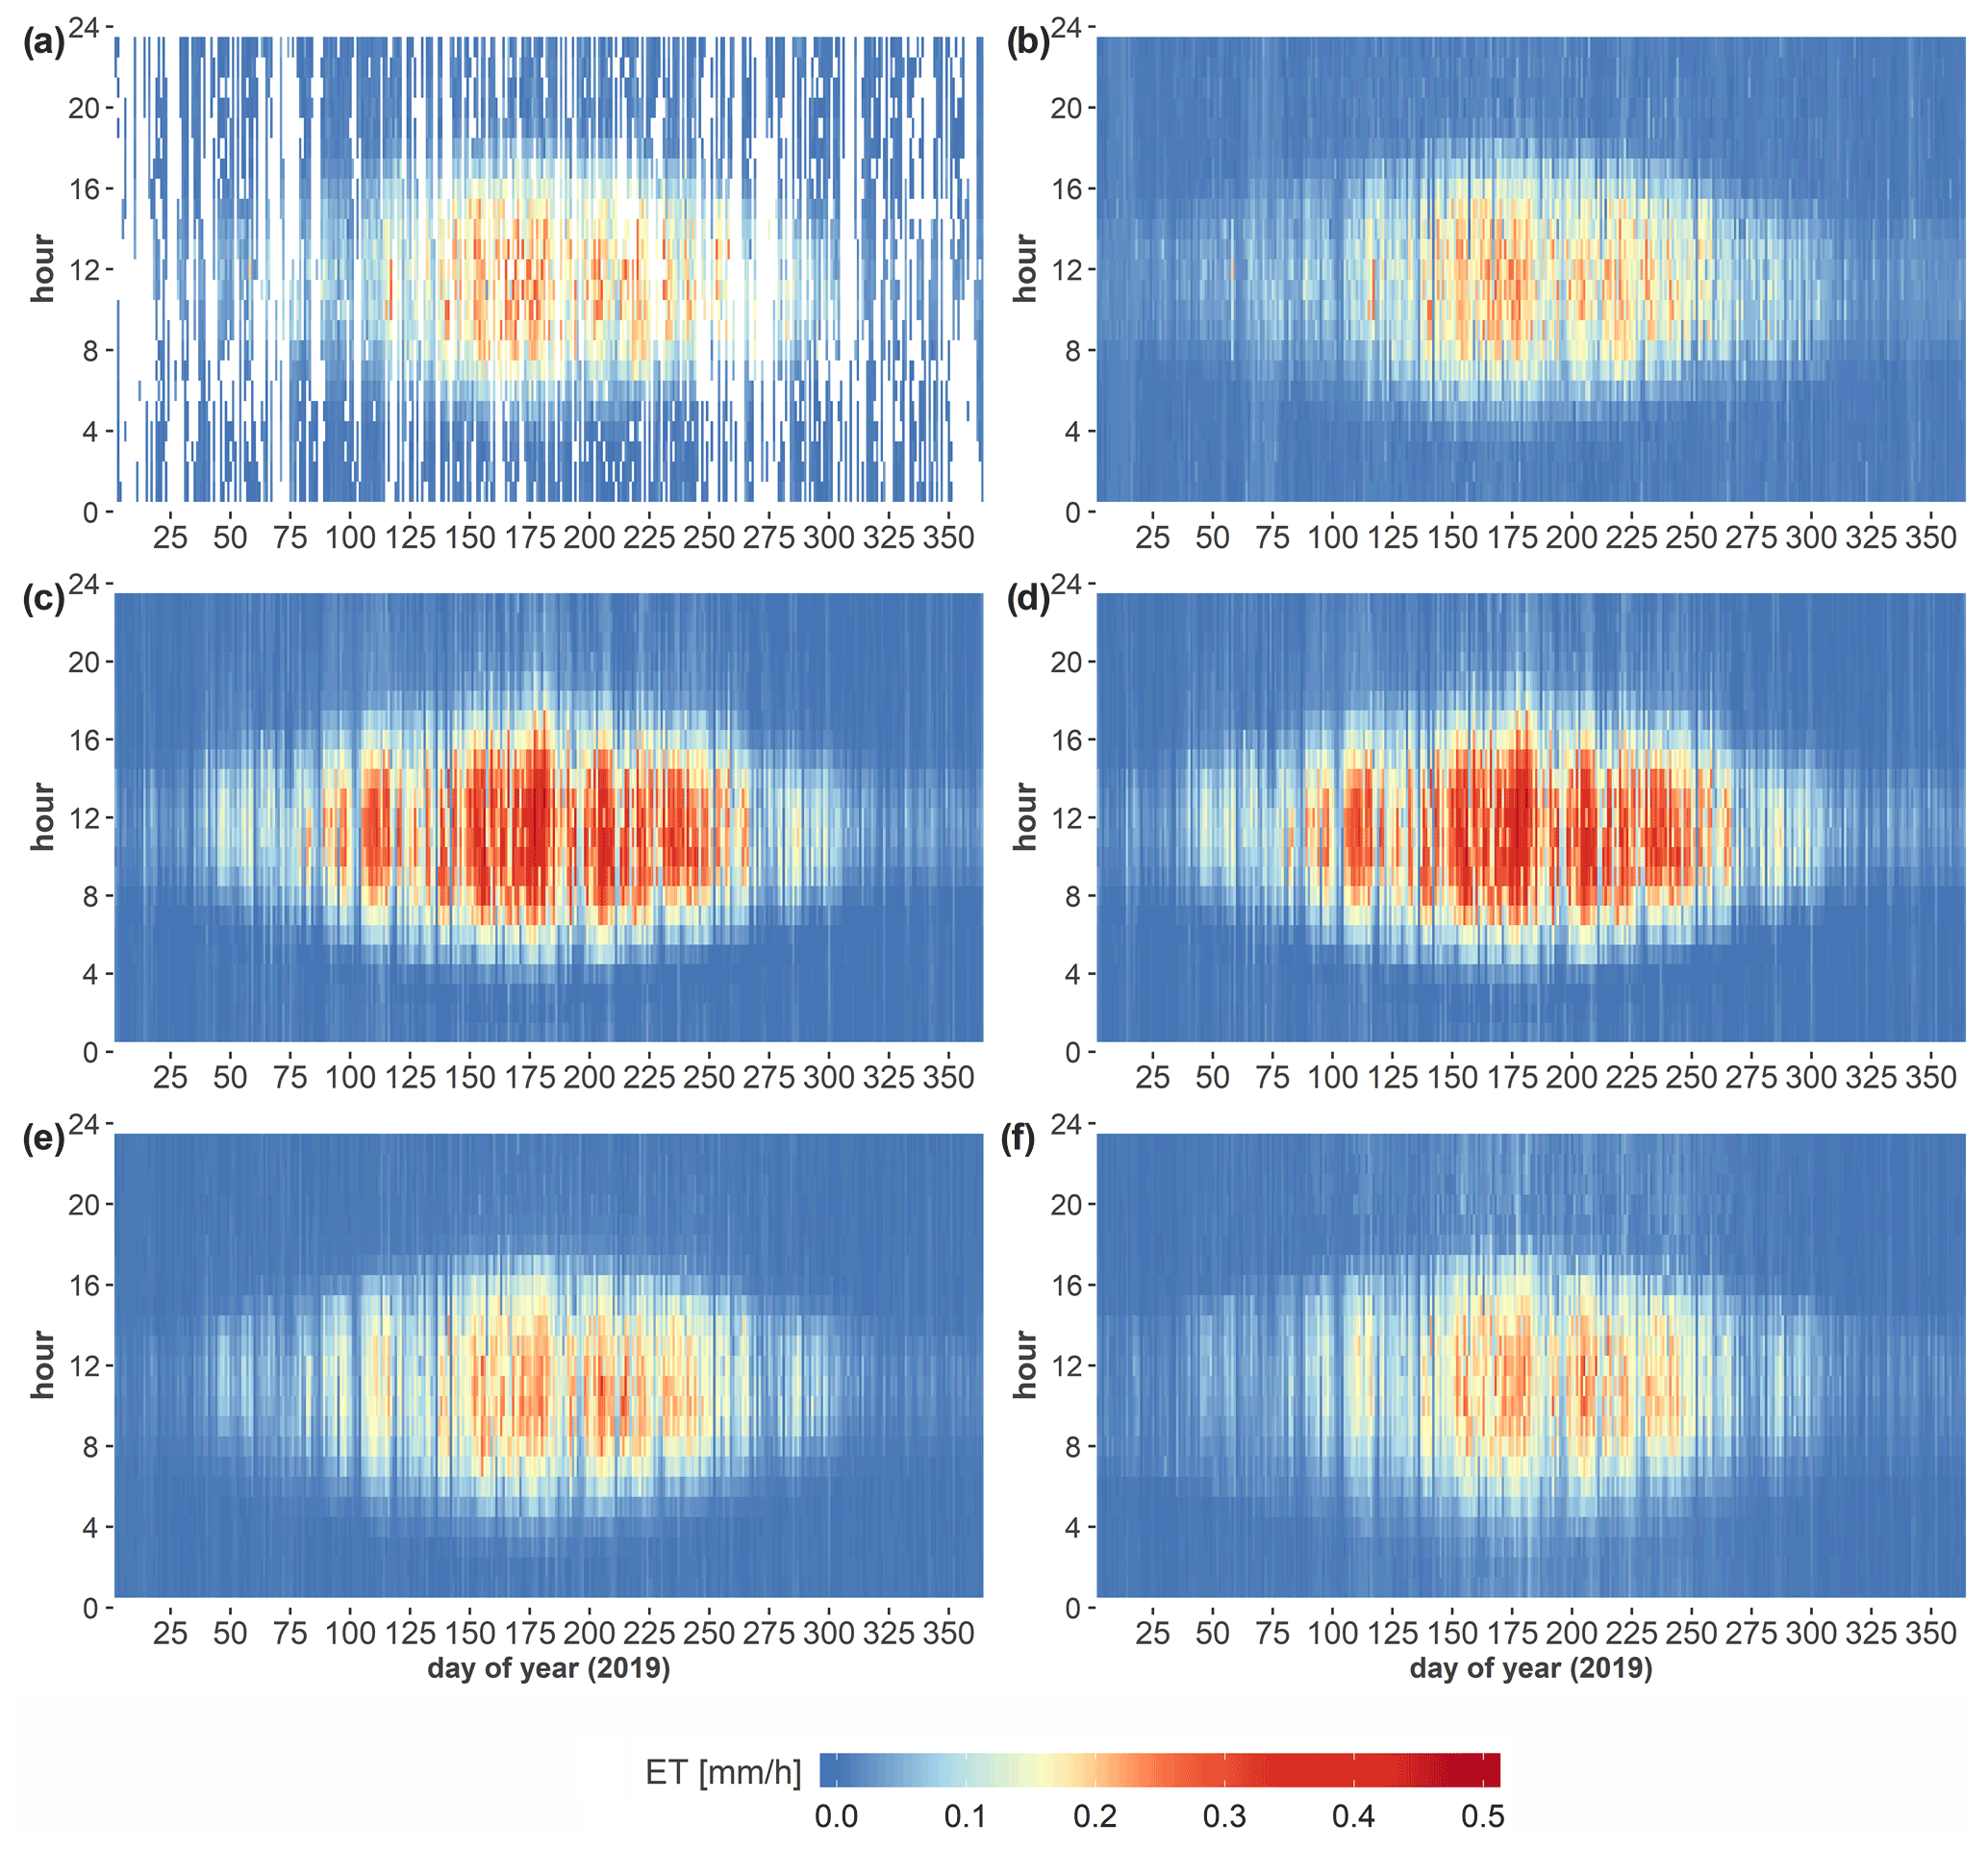
Figure 6ET by day of the year and hours of the day for the ROTH site. Observed ET after cleaning (a), observed ET gap-filled with MDS (b), Penman–Monteith ET0 (c), predicted ET with SCOPE_ET0 model (d), predicted ET with SCOPE_DWD model (e), and predicted ET with SCOPE_RS model (f). For TUCC, see Fig. A1.
3.3 Monthly and yearly ET estimations
As 42 % of the hourly ET observations were missing values, we used the MDS gap-filling method to estimate monthly or yearly observed ET values. The estimated value for the ROTH site was 336 mm yr−1, representing 66 % of the observed annual precipitation (Fig. 6). This value is similar to that of the corrected SCOPE RS model, 330 mm yr−1 or 65 % of the annual precipitation according to the nearby DWD meteorological station. The corrected ET0 annual estimate of 477 mm yr−1 (94 %) is most likely overestimated. At the TUCC site, MDS gap-filling estimates 188 mm yr−1, representing nearly half of the annual precipitation volume (47 %), which is much lower than at ROTH. The ET0 estimated at TUCC is 236 mm, representing 59 % of the annual precipitation, while the SCOPE models estimate the lowest values, ranging from 146 to 151 mm yr−1 (36 % to 38 %). The maximum volume of precipitation for ROTH (i.e. Dahlem station) was observed in June (75 mm) and the minimum in April (6 mm). The maximum value of estimated ET was 95 mm for ET0 and 67 mm for SCOPE_RS, also in June, while the minimum was 6 and 4 mm, respectively, in January. The TUCC site (i.e. Tegel station) presents a maximum volume of precipitation in March (62 mm) and the minimum also in April (7.5 mm). The ET estimate reaches the maximum of 49 and 32 mm for ET0 and SCOPE_RS models in June and a minimum of 3.2 and 2.2 mm in December, respectively.
4.1 Predicting urban ET with SCOPE
As demonstrated in this study, the approach combining a correction factor for urban environments with a SVAT model can provide accurate predictions of ET, similar to the values measured by the eddy covariance method. However, our approach offers a low-cost and less computationally intensive method to estimate ET using data from standard meteorological stations combined with freely available remote sensing data. Data from meteorological stations provide consistent measurements with nearly no missing values, while EC data often have significant gaps.
We also showed that similar atmospheric conditions would produce very distinctive ET values as the process is highly dependent on the vegetation fraction of the location under consideration. As a sum of evaporation from the soil, plant transpiration and intercepted precipitation, the volume of water released into the atmosphere by ET varies significantly according to the imperviousness. Our assumption that most terrestrial ET could be attributed to the two primary processes of soil evaporation and plant transpiration seems to be valid for the urban environment. The most vegetated urban site (ROTH) presented a high accuracy for the ET predictions and no bias after the proposed correction. Furthermore, daytime ET in the summertime is twice as high in ROTH, the highly vegetated site, as in TUCC, demonstrating the dominant contribution of transpiration to urban ET.
Classic process-based models using the Penman–Monteith equation focus mostly on the atmospheric interfaces, lacking representation of soil and vegetation properties. The crop or grassland factors suggested for the Penman–Monteith equation are often calibrated for the growing season in optimal conditions (Allen et al., 1998), which otherwise overestimate ET. However, using variables to characterise plant phenology and water availability in the soil offered in the SCOPE model allows for a comprehensive parameterisation to capture the ET variation in the vegetated areas of the city (van der Tol et al., 2009). The effect of surface heterogeneity in the horizontal direction, typical in an urban environment, is not addressed by (one-dimensional) SCOPE or Penman–Monteith-based models. However, accounting for surface–atmosphere interactions in vegetation fractions with a SCOPE model combined with high-resolution land cover to mask the impervious areas makes it possible to predict ET accurately in urban environments.
The inclusion of remote sensing data proved beneficial in modelling urban ET using SCOPE. Important plant phenology parameters such as LAI, water content and chlorophyll (Chl) can be obtained using available satellite images (Raj et al., 2020). Our study included remote sensing-derived LAI from Copernicus, reducing bias in ET predictions in the early spring. Incorporating LAI was particularly beneficial in April, as using the default constant value of LAI overestimates ET. In 2019, the air temperature started to increase in this period, but the canopy foliage was still incomplete.
The accuracy (i.e. bias) varied differently depending on the season. In general, our models underestimate ET in wintertime. Modelling SCOPE separately for each season may improve the accuracy as aerodynamic, photosynthetic, soil, and canopy constants could be better specified for these periods. Given that most of the applications to model ET are constrained to the growing season, constants and default parameters are likely to be optimised for these conditions (Ward et al., 2016). Tuning or measuring most of the input parameters to match the reality of the specific urban environment under consideration can further improve the model accuracy. SCOPE has more than 60 model inputs, allowing for greater model customisation to the local environment than presented in this study. However, the objective of this study was to demonstrate the potential of our approach for estimating hourly ET with open data rather than to provide a final model for Berlin. Thus, most of the parameters were kept constant using default model values.
4.2 Model validation
The EC system used in this study is one of the most suitable approaches for deriving observed terrestrial ET, especially in urban areas (Foltýnová et al., 2020; Nouri et al., 2013). Despite the EC method representing the closest attempt to measure ET directly, studies have reported accuracy varying from 5 % to 20 % (Foken, 2008; Liang and Wang, 2020), which may be even higher in urban environments as the lack of energy balance closure is more pronounced. The use of EC measurements to validate the model predictions present some drawbacks to EC measurements, such as: (1) the source area varies continuously in size and shape, which makes it difficult to identify the surface from which ET is released (Kljun et al., 2002; Kotthaus and Grimmond, 2014; Schmid and Oke, 1990); (2) during rain and after a certain subsequent period, EC measurements are not reliable, presenting unrealistically high values of ET (Kotthaus and Grimmond, 2014; Ward et al., 2013); and (3) it is not possible to separate evaporation into soil evaporation, plant transpiration, anthropogenic vapour emissions and intercepted precipitation (Karsisto et al., 2016; Kotthaus and Grimmond, 2012; Nordbo et al., 2012; Nouri et al., 2013).
The discrepancy between the concept of our modelled ET and the direct EC measurements makes model validation challenging. Some of the model bias could be attributed to the neglect of evaporation from interception and (dry) impervious surfaces, or to the flux tower measurements. For instance, the underestimation in the ET predictions around winter and periods with higher precipitation could be an artefact of bias in EC measurements caused by water in the instrument. Ward et al. (2013) also indicate that LE measured by the EC method presents significantly higher values than modelled LE in the following hours after rainfall. EC measurements can also be unreliable during certain conditions such as non-steady-state conditions or absence of well-developed turbulence. LE measurements from EC towers are reported as slightly underestimated due to the lack of closure in energy balance caused by low turbulence (Kracher et al., 2009).
The different evaporation processes may not exhibit similar seasonality. For instance, soil evaporation and plant transpiration are often strongly correlated as they have similar drivers. On the other hand, evaporation from interception behaves differently across seasons, and it is mainly driven by precipitation and less constrained by net radiation (Webb et al., 1980). Given the differences in temporal resolution of the model inputs and ET seasonality (daily and yearly), the validation should not only focus on the general accuracy but also assess the residuals across time and space to evaluate the impact of each parameter in the model performance as shown in Fig. 5.
Further investigation at other locations is needed to conclude on the role of footprint modelling in the overall prediction accuracy where the vegetation fraction varies strongly with wind speed and direction. Otherwise, a simple buffer estimation could be performed instead. While in the ROTH site, the correction using the vegetation fraction from footprints improves the model accuracy compared to a buffer, in the case of the TUCC site, using a buffer of 500 m presents slightly better accuracy than using footprints. This occurs since ET shows a moderate correlation (0.35 and −0.44) with the vegetation fraction and impervious fraction extracted from the footprints for the ROTH site but no significant correlation for the TUCC site. However, vegetation fractions can partially explain the difference between observed ET and reference ET (ET0) in spring and summertime, presenting a correlation of 0.44 for the TUCC site and 0.62 when both locations are analysed together. In summer at the ROTH site, the percentage of vegetation fraction increases during the day up to noon, while the impervious fraction shows the opposite behaviour (Fig. 4b), which may partially explain the better correlation. These differences in footprint size across the day are affected by alterations in atmospheric stability and wind speed, which, combined with the vegetation-impervious composition in the tower surroundings, determine the vegetation fraction in the source area.
Both predictions and observations have a certain level of bias and imprecision (random and systematic errors) that behave differently according to the environmental conditions and model calibration. Therefore, when seeking global model accuracy, one may increase the bias to fit the observed ET better in general, affecting predictions in other conditions in which the model could be closer to reality than the EC measurement. A better approach would be to calibrate the model separately for different conditions. For instance, the bias values for TUCC can be further reduced if the correction is applied only during the daytime. Also, model accuracy was significantly improved when the option to correct the parameter Vcmax by the hourly temperature was selected, showing that the seasonality of photosynthetic parameters is very important for ET estimates.
4.3 Model comparison
Our approach requires fewer and freely available model inputs, demanding less calibration and computational cost than hydrological and urban models that provide ET or LE as output. For instance, SUEWS models have many non-ordinary inputs that are difficult to supply in a high temporal and spatial resolution (Järvi et al., 2011). Several inputs are described as important in the model, including the fraction of irrigated surface area, soil fraction without rocks and maximum soil storage capacity. Rafael et al. (2020) state that the availability of measured data is a limitation for applications. UT&C models require even more complex parameters, including the distance of the wall to the tree trunk (m), the albedo and emissivity of walls, the thickness of walls and roofs, and the volumetric heat capacity of impervious surfaces, roofs and walls. These variables are possible to estimate for experimental models at a reduced scale but unreasonable to be applied in real-life cases, especially when aiming to map ET at a high spatial resolution for an entire city. While the SCOPE model includes more than 60 inputs, our study shows that calibrating no more than 10 inputs was enough to have relatively high accuracy for ET/LE predictions.
Despite our approach using a simplifying assumption and few required inputs, the prediction accuracy (precision and bias) is compatible with the state-of-the-art urban ET models while being potentially more transferable. The estimations of LE may be critical output in most urban models, often showing a low accuracy, especially in dense urban areas. Rafael et al. (2020) applied the SUEWS model in two locations in Portugal, concluding that the performance of LE predictions in suburban areas was far better than the denser urban site (correlation 0.61 and 0.13, respectively). The statement is consistent with previous studies using two areas with different levels of urbanisation, conducted in the surroundings of London (R2 0.72 and 0.25) and Helsinki (correlation 0.79 and 0.44) (Karsisto et al., 2016; Ward et al., 2016). Although the UT&C model is a very sophisticated and detailed urban model (i.e. urban canyon design), the accuracy is similar to the SUEWS models. The R2 values reported for the three locations (Singapore, Melbourne and Phoenix) range from 0.50 to 0.62 (Meili et al., 2020). However, given that the model was developed and calibrated for these sites, the accuracy may be lower when transferred to a different location or period. Our modelling approach also presents better accuracy for the suburban site ROTH (R2 0.82) than the built-up area TUCC (R2 0.47), similar to the SUEWS models. In general, the accuracy of the dense urban sites is lower than more vegetated areas, independent of the model approach. However, a specialised urban model should perform optimally in denser built-up areas since they were designed for such environments.
Our study opted to use a simplifying assumption that (dry) impervious surfaces do not evaporate, similarly to other models. Ward et al. (2016) suggest that future model development should allow some evaporation from paved and built-up surfaces other than evaporation of intercepted water. Therefore, the assumption of urban models such as SUEWS is similar to our simplification, which considers that completely impervious surfaces have no ET using the correction factor.
We also compared our approach with the hydrological water balance model (ABIMO 3.2), which models and maps evaporation from precipitation for Berlin available in the study “Surface runoff, percolation, total runoff and evaporation from precipitation” (Senate Department for Urban Planning and the Environment, 2019). This model requires approximately 25 data inputs for almost 25 000 single sections of the city (blocks, streets and other features), providing a detailed spatial resolution but only an annual temporal resolution which is not updated every year. It reports that around 60 % of Berlin's precipitation evaporates and varies from less than 3.7 mm yr−1 to more than 659 mm yr−1 according to the land surface and water systems available in the region. For the block where the two EC towers are installed, the evaporation from precipitation was reported as 344 mm yr−1 at ROTH and 196 mm yr−1 at the TUCC site. When considering the average footprint of each tower, the annual values of the Berlin Environmental Atlas decrease to 266 mm at ROTH and 165 mm at TUCC. Our approach estimated 330 and 151 mm, respectively, while the EC observations (gap-filled with MDS) were 336 and 188 mm. Our study arrives at similar annual values of ET using a much simpler approach while providing accurate ET estimates at an hourly scale that can better support actions to mitigate the UHI effect. The greater differences are observed at the TUCC site, suggesting that the intercepted precipitation on impervious surfaces may cause underestimation in this location.
4.4 Interception from precipitation
Despite the predominant role of soil evaporation and plant transpiration, interception loss is also a substantial component of urban ET. According to Ramamurthy and Bou-Zeid (2014), wet impervious surfaces evaporate at higher rates than wet vegetation as they often store more heat. They conclude that evaporation from wet impervious surfaces such as concrete pavements, asphalt and building rooftops accounted for around 18 % of the LE and may last up to 10 d, with the highest evaporation rates occurring 48 h after a precipitation event. Interception can exceed daytime transpiration rates even at night and is disproportionately high in winter (Martens et al., 2017; Miralles et al., 2020). The EC tower at the TUCC site is installed 10 m over a building with a flat roof, intensifying the interception loss even in conditions of low radiation and low air temperature. For the denser built-up site (TUCC), the lower accuracy and the relative underestimation (−0.13 of bias) in comparison with ROTH could mostly be attributed to interception loss combined with higher land surface temperature caused by anthropogenic heating (Fig. 5b). Although the ROTH site presents a considerably higher overall ET and vegetation fraction, the average night ET at TUCC is higher than at ROTH for all seasons. Based on Figs. 4 and 5, the interception loss could explain most of the model error at the TUCC site, indicating that the impervious urban canopy may intercept more precipitation and evaporate faster than the vegetated canopy.
The monthly and annual ET values may be underestimated, especially in the most built-up areas, as interception loss and precipitation are not part of the model. The model underestimation occurs mainly at night and winter, which makes us conclude that direct anthropogenic heat sources have a minor contribution to LE during the spring and summer. However, during winter, neither moisture nor the cooling effect capacity of ET is important in this part of the globe.
The intercepted precipitation on impervious surfaces plays a role in increasing the evaporation after rainfall, as demonstrated by the underestimated model prediction in the period when more frequent rain events occur (Fig. 5). However, intercepted precipitation is an independent process that should not be confused with evaporation from plants and soil for two reasons. First of all, it is difficult to assess the contribution of interception loss to measured LE, as the EC data during and just after rain are not available (missing values) or non-reliable (Wouters et al., 2015). The second reason is that despite increasing ET and affecting the EC measurements, interception loss from impervious surfaces does not mitigate UHI and droughts or make cities more sustainable. On the contrary, partially sealed or non-sealed surfaces favour percolation, recharging the groundwater and maintaining soil moisture (Gillefalk et al., 2021; Kuhlemann et al., 2021). Also, depending on the topography, the capacity to store water on impervious surfaces can vary greatly.
4.5 Applications and limitations
Applications providing accurate ET maps can range from controlling irrigation for managing green spaces in cities to planning more sustainable urban environments. Smart and green city initiatives could utilise dynamic ET maps to monitor the impact of climate change and identify solutions to improve the quality of life in cities worldwide. A better understanding and management of the water cycle (green, blue and grey) will be vital for human well-being in the near future.
The advantage of a process-based model (i.e. fully deterministic) over an empirical model is that training is not required, which increases the chances of generalising the model to other locations. Our approach can be applied to estimate ET at any location in the city or time aggregation (ranging from hourly to annually). The network of DWD stations could be used to create spatiotemporal raster layers with the primary inputs of atmospheric conditions required to model ET using the grid resolution of the land surface data. Combining high temporal resolution raster data of atmospheric conditions and land cover surface data with high spatial resolution can make it feasible to produce accurate ET maps for entire metropolitan regions.
We demonstrate that one meteorological station is enough to provide input variables to characterise the atmospheric conditions for different locations in a large city such as Berlin. For instance, the incoming solar radiation inputs (shortwave and longwave) used in this study were provided by a DWD station located in another town (Potsdam) more than 20 km from both sites. A high spatial resolution is not as crucial to represent the atmospheric conditions as a high temporal resolution (e.g. hourly). However, this approach requires adequate spatial resolution of the vegetation fraction to apply the correction for urban environments.
Limitations of our approach related to the omission of the intercepted precipitation may occur when applying the model in very wet places where rainy conditions are predominant throughout the year. The proposed approach is not able to estimate the complete water balance similar to the EC measurements, which include the interception and anthropogenic sources of evaporation. However, our approach presents higher accuracy with fewer inputs compared with well-known models for urban ET that can be applied in high spatial and temporal resolutions. The latent heat flux estimate from SCOPE can be separated into soil LE and canopy LE, which allows us to incorporate different levels of imperviousness in the correction factor to overcome our prior assumption of no evaporation from (dry) paved surfaces. Maps derived from our approach are well suited to support local governments in mitigating UHI effects during extreme summer temperatures since the neglected sources affect winter predictions more. The mapping for the entire city, the inclusion of different levels of imperviousness, a correction for intercepted precipitation, and the assessment of the model transferability in different locations will be explored in future works.
This study proposed a novel approach to estimate hourly ET in urban environments using a process-based model and freely available meteorological and remote sensing data. Therefore, this modelling approach can predict ET in an entire city in different spatial and temporal resolutions, paving the way for mapping urban ET systematically without highly specialised and costly EC tower equipment. Although the SCOPE model was successfully applied to predict ET in previous studies, this is the first time that SCOPE was applied in an urban environment. Most process-based model approaches to estimating ET, including SCOPE, are designed for homogeneous vegetated landscapes, resulting in the overestimation of ET in urban areas. However, we developed a correction factor for urban environments using the vegetation fraction derived from remote sensing data that has proved to reduce model bias and improve global accuracy. The solution combines high temporal resolution data of atmospheric conditions from meteorological stations and high spatial resolution data of land surface derived from remote sensing. We demonstrate that a single meteorological station is enough to provide model input to characterise the atmospheric conditions for different locations in a city, which increases the potential to generalise the approach to produce ET maps for other urban regions. The model performance decreases at nighttime, winter and in the presence of wet surfaces as interception loss is not considered. However, these conditions are not important for adapting to droughts and mitigating the urban heat island.
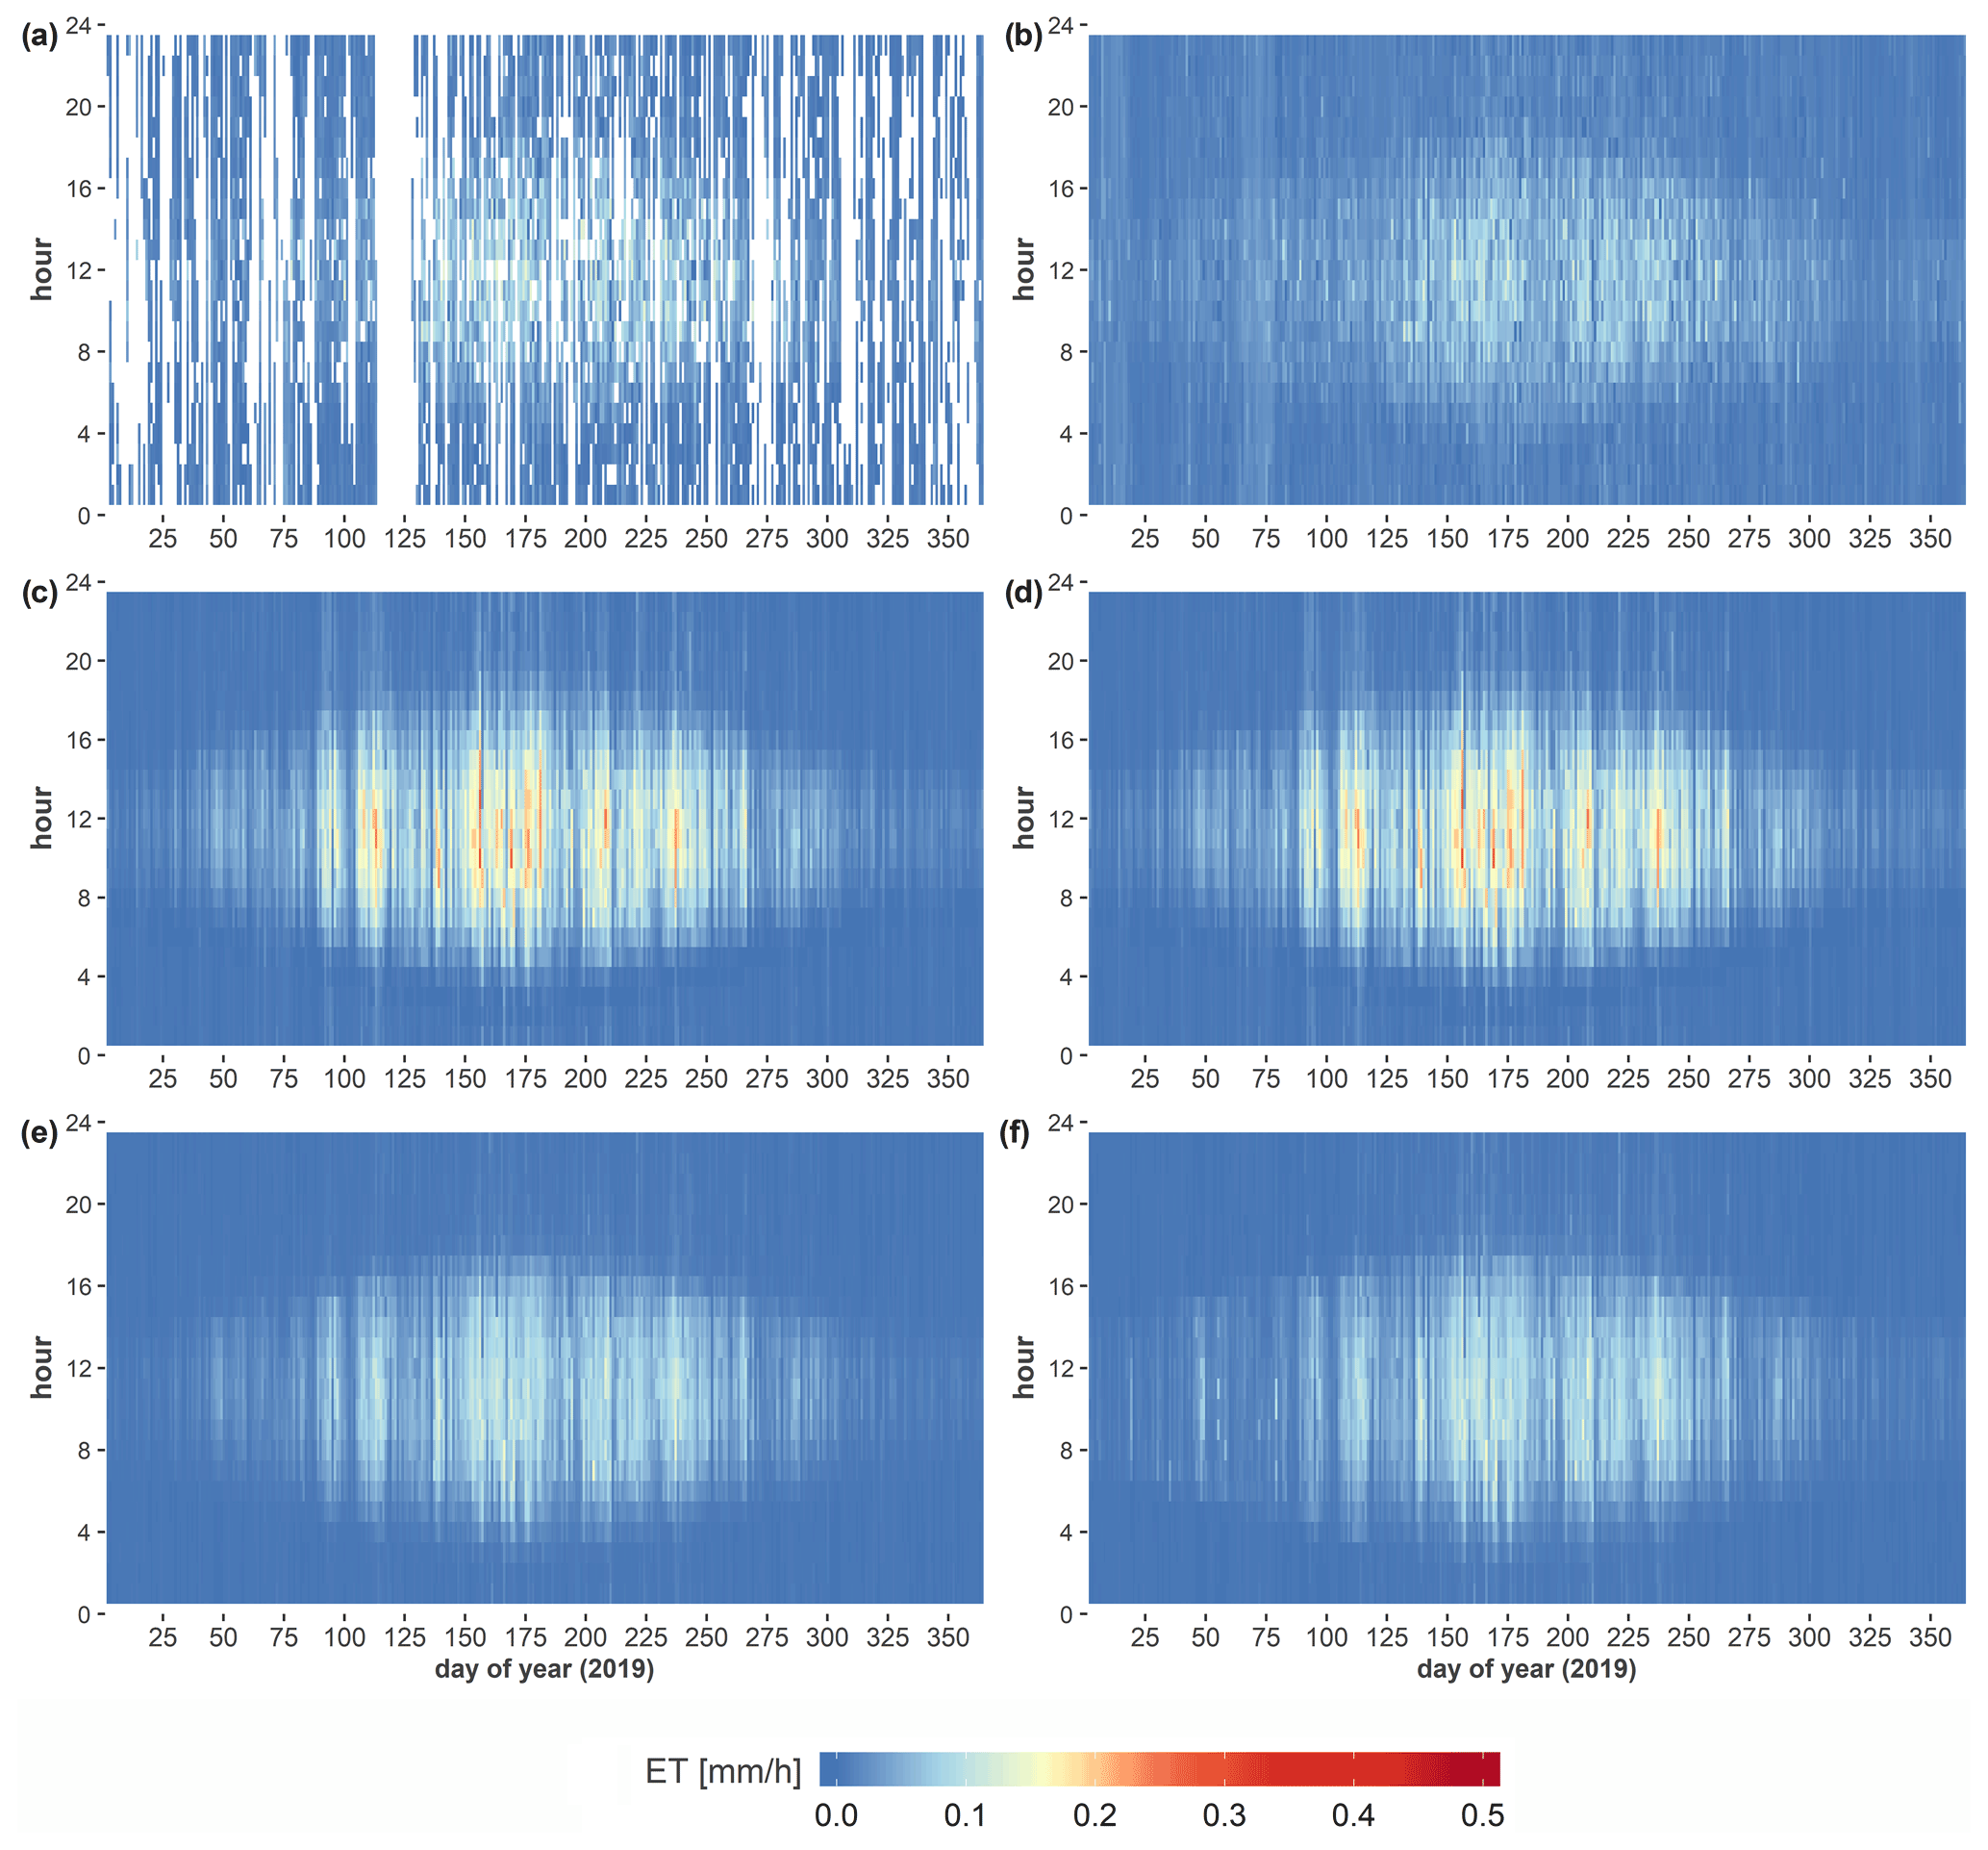
Figure A1ET by day of the year and hours of the day for the TUCC site. Observed ET after cleaning (a), observed ET gap-filled with MDS (b), Penman–Monteith ET0 (c), predicted ET with SCOPE_ET0 model (d), predicted ET with SCOPE_DWD model (e), and predicted ET with SCOPE_RS model (f).
The SCOPE documentation and codes are freely available (https://doi.org/10.5281/zenodo.4309327; van der Tol et al., 2020). The R code to download the DWD data and the Berlin Environmental Atlas maps, to extract the footprints and evaluate the model accuracy can be find at https://doi.org/10.5281/zenodo.6204580 (Duarte Rocha, 2022). The data used are available from the author upon request.
ADR and BK were responsible for the overall research goals and aims. ADR was responsible for preparing the paper draft.
SV and ADR worked on the measured data pre-processing and footprint modelling. ADR was responsible for the modelling and results and CvdT curated and specialised in the SCOPE model. MF and BK contributed to the remote sensing inputs and model evaluation. All authors contributed to discussions of the results and to the final written paper.
The contact author has declared that neither they nor their co-authors have any competing interests.
Publisher's note: Copernicus Publications remains neutral with regard to jurisdictional claims in published maps and institutional affiliations.
This work was supported by the German Research Foundation (DFG) within the Research Training Group “Urban Water Interfaces”. The authors would like to thank the DWD, the Chair of Climatology at the Technische Universität Berlin, the European Commission, and the Berlin Senate Department for Urban Development and Housing for providing data used in this paper. We would additionally like to thank Fred Meier for pre-processing and providing the eddy covariance data and Justus Quanz for providing R code to optimise footprint modelling.
This research has been supported by the Deutsche Forschungsgemeinschaft (grant no. GRK 2032-2).
This open-access publication was funded by Technische Universität Berlin.
This paper was edited by Adriaan J. (Ryan) Teuling and reviewed by two anonymous referees.
Allen, R. G., Pereira, L. S., Raes, D., and Smith, M.: Crop evapotranspiration: Guidelines for computing crop requirements, FAO Irrigation and drainage paper 56, ISBN 92-5-104219-5, https://www.fao.org/3/x0490e/x0490e00.htm (last access: 14 November 2021), 1998.
Allen, R. G., Walter, I. A., Elliott, R. L., Howell, T. A., Itenfisu, D., Jensen, M. E., and Snyder, R. L.: The ASCE Standardized Reference Evapotranspiration Equation, American Society of Civil Engineers, https://epic.awi.de/id/eprint/42362/1/ascestzdetmain2005.pdf (last access: 10 February 2021), 2005.
Bauer-Marschallinger, B. and Paulik, C.: Copernicus Global Land Operations ”Vegetation and Energy”, Validation Report (QAR), SWI1km-V1_I1.11, https://land.copernicus.eu/global/sites/cgls.vito.be/files/products/CGLOPS1_SQE2020_SWI1km_I1.00.pdf (last access: 25 May 2021), 2019.
Bayat, B., van der Tol, C., and Verhoef, W.: Integrating satellite optical and thermal infrared observations for improving daily ecosystem functioning estimations during a drought episode, Remote Sens. Environ., 209, 375–394, https://doi.org/10.1016/j.rse.2018.02.027, 2018.
Devia, G. K., Ganasri, B. P., and Dwarakish, G. S.: A Review on Hydrological Models, Aquat. Procedia, 4, 1001–1007, https://doi.org/10.1016/j.aqpro.2015.02.126, 2015.
Duarte Rocha, A.: AlbyDR/rSCOPE: rSCOPE v1.0 (Evapotranspiration), Zenodo [code], https://doi.org/10.5281/zenodo.6204580, 2022.
Dwarakish, G. S., Ganasri, B. P., and De Stefano, L.: Impact of land use change on hydrological systems: A review of current modeling approaches, Cogent Geosci., 1, 1115691, https://doi.org/10.1080/23312041.2015.1115691, 2015.
DWD: DWD Climate Data Center (CDC), http://ftp-cdc.dwd.de/climate_environment/CDC/ (last access: 15 October 2021), 2020.
Falge, E., Baldocchi, D., Olson, R., Anthoni, P., Aubinet, M., Bernhofer, C., Burba, G., Ceulemans, R., Clement, R., Dolman, H., Granier, A., Gross, P., Grünwald, T., Hollinger, D., Jensen, N. O., Katul, G., Keronen, P., Kowalski, A., Lai, C. T., Law, B. E., Meyers, T., Moncrieff, J., Moors, E., Munger, J. W., Pilegaard, K., Rannik, Ü., Rebmann, C., Suyker, A., Tenhunen, J., Tu, K., Verma, S., Vesala, T., Wilson, K., and Wofsy, S.: Gap filling strategies for defensible annual sums of net ecosystem exchange, Agr. Forest Meteorol., 107, 43–69, https://doi.org/10.1016/S0168-1923(00)00225-2, 2001.
Feigenwinter, C., Vogt, R., and Christen, A.: Eddy Covariance, Springer, 377–397, https://doi.org/10.1007/978-94-007-2351-1, 2012.
Feigenwinter, C., Vogt, R., Parlow, E., Lindberg, F., Marconcini, M., Del Frate, F., and Chrysoulakis, N.: Spatial Distribution of Sensible and Latent Heat Flux in the City of Basel (Switzerland), IEEE J. Select. Top. Appl. Earth Obs. Remote Sens., 11, 2717–2723, https://doi.org/10.1109/JSTARS.2018.2807815, 2018.
Foken, T.: The energy balance closure problem: An overview, Ecol. Appl., 18, 1351–1367, https://doi.org/10.1890/06-0922.1, 2008.
Foltýnová, L., Fischer, M., and McGloin, R. P.: Recommendations for gap-filling eddy covariance latent heat flux measurements using marginal distribution sampling, Theor. Appl. Climatol., 139, 677–688, https://doi.org/10.1007/s00704-019-02975-w, 2020.
Gillefalk, M., Tetzlaff, D., Hinkelmann, R., Kuhlemann, L., Meier, F., Maneta, M. P., and Soulsby, C.: Quantifying the effects of urban green space on water partitioning and ages using an isotope-based ecohydrological model, Hydrol. Earth Syst. Sci., 25, 3635–3652, https://doi.org/10.5194/hess-25-3635-2021, 2021.
Hörnschemeyer, B., Henrichs, M., and Uhl, M.: Swmm-urbaneva: A model for the evapotranspiration of urban vegetation, Water, 13, 243, https://doi.org/10.3390/w13020243, 2021.
Järvi, L., Grimmond, C. S. B. B., and Christen, A.: The Surface Urban Energy and Water Balance Scheme (SUEWS): Evaluation in Los Angeles and Vancouver, J. Hydrol., 411, 219–237, https://doi.org/10.1016/j.jhydrol.2011.10.001, 2011.
Karsisto, P., Fortelius, C., Demuzere, M., Grimmond, C. S. B., Oleson, K. W., Kouznetsov, R., Masson, V., and Järvi, L.: Seasonal surface urban energy balance and wintertime stability simulated using three land-surface models in the high-latitude city Helsinki, Q. J. Roy. Meteorol. Soc., 142, 401–417, https://doi.org/10.1002/qj.2659, 2016.
Kent, C. W., Grimmond, S., and Gatey, D.: Aerodynamic roughness parameters in cities: Inclusion of vegetation, J. Wind Eng. Ind. Aerodynam., 169, 168–176, https://doi.org/10.1016/j.jweia.2017.07.016, 2017.
Kljun, N., Rotach, M. W., and Schmid, H. P.: A three-dimensional backward lagrangian footprint, Bound.-Lay. Meteorol., 103, 205–226, 2002.
Kljun, N., Calanca, P., Rotach, M. W., and Schmid, H. P.: A simple two-dimensional parameterisation for Flux Footprint Prediction (FFP), Geosci. Model Dev., 8, 3695–3713, https://doi.org/10.5194/gmd-8-3695-2015, 2015.
Knauer, J., El-Madany, T. S., Zaehle, S., and Migliavacca, M.: Bigleaf – An R package for the calculation of physical and physiological ecosystem properties from eddy covariance data, PLoS One, 13, e0201114, https://doi.org/10.1371/journal.pone.0201114, 2018.
Kormann, R. and Meixner, F. X.: An analytical footprint model for non-neutral stratification, Bound.-Lay. Meteorol., 99, 207–224, https://doi.org/10.1023/A:1018991015119, 2001.
Kotthaus, S. and Grimmond, C. S. B.: Identification of Micro-scale Anthropogenic CO2, heat and moisture sources – Processing eddy covariance fluxes for a dense urban environment, Atmos. Environ., 57, 301–316, https://doi.org/10.1016/j.atmosenv.2012.04.024, 2012.
Kotthaus, S. and Grimmond, C. S. B.: Energy exchange in a dense urban environment – Part II: Impact of spatial heterogeneity of the surface, Urban Clim., 10, 281–307, https://doi.org/10.1016/j.uclim.2013.10.001, 2014.
Kovats, R. S. and Hajat, S.: Heat stress and public health: A critical review, Annu. Rev. Publ. Health, 29, 41–55, https://doi.org/10.1146/annurev.publhealth.29.020907.090843, 2008.
Kracher, D., Mengelkamp, H. T., and Foken, T.: The residual of the energy balance closure and its influence on the results of three SVAT models, Meteorol. Z., 18, 647–661, https://doi.org/10.1127/0941-2948/2009/0412, 2009.
Kuhlemann, L.-M., Tetzlaff, D., Smith, A., Kleinschmit, B., and Soulsby, C.: Using soil water isotopes to infer the influence of contrasting urban green space on ecohydrological partitioning, Hydrol. Earth Syst. Sci., 25, 927–943, https://doi.org/10.5194/hess-25-927-2021, 2021.
Liang, S. and Wang, J. (Eds.): Chapter 17 – Terrestrial evapotranspiration, in: Advanced Remote Sensing, 2nd Edn., Academic Press, 649–684, ISBN 9780128158265, 2020.
Maronga, B., Gryschka, M., Heinze, R., Hoffmann, F., Kanani-Sühring, F., Keck, M., Ketelsen, K., Letzel, M. O., Sühring, M., and Raasch, S.: The Parallelized Large-Eddy Simulation Model (PALM) version 4.0 for atmospheric and oceanic flows: Model formulation, recent developments, and future perspectives, Geosci. Model Dev., 8, 2515–2551, https://doi.org/10.5194/gmd-8-2515-2015, 2015.
Martens, B., Miralles, D. G., Lievens, H., Van Der Schalie, R., De Jeu, R. A. M., Fernández-Prieto, D., Beck, H. E., Dorigo, W. A., and Verhoest, N. E. C.: GLEAM v3: Satellite-based land evaporation and root-zone soil moisture, Geosci. Model Dev., 10, 1903–1925, https://doi.org/10.5194/gmd-10-1903-2017, 2017.
Meili, N., Manoli, G., Burlando, P., Bou-Zeid, E., Chow, W. T. L., Coutts, A. M., Daly, E., Nice, K. A., Roth, M., Tapper, N. J., Velasco, E., Vivoni, E. R., and Fatichi, S.: An urban ecohydrological model to quantify the effect of vegetation on urban climate and hydrology (UT&C v1.0), Geosci. Model Dev., 13, 335–362, https://doi.org/10.5194/gmd-13-335-2020, 2020.
Miralles, D. G., Brutsaert, W., Dolman, A. J., and Gash, J. H.: On the Use of the Term “Evapotranspiration”, Water Resour. Res., 56, e2020WR028055, https://doi.org/10.1029/2020WR028055, 2020.
Moncrieff, J. B., Massheder, J. M., De Bruin, H., Elbers, J., Friborg, T., Heusinkveld, B., Kabat, P., Scott, S., Soegaard, H., and Verhoef, A.: A system to measure surface fluxes of momentum, sensible heat, water vapour and carbon dioxide, J. Hydrol., 188–189, 589–611, https://doi.org/10.1016/S0022-1694(96)03194-0, 1997.
Nordbo, A., Järvi, L., and Vesala, T.: Revised eddy covariance flux calculation methodologies – effect on urban energy balance, Tellus B, 64, 18184, https://doi.org/10.3402/tellusb.v64i0.18184, 2012.
Nouri, H., Beecham, S., Kazemi, F., and Hassanli, A. M.: A review of ET measurement techniques for estimating the water requirements of urban landscape vegetation, Urban Water J., 10, 247–259, https://doi.org/10.1080/1573062X.2012.726360, 2013.
Nouri, H., Beecham, S., Anderson, S., Hassanli, A. M., and Kazemi, F.: Remote sensing techniques for predicting evapotranspiration from mixed vegetated surfaces, Urban Water J., 12, 380–393, https://doi.org/10.1080/1573062X.2014.900092, 2015.
Nouri, H., Borujeni, S. C., and Hoekstra, A. Y.: The blue water footprint of urban green spaces: An example for Adelaide, Australia, Landsc. Urban Plan., 190, 103613, https://doi.org/10.1016/j.landurbplan.2019.103613, 2019.
Olmedo, G. F., Ortega-Farías, S., de la Fuente-Sáiz, D., Fonseca-Luengo, D., and Fuentes-Peñailillo, F.: water: Tools and Functions to Estimate Actual Evapotranspiration Using Land Surface Energy Balance Models in R, R J., 8, 352–370, https://doi.org/10.32614/rj-2016-051, 2016.
Ortega-Farias, S., Olioso, A., Antonioletti, R., and Brisson, N.: Evaluation of the Penman-Monteith model for estimating soybean evapotranspiration, Irrig. Sci., 23, 1–9, https://doi.org/10.1007/s00271-003-0087-1, 2004.
Petropoulos, G., Carlson, T. N., and Wooster, M. J.: An overview of the use of the SimSphere Soil Vegetation Atmosphere Transfer (SVAT) model for the study of land-atmosphere interactions, Sensors, 9, 4286–4308, https://doi.org/10.3390/s90604286, 2009.
Quanz, J. A.: Impact of spatial heterogeneity on energy exchange in an urban environment in Berlin, MS thesis, Institute of Ecology Chair of Climatology, Technische Universität Berlin, Berlin, Germany, 93 pp., 2018.
Rafael, S., Rodrigues, V., Fernandes, A. P., Augusto, B., Borrego, C., and Lopes, M.: Evaluation of urban surface parameterizations in WRF model using energy fluxes measurements in Portugal, Urban Clim., 28, 100465, https://doi.org/10.1016/j.uclim.2019.100465, 2019.
Rafael, S., Martins, H., Matos, M. J., Cerqueira, M., Pio, C., Lopes, M., and Borrego, C.: Application of SUEWS model forced with WRF: Energy fluxes validation in urban and suburban Portuguese areas, Urban Clim., 33, 100662, https://doi.org/10.1016/j.uclim.2020.100662, 2020.
Raj, R., Bayat, B., Lukeš, P., Šigut, L., and Homolová, L.: Analyzing Daily Estimation of Forest Gross Primary Production Based on Harmonized Landsat-8 and Sentinel-2 Product Using SCOPE Process-Based Model, Remote Sens., 12, 3773, https://doi.org/10.3390/rs12223773, 2020.
Ramamurthy, P. and Bou-Zeid, E.: Contribution of impervious surfaces to urban evaporation, Water Resour. Res., 50, 2889–2902, https://doi.org/10.1002/2013WR013909, 2014.
R Core Team: R: A Language and Environment for Statistical Computing, https://www.r-project.org/ (last access: 5 January 2022), 2020.
Rocha, A. D., Groen, T. A., Skidmore, A. K., Darvishzadeh, R., and Willemen, L.: Machine learning using hyperspectral data inaccurately predicts plant traits under spatial dependency, Remote Sens., 10, 1263, https://doi.org/10.3390/rs10081263, 2018.
Rocha, A. D., Groen, T. A., Skidmore, A. K., and Willemen, L.: Role of Sampling Design When Predicting Spatially Dependent Ecological Data With Remote Sensing, IEEE T. Geosci. Remote, 59, 663–674, https://doi.org/10.1109/TGRS.2020.2989216, 2020.
Scherer, D., Fehrenbach, U., Lakes, T., Lauf, S., Meier, F., and Schuster, C.: Quantification of heat-Stress related mortality hazard, vulnerability and risk in Berlin, Germany, Erde, 144, 238–259, https://doi.org/10.12854/erde-144-17, 2013.
Scherer, D., Ament, F., Emeis, S., Fehrenbach, U., Leitl, B., Scherber, K., Schneider, C., and Vogt, U.: Three-dimensional observation of atmospheric processes in cities, Meteorol. Z., 28, 121–138, https://doi.org/10.1127/metz/2019/0911, 2019.
Schmid, H. P. and Oke, T. R.: A model to estimate the source area contributing to turbulent exchange in the surface layer over patchy terrain, Q. J. Roy. Meteorol. Soc., 116, 965–988, https://doi.org/10.1002/qj.49711649409, 1990.
Senate Department for Urban Development and Housing: Berlin Environmental Atlas, Long-term Development of Selected Climate Parameters, Edition 2015, https://www.berlin.de/umweltatlas/_assets/klima/klimaparameter/langjaehrig/en-texte/ek413.pdf (last access: 21 December 2020), 2015.
Senate Department for Urban Development and Housing: Berlin Environmental Atlas, Green Volume, Edition 2017, https://www.berlin.de/umweltatlas/_assets/biotope/gruenvolumen/en-texte/ek509.pdf (last access: 8 December 2020), 2017.
Senate Department for Urban Planning and the Environment: Berlin Environmental Atlas, Building and Vegetation Heights, 2014 Edition, https://www.berlin.de/umweltatlas/_assets/nutzung/gebaeude-und-vegetationshoehen/en-texte/ek610.pdf (last access: 6 January 2021), 2014.
Senate Department for Urban Planning and the Environment: Berlin Environmental Atlas, Surface Runoff, Percolation, Total Runoff and Evaporation from Precipitation, 2019 Edition, https://www.berlin.de/umweltatlas/_assets/wasser/wasserhaushalt/en-texte/ekd213.docx (last access: 4 December 2020), 2019.
Timmermans, J., Su, Z., van der Tol, C., Verhoef, A., and Verhoef, W.: Quantifying the uncertainty in estimates of surface-atmosphere fluxes through joint evaluation of the SEBS and SCOPE models, Hydrol. Earth Syst. Sci., 17, 1561–1573, https://doi.org/10.5194/hess-17-1561-2013, 2013.
van der Tol, C. and Norberto, G.: Guidelines for Remote Sensing of Evapotranspiration, Evapotranspiration – Remote Sens. Model., https://doi.org/10.5772/18582, 2012.
van der Tol, C., Verhoef, W., Timmermans, J., Verhoef, A., and Su, Z.: An integrated model of soil-canopy spectral radiances, photosynthesis, fluorescence, temperature and energy balance, Biogeosciences, 6, 3109–3129, https://doi.org/10.5194/bg-6-3109-2009, 2009.
van der Tol, C., Prikaziuk, and akornfeld: Christiaanvandertol/SCOPE: SCOPEv2.0 (v2.0), Zenodo [code], https://doi.org/10.5281/zenodo.4309327, 2020.
Vickers, D. and Mahrt, L.: Quality control and flux sampling problems for tower and aircraft data, J. Atmos. Ocean Tech., 14, 512–526, https://doi.org/10.1175/1520-0426(1997)014<0512:QCAFSP>2.0.CO;2, 1997.
Vitale, D., Fratini, G., Bilancia, M., Nicolini, G., Sabbatini, S., and Papale, D.: A robust data cleaning procedure for eddy covariance flux measurements, Biogeosciences, 17, 1367–1391, https://doi.org/10.5194/bg-17-1367-2020, 2020.
Vulova, S., Meier, F., Duarte, A., Quanz, J., Nouri, H., and Kleinschmit, B.: Science of the Total Environment Modeling urban evapotranspiration using remote sensing, flux footprints, and artificial intelligence, Sci. Total Environ., 786, 147293, https://doi.org/10.1016/j.scitotenv.2021.147293, 2021.
Wang, Y., Zhang, Y., Ding, N., Qin, K., and Yang, X.: Simulating the impact of urban surface evapotranspiration on the urban heat island effect using the modified RS-PM model: A case study of Xuzhou, China, Remote Sens., 12, 578, https://doi.org/10.3390/rs12030578, 2020.
Ward, H. C. and Grimmond, C. S. B.: Assessing the impact of changes in surface cover, human behaviour and climate on energy partitioning across Greater London, Landsc. Urban Plan., 165, 142–161, https://doi.org/10.1016/j.landurbplan.2017.04.001, 2017.
Ward, H. C., Evans, J. G., and Grimmond, C. S. B. B.: Multi-season eddy covariance observations of energy, water and carbon fluxes over a suburban area in Swindon, UK, Atmos. Chem. Phys., 13, 4645–4666, https://doi.org/10.5194/acp-13-4645-2013, 2013.
Ward, H. C., Kotthaus, S., Järvi, L., and Grimmond, C. S. B. B.: Surface Urban Energy and Water Balance Scheme (SUEWS): Development and evaluation at two UK sites, Urban Clim., 18, 1–32, https://doi.org/10.1016/j.uclim.2016.05.001, 2016.
Webb, E. K., Pearman, G. I., and Leuning, R.: Correction of flux measurements for density effects due to heat and water vapour transfer, Q. J. Roy. Meteorol. Soc., 106, 85–100, https://doi.org/10.1002/qj.49710644707, 1980.
Westerhoff, R. S.: Using uncertainty of Penman and Penman-Monteith methods in combined satellite and ground-based evapotranspiration estimates, Remote Sens. Environ., 169, 102–112, https://doi.org/10.1016/j.rse.2015.07.021, 2015.
Wickham, H.: ggplot2: Elegant Graphics for Data Analysis, Springer-Verlag, New York, ISBN 978-3-319-24277-4, 2016.
Wouters, H., Demuzere, M., De Ridder, K., and Van Lipzig, N. P. M.: The impact of impervious water-storage parametrization on urban climate modelling, Urban Clim., 11, 24–50, https://doi.org/10.1016/j.uclim.2014.11.005, 2015.
Wutzler, T., Lucas-Moffat, A., Migliavacca, M., Knauer, J., Sickel, K., Šigut, L., Menzer, O., and Reichstein, M.: Basic and extensible post-processing of eddy covariance flux data with REddyProc, Biogeosciences, 15, 5015–5030, https://doi.org/10.5194/bg-15-5015-2018, 2018.
Xenakis, G.: FREddyPro: Post-Processing EddyPro Full Output File (R package version 1.0), https://cran.r-project.org/package=FREddyPro (last access: 29 July 2020), 2016.
Yang, P., Prikaziuk, E., Verhoef, W., and van der Tol, C.: SCOPE 2.0: a model to simulate vegetated land surface fluxes and satellite signals, Geosci. Model Dev., 14, 4697–4712, https://doi.org/10.5194/gmd-14-4697-2021, 2021.
Zhao, L., Xia, J., Xu, C. yu, Wang, Z., Sobkowiak, L., and Long, C.: Evapotranspiration estimation methods in hydrological models, J. Geogr. Sci., 23, 359–369, https://doi.org/10.1007/s11442-013-1015-9, 2013.
Zheng, Q., Hao, L., Huang, X., Sun, L., and Sun, G.: Effects of urbanization on watershed evapotranspiration and its components in southern China, Water, 12, 645, https://doi.org/10.3390/w12030645, 2020.