the Creative Commons Attribution 4.0 License.
the Creative Commons Attribution 4.0 License.
 | 22 Feb 2022
Spatial distribution of groundwater recharge, based on regionalised soil moisture models in Wadi Natuf karst aquifers, Palestine
Clemens Messerschmid
Amjad Aliewi
While groundwater recharge is considered fundamental to hydrogeological insights and basin management and studies on its temporal variability are in great number, much less attention has been paid to its spatial distribution, by comparison. And in ungauged catchments it has rarely been quantified, especially on the catchment scale.
For the first time, this study attempts such analysis, in a previously ungauged basin. Our work is based on the results of field data (as published in Messerschmid et al., 2020) of several soil moisture stations, which represent five geological formations of karst rock in Wadi Natuf, a semi-arid to sub-humid Mediterranean catchment in the occupied Palestinian West Bank. For that purpose, recharge was conceptualised as deep percolation from soil moisture under saturation excess conditions, which had been modelled parsimoniously and separately with different formation-specific recharge rates.
For the regionalisation, inductive methods of empirical field measurements and observations were combined with deductive approaches of extrapolation, based on a new basin classification framework (BCF) for Wadi Natuf, thus following the recommendations for hydrological Prediction in Ungauged Basins (PUB), by the International Association of Hydrological Sciences (IAHS). Our results show an average annual recharge estimation in Wadi Natuf catchment (103 km2), ranging from 235 to 274 mm (24 to 28×106 m3) per year, equivalent to recharge coefficients (RCs) of 39 %–46 % of average annual precipitation (over a 7-year observation period but representative of long-term conditions as well).
Formation-specific RC values, derived from empirical parsimonious soil moisture models, were regionalised and their spatial distribution was assessed and quantified on the catchment scale. Thus, for the first time, a fully distributed recharge model in a hitherto entirely ungauged (and karstic) aquifer basin was created that drew on empirical methods and direct approaches. This was done by a novel combination of existing methods and by creating a unified conceptual basin classification framework for different sets of physical basin features. This new regionalisation method is also applicable in many comparable sedimentary basins in the Mediterranean and worldwide.
- Article
(3296 KB) - Full-text XML
- Companion paper
- BibTeX
- EndNote


The assessment of distributed groundwater recharge is considered a challenge already in basins with scarce data, even more so its spatial distribution and the regionalisation of point measurements and plot-scale experiments, since the governing processes of recharge and its spatial distribution often remain poorly understood (Hartmann et al., 2012a), even in well-developed basins. The nature of karstic aquifers, characterised by their diverse and complicated inhomogeneous and anisotropic flow fields, poses an additional complication (Schmidt et al., 2014; Geyer et al., 2008). Yet, regionalised information on spatially distributed recharge is highly important, not only for the correct budgeting of inflows on different scales, but also for the overriding and growing demands in resource protection and sustainable management, as well as the equitable allocation of groundwater among different basin riparians.
1.1 Spatial variability in ungauged basins and physical landscape characteristics
In order to investigate spatial variability, two shifts in general approaches can be observed, on the one hand a shift from so-called indirect to direct approaches, which try to observe, determine and quantify near-surface processes (Dörhöfer and Jesopait, 1997; Lerner et al., 1990), as discussed in Messerschmid et al. (2020). This is particularly the case in areas where the observation of deep underground surfaces is limited or severely restricted, as in Wadi Natuf, where the Israeli occupation prohibits any well development (World Bank, 2009). And on the other hand, many authors of the Prediction in Ungauged Basins (PUB) literature recommended a shift away from lumped and integrated models (such as Richts et al., 2011 or MacDonald et al., 2021), which may be problematic in ungauged basins, especially where lateral flow connections to other basins exist. Instead, distributed models are recommended that differentiate hydrological processes, such as soil saturation, runoff or recharge, together with their drivers, for example, precipitation and evapotranspiration (Batelaan and De Smedt, 2001, 2007; Hrachowitz et al., 2013; Sivakumar et al., 2013).
To constrain parameters and to ensure that hydrological models faithfully and realistically represent the dominant processes, highly location-specific, empirical work should be combined with conceptual efforts, such as the correct differentiation of different groups of landscape features that rule the recharge process (Franchini and Pacciani, 1991).
The processes that enable and limit recharge, besides precipitation, encompass evapotranspiration, runoff, soil infiltration and deep percolation. Direct evaporation from the surface largely depends on the balance of soil moisture (SM) storage (see Messerschmid et al., 2020), whereas transpiration reflects the type of vegetation (type and density of plant cover). Surface runoff is a function of landscape characteristics (slope, vegetation and land use, etc.), and in addition, infiltration excess runoff is directly linked to the soil moisture storage as well as the permeability of the underlying rock. Soil infiltration can depend on soil types and other factors, such as vegetation. Finally, percolation into the rock formation is closely linked to the mineralogical content of the rock, its permeability and its conductivity (here combined as geology). In other words, most processes are ruled by three sets of physical catchment characteristics: geology (1), soil (2) and land forms or features of land use and land cover (LU/LC) (3).
According to Hrachowitz et al. (2013), most studies select parameter sets from these three principal groups of physical characteristics or their combination and interaction. Sanz et al. (2011) used geology and lithology (first group). Batelaan and De Smedt (2001, 2007) and Aish et al. (2010) used soil characteristics (second group) and combined them with land use, topography, water level data and lithology. Aish et al. (2010) and Zomlot et al. (2015) used landscape features, including topography, vegetation and land use (third group), which can be combined to the above land use and land cover characteristics (LU/LC). Finally, some authors use a selection of many parameters, based, however, not on field observations but on conceptual assumptions (Radulovič et al., 2011) in order to assign them with weights as variables in a basin-wide transfer function between spatial characteristics and hydrological response or in order to estimate the relative importance of different “conditioning factors” (Jaafarzadeh et al., 2021).
The linkage between physical characteristics and hydrological processes, between catchment form and function (Hrachowitz et al., 2013), can be done by so-called catchment classification and similarity frameworks, based on field observations and on similarities of hydrological function (McDonnell and Woods, 2004; Berne et al., 2005). This is best done on the catchment scale, at which the entire complexity of distributed recharge processes and their interactions is fully at play (Hrachowitz et al., 2013; McDonnell et al., 2007). By contrast, studies on a very small scale, continent-wide (MacDonald et al., 2021) or even global (Richts et al., 2011; Mohan et al., 2018) scales, cannot live up to this demand.
According to Sivapalan et al. (2003a), such predictive systems should contain three components: (1) a model that describes key processes, (2) climatic input with the meteorological drivers of basin response and (3) parameters of landscape properties that govern these processes. In other words, basin classification frameworks differentiate, describe and, where possible, quantify the observable physical landscape features, both underground (using geology) and above surface (using soil cover or land use and land cover, LU/LC) and relate them to each other. For their part, Sivakumar et al. (2013) offer a three-step procedure for an effective formulation and verification of a catchment classification framework: (1) the detection of possible patterns in hydrologic data and determination of complexity and connectivity levels; (2) the classification into groups and subgroups based on data patterns, system complexity and connections; and (3) the verification of the classification framework.
For the regionalisation of physical parameters, in ungauged basins, previous authors have suggested the use of physiographic similarity as a proxy (Arheimer and Brandt, 1998; Parajka et al., 2005; Dornes et al., 2008; Masih et al., 2010). However, the correct linkage and translation of point- and plot-scale observations into regionalised findings on the catchment scale often remains a crucial challenge (Hartmann et al., 2013). And the regionalisation of observable spatial parameters remains connected to the empirical efforts of field observation and measurements (maps, aerial photography, satellite imagery and of course field visits). This article therefore draws on the recharge measurements and modelling in Messerschmid et al. (2020).
1.2 Reliable field data in regional flow systems for the correlation of form and function
Several factors pose a challenge to the estimation of spatially distributed recharge, such as the need for reliable field data or the correct conceptual representation of the aquifer and its flow and recharge processes (Goldscheider and Drew, 2007; Scanlon et al., 2006). Important physical landscape features are often difficult to control since they are spatially highly variable, localised in nature and far from being uniquely correlated to each other (Beven, 2000; Oudin et al., 2010). Yet, they shape the overlapping processes of groundwater recharge (Batelaan and De Smedt, 2001; Beven and Kirkby, 1979).
The translation of physical basin form into hydrological function is crucial and challenging, since it involves two discrete conceptual levels and an extraordinary complexity of interactions. Therefore, many studies suggested the use of physiographic similarity as a proxy for functional similarity (Arheimer and Brandt, 1998; Parajka et al., 2005; Dornes et al., 2008; Masih et al., 2010). Hence, the regionalisation of runoff, recharge or other dynamic catchment response characteristics can be based on physical characteristics (Yadav et al., 2007).
Hydrological system signatures, for example, temporal patterns discharge, flow duration curves or spring hydrographs, can be employed to create a link between physical features and basin response and to describe emergent system properties (Eder et al., 2003; Hartmann et al., 2013). They can be used quantitatively, for example, for the calibration of models (Hingray et al., 2010; Baalousha et al., 2018), or qualitatively, as indicators of basin response (see Messerschmid et al., 2020; Sivapalan et al., 2003b and Winsemius et al., 2009). And in poorly gauged catchments, they can serve the regionalisation of plot-scale findings into basin-wide overall processes (e.g. Castellarin et al., 2004; Bulygina et al., 2009; Pallard et al., 2009) or the testing and investigation of modelling results (see Messerschmid et al., 2020).
Field observations can either focus on surface water or on the saturated, deeply buried zone of the aquifer. Where both are not available (as in Messerschmid et al., 2020), the unsaturated zone can be targeted – within the soil cover or underlying rock formations – as Scanlon et al. (2006) report.
The problems with the regionalisation of distributed recharge are further exacerbated in deeply buried karstic aquifers, known for their non-Darcian flows and anisotropic natural flow fields, which often are further altered and disturbed by human intervention, for example, well abstractions. In such basins, even a well-controlled basin response based on lumped outflows in the often strongly confined downstream area often does not truly reflect upstream variability in unconfined and outcropping areas, where recharge takes place. This is especially the case in settings where several sub-units are stacked and hydraulically interconnected in one uniformly acting regional aquifer in the downstream abstraction zone, with low gradients and excessive pumping, as Dafny (2009) and Dafny et al. (2010) have shown for the Western Aquifer Basin (see also Hartmann et al., 2012b, Guttman and Zukerman, 1995, and Abusaada, 2011). Last but not least, with respect to spatially distributed recharge from different hydrogeological units, the concept of budgeting in- and outflows only functions correctly when no downward leakage has to be accounted for. This process, however, is often beyond the reach of observations and measurements, particularly in poorly or entirely ungauged basins around the world.
Sivapalan et al. (2003a) stated that in ungauged basins, predictive systems must be inferred from direct field observation of dominant processes and empirically derived field parameters. They must be firmly based on local knowledge of the observable landscape (and climate) controls of hydrological processes (see also Messerschmid et al., 2020). On the other hand, McDonnell et al. (2007) argued that any mapping or characterisation of landscape heterogeneity and process complexity must be driven by a desire to generalise and extrapolate observations from one place to another, or across multiple scales. A certain degree of extrapolation is therefore inevitable when attributing physical features and feature ensembles to processes and basin responses (or from the observed to another location). This therefore involves deductive steps. But the need for direct observation remains. PUB theory therefore postulates the imperative of a combination or better the integration of inductive (experimental and empirical) and deductive approaches in regionalisation (Pomeroy, 2011).
Conceptually, Sawicz et al. (2011) developed a simple recipe for regionalisation consisting of three steps: (1) classification (to give names), (2) regionalisation (to transfer information) and (3) generalisation (to develop new theory), or in brief terms: name it, attribute it and theorise it.
1.3 Western Aquifer Basin – overview and existing recharge studies
Details of the characteristics of the Western Aquifer Basin (WAB) were described in Messerschmid et al. (2020). The WAB is a complex of up to 1000 m thick Upper Cretaceous carbonatic karst aquifer sequences (SUSMAQ, 2002) and conventionally divided into two regional aquifer layers (Fig. 1) – an Upper Aquifer (UA) of Turonian to Cenomanian age and a Lower Aquifer (LA) of Upper Albian age, (see Fig. 2a in Messerschmid et al., 2020) – and separated by poorly or non-permeable layers of Lower Cretaceous age (Yatta formation). However, this simplified regional hydrostratigraphy applies only to the coastal plain downstream, with its productive abstraction and discharge zone, where the fully confined aquifer acts uniformly and with a low hydraulic gradient (Dafny et al., 2010); see Table 1, Sect. 2. On a local scale, especially in the phreatic zone upstream, the hydrostratigraphy is far more complex than the above-mentioned bipartite division into the Upper Aquifer and Lower Aquifer.
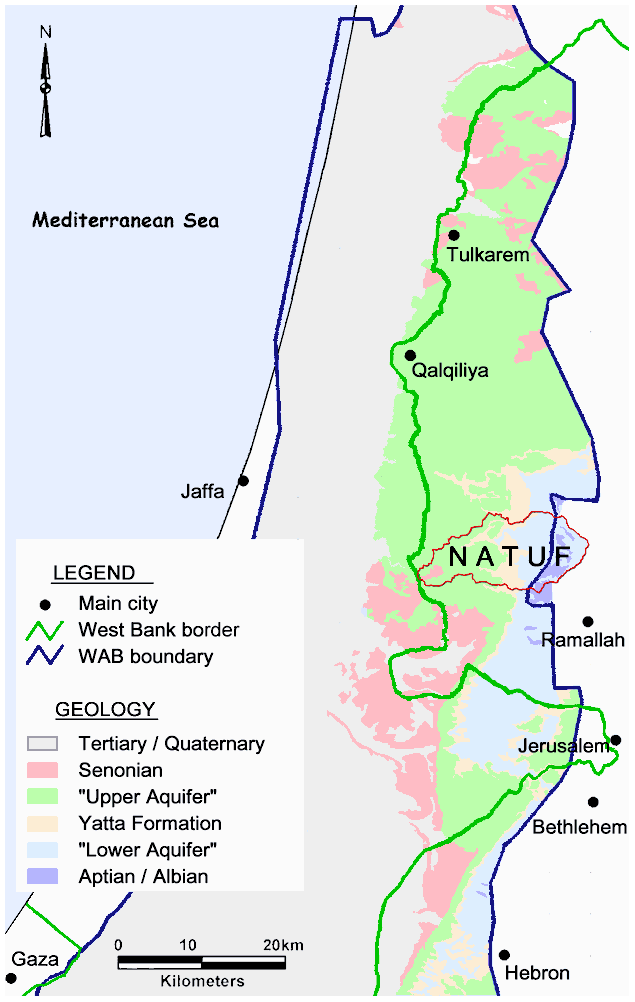
Figure 1Overview of regional aquifer outcrops in Wadi Natuf and the WAB, modified after Messerschmid et al. (2003a).
Importantly, the productive coastal plain (inside Israel) is well developed, monitored and gauged through a network of hundreds of Israeli groundwater abstraction and monitoring wells (tapping the deep aquifers). By contrast, the slopes, the WAB recharge and accumulation zones (in the occupied West Bank) remain almost untouched, ungauged and unexplored, due to severe Israeli restrictions on Palestinian water use and development (World Bank, 2009) – one of the main points of contention and water conflict between the two sides. Wadi Natuf, the study area of this paper, lies almost entirely within the aquifer's recharge zone, with only the most downstream western portion bordering on the productive abstraction zone in the coastal plain (Fig. 1) and with one single abstraction well not far from the western catchment boundary (SUSMAQ, 2001).
So far, only a few authors have attempted the analysis of fully distributed recharge in the WAB (Hughes et al., 2008), and no previous study was based on empirical field evidence, measurements and observations. Sheffer (2009) introduced a semi-distributed, partially lumped recharge model but with a very coarse lithological differentiation into merely two types of rock, either permeable or less permeable. In addition, Sheffer (2009) took his soil model parameters from the general literature and later adjusted them by calibration. In his own words, he focussed and aimed at “the understanding of temporal influence on recharge processes”, rather than on understanding spatial influences (Sheffer et al., 2010; Sheffer, 2009).
During the last 2 decades, other studies of field-based and empirical investigations on sub-catchment, local and plot scales were conducted. Chloride mass balance calculations were carried out in the adjacent Eastern Aquifer Basin (EAB) (Marei et al., 2010; Schmidt et al., 2013; Aliewi et al, 2021) and in the central WAB (Jebreen et al., 2018), usually with annual recharge coefficient (RC) values between 30 % and 50 % (see Messerschmid et al., 2020, Appendix H). However, they contributed little to the spatial differentiation of distributed recharge processes, let alone its regionalisation.
1.4 Research gaps, aims and motivation of our study
In the WAB, lumped studies of basin-wide replenishment are widely available but are mostly based on desktop work. By contrast, distributed recharge quantification has hardly been attempted. Moreover, the physical form and the spatially variable parameters that rule the recharge process were not observed or measured directly in the field. At most, some empirical recharge studies were conducted on the point scale but without further regionalisation efforts – a crucial difference according to Martínez-Santos and Andreu (2010). Under such circumstances, the regionalisation of the observed and modelled field results must include at least some measure of extrapolation and deduction. A suitable basin classification framework (BCF) for the WAB, as recommended by Hrachowitz et al. (2013) above, did not exist prior to this study and had to be developed, drawing on the three groups of physical characteristics above.
The previous paper (Messerschmid et al., 2020) was firmly grounded in field observation, measurements and a forward-calculating location-specific soil-moisture percolation models; now, this current paper extends the findings of the local models in a regionalisation effort to the entire surface catchment area of 103 km2. By contrast, the aim of this study was the generation of spatially distributed, specific recharge coefficients for every lithostratigraphic formation in Wadi Natuf through regionalisation, i.e. the attribution and extrapolation of the recharge coefficients, modelled before at point scale. The work was based on the understanding of dominant physical parameters and processes and carried out in two consecutive steps: in a first step, a new recharge classification framework was set up for this largely ungauged basin, based on field observations, as well as conceptualisation and classification. Relevant physical features were identified and attributed to three different groups (geology, soil and LU/LC), and within each group, different recharge classes were differentiated. In a second step, the quantification and regionalisation were carried out as an extrapolation along the above grouping and classification scheme, developed for Wadi Natuf and the WAB. Hereby, we used the location-specific recharge coefficients (RC) that were derived from the soil moisture models in Messerschmid et al. (2020).
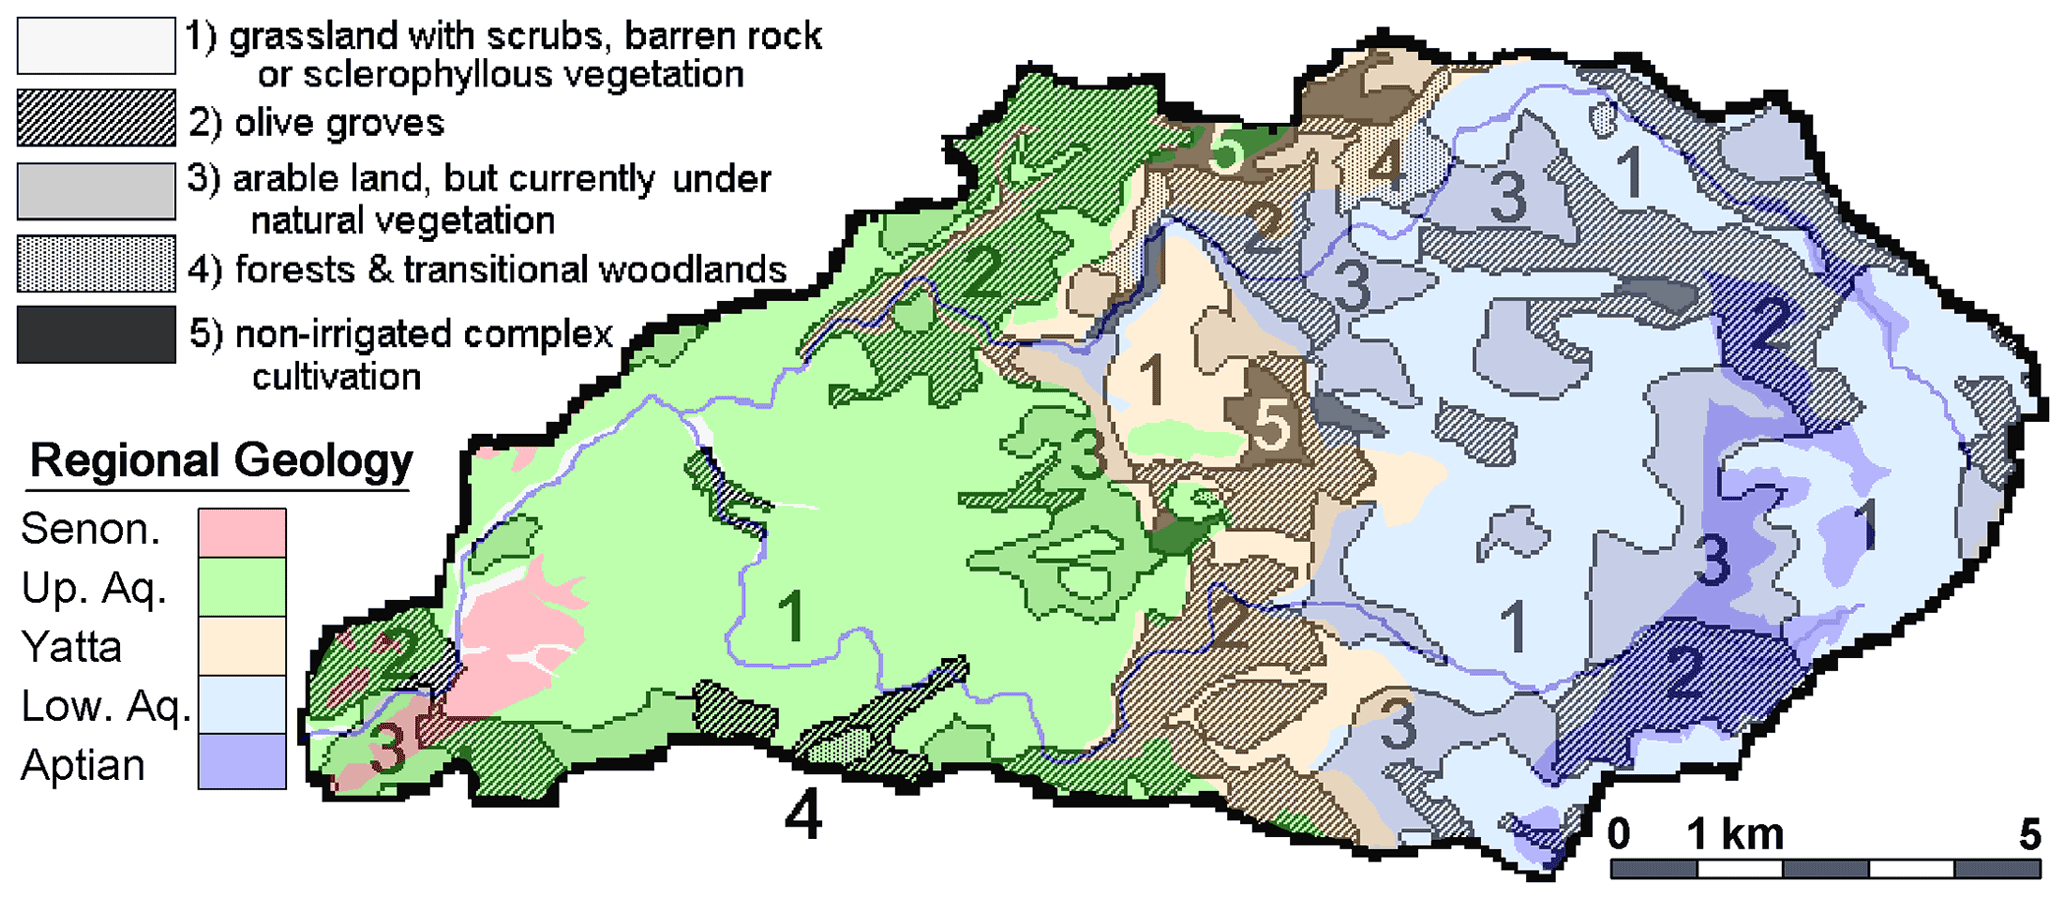
Figure 2Wadi Natuf land use and land cover (LU/LC) map and regional hydrostratigraphy in shaded colours (modified after LRC, 2004, Messerschmid et al., 2003a, and ARIJ, 2012). Note that the land cover types 4 and 5 are almost completely restricted to Yatta formation outcrops (and in some places parts of the UBK formations). Type 3 is typically found over outcrops of the regional Lower Aquifer. The Upper Aquifer outcrop area is dominated by type 1 (grassland and barren rock). Olives (type 2) can be found in all areas but are grown on tended terraces, mostly in the steep slopes of the Lower Aquifer outcrops in upper Wadi Natuf.
The development of empirical understanding of how recharge (with empirical coefficients) takes place in deep karst formations is innovative on its own. For the first time, we were able to develop a fully distributed recharge model in a hitherto ungauged basin of deep karstic aquifers (such as Wadi Natuf in the WAB). In addition, the novelty of our approach consisted in a new combination of existing techniques that are based on observable processes, parameters and signatures. The assessment adheres to the goal of parsimony and integrates inductive and deductive steps. And by being firmly grounded in empirical surface and near-surface observations, this new approach can be transferred and applied to other, hitherto ungauged basins in order to advance the crucial but challenging task of a realistic representation of distributed recharge.
The 103 km2 large catchment of Wadi Natuf extends on the western flanks of the West Bank from the mountain crest in the east towards 1949 Armistice Line (“Green Line”) in the western foothills. Much of its topography is characterised by undulating hills with deeply incised ephemeral rivers (wadis). The catchment exhibits a pronounced spatial variability of climatic drivers (precipitation, evaporation), land use and land cover features (LU/LC), soil thickness and, not least, rock lithology of the different geological (lithostratigraphical) formations (see Fig. 2a in Messerschmid et al., 2020).
2.1 Geology and hydrogeology
One of the reasons for choosing Wadi Natuf as an exemplary sub-catchment on the recharge zone of the Western Aquifer Basin (WAB), besides field accessibility, was the unrivalled lithostratigraphic diversity, reaching from the deepest outcropping Aptian formations all the way up to the top cover series of impermeable chalks from Senonian (and Lower Tertiary) age. All formations of the WAB are covered in this study (Fig. 2b in Messerschmid et al., 2020). Together, the aquifer formations cover around two-thirds (64.4 %) of the outcrop areas in Wadi Natuf; they are entirely carbonatic and in most parts strongly karstified. The other third of the area consists of outcrops of less permeable and fully impermeable formations.
According to the old, conventional view – valid on the regional scale – the regional Upper Aquifer and Lower Aquifer are divided by some 100 to 150 m thick marly, chalky and carbonatic series of a so-called “Middle Aquitard” or Yatta formation (Bartov et al., 1981; SUSMAQ, 2002; Messerschmid et al., 2003a, b; ESCWA-BGR, 2013). The regional geology is indicated in the land use and geology map (Fig. 2; for a detailed geological map, compare with Messerschmid et al., 2020, Fig. 2b). However, closer scrutiny reveals that this regional Middle Aquitard can be further subdivided. The top forms an aquitard or even aquiclude section of impermeable yellow soft marl (upper Yatta, u-Yat). By contrast, the main (lower) part of this “regional aquitard” is more carbonatic and in parts karstified but complemented by smaller portions of chalk, marl and chert. These somewhat marly and chalky limestones and dolomites of lower Yatta formation (l-Yat) thus form intermediate perched aquifer horizons that drain through small local springs.
Table 1Outcrop (recharge) area, average precipitation and formation names in Wadi Natuf – regional and local refined hydrostratigraphies.
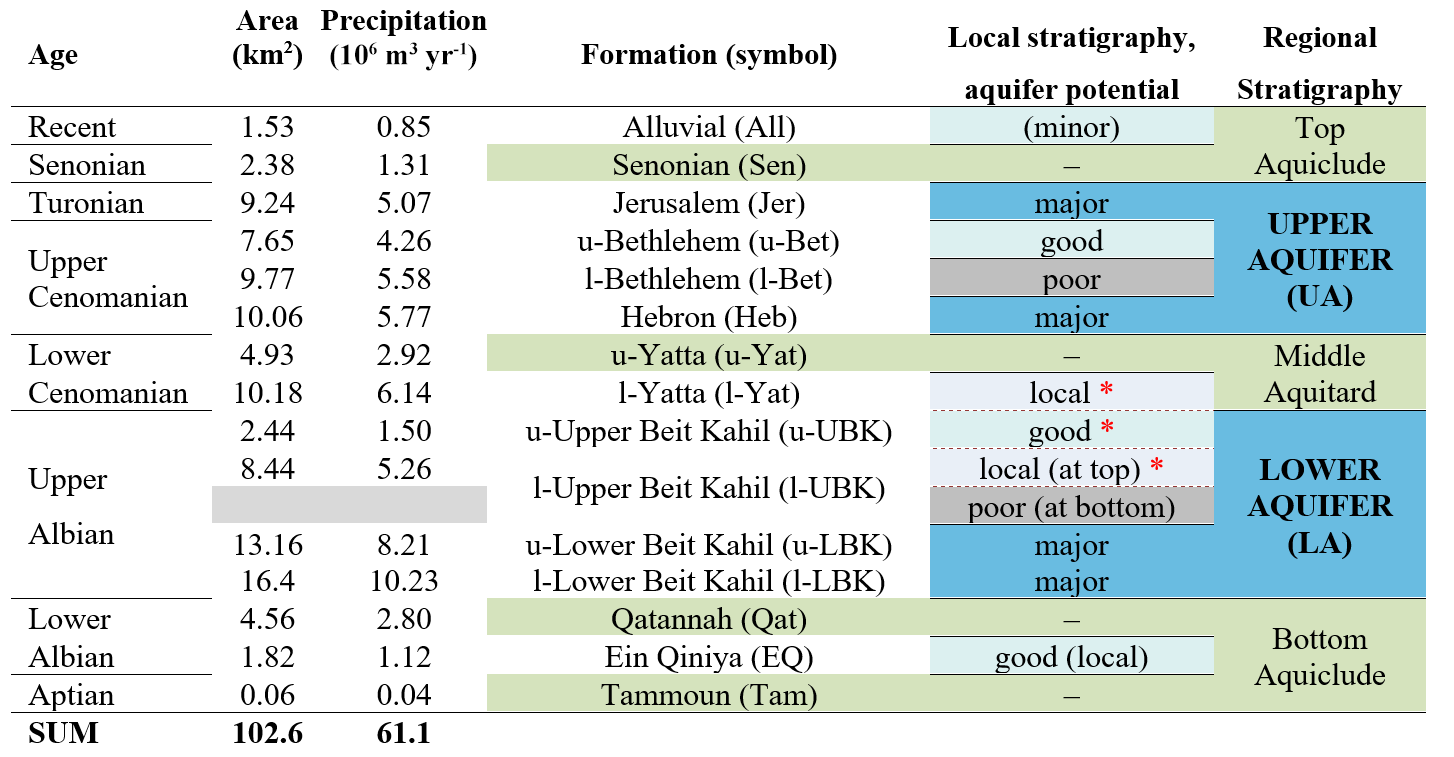
Note that the area of formation outcrop here is equated with the area for infiltration (recharge). Precipitation here is expressed as the average annual amount of area precipitation over the respective formation outcrops and calculated with rainfall of the respective sub-catchments within Wadi Natuf. Ein Qiniya formation is a local aquifer, which however does not belong to any of the regional aquifer units or basins; its recharge potential does not form part of the water balance calculations for the WAB. * Perched leaky aquifers with dashed line at bottom. Source: this study.
Also, the regional Lower Aquifer (LBK and UBK) can be differentiated on the local scale into more aquiferous and more permeable parts (Table 1). Its top is formed by the conspicuous cliff-forming and very permeable reefal limestone of upper UBK (u-UBK) that also acts as a leaky perched aquifer on the local scale (such as in Wadi Zarqa). By contrast, the lower UBK formation (l-UBK) mostly consists of banked, often chalky dolomites (again with intercalations of marl and chert) with a relatively poor aquifer potential. Its top, however, was found to be more carbonatic but underlain by a twin marl band (Fig. 3c), which hydraulically separates the top from the main, lower part of l-UBK and above which local contact springs align. This top of l-UBK acts as a third local and isolated perched aquifer horizon.
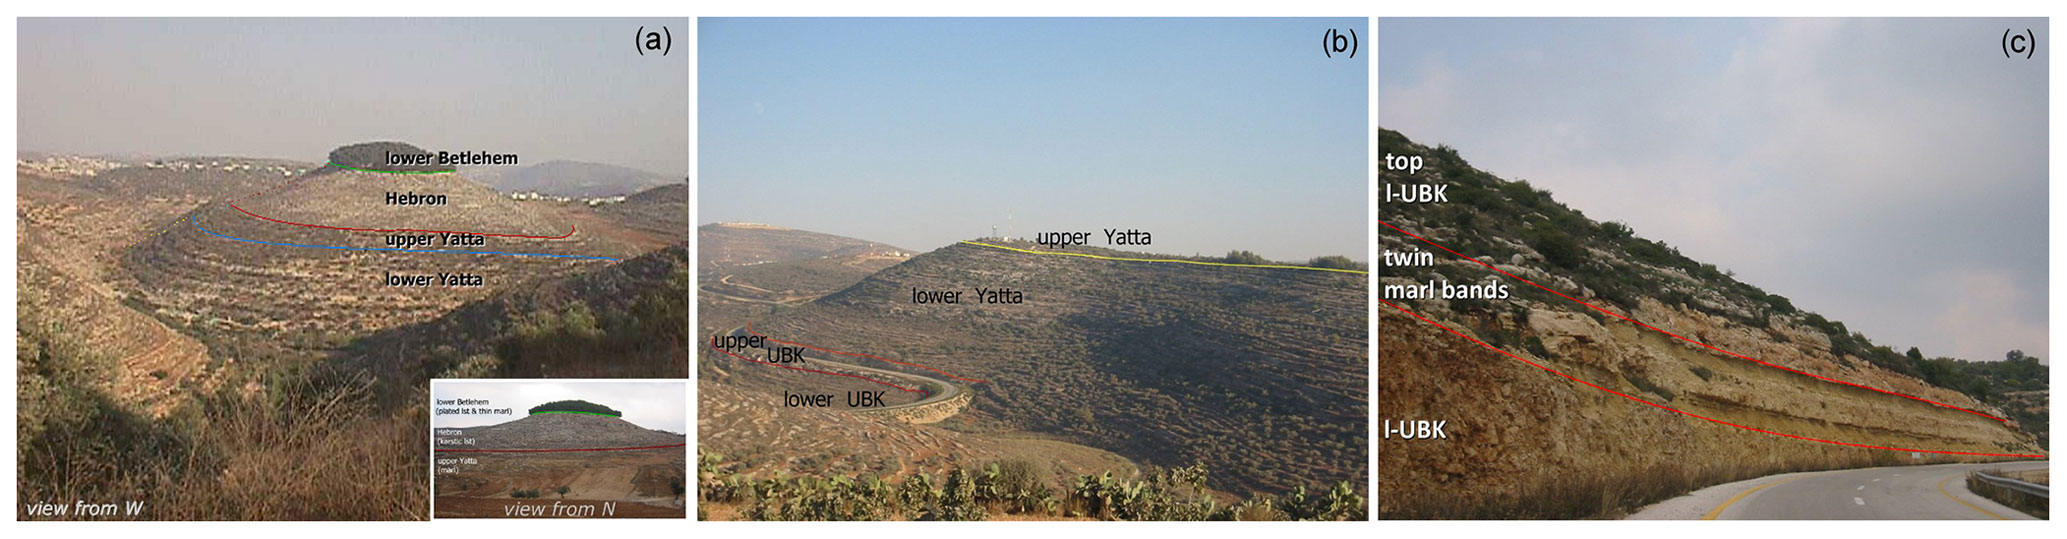
Figure 3Correlation of landform and lithology. Nabi Ghayth hill, west of Beitillu (a), and Nabi Aneer spring group (b). Twin marl band underlying a local perched aquifer (c). Note that the karstic limestone of Hebron formation forms outcrops with thin soil cover, bare rock or karren fields and tends to erode into steeper slopes above the soft, mostly eroded upper Yatta formation – the only true aquiclude within the West Bank Group (with levelled agricultural plains in the inlet photo in (a). By contrast, the top of the hill is formed by lower Bethlehem formation, a thinly plated coloured limestone ensemble with fine marl interbedding that lacks karstification and promotes soil development and natural vegetation. Panel (c) shows the twin marl band, underlying and confining Beitillu, Harat Al-Wad spring group (of top l-UBK formation).
By contrast, the regional “Upper Aquifer” is void of both perched aquifers and springs, despite the fact that it too contains formations with thin marl intercalations of reduced permeability, such as the colourful plated limestone series of lower Bethlehem formation (l-Bet), the outcrops of which are often covered by small forests. This is due to the presence of the thin marl intercalations which promote the development of thicker soils here (e.g. the forested hilltop in Fig. 3a). It can thus be summarised that almost the entire Upper Aquifer and most of the Lower Aquifer outcrops in the recharge area are void of springs.
Only the intermediate aquifers of the central study area show land forms of deeply incised erosional Wadis, which often completely isolate the small local and often perched aquifer reservoirs on individual hills or hill groups. They drain through over 100 small and very small but perennial local contact springs (Fetter, 1994), with individual spring flow between zero and a maximum of 1.7 L s−1 (Messerschmid et al., 2003a, b).
These isolated perched hilltop aquifers of central Wadi Natuf stand in contrast to the thick regional aquifers and therefore only incompletely contribute to the deep regional groundwater recharge of the two regional storage and flow systems. Together, the formations of the three isolated perched aquifer systems cover 13 % of the catchment.
The outcrop areas of all formations, as well as the differences between the local and the regional hydrostratigraphy, form one focus of the present study (see Table 1).
2.2 Physical landscape features
Less than 5 % of the rural Wadi Natuf landscape is built up (Messerschmid, 2014). Its typical land forms (Fig. 2) range from rock outcrops and terraces with olives to grass- and shrublands, arable but currently uncultivated lands, mixed vegetation and transitional woodlands to agricultural plains and forests (Messerschmid, 2014; LRC, 2004). All land forms in Wadi Natuf are closely related to the underlying geology (Fig. 3). The soft marl of u-Yat usually forms an eroded step in the landscape that can develop into small inland plains with cultivated agricultural fields. By contrast, the mixed intercalations of marly, chalky and limey rocks of l-Yat form natural steps and terraces in the landscape, often with a bushy landscape, partly also with trees. The regional aquitard of u-Yat is overlain by the strongly karstified massively bedded limestone of Hebron formation (Heb), which often restricts soil development to small pockets in an otherwise sparsely vegetated karren-field landscape. This karstic formation with an excellent recharge potential (and very low runoff generation; see Messerschmid et al., 2018) in turn is overlain by the already mentioned soft, plated limestone with thin marl intercalations of l-Bet, which not only erodes differently, but also allows for the formation of thicker soils; Fig. 3a shows l-Bet at the top of the hill, conspicuously covered by a little forest and with a sharp boundary to the LU/LC type of the underlying karstic Hebron formation.
Typically, in Wadi Natuf, this distribution of LU/LC follows the formation outcrops (geology) with great accuracy, discernible even from aerial photographs. Also soil thickness was measured and found to strongly correlate with lithology and land forms (LU/LC), as discussed in the first part of this series (see Table D1 in Messerschmid et al., 2020). This recurrent field finding of strict correlation between the three groups of physical features – LU/LC, soil thickness and geology – forms the basis of the classification framework in Wadi Natuf (see Sects. 3.2, 3.3 and 5.1), since it allows for categorisation of key elements of recharge and the attribution of lithological and hydro-stratigraphical characteristics with the aquifer and recharging potential of the different formations.
The regionalisation of this study employs two consecutive procedures: Step (a), identification and parameterisation of physical features and their classification in a conceptual response matrix, attributed to classes of hydrological impacts (Fig. 4, rows 1 and 2), and Step (b), extrapolation and regionalisation of the quantitative model results from Messerschmid et al. (2020) within a classification framework (row 3).
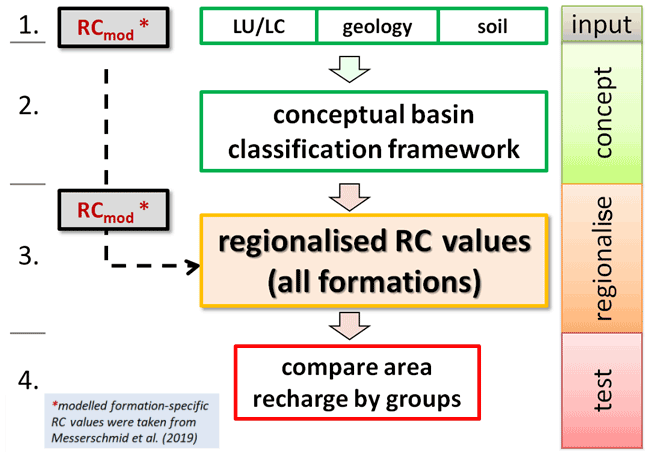
Figure 4Conceptual flow diagram of work steps First row: field observations on land forms, geology and soil, together with key date campaign on spring flow measurements; second row: setting up a conceptual classification framework; third row: introducing formation-specific RC values (from Messerschmid et al., 2020) and regionalisation of RC values for the entire catchment (all formations and all three groups); fourth row: area recharge calculation and comparison of results for the different groups.
3.1 Physical features
The classification of distributed physical landscape features and their parameters stands at the heart of this study. Mapping, detection, interpretation and, where possible, quantification of their parameters were carried out over a period of more than 10 years and over 200 field visits to gain local knowledge on specific field conditions.
Table 2Schematic conceptual basin classification framework.
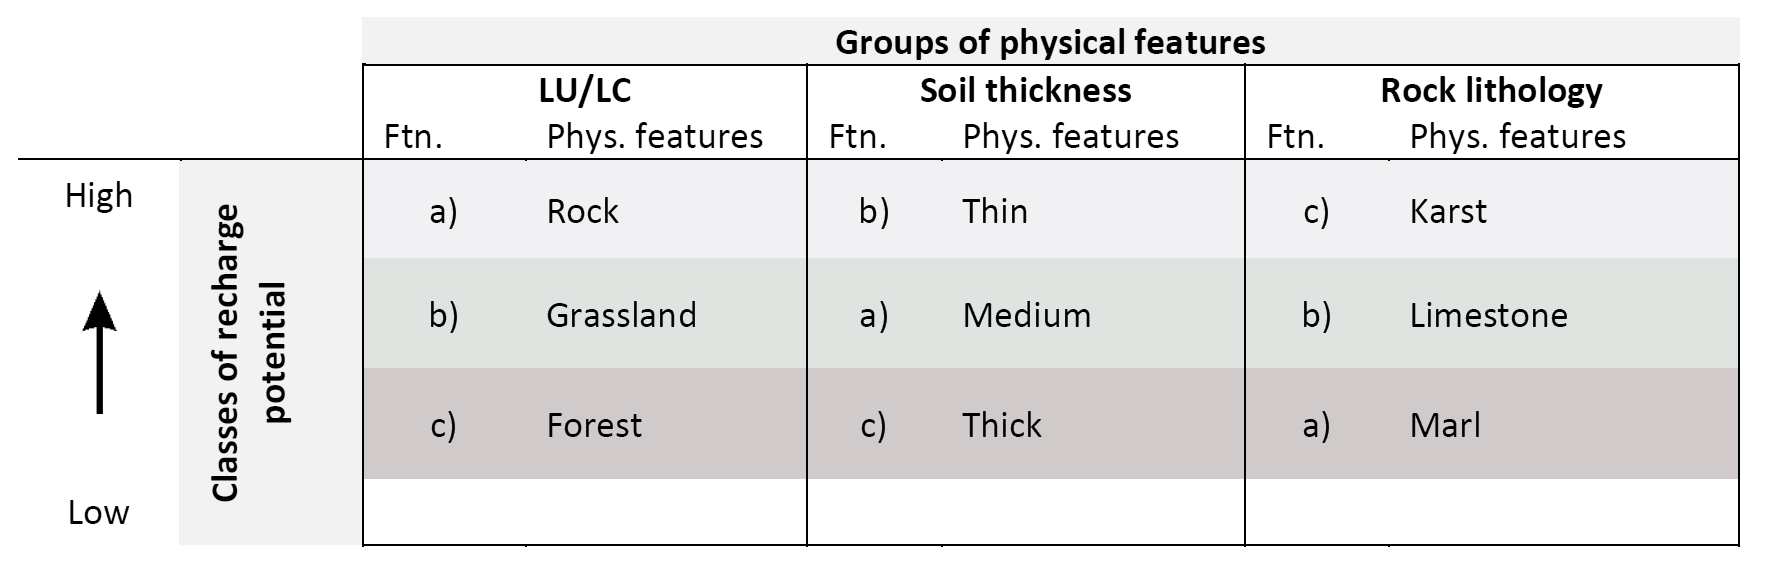
Note that the order of formations (a–c) differs from group to group, thus indicating different ranking orders of formations as to their recharge potential (classes) in each group. This table is a generic example; more classes can be used.
First, existing geological maps in the scale 1:50 000 (GSI, 2000, 2008; Rofe and Raffety Consulting Engineers, 1963) were corrected, complemented and refined by extensive field mapping and remote sensing (stereoscopic aerial photographs) with the target to detect, describe and interpret the lithological rock content, (mineralogical composition, texture, grain distribution), the degree of crystallisation and structural features like folding, faulting, cleavage and jointing, as well as primary porosity and karstic features. These karstic features encompass epikarst surface features (karren and schratten landscape), karstic solution holes (especially in the l-LBK formation, a.k.a. “Swiss cheese” formation, and in parts of the Hebron formation), well-known caves and karstic channels in the underground and wide, karstified fractures (inc. their width and prevalence). The study also built on earlier small-scale fracture trace and lineament mapping in the Ramallah district (Aliewi and Messerschmid, 1998). In addition, there are indirect indicators of sub-surface karst (such as rapid interflow emerging at “bleeding hills” and travertine crusts). Another focus was the refinement of local hydrostratigraphy, in particular with respect to the spring-feeding formations (Messerschmid et al., 2003b; Dafny, 2009) and their catchment areas. Of particular interest were not only the spatial pattern and distribution of such features, but especially also the comparison of these geological features with the features and distribution of the other groups, i.e. soil and LU/LC. This enabled us to assign particular spatially distributed geological characteristics to each of the different formations. This study first re-examined the distribution of landscape features with respect to their recharge potential and the exact delineation of the outcrop and recharge areas of the different aquifer and aquitard formations.
The second part of field mapping and investigations targeted the soils in Wadi Natuf. Lab tests found silty to clayey residual soils (terra rossa), which are typical of Mediterranean carbonate environments (see also Messerschmid et al., 2020). The main aim of this sub-study was to investigate soil thickness and its distribution over the area. As already mentioned, a conspicuous spatial pattern emerged, namely that typical soil thicknesses formed over different formations (see Fig. 3a and b). Appendix D in Messerschmid et al. (2020) presents these results in a soil thickness matrix, where the distribution of soil depth was documented for different LU/LC types and different lithostratigraphic units.
Thirdly, and similar to geology and soil thickness, land use and land cover characteristics, such as relief, natural vegetation and its alteration by human land use (Sect. 2), can be interpreted as indicators of different hydrological processes that determine recharge. Whereas the differences in landscape units with respect to their runoff potential were discussed in Messerschmid (2014) and Messerschmid et al. (2018), this study aimed at creating a simplified but realistic categorisation of physical, recharge-controlling landscape features and their spatial distribution along the lines of outcropping formations.
3.2 Conceptual basin classification framework and regionalisation
Conceptually, as already mentioned, the regionalisation in this study comprises of two main steps (rows 2 and 3 in Fig. 4), i.e. the creation of a basin classification framework and the attribution of the model results of Messerschmid et al. (2020) to this framework by extrapolation and regionalisation, which will be further specified in the following. Based on the PUB understanding that physical characteristics control hydrological processes, and thus (hydrological) function follows (physical) form, a conceptual framework was set up, as shown in Table 2. The physical features were divided into three groups, such as LU/LC, soil and geology (columns in Table 2), and within each group, separately, the different landscape units were divided into distinct classes of recharge potential (lines in Table 2), based on the available geological literature and our extensive field investigations. Then, each lithostratigraphic formation (numbered a, b and c, etc. in the schematic of Table 2) was attributed to a distinct recharge class (from low to high in Table 2 and as roman numbers I–V in Table 3). As a result, we obtained three independent sets of differently ordered lithostratigraphic formations, ranked by their recharge potential. This separation allowed us to examine the result of attributed recharge classes separately for each group in order to gain a more realistic picture, to examine the differences in outcomes and to avoid oversimplification in line with PUB recommendations (Sect. 1.2). Again, this procedure was based on the findings of Sect. 2, namely that such a correlation between the three groups of physical features was clearly discernible in field explorations in Wadi Natuf. It should be noted here that whereas soil thickness was a quantifiable parameter, other physical parameters such as LU/LC (types of natural vegetation or land use) and geology were not. So, LU/LC and geology features were ranked according to their recharge potential and correlated with soil thickness (see ranked classes of recharge potential from low to high, as in Table 2). This was based on a soil thickness correlation matrix in which representative typical soil depths could be attributed to the different formations and land forms (this soil matrix is shown in Appendix D, Messerschmid et al., 2020).
Table 3Conceptual basin classification framework, specific to Wadi Natuf.
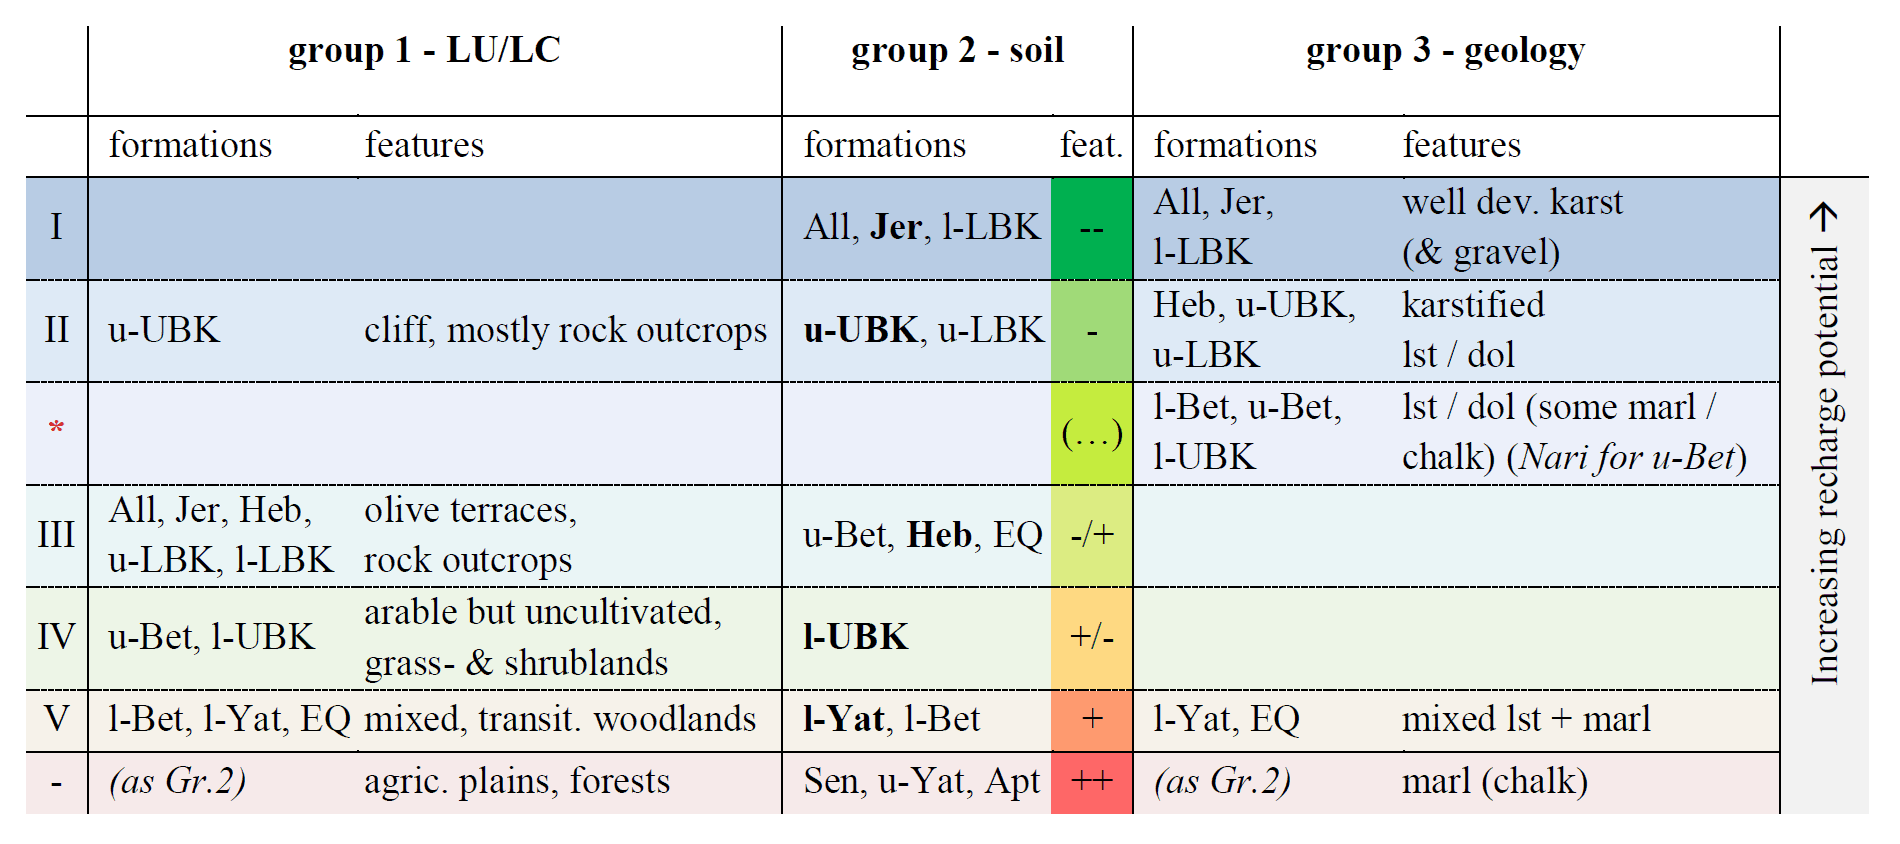
Note that the left column denotes classes of measured recharge potential (I–V), and the middle columns are groups of phys. features (1–3). formation names are as in Table 1. Soil thickness increases from thin () to thick (). The formations shown in bold type were the ones monitored, measured and modelled. The grouping and class distribution was based on field work and literature, for example, SUSMAQ (2002), LRC (2004), GSI (2000), Keshet and Mimran (1993), Messerschmid (2014) and Messerschmid et al. (2018). Aquitards, i.e. impermeable formations, where recharge is assumed zero, were not measured in SM stations (bottom line of Table 3).
Five different formation-specific RC values were obtained by Messerschmid et al. (2020), which had been based on monitored and modelled SM station data representing five different classes of recharge potential (between 57 % and 42 %, shown in bold red font in Table 4). In addition, impermeable formations were not monitored at SM stations; instead, a sixth class of zero recharge (RC = 0 %) was added for them. According to the correlation and grouping in the BCF, the different specific RC values of the modelled formations could be attributed to other formations as well (see Table 4). Hereby, the exact RC values found in the soil modelling were redistributed and assigned to different formations under LU/LC and geology groups – shown schematically in Table 2, conceptually in Table 3 and quantitatively in Table 4. By this step, all existing formations in Wadi Natuf were assigned specific RC values of annual recharge (ranging from 57 % to 42 % in aquifers and down to zero recharge in the aquitards). It should be added here that for three formations, an additional step was needed. These formations were found not to be uniform but either consist of different sub-facies at different locations of the catchment (e.g. u-Bet and l-Bet) or represent different lithologies in the stratigraphic column (within l-UBK formation; see photo in Fig. 3c). In these instances, an additional, intermediate RC value was introduced, based on the arithmetic mean of classes II and IV (49.4 % – as average between 44.7 % and 54.1 %).
Table 4Extrapolated recharge coefficients per group.
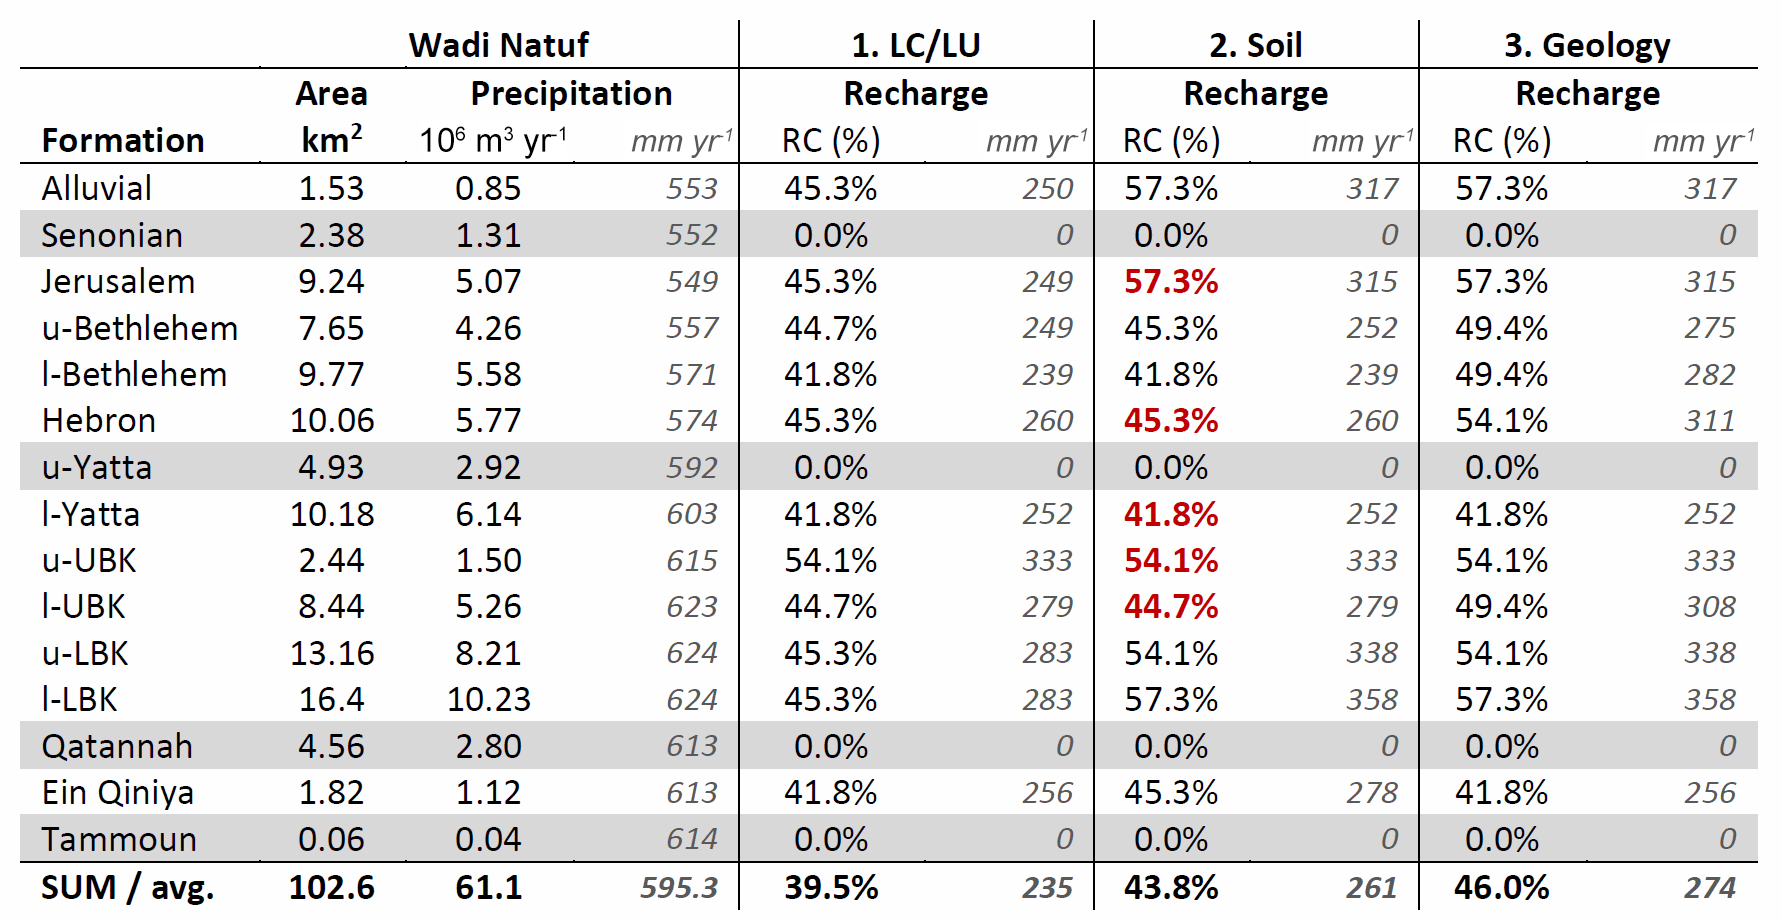
Note that the modelled RC values, taken from Table 2 in Messerschmid et al. (2020), are indicated in red and bold fonts under the second group (soil conditions). Aquitards void of recharge are shaded grey.
4.1 Basin classification
This analysis results in a basin classification framework that categorises different groups of recharge potential and attributes each formation to one of these classes, shown in Table 3. Each formation is attributed to different classes of recharge potential (lines) and independently for each “group” of physical features (columns). Hereby, the ranking order of some of the formations differs from group to group, based on literature and field observations as well as on conceptual considerations grounded in general physical laws (see Fig. 2 and Sects. 2 and 3).
4.2 Regionalisation and extrapolation of modelled RC values
Using this basin classification framework, it was now possible to extrapolate the results of the parsimonious percolation model and attribute the modelled recharge coefficients to other formations (according to classes of recharge potential, Table 3). To avoid equifinality problems and increase the reliability of the approach, this attribution of RC values was performed for each group of physical features independently. This approach rests on the assumption that the 7-year observation period fairly represents the long-term variability of inter-annual rainfall (see Messerschmid et al., 2020; Appendix E). Table 4 shows the modelled and the newly attributed and inserted average annual recharge coefficients for each group. In the table, those RC values which are directly taken from the model (Messerschmid et al., 2020) were marked in bold font and red colour (in group 2, representing soil thickness).
Regarding the class marked with an asterisk (*), this formation was not measured in SM stations. Instead, for group 3 (geology), the average of RC for classes II and IV was taken (as 49.4 %) because these formations appear in two facies types, which are more and less permeable, respectively.
Table 4 lists the 15 different outcropping formations in Wadi Natuf in chronological order from the youngest, alluvial series and impermeable Senonian chalks down to the oldest, also impermeable lower Albian–upper Aptian Tammoun shale formation (Messerschmid et al., 2003a). In between, there are two aquitardal series (Qat, u-Yat) and 10 more or less aquiferous formations, almost all of which are partially composed of carbonates (including the unconsolidated carbonate gravels forming the shallow alluvial in the Wadis). However, the recharge coefficients (as a fraction of rainfall) of the aquifers deviate by over 15 % between the most susceptible karstic limestones with an RC > 57 % and the more aquitardal series, containing some degree of marl and chalk, be it as discrete thin beds (l-Bet) or as marly and chalky limestones (l-Yat) with an RC of almost 42 %. These high recharge rates are partly due to the much reduced (in fact negligible) rates of runoff generation measured in Wadi Natuf. But more importantly, they are a result of the overall quite modest amounts of actual evapotranspiration, caused by the Mediterranean climate with a rather short but very wet winter season and a prolonged rain-free summer season, in which the dried up soils cannot offer any amounts of water to direct soil evaporation or plant transpiration, undergoing a kind of summer dormancy.
As described before and applied in the modelling code of the SM saturation excess and percolation model, the rate of groundwater percolation (here equated with recharge) from the soil into the aquifer bedrock is directly related to the thickness of the soil. In other words, our model and hence also this table is based on the observation and assumption that thicker soils permit less recharge than thin soil covers. Consequently, the highest RC values are all found in formations with very thin soils and larger portions of rock outcrops (around soil pockets), such as the Turonian limestones of Jerusalem formation at the top of the regional Upper Aquifer and as the bottom of the regional Lower Aquifer, the lower LBK formation (l-LBK), both of which display highly karstified and massively bedded limestone series with strong features of epikarst in the outcrop (SUSMAQ, 2002). These formations also show the highest recharge coefficients in the third physical landscape feature group (geology), due to the aforementioned lithological features. However, under the third group (LU/LC), these formations rank lower than the maximum RC values (instead, the cliff-forming u-UBK formation reaches the maximum here). This is due to the fact that, from a land use and land cover point of view, these two formations had to be grouped into class II of recharge potential (see Table 3) because here, besides the extended grass- and scrub lands, olive groves dominate on the cultivated terraces of l-LBK and on the plains of Jerusalem formation (see LU/LC map, Fig. 2). The other, un-modelled aquifer formations (u-Bet, Hebron, u-LBK and the stratigraphically deep formation Ein Qiniya) are assigned intermediate RC values (with 0 % for aquitards and 57 % for the highest potential) according to their class of recharge potential (Table 3).
Note again that Wadi Natuf comprises a main part of the WAB, a smaller eastern portion (in the mountains) belonging to the groundwater catchment of the EAB and reduced outcrop areas, older than and stratigraphically below the bottom formations of the regional Lower Aquifer in both WAB and EAB. Table 5 documents the total recharge in Wadi Natuf (as well as that of the WAB portion only, in brackets and blue colour). The resulting overall area recharge coefficient for the entirety of Wadi Natuf ranges between 39.4 % and 46.1 %, slightly higher for the WAB portion (44.2 % as a mean value of the three groups). As can be noted, despite the independent approaches and individual RC attribution for each group, the final results of average area recharge within the WAB portion match each other rather closely and for each calculation, with 24.1, 26.8 and 28.1×10⁶ m3 yr−1, respectively, or in other words, with a deviation of total distributed recharge by less than 10 %.
Table 5Annual average recharge in Wadi Natuf for different groups of landscape features (WAB only).
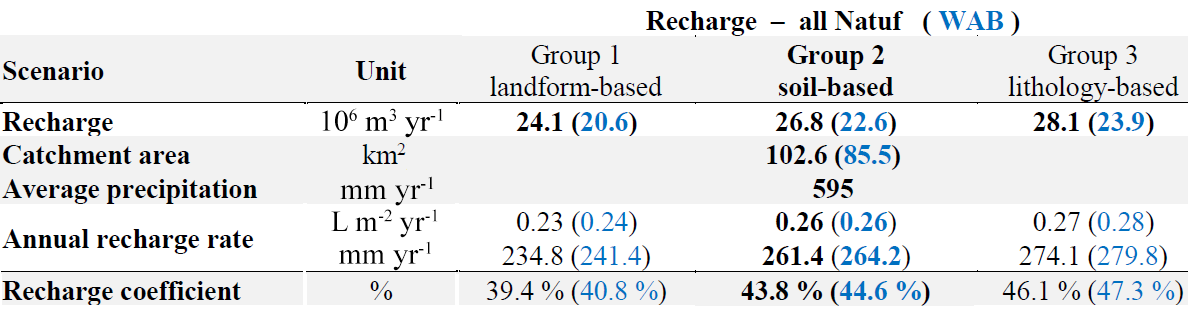
Note that the blue numbers refer only to the WAB portion with Wadi Natuf.
Figure 5 shows the overall catchment recharge as a result of the three independent runs of regionalisation for each of three types of landscape characteristics (geology, soil and LU/LC). The values from Table 4 were applied here and mapped as visualisation. The overall results of the three runs match each other closely. The ranking of formations according to LU/LC resulted in the lowest overall recharge. The regionalisation according to geology shows the highest values. The values of the soil-based group (middle column, marked bold in Table 4) take an intermediate position, close to the arithmetic mean of the three groups. A more detailed translation of the recharge values for different stations into area and aquifer recharge rates is documented in Table A1.
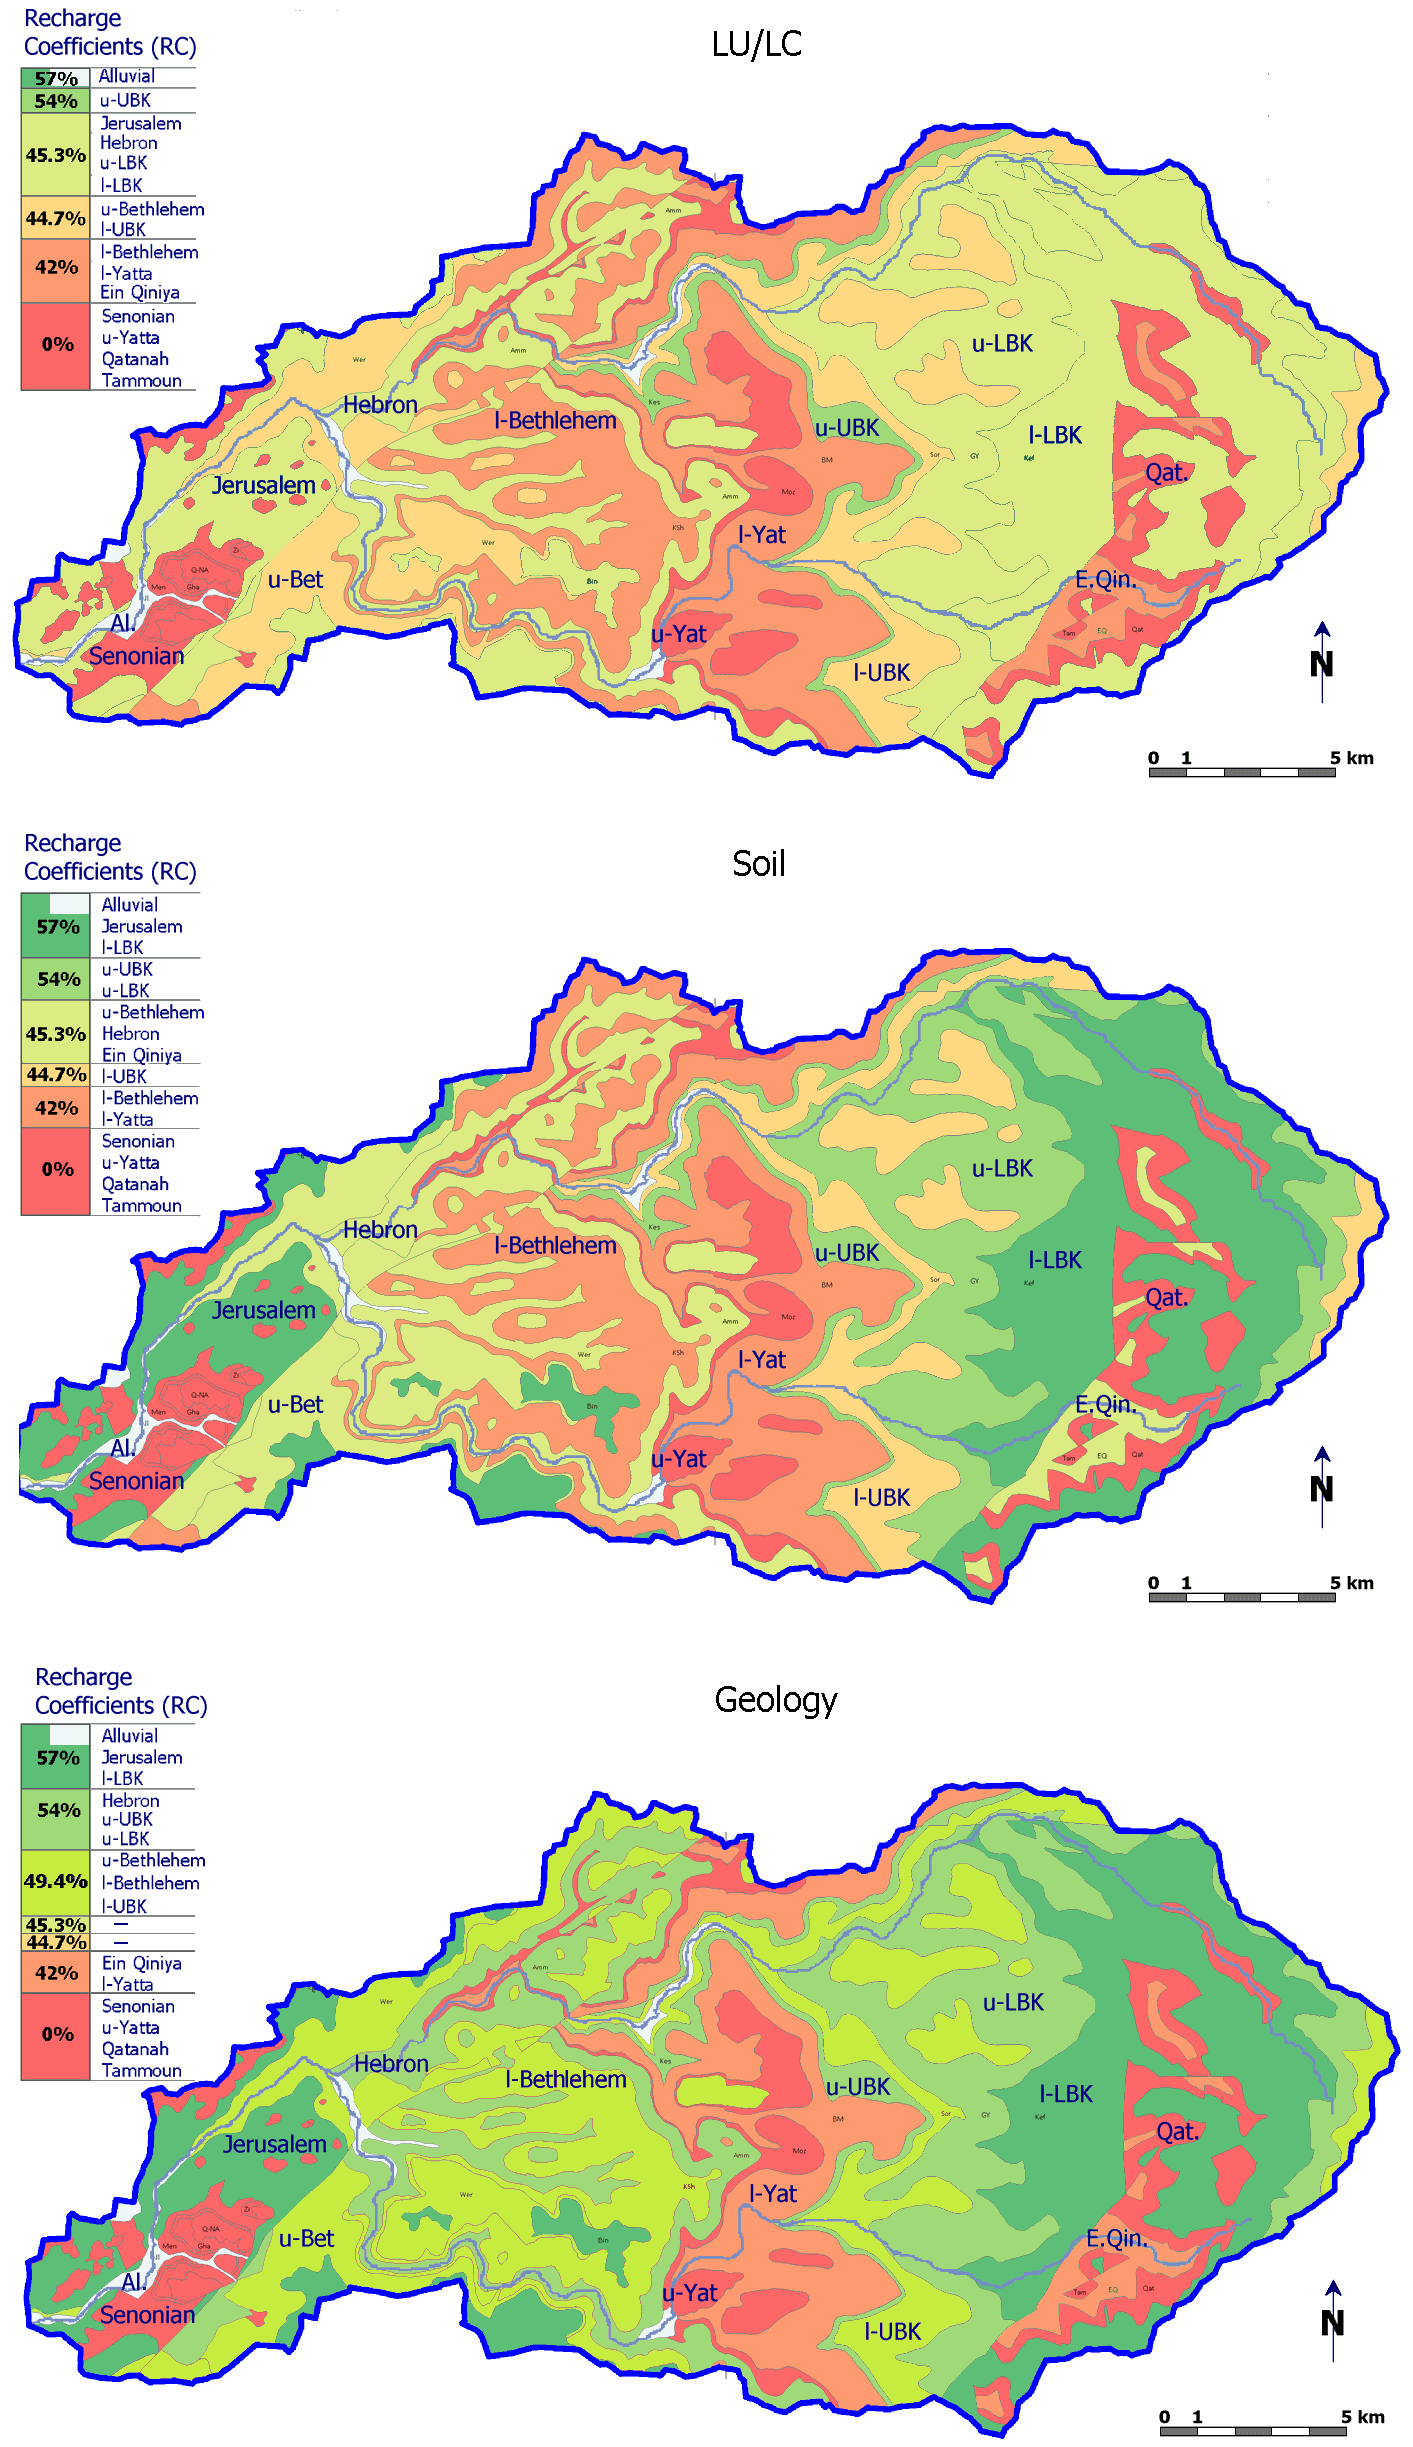
Figure 5Recharge map of Wadi Natuf – recharge coefficients of the different formations according to the different groups of landscape characteristics (LU/LC, soil and geology). The RC values are shown in percent of annual precipitation.
5.1 General approach of process representation
PUB research had previously suggested new ways to describe and estimate distributed basin responses but mostly focussed on runoff rather than on recharge and its spatial distribution.
Savenije (2010) suggested assigning individual hydrological processes and distinct hydrological functions (e.g. runoff) to different landscape units by dissecting catchments in a semi-distributed way and according to a hydrologically meaningful landscape classification metric. Batelaan and De Smedt (2001) accounted for spatial variation of physical features using a water budget of rain, evapotranspiration and runoff. In Batelaan and De Smedt (2007) long-term recharge largely depended on soil and LU/LC differences (with parameters based on literature values). Aish et al. (2010) could not only draw on physical features, but also on hydrological basin response knowledge (water levels) in their water balance model of the Gaza Strip (similarly Tillman et al., 2015). Several authors used dimensionless numbers of “similarity patterns” to relate physical form to hydrological impact in basin-wide transfer functions (Berne et al., 2005; Woods, 2002; Radulovič et al., 2011). Other authors calibrated parameters of the transfer functions such as soil properties (Ali et al., 2012) or LU/LC, soil and geology (Götzinger et al., 2006) or land forms such as depressions (Baalousha et al., 2018). Simple soil water models at the basin scale for daily recharge estimates in temperate climates were used by Dripps and Bradbury (2007) and by Finch (2001) as responses to land cover changes.
This study went a step further than the existing literature and employed new methods by combining deductive (conceptual) and inductive (empirical) approaches to determine spatial variations in groundwater recharge, based on qualitative (dimensionless) and on measured quantitative basin observations alike. Our distribution into distinct classes of recharge potential, we would like to stress here again, was an act of attribution and deduction; it was, however, firmly grounded in general physical laws, such as permeability of different lithologies or different forms of land use. Only the second group of soil moisture was empirically quantified by repeated field measurements in the form of soil depth probing. The results of this empirical survey of soil depth distribution for different hydrostratigraphical units are documented in the soil depth matrix in Messerschmid et al. (2020), Table D1.
Our three independent runs of conceptual analysis and attribution resulted in a close range of total WAB recharge (24, 26 and 28×106 m3 yr−1). This suggests that our transfer procedures delivered a robust and realistic representation of the processes at hand (which we prioritised over allegedly “exact” but less reliable results).
In our study, we tried to avoid problems of multicollinearity and equifinality by testing three conceptual approaches individually and separately in different groups according to physical basin form (grounded in empirical observation). It should be noted here that this approach was based on general knowledge and understanding of processes that can be observed worldwide; for example, high recharge potential can be attributed to areas with barren rock but also to terraces with tended olive groves, where runoff is inhibited by stone walls and where soils are relatively thin and farmers plough and remove weeds twice a year, which in turn reduces plant transpiration and thus slows down the loss of soil moisture. On the other hand, forests and agricultural plains with thick accumulated soils are known to reduce the infiltration, percolation and hence recharge potential. The same is true for different lithologies of receiving bedrock (like carbonatic, argillaceous and arenitic sediments). Although applicable worldwide in principle, our approach of separately accounting for three land feature groups signals a departure from many of the existing studies in other areas, which probably oversimplified matters by combining and subsuming all types of typical landscape features in one group, which then were split into different classes of basin responses.
As already mentioned, and by contrast to most earlier studies in the WAB, the focus of our approach was clearly the spatial, not temporal distribution and variability of recharge. This work was based on two assumptions: (a) that the 7-year rain period of the SM percolation model is a fair representation of long-term averages of both inter-annual and seasonal distribution of precipitation (see Messerschmid et al., 2020) and (b) that each of the selected SM stations is representative of the entire formation. Here we draw on the above results for the spatial distribution of physical features (Table 2) and soil depth (Table D1 in Messerschmid et al., 2020) of the respective formations. The results of these measurements and analysis confirmed the well-known fact that the temporal distribution of precipitation events strongly affects the percolation rates.
As the main aim of our research, we thereby obtained a detailed differentiation of the spatial distribution of recharge with formation-specific recharge coefficients for all formations in Wadi Natuf, which is a representative catchment of the recharge area of the WAB. The results of our three-way conceptual analysis and attribution seemed to suggest that, indeed, slightly different results of overall recharge rates follow from the three approaches. However, the relative closeness of the three results, for example, the total WAB recharge in Wadi Natuf of 24, 26 and 28×106 m3 yr−1, respectively, did suggest that each of the three independent transfer procedures between basin form and response was a realistic representation of the processes at hand. In other words, instead of producing an apparently precise figure for groundwater recharge, our analysis resulted in a less “exact” but more robust, realistic and nonetheless close range of recharge quantifications.
5.2 Limitations and caveats
To begin with, the results of the SM models, the RC values of the different formations as input data for our basin classification framework (BCR), are taken as correct and reliable. A discussion of the limitations and caveats of the results and methods can be found under Messerschmid et al. (2020). However, the process of setting up a BCF and attributing different classes of recharge potential (RP) to the different physical features (under the three groups selected) is a deductive step, which relies on the translation of qualitative observations in the field into quantitative classes of RP. Therefore, the exact classes under the BCF developed here, although based on and rooted in universal physical laws and well-established evaluations, could be somewhat imprecise and incorrect. Some classes could have been selected wrongly and could under- or overestimate certain factors (features) for the decision. This is why we found it imperative to establish three independent runs of classification for the three different groups of indicators, which allows us to weigh and compare and thus evaluate the reliability of the BCF.
Another theoretical possibility is that some processes, although present in the field, were not detected and included in the set-up of the BCF. However, the approach of this study used the most commonly known principle groups of physical landscape criteria quoted in most of the literature (see Sect. 1, Introduction). Therefore it can be stated with confidence that the processes covered by our selection of classification criteria belong to the most important, principle processes of groundwater recharge, and it is rather unlikely that a major process was overlooked.
The possibility of overlooking a minor process is always and necessarily a by-product of such simplification. Hence, such simplification, a major characteristic of our approach, is not only a strength but also a (relative) weakness. However, it should be repeated here once again that the need for simplification of the host of processes at work in groundwater recharge is strongly recommended and explicitly highlighted by the existing PUB literature (see Sect. 1, Introduction). In addition, the overall results were also weighed against and compared with similar results from other catchments, especially such as in the WAB and its environs.
Lastly, and although the correlation between the three groups of observable features was clearly observed and investigated in depth within Wadi Natuf, it may be absent in other catchments. This then would pose a limitation to the applicability of the approach chosen. However, in such a case, other correlations can and should exist; they should be studied and detected individually for each other basin but otherwise following the same approach as designed for this study.
5.3 Annual RC and overall basin RC, compared with other studies
As presented already, the individual recharge coefficients for the different formations cropping out in Wadi Natuf lie between a minimum of 0 % (non-recharging formations) and a maximum of 57 %. For the WAB portion of Wadi Natuf, the total average recharge for each group was found at 20.6, 22.6 and 23.9×10⁶ m3 yr−1, respectively. (This is equivalent to a WAB recharge coefficient of 40.8 %, 44.6 % and 47.3 %, respectively, within Wadi Natuf.) These overall recharge values fall well into the range usually quoted for the WAB (see Table A1). Also compare with the detailed table in Appendix H of Messerschmid et al. (2020) that lists the regional and other reported recharge coefficients, both for annual and event-based calculations and together with the methods applied therein. Weiss and Gvirtzman (2007) reported maximum recharge for 1 outstanding year (1988) as 91 % of annual rainfall at the small Ein Al-Harrasheh catchment on the SE edge of Wadi Natuf (Table H1). Allocca et al. (2014) found in the Apennines that for single events, up to 97 % of event precipitation may percolate and arrive as recharge at the groundwater table. Rosenzweig (1972) reported that for pasture and grassland at Mt. Carmel Basin, land form-specific recharge can amount to 60 % of annual precipitation. Allocca et al. (2014) quoted average annual RC values (“effective infiltration”) from other countries (Hungary, Greece, Spain, France and Croatia) to range from 35 % to 76 % and of 27 % for Tennessee (dolomites) and found recharge coefficients of 50 %–79 % in their own study in the southern Apennines. Martos-Rosillo et al. (2015) present a review of groundwater recharge studies in Spain. They found spatial variations due to “the degree of surface karstification and the development of the vegetal cover–soil–epikarst system in the carbonate aquifers”. “The recharge may range anywhere from 7 to 720 mm yr−1. The mean coefficient infiltration or recharge rate is 38 % of the rainfall, ranging between 4 % and 62 %.” Our findings of a range between <40 % and >47 % of overall annual recharge coefficients lie well in the middle of reported literature (incidentally, the average RC of 47.2 % for Harrasheh sub-catchment calculated by Weiss and Gvirtzman (2007) matches our maximum area RC of 47.3 % exactly). By contrast, RC values determined in recent studies in the Eastern Aquifer Basin at 33 % in the upper slopes (Ries et al., 2015) and 25 % in the lower slopes near the Jordan Valley (Schmidt et al., 2014) ranged somewhat lower; this is according to expectations due to the more arid climatic conditions with less precipitation and higher evaporation rates.
This study contributes to the assessment of distributed recharge in a Mediterranean karst area with a pronounced annual rainfall pattern of two seasons (dry and wet) and with a high variability in lithostratigraphy and other related landscape features, a key topic under future climate change. In line with the findings of the PUB decade, it was possible to solidly ground our basin classification for dominant recharge processes in observations of the physical form and based on fundamental laws of physics. Although the exact combination of land features is unique to the catchment at hand, its individual physical features and processes are common in many other Mediterranean catchments as well as worldwide: relatively thin, clayey terra rossa soils (Dan et al., 1975) covered by semi-arid to sub-humid climate vegetation; a highly variable relief with undulating hills, deeply incised Wadis and small inland plans; a pronounced seasonal precipitation; soil infiltration and runoff dominated by soil moisture saturation and storage; and last but not least, a series of well-bedded carbonates that are subject to uplifting, tilting and pronounced erosion, such as karstification. These characteristics were observed, analysed and united in a common basin classification framework (BCF). This new, intrinsic approach enabled a more precise quantification of recharge and of the areas concerned by this recharge (which can therefore be more protected, for example). We found an accentuated spatial variability of percolation fluxes and a strong dependency on three main groups of physical form, namely LU/LC, soil thickness and geology. For the first time in the WAB, our study used a truly distributed approach for a great variety of different physical land forms by employing extensive direct field observations and intensive multi-seasonal measurements. To extrapolate our findings, we ran three independent sets of basin classification and grouping in classes of recharge potential as observed in our study area.
While our regionalised recharge coefficients originated from plot-scale measurements, the results matched long-term observations reported in the WAB literature closely. The application, attribution and extrapolation of these coefficients for other, unmonitored formations reflect the ranges of recharge reported in the same region (WAB and environs) by previous studies that used lumped outflow-based basin-wide modelling (without spatial recharge differentiation).
On the side of spatial differentiation, and given the lack of existing hydrological measurements, our approach followed the three-way compromise prescribed by PUB (Beven and Kirkby, 1979) between the advantages of model simplicity, the complex representation of spatial variability of hydrological basin response and the economic limitations on field parameter measurement. This was done by applying the simple recipe of Sawicz et al. (2011) for regionalisation in ungauged basins, namely classification (to give names), regionalisation (to transfer information) and generalisation (to develop new or enhance existing theory).
Whereas our BCF for Wadi Natuf is site-specific, the general approach of using physical characteristics in poorly gauged basins can be readily applied to other catchments around the world, with only minor modifications in order to achieve meaningful predictions and a full representation of the spatial distribution of groundwater recharge even in the absence of plentiful groundwater observation points.
Table A1Recharge of all formations and aquifer groups in all of Wadi Natuf, detailed by groups of physical features (as coefficients and annual recharge rates).
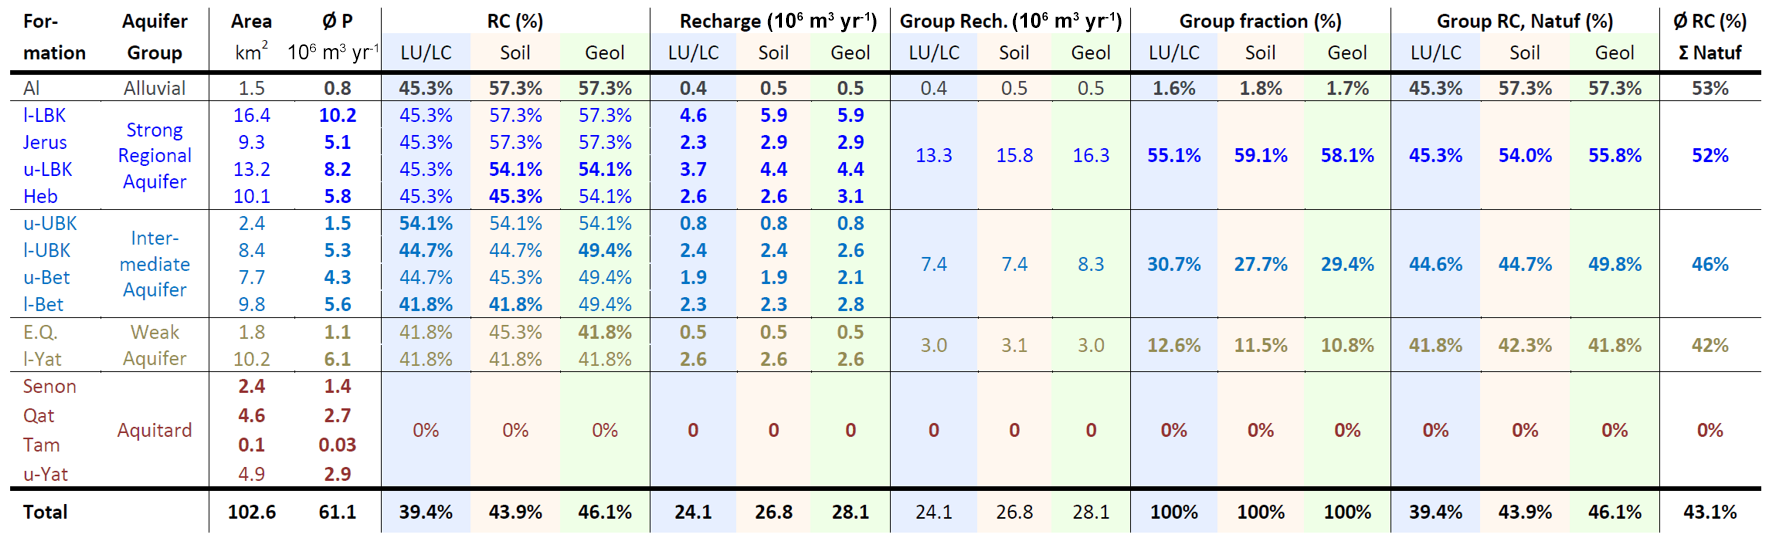
Note that the above values are surface-catchment-based, including both WAB and EAB. The table indicates the outcrop area of each formation in Wadi Natuf and the respective area rainfall (here taken as area average and 7-year average for the sake of comparison).
Table A1 below lists the detailed results of the regionalisation of RC values for individual formations (see also Table 4) and independently for each group of physical features. The table refers to the entire catchment, including WAB, EAB and the erosion zone between the two. The arithmetic mean of the results of all three physical feature groups is indicated in the column to the right. The ranges of recharge coefficient for individual formations lay between 57 % and 0 % of annual rainfall, each depending on the individual land use, geology and soil type conditions of the formation. The order of formations in this table is listed as groups of differing aquifer potential (second column from the left), from the very permeable and productive regional aquifers reaching on average of all three physical feature groups to over 50 % RC (strong blue) down to on average 42 % RC for the weak, somewhat aquitardal local aquifers (brown fonts). The aquitards are assumed to be impermeable and contributing no recharge. The relative weight of recharge of each aquifer type group is indicated under “group fraction”, indicating the contribution of each group of respective aquifer types between almost 60 % (regional aquifers) and only 10 % (weak aquifers) of total recharge, summing to 100 %.
The average of total area recharge in Wadi Natuf as arithmetic mean of the three physical landscape feature groups lies at 43.1 %. It should be noted that although the regionalisation was performed for each group of physical features independently, the differences in individual formations equal out to very similar overall recharge rates of approximately 27±2 ×10⁶ m3 yr−1 (or as percentage, between 39 % and 46 %), as average over the 7-year measurement and modelling period.
No data sets were used in this article.
CM and AA conceived and designed the study. CM carried out field measurements, conceptualized the basin framework and performed the calculations. CM and AA performed the basin framework and regionalization validation. CM wrote the paper. Both authors read, commented on and revised the manuscript.
The contact author has declared that neither they nor their co-author has any competing interests.
This article is part of the special issue “Changes in the Mediterranean hydrology: observation and modeling”. It is not associated with a conference.
Publisher's note: Copernicus Publications remains neutral with regard to jurisdictional claims in published maps and institutional affiliations.
This paper was edited by Lionel Jarlan and reviewed by Véronique Léonardi and one anonymous referee.
Abusaada, M. J.: Flow Dynamics and Management Options in Stressed Carbonate Aquifer System, The Western Aquifer Basin, Palestine, PhD Thesis, University of Göttingen, https://d-nb.info/1042263574/34 (last access: 19 April 2017), 2011.
Aish, A. M., Batelaan, O., and De Smedt, F.: Distributed recharge estimation for groundwater modeling using WetSpass model, case study – Gaza strip, Palestine, Arab. J. Sci. Eng., 35, 155, https://doi.org/10.1007/s13369-012-0323-1, 2010.
Ali, G., Tetzlaff, D., Soulsby, C., McDonnell, J. J., and Capell, R.: A comparison of similarity indices for catchment classification using a cross-regional dataset, Adva. Water Resour., 40, 11–22, 2012.
Aliewi, A. and Messerschmid, C.: Geological Lineament and Fracture Trace Mapping of Greater Ramallah Area, unpublished GTZ report, WWSDP, GTZ, Ramallah, 12 maps by Nabulsi, S. and Wishahi, S., p. 34, 1998.
Aliewi, A., Bhandary, H., Sabarathinam, C., and Al-Qallaf, H.: A new modified chloride mass balance approach based on aquifer properties and other sources of chloride to assess rainfall recharge in brackish aquifers, Hydrol. Process., e14513, https://doi.org/10.1002/hyp.14513, 2021.
Allocca, V., Manna, F., and De Vita, P.: Estimating annual groundwater recharge coefficient for karst aquifers of the southern Apennines (Italy), Hydrol. Earth Syst. Sci., 18, 803–817, https://doi.org/10.5194/hess-18-803-2014, 2014.
Arheimer, B. and Brandt, M.: Modelling nitrogen transport and retention in the catchments of southern Sweden, Ambio, 27, 471–480, 1998.
ARIJ: The Palestinian Community Profiles and Needs Assessment, Applied Research Institute Jerusalem – Geographic Information Systems and Remote Sensing Unit, Land Use Analysis, Bethlehem, http://vprofile.arij.org/ramallah/ (last access: 27 January 2019), 2012.
Baalousha, H. M., Barth, N., Ramasomanana, F. H., and Ahzi, S.: Groundwater recharge estimation and its spatial distribution in arid regions using GIS: a case study from Qatar karst aquifer, Model. Earth Syst. Environ., 4, 1319–1329, https://doi.org/10.1007/s40808-018-0503-4, 2018.
Bartov, Y., Arkin, Y. A., Lewy, Z. E., and Mimran, Y. A.: Regional stratigraphy of Israel: a guide for geological mapping, (Hebrew), GSI-Report, Geol. Surv. Isr., Tel Aviv, http://www.gsi.gov.il/_uploads/ftp/CurrentResearch/1980/Geology-Regional-Stratigraphy-300dpi-Cleaned.pdf (last access: 19 April 2018), 1981.
Batelaan, O. and De Smedt, F.: WetSpass: a flexible, GIS based, distributed recharge methodology for regional groundwater modelling, IAHS Publ. No. 269, ISBN 1-901502-56-2, 2001.
Batelaan, O. and De Smedt, F.: GIS-based recharge estimation by coupling surface–subsurface water balances, J. Hydrol., 337, 337–355, 2007.
Berne, A., Uijlenhoet, R., and Troch, P. A.: Similarity analysis of subsurface flow response of hillslopes with complex geometry, Water Resour. Res., 41, W09410, https://doi.org/10.1029/2004WR003629, 2005.
Beven, K. J.: Uniqueness of place and process representations in hydrological modelling, Hydrol. Earth Syst. Sci., 4, 203–213, https://doi.org/10.5194/hess-4-203-2000, 2000.
Beven, K. J. and Kirkby, M. J.: A physically based, variable contributing area model of basin hydrology, Hydrolog. Sci. Bull., 42, 43–69, 1979.
Bulygina, N., McIntyre, N., and Wheater, H.: Conditioning rainfall-runoff model parameters for ungauged catchments and land management impacts analysis, Hydrol. Earth Syst. Sci., 13, 893–904, https://doi.org/10.5194/hess-13-893-2009, 2009.
Castellarin, A., Galeati, G., Brandimarte, L., Montanari, A., and Brath, A.: Regional flow-duration curves: reliability for ungauged basins, Adv. Water Resour., 27, 953–965, 2004.
Dafny, E.: Groundwater flow and solute transport within the Yarqon-Taninim aquifer, Israel, Diss. PhD Thesis, Hebrew University of Jerusalem, Jerusalem, Israel, 2009.
Dafny, E., Burg, A., and Gvirtzman, H.: Effects of Karst and geological structure on groundwater flow: The case of Yarqon-Taninim Aquifer, Israel, J. Hydrol., 389, 260–275, https://doi.org/10.1016/j.jhydrol.2010.05.038, 2010.
Dan, Y., Raz, Z., Yaalon, D. H., and Koyumdjisky, H.: Soil map of Israel, , Ministry of Agriculture, Agricultural Research Organization & Soil Conservation and Drainage Dept., Jerusalem, http://esdac.jrc.ec.europa.eu/images/Eudasm/Asia/images/maps/download/IL3002_SO.jpg (last access: 16 January 2019), 1975.
Dörhöfer, G. and Jesopait, V.: Grundwasserneubildung und ihre Ermittlung – eine Anmerkung zum Beitrag von Hölting: Modellrechnungen zur Grundwasser-neubildung, Grundwasser, 2, 77–80, https://doi.org/10.1007/s767-1997-8523-3, 1997.
Dornes, P. F., Tolson, B. A., Davison, B., Pietroniro, A., Pomeroy, J. W., and Marsh, P.: Regionalisation of land surface hydrological model parameters in subarctic and arctic environments, Phys. Chem. Earth Pt. A/B/C, 33, 1081–1089, 2008.
Dripps, W. R. and Bradbury, K. R.: A simple daily soil–water balance model for estimating the spatial and temporal distribution of groundwater recharge in temperate humid areas, Hydrogeol. J., 15, 433–444, 2007.
Eder, G., Sivapalan, M., and Nachtnebel, H. P.: Modelling water balances in an Alpine catchment through exploitation of emergent properties over changing time scales, Hydrol. Process., 17, 2125–2149, https://doi.org/10.1002/hyp.1325, 2003.
ESCWA-BGR: Inventory of shared water resources in Western Asia – Chapter 16 Western Aquifer Basin, UN-ESCWA (United Nations Economic and Social Commission for Western Asia) and BGR (Federal Institute for Geosciences and Natural Resources), Beirut, 23 pp., http://waterinventory.org/groundwater/western-aquifer-basin (last access: 14 May 2018), 2013.
Fetter C. W.: Applied Hydrogeology, Macmillan College Publishing Company, Inc., New York, ISBN 0-13-088239-9, https://arjzaidi.files.wordpress.com/2015/09/unimasr-com_e7ce669a880a8c4c70b4214641f93a02.pdf (last access: 21 February 2022), 1994.
Finch, J. W.: Estimating change in direct groundwater recharge using a spatially distributed soil water balance model, Q. J. Eng. Geol. Hydrogeol., 34, 71–83, 2001.
Franchini, M. and Pacciani, M.: Comparative analysis of several conceptual rainfall–runoff models, J. Hydrol., 122, 161–219, 1991.
Geyer, T., Birk, S., Liedl, R., and Sauter, M.: Quantification of temporal distribution of recharge in karst systems from spring hydrographs, J. Hydrol., 348, 452–463, 2008.
Goldscheider, N. and Drew, D. (Eds.): Methods in Karst Hydrogeology, in: International Contribution to Hydrogeology, IAH, vol. 26, Taylor and Francis/Balkema, London, 264 pp., ISBN 9780367388980, https://doi.org/10.1201/9781482266023, 2007.
Götzinger, J., Jagelke, J., Barthel, R., and Bárdossy, A.: Integration of water balance models in RIVERTWIN, Adv. Geosci., 9, 85–91, https://doi.org/10.5194/adgeo-9-85-2006, 2006.
GSI: Geological Map of Israel, Sheet 8-IV: Ramallah, Geological Map by: Shachnai, E., GSI – Geological Survey of Israel, Jerusalem, http://www.gsi.gov.il/eng/?CategoryID=253&ArticleID=777, (last access: 16 March 2018), 2000.
GSI: Geological Map of Israel, Sheet 8-III: Lod, Geological Map by: Yechieli, Y., GSI – Geological Survey of Israel, Jerusalem, http://www.gsi.gov.il/eng/?CategoryID=253&ArticleID=778 (last access: 16 March 2018), 2008.
Guttman, J. and Zukerman, H.: Yarqon-Taninim-Beer Sheeba Basin, flow model, Tahal Consult. Eng., Tel Aviv, Israel, 37 pp., https://link.springer.com/chapter/10.1007/978-3-030-51148-7_2 (last access: 21 February 2022), 1995.
Hartmann, A., Lange, J., Weiler, M., Arbel, Y., and Greenbaum, N.: A new approach to model the spatial and temporal variability of recharge to karst aquifers, Hydrol. Earth Syst. Sci., 16, 2219–2231, https://doi.org/10.5194/hess-16-2219-2012, 2012a.
Hartmann, A., Kralik, M., Humer, F., Lange, J., and Weiler, M.: Identification of a karst system's intrinsic hydrodynamic parameters: upscaling from single springs to the whole aquifer, Environ. Earth Sci., 65, 2377–2389, https://doi.org/10.1007/s12665-011-1033-9, 2012b.
Hartmann, A., Weiler, M., Wagener, T., Lange, J., Kralik, M., Humer, F., Mizyed, N., Rimmer, A., Barberá, J. A., Andreo, B., Butscher, C., and Huggenberger, P.: Process-based karst modelling to relate hydrodynamic and hydrochemical characteristics to system properties, Hydrol. Earth Syst. Sci., 17, 3305–3321, https://doi.org/10.5194/hess-17-3305-2013, 2013.
Hingray, B., Schaefli, B., Mezghani, A., and Hamdi, Y.: Signature-based model calibration for hydrological prediction in mesoscale Alpine catchments, Hydrolog. Sci. J., 55, 1002–1016, 2010.
Hrachowitz, M., Savenije, H. H., Blöschl, G., McDonnell J. J., Sivapalan, M., Pomeroy, J. W., Arheimer, B., Blume T., Clark, M. P., Ehret, U., and Fenicia, F.: A decade of Predictions in Ungauged Basins (PUB) – a review, Hydrolog. Sci. J., 58, 1198–1255, https://doi.org/10.1080/02626667.2013.803183, 2013.
Hughes, A. G., Mansour, M. M., and Robins, N. S.: Evaluation of distributed recharge in an upland semi-arid karst system: the West Bank Mountain Aquifer, Middle East, Hydrogeol. J., 16, 845–854, https://doi.org/10.1007/s10040-008-0273-6, 2008.
Jaafarzadeh, M. S., Tahmasebipour, N., Haghizadeh, A., Pourghasemi, H. R., and Rouhani, H.: Groundwater recharge potential zonation using an ensemble of machine learning and bivariate statistical models, Sci. Rep., 11, 5587, https://doi.org/10.1038/s41598-021-85205-6, 2021.
Jebreen, H., Wohnlich, S., Wisotzky, F., Banning, A., Niedermayr, A., and Ghanem, M.: Recharge estimation in semi-arid karst catchments: Central West Bank, Palestine, Grundwasser, 23, 91–101, 2018.
Keshet, N. and Mimran, Y.: Landuse mapping – Ramallah area, unpublished report in Hebrew, Geological Survey of Israel, GSI/14/93, Jerusalem, LRC: Land Cover Mapping, unpubl. digital version of satellite imagery-based GIS maps (scale 1:150 000), 1993.
Lerner, D. N., Issar, A. S., and Simmers, I.: Groundwater recharge: A guide to understanding and estimating natural recharge, in: International Contributions to Hydrogeology, Vol. 8, Verlag Heinz Heise, Hannover, 375 pp., ISBN 3-922705-91-X, https://doi.org/10.2134/jeq1992.00472425002100030036x, 1990.
LRC – Land Research Center: Land Cover Mapping. Digital version of satellite imagery based GIS maps, scale , Arab Studies Society – LRC, El-Bireh, unpublished, 2004.
MacDonald, A. M., Lark, R. M., Taylor, R. G., Abiye, T., Fallas, H. C., Favreau, G., Goni, I. B., Kebede, S., Scanlon, B., Sorensen, J. P. R., Tijani, M., Upton, K. A., and West, C.: Mapping groundwater recharge in Africa from ground observations and implications for water security, Environ. Res. Lett., 16, 034012, https://doi.org/10.1088/1748-9326/abd661, 2021.
Marei, A., Khayat, S., Weise, S., Ghannam, S., Sbaih, M., and Geyer, S.: Estimating groundwater recharge using the chloride mass-balance method in the West Bank, Palestine, Hydrolog. Sci. J., 55, 780–791, 2010.
Martínez-Santos, P. and Andreu, J. M.: Lumped and distributed approaches to model natural recharge in semiarid karst aquifers, J. Hydrol., 388, 389–398, https://doi.org/10.1016/j.jhydrol.2010.05.018, 2010.
Martos-Rosillo, S., González-Ramón, A., Jiménez-Gavilán, P., Andreo, B., Durán, J. J., and Mancera, E.: Review on groundwater recharge in carbonate aquifers from SW Mediterranean (Betic Cordillera, S Spain), Environ. Earth Sci., 74, 7571–7581, https://doi.org/10.1007/s12665-015-4673-3, 2015.
Masih, I., Uhlenbrook, S., Maskey, S., and Ahmad, M. D.: Regionalization of a conceptual rainfall–runoff model based on similarity of the flow duration curve: a case study from the semi-arid Karkheh basin, Iran, J. Hydrol., 391, 188–201, 2010.
McDonnell, J. J. and Woods, R.: On the need for catchment classification, J. Hydrol., 299, 2–3, 2004.
McDonnell, J. J., Sivapalan, M., Vaché, K., Dunn, S., Grant, G., Haggerty, R., Hinz, C., Hooper, R., Kirchner, J., Roderick, M. L., Selker, J., and Weiler, M.: Moving beyond heterogeneity and process complexity: a new vision for catchment hydrology, Water Resour. Res., 43, W07301, https://doi.org/10.1029/2006WR005467, 2007.
Messerschmid, C.: Feedback between societal change and hydrological response in Wadi Natuf, a karstic mountainous watershed in the occupied Palestinian Westbank, Proc. IAHS, 364, 261–266, https://doi.org/10.5194/piahs-364-261-2014, 2014.
Messerschmid, C., Kalbouneh, A., Zayed, O., and Sayfi, E.: Conceptual Model of Wadi Natuf Groundwater Recharge, Final Report – SUSMAQ-NAT # 64 V 0.3, The Sustainable Management for the West Bank and Gaza Aquifers, Palestinian Water Authority (Palestine) and University of Newcastle upon Tyne (UK), November 2003, Ramallah, 19 pp., http://hwe.org.ps/Projects/SUSMAQ_Reports/Wadi Natuf catchment area/Conceptual Model of Wadi Natuf Groundwater Recharge.pdf (last access: 21 March 2020), 2003a.
Messerschmid, C., Aliewi, A., Kalbouneh, A., Sayfi, E., and Ziada, M.: Field trips to the springs in Wadi Natuf, Final Report – SUSMAQ-NAT # 65 V 0.,. The Sustainable Management for the West Bank and Gaza Aquifers, Palestinian Water Authority (Palestine) and University of Newcastle upon Tyne (UK), Ramallah, July 2003, 21 pp., http://hwe.org.ps/Projects/SUSMAQ_Reports/Wadi Natuf catchment area/Field trips to the springs in Wadi Natuf.pdf (last access: 21 March 2020), 2003b.
Messerschmid, C., Lange, J., and Sauter, M.: Assessment of transmission loss in a Mediterranean karstic watershed (Wadi Natuf, West Bank), Hydrol. Process., 32, 1375–1390, https://doi.org/10.1002/hyp.11496, 2018.
Messerschmid, C., Sauter, M., and Lange, J.: Field-based estimation and modelling of distributed groundwater recharge in a Mediterranean karst catchment, Wadi Natuf, West Bank, Hydrol. Earth Syst. Sci., 24, 887–917, https://doi.org/10.5194/hess-24-887-2020, 2020.
Mohan, C., Western, A. W., Wei, Y., and Saft, M.: Predicting groundwater recharge for varying land cover and climate conditions – a global meta-study, Hydrol. Earth Syst. Sci., 22, 2689–2703, https://doi.org/10.5194/hess-22-2689-2018, 2018.
Oudin, L., Kay, A., Andréassian, V., and Perrin, C.: Are seemingly physically similar catchments truly hydrologically similar?, Water Resour. Res., 46, W11558, https://doi.org/10.1029/2009WR008887, 2010.
Pallard, B., Castellarin, A., and Montanari, A.: A look at the links between drainage density and flood statistics, Hydrol. Earth Syst. Sci., 13, 1019–1029, https://doi.org/10.5194/hess-13-1019-2009, 2009.
Parajka, J., Merz, R., and Blöschl, G.: A comparison of regionalisation methods for catchment model parameters, Hydrol. Earth Syst. Sci., 9, 157–171, https://doi.org/10.5194/hess-9-157-2005, 2005.
Pomeroy, J.: IAHS Decade for Predictions in Ungauged Basins, PUB – Advances and Prospects, Presentation at IAHS-PUB, 11 May, 2011, Canmore, Canada, http://www.usask.ca/hydrology/pub2011/presentations/Pomeroy_PUB2011_Weds11May.pdf (last access: 17 December 2018), 2011.
Radulovič, M. M., Stevanović, Z., and Radulovič, M.: A new approach in assessing recharge of highly karstified terrains – Montenegro case studies, Environ. Earth Sci., 65, 2221–2230, https://doi.org/10.1007/s12665-011-1378-0, 2011.
Richts, A., Struckmeier, W., and Zaepke, M.: WHYMAP and the Groundwater Resources of the World 1:25,000,000, in: Sustaining Groundwater Resources. International Year of Planet Earth, edited by: Jones J., Springer, https://doi.org/10.1007/978-90-481-3426-7_10, 2011.
Ries, F., Lange, J., Schmidt, S., Puhlmann, H., and Sauter, M.: Recharge estimation and soil moisture dynamics in a Mediterranean, semi-arid karst region, Hydrol. Earth Syst. Sci., 19, 1439–1456, https://doi.org/10.5194/hess-19-1439-2015, 2015.
Rofe and Raffety Consulting Engineers: Jerusalem and District Water Supply: Geological and Hydrological Report, Report to the Central Water Authority of the Hashemite Kingdom of Jordan, Rofe and Raffety Consulting Engineers, London, Hashemite Kingdom of Jordan, Central Water Authority, Amman, 1963.
Rosenzweig, A.: Study of the difference in effects of forest and other vegetative covers on water yield, Final report, Project A-10-FS-13, State of Israel, Ministry of Agriculture, Soil Conservation and Drainage Division Research Unit, Rishon LeTsiyon, Israel, https://agris.fao.org/agris-search/search.do?recordID=US201300497925 (last access: 21 February 2022), 1972.
Sanz, E., Menéndez Pidal de Navascués, I., and Táávara, C.: Calculating the average natural recharge in large areas as a factor of their lithology and precipitation, Hydrol. Earth Syst. Sci. Discuss., 8, 4753–4788, https://doi.org/10.5194/hessd-8-4753-2011, 2011.
Savenije, H. H. G.: HESS Opinions “Topography driven conceptual modelling (FLEX-Topo)”, Hydrol. Earth Syst. Sci., 14, 2681–2692, https://doi.org/10.5194/hess-14-2681-2010, 2010.
Sawicz, K., Wagener, T., Sivapalan, M., Troch, P. A., and Carrillo, G.: Catchment classification: empirical analysis of hydrologic similarity based on catchment function in the eastern USA, Hydrol. Earth Syst. Sci., 15, 2895–2911, https://doi.org/10.5194/hess-15-2895-2011, 2011.
Scanlon, B. R., Keese, K. E. A., Flint, L., Flint, L. E., Gaye, C. B., Edmunds, W. M., and Simmers, I.: Global synthesis of groundwater recharge in semiarid and arid regions, Hydrol. Process., 20, 3335–3370, https://doi.org/10.1002/hyp.6335, 2006.
Schmidt, S., Geyer, T., Marei, A., Guttman, J., and Sauter, M.: Quantification of long-term wastewater impacts on karst groundwater resources in a semi-arid environment by chloride mass balance methods, J. Hydrol., 502, 177–190, 2013.
Schmidt, S., Geyer, T., Guttman, J., Marei, A., Ries, F., and Sauter, M.: Characterisation and modelling of conduit restricted karst aquifers – example of the Auja spring, Jordan Valley, J. Hydrol., 511, 750–763, 2014.
Sheffer, N. A.: Variable scale recharge measurement and modeling using the hydrometeorological DREAM, PhD dissertation, Hebrew Univ. of Jerusalem, Israel, 97 pp., http://shemer.mslib.huji.ac.il/dissertations/W/JSL/001492847.pdf (last access: 21 February 2022), 2009.
Sheffer, N. A., Dafny, E., Gvirtzman, H., Navon, S., Frumkin, A., and Morin, E.: Hydrometeorological daily recharge assessment model (DREAM) for the Western Mountain Aquifer, Israel: Model application and effects of temporal patterns, Water Resour. Res., 46, W05510, https://doi.org/10.1029/2008WR007607, 2010.
Sivakumar, B., Singh, V. P., Berndtsson, R., and Khan, S. K.: Catchment classification framework in hydrology: challenges and directions, J. Hydrol. Eng., 20, A4014002, https://doi.org/10.1061/(ASCE)HE.1943-5584.0000837, 2013.
Sivapalan, M., Takeuchi, K., Franks, S. W., Gupta, V. K., Karambiri, H., Lakshmi, V., Liang, X., McDonnell, J. J., Mendiondo, E. M., O'Connell, P. E., Oki, T., Pomeroy, J. W., Schertzer, D., Uhlenbrook, S., and Zehe, E.: IAHS Decade on Predictions in Ungauged Basins (PUB), 2003–2012: Shaping an exciting future for the hydrological sciences, Hydrol. Sci. J., 48, 857–880, https://doi.org/10.1623/hysj.48.6.857.51421, 2003a.
Sivapalan, M., Blöschl, G., Zhang, L., and Vertessy, R.: Downward approach to hydrological prediction, Hydrol. Process., 17, 2101–2111, 2003b.
SUSMAQ: Compiled Base Data for the Numerical Groundwater Flow Model of the Western Aquifer Basin. Volume 1 – General Background, SUSMAQ-MOD Report No. #07 V0.4, The Sustainable Management for the West Bank and Gaza Aquifers, Palestinian Water Authority and University of Newcastle upon Tyne, UK, Ramallah, Palestine, 306 pp., http://hwe.org.ps/Projects/SUSMAQ_Reports/Flow Modeling/Compiled Base Data for the Numerical Groundwater Flow Model of (last access: 21 March 2020), 2002.
SUSMAQ: Boundaries of the Western Aquifer Basin and the Eocene Aquifer in the Northeastern Aquifer Basin, SUSMAQ-MOD Report No. # 6.1 V1.0, The Sustainable Management for the West Bank and Gaza Aquifers, Palestinian Water Authority and University of Newcastle upon Tyne, UK, Ramallah, Palestine, 56 pp., http://www.hwe.org.ps/Projects/SUSMAQ_Reports/FlowModeling/Boundaries.pdf (last access: 2 April 2015), 2001.
Tillman, F. D., Pool, D. R., and Leake, S. A.: The Effect of Modeled Recharge Distribution on Simulated Groundwater Availability and Capture, Groundwater, 53, 378–388, https://doi.org/10.1111/gwat.12210, 2015.
Weiss, M. and Gvirtzman, H.: Estimating ground water recharge using flow models of perched karstic aquifers, Groundwater, 45, 761–773, 2007.
Winsemius, H. C., Schaefli, B., Montanari, A., and Savenije, H. H. G.: On the calibration of hydrological models in ungauged basins: A framework for integrating hard and soft hydrological information, Water Resour. Res., 45, W12422, https://doi.org/10.1029/2009WR007706, 2009.
Woods, R. A.: Seeing catchments with new eyes, Hydrol. Process., 16, 1111–1113, 2002.
World Bank: West Bank & Gaza: Assessment of Restrictions on Palestinian Water Sector Development, Washington, DC, https://openknowledge.worldbank.org/handle/10986/3056 (last access: 21 February 2022), 2009.
Yadav, M., Wagener, T., and Gupta, H.: Regionalization of constraints on expected watershed response behavior for improved predictions in ungauged basins, Adv. Water Resour., 30, 1756–1774, 2007.
Zomlot, Z., Verbeiren, B., Huysmans, M., and Batelaan, O.: Spatial distribution of groundwater recharge and base flow: Assessment of controlling factors, J. Hydrol.: Reg. Stud., 4, 349–368, https://doi.org/10.1016/j.ejrh.2015.07.005, 2015.