the Creative Commons Attribution 4.0 License.
the Creative Commons Attribution 4.0 License.
 | 05 Jan 2021
Using multiple methods to investigate the effects of land-use changes on groundwater recharge in a semi-arid area
Ian Cartwright
P. Evan Dresel
Edoardo Daly
Understanding the applicability and uncertainties of methods for documenting recharge rates in semi-arid areas is important for assessing the successive effects of land-use changes and understanding groundwater systems. This study focuses on estimating groundwater recharge rates and understanding the impacts of land-use changes on recharge rates in a semi-arid area in southeast Australia. Two adjacent catchments were cleared ∼180 years ago following European settlement, and a eucalypt plantation forest was subsequently established ∼15 years ago in one of the catchments. Chloride mass balance analysis yields recharge rates of 0.2 to 61.6 mm yr−1 (typically up to 11.2 mm yr−1). The lower of these values probably represents recharge rates prior to land clearing, whereas the higher likely reflects recharge rates following the initial land clearing. The low pre-land-clearing recharge rates are consistent with the presence of old groundwater (residence times up to 24 700 years) and the moderate-to-low hydraulic conductivities (0.31 to 0.002 m d−1) of the aquifers. Recharge rates estimated from tritium activities and water table fluctuations reflect those following the initial land clearing. Recharge rates estimated using water table fluctuations (15 to 500 mm yr−1) are significantly higher than those estimated using tritium renewal rates (0.01 to 89 mm yr−1; typically <14.0 mm yr−1) and approach the long-term average annual rainfall (∼640 mm yr−1). These recharge rates are unrealistic given the estimated evapotranspiration rates of 500 to 600 mm yr−1 and the preservation of old groundwater in the catchments. It is likely that uncertainties in the specific yield results in the water table fluctuation method significantly overestimating recharge rates, and despite the land-use changes, the present-day recharge rates are relatively modest. These results are ultimately important for assessing the impacts of land-use changes and management of groundwater resources in semi-arid regions in Australia and elsewhere.
- Article
(4371 KB) - Full-text XML
-
Supplement
(107 KB) - BibTeX
- EndNote


Groundwater is a critical resource for meeting the expanding urban, industrial and agricultural water requirements, especially in semi-arid areas that lack abundant surface water resources (de Vries and Simmers, 2002; Siebert et al., 2010). Groundwater also makes a significant contribution to the streamflow of rivers in semi-arid areas. Land-use changes may modify groundwater recharge rates, which thus affect groundwater systems as well as groundwater resources (Foley et al., 2005; Lerner and Harris, 2009; Owuor et al., 2016). In many semi-arid regions, there has been the conversion of native forests to agricultural land (Foley et al., 2005). Deep-rooted trees generally return more water to the atmosphere via transpiration than shallow-rooted crops and grasses (Hewlett and Hibbert, 1967; Bosch and Hewlett, 1982; Fohrer et al., 2001). In southeast Australia, the reduction in evapotranspiration following the land clearing has commonly resulted in a net increase in recharge and a rise of the regional water tables. In turn, this has resulted in waterlogging and salinization of cleared lands and increased stream salinity (Allison et al., 1990). Eucalyptus tree plantations were subsequently initiated partially to reduce groundwater recharge and thus prevent the rise of regional water tables (Gee et al., 1992; Benyon et al., 2006). In order to assess the impacts of successive land-use changes on the groundwater and surface water systems, estimates of recharge are required. Estimation of recharge rates is also important for groundwater modelling, because recharge represents the water flux used as a boundary condition at the water table.
Recharge is the water that infiltrates through the unsaturated zone to the water table and thus increases the volume of water stored in the saturated zone (Lerner et al., 1990; Healy and Cook, 2002; Scanlon et al., 2002; Moeck et al., 2020). A distinction between gross and net recharge may also be made (Crosbie et al., 2005). The total amount of water that reaches the water table is the gross recharge, while the net recharge accounts for the subsequent removal of water from the saturated zone by evapotranspiration. In areas with shallow water tables and deep-rooted vegetation, this subsequent water loss can be considerable. Estimating groundwater recharge rates, in general, is not straightforward (Lerner et al., 1990; Healy, 2010; Moeck et al., 2020), and recharge rates potentially vary in space and time (Sibanda et al., 2009).
Several techniques may be used to estimate groundwater recharge, including Darcy's law, measuring water infiltration using lysimeters installed in the unsaturated zone, measuring and modelling soil moisture contents, use of heat flow calculations, catchment water budgets, remote sensing, numerical models, water table fluctuations, chemical (chloride) mass balance calculations, and/or the concentrations of radioisotopes such as 3H (tritium), 14C (carbon), 36Cl (chloride), or other time-sensitive tracers (e.g., chlorofluorocarbons) in groundwater (Scanlon et al., 2002, 2006; Healy, 2010; Doble and Crosbie, 2017; Cartwright et al., 2017; Moeck et al., 2020; Gelsinari et al., 2020).
Different techniques estimate recharge over different spatial and temporal scales, and they may thus yield different results (Scanlon et al., 2002). Because each technique has different uncertainties and limitations, it is recommended that multiple methods are used to constrain recharge (Healy and Cook, 2002; Scanlon et al., 2006). Understanding the broader hydrogeology also helps to understand recharge. For example, areas where recharge rates are high should contain high proportions of young groundwater. Additionally, recharge rates are likely to be low if evapotranspiration rates approach rainfall totals.
This study estimates recharge rates using Cl mass balance, water table fluctuations, and 3H renewal rate methods in a semi-arid area that has undergone successive land-use changes. We evaluate the applicability and uncertainties of these commonly applied methods to determine the changes in recharge rates caused by these successive land-use changes. While based on a specific area, the results of this study, in particular the comparison of present-day recharge rate estimates, will be applicable to similar semi-arid areas in southeast Australia and elsewhere. Specifically, predicting the impacts of changes to land-use changes on recharge rates is required to understand and manage waterlogging and salinization of soils and streams. A brief description of the assumptions and limitations of these techniques is provided below.
1.1 Cl mass balance
The Cl mass balance (CMB) approach yields average regional net recharge rates (Bazuhair and Wood, 1996; Scanlon, 2000; Scanlon et al., 2002). The assumptions of this method are that all Cl in groundwater originates from rainfall and that Cl exported in surface runoff is negligible or well known. Under these conditions, the net groundwater recharge (Rnet in mm yr−1) is estimated from
(Eriksson and Khunakasem, 1969), where P is mean annual precipitation (mm yr−1), Clp is the weighted mean Cl concentration in precipitation (mg L−1) and Clgw is Cl concentration in groundwater (mg L−1). The CMB method estimates net recharge rates averaged over the time that the Cl contained within the groundwater is delivered; this may be several years to millennia. Uncertainties in the CMB method are mainly the long-term rate of Cl delivery and the assumption that runoff has remained negligible over time.
1.2 Water table fluctuations
Water table fluctuations may be used to estimate gross recharge rates over the time period for which groundwater elevation data are available. Because bore hydrograph data are abundant, this probably is the most common method of estimating present-day recharge rates. The water table fluctuation (WTF) method strictly requires the water table to be located within the screened interval of the bore; however, it can be used in bores screened within a few metres of the water table (Healy and Cook, 2002). The method assumes that evapotranspiration from the water table has not occurred, the rise in the water table is solely due to recharge following rainfall events, groundwater elevations are not influenced by pumping and the water table falls in the absence of recharge. Rgross is calculated from
where Sy is the specific yield (dimensionless) of the aquifer, and Δh∕Δt is the variation in the hydraulic head over the recharge event (mm yr−1, where there is an annual recharge event).
Despite its simplicity, there are several potential uncertainties in the WTF method. Sy is not commonly measured, and most studies rely on typical values based on aquifer materials. More importantly, the retention of moisture in the unsaturated zone between recharge events reduces Sy and results in Sy being spatially and temporally variable (Gillham, 1984; Sophocleous, 1985; Healy and Cook, 2002; Crosbie et al., 2019). However, many recharge studies assume that Sy is constant and close to the effective porosity. This may result in the WTF method significantly overestimating recharge rates (Gillham, 1984; Sophocleous, 1985; Crosbie et al., 2019). Other processes may also affect head measurements. These include entrapment of air during rapid recharge events (the Lisse effect) and the impacts of barometric pressure changes and ocean or Earth tides, especially when the head is measured using sealed pressure transducers (Crosbie et al., 2005). The estimation of the recession curve of the groundwater hydrograph used to calculate Δh in Eq. (2) also involves some judgement.
1.3 3H renewal rate
The 3H renewal rate (TRR) method envisages that recharge mixes with pre-existing groundwater in a discrete zone at the top of the aquifer with an equivalent amount of water from this upper zone displaced lower into the groundwater system. The renewal rate (Rn) represents the proportion of new water added in each recharge cycle. If there is an annual cycle of groundwater recharge, the 3H activity of groundwater in year i () is related to Rn by
(Leduc et al., 2000; Le Gal La Salle et al., 2001; Favreau et al., 2002), where λt is the radioactive decay constant for 3H (0.0563 yr−1), and is the average 3H activity of rainfall in year i (in Tritium Units, TU, where 1 TU corresponds to ). The application of the TRR method requires the 3H input function over the past few decades to be known. The 3H activities of Southern Hemisphere groundwater recharged during the 1950s and 1960s atmospheric tests were several orders of magnitude lower than Northern Hemisphere groundwater (Morgenstern et al., 2010; Tadros et al., 2014). These 3H activities have now decayed and are lower than those of present-day rainfall, which results in individual 3H activities yielding a single Rn estimate (Cartwright et al., 2007, 2017, 2020); however, this is not yet the case in the Northern Hemisphere (Le Gal La Salle et al., 2001).
Groundwater recharge rates are related to Rn by
where b is the thickness of the upper part of the aquifer system that receives annual recharge, and n is the effective porosity. Uncertainties in the TRR estimates include uncertainties in the 3H input function and having to estimate b and n, which may be variable and not well defined. The recharge rates are net estimates averaged over the residence time of groundwater in the upper part of the aquifer, which in an ideal system is .
Gatum is situated in western Victoria, southeast Australia (Fig. 1a). The native eucalyptus forests in this region were originally cleared for grazing following European settlement ∼180 years ago (Lewis, 1985) and then partially replaced by eucalyptus plantation in the last ∼15 years (Adelana et al., 2015). Gatum lies in the regional recharge area of the Glenelg River basin to the south of the drainage divide between the Glenelg and Wannon rivers, and surface water drains to the Wannon River via the Dundas River (Dresel et al., 2012). The area is predominantly composed of fine- to coarse-grained weathered Early Devonian ignimbrites containing abundant, large, locally derived clasts near their base (Cayley and Taylor, 1997). Post-Permian weathering has produced a deeply weathered saprolitic clay-rich regolith and ferruginous laterite duricrust (Brouwer and Fitzpatrick, 2002). Some of the drainage areas contain Quaternary alluvium and colluvium (Adelana et al., 2015).

Figure 1(a) Map of the Gatum pasture and forest catchments with the locations of groundwater bores (3007 and 3008, 3666 and 3667, and 3656 and 3657 are nested bores); shallow piezometers are at PD (pasture drainage zone), PB (pasture lower slope), FD (forest drainage zone) and FB (forest lower slope). The catchment boundaries for the streams are from Dresel et al. (2018). (b) Mean hydraulic heads of groundwater from 2010 to 2017 except for 3008 (from 2010 to 2015) and 3658 (from 2010 to 2016) with sample depths and flow directions. Background ArcGIS® 10.5 image (Esri, HERE, Garmin, © OpenStreetMap contributors and the GIS User Community, Source: Esri, DigitalGlobe, GeoEye, Earthstar Geographics, CNESAirbus DS, USDA, USGS, AeroGRID, IGN, and the GIS User Community).
The study area consists of two catchments with contrasting land uses, one catchment is predominately dryland pasture used for sheep grazing and the other is mostly occupied by plantation Eucalyptus globulus forestry. The pasture catchment is around 151 ha and is typical of the cleared land in this region. It is covered by perennial grasses with about 3 % remnant eucalyptus trees. The forest catchment is around 338 ha and comprises approximately 62 % plantation forest, established in 2005, and 38 % grassland (Adelana et al., 2015). The elevations of the pasture and forest catchments range from 236 to 261 m and 237 to 265 m AHD (Australian Height Datum), respectively (Fig. 2). The two catchments were subdivided into the upper slope, mid-slope and lower slope, based on the elevation of the study area; the drainage zones are in the riparian zones of the small streams (Dresel et al., 2018). The catchments are drained by two small intermittent streams (Banool and McGill; Fig. 1a) that export ∼8 % of annual rainfall (Adelana et al., 2015; Dresel et al., 2018).
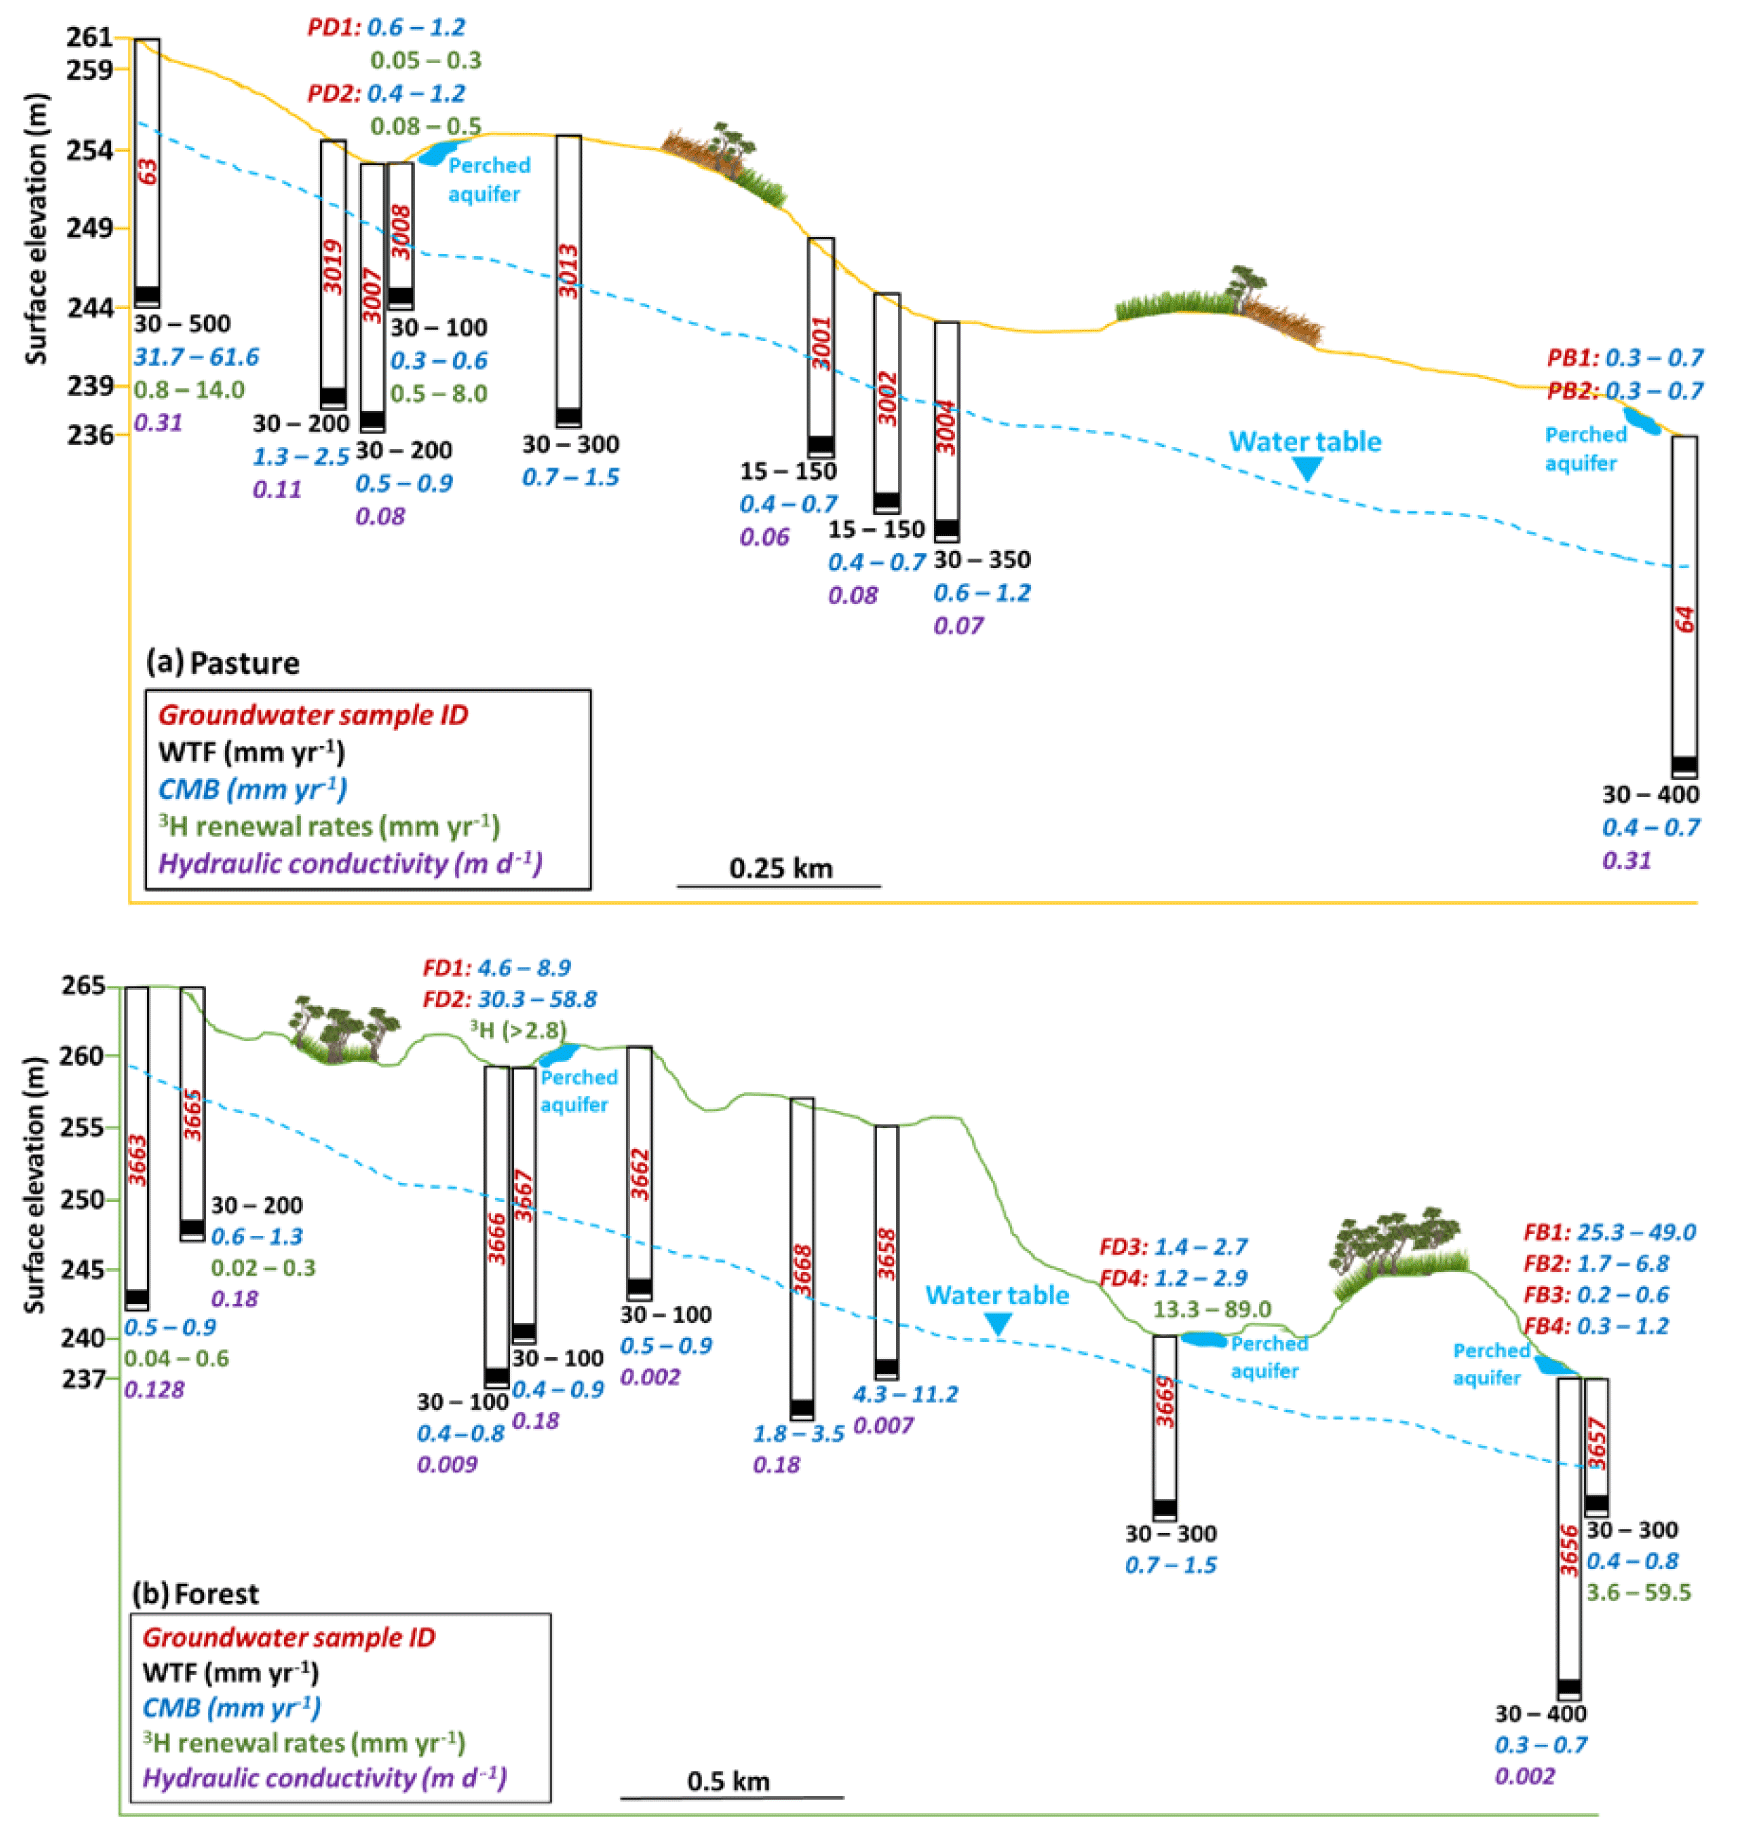
Figure 2Simplified cross sections of (a) pasture and (b) forest catchments showing variability of groundwater recharge estimated via WTF, CMB, 3H methods and variable hydraulic conductivity of the aquifer lithologies. Transects are in Fig. 1a. PD and FD represent the shallow groundwater in the pasture drainage and forest drainage areas, respectively. Data are from Table 1.
The regional groundwater is not extensively used in this area. However, the study area is one of many in southeast Australia that was identified as being impacted by dryland salinity due to land clearing and rising water tables (Clark and Harvey, 2008). During the Millennium Drought in the first decade of the century, the water tables dropped considerably and the emphasis on dryland salinity diminished. The focus of water management in this area switched from salinity to water sustainability and the effect of land-use changes on the water balance of this area (Dresel et al., 2012). In addition to the regional groundwater system, shallow (1 to 4 m deep) perched groundwater exists in the riparian zones (Brouwer and Fitzpatrick, 2002; Adelana et al., 2015).
The climate is characterized by cool, wet winters and hot, dry summers (Köppen–Geiger zone Bsk). From 1884 to 2018, the average annual rainfall at Cavendish (station 089009) ∼19 km southeast of Gatum (Fig. 1a) was ∼640 mm (Bureau of Meteorology, 2020), with most rainfall in the austral winter between May and October (Fig. 3a). Average annual actual evapotranspiration across the two catchments between 2011 and 2016 was estimated at about 580 mm (Dresel et al., 2018). The mean concentrations of Cl in rainfall range from 2.2 mg L−1 at Cavendish (Hutton and Leslie, 1958) to 4.4 mg L−1 at Hamilton (∼34 km southeast of Gatum, Fig. 1a; Bormann, 2004; Dean et al., 2014). Similar Cl concentrations were recorded in rainfall across much of southeast Australia (Blackburn and McLeod, 1983; Crosbie et al., 2012).

Figure 3(a) Daily rainfall at Cavendish (station 089009, ∼19 km southeast of Gatum). Variation in groundwater heads from bores in (b) pasture and (c) forest (Dresel et al., 2018). The legend shows the sample depths (in parentheses) and landscape positions.
3.1 Water sampling
There are 19 monitoring bores at different landscape positions sampling the regional groundwater in the pasture and forest catchments (Fig. 1a) with sample depths ranging from 1.3 to 29.7 m (Table S1 in the Supplement). Hydraulic heads have been measured since 2010 at four-hourly intervals using In Situ AquaTROLL or Campbell CS450 WL pressure loggers corrected for barometric pressure variations using In Situ BaroTROLL loggers. Occasional spikes (generally resulting from the logger being removed from the bores) were removed. Twelve shallow piezometers (∼1 m deep with ∼10 cm wide screens at their base) were installed in 2018 near the monitoring bores in the drainage zones and the lower slopes of the pasture and forest catchments (Fig. 1a). These piezometers intercept the riparian groundwater that in places is perched above the regional groundwater. Regional groundwater was sampled from bores (n=24) and riparian groundwater from shallow piezometers (n=24) between May and November 2018. The groundwater samples were collected from the screened interval using a submersible pump or bailer following the removal of at least three bore volumes of groundwater or removing all water and allowing it to recover. Following sampling, hydraulic conductivities (Ks, m d−1) were determined from the rate of recovery of the groundwater levels measured at 3 min intervals using an In Situ AquaTROLL pressure logger (Hvorslev, 1951). A 1-year aggregated rainwater sample was collected in a narrow-mouthed container with an open funnel. The sample was periodically removed from the container and aggregated into a single sample.
3.2 Analytical techniques
Geochemical data are presented in Table S1. Electrical conductivity (EC) was measured in the field using a calibrated handheld TPS WP-81 multimeter and probe. Groundwater samples were collected in high-density polyethylene bottles and stored at ∼4 ∘C prior to analysis. Alkalinity (HCO3) concentrations were measured within 12 h of sampling by titration. Major ion concentrations were measured at Monash University. Cation concentrations were determined on filtered (0.45 µm cellulose nitrate filters) water samples that were acidified to pH < 2 with double-distilled 16 N HNO3 using inductively coupled plasma optical emission spectrometry (ICP-OES) (Thermo Scientific iCAP 7000). Concentrations of anions were determined on unacidified filtered water samples by ion chromatography (Thermo Scientific Dionex ICS-1100). Based on replicate analyses, the precision of cation and anion concentrations are ±2 %; from the analysis of certified standards, accuracy is estimated at ±5 %. Total dissolved solids (TDS) concentrations are the sum of the cation and anion concentrations.
3H and 14C activities were measured at the Institute of Geological and Nuclear Sciences (GNS) in New Zealand. Samples for 3H activities were measured by liquid scintillation in Quantulus ultra-low-level counters following vacuum distillation and electrolytic enrichment as described by Morgenstern and Taylor (2009). The quantification limits are 0.02 TU and the relative uncertainties are typically ±2 % (Table S1). 14C activities (a14C) were measured by AMS following Stewart et al. (2004). Dissolved inorganic carbon (DIC) was converted to CO2 by acidification with H3PO4 in a closed evacuated environment. The CO2 was purified cryogenically and converted to graphite. 14C activities are normalized using the δ13C values and expressed as percent modern carbon (pMC), where the 14C activity of modern carbon is 95 % of 14C activity of the NBS (National Bureau of Standards) oxalic acid standard in 1950. Uncertainties are between 0.27 and 0.35 pMC (Table S1).
3.3 Recharge calculations
Recharge rates were estimated using the methods discussed in Sect. 1.1 to 1.3. Net recharge rate estimates from the CMB (Eq. 1) utilized present-day average rainfall amounts (∼640 mm) and Cl concentrations of 2.2 to 4.4 mg L−1 together with the measured Cl concentrations of groundwater (Table S1). Gross recharge rates were estimated using the WTF method (Eq. 2) from the bore hydrographs that display seasonal variations in the water levels (Fig. 3b and c). There is a single pronounced annual increase in the hydraulic head following winter rainfall, and Δh was estimated as the difference between the highest head value and the extrapolated antecedent recession curve (Healy and Cook, 2002). The effect of evapotranspiration on the magnitude of the hydraulic heads is assumed to be low, especially during winter when radiation and temperature are lower. Sy was assumed to be close to n (0.03 to 0.1; Adelana et al., 2015; Dean et al., 2015), which will be the case if the unsaturated zone dries up between recharge events (Sophocleous, 1985). The TRR calculations (Eq. 3) used 3H activities in Melbourne rainfall as the input function (Tadros et al., 2014). The annual average 3H activity of present-day rainfall in both Melbourne and Gatum is ∼2.8 TU (Tadros et al., 2014; Table S1), and the rainfall prior to the atmospheric nuclear tests was assumed to have had the same 3H activity as present-day rainfall. n=0.03 to 0.1 was again used and estimates of b are discussed below.
3.4 Mean residence times
The mean residence times (MRTs) and the covariance of 3H and 14C activities in groundwater were estimated via lumped parameter models (LPMs; Zuber and Maloszewski, 2001; Jurgens et al., 2012). LPMs relate 14C activity of water at time t (Cout) to the 14C input during recharge over time (Cin) via the convolution integral
(Zuber and Maloszewski, 2001; Jurgens et al., 2012), where q is the fraction of DIC derived from the rainfall or the soil zone, (t−τm) is the age of the water, τm is the MRT, λc is the decay constant for 14C ( yr−1) and g(τm) is the system response function that describes the distribution of residence times in the aquifer (described in detail by Maloszewski and Zuber, 1982; Zuber and Maloszewski, 2001; Jurgens et al., 2012). 3H activities may be calculated from the input of 3H over time in a similar way. Unlike 14C, 3H activities are not changed by reactions between the groundwater and the aquifer matrix; hence the q term is omitted.
There are several commonly used LPMs. The partial exponential model (PEM) may be applied to the aquifers where only the deeper groundwater flow paths are sampled. The dimensionless PEM ratio defines the ratio of the unsampled to sampled depths of the aquifer (Jurgens et al., 2012). This study used PEM ratios of 0.05 to 0.5 that cover the ratios of unsampled to sampled portions of the aquifers at Gatum. The dispersion model (DM) is derived from the one-dimensional advection–dispersion transport equation and is applicable to a broad range of flow systems (Maloszewski and Zuber, 1982; Zuber and Maloszewski, 2001; Jurgens et al., 2012). The dimensionless dispersion parameter (DP) in this model describes the relative contributions of dispersion and advection. For flow systems of a few hundreds of metres to a few kilometres, DP values are likely to be in the range of 0.05 to 1.0 (Zuber and Maloszewski, 2001). Other commonly applied LPMs, such as the exponential-piston flow or the gamma model, produce similar estimates of residence times (Jurgens et al., 2012; Howcroft et al., 2017). The long-term variations of atmospheric 14C concentrations in the Southern Hemisphere (Hua and Barbetti, 2004; McCormac et al., 2004) were used as the 14C input function, and 3H activities in rainfall for Melbourne (Tadros et al., 2014) were used as the 3H input function.
4.1 Hydraulic heads and properties
The hydraulic heads in regional groundwater from both pasture and forest catchments decrease from the upper to lower slopes implying that the regional groundwater flows southwards (Fig. 1b). In the pasture, the hydraulic heads in groundwater from all bores generally gradually increase over several weeks to months following the onset of winter rainfall (Fig. 3b). The increase in hydraulic heads was higher in 2016, which was a year of higher than average rainfall (∼800 mm; Bureau of Meteorology, 2020). This was especially evident at bore 63 (Fig. 3b). In the forest, groundwater heads from bores in the upper (3663 and 3665) and mid (3668) slopes decline uniformly over the monitoring period, and the groundwater head from bore 3658 near the drainage zones does not show seasonal variations (Fig. 3c). However, fluctuations of the head from three bores near the drainage zones (3669) and the lower slopes (3656 and 3657) show seasonal variations similar to that of the groundwater in the pasture (Fig. 3b and c).
Values of Ks range from 0.06 to 0.31 m d−1 in the pasture (Table S1, Fig. 2a) and from 0.002 to 0.18 m d−1 in the forest catchments (Table S1, Fig. 2b). The aquifers in the upper and lower slopes of the pasture catchment have the highest Ks values of ∼0.31 m d−1, whereas Ks values of the aquifers in the forest are lowest on the lower slopes (Table S1, Fig. 2). The aquifers contain rocks from the same stratigraphic unit, and the heterogeneous hydraulic properties probably reflect the degree of weathering, cementation and clay contents.
4.2 Major ions
TDS concentrations of regional groundwater range from 282 to 7850 mg L−1 in the pasture catchment and from 1190 to 7070 mg L−1 in the forest catchment (Table S1); the lowest salinity regional groundwater is from the upper slope of the pasture catchment. The TDS concentrations of the shallow riparian groundwater (≤1 m depth) are between 3890 and 8180 mg L−1 in the pasture and from 169 to 13600 mg L−1 in the forest (Table S1). Regional and riparian groundwaters from both catchments have similar geochemistry. Na constitutes up to 67 % of the total cations on a molar basis, and Cl accounts for up to 91 % of total anions on a molar basis. Cl concentrations range between 45.2 and 8140 mg L−1, which significantly exceed the mean concentrations of Cl in local rainfall (2.2 to 4.4 mg L−1; Hutton and Leslie, 1958; Bormann, 2004; Dean et al., 2014). Molar Cl∕Br ratios are between 180 and 884, with most in the range between 450 and 830 (Fig. 4a), which spans those of seawater and coastal rainfall (∼650; Davies et al., 1998, 2001). Cl∕Br ratios are significantly lower than those that would result from halite dissolution (104 to 105; Kloppmann et al., 2001; Cartwright et al., 2004, 2006) and do not increase with increasing Cl concentrations. These observations indicate that, as is the case throughout southeast Australia (e.g., Herczeg et al., 2001; Cartwright et al., 2006), Cl is predominantly derived from rainfall and concentrated by evapotranspiration. There is also no halite reported in the aquifers in this region. Cl concentrations of the shallow and deeper groundwaters overlap (Fig. 4b) and there is no correlation between Cl and 3H (Fig. 4c). Ca and HCO3 concentrations are uncorrelated (Fig. 4d), indicating that the dissolution of calcite is not a major process influencing groundwater geochemistry.
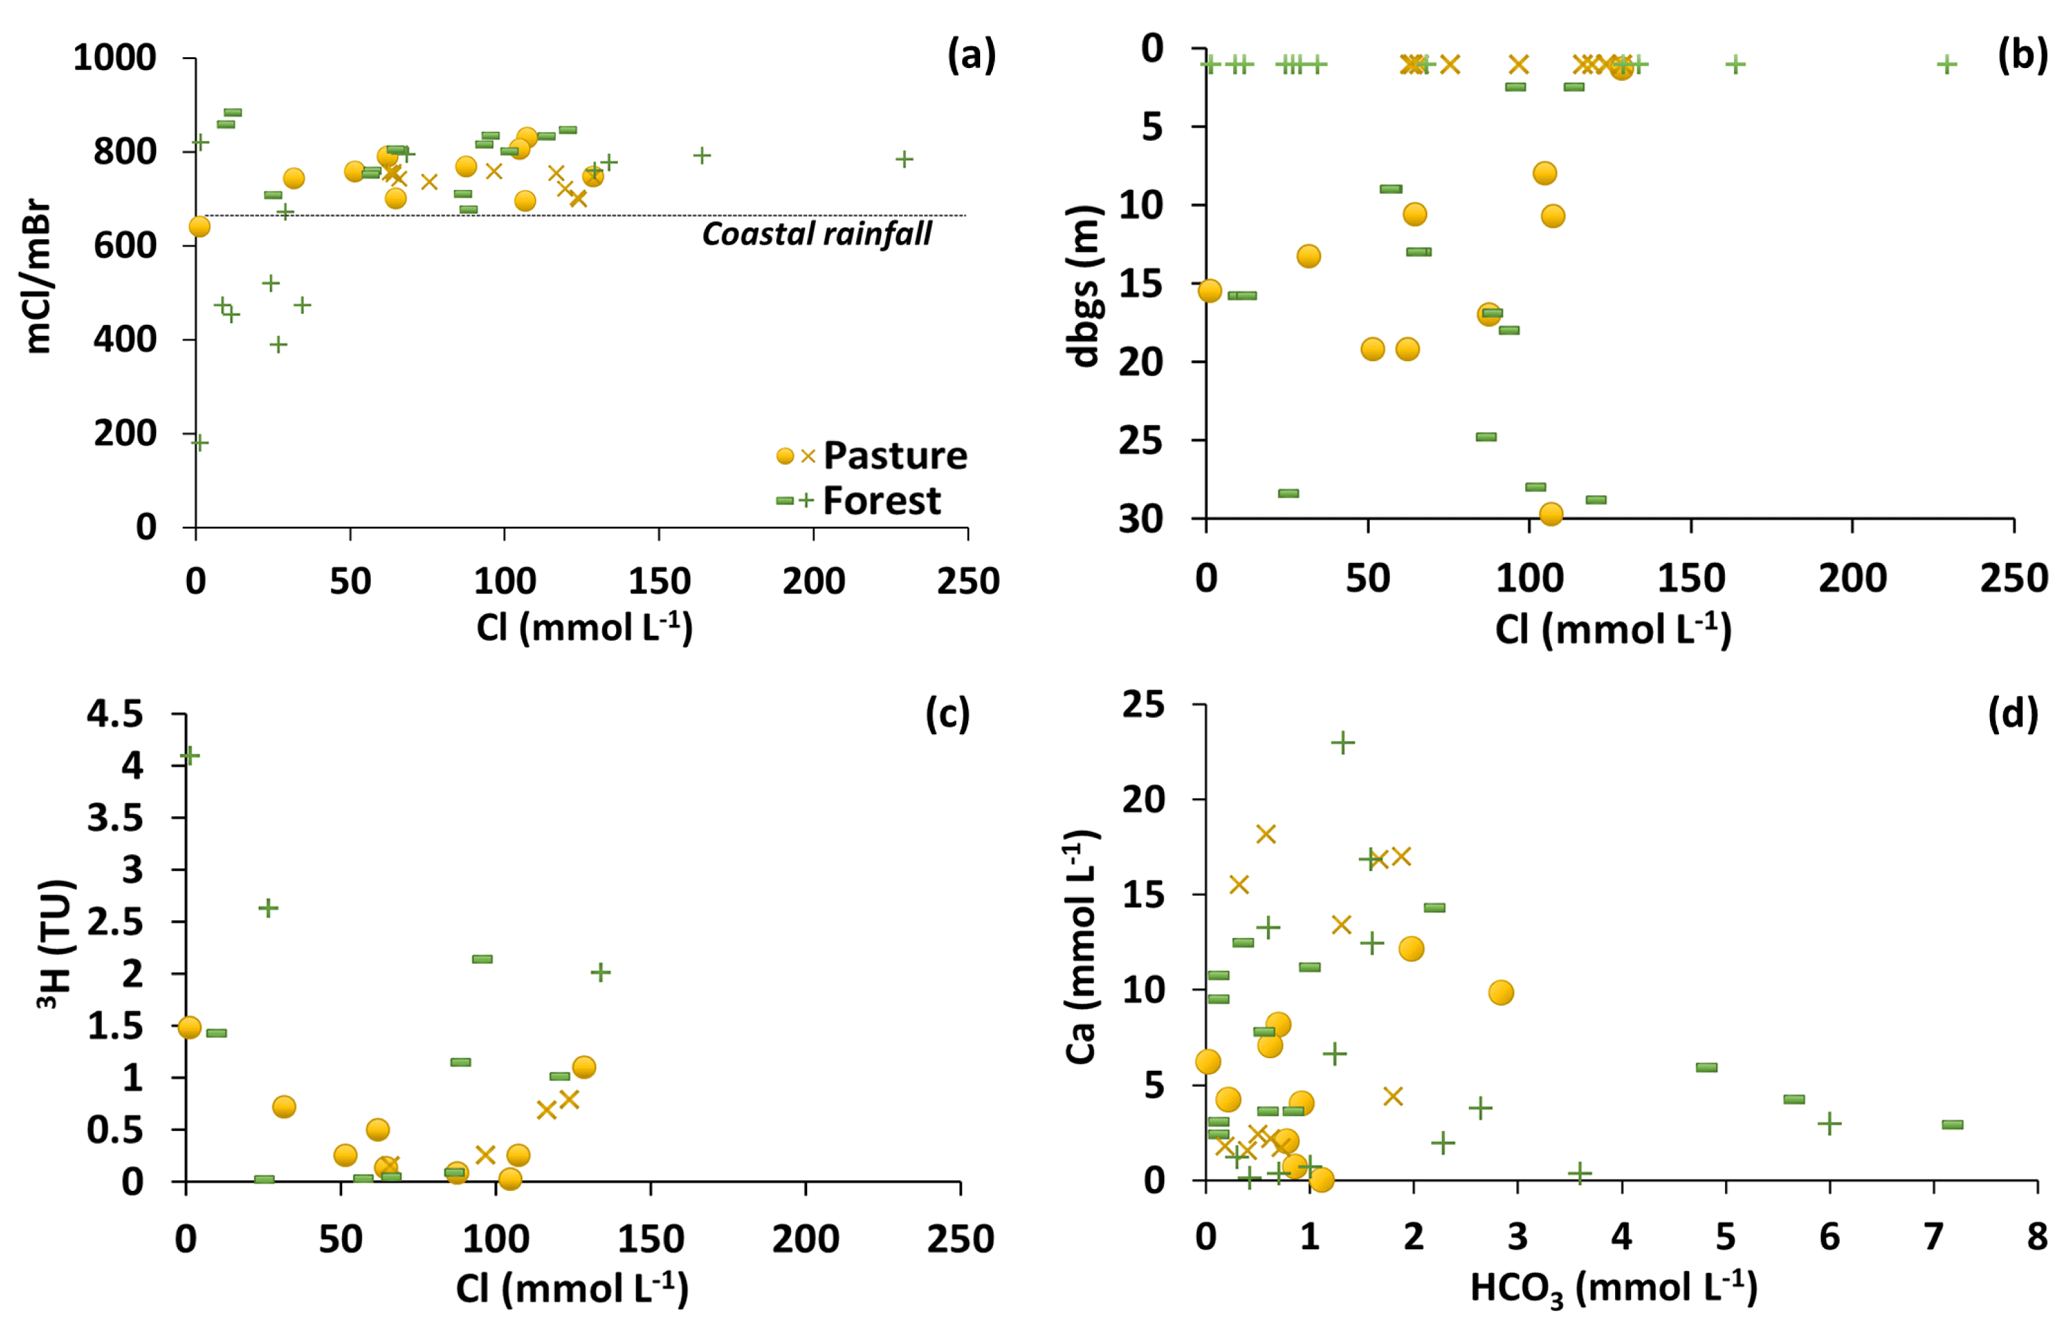
Figure 4(a) Variations of molar Cl∕Br ratios with molar concentrations of Cl. (b) Molar Cl concentrations vs. depth below ground surface (d.b.g.s., m). (c) 3H (TU) vs. molar Cl concentrations. (d) Molar Ca vs. HCO3 concentrations. Cross and plus symbols are for the shallow riparian groundwater, and other symbols are for the regional groundwater.
4.3 Radioisotopes
3H activities of the regional groundwater are up to 1.48 TU (Table S1, Fig. 5). These are lower than the average annual 3H activities of present-day rainfall in this region of ∼2.8 TU (Tadros et al., 2014; Table S1). The highest 3H activities (>1 TU) are from the regional groundwater in the upper slopes (15.5 m depth) and the drainage zones (∼1.3 m depth) of the pasture catchment and between 15.8 and 28.8 m depths in the forest catchment (Table S1). The regional groundwater from ≥28 m depth in the lower slopes of the pasture catchment and the drainage zones of the forest catchment locally have below detection (<0.02 TU) 3H activities (Table S1). The 3H activities of the shallow riparian groundwater in the pasture vary from 0.26 to 0.79 TU with the highest activities from the lower slopes (Table S1, Fig. 5). The riparian groundwater in the forest catchment has 3H activities ranging from 2.01 to 4.10 TU (Table S1, Fig. 5), which are locally higher than the annual average 3H activity of present-day rainfall (∼2.8 TU). These high 3H activities probably reflect seasonal recharge by the winter rainfall that in southeast Australia has higher 3H activities than the annual average (Tadros et al., 2014).
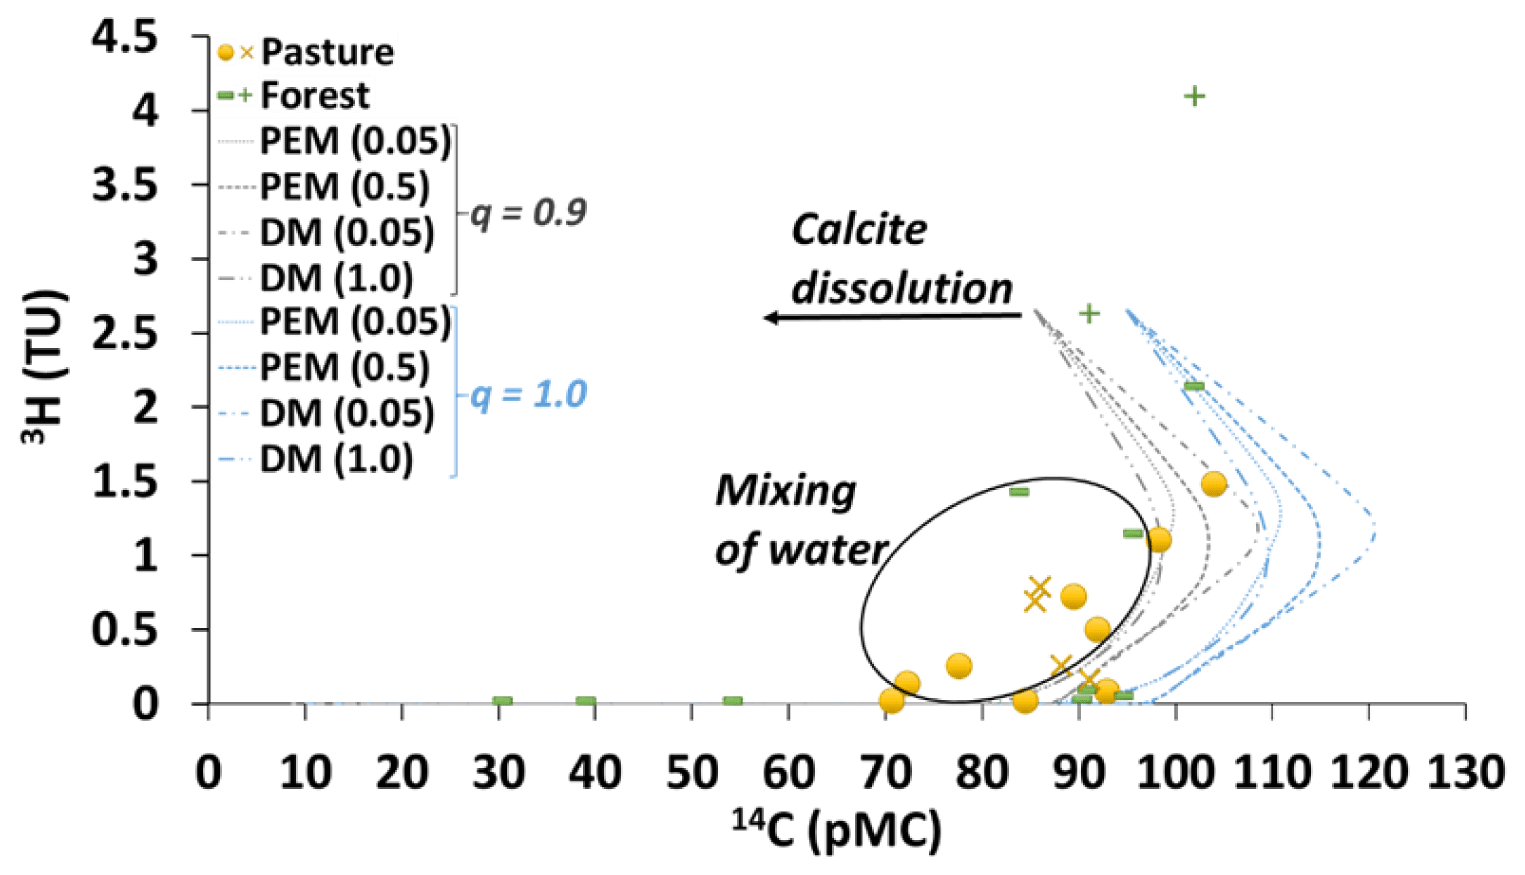
Figure 5Activities of 3H (TU) and 14C (pMC) in the pasture and forest groundwater. PEM represents partial exponential model (PEM ratio in brackets) and DM represents dispersion model (DP parameter in brackets). Cross and plus symbols are for the shallow riparian groundwater, and other symbols are for the regional groundwater. The single high 3H activity possibly reflects recharge by winter rainfall. Samples lying to the left of the covariance curves probably record mixing between younger and older groundwater (see text for discussion).
14C activities in the regional groundwater from the pasture and forest catchments range from 70.7 to 104 (pMC) and from 29.5 to 101 (pMC), respectively (Table S1, Fig. 5). The highest 14C activities (>100 pMC) are from groundwater in the upper slopes of the pasture catchment and the lower zones of the forest catchment that also has high 3H activities (Table S1). The lowest 14C activities are from groundwater at 18 to 28.4 m depths in the mid-slopes and the drainage lines of the forest catchment (Table S1). 14C activities of the shallow riparian groundwater are 85.5 to 102 pMC, with higher activities (>100 pMC) in the drainage zones of the forest catchment (Table S1, Fig. 5).
The combined groundwater elevation and geochemical data allow residence times, mixing and recharge rates at Gatum to be interpreted.
5.1 Mean residence times and mixing
3H and 14C activities help to understand water mixing within the aquifers (Le Gal La Salle et al., 2001; Cartwright et al., 2006, 2013) and the MRTs. The predicted 3H vs. 14C activities (Fig. 5) were calculated for all DIC being introduced by recharge (q=1) and for 10 % contribution of 14C-free DIC from the aquifer matrix (q=0.9). Mixing between older (low 3H and low 14C) and recently recharged groundwater (high 3H and high 14C) results in groundwater samples that plot to the left of the decay trends in Fig. 5. It is difficult to calculate MRTs for these mixed waters; however, it is possible to estimate MRTs from the 14C activities for groundwater lying close to the predicted decay trends. The aquifers are dominated by siliceous rocks, and the major ion geochemistry implies little calcite dissolution. Similar values of q were estimated for groundwater from other siliceous aquifers in southeast Australia (Cartwright and Morgenstern, 2012; Atkinson et al., 2014; Raiber et al., 2015; Howcroft et al., 2017) and elsewhere (Vogel, 1970; Clark and Fritz, 1997). Much lower q values are precluded as samples cannot lie to the right of the 3H vs. 14C curves (Cartwright et al., 2006, 2013, 2017). This is because samples that are not a mixture of old and young groundwater, containing measurable 3H will be less than 200 years old. Over that time span, there has been negligible decay of 14C, and the initial a14C of the sample is a14C∕q (Clark and Fritz, 1997). If there were a greater than 10 % contribution of DIC from 14C-free calcite dissolution, the estimated initial a14C would exceed the highest a14C recorded in soil CO2 of ∼120 pMC.
The calculated MRTs are up to 3930 years in the pasture and up to 24 700 years in the forest (Table 1, Fig. 6). While using LPMs is preferable to using a simple decay equation that assumes piston flow and ignores variations in the 14C input function, there are uncertainties in the calculated MRTs. The different LPMs have different residence time distributions and so yield different MRT estimates. Additionally, there are uncertainties in q and the input function of 14C. Previous studies (e.g., Atkinson et al., 2014; Howcroft et al., 2017) estimated overall uncertainties in MRTs were up to 25 %. While these are considerable, much of the regional groundwater undoubtedly has residence times of several thousands of years and was recharged prior to land clearing. These long residence times are consistent with the locally clay-rich nature of the aquifers and the moderate-to-low hydraulic conductivities.
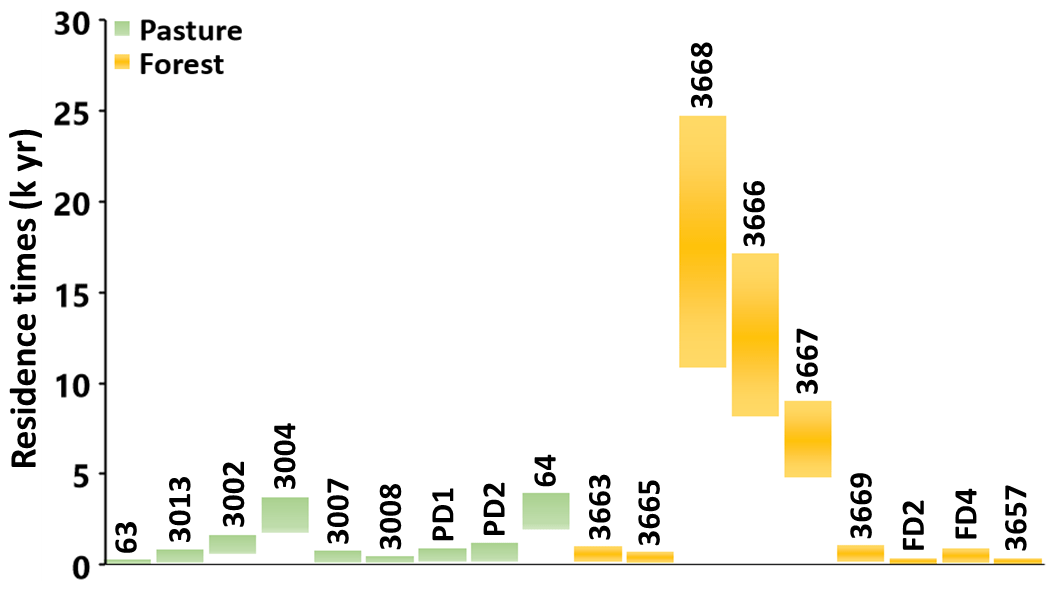
Figure 6Ranges of groundwater residence times (in kyr) estimated using different LPMs. The numbers above the boxes represent sample IDs. PD and FD represent the shallow groundwater in the pasture drainage and forest drainage areas, respectively. Data are from Table 1.
Table 1Groundwater recharge rates and estimated residence times of groundwater.
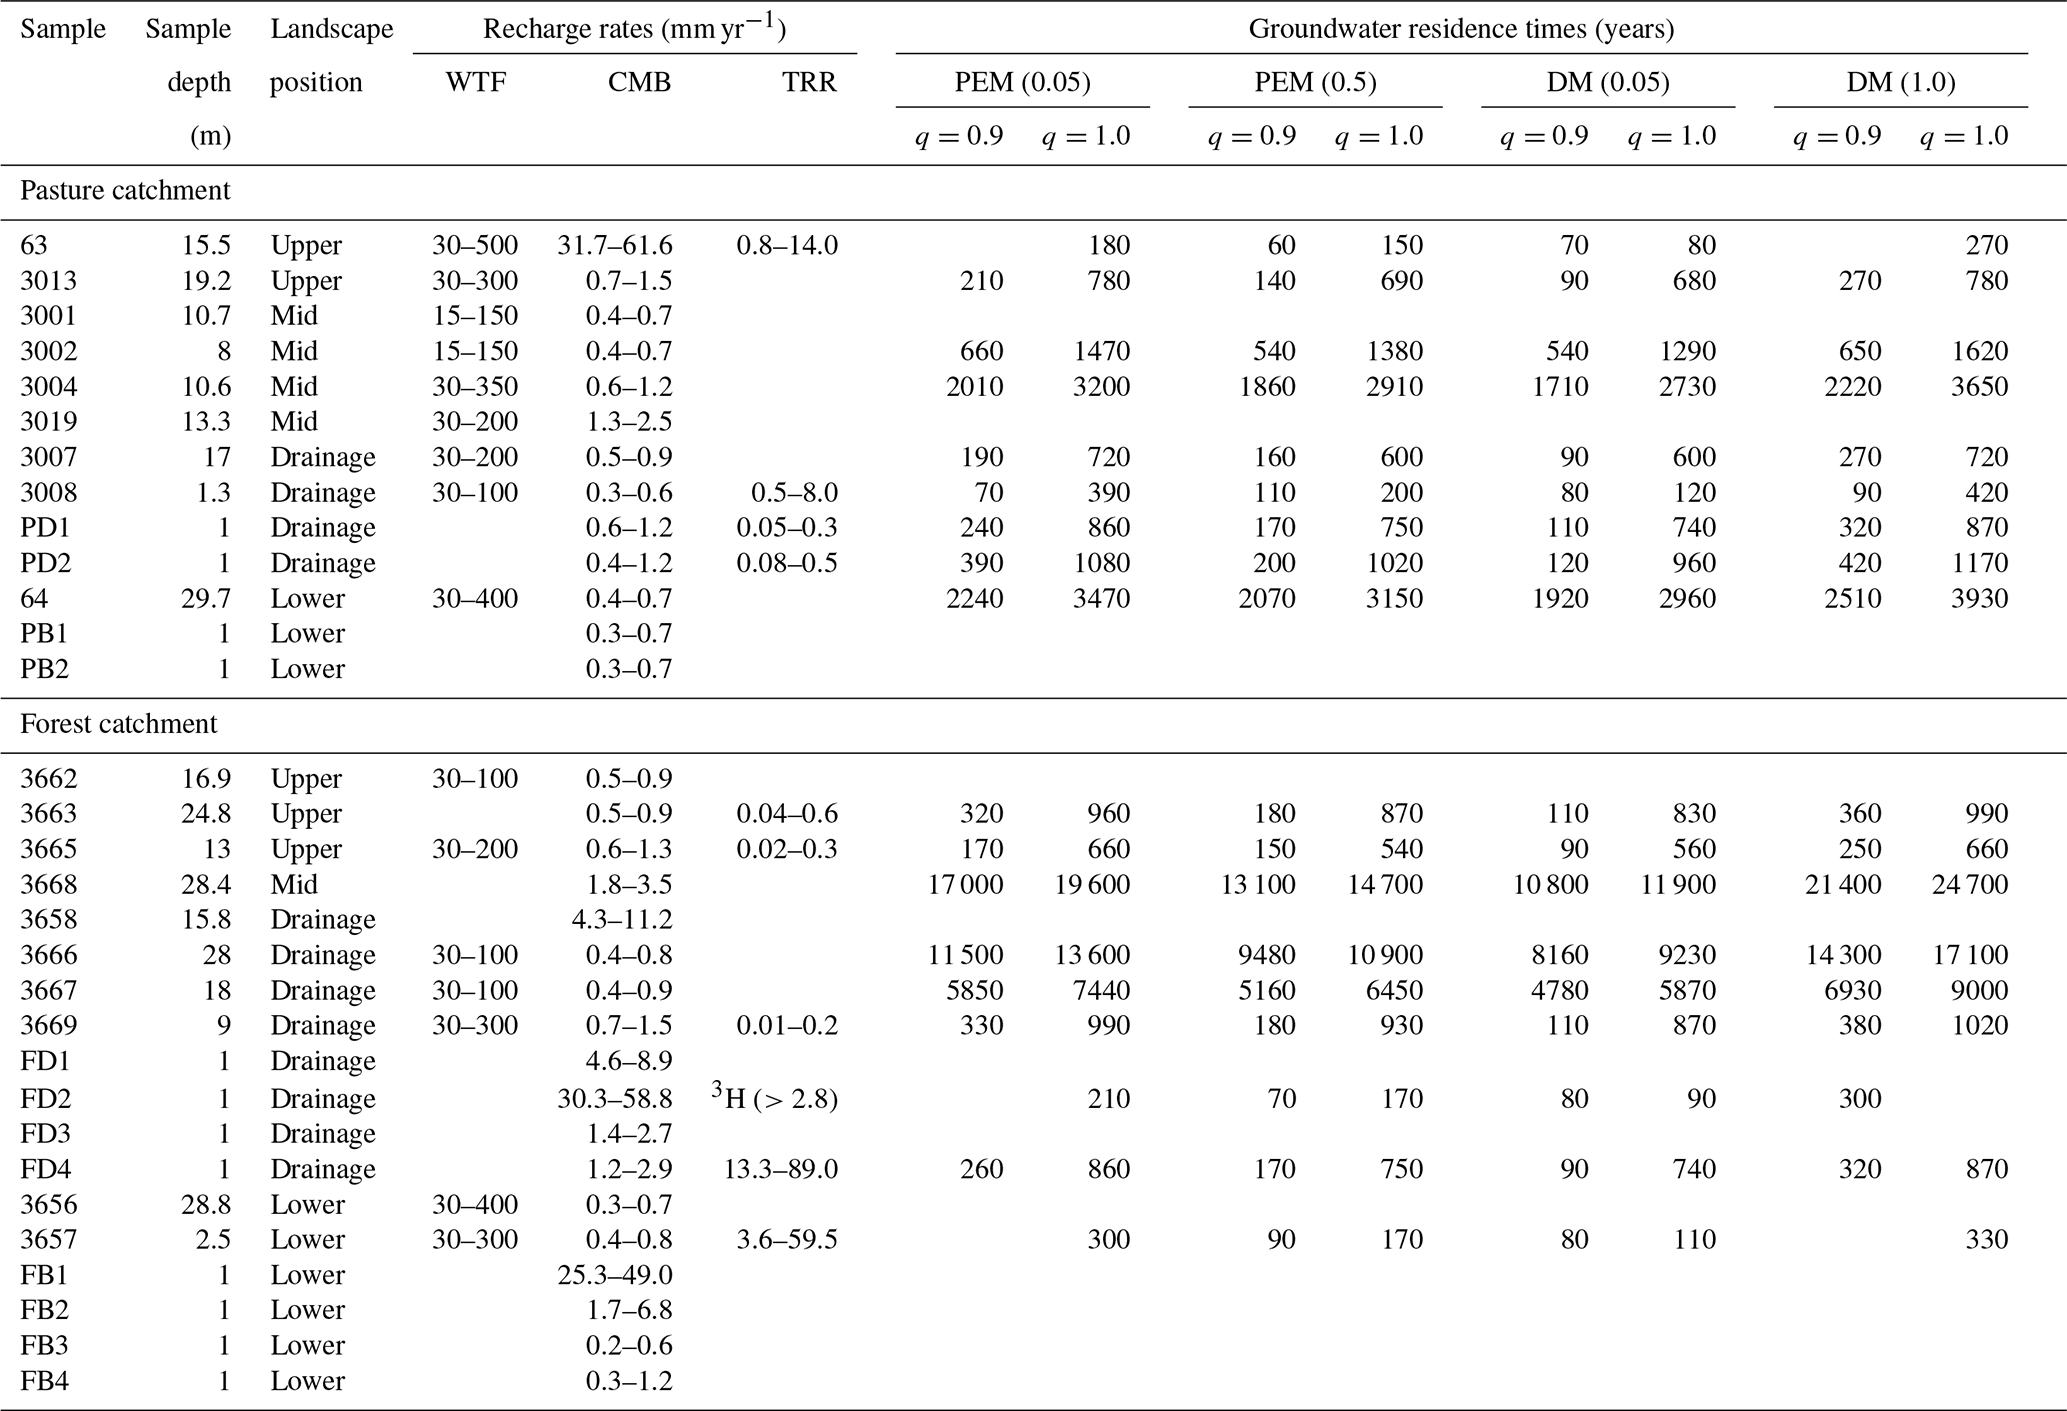
Landscape positions: upper, mid and lower slopes as discussed in text. Sample depth is the middle of the screened interval. The recharge rates from the WTF method were calculated for bore hydrographs that show seasonal variations in hydraulic head. The recharge rates with TRR were calculated assuming b was 1 to 5 m (bores) and 1 to 2 m (shallow piezometers). The groundwater samples that do not show mixing of young and old groundwater were calculated for recharge rates from TRR and residence times. Groundwater residence times were not calculated for those samples which exceeded the upper limit of 14C concentrations in lumped parameter models.
5.2 Recharge rates
5.2.1 Cl mass balance
Recharge rates calculated from the CMB method (Eq. 1) using total rainfall of ∼640 mm yr−1 and rainfall Cl concentrations of 2.2 to 4.4 mg L−1 are similar between the pasture (0.3 to 61.6 mm yr−1) and forest (0.2 to 58.8 mm yr−1) catchments (Figs. 2 and 7a). The typical recharge rates for most of the regional groundwater are from 0.3 to 2.5 mm yr−1 in the pasture and from 0.2 to 11.2 mm yr−1 in the forest (Figs. 2 and 7a). The Cl∕Br ratios imply that the dissolution of halite is negligible, and all the Cl is delivered by the rainfall. Whether the rate of Cl delivery has been constant over long time periods is more difficult to assess; however, the rainfall Cl concentrations are typical of inland rainfall, and southeast Australia does not record major climate fluctuations such as glaciations or monsoons (Davies and Crosbie, 2018).
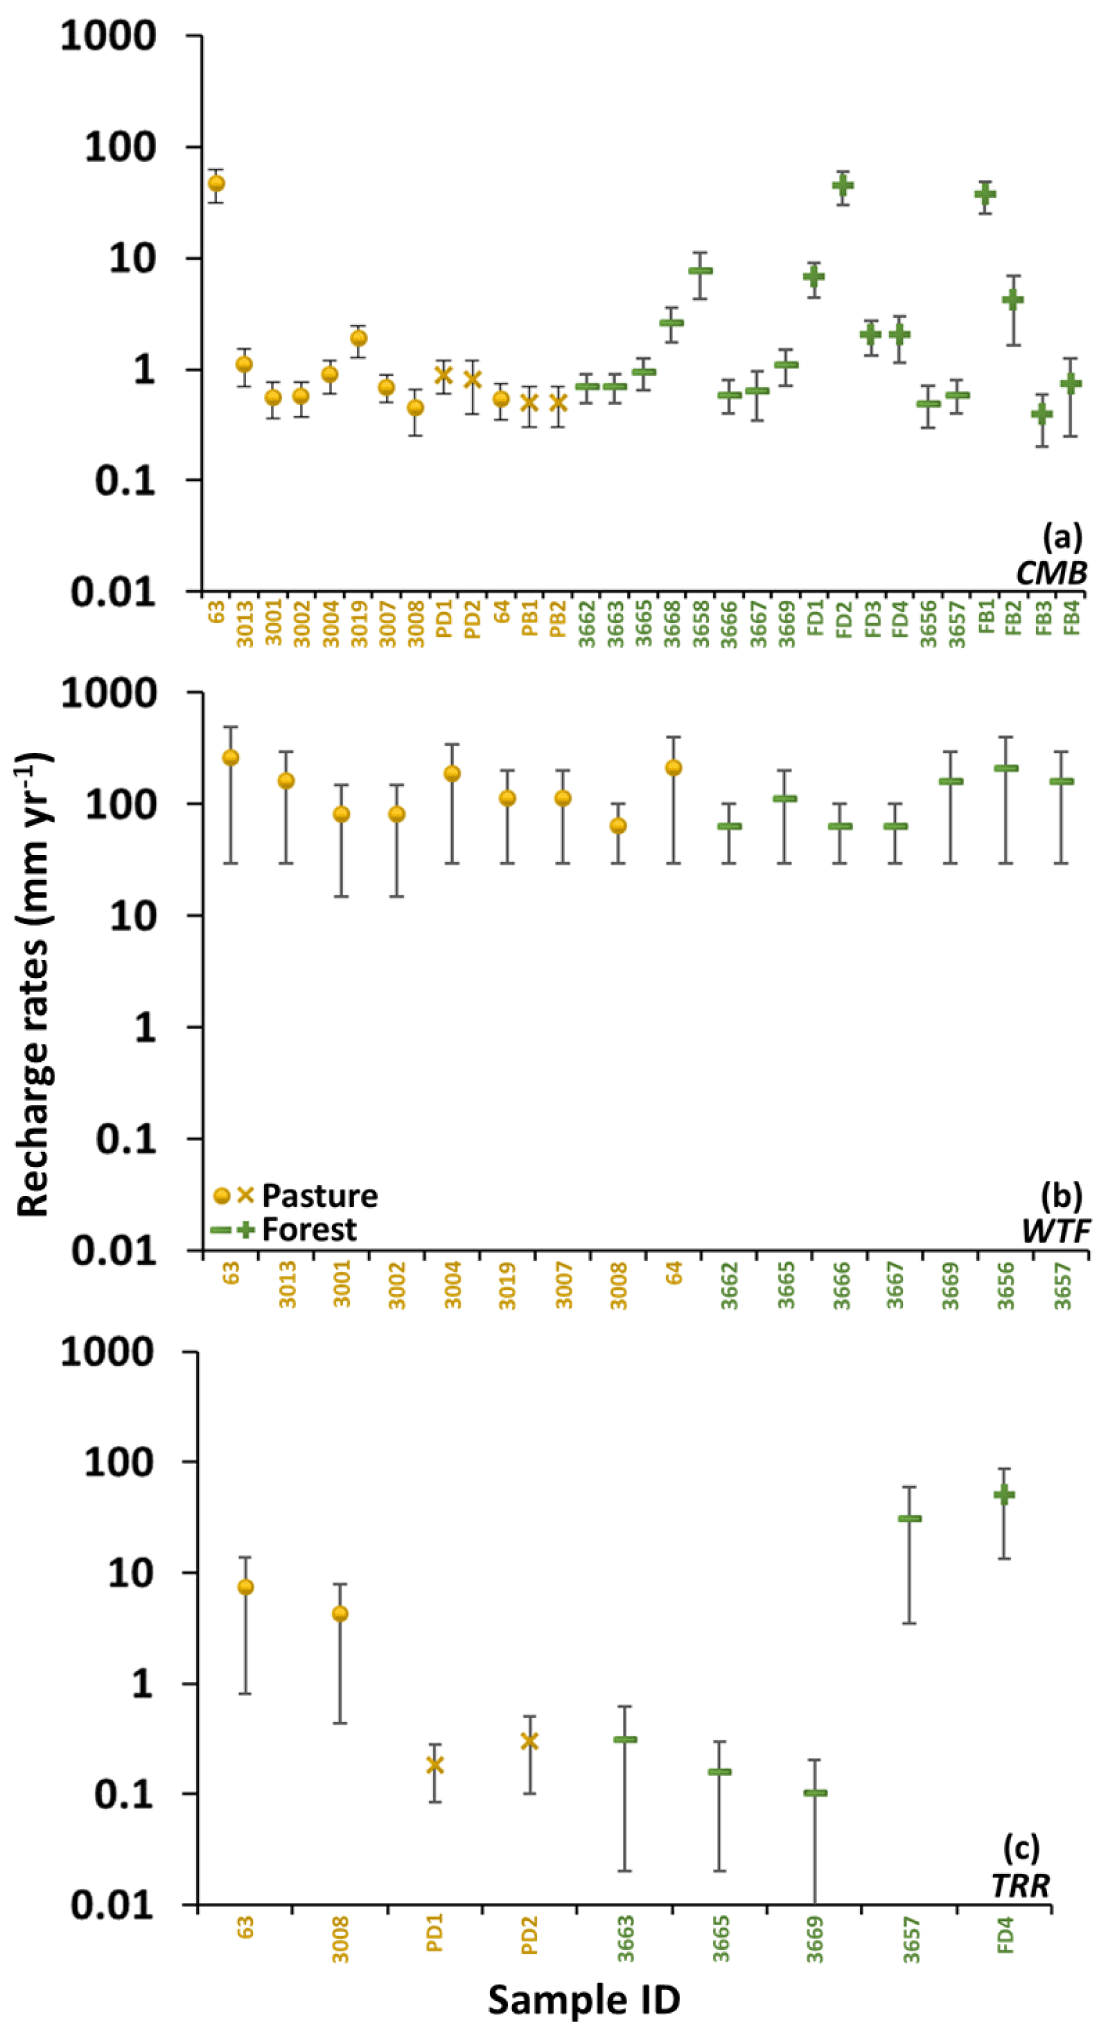
Figure 7Recharge rates (in mm yr−1) estimated from (a) CMB, (b) WTF and (c) TRR. PD and FD are for the shallow groundwater in the pasture drainage and forest drainage areas, respectively. Bars indicate the ranges of recharge rates from Table 1.
The CMB technique also assumes that the export of Cl by surface runoff is negligible. The streams at Gatum currently discharge ∼8 % of local rainfall and much of the Cl that they export represents groundwater discharging into the stream (Adelana et al., 2015). This component of Cl does not impact the CMB recharge rate calculations. If some direct export of Cl has occurred, the recharge estimates would be slightly lower than estimated above. However, because the initial land clearing has most likely increased streamflow in this region (Dresel et al., 2018), streamflows and the export of Cl would have historically been lower than the present day.
Because Cl in groundwater accumulates over hundreds to thousands of years (Scanlon et al., 2002, 2006), the CMB method generally yields longer-term recharge rates; these largely reflect pre-land-clearing recharge in Australia (Alison and Hughes, 1978; Cartwright et al., 2007; Dean et al., 2015; Perveen, 2016). This conclusion is consistent with the long 14C residence times of much of the deeper regional groundwater at Gatum. The higher recharge rates (25.3 to 61.6 mm yr−1) are from the regional groundwater in the upper slopes of the pasture (bore 63) and the shallow riparian groundwater in the drainage zones (piezometer FD2) and the lower slopes (piezometer FB1) of the forest (Figs. 2 and 7a). The groundwater at these sites has high 3H and 14C activities, and the recharge rates from the CMB technique are likely to represent present-day recharge.
5.2.2 Water table fluctuations
The recharge rates were calculated using the WTF method (Eq. 2) from the bore hydrographs, which show seasonal head variations, assuming Sy=0.03 to 0.1. The estimated recharge rates range from 15 to 500 mm yr−1 (2 % to 78 % of rainfall) in the pasture and from 30 to 400 mm yr−1 (5 % to 63 % of rainfall) in the forest (Figs. 2 and 7b). As with the CMB estimates, the recharge rates are generally high at the upper slopes of the pasture catchment (Figs. 2 and 7b). However, the highest recharge rates from the WTF method are unlikely given that evapotranspiration rates in this region approach the rainfall rates (Dean et al., 2016; Dresel et al., 2018; Azarnivand et al., 2020). The lower recharge rates estimated from the WTF method appear more reasonable but are still larger than most recharge rates estimated from the TRR method. The observation that much of the older saline groundwater has not been flushed from the catchments also implies that present-day recharge rates cannot be very high.
The WTF method requires the hydrograph recession curves to be estimated. There are significant steep and straight recession curves in the bore hydrographs (Fig. 3b and c) that can lead to errors in recharge estimates. The WTF method may overestimate recharge due to air entrapped during recharge (the Lisse effect; Crosbie et al., 2005). However, this occurs during rapid recharge, which is not observed in the Gatum area. Dean et al. (2015) suggested that the high recharge rates estimated from the WTF method in the adjacent Mirranatwa catchments might reflect focussed recharge from the streams. This is not the case at Gatum as high WTF recharge rates are recorded at all landscape positions and the streams only export ∼8 % of rainfall (Adelana et al., 2015). Because the WTF estimates gross recharge and geochemical methods estimate net recharge, there may be differences if the water is removed from the water table by evapotranspiration, especially in spring after the water tables reach their seasonal peaks. The plantation forest plausibly has high evapotranspiration rates (Benyon et al., 2006; Dean et al., 2015; Dresel et al., 2018); however, this explanation is unlikely in the pasture where water tables are locally several metres below the land surface and there is no deep-rooted vegetation.
It is most likely that the unrealistically high recharge rates estimated from the WTF method reflect an overestimation of Sy due to the presence of remnant moisture in the unsaturated zone between the recharge events (Gillham, 1984; Sophocleous, 1985; Crosbie et al., 2005, 2019). While this is not unexpected, it is difficult to determine realistic values of Sy to improve these estimates.
5.2.3 3H renewal rate
The recharge rates for bores and shallow piezometers were estimated using 3H activities and the TRR method (Eqs. 3 and 4). These recharge rates were calculated for those groundwater samples which do not show the mixing of recent and older groundwater (Fig. 5). Regional groundwater from nested bores commonly has different TDS contents, EC values, and 3H and 14C concentrations (Table S1), indicating that the groundwater is stratified. Much of the deeper groundwater has low 3H and 14C activities, implying that it is not recently recharged. Based on these differences in geochemistry (Table S1), b is estimated as being between 1 and 5 m in the regional groundwater. b values for the shallow riparian groundwater are estimated to be 1 to 2 m, which is the approximate thickness of the shallow perched aquifers (Brouwer and Fitzpatrick, 2002). The estimated n values of 0.03 to 0.1 (Adelana et al., 2015; Dean et al., 2015) were used for these calculations.
Recharge rates from the regional groundwater are 0.5 to 14.0 mm yr−1 in the pasture and 0.01 to 59.5 mm yr−1 in the forest with most in the range of 0.01 to 0.6 mm yr−1 (Figs. 2 and 7c). The higher recharge rates were from the upslopes of the pasture (14.0 mm yr−1) and the lower slopes of the forest (59.5 mm yr−1). The recharge rates in the riparian groundwater are from 0.05 to 0.5 mm yr−1 in the pasture and from 13.3 to 89.0 mm yr−1 in the forest (Figs. 2 and 7c).
The average annual 3H activity in present-day rainfall at Gatum (∼2.8 TU) is within the predicted range of the 3H activities in present-day Melbourne rainfall (3.0±0.2 TU), implying that the Melbourne 3H input function is appropriate to use for this area. Assuming uncertainty in the 3H input function of 5 % to 10 % (which is similar to the present-day variability of 3H activities reported by Tadros et al., 2014) results in <5 % uncertainties in recharge estimates. The variation resulting from analytical uncertainties are lower than this. Recharge rates are most sensitive to the b values, which are not explicitly known and may be variable. However, b is unlikely to be >5 m based on the observed degree of chemical stratification. It may also be possible to estimate b from the fluctuation of the water table (on the basis that the rise in the water table corresponds to recharging water added to the top of the aquifer). If that is the case, b values would be typically 1 to 3 m (Fig. 3b and c), which is within the range used in these calculations. There is also an assumption of a homogeneous aquifer. However, older water with low 3H activities may locally be present in the zones of low hydraulic conductivity. Diffusion may reduce 3H activities in more mobile groundwater adjacent to those zones (Sudicky and Frind, 1981; Cartwright et al., 2006, 2017, 2020). Overall, the recharge rates from the TRR method are again generally higher than those calculated using the CMB, which reflects the effects of the initial land clearing. However, despite both reflecting post-land-clearing recharge, they are significantly lower than those estimated using the WTF.
5.3 Predicting the effect of land-use changes
In large regions of southeast Australia (including the study area), understanding whether and by how much recharge increased following the initial land clearing is important in predicting the impact of a rising water table in causing salinization of soils and streams. For areas where plantation forests have been established, it is important to assess any subsequent impact of those plantations on recharge.
As expected, the recharge estimates from the CMB method are generally lower than those from the WTF and TRR methods and largely reflect those prior to the initial replacement of native eucalyptus vegetation by pasture. Although both methods determine present-day recharge rates (Scanlon et al., 2002, 2006), those estimated using the WTF method are significantly higher than the TRR estimates (Fig. 8). Having to estimate b represents a major uncertainty in the TRR calculations; however, b would have to be up to 50 m to achieve agreement between the recharge estimates from these two methods. This is unlikely given the observations that major ion geochemistry, 3H and 14C activities of groundwater vary over vertical scales of a few metres (Table S1), implying that the groundwater is compartmentalized on those scales. It is also unlikely that b could be so large given the heterogeneous nature of the aquifers and the presence of clay layers. It is most likely that the WTF method systematically overestimates recharge due to issues in estimating Sy.
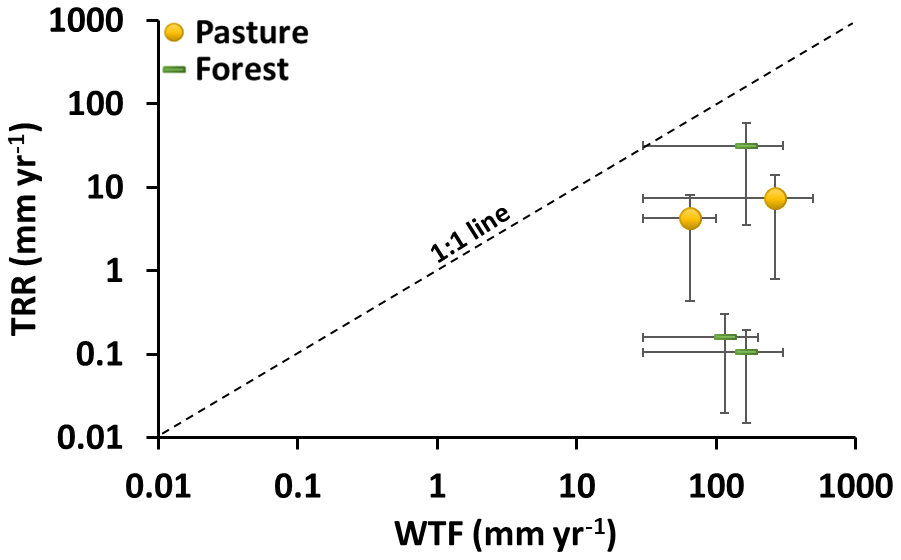
Figure 8Comparison between recharge rates for the regional groundwater estimated from WTF and TRR. Bars represent the ranges of calculated recharge values from Table 1.
The recharge estimates from the TRR method differ little between pasture and forest; this is unexpected given that the establishment of plantation forests aimed to reduce the recharge rates. The evapotranspiration rates in the forest are also higher than in the pasture (Adelena et al., 2015; Dresel et al., 2018), and the water levels are declining in some areas of the forest with no corresponding decline in the pasture (Fig. 3b and c), suggesting higher water use by the trees. The plantation covers ∼62 % of the forest catchment, and many of the bores are in cleared areas between the stands of trees (Fig. 1a). Thus, the recharge rates may not be representative of the forest as a whole. Additionally, the TRR averages recharge rates over the time span of the residence times of the aliquots of water contained in the water sample (Maloszewski and Zuber, 1982; Cartwright et al., 2017). If the zone at the top of the aquifer approximates a well-mixed reservoir, the time span is 1∕Rn (Leduc et al., 2000; Favreau et al., 2002). Rn values at Gatum are to , implying that recharge rates are averaged over decades to centuries. Thus, the recharge rates in the forest catchment may reflect those from both before and following the recent reforestation.
As has been discussed elsewhere (Scanlon et al., 2002; Healy, 2010; Crosbie et al., 2010, 2019; Cartwright et al., 2017; Moeck et al., 2020), estimating recharge rates can be difficult and a range of techniques together with other data (such as estimates of residence time) is required to produce reliable results. By necessity, estimating pre- and post-land-clearing recharge rates requires different methods. Both the CMB and WTF methods use data that are readily available (or are relatively low cost to attain). The uncertainties in the CMB estimates are relatively straightforward to address, and this represents a viable method of estimating historic recharge rates; however, the commonly used WTF method may not be able to be applied in a straightforward manner to estimate present-day recharge rates. Relatively high WTF recharge rates (up to 161 and 366 mm yr−1) were also calculated in adjacent catchments with similar land uses (Dean et al., 2015; Perveen, 2016). 3H activities in groundwater from those catchments are similar to those at Gatum, implying that recharge estimates based on the TRR method would again be significantly lower. Cartwright et al. (2007) and Crosbie et al. (2010) also reported that the recharge estimates from the TRR method and other geochemical tracers in semi-arid catchments elsewhere in Australia are lower than those from the WTF method. A similar observation was made for temperate catchments (Cartwright et al., 2020). Some of the discrepancy may be caused by the local presence of older water in lower permeability regions; however, this probably does not entirely account for the systematic differences across a range of catchments.
Additionally, the recharge rates are likely to be spatially variable across both catchments, and even with a relatively high density of data such as at Gatum, it is difficult to estimate typical or area-integrated values. In the case of understanding recharge rates in the plantation forest, the necessity that bores are in cleared areas (between the stands of trees) also makes it questionable whether the recharge rates are representative. Finally, all the geochemical techniques integrate recharge rate estimates over years to centuries and are thus ineffective at determining changes over shorter timescales than this.
Detailed soil moisture measurements that would improve Sy estimates and geochemical tracers, such as 3H, may not always be available. Integrated surface and subsurface hydrogeologic models, which simulate coupled groundwater, surface water and soil water fluxes, might provide additional tools to estimate recharge rates that could be used to support the field and geochemical data (Scudeler et al., 2016; Daneshmand et al., 2019). With the increasing availability of soil moisture, evapotranspiration, rainfall, streamflow and groundwater elevation data, catchment water balance models (e.g., Wada et al., 2010; Moeck et al., 2020) might also represent viable methods of estimating recharge, especially over large areas.
The results of this study inform the understanding of hydrogeological processes in this and similar semi-arid regions globally. The present-day recharge rates in the pasture, which is typical of cleared land in southeast Australia, are likely to be <10 mm yr−1. Despite these being significantly higher than the pre-land-clearing recharge rates, they only result in the gradual replacement of the older saline water stored in these aquifers (as is implied by the trends of d.b.g.s. vs. Cl and 3H vs. Cl; Fig. 4b and c). Additionally, while there has been a rise in the water table caused by increased recharge (and in some cases increased drainage in the streams), the magnitude of these changes will be limited by the modest recharge rates. The results also indicate that care must be used in assigning recharge rates as boundary conditions in numerical models.
All analytical data is presented in the Supplement. Groundwater head data are from Dresel et al. (2018).
The supplement related to this article is available online at: https://doi.org/10.5194/hess-25-89-2021-supplement.
SB and IC conducted the sampling assisted by PED and ED. SB carried out the analytical work conducted at Monash University. PED and ED manage the field sites and provided pre-existing data. All authors were involved in writing the article.
The authors declare that they have no conflict of interest.
We thank Rob Lawrence (farm owner) and Georgie Luckock (plantation manager at PF Olsen Australia) for allowing us to access their farm and forest. Special thanks to Peter Hekmeijer from the Department of Jobs, Precincts and Regions, Victoria, for his keen support of this study. Massimo Raveggi and Rachelle Pierson are thanked for their help with the analytical work. The comments of the referees helped clarify the paper.
This research was supported by the Australian Research Council (grant no. DP180101229).
This paper was edited by Nunzio Romano and reviewed by three anonymous referees.
Adelana, S. M., Dresel, P. E., Hekmeijer, P., Zydor, H., Webb, J. A., Reynolds, M., and Ryan, M.: A comparison of streamflow, salt and water balances in adjacent farmland and forest catchments in south-western Victoria, Australia, Hydrol. Process., 29, 1630–1643, https://doi.org/10.1002/hyp.10281, 2015.
Allison, G., Cook, P., Barnett, S., Walker, G., Jolly, I., and Hughes, M.: Land clearance and river salinisation in the western Murray Basin, Australia, J. Hydrol., 119, 1–20, https://doi.org/10.1016/0022-1694(90)90030-2, 1990.
Allison, G. B. and Hughes, M. W.: The use of environmental chloride and tritium to estimate total recharge to an unconfined aquifer, Aust. J. Soil Res., 16, 181–195, https://doi.org/10.1071/SR9780181, 1978.
Atkinson, A. P., Cartwright, I., Gilfedder, B., Cendón, D., Unland, N., and Hofmann, H.: Using 14C and 3H to understand groundwater flow and recharge in an aquifer window, Hydrol. Earth Syst. Sci., 18, 4951–4964, https://doi.org/10.5194/hess-18-4951, 2014.
Azarnivand, A., Camporese, M., Alaghmand, S., and Daly, E.: Simulated response of an intermittent stream to rainfall frequency patterns, Hydrol. Process., 34, 615–632, https://doi.org/10.1002/hyp.13610, 2020.
Bazuhair, A. S. and Wood, W. W.: Chloride mass-balance method for estimating ground water recharge in arid areas: examples from western Saudi Arabia, J. Hydrol., 186, 153–159, https://doi.org/10.1016/S0022-1694(96)03028-4, 1996.
Benyon, R. G., Theiveyanathan, S., and Doody, T. M.: Impacts of tree plantations on groundwater in south-eastern Australia, Aust. J. Bot., 54, 181–192, https://doi.org/10.1071/BT05046, 2006.
Blackburn, G. and McLeod, S.: Salinity of atmospheric precipitation in the Murray-Darling drainage division, Australia, Aust. J. Soil Res., 21, 411–434, https://doi.org/10.1071/SR9830411, 1983.
Bormann, M. E.: Temporal and spatial trends in rainwater chemistry across central and western Victoria, Honours Thesis, School of Life Sciences, College of Science, Health and Engineering, La Trobe University, Bundoora, Victoria, Australia, 2004.
Bosch, J. M. and Hewlett, J.: A review of catchment experiments to determine the effect of vegetation changes on water yield and evapotranspiration, J. Hydrol., 55, 3–23, 1982.
Brouwer, J. and Fitzpatrick, R.: Interpretation of morphological features in a salt-affected duplex soil toposequence with an altered soil water regime in western Victoria, Aust. J. Soil Res., 40, 903–906, https://doi.org/10.1071/SR02008, 2002.
Bureau of Meteorology: Commonwealth of Australia, available at: http://www.bom.gov.au, last access: 14 February 2020.
Cartwright, I. and Morgenstern, U.: Constraining groundwater recharge and the rate of geochemical processes using tritium and major ion geochemistry: Ovens catchment, southeast Australia, J. Hydrol., 475, 137–149, https://doi.org/10.1016/j.jhydrol.2012.09.037, 2012.
Cartwright, I., Weaver, T. R., Fulton, S., Nichol, C., Reid, M., and Cheng, X.: Hydrogeochemical and isotopic constraints on the origins of dryland salinity, Murray Basin, Victoria, Australia, Appl. Geochem., 19, 1233–1254, https://doi.org/10.1016/j.apgeochem.2003.12.006, 2004.
Cartwright, I., Weaver, T. R., and Fifield, L. K.: Cl∕Br ratios and environmental isotopes as indicators of recharge variability and groundwater flow: An example from the southeast Murray Basin, Australia, Chem. Geol., 231, 38–56, https://doi.org/10.1007/s10040-003-0318-9, 2006.
Cartwright, I., Weaver, T. R., Stone, D., and Reid, M.: Constraining modern and historical recharge from bore hydrographs, 3H, 14C, and chloride concentrations: Applications to dual-porosity aquifers in dryland salinity areas, Murray Basin, Australia, J. Hydrol., 332, 69–92, https://doi.org/10.1016/j.jhydrol.2006.06.034, 2007.
Cartwright, I., Fifield, L. K., and Morgenstern, U.: Using 3H and 14C to constrain the degree of closed-system dissolution of calcite in groundwater, Appl. Geochem., 32, 118–128, https://doi.org/10.1016/j.apgeochem.2012.10.023, 2013.
Cartwright, I., Cendón, D., Currell, M., and Meredith, K.: A review of radioactive isotopes and other residence time tracers in understanding groundwater recharge: Possibilities, challenges, and limitations, J. Hydrol., 555, 797–811, https://doi.org/10.1016/j.jhydrol.2017.10.053, 2017.
Cartwright, I., Morgenstern, U., Hofmann, H., and Gilfedder, B.: Comparisons and uncertainties of recharge estimates in a temperate alpine catchment, J. Hydrol., 590, 125558, https://doi.org/10.1016/j.jhydrol.2020.125558, 2020.
Cayley, R. A. and Taylor, D. H.: Grampians special map area geological report, Geological Survey of Victoria Report 107, Geological Survey, Victoria, 150 pp., ISBN 0730694127, 1997.
Clark, R. M. and Harvey, W.: Dryland salinity in Victoria in 2007: An analysis of data from the soil salinity database and Victorian discharge monitoring network, Department of Primary Industries, Primary Industries Research Victoria, Bendigo, ISBN 9781742170374, 2008.
Clark, I. D. and Fritz, P.: Environmental Isotopes in Hydrogeology, Lewis Publishers, New York, USA, ISBN 1566702496, 1997.
Crosbie, R., Morrow, D., Cresswell, R., Leaney, F., Lamontagne, S., and Lefournour, M.: New insights to the chemical and isotopic composition of rainfall across Australia, Water for a Healthy Country Flagship Report Series, CSIRO Publishing, Canberra, Australia, ISSN 1835095X, 2012.
Crosbie, R., S., Binning, P., and Kalma, J. D.: A time series approach to inferring groundwater recharge using the water table fluctuation method, Water Resour. Res., 41, 1–9, https://doi.org/10.1029/2004WR003077, 2005.
Crosbie, R. S., Jolly, I. D., Leaney, F. W., and Petheram, C.: Can the dataset of field based recharge estimates in Australia be used to predict recharge in data-poor areas?, Hydrol. Earth Syst. Sci., 14, 2023–2038, https://doi.org/10.5194/hess-14-2023-2010, 2010.
Crosbie, R. S., Doble, R. C., Turnadge, C., and Taylor, A. R.: Constraining the magnitude and uncertainty of specific yield for use in the water table fluctuation method of estimating recharge, Water Resour. Res., 55, 7343–7361, https://doi.org/10.1029/2019WR025285, 2019.
Daneshmand, H., Alaghmand, S., Camporese, M., Talei, A., and Daly, E.: Water and salt balance modelling of intermittent catchments using a physically-based integrated model, J. Hydrol., 568, 1017–1030, https://doi.org/10.1016/j.jhydrol.2018.11.035, 2019.
Davies, P. J., and Crosbie, R. S.: Mapping the spatial distribution of chloride deposition across Australia, Journal of Hyrology, 561, 76-88, doi.org/10.1016/j.jhydrol.2018.03.051, 2018.
Davis, S. N., Whittemore, D. O., and Fabryka-Martin, J.: Uses of chloride ∕ bromide ratios in studies of potable water, Groundwater, 36, 338–350, https://doi.org/10.1111/j.1745-6584.1998.tb01099.x, 1998.
Davis, S. N., Cecil, L. D., Zreda, M., and Moysey, S.: Chlorine-36, bromide, and the origin of spring water, Chem. Geol., 179, 3–16, https://doi.org/10.1016/S0009-2541(01)00312-6, 2001.
Dean, J. F., Webb, J. A., Jacobson, G. E., Chisari, R., and Dresel, P. E.: Biomass uptake and fire as controls on groundwater solute evolution on a southeast Australian granite: Aboriginal land management hypothesis, Biogeosciences, 11, 4099–4114, https://doi.org/10.5194/bg-11-4099-2014, 2014.
Dean, J. F., Webb, J. A., Jacobsen, G. E., Chisari, R., and Dresel, P. E.: A groundwater recharge perspective on locating tree plantations within low-rainfall catchments to limit water resource losses, Hydrol. Earth Syst. Sci., 19, 1107–1123, https://doi.org/10.5194/hess-19-1107, 2015.
Dean, J. F., Camporese, M., Webb, J. A., Grover, S, P., Dresel, P. E., and Daly, E.: Water balance complexities in ephemeral catchments with different land uses: Insights from monitoring and distributed hydrologic modeling, Water Resour. Res., 52, 4713–4729, https://doi.org/10.1002/2016WR018663, 2016.
de Vries, J. J. and Simmers, I.: Groundwater recharge: An overview of processes and challenges, Hydrogeol. J., 10, 5–17, https://doi.org/10.1007/s10040-001-0171-7, 2002.
Doble, R. C. and Crosbie, R. S.: Review: Current and emerging methods for catchment-scale modelling of recharge and evapotranspiration from shallow groundwater, Hydrogeol. J., 25, 3–23, https://doi.org/10.1007/s10040-016-1470-3, 2017.
Dresel, P. E., Zydor, H., Hekmeijer, P., and Adelana, S. M.: Catchment scale impacts of land use in south-western Victoria, Project CMI Number 102920, State Government of Victoria, Department of Primary Industries, Bendigo, Australia, ISBN 9781742642337, 2012.
Dresel, P. E., Dean, J. F., Perveen, F., Webb, J. A., Hekmeijer, P., Adelana, S. M., and Daly, E.: Effect of eucalyptus plantations, geology, and precipitation variability on water resources in upland intermittent catchments, J. Hydrol., 564, 723–739, https://doi.org/10.1016/j.jhydrol.2018.07.019, 2018.
Eriksson, E. and Khunakasem, V.: Chloride concentrations in groundwater, recharge rate and rate of deposition of chloride in the Israel coastal plain, J. Hydrol., 7, 178–197, https://doi.org/10.1016/0022-1694(69)90055-9, 1969.
Favreau, G., Leduc, C., Marlin, C., Dray, M., Taupin, J. D., Massault, M., Le Gal La Salle, C., and Babic, M.: Estimate of recharge of a rising water table in semiarid niger from 3H and 14C modeling, Groundwater, 40, 144–151, https://doi.org/10.1111/j.1745-6584.2002.tb02499.x, 2002.
Fohrer, N., Haverkamp, S., Eckhardt, K., and Frede, H. G.: Hydrologic response to land use changes on the catchment scale, Phys. Chem. Earth B, 26, 577–582, https://doi.org/10.1016/S1464-1909(01)00052-1, 2001.
Foley, J. A., de Fries, R., Asner, G. P., Barford, C., Bonan, G., Carpenter, S. R., Chapin, F. S., Coe, M. T., Daily, G. C., Gibbs, H. K., Helkowski, J. H., Holloway, T., Howard, E. A., Kucharik, C. J., Monfreda, C., Patz, J. A., Prentice, C., Ramankutty, N., and Snyder, P. K.: Global consequences of land use, Science, 309, 570–574, https://doi.org/10.1126/science.1111772, 2005.
Gee, G., Fayer, M., Rockhold, M., and Campbell, M.: Variations in recharge at the Hanford Site, Northwest Science, WSU Press, Washington, USA, 66 pp., 1992.
Gelsinari, S., Doble, R., Daly, E., and Pauwels, V. R. N.: Feasibility of improving groundwater modeling by assimilating evapotranspiration rates, Water Resour. Res., 56, e2019WR025983, https://doi.org/10.1029/2019WR025983, 2020.
Gillham, R. W.: The capillary fringe and its effect on water-table response, J. Hydrol., 67, 307–324, https://doi.org/10.1016/0022-1694(84)90248-8, 1984.
Healy, R. W.: Estimating Groundwater Recharge, Cambridge University Press, Cambridge, ISBN 9780511780745, https://doi.org/10.1017/CBO9780511780745, 2010.
Healy, R. W. and Cook, P. G.: Using groundwater levels to estimate recharge, Hydrogeol. J., 10, 91–109, https://doi.org/10.1007/s10040-001-0178-0, 2002.
Herczeg, A. L., Dogramaci, S. S., and Leaney, F. W. J.: Origin of dissolved salts in a large, semi-arid groundwater system: Murray Basin, Australia, Aust. J. Mar. Freshw. Res., 52, 41–52, https://doi.org/10.1071/MF00040, 2001.
Hewlett, J. D. and Hibbert, A. R.: Factors affecting the response of small watersheds to precipitation in humid areas, Forest Hydrol., 1, 275–290, https://doi.org/10.1177/0309133309338118, 1967.
Howcroft, W., Cartwright, I., Fifield, L. K., and Cendón, D. I.: Differences in groundwater and chloride residence times in saline groundwater: The Barwon River catchment of southeast Australia, Chem. Geol., 451, 154–168, https://doi.org/10.1016/j.chemgeo.2017.01.015, 2017.
Hua, Q. and Barbetti, M.: Review of tropospheric bomb 14C data for carbon cycle modeling and age calibration purposes, Radiocarbon, 46, 1273–1298, https://doi.org/10.1017/S0033822200033142, 2004.
Hutton, J. and Leslie, T.: Accession of non-nitrogenous ions dissolved in rainwater to soils in Victoria, Aust. J. Agricult. Res., 9, 492–507, https://doi.org/10.1071/AR9580492, 1958.
Hvorslev, M. J.: Time lag and soil permeability in ground-water observations, Bulletin No. 36, Waterways Experiment Station, Corps of Engineers, United States Army, Vicksburg, Mississippi, 1951.
Jurgens, B. C., Bohkle, J. K., and Eberts, S. M.: TracerLPM (Version 1): An Excel® workbook for interpreting groundwater age distributions from environmental tracer data, United States Geological Survey, Techniques and Methods Report 4-F3, United States Geological Survey, Reston, USA, 60 pp., https://doi.org/10.3133/tm4F3, 2012.
Kloppmann, W., Négrel, P., Casanova, J., Klinge, H., Schelkes, K., and Guerrot, C.: Halite dissolution derived brines in the vicinity of a Permian salt dome (N German Basin). Evidence from boron, strontium, oxygen, and hydrogen isotopes, Geochim. Cosmochim. Ac., 65, 4087–4101, https://doi.org/10.1016/S0016-7037(01)00640-8, 2001.
Le Gal La Salle, C., Marlin, C., Leduc, C., Taupin, J. D., Massault, M., and Favreau, G.: Renewal rate estimation of groundwater based on radioactive tracers (3H, 14C) in an unconfined aquifer in a semi-arid area, Iullemeden Basin, Niger, J. Hydrol., 254, 145–156, https://doi.org/10.1016/S0022-1694(01)00491-7, 2001.
Leduc, C., Sabljak, S., Taupin, J. D., Marlin, C., and Favreau, G.: Recharge of the Quaternary water table in the northwestern Lake Chad Basin (southeastern Niger) estimated from isotopes, Comptes Rendus de I'Académie des Sciences – Series IIA – Earth and Planetary Science, 330, 355–361, ISSN 12518050, 2000.
Lerner, D. N. and Harris, B.: The relationship between land use and groundwater resources and quality, Land Use Policy, 26S, S265–S273, https://doi.org/10.1016/j.landusepol.2009.09.005, 2009.
Lerner, D. N., Issar, A. S., and Simmers, I.: Groundwater recharge: A guide to understanding and estimating natural recharge, International Contributions to Hydrogeologists, 10, Imternational Association of Hydrogeologists, Goring, UK, 1990.
Lewis, M. F.: Factors affecting the development of dryland salinity in a catchment on the Dundas tableland, western Victoria, Land Protection Service, Department of Conservation Forests and Lands, Kew, Australia, 7, 1–97, 1985.
Maloszewski, P. and Zuber, A.: Determining the turnover time of groundwater systems with the aid of environmental tracers: 1, Models and their applicability, J. Hydrol., 57, 207–231, https://doi.org/10.1016/0022-1694(82)90147-0, 1982.
McCormac, F. G., Hogg, A. G., Blackwell, P. G., Buck, C. E., Higham, T. F. G., and Reimer, P. J.: SHCal04 Southern Hemisphere Calibration, 0–11.0 cal kyr BP, Radiocarbon, 46, 1087–1092, https://doi.org/10.1017/S0033822200033014, 2004.
Moeck, C., Grech-Cumbo, N., Podgorski, J., Bretzler, A., Gurdak, J. J., Berg, M., and Schirmer, M.: A global-scale dataset of direct natural groundwater recharge rates: A review of variables, processes and relationships, Sci. Total Environ., 717, 137042, https://doi.org/10.1016/j.scitotenv.2020.137042, 2020.
Morgenstern, U. and Taylor, C. B.: Ultra low-level tritium measurement using electrolytic enrichment and LSC, Isotop. Environ. Health Stud., 45, 96–117, https://doi.org/10.1080/10256010902931194, 2009.
Morgenstern, U., Stewart, M. K., and Stenger, R.: Dating of streamwater using tritium in a post nuclear bomb pulse world: continuous variation of mean transit time with streamflow, Hydrol. Earth Syst. Sci., 14, 2289–2301, https://doi.org/10.5194/hess-14-2289-2010, 2010.
Owuor, S. O., Butterbach-Bahl, K., Guzha, A. C., Rufino, M. C., Pelster, D. E., Díaz-Pinés, E., and Breuer, L.: Groundwater recharge rates and surface runoff response to land use and land cover changes in semi-arid environments, Ecol. Process., 5, 16, https://doi.org/10.1186/s13717-016-0060-6, 2016.
Perveen, F.: Assessing the impacts of changing land use and geology on groundwater and surface water resources in south-western Victoria, Australia, PhD Thesis, School of Life Sciences, College of Science, Health and Engineering, La Trobe University, Bundoora, Victoria 3086, Australia, 1-243, hdl.handle.net/1959.9/560005, 2016.
Raiber, M., Webb, J. A., Cendón, D. I., White, P. A., and Jacobsen, G. E.: Environmental isotopes meet 3D geological modelling: conceptualising recharge and structurally controlled aquifer connectivity in the basalt plain of southwestern Victoria, Australia, J. Hydrol., 527, 262–280, https://doi.org/10.1016/j.jhydrol.2015.04.053, 2015.
Scanlon, B. R.: Uncertainties in estimating water fluxes and residence times using environmental tracers in an arid unsaturated zone, Water Resour. Res., 36, 395–409, https://doi.org/10.1029/1999WR900240, 2000.
Scanlon, B. R., Healy, R. W., and Cook, P. G.: Choosing appropriate techniques for quantifying groundwater recharge, Hydrogeol. J., 10, 18–39, https://doi.org/10.1007/s10040-001-0176-2, 2002.
Scanlon, B. R., Keese, K. E., Flint, A. L., Flint, L. E., Gaye, C. B., Edmunds, W. M., and Simmers, I.: Global synthesis of groundwater recharge in semiarid and arid regions, Hydrol. Process., 20, 3335–3370, https://doi.org/10.1002/hyp.6335, 2006.
Scudeler, C., Pangle, L., Pasetto, D., Niu, G.-Y., Volkmann, T., Paniconi, C., Putti, M., and Troch, P.: Multiresponse modeling of variably saturated flow and isotope tracer transport for a hillslope experiment at the Landscape Evolution Observatory, Hydrol. Earth Syst. Sci., 20, 4061–4078, https://doi.org/10.5194/hess-20-4061-2016, 2016.
Sibanda, T., Nonner, J. C., and Uhlenbrook, S.: Comparison of groundwater recharge estimation methods for the semi-arid Nyamandhlovu area, Zimbabwe, Hydrogeol. J., 17, 1427–1441, https://doi.org/10.1007/s10040-009-0445-z, 2009.
Siebert, S., Burke, J., Faures, M., Frenken, K., Hoogeveen, J., Döll, P., and Portmann, F. T.: Groundwater use for irrigation – a global inventory, Hydrol. Earth Syst. Sci., 14, 1863–1880, https://doi.org/10.5194/hess-14-1863-2010, 2010.
Sophocleous, M.: The role of specific yield in groundwater recharge estimations: A numerical study, Groundwater, 23, 52–58, https://doi.org/10.1111/j.1745 6584.1985.tb02779.x, 1985.
Stewart, M. K., Thomas, J. T., Norris, M., and Trompetter, V.: Paleogroundwater in the Moutere gravel aquifers near Nelson, New Zealand, Radiocarbon, 46, 517–529, https://doi.org/10.1017/S0033822200035578, 2004.
Sudicky, E. A. and Frind, E. O.: Carbon 14 dating of groundwater in confined aquifers: Implications of aquitard diffusion, Water Resour. Res., 17, 1060–1064, https://doi.org/10.1029/WR017i004p01060, 1981.
Tadros, C. V., Hughes, C. E., Crawford, J., Hollins, S. E., and Chisari, R.: Tritium in Australian precipitation: A 50 year record, J. Hydrol., 513, 262–273, https://doi.org/10.1016/j.apgeochem.2014.04.016, 2014.
Vogel, J. C.: Groningen radiocarbon dates IX, Radiocarbon, 12, 444–471, https://doi.org/10.1017/S0033822200008183, 1970.
Wada, Y., van Beek, L. P. H., van Kempen, C. M., Reckman, J. W. T. M., Vasak, S., and Bierkens, M. F. P.: Global depletion of groundwater resources, Geophys. Res. Lett., 37, L20402, https://doi.org/10.1029/2010GL044571, 2010.
Zuber, A. and Maloszewski, P.: Lumped parameter models, in: chap. 2, vol 6: Modelling in Environmental Isotopes in the Hydrological Cycle: Principles and Applications, Technical Documents in Hydrology, edited by: Mook, W. G. and Yurtsever, Y., UNESCO, Paris, France, 39, 5–35, 2001.