the Creative Commons Attribution 4.0 License.
the Creative Commons Attribution 4.0 License.
 | 19 Feb 2021
Determination of vadose zone and saturated zone nitrate lag times using long-term groundwater monitoring data and statistical machine learning
Martin J. Wells
Natalie Nelson
Aaron Mittelstet
John K. Böhlke
In this study, we explored the use of statistical machine learning and long-term groundwater nitrate monitoring data to estimate vadose zone and saturated zone lag times in an irrigated alluvial agricultural setting. Unlike most previous statistical machine learning studies that sought to predict groundwater nitrate concentrations within aquifers, the focus of this study was to leverage available groundwater nitrate concentrations and other environmental variables to determine mean regional vertical velocities (transport rates) of water and solutes in the vadose zone and saturated zone (3.50 and 3.75 m yr−1, respectively). The statistical machine learning results are consistent with two primary recharge processes in this western Nebraska aquifer, namely (1) diffuse recharge from irrigation and precipitation across the landscape and (2) focused recharge from leaking irrigation conveyance canals. The vadose zone mean velocity yielded a mean recharge rate (0.46 m yr−1) consistent with previous estimates from groundwater age dating in shallow wells (0.38 m yr−1). The saturated zone mean velocity yielded a recharge rate (1.31 m yr−1) that was more consistent with focused recharge from leaky irrigation canals, as indicated by previous results of groundwater age dating in intermediate-depth wells (1.22 m yr−1). Collectively, the statistical machine learning model results are consistent with previous observations of relatively high water fluxes and short transit times for water and nitrate in the primarily oxic aquifer. Partial dependence plots from the model indicate a sharp threshold in which high groundwater nitrate concentrations are mostly associated with total travel times of 7 years or less, possibly reflecting some combination of recent management practices and a tendency for nitrate concentrations to be higher in diffuse infiltration recharge than in canal leakage water. Limitations to the machine learning approach include the non-uniqueness of different transport rate combinations when comparing model performance and highlight the need to corroborate statistical model results with a robust conceptual model and complementary information such as groundwater age.
- Article
(5083 KB) - Full-text XML
-
Supplement
(451 KB) - BibTeX
- EndNote


Nitrate is a common contaminant of groundwater and surface water that can affect drinking water quality and ecosystem health. Predicting responses of aquatic resources to changes in nitrate loading can be complicated by uncertainties related to rates and pathways of nitrate transport from sources to receptors. Lag times for the movement of non-point source nitrate contamination through the subsurface are widely recognized (Böhlke, 2002; Meals et al., 2010; Puckett et al., 2011; Van Meter and Basu, 2017) but difficult to measure. Vadose (unsaturated zone) and groundwater (saturated zone) lag times are of critical importance for monitoring, regulating, and managing the transport of contaminants in groundwater. However, transport timescales are often generalized due to the coarse spatiotemporal resolutions in data available for groundwater systems being impacted by agricultural activities (Gilmore et al., 2016; Green et al., 2018; Puckett et al., 2011), which results in a simplified groundwater management approach. Regulators and stakeholders in agricultural landscapes are increasingly in need of more precise and local lag time information to better evaluate and apply regulations and best management practices for the reduction of groundwater nitrate concentrations (e.g., Eberts et al., 2013).
Field-based studies of lag times (time required for water to move through both the vadose zone and saturated zone) commonly use vadose zone sampling and/or expensive groundwater age-dating techniques to estimate nitrate transport rates moving into and through aquifers (Böhlke et al., 2002, 2007; Böhlke and Denver, 1995; Browne and Guldan, 2005; Kennedy et al., 2009; McMahon et al., 2006; Morgenstern et al., 2015; Turkeltaub et al., 2016; Wells et al., 2018). Detailed process-based modeling studies focused on lag times require complex numerical models combined with spatially intensive and/or costly hydrogeological observations (Ilampooranan et al., 2019; Rossman et al., 2014; Russoniello et al., 2016). Thus, efficient but locally applicable modeling approaches are needed (Green et al., 2018; Liao et al., 2012; Van Meter and Basu, 2015). In this study, an alternative data-driven approach (random forest regression) leverages existing long-term groundwater nitrate concentration (hereafter referred to as ) data and easily accessible environmental data to estimate vadose and saturated zone vertical velocities (transport rates) for the determination of subsurface lag times.
Statistical machine learning methods, including random forest, have been used successfully for modeling distribution in aquifers (Anning et al., 2012; Juntakut et al., 2019; Knoll et al., 2020; Nolan et al., 2014; Ouedraogo et al., 2017; Rodriguez-Galiano et al., 2014; Rahmati et al., 2019; Vanclooster et al., 2020; Wheeler et al., 2015), but there has not been robust analysis of model capabilities for estimating vadose and/or saturated zone lag times. Proxies for lag time, such as well screen depth, have been used as predictors in random forest models (Nolan et al., 2014; Wheeler et al., 2015). Decadal lag times have been suggested from using time-averaged nitrogen inputs as predictors (e.g., 1978–1990 inputs vs. 1992–2006 inputs) and by comparing their relative importance in the model (Wheeler et al., 2015). The application of similar machine learning methods suggested that groundwater age could be used as a predictor to improve model performance (Ransom et al., 2017). Hybrid models, using both mechanistic models and machine learning, have also sought to integrate vertical transport model parameters and outputs to evaluate nitrate-related predictors, including vadose zone travel times (Nolan et al., 2018).
The objective of this study is to test a data-driven approach for estimating vadose and saturated zone transport rates and lag times for an intensively monitored alluvial aquifer in western Nebraska (Böhlke et al., 2007; Verstraeten et al., 2001a, 2001b; Wells et al., 2018). Results are compared to the hydrogeologic and mechanistic understanding from previous groundwater studies to determine the strengths and weaknesses of the approach as (1) a stand-alone technique or (2) as an exploratory analysis to guide or complement more complex physically based models or intensive hydrogeologic field investigations.
2.1 Site description
The Dutch Flats study area is in the western Nebraska counties of Scotts Bluff and Sioux (Fig. 1). The North Platte River delivers large quantities of water for crop irrigation to this region and runs along the southern portion of this study area. Irrigation water is diverted from the North Platte River into three major canals (Mitchell–Gering, Tri-State, and Interstate) that feed a network of minor canals. Several previous Dutch Flats area studies have investigated groundwater characteristics and provided thorough site descriptions of the semiarid region (Babcock et al., 1951; Böhlke et al., 2007; Verstraeten et al., 2001a, 2001b; Wells et al., 2018) The Dutch Flats area overlies an alluvial aquifer characterized by unconsolidated deposits of predominantly sand and gravel, with the aquifer base largely consisting of consolidated deposits of the Brule, Chadron, or Lance formations (Verstraeten et al., 1995; Fig. 2). Irrigation water not derived from the North Platte River is typically pumped from the alluvial aquifer or water-bearing units of the Brule Formation.
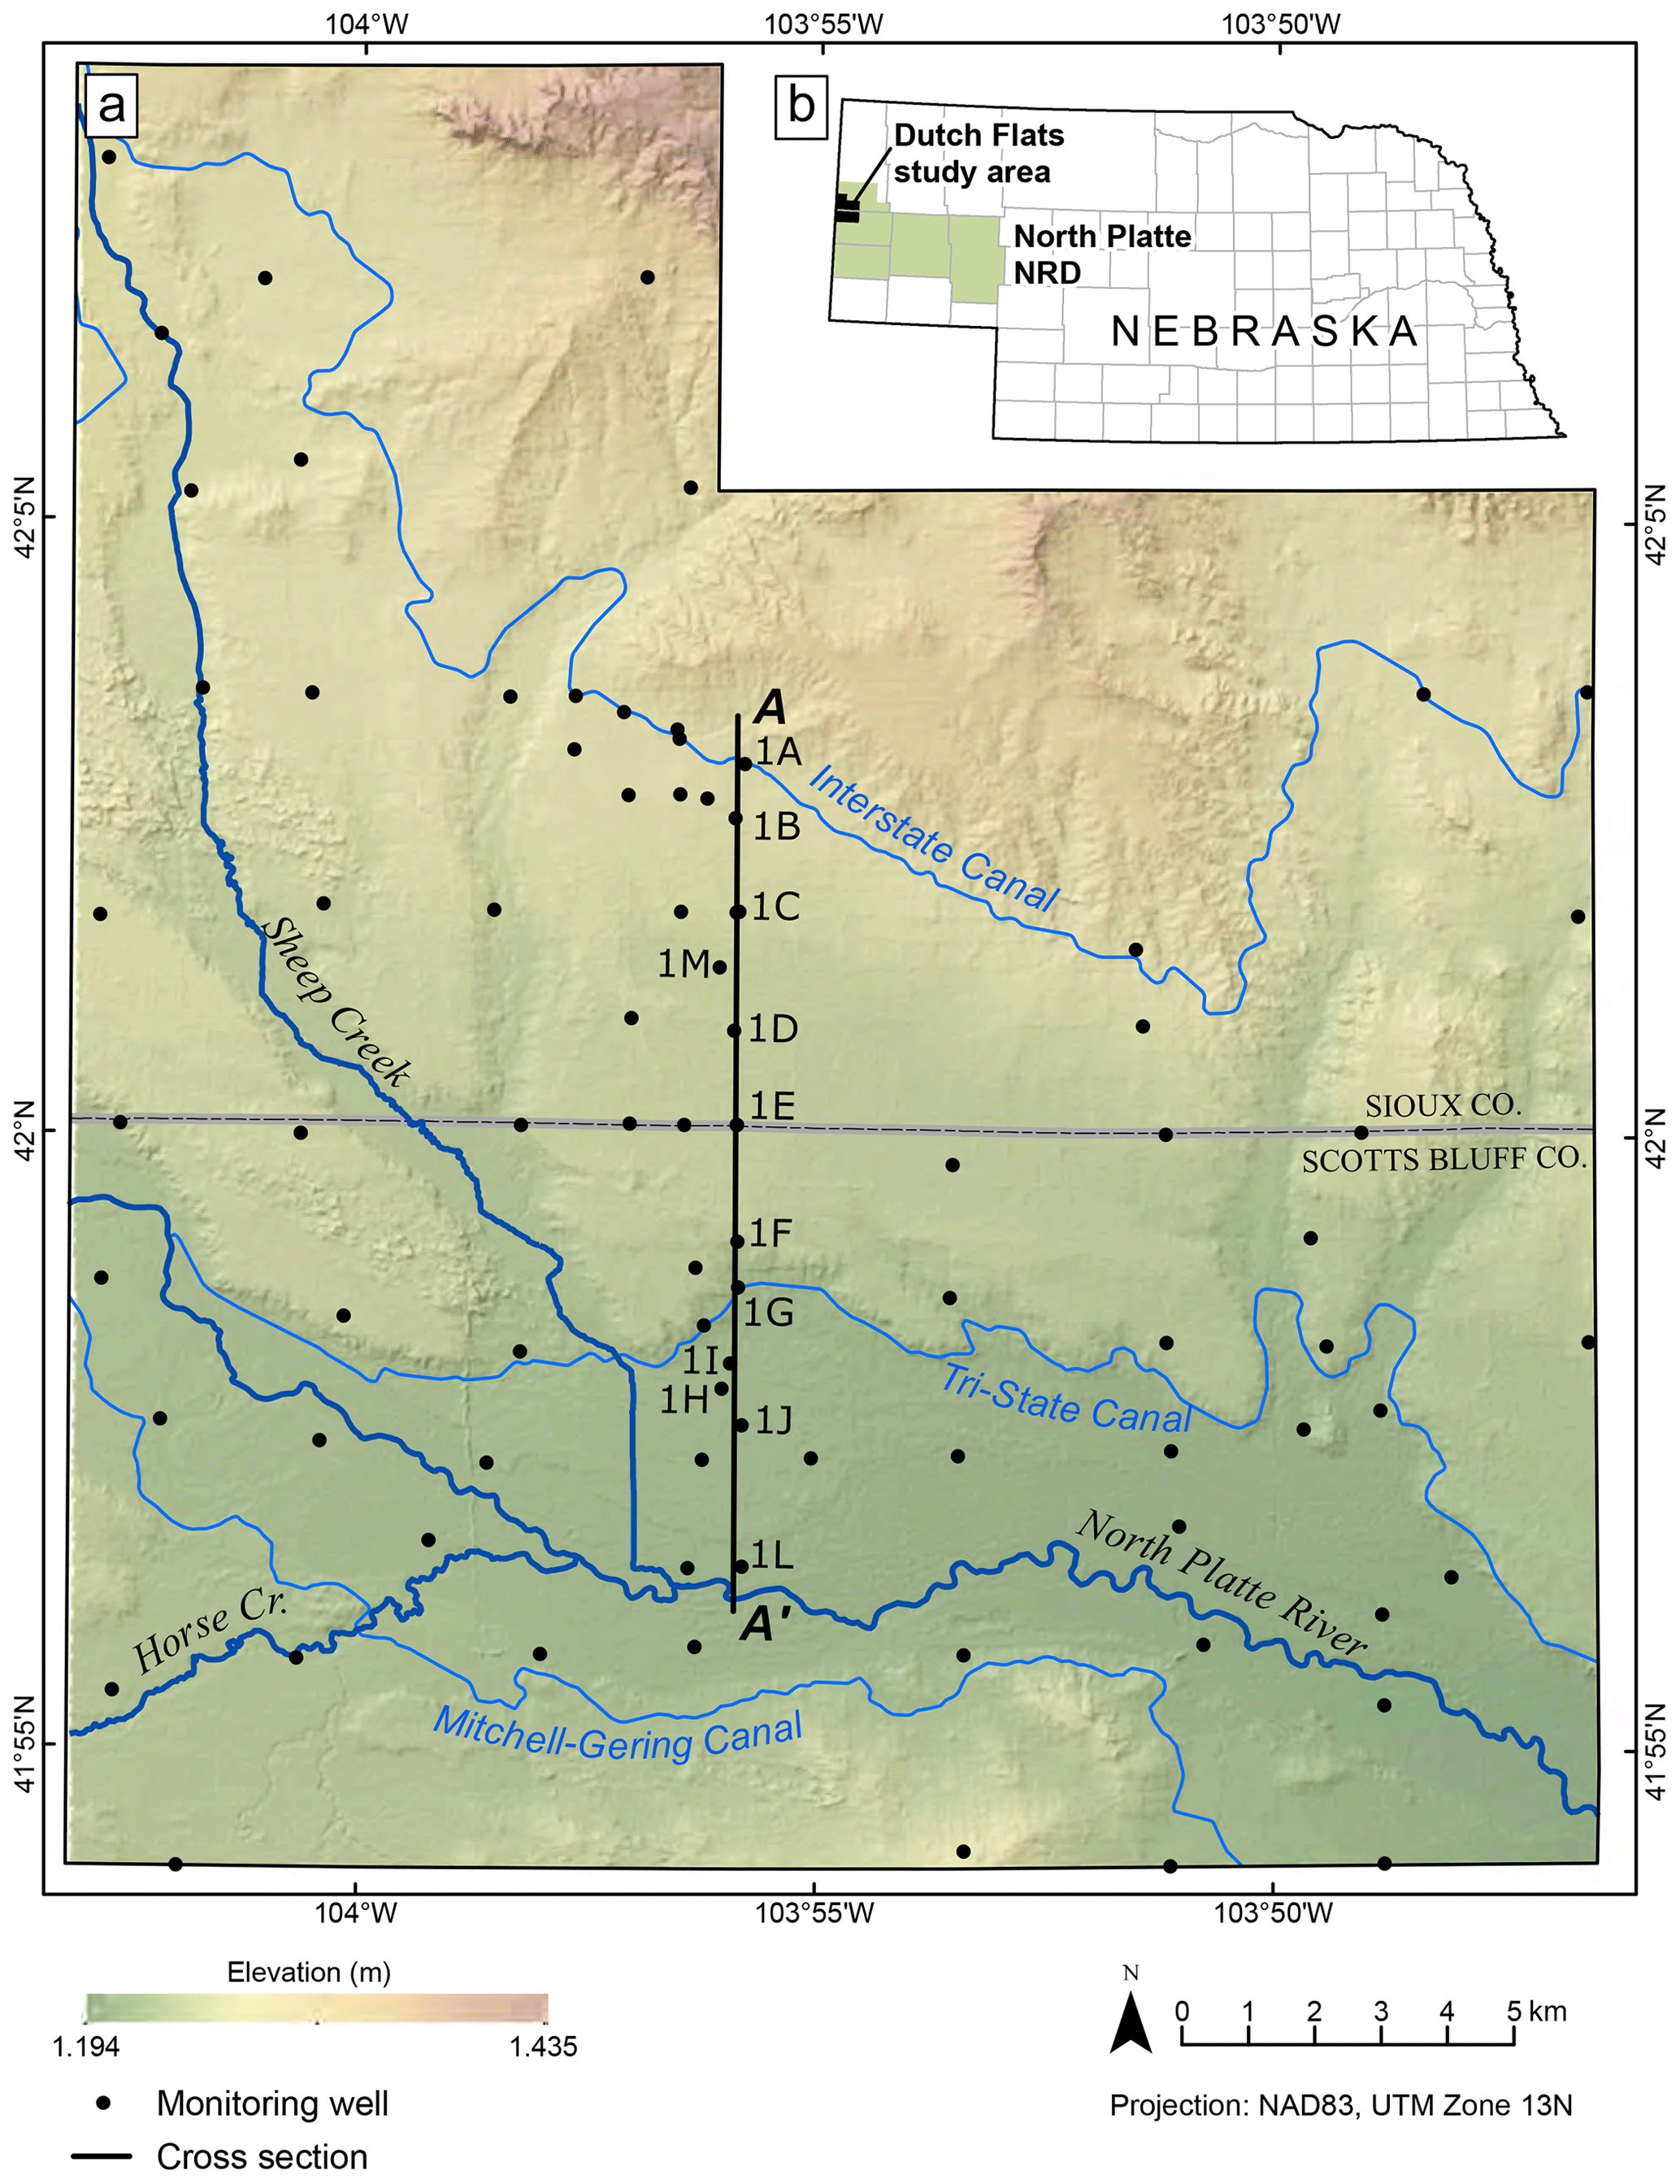
Figure 1Dutch Flats study area (a) overlain by 30 m digital elevation model (DEM; USGS, 1997). The study area is located within the North Platte Natural Resources District of western Nebraska (b). Depending on data availability, multiple wells (well nest) or a single well may be found at each monitoring well location. Transect A–A′ represents the location and wells displayed in the Fig. 2 hydrogeologic cross section.
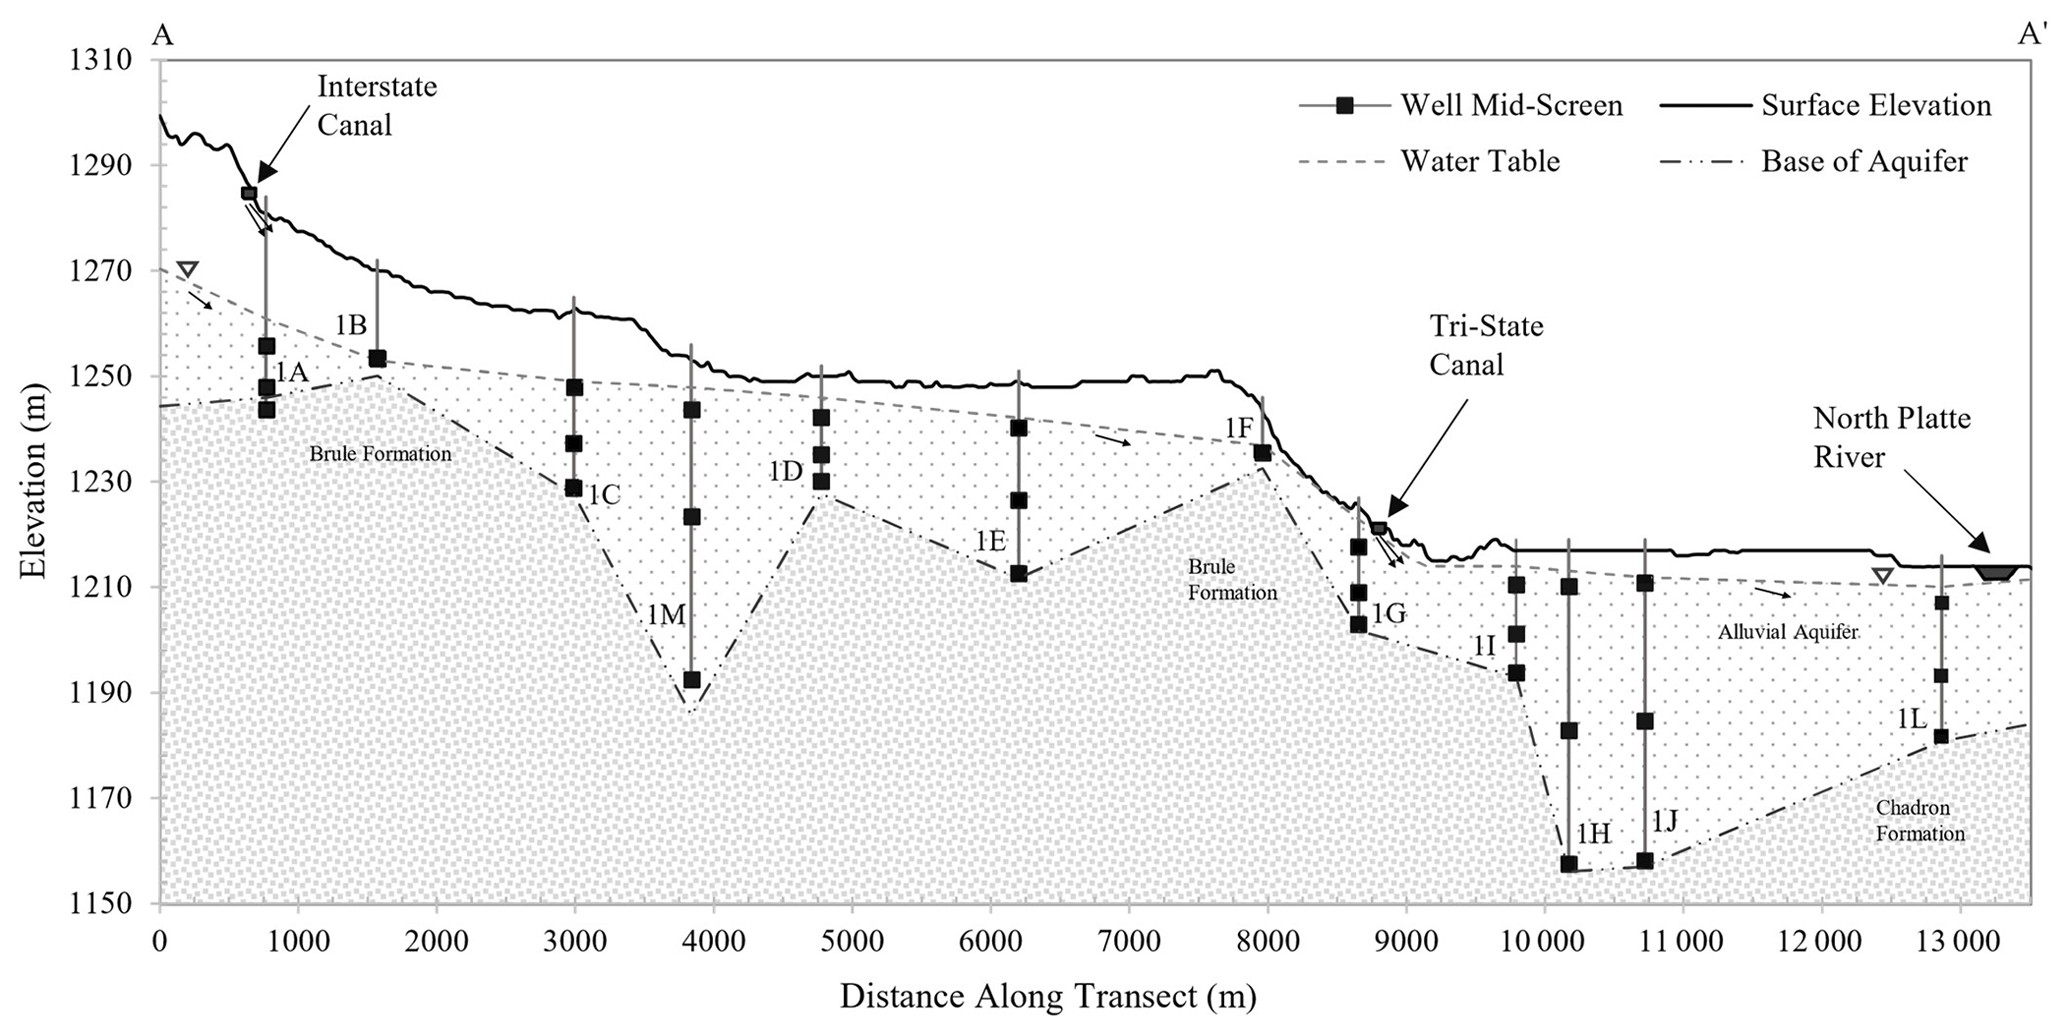
Figure 2Cross section along representative well transect (see Fig. 1) within the Dutch Flats area. Surface elevation data were derived from a 30 m digital elevation model (USGS, 1997). Water surface and base of aquifer elevations were sourced from a 1998 Dutch Flats study (Böhlke et al., 2007; Verstraeten et al., 2001a, 2001b). Small black arrows beneath the surface indicate general groundwater flow direction.
The total area of the Dutch Flats study area is roughly 540 km2, of which approximately 290 km2 (53.5 %) is agricultural land (cultivated crops and pasture). Most agricultural land is concentrated south of the Interstate Canal (Homer et al., 2015). Due to the combination of intense agriculture and low annual precipitation, producers in Dutch Flats rely on a network of irrigation canals to supply water to the region. From 1908 to 2016, a mean precipitation of 390 mm was measured at the nearby Western Nebraska Regional Airport in Scottsbluff, NE (NOAA, 2017).
While some groundwater is withdrawn for irrigation and some irrigated acres in the study area are classified as commingled (groundwater and surface water source), Scotts Bluff County irrigation is mostly from surface water sources. Estimates determined every 5 years suggest that surface water provided between 76.8 % and 98.6 % of the total water withdrawals from 1985 to 2015, which is about 92 % on average (Dieter et al., 2018). Canals transport water from the North Platte River to fields throughout the study area, most of which are downgradient (south) of the Interstate Canal. Mitchell–Gering, Tri-State, and Interstate canals are the major canals in Dutch Flats, with the latter holding the largest water right of 44.5 m3 s−1 (NEDNR, 2009). Leakage from these canals provides a source of artificial groundwater recharge. Previous studies estimate that the leakage potential of canals in the region results in as much as 40 % to 50 % of canal water being lost during conveyance (Ball et al., 2006; Harvey and Sibray, 2001; Hobza and Andersen, 2010; Luckey and Cannia, 2006). Leakage estimates from a downstream section of the Interstate Canal (extending to the east of the study area; Hobza and Andersen, 2010) suggest fluxes ranging from 0.08 to 0.7 m d−1 through the canal bed. Assuming a leakage of 0.39 m d−1 over the Interstate Canal bed area (16.8 m width × 55.5 km length) within Dutch Flats yields of leakage. Applied over an average operation period of 151 d (USBR, 2018), leakage from the Interstate Canal alone could approach 6.1×10⁷ m3 annually, which is about 29 % of the annual volume of precipitation in the Dutch Flats area.
A 1990s study investigated both the spatial and temporal influences from canals in the Dutch Flats area (Verstraeten et al., 2001a, 2001b), with the results later synthesized by Böhlke et al. (2007). Canals were found to dilute groundwater locally with low- (e.g., in 1997) surface water during the irrigation season. age dating was used to determine apparent groundwater ages and recharge rates. It was noted that wells near canals displayed evidence of high recharge rates influenced by local canal leakage. Data from wells far from the canals indicated that shallow groundwater was more likely influenced by local irrigation practices (i.e., furrows in fields), while deeper groundwater was impacted by both localized irrigation and canal leakage (Böhlke et al., 2007). Shallow groundwater in the Dutch Flats area has hydrogen and oxygen stable isotopic compositions consistent with surface water sources (i.e., North Platte River and associated canals), indicating that most groundwater intercepted by the monitoring well network has been affected by surface water irrigation recharge (Böhlke et al., 2007; Cherry et al., 2020).
The Dutch Flats area is within the North Platte Natural Resources District (NPNRD), one of 23 groundwater management districts in Nebraska tasked with, among other functions, improving water quality and quantity. The NPNRD has a large monitoring well network consisting of 797 wells, 327 of which are nested. Nested well clusters are drilled and constructed such that screen intervals represent (1) shallow groundwater intersecting the water table (length of screened interval=6.1 m), (2) intermediate groundwater from mid-aquifer depths (length of screened interval=1.5 m), and (3) deep groundwater near the base of the unconfined aquifer (length of screened interval=1.5 m). Depending on well location within the Dutch Flats area, depths of the water table and base of aquifer are highly variable, such that shallow, intermediate, and deep wells can have overlapping ranges of depths below land surface (Fig. 2).
Influenced by both regulatory and economic incentives, the Dutch Flats area has undergone a notable shift in irrigation practices in the last two decades. From 1999 to 2017, the center pivot irrigated area has increased by approximately 270 %, from roughly 3830 to 14 253 ha or from 13 % to 49 % of the total agricultural land area, respectively. Most of this shift in technology has occurred on fields previously under furrow irrigation. Conventional furrow irrigation has an estimated potential application efficiency (which is a “measure of the fraction of the total volume of water delivered to the farm or field to that which is stored in the root zone to meet the crop evapotranspiration needs,” according to Irmak et al., 2011) of 45 % to 65 %, compared to center pivot sprinklers at 75 % to 85 % (Irmak et al., 2011). Based on improved irrigation efficiency (between 10 % and 40 %), the average precipitation throughout the growing season (29.5 cm for 15 April to 13 October; Yonts, 2002), and average water requirements for corn (69.2 cm; Yonts, 2002), converting furrow irrigated fields to center pivot over the aforementioned 14 253 ha could represent a difference of 1×10⁷ m3 to 6×10⁷ m3 in the water applied. Those (roughly approximated) differences in water volumes are equivalent to between 6 % and 28 % of the average annual precipitation applied over the Dutch Flats area, suggesting that the change in irrigation practice does have potential to alter the water balance in the area.
The hypothesis of lower recharge due to changes in irrigation technology was investigated by Wells et al. (2018), who compared samples collected in 1998 and 2016. Sample sites were selected based on a well's proximity to the fields that experience a conversion in irrigation practices (i.e., furrow irrigation to center pivot) between the two collection periods. While the mean recharge rate was not significantly different, a lower recharge rate was indicated by data from 88 % of the wells. Long-term Dutch Flats trends were also assessed in the study, suggesting decreasing trends (though statistically insignificant) from 1998 to 2016 throughout the Dutch Flats area, and nitrogen isotopes of nitrate indicated little change in the biogeochemical processes. For additional background, Wells et al. (2018) provides a more in-depth analysis of recent trends in this region (see also Fig. S1A in the Supplement, which shows the nitrate data used in the present study).
As in other agricultural areas, nitrate in Dutch Flats groundwater is dependent on nitrogen loading at the land surface, the rate of leaching below crop root zones, the rate of nitrate transport through the vadose and saturated zones, the dilution from focused recharge in the vicinity of canals, the rate of discharge from the aquifer (whether from pumping or discharge to surface water bodies), and the rates of nitrate reduction (primarily denitrification) in the aquifer. Based on nitrogen and oxygen isotopes in nitrate and redox conditions observed in previous studies, denitrification likely has a relatively minor or localized influence on groundwater nitrate in the Dutch Flats area (Wells et al., 2018). Evidence of denitrification (from dissolved gases and isotopes (Böhlke et al., 2007; Wells et al., 2018) was mostly limited to some of the deepest wells near the bottom of the aquifer. Leakage of low-nitrate water in the major canals causes nitrate dilution in the groundwater (i.e., relatively little nitrate addition, at least from the upgradient canals). Additional isotope data might be useful for documenting temporal shifts in recharge sources or irrigation return flows to the river; however, it is difficult to know the exact location or size of the contributing area for each well, especially for the deeper ones.
Other long-term changes to the landscape were evaluated by Wells et al. (2018) and included statistically significant reductions in mean fertilizer application rates (1987–1999 vs. 2000–2012) and the volume of water diverted into the Interstate Canal (1983–1999 vs. 2000–2016), while a significant increase in the area of planted corn occurred (1983–1999 vs. 2000–2016). Precipitation was also evaluated, and though the mean has decreased over a similar time period, the trend was not statistically significant.
2.2 Statistical machine learning modeling framework
Statistical machine learning uses algorithms to assess and identify complex relationships between variables. Learned relations can be used to uncover nonlinear trends in data that might otherwise be overshadowed when using simple regression techniques (Hastie et al., 2009). In this study, we used random forest regression to evaluate site-specific explanatory variables (e.g., precipitation, vadose zone thickness, depth to the bottom of screen, etc.) that may impact the response variable, i.e., groundwater . Additionally, as described in detail in Sect. 2.4, we estimated a range of total travel times (from land surface to the point of sampling) at each of the wells by varying the vadose and saturated zone transport rates. The relative importance of total travel time as a predictor variable was ultimately used to identify an optimal travel time and model.
2.3 Variables and project setup
Data from 15 predictors were collected and analyzed (Table 1). Spatial variables were manipulated using ArcGIS 10.4. The data set for the entire NPNRD had 10 676 observations from 1979 to 2014 and was downloaded from the Quality-Assessed Agrichemical Contaminant Database for Nebraska Groundwater (University of Nebraska – Lincoln, 2016). We used data encompassed by the Dutch Flats model area (2829 observations from 214 wells). In order to have an accurate vadose zone thickness, only wells with a corresponding depth to groundwater record, of which the most recent record was used, were selected (2651 observations from 172 wells). Over this period, several wells were sampled much more frequently than others (e.g., monthly sampling over a short period of record), especially during a U.S. Geological Survey (USGS) National Water-Quality Assessment (NAWQA) study from 1995 to 1999. To prevent those wells from dominating the training and testing of the model, the annual median was calculated for each well and used in the data set. The data set was further manipulated such that each median observation had 15 complementary predictors (Table 1). The selected predictor variables capture the drivers of long-term and lags. After incorporating all the data, including limited records of dissolved oxygen (DO), the final data set included 1049 observations from 162 wells sampled between 1993 and 2013 (Fig. S1A). Additional details of the data selection, sources, and manipulations may be found in the Supplement.
Table 1List of the 15 predictors used for random forest evaluation. Average (avg.) and median (med.) values are shown, and DEM denotes digital elevation model.
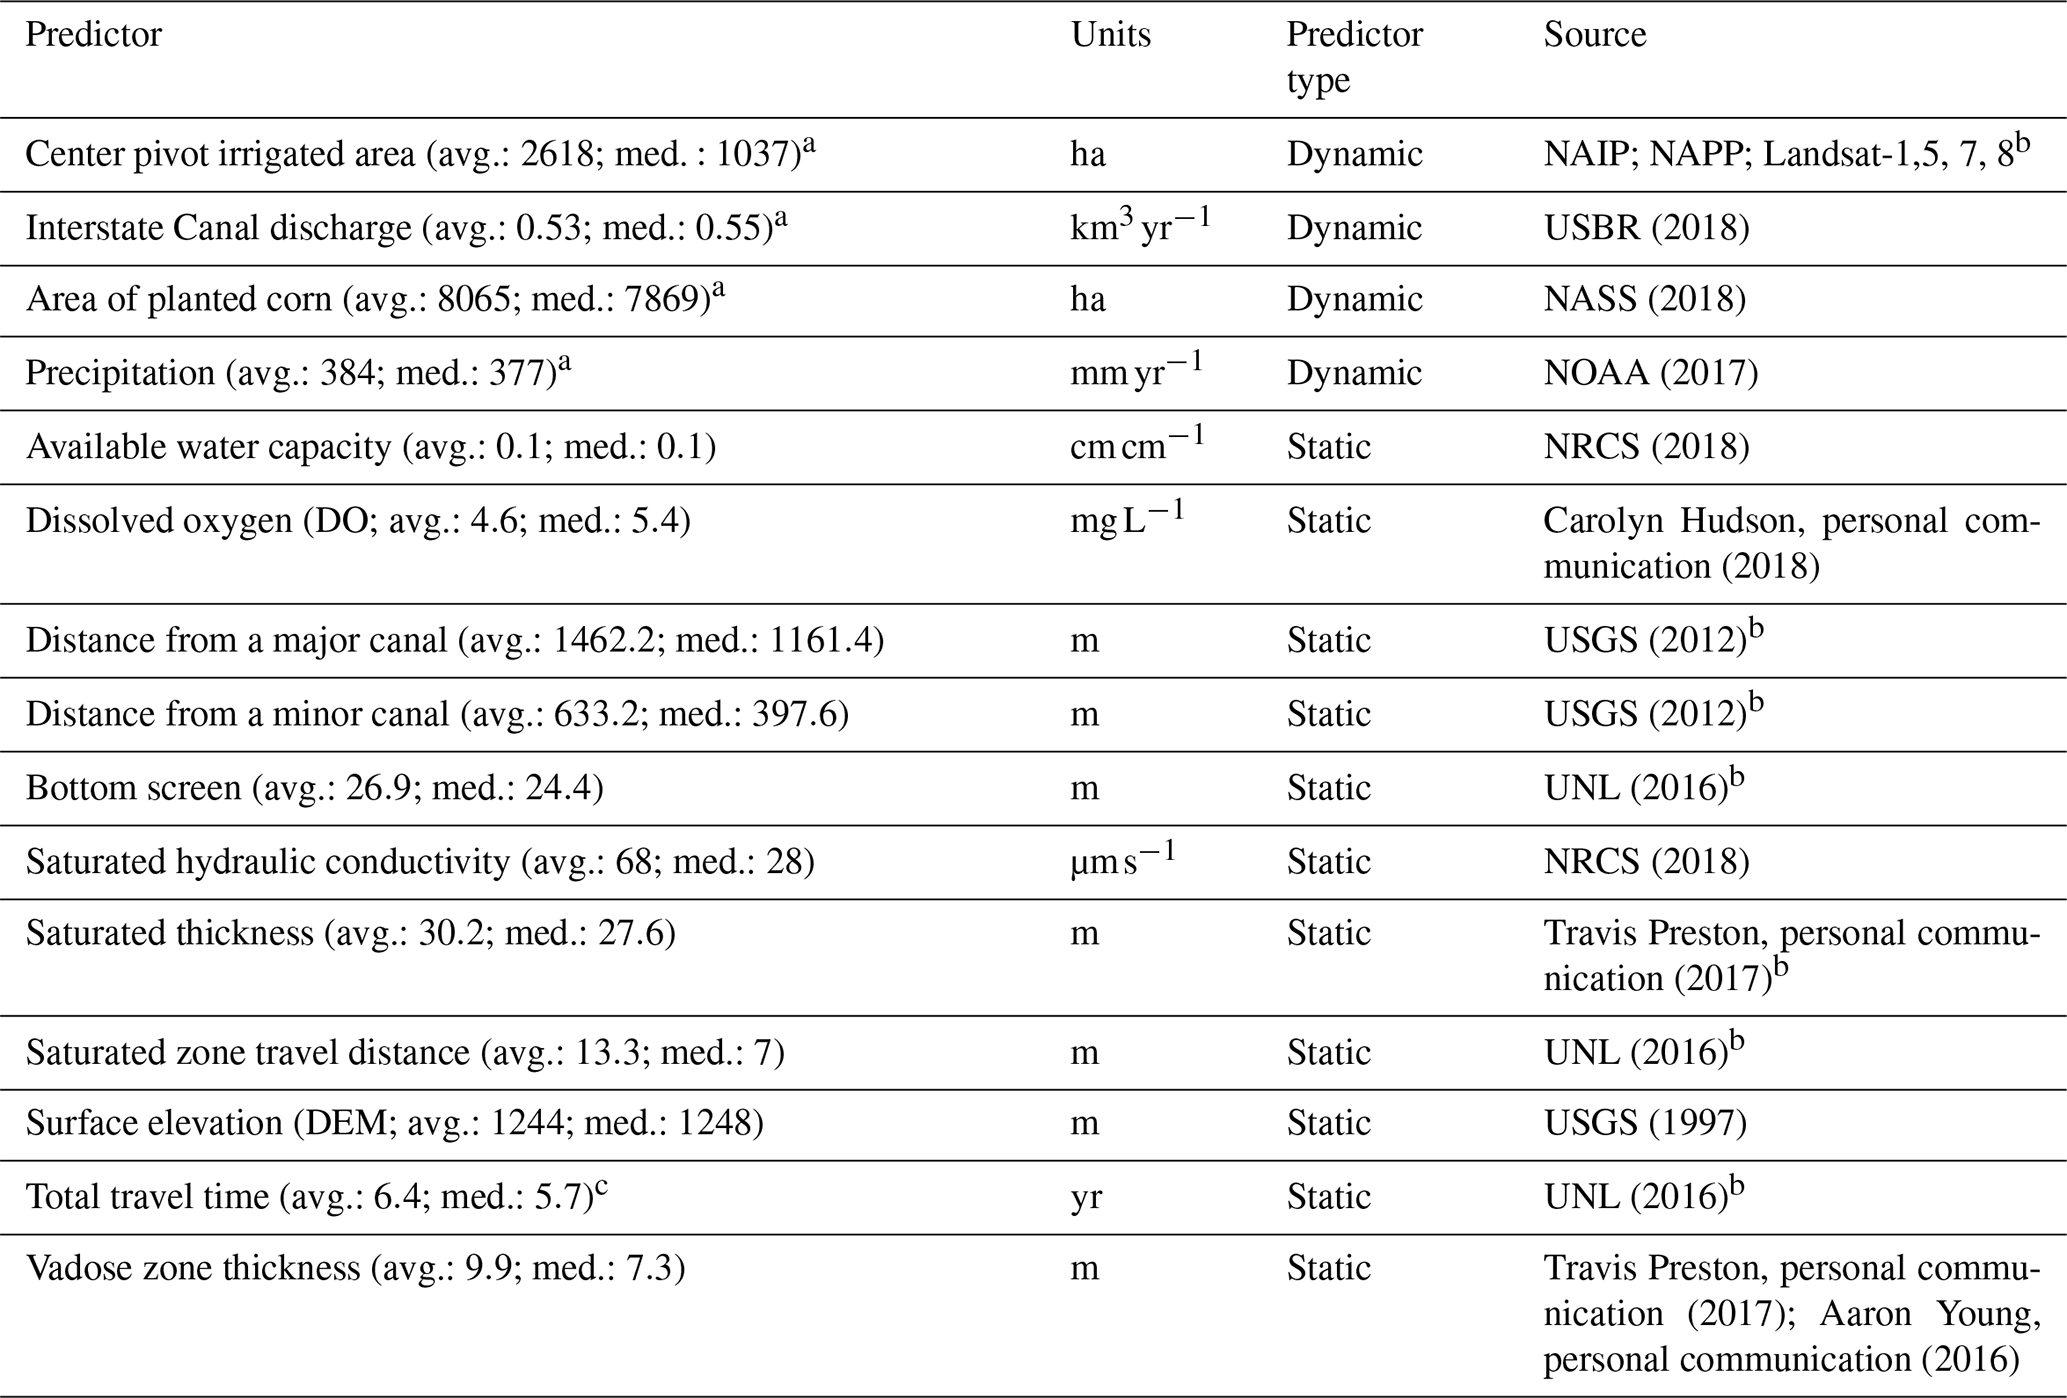
a Average and median span from 1946 to 2013. b Data required further analysis to yield calculated values; data sources are USDA (2017) and USGS (2017). c Average and median reflects transport rates of and .
Predictors were divided into two categories, namely static and dynamic (Table 1). Static predictors are those that either did not change over the period of record or had only short records. DO, for example, could potentially experience slight annual variations, but the data were not available to assign each nitrate sample with a unique DO value. Instead, observations for each well were assigned the average DO value observed from the well. This approximation was considered reasonable because nitrate isotopic composition and DO data from Wells et al. (2018) and Böhlke et al. (2007) did not indicate any major changes to the biogeochemical processes over nearly 2 decades. Total travel time (from ground surface to the point of sampling) was strictly considered a static predictor in this study and was used to link the nitrate sampling year to a dynamic predictor value.
Dynamic predictors were defined in this study as data that changed temporally over the study period. Therefore, each annual median was assigned a lagged dynamic value to represent the difference between the time of a particular surface activity (e.g., timing of a particular irrigation practice) and when the groundwater sampling occurred. Dynamic predictors were available from 1946 to 2013 and included annual precipitation, Interstate Canal discharge, the area under center pivot sprinklers, and the area of planted corn (Fig. 3). Dynamic predictors were included to assess their ability to optimize random forest groundwater modeling and determine an appropriate lag time. Lag times were based on the vertical travel distance through both the vadose and saturated zones (see Sect. 2.4). The area of planted corn was included as a proxy for fertilizer data, which were unavailable prior to 1987. However, the analysis suggests that there has been a 17 % reduction (comparing the means of 1987–1999 to 2000–2012) in fertilizer application rates per planted hectare, while the area of planted corn has increased by 16 % (comparing the means of 1983–1999 to 2000–2016) in recent decades (Wells et al., 2018). This trend may be attributed to improved fertilizer management by agricultural producers. There was a likely trade-off in using this proxy; we were able to extend the period of record back to 1946, allowing for the analysis of a wider range of lag times in the model, but we might have sacrificed some accuracy in recent decades when nitrogen management may have improved. Lastly, vadose and saturated zone transport rates were assumed to be constant over time (Wells et al., 2018).
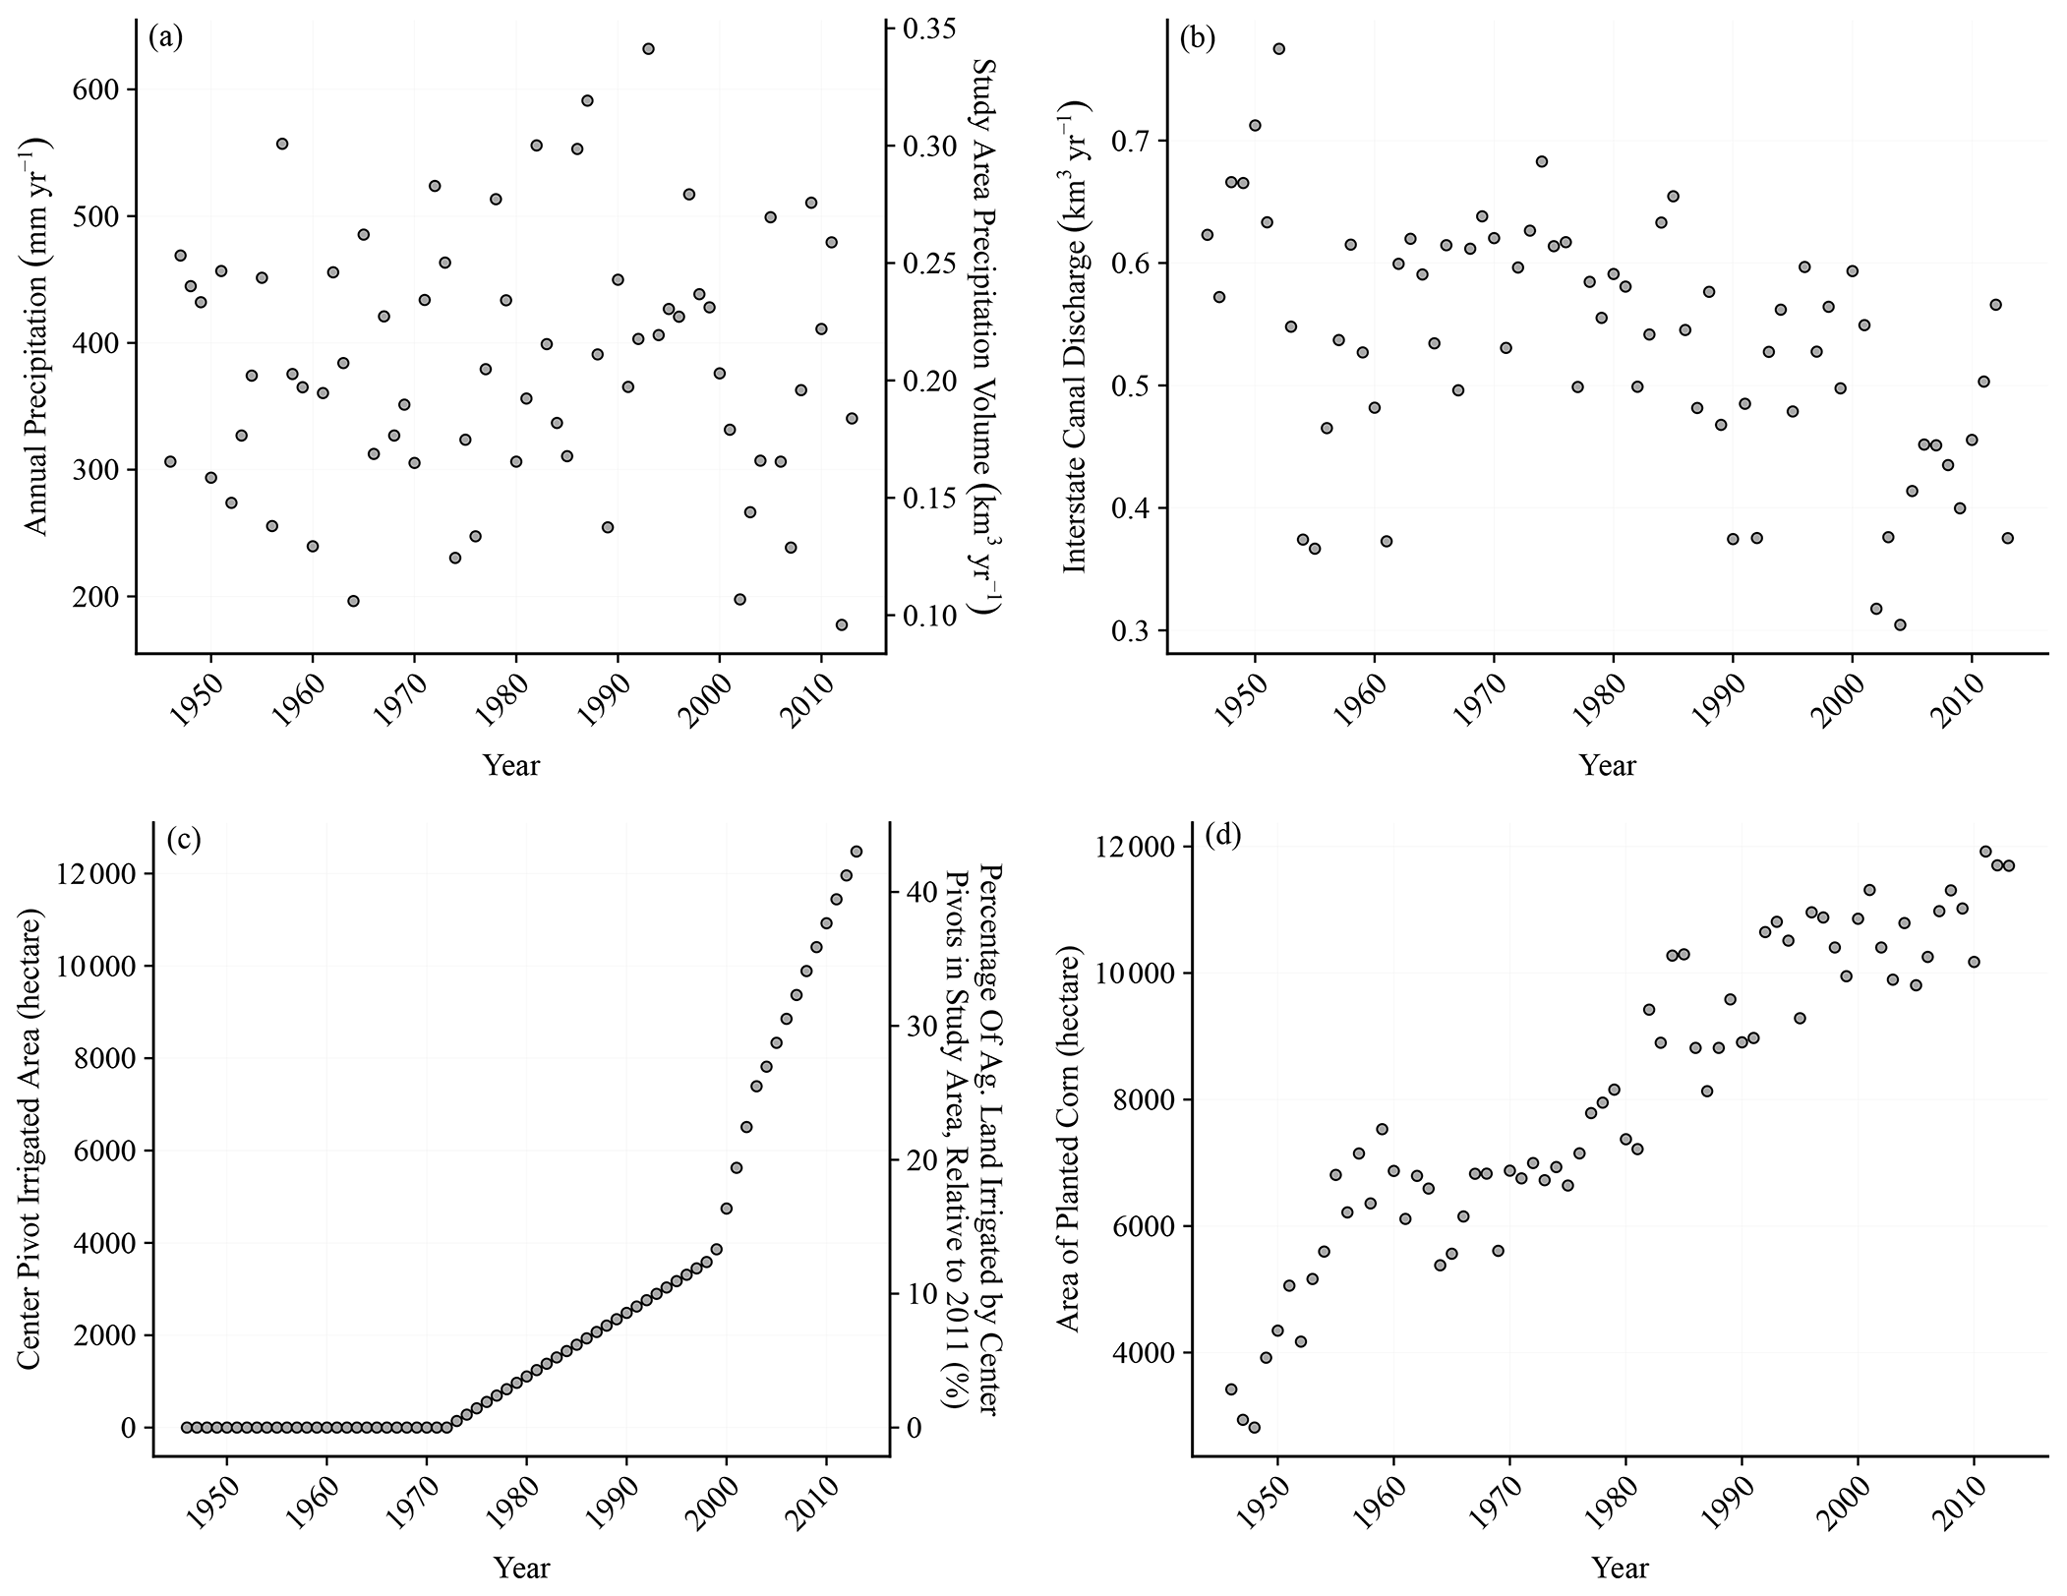
Figure 3Time series plots of all four dynamic predictors. Figures represent the (a) annual precipitation, (b) Interstate canal discharge, (c) center pivot irrigated area, and (d) area of planted corn from 1946 to 2013.
2.4 Vadose and saturated zone transport rate analysis
Ranges of vertical velocities (transport rates) through the Dutch Flats vadose zone and saturated zone were estimated from age-dating-derived recharge rates. The vertical velocities were determined from results published for samples collected in 1998 (Böhlke et al., 2007, Verstraeten et al., 2001a) and 2016 (Wells et al., 2018) as follows:
where R is the upper and lower bound of recharge rates (m yr−1), and θ is the mobile water content in the vadose zone or porosity in the saturated zone. The data were used in this study solely for constraining the range of potential transport rates being evaluated in the vadose and saturated zones and as a base comparison to model results. The age data, however, were not used by the model itself when seeking to identify an optimum transport rate combination. Throughout the text, unsaturated (vadose) zone vertical transport rates will be abbreviated as Vu, while saturated zone vertical transport rates will be Vs. In the vadose zone, θ was assigned a constant value of 0.13, which was calibrated previously using a vertical transport model for the Dutch Flats area (Liao et al., 2012). In the saturated zone, θ was assigned a constant value of 0.35, equal to the value assumed previously for recharge calculations (Böhlke et al., 2007). Vadose and saturated zone travel times (τ) were then calculated as follows:
where τ is either the vadose zone (τu) or saturated zone (τs) travel time in years, and z is the vadose zone thickness (zu) or distance from the water table to the well mid-screen (zs) in meters.
Though Eqs. (1) and (2) do not explicitly consider horizontal groundwater flow, they are approximately consistent with the distribution of groundwater ages (travel times from recharge), which increase with depth below the water table. Whereas groundwater ages commonly increase exponentially with depth in idealized surficial aquifers with relatively uniform thickness and distributed recharge (Cook and Böhlke, 2000), our linear approximation is based on several local observations including the following: (1) the linear approximation is similar to the exponential approximation in the upper parts of idealized aquifers, (2) linear age gradients may be appropriate in idealized wedge-shaped flow systems, as in some segments of the aquifer section (Fig. 2), (3) focused recharge under irrigation canals and distribution channels, which can cause the distortion of vertical groundwater age gradients in downgradient parts of the flow system, and (4) roughly linear age gradients, which were obtained from groundwater dating in the region, though with substantial local variability (Böhlke et al., 2007). Discrete transport rates and travel times calculated from Eqs. (1) and (2) should be considered “apparent” rates and travel times, similar to apparent groundwater ages, which are based on imperfect tracers and may be affected by dispersion and mixing. Nonetheless, the saturated open intervals of the monitoring wells used for this study (<6.1 m for shallow wells; 1.5 m for intermediate and deep wells) generally were short compared with the aquifer thickness, such that age distributions within individual samples were relatively restricted in comparison to those of the whole aquifer or of wells with long screened intervals. In addition, it is emphasized that the assumed mobile water content of 0.13 is a calibrated parameter derived previously through inverse modeling and, as suggested by Liao et al. (2012), may have large uncertainties due to the varying, site-specific characteristics known to exist from one well to the next.
Because of the influence of canal leakage on both intermediate and deep wells (Böhlke et al., 2007), only recharge rates from shallow wells were used to estimate initial values and the permissible ranges of vadose zone travel times. The mean () and standard deviation () of all the 1998 (n=7) and 2016 (n=2) shallow recharge rates were calculated. Using , a range of recharge rates from 0.15 to 0.61 m yr−1 (i.e., rates that varied by a factor of 4) were converted to transport rates (Vu) using Eq. (1). Calculated transport rates resulted in 1.15 to 4.69 m yr−1 being the range of vadose zone transport rates. Expanding the upper and lower bounds, a minimum vadose zone transport rate of 1.0 m yr−1 and a maximum of 4.75 m yr−1 was applied. Vertical transport rates in the vadose zone were increased by increments of 0.25 m yr−1 from 1.0 to 4.75 m yr−1, resulting in 16 possible vadose zone transport rates to evaluate in the random forest model.
The mean () and standard deviation () of all shallow, intermediate, and deep well recharge rates were included in identifying a range of saturated zone recharge rates from 0.10 to 1.57 m yr−1. A total of 35 and eight recharge rates were used from the Böhlke et al. (2007) and Wells et al. (2018) studies, respectively. Equation (1) was used to calculate the saturated zone transport rates (Vs) of 0.28 and 4.49 m yr−1. Saturated zone transport rates were increased by increments of 0.25 m yr−1, from 0.25 to 4.5 m yr−1, resulting in 18 unique saturated zone transport rates that could be evaluated in the random forest model. The range of transport rates suggested by groundwater age dating was large (more than an order of magnitude) and is considered to include rates likely to be expected in a variety of field settings. Presumably, similar model constraints and results could have been obtained without the prior age data and with some relatively conservative estimates.
Travel times τu and τs were calculated for each well based on zu and zs, respectively. For every possible combination of vadose and saturated zone transport rates, a unique total travel time, τt, was calculated for each well based on the vadose and saturated zone dimensions of that particular well.
The total travel times from Eq. (3) were used to lag dynamic predictors relative to each nitrate sample date. For instance, a nitrate sample collected in 2010 at a well with a 20 year total travel time (e.g., τu is 10 years and τs is 10 years) would be assigned the 1990 values for precipitation (450 mm), Interstate Canal discharge (0.4 km3 yr−1), center pivot irrigated area (2484 ha), and area of planted corn (8905 ha), respectively.
A total of 288 unique transport rate combinations (corresponding to different combinations of the 16 vadose and 18 saturated zone transport rates) were evaluated. Each transport rate combination incorporated up to 1049 groundwater values in the random forest model.
2.5 Random forest application
Random forests are created by combining hundreds of unskilled regression trees into one model ensemble, or forest, which collectively produces skilled and robust predictions (Breiman, 2001). Models of groundwater were developed using five-fold cross validation (Hastie et al., 2009), where each fold was used to build the model (training data) four times and held out once (testing data). The maximum and minimum of the groundwater and each predictor were determined and placed into each fold for training models to eliminate the potential for extrapolation during validation. The four folds designated to build the model also underwent a nested five-fold cross validation, as specified in the trainControl function within the caret (Classification And Regression Training) R package (Kuhn, 2008; R Core Team, 2017). Functions in caret were used to train the random forest models. We repeated the five-fold cross validation process five times to create a total of 25 models, similar to the approach used by Nelson et al. (2018), in order to assess the sensitivity of the model performance to the data assigned to the training and testing folds.
Permutation importance, partial dependence, and Nash–Sutcliffe efficiency (NSE) were quantified to evaluate model performance and to interpret results. The NSE (Nash and Sutcliffe, 1970) was calculated as follows:
where n is the number of observations, is the ith observation of the response variable (), is the ith prediction from the random forest model, and Ymean is the mean of observations from i through n. Values from negative infinity to zero suggest the mean of the observed would serve as a better predictor than the model. When NSE is zero, the model predictions are as accurate as that of a model with only the mean observed as a predictor. From zero, the larger NSE values indicate how a model's predictive ability improves, until NSE is one, where observations and predictions are equal. NSE was calculated for both the training and testing data.
For each tree, a random bootstrapped sample (i.e., data randomly pulled from the data set and sampled with a replacement) is extracted from the data set (Efron, 1979) and a random subset of predictors to consider the fitting at each split. Thus, each tree is grown from a bootstrap sample and random subset of predictors, making the trees random and grown independently of the others. Observations not used as bootstrap samples are termed the out-of-bag (OOB) data.
When building a tree, all from the bootstrap sample are categorized into terminal nodes, such that each node is averaged and yields a predicted . The performance and mean squared error (MSE) of a random forest model is evaluated by comparing the observed of the OOB data to the average predicted from the forest. OOB data from the training data set may be used to evaluate both the permutation importance, referred to in the rest of this text as variable importance, and partial dependence. Variable importance uses the percent increase in the mean squared error (%incMSE) to describe the predictive power of each predictor in the model (Jones and Linder, 2015). During this process, a single predictor is permuted, or shuffled, in the data set. Therefore, each observed has the same relationship between itself and all predictors, except one permuted variable. The %incMSE of a variable is determined by comparing the permuted OOB MSE to an unpermuted OOB MSE. Important predictors will result in a large %incMSE, while a variable of minor importance does little to impact a model's performance, as suggested by a low %incMSE value.
Partial dependence curves serve as a graphical representation of the relationship between and predictors in the random forest model ensemble (Hastie et al., 2009). In these models, the y axis of a partial dependence plot represents the average of the OOB-predicted at a specific x value of each predictor.
This study addressed a relatively unexplored use of random forest, which is to identify optimal lag times based on testing a range of transport rate combinations through the vadose and saturated zones, historical , and the use of easily accessible environmental data sets.
3.1 Relative importance of transport time and dynamic variables
In our initial modeling (using both static and dynamic predictors), we anticipated that we could use the random forest model with the highest NSE to identify the optimal pair of vadose and saturated zone transport rates. However, no clear pattern emerged among the different models (Fig. 4). Given the small differences and lack of defined pattern in testing NSE values, we selected 10 transport rate combinations (the five top-performing models, four transport rate combinations of high and low transport rates, and one intermediate transport rate combination) for further evaluation of variable importance and sensitivity to a range of transport rate combinations (Table 2). The median total travel time ranked third in the variable importance, while the four dynamic variables consistently had the four lowest rankings (Fig. 5). Total travel time also had the greatest variability in importance among the 15 variables, with a range of 18.4 % between the upper and lower values, suggesting some model sensitivity to lag times. When excluding total travel time, the remaining variables had an average variable importance range of 6 %.
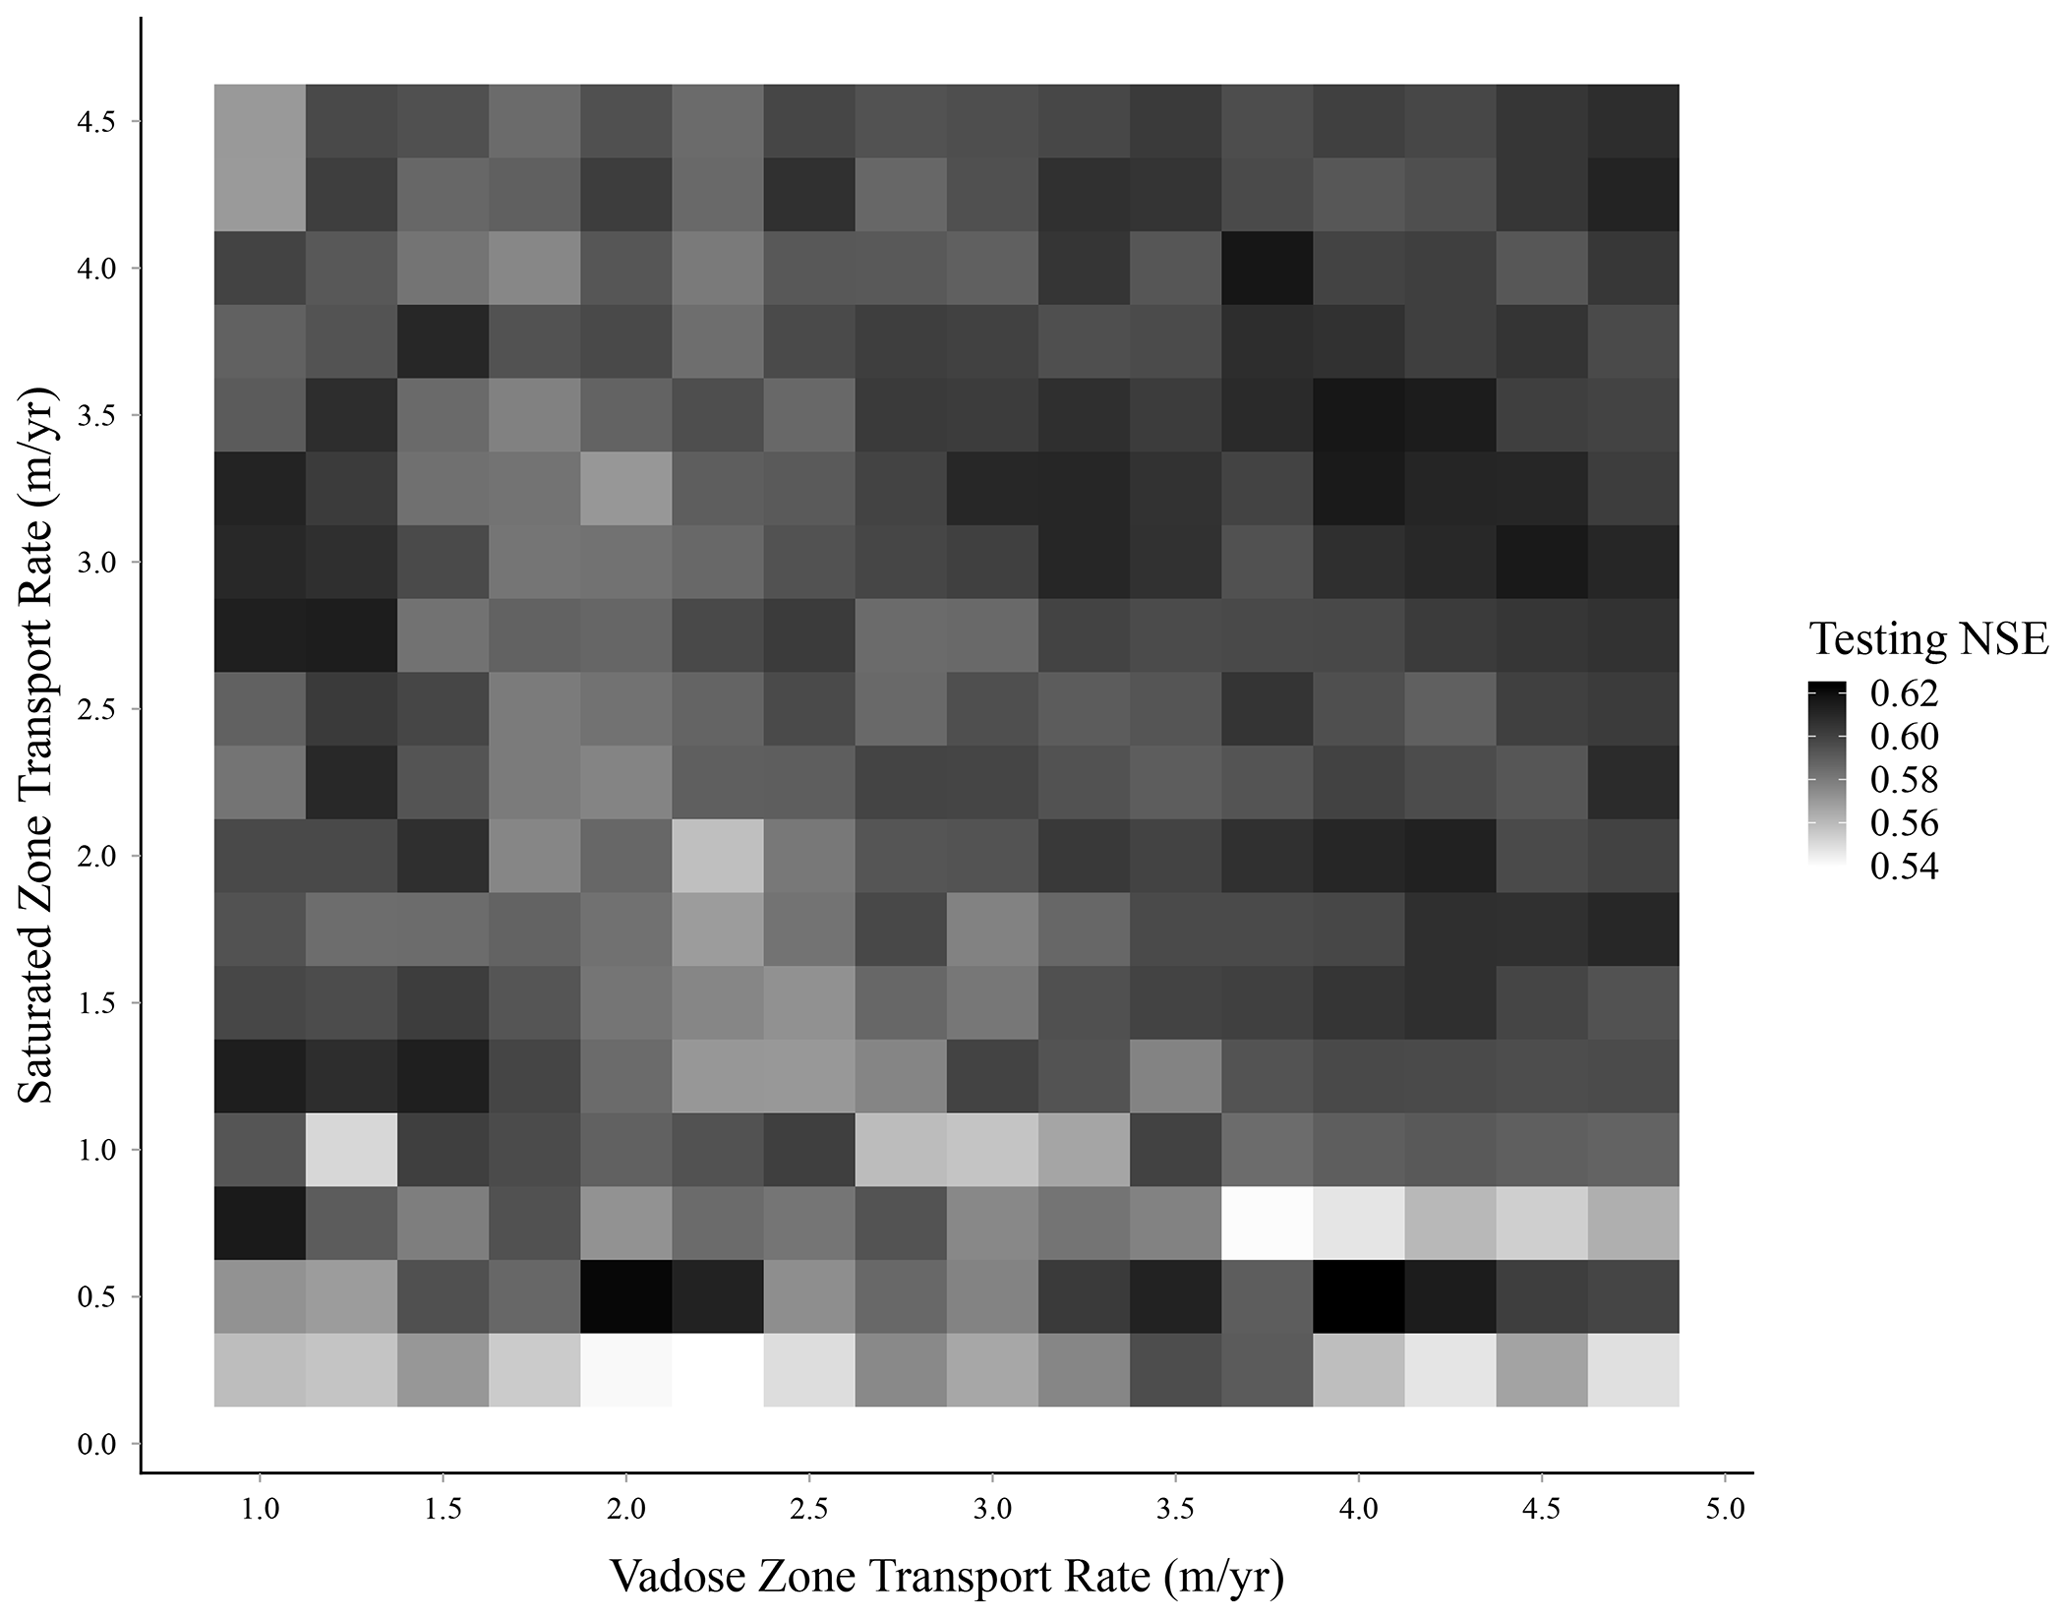
Figure 4Heat map of testing NSE results from 288 vadose and saturated zone transport rate combinations. Testing NSE in this figure is the median of all 25 model outputs from each of the 288 transport rate combinations. No clear pattern of optimal vadose and saturated zone transport rate combinations was observed.
Table 2Summary of 10 vadose and saturated zone transport rate combinations selected from 288 unique potential combinations from the analysis, including the dynamic variables.
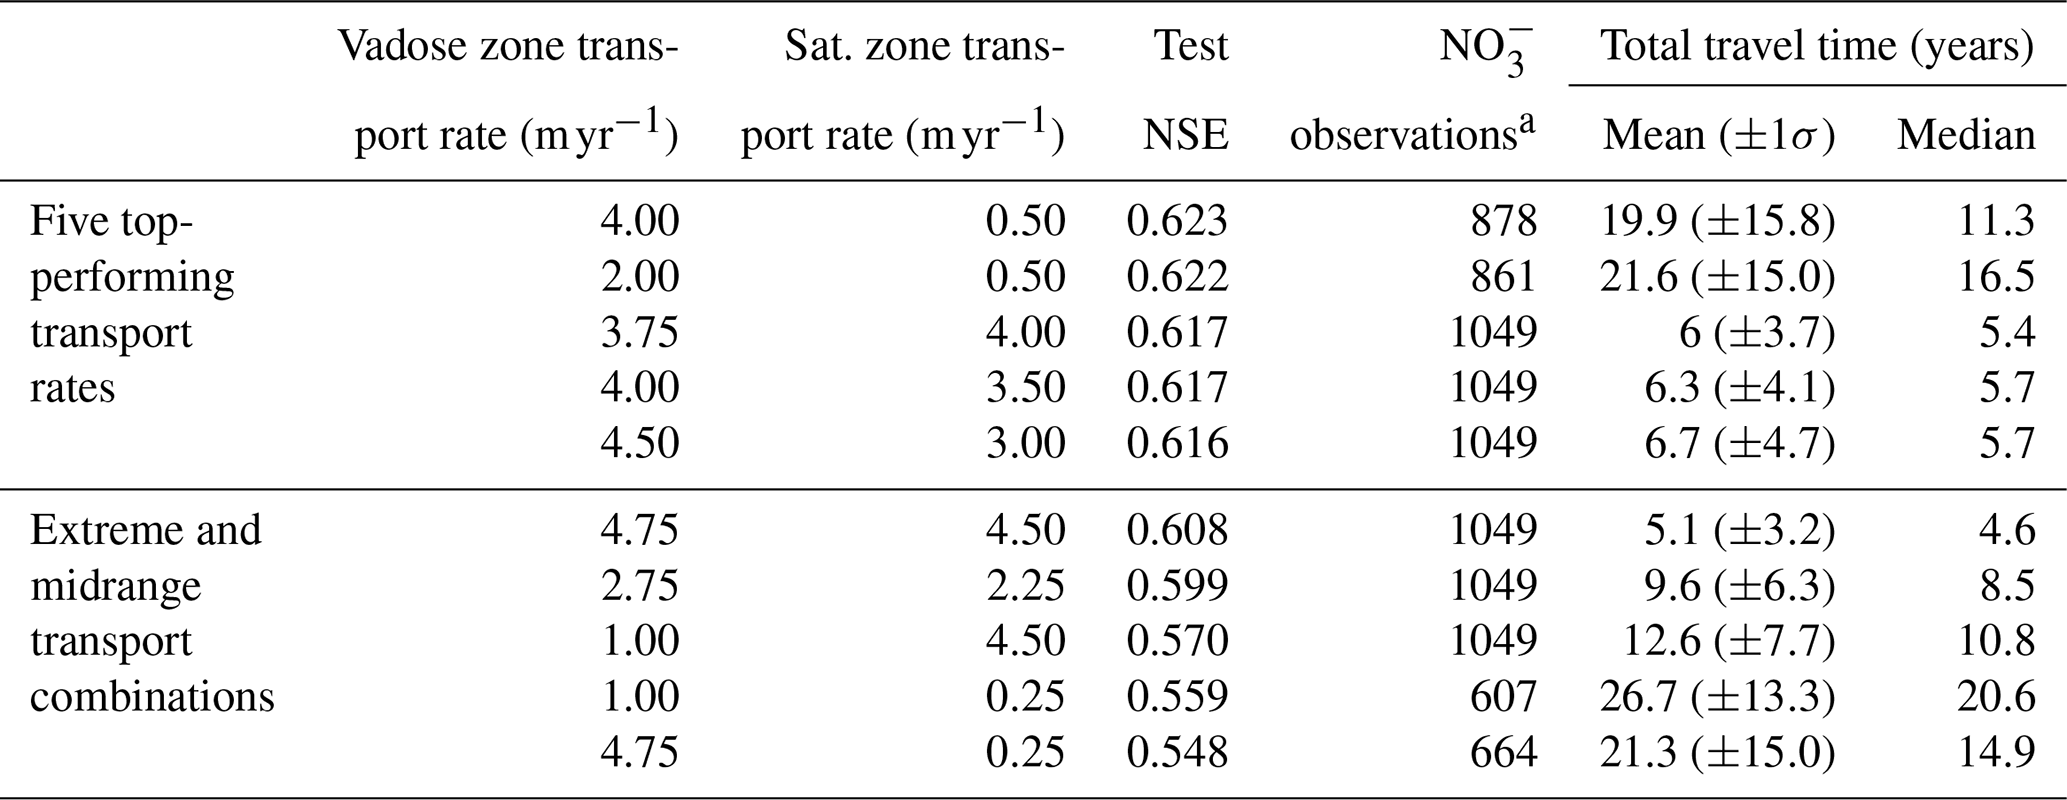
a In cases with slow transport rates, lag times were relatively long and not all data could be used in the model. For example, a slow transport rate combination resulting in a lag time with the infiltration year prior to 1946 could not be included. Thus, some models were ultimately based on <1049 observations.
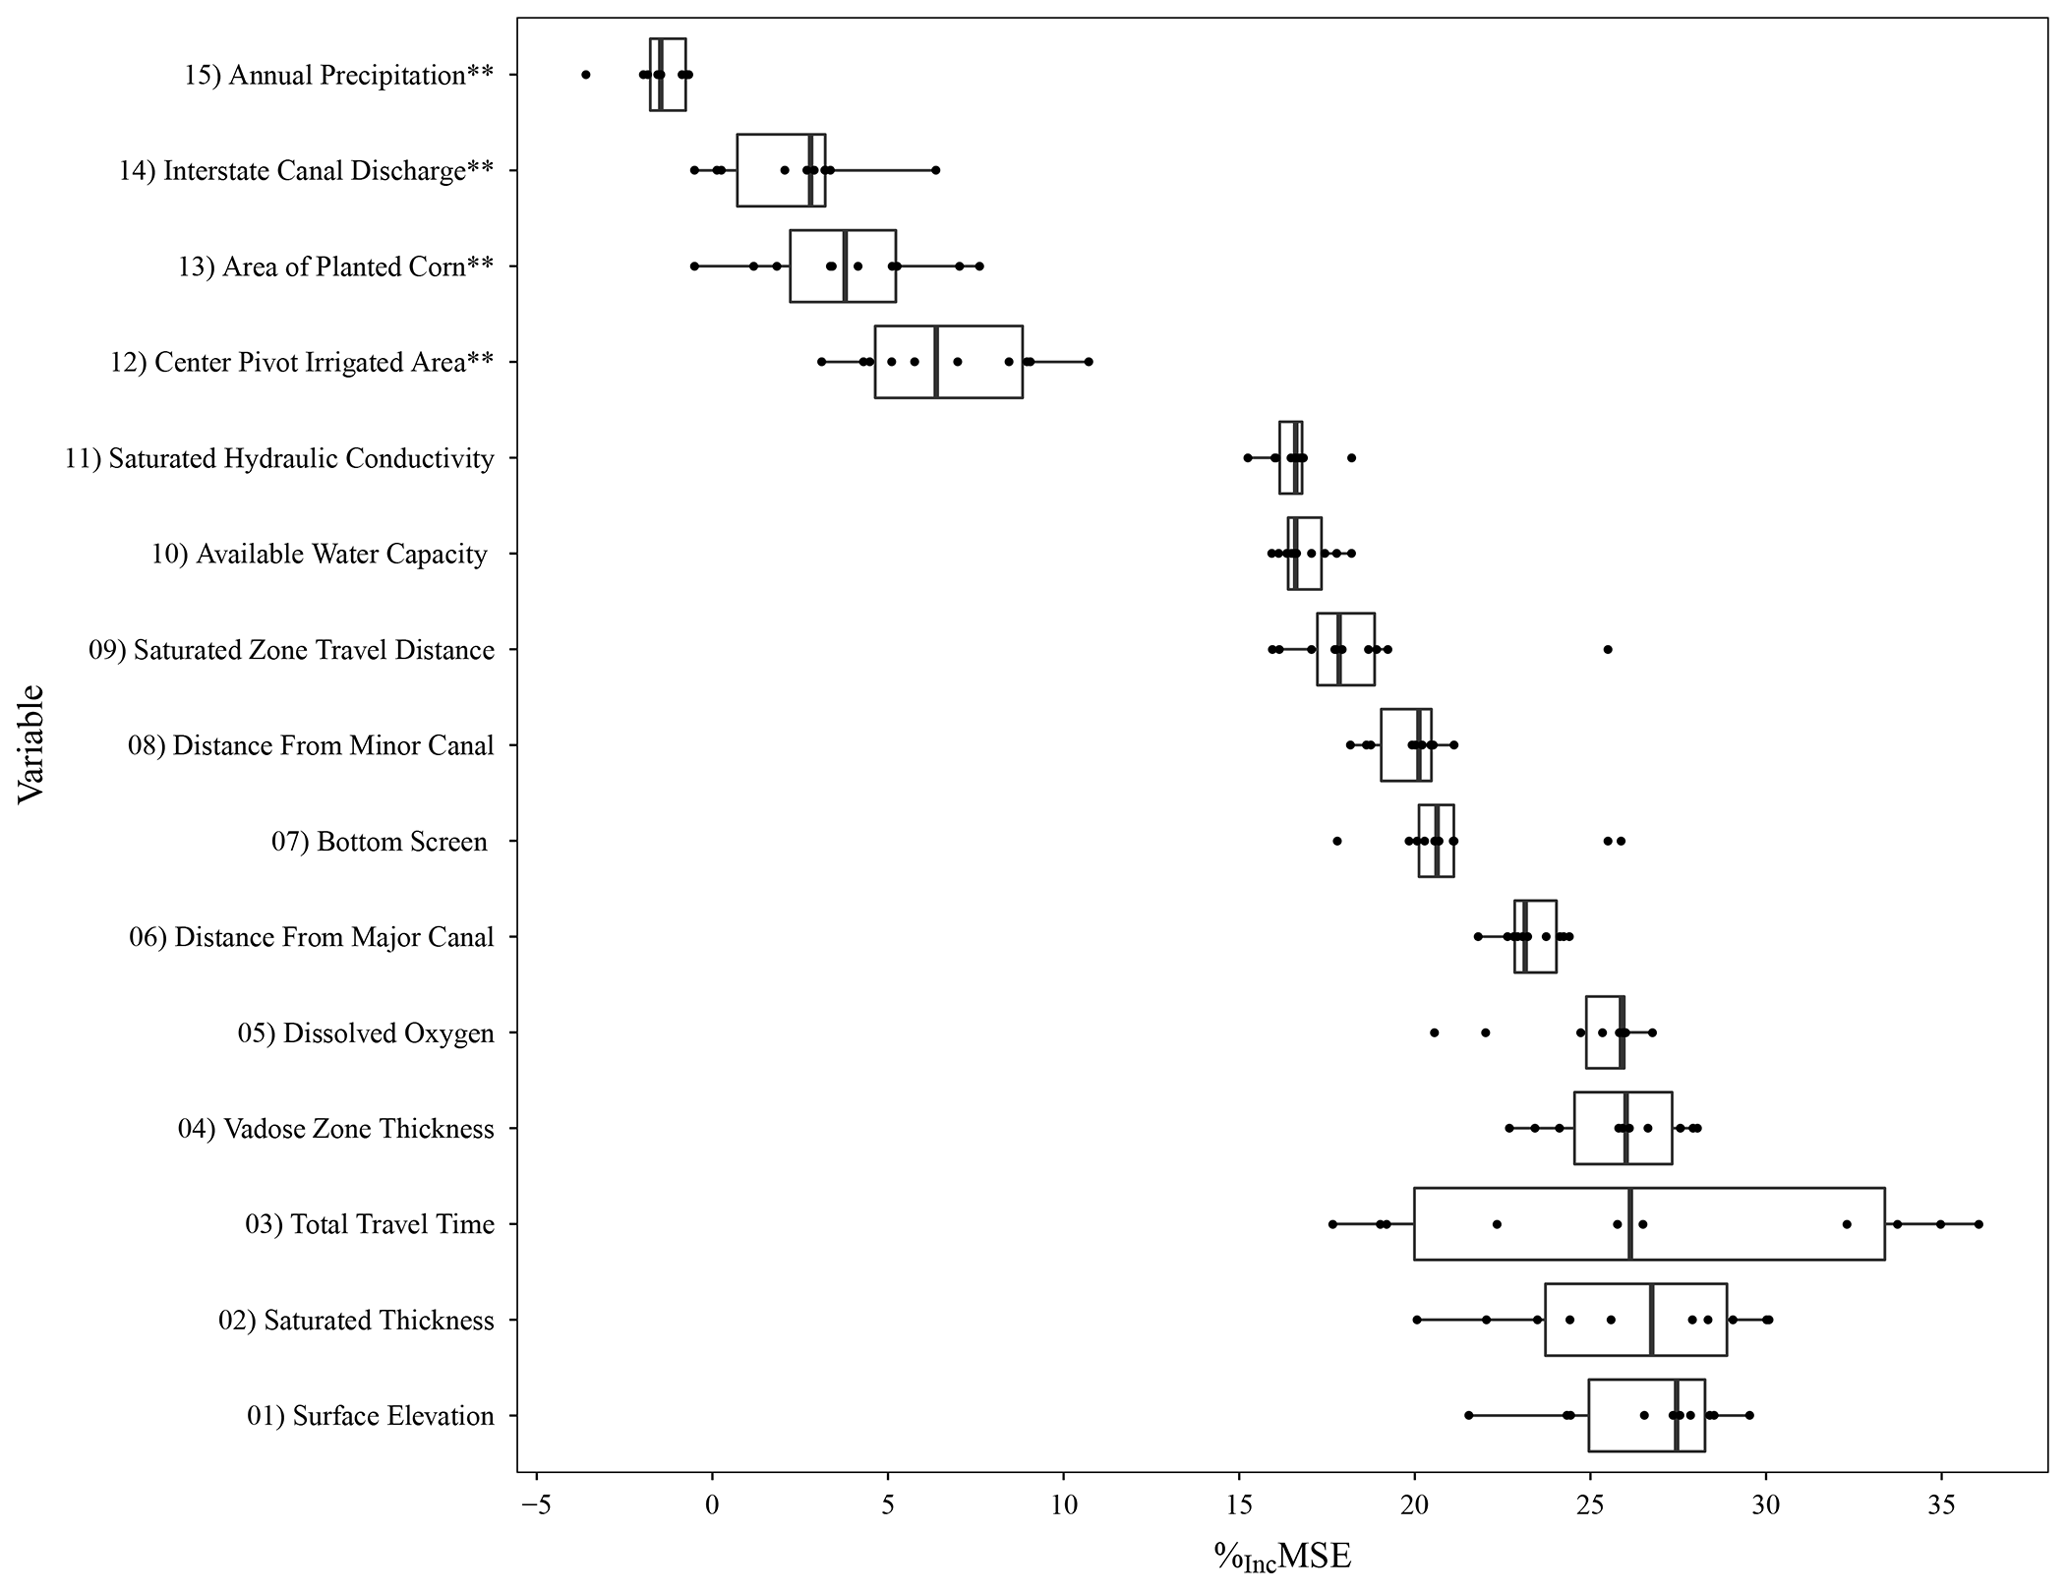
Figure 5Box plot of the %incMSE from the 10 transport rate combinations shown in Table 2. Each box plot has 10 points for each transport rate combination, representing the median %incMSE from the 25 models (five-fold cross validation repeated five times). A larger %incMSE suggests that the variable had a greater influence on a model's ability to predict . Note: ** denotes dynamic predictors.
Dynamic variables had little influence on the model, despite having common potential linkages to groundwater (Böhlke et al., 2007; Exner et al., 2010; Spalding et al., 2001). A pattern emerged among the dynamic variables where the stronger the historical trend of the predictor, the greater the importance of the predictor (Figs. 3 and 5). For instance, the center pivot irrigated area (highest-ranking dynamic variable) had the least noise and the most pronounced trend, while annual precipitation (lowest-ranking variable) was highly variable and lacked any trend over time (Fig. 3) and also may not be a substantial source of recharge (Böhlke et al., 2007). Further exploration could be done to test more refined and/or spatially varying predictors – for instance, annual median rainfall intensity for the growing season might have a more direct connection to nitrate leaching than total annual precipitation. However, rainfall intensity data are not readily available. Likewise, the availability of a long-term, detailed fertilizer loading data set would be advantageous in providing a more substantiated conclusion regarding the viability of applying dynamic variables for determining the vadose and saturated zone lag. Dynamic variables could be of more use in other study areas that undergo relatively rapid and pronounced changes (e.g., land use). In future work, the model sensitivity to dynamic variables could be tested through formal sensitivity analysis and/or automated variable selection algorithms (Eibe et al., 2016).
Ultimately, the results from initial analyses suggest that (1) the dynamic data did little to improve model performance, and (2) the random forest was not able to relate the four considered dynamic predictors to in a meaningful way that could be used to estimate lag times. It is likely that the influence of these dynamic predictors is dampened as nitrate is transported from the surface to wells, such that data-driven approaches are unable to sort through the noise to identify relationships.
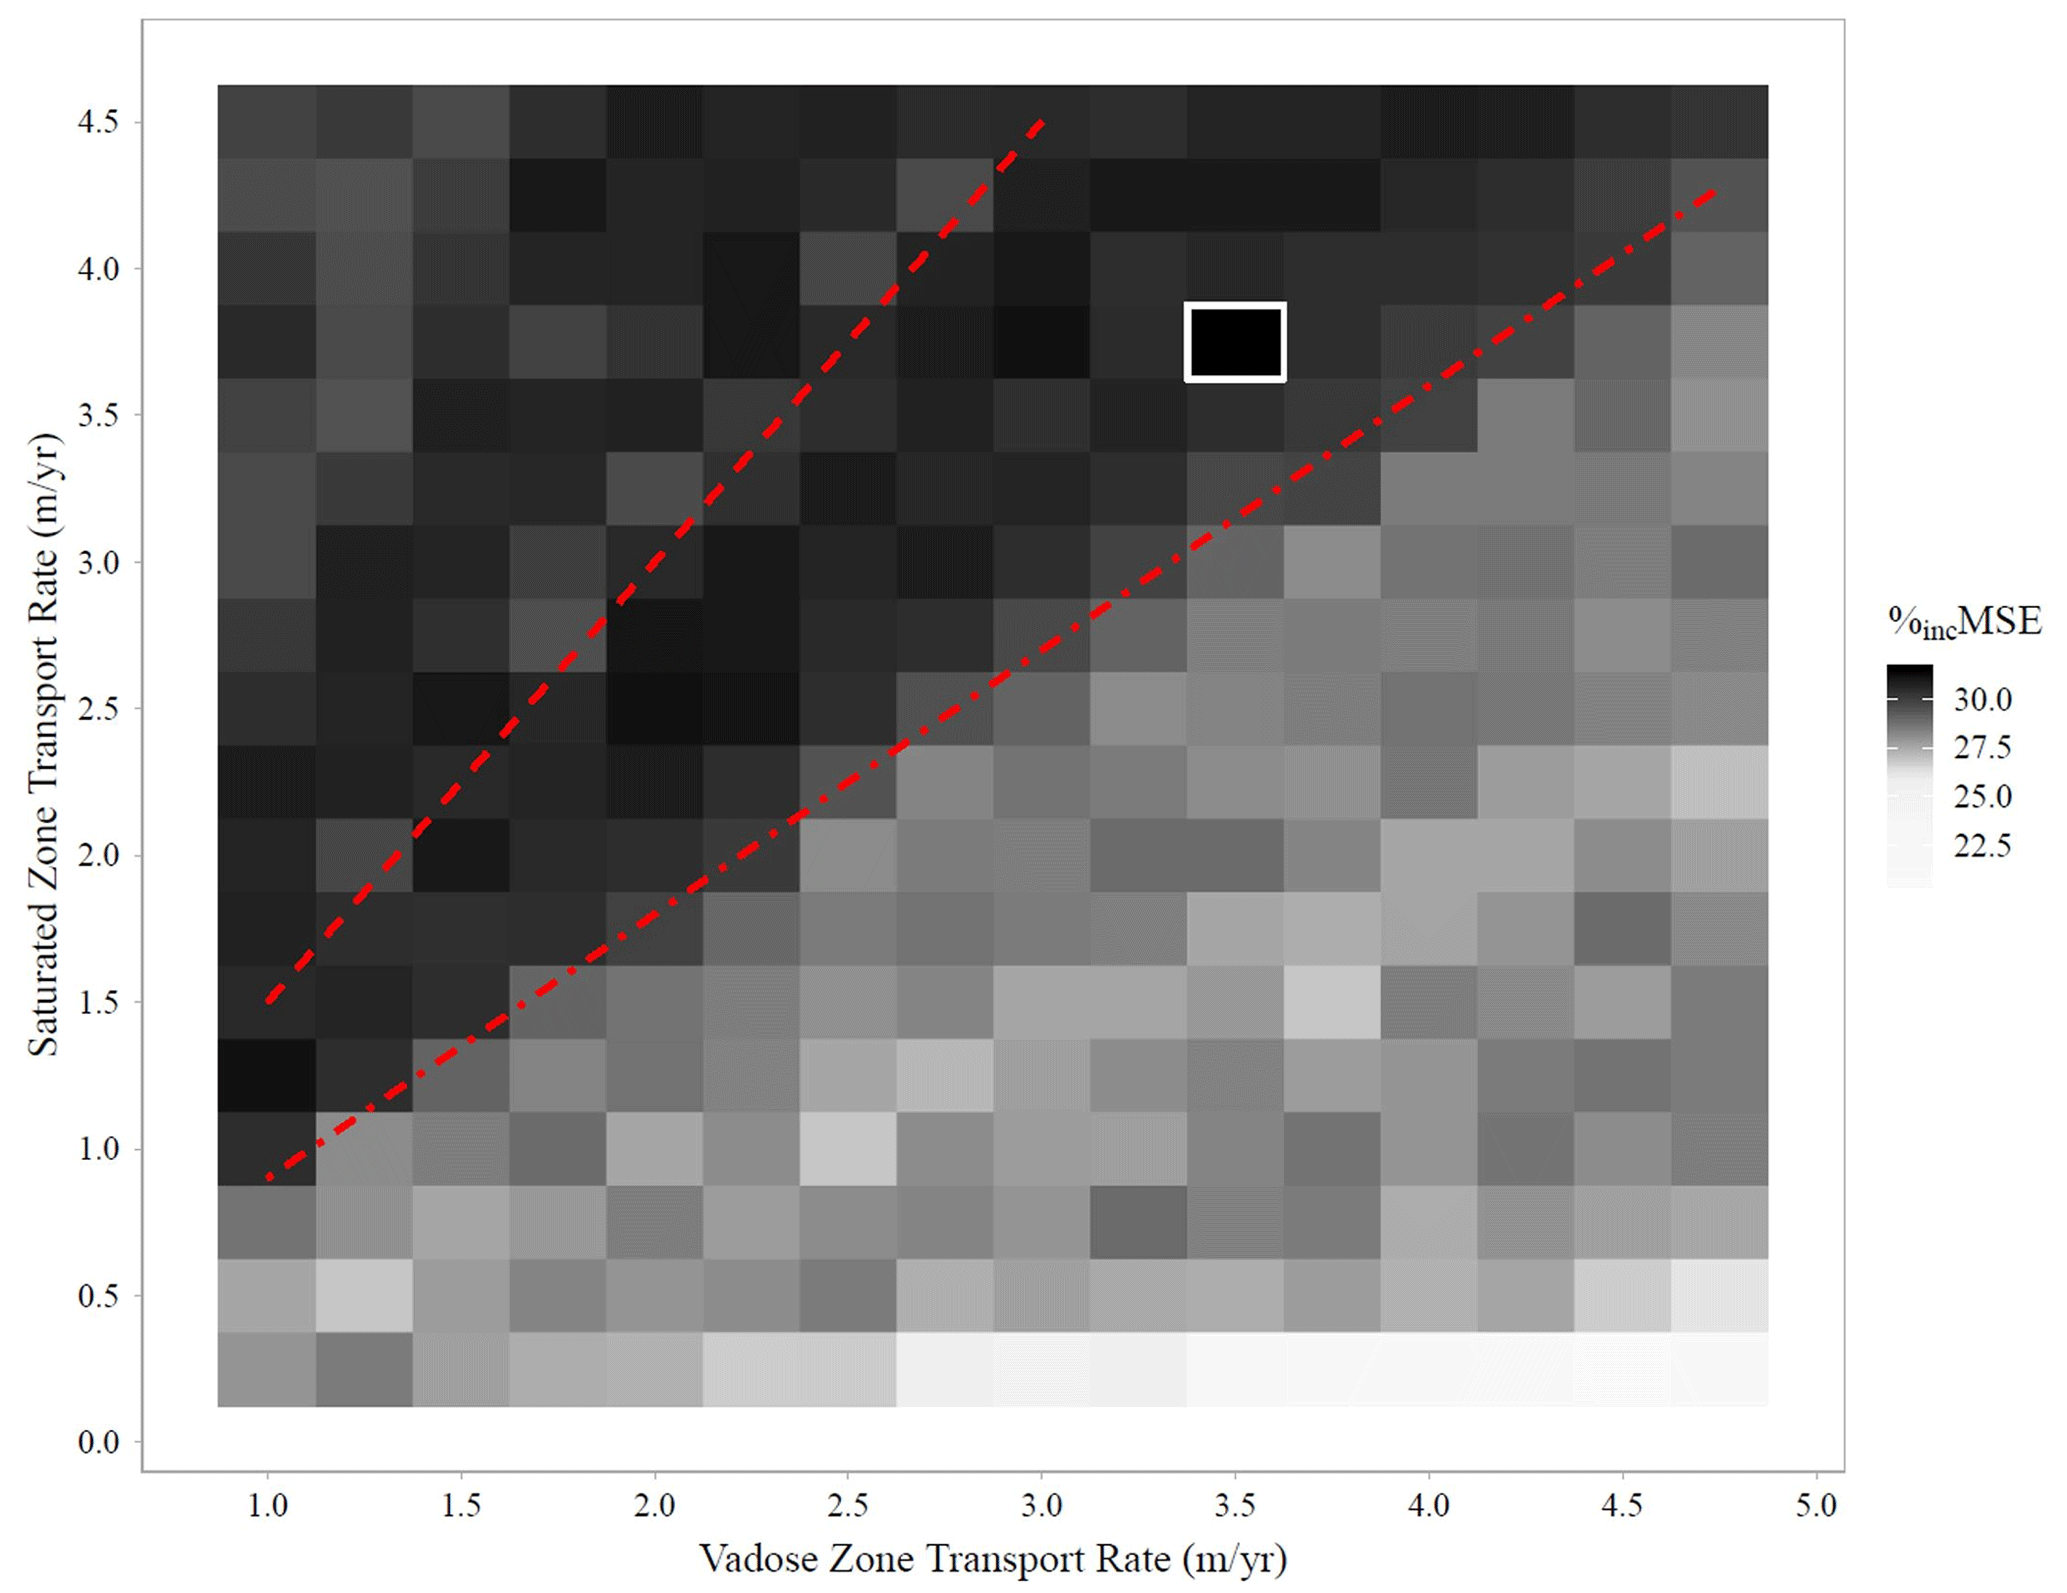
Figure 6Heat map of %incMSE (median from 25 models) from the variable importance of the total travel time for each of the 288 transport rate combinations evaluated. Red dashed lines indicate upper (Vs Vu=1.5; long dashes) and lower (0.9; short dashes) bounds of the band of transport rate combinations with consistently higher %incMSE. The white square highlights the single transport rate combination with the highest %incMSE.
3.2 Use of random forest to determine transport rates
Due to their low relative importance as predictors, all four dynamic predictors were removed in the subsequent analysis. As discussed above, a notable variation in total travel time %incMSE was observed in Fig. 5, suggesting model sensitivity to this variable. Additionally, a relationship between travel time and has been suggested in the Dutch Flats area through previous studies (Böhlke et al., 2007; Wells et al., 2018). Therefore, a second analysis of just the 11 static predictors was performed over the full range of vadose and saturated zone transport rates (i.e., 288 combinations). However, in the second analysis, the model sensitivity to total travel time – evaluated with respect to the transport rate combination corresponding to the largest %incMSE of total travel time – was used to determine a distinguished transport rate combination. In other words, the models were retrained and tested for all transport rate combinations, each of which produced a unique set of values for the total travel time variable. As described in Sect. 2.5, the %incMSE value for total travel time was then based on the error induced in the model by permuting the calculated total travel times across all the nitrate observations (i.e., randomly shuffling the total travel time variable and, thus, disturbing the structure of the data set).
The random forest models were useful in identifying the relative magnitudes of Vu and Vs that led to high %incMSE. Based on the heat map of %incMSE, a band of transport rate combinations with consistently high %incMSE was visually apparent (Fig. 6). The upper and lower bounds of the band translate to transport rate ratios (Vs Vu) ranging from 0.9 to 1.5 and are values that could be useful in constraining recharge and/or transport rate estimates in more complex mechanistic models of the Dutch Flats area as part of a hybrid modeling approach. This is especially important because recharge is one of the most sensitive parameters in a groundwater model (Mittelstet et al., 2011), yet it is one with high uncertainty. Whereas a saturated zone velocity that is greater than a vadose zone velocity would be unexpected in many unconsolidated surficial aquifers receiving distributed recharge, the statistical machine learning results are consistent with the two contrasting primary recharge processes in the Dutch Flats area, namely (1) the diffuse recharge from irrigation and precipitation across the landscape and (2) the focused recharge from leaking irrigation conveyance canals.
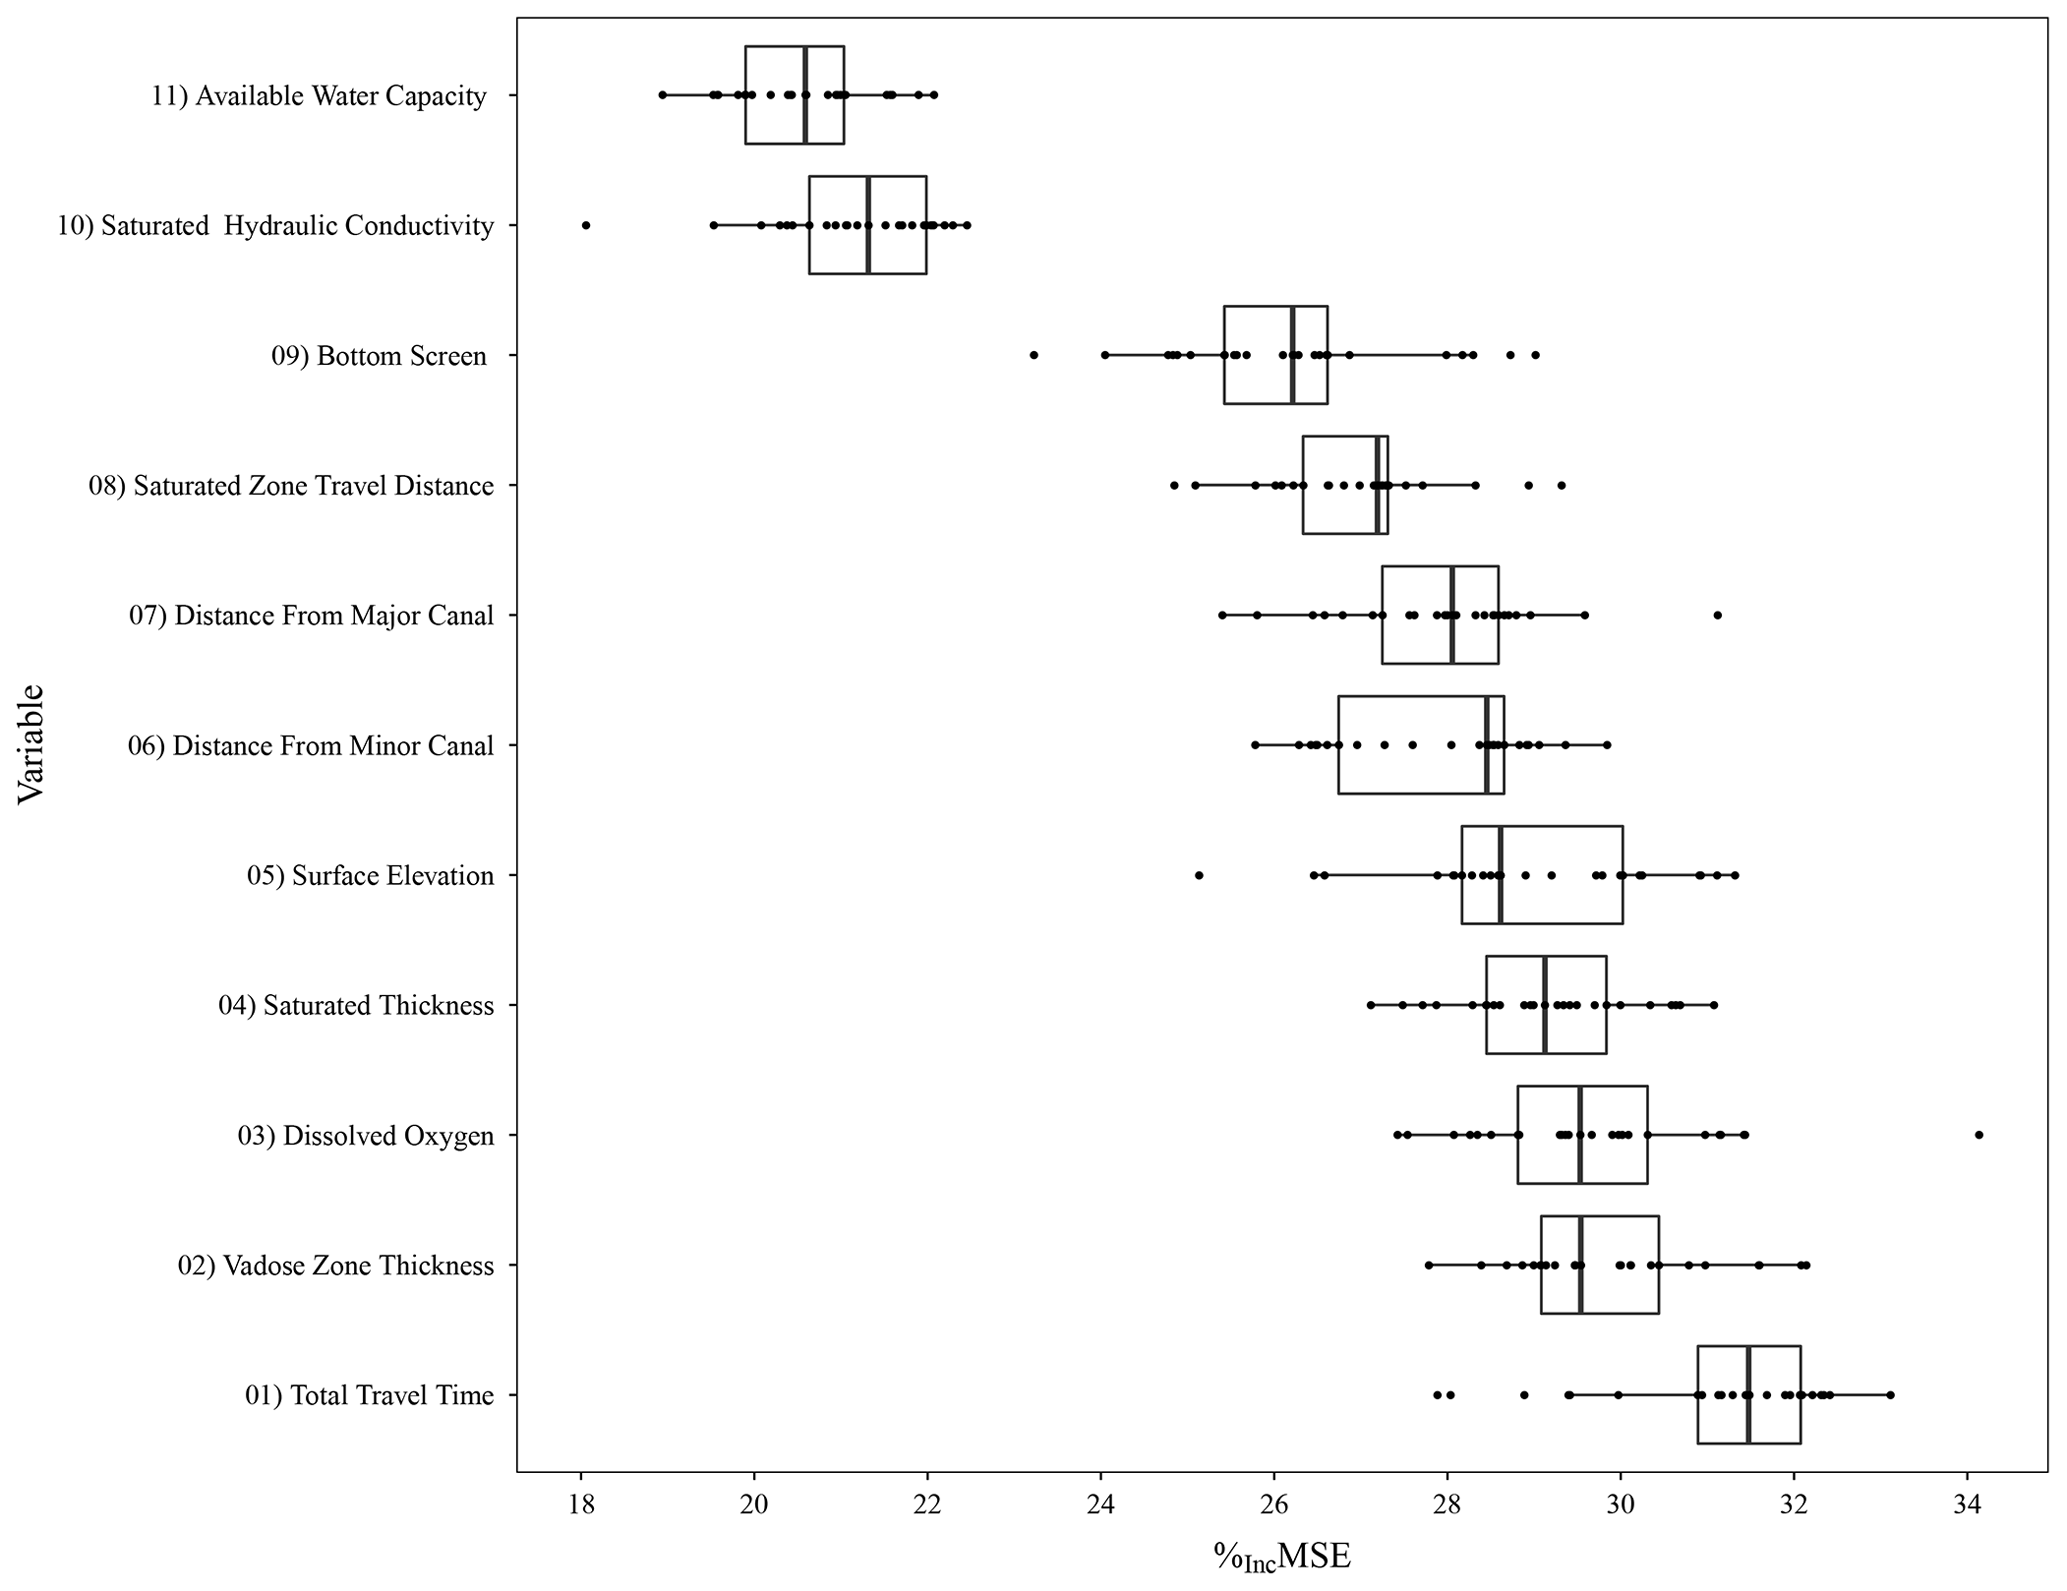
Figure 7Plot from the secondary analysis exploring the variable importance of the transport rate combination with the largest median %incMSE in total travel time (; ). Each point is from one of 25 random forest models that were run for this evaluation. A larger %incMSE suggests the variable had a greater influence on a model's ability to predict .
The %incMSE of total travel time in the second analysis (using only static variables) ranged from 20.6 % to 31.5 %, with the largest %incMSE associated with vadose and saturated zone transport rates of 3.50 and 3.75 m yr−1, respectively (Fig. 6), and the top four predictors for this transport rate combination were total travel time, vadose zone thickness, dissolved oxygen (DO), and saturated thickness (Fig. 7). Converting those vadose and saturated zone transport rates to recharge rates yielded values of 0.46 and 1.31 m yr−1, respectively. Such a large difference between the two recharge values is consistent with the hydrologic conceptual model of the Dutch Flats area. In fact, both model recharge rates compare favorably with recharge rates calculated from the previous Dutch Flats studies using age dating (Böhlke et al., 2007; Wells et al., 2018). For instance, the recharge rate determined from the vadose zone transport rate in this study (0.46 m yr−1) was comparable to the mean recharge rate of 0.38 m yr−1 (n=9) from groundwater age dating at shallow wells, which are the most representative of the diffuse recharge below crop fields that are present across most of the study area (e.g., Fig. S2). Additionally, the recharge rate (1.31 m yr−1) determined from the saturated zone transport rate was consistent with the mean recharge value derived from groundwater ages in intermediate wells (1.22 m yr−1, n=13; Böhlke et al., 2007; Wells et al., 2018). Intermediate wells are variably impacted by focused recharge from canals in upgradient areas. Given the similarity in diffuse recharge and focused recharge estimates from both random forest and groundwater age dating, the transport rate ratios (1.2 and 1.1, respectively) were consistent. That is, the random forest modeling framework produced transport rates consistent with the major hydrological processes in Dutch Flats in both direct (i.e., transport rate estimates) and relative (i.e., transport rate ratio) terms.
Assuming that the random forest approach has accurately captured the two major recharge processes (diffuse recharge over crop fields and focused recharge from canals), a comparison of recharge rates from all sampled groundwater wells representative of recharge to the groundwater system as a whole (0.84 m yr−1; n=43) to the recharge rates from random forest modeling (0.46 and 1.31 m yr−1) would provide an estimate of the relative importance of diffuse versus focused recharge on overall recharge in Dutch Flats. Under these assumptions, diffuse recharge would account for approximately 55 %, while focused recharge would account for about 45 % of the total recharge in the Dutch Flats area. Similarly, Böhlke et al. (2007) concluded that these two recharge sources contributed roughly equally to the aquifer on the basis of groundwater age profiles and from dissolved atmospheric gas data indicating the mean recharge temperatures between those expected for diffuse infiltration and focused canal leakage.
Partial dependence plots, which illustrate the impact that a single predictor has on in the model with respect to other predictors (Fig. 8), largely reflect the conceptual understanding of the system from previous studies, including Böhlke et al. (2007) and Wells et al. (2018). Key plots and features that strengthen confidence in the random forest modeling include (1) depth to the bottom screen, where groundwater is lower at greater depths; (2) the effects of minor and major canals, where groundwater in the vicinity of canals is diluted by canal leakage, and the influence of major canals, which extend over a longer distance when compared to that of minor canals; (3) land surface elevation, where elevations indicating proximity to major canals are associated with relatively lower groundwater ; and (4) DO concentration, where higher DO concentration is linked to higher groundwater . We note that decreasing DO and with groundwater age can be explained by the DO reduction and historical changes in recharge, whereas groundwater chemistry and nitrate isotopic data recorded in both this study and previous Dutch Flats studies suggest that denitrification was not a major factor in this alluvial aquifer.
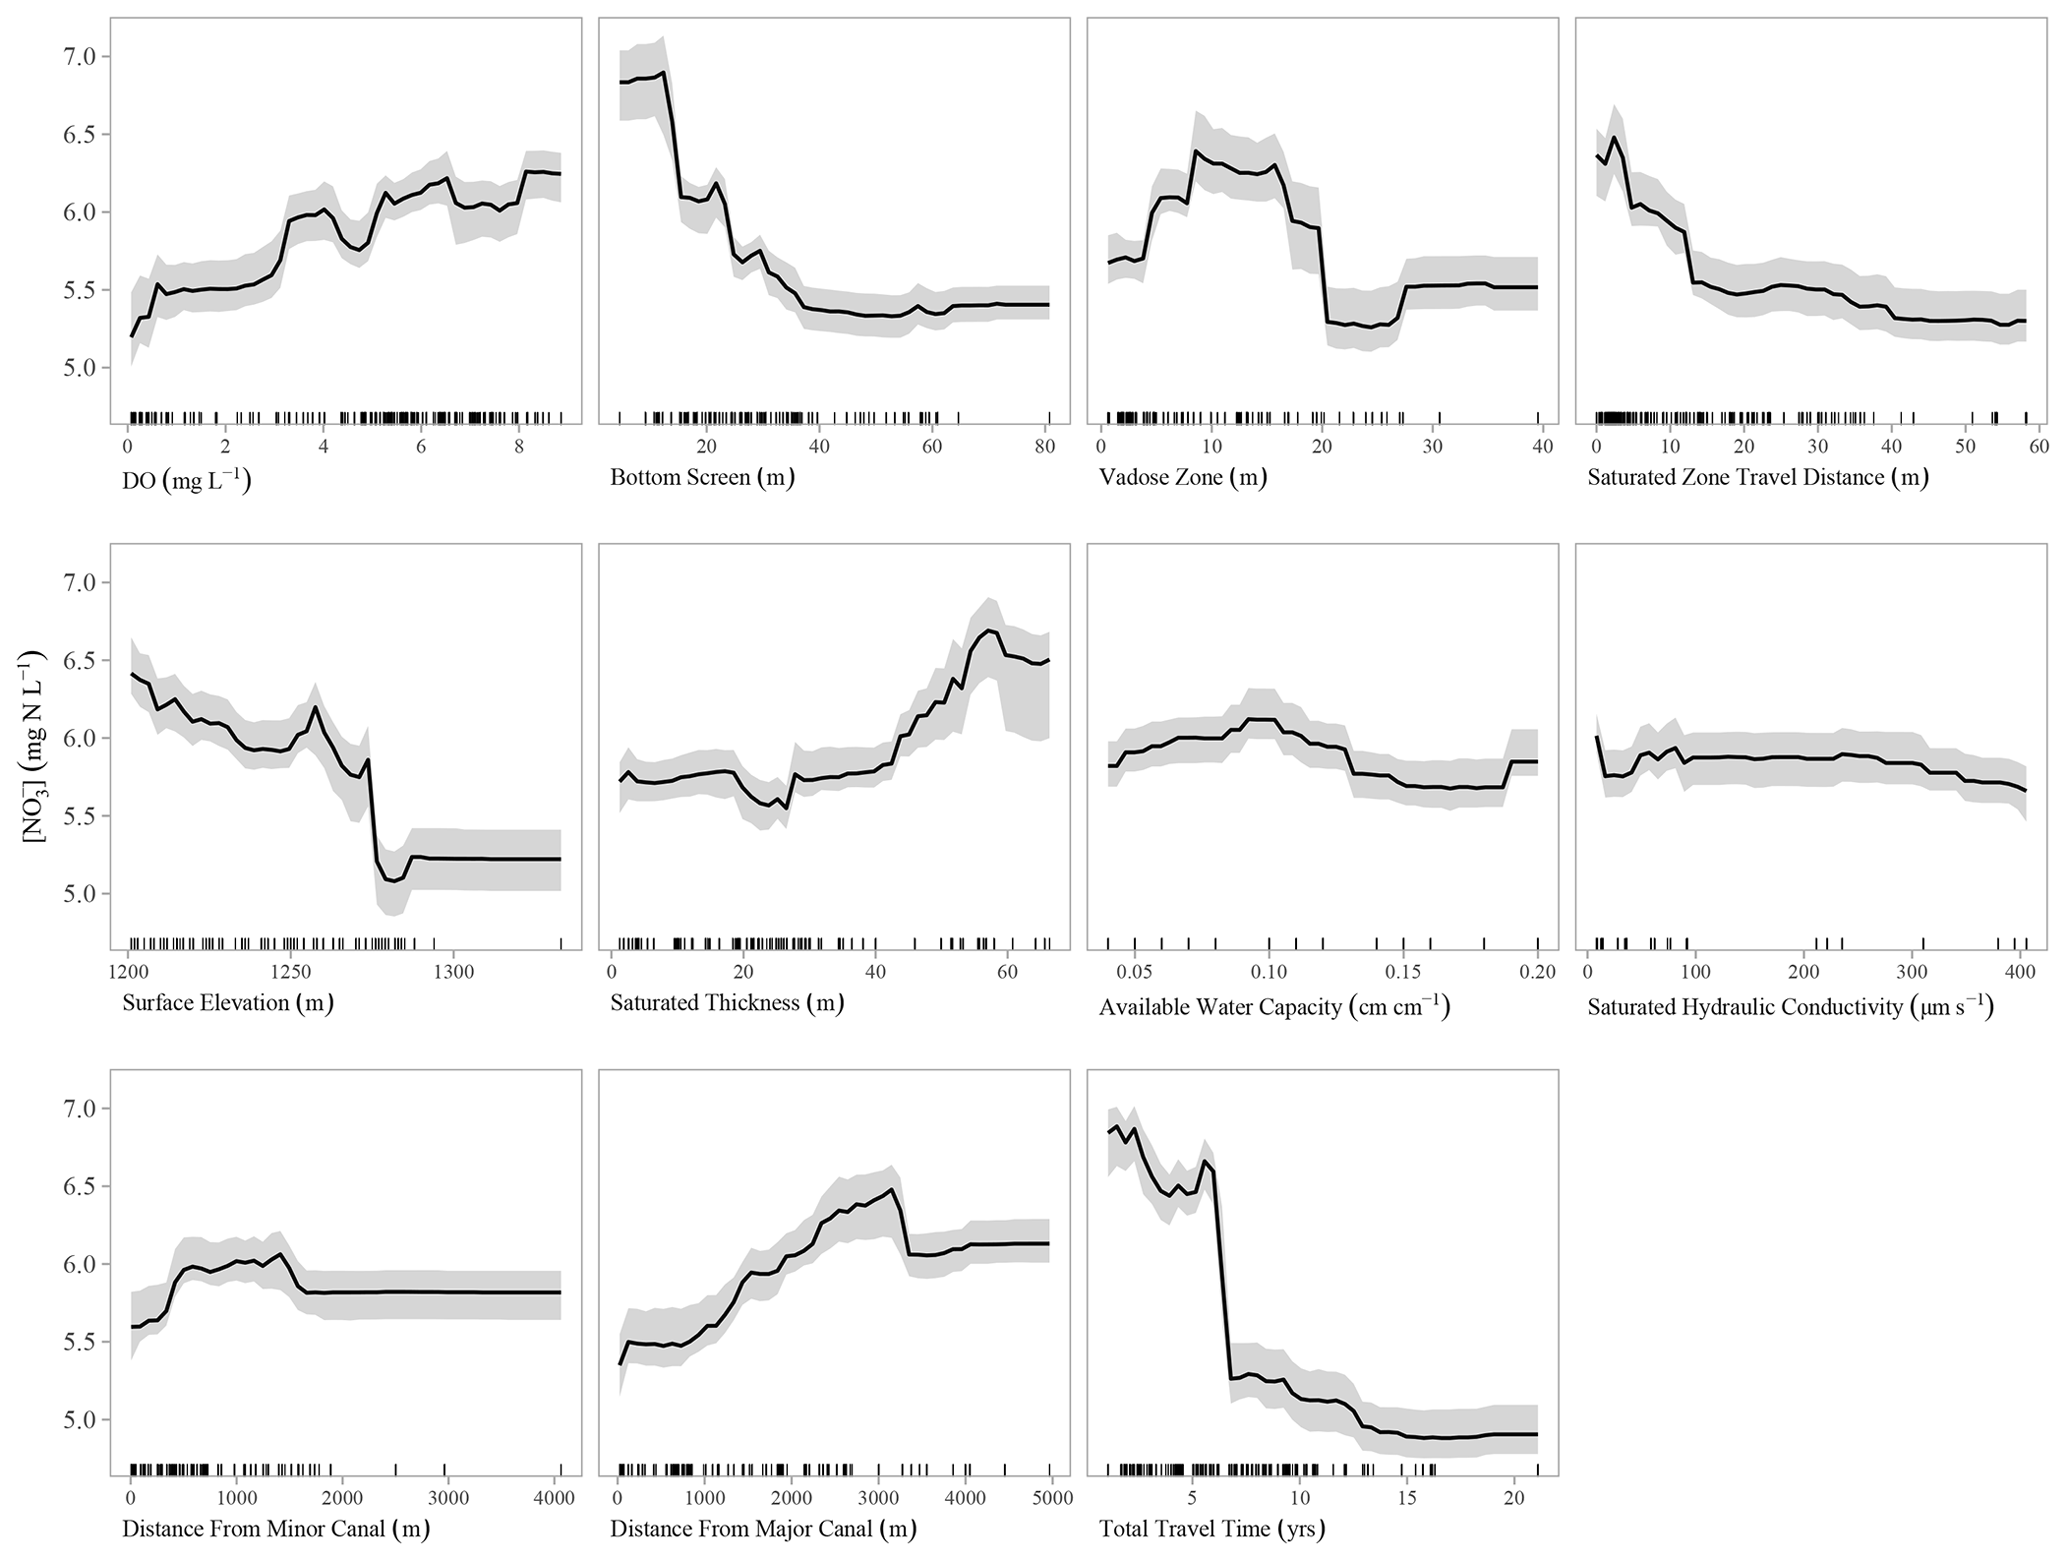
Figure 8Partial dependence plot for the model evaluating the transport rate combination of and . Tick marks on each plot represent predictor observations used to train models.
The partial dependence plot (Fig. 8) for total travel time exhibits a pronounced threshold, where is markedly higher for groundwater with a travel time of less than 7 years. It is possible that this reflects long-term stratification of groundwater , stemming from the suggested patterns stated above, as nitrate varies with the aquifer depth due to the influences of diffuse and focused recharge in the region. This 7-year threshold is slightly lower than a previous estimate of mean groundwater age in the aquifer (8.8 years; Böhlke et al., 2007; where groundwater age excludes vadose zone travel time) and suggests that shallow groundwater can respond relatively rapidly to changes in nitrogen management in the Dutch Flats area.
3.3 Opportunities and limitations of the random forest approach in estimating lag times
Overall, results suggest that, in a complex system such as Dutch Flats, random forest was able to identify reasonable transport rates for both the vadose and saturated zones, and with additional validation, this method may offer an inexpensive (i.e., compared to groundwater age dating across a large monitoring well network and/or complex modeling) and reasonable technique for estimating the lag time from historical monitoring data. Furthermore, this approach allows for additional insight on groundwater dynamics to be extracted from existing monitoring data. However, this study was conducted in the context of a larger project (Wells et al., 2018) and built on prior research on groundwater flow and in the study area (Böhlke et al., 2007). Therefore, it is critical, in future work, to incorporate site-specific knowledge, process understanding, and approaches for increasing the interpretability of machine learning models (Lundberg et al., 2020, Saia et al., 2020), as highlighted in the key considerations below.
Some key considerations for the future application of this approach include the following:
-
The random forest approach might be useful for estimating future recharge and using multiple potential management scenarios as long as the considered management scenarios fall within the range of historical observations used to train the model. This information could be used to inform policy makers of the impact that current and future management decisions will have on recharge and .
-
The Dutch Flats overlies a predominantly oxic aquifer where nitrate transport is mostly conservative. In aquifers with heterogeneity in the denitrification potential and/or distinct nitrate extinction depths (Liao et al., 2012; Welch et al., 2011), this approach may be biased toward the oxic portions of the aquifer where the nitrate signal is preserved. Similarly, vertical profiles of and isotopic composition in the vadose zone could provide valuable data for investigating (1) the amount of nitrate stored in the vadose zone and (2) whether nitrate undergoes any biogeochemical changes while being transported through the vadose zone to the water table.
-
While estimates of vadose and saturated zone transport rates determined from %incMSE are consistent with previous studies, the predictive performance of the selected model (based on NSE and a visual inspection of predicted versus observed nitrate plots) was not substantially different to other models tested. In other words, the optimal model was only weakly preferred in terms of predicting . Testing the approach of using %incMSE in other vadose and saturated zones, with substantial comparison to previous transport rate estimates, is warranted. This would be especially valuable in an area with a well-defined input function for nitrate that could be compared to a reconstructed input function from the model. Furthermore, in aquifer settings with relatively evenly distributed recharge, optimized travel times to wells could be used to estimate the infiltration date of samples, thus providing an optimized view of historical variations in entering the subsurface, as illustrated in Fig. S1B. In the Dutch Flats area, however, such an analysis is complicated by the effects of subsurface nitrate dilution by local recharge from canal leakage.
-
Despite the potential non-uniqueness in the prediction metrics, the heat map of %incMSE did reveal an orderly pattern, suggesting consistent transport rate ratios. For modeling efforts where recharge rates are a key calibration parameter, the identification of a range of reasonable recharge rates, and/or the ratio of recharge rates from diffuse and focused recharge sources for a complex system, will reduce model uncertainty and improve the results. This statistical machine learning approach, which essentially leverages nitrate as a tracer (albeit with an unknown input function in this case), may provide valuable insight to complement relatively expensive groundwater age-dating or vadose zone monitoring data or perhaps it will be useful as a stand-alone approach for first-order approximations.
-
The demonstrated statistical machine learning approach is apparently well-suited for drawing out transport rate information from a site with two distinct recharge sources (diffuse versus focused recharge sources) driving the groundwater nitrate dynamics. Further testing is needed at sites where recharge and nitrate dynamics are more subtle.
The Dutch Flats area exhibits large variations in throughout a relatively small region in western Nebraska. Long-term groundwater monitoring and previous groundwater age-dating studies in Dutch Flats provided an opportune setting to test a new application of statistical machine learning (random forest) for determining vadose and saturated zone transport rates. Overall results suggest that random forest has the capability to both identify reasonable transport rates (and lag time) and key variables influencing groundwater , albeit with the potential for non-unique results. Limitations were also identified when using dynamic predictors to model groundwater . Utilizing only static predictors and random forest's ability to evaluate variable importance, vadose zone and saturated zone transport rates were selected based on model sensitivity to changing the total travel time predictor. In other words, total travel time variable importance was evaluated for 288 different transport rate combinations, and the combination with a total travel time that had the largest influence over the model's ability to predict was selected for additional examination. This analysis identified a vadose zone and saturated zone transport rate combination consistent with rates previously estimated from age dating in Böhlke et al. (2007) and Wells et al. (2018), indicating that there is a combination of distributed and focused sources of irrigation recharge to this aquifer.
Future studies could include assessments of the proper conditions for the application of dynamic predictors and comparisons of data-driven analyses with complementary data sets and/or modeling (e.g., field-based recharge rate estimates, finite-difference flow model). Despite the noted limitations, the partial dependence plots and relative importance of predictors were largely consistent with the previous findings and mechanistic understanding of the study area, giving greater confidence in the model outputs. The influence of canal leakage on groundwater recharge rates and , for example, was consistent with previous Dutch Flats studies. Partial dependence plots suggest a threshold of higher for groundwater with a total travel time (vadose and saturated zone travel times, combined) of less than 7 years, indicating the potential for a relatively rapid groundwater response to the widespread implementation of best management practices. Additionally, research is needed to determine the minimum number of observations necessary to effectively apply the framework shown here.
The code is available on request. Data used in the random forest model and described in the Supplement are available via the University of Nebraska – Lincoln Data Repository (UNLDR; https://doi.org/10.32873/unl.dr.20200428; Wells and Gilmore, 2020).
An online file accompanying this article contains additional figures, tables, and details of the methods used for the study. The supplement related to this article is available online at: https://doi.org/10.5194/hess-25-811-2021-supplement.
TG, AM, and NN were responsible for the conceptualization. MW and NN developed the model code, and MW performed the formal analysis. MW prepared the paper from his Masters thesis, with contributions from all coauthors, including JKB. TG was responsible for the project administration and funding acquisition.
The authors declare that they have no conflict of interest.
Any use of trade, firm, or product names is for descriptive purposes only and does not imply endorsement by the U.S. government.
The authors acknowledge the North Platte Natural Resources District for providing technical assistance and resources, including long-term groundwater nitrate data accessed via the Quality-Assessed Agrichemical Contaminant Database for Nebraska Groundwater. We thank Steve Sibray and Mason Johnson, for their support in the field sampling efforts, and Les Howard, for the cartography. Models were run on the Holland Computing Center (HCC) cluster at the University of Nebraska – Lincoln. We also thank Christopher Green, Sophie Ehrhardt, Pia Ebeling, and two anonymous reviewers for the helpful comments on earlier versions of the paper.
This research has been supported by the U.S. Geological Survey (grant no. 2016NE286B), the U.S. Department of Agriculture National Institute of Food and Agriculture (grant no. NEB-21-177; accession no. 1015698), and the Daugherty Water for Food Global Institute Fellowship for graduate students.
This paper was edited by Nunzio Romano and reviewed by Sophie Ehrhardt, Pia Ebeling, and two anonymous referees.
Anning, D. W., Paul, A. P., McKinney, T. S., Huntington, J. M., Bexfield, L. M., and Thiros, S. A.: Predicted Nitrate and Arsenic Concentrations in Basin-Fill Aquifers of the Southwestern United States, United States Geological Survey Scientific Investigations Report 2012–5065, 78, available at: https://pubs.usgs.gov/sir/2012/5065/ (last access: 8 February 2021), 2012.
Babcock, H. M., Visher, F. N., and Durum, W. H.: Ground-Water Conditions in the Dutch Flats Area, Scotts Bluff and Sioux Counties, Nebraska, United States Geological Survey Circular 126, 51, available at: http://pubs.er.usgs.gov/publication/cir126 (last access: 8 February 2021), 1951.
Ball, L. B., Kress, W. H., Steele, G. V., Cannia, J. C., and Andersen, M. J.: Determination of Canal Leakage Potential Using Continuous Resistivity Profiling Techniques, Interstate and Tri-State Canals, Western Nebraska and Eastern Wyoming, 2004, United States Geological Survey Scientific Investigations Report 2006–5032, 53, available at: http://pubs.er.usgs.gov/publication/sir20065032 (last access: 8 February 2021), 2006.
Böhlke, J. K.: Groundwater Recharge and Agricultural Contamination, Hydrogeol. J., 10, 153–179, https://doi.org/10.1007/s10040-001-0183-3, 2002.
Böhlke, J. K. and Denver, J. M.: Combined Use of Groundwater Dating, Chemical, and Isotopic Analyses to Resolve the History and Fate of Nitrate Contamination in Two Agricultural Watersheds, Atlantic Coastal Plain, Maryland, Water Resour. Res., 31, 2319–2339, https://doi.org/10.1029/95WR01584, 1995.
Böhlke, J. K., Wanty, R., Tuttle, M., Delin, G., and Landon, M.: Denitrification in the Recharge Area and Discharge Area of a Transient Agricultural Nitrate Plume in a Glacial Outwash Sand Aquifer, Minnesota, Water Resour. Res., 38, 10-1–10–26, https://doi.org/10.1029/2001WR000663, 2002.
Böhlke, J. K., Verstraeten, I. M., and Kraemer, T. F.: Effects of Surface-Water Irrigation on Sources, Fluxes, and Residence Times of Water, Nitrate, and Uranium in an Alluvial Aquifer, Appl. Geochem., 22, 152–174, https://doi.org/10.1016/j.apgeochem.2006.08.019, 2007.
Breiman, L.: Random Forests, Machine Learning, 45, 5–32, https://doi.org/10.1023/A:1010933404324, 2001.
Browne, B. A. and Guldan, N. M.: Understanding Long-Term Baseflow Water Quality Trends Using a Synoptic Survey of the Ground Water–Surface Water Interface, Central Wisconsin, Journal of Environment Quality, 34, 825, https://doi.org/10.2134/jeq2004.0134, 2005.
Cherry, M., Gilmore, T., Mittelstet, A., Gastmans, D., Santos, V., and Gates, J. B.: Recharge Seasonality Based on Stable Isotopes: Nongrowing Season Bias Altered by Irrigation in Nebraska, Hydrol. Process., 34, 1575–1586, https://doi.org/10.1002/hyp.13683, 2020.
Cook, P. G. and Böhlke, J. K.: Determining Timescales for Groundwater Flow and Solute Transport, in: Environmental Tracers in Subsurface Hydrology, edited by: Cook, P. G. and Herczeg, A. L., 1–30, Springer US, Boston, MA, 2000.
Dieter, C. A., Maupin, M. A., Caldwell, R. R., Harris, M. A., Ivahnenko, T. I., Lovelace, J. K., Barber, N. L., and Linsey, K. S.: Estimated Use of Water in The United States in 2015, United States Geological Survey Circular 1441, 65, https://doi.org/10.3133/cir1441, 2018.
Eberts, S. M., Thomas, M. S., and Jagucki, M. L.: Factors Affecting Public-Supply-Well Vulnerability to Contamination: Understanding Observed Water Quality and Anticipating Future Water Quality, U.S. Geological Survey Circular 1385, 120, available at: https://pubs.usgs.gov/circ/1385/ (last access: 8 February 2021), 2013.
Efron, B.: Bootstrap Methods: Another Look at the Jackknife, Ann. Stat., 7, 1–26, https://doi.org/10.1214/aos/1176344552, 1979.
Eibe, F., Hall, M. A., and Witten, I. H.: The WEKA Workbench, in: Online Appendix for “Data Mining: Practical Machine Learning Tools and Techniques,” Morgan Kaufmann, San Francisco, CA, United States, 2016.
Exner, M. E., Perea-Estrada, H., and Spalding, R. F.: Long-Term Response of Groundwater Nitrate Concentrations to Management Regulations in Nebraska's Central Platte Valley, The Sci. World J., 10, 286–297, https://doi.org/10.1100/tsw.2010.25, 2010.
Gilmore, T. E., Genereux, D. P., Solomon, D. K., and Solder, J. E.: Groundwater Transit Time Distribution and Mean from Streambed Sampling in an Agricultural Coastal Plain Watershed, North Carolina, USA, Water Resour. Res., 52, 2025–2044, https://doi.org/10.1002/2015WR017600, 2016.
Green, C. T., Liao, L., Nolan, B. T., Juckem, P. F., Shope, C. L., Tesoriero, A. J., and Jurgens, B. C.: Regional Variability of Nitrate Fluxes in the Unsaturated Zone and Groundwater, Wisconsin, USA, Water Resour. Res., 54, 301–322, https://doi.org/10.1002/2017WR022012, 2018.
Harvey, F. E. and Sibray, S. S.: Delineating Ground Water Recharge from Leaking Irrigation Canals Using Water Chemistry and Isotopes, Ground Water, 39, 408–421, https://doi.org/10.1111/j.1745-6584.2001.tb02325.x, 2001.
Hastie, T., Tibshirani, R., and Friedman, J. H.: The Elements of Statistical Learning: Data Mining, Inference, And Prediction, 2nd ed., Springer, New York, USA, 2009.
Hobza, C. M. and Andersen, M. J.: Quantifying Canal Leakage Rates Using a Mass-Balance Approach and Heat-Based Hydraulic Conductivity Estimates in Selected Irrigation Canals, Western Nebraska, 2007 through 2009, United States Geological Survey Scientific Investigations Report 2010–5226, 38, https://doi.org/10.3133/sir20105226, 2010.
Homer, C. G., Dewitz, J., Yang, L., Jin, S., Danielson, P., Xian, G. Z., Coulston, J., Herold, N., Wickham, J., and Megown, K.: Completion of the 2011 National Land Cover Database for the Conterminous United States – Representing a Decade of Land Cover Change Information, Photogramm. Eng. Rem. S., 81, 345–354, 2015.
Hudson, C. (NPNRD): Personal communication with M. J. Wells, University of Nebraska, Lincoln, NE, USA, 2018.
Ilampooranan, I., Van Meter, K. J., and Basu, N. B.: A Race Against Time: Modelling Time Lags in Watershed Response, 55, 3941–3959, Water Resour. Res., https://doi.org/10.1029/2018WR023815, 2019.
Irmak, S., Odhiambo, L., Kranz, W. L., and Eisenhauer, D. E.: Irrigation Efficiency and Uniformity, And Crop Water Use Efficiency, Extension Circular, University of Nebraska – Lincoln, Lincoln, NE, available at: http://extensionpubs.unl.edu/ (last access: 8 February 2021), 2011.
Jones, Z. M. and Linder, F. J.: Exploratory Data Analysis using Random Forests, in 73rd Annual MPSA Conference, 1–31, available at: http://zmjones.com/static/papers/rfss_manuscript.pdf (last access: 25 May 2018), 2015.
Juntakut, P., Snow, D. D., Haacker, E. M. K., and Ray, C.: The Long Term Effect of Agricultural, Vadose Zone and Climatic Factors on Nitrate Contamination in Nebraska's Groundwater System, J. Contam. Hydrol., 220, 33–48, https://doi.org/10.1016/j.jconhyd.2018.11.007, 2019.
Kennedy, C. D., Genereux, D. P., Corbett, D. R., and Mitasova, H.: Spatial and Temporal Dynamics of Coupled Groundwater and Nitrogen Fluxes Through a Streambed in an Agricultural Watershed, Water Resour. Res., 45, https://doi.org/10.1029/2008WR007397, 2009.
Knoll, L., Breuer, L., and Bach, M.: Nation-Wide Estimation of Groundwater Redox Conditions and Nitrate Concentrations Through Machine Learning, Environ. Res. Lett., 15, 064004, https://doi.org/10.1088/1748-9326/ab7d5c, 2020.
Kuhn, M.: Building Predictive Models in R Using the Caret Package, J. Stat. Softw., 28, https://doi.org/10.18637/jss.v028.i05, 2008.
Liao, L., Green, C. T., Bekins, B. A., and Böhlke, J. K.: Factors Controlling Nitrate Fluxes in Groundwater in Agricultural Areas, Water Resour. Res., 48, https://doi.org/10.1029/2011WR011008, 2012.
Luckey, R. R. and Cannia, J. C.: Groundwater Flow Model of the Western Model Unit of the Nebraska Cooperative Hydrology Study (COHYST) Area, Nebraska Department of Natural Resources, Lincoln, NE, available at: ftp://ftp.dnr.nebraska.gov/Pub/cohystftp/cohyst/model_reports/WMU_Documentation_060519.pdf (last access: 24 March 2017), 2006.
Lundberg, S. M., Erion, G., Chen, H., DeGrave, A., Prutkin, J. M., Nair, B., Katz, R., Himmelfarb, J., Bansal, N., and Lee, S. I.: from Local Explanations to Global Understanding with Explainable AI for Trees, Nature Machine Intelligence, 2, 56–67, https://doi.org/10.1038/s42256-019-0138-9, 2020.
McMahon, P. B., Dennehy, K. F., Bruce, B. W., Böhlke, J. K., Michel, R. L., Gurdak, J. J., and Hurlbut, D. B.: Storage and Transit Time of Chemicals in Thick Unsaturated Zones Under Rangeland and Irrigated Cropland, High Plains, United States, Water Resour. Res., 42, https://doi.org/10.1029/2005WR004417, 2006.
Meals, D. W., Dressing, S. A., and Davenport, T. E.: Lag Time in Water Quality Response to Best Management Practices: A Review, Journal of Environment Quality, 39, 85, https://doi.org/10.2134/jeq2009.0108, 2010.
Mittelstet, A. R., Smolen, M. D., Fox, G. A., and Adams, D. C.: Comparison of Aquifer Sustainability Under Groundwater Administrations in Oklahoma and Texas, J. Am. Water Resour. As., 47, 424–431, https://doi.org/10.1111/j.1752-1688.2011.00524.x, 2011.
Morgenstern, U., Daughney, C. J., Leonard, G., Gordon, D., Donath, F. M., and Reeves, R.: Using groundwater age and hydrochemistry to understand sources and dynamics of nutrient contamination through the catchment into Lake Rotorua, New Zealand, Hydrol. Earth Syst. Sci., 19, 803–822, https://doi.org/10.5194/hess-19-803-2015, 2015.
Nash, J. E. and Sutcliffe, J. V.: River Flow Forecasting Through Conceptual Models Part I – A Discussion of Principles, J. Hydrol., 10, 282–290, https://doi.org/10.1016/0022-169490255-6, 1970.
NASS: USDA/NASS QuickStats Ad-hoc Query Tool, available at: https://quickstats.nass.usda.gov/, last access: 15 February 2018.
NEDNR: Fifty-Fifth Biennial Report of the Department of Natural Resources, Nebraska Department of Natural Resources, Lincoln, NE, available at: https://dnr.nebraska.gov/sites/dnr.nebraska.gov/files/doc/surface-water/biennial-reports/BiennialReport2005-06.pdf (last access: 8 February 2021), 2009.
Nelson, N. G., Muñoz-Carpena, R., Phlips, E. J., Kaplan, D., Sucsy, P., and Hendrickson, J.: Revealing Biotic and Abiotic Controls of Harmful Algal Blooms in a Shallow Subtropical Lake through Statistical Machine Learning, Environ. Sci. Technol., 52, 3527–3535, https://doi.org/10.1021/acs.est.7b05884, 2018.
NOAA: National Climatic Data Center (NCDC), available at: https://www.ncdc.noaa.gov/cdo-web/datatools, last access: 4 August 2017.
Nolan, B. T., Green, C. T., Juckem, P. F., Liao, L., and Reddy, J. E.: Metamodeling and Mapping of Nitrate Flux in the Unsaturated Zone and Groundwater, Wisconsin, USA, J. Hydrol., 559, 428–441, https://doi.org/10.1016/j.jhydrol.2018.02.029, 2018.
Nolan, B. T., Gronberg, J. M., Faunt, C. C., Eberts, S. M., and Belitz, K.: Modeling Nitrate at Domestic and Public-Supply Well Depths in the Central Valley, California, Environ. Sci. Technol., 48, 5643–5651, https://doi.org/10.1021/es405452q, 2014.
NRCS: Web Soil Survey, available at: https://websoilsurvey.sc.egov.usda.gov/ (last access: 16 November 2017), 2018.
Ouedraogo, I., Defourny, P., and Vanclooster, M.: Validating a Continental-Scale Groundwater Diffuse Pollution Model Using Regional Datasets, Environ. Sci. Pollut. R., 26, 2105–2119, https://doi.org/10.1007/s11356-017-0899-9, 2017.
Preston, T. (NPNRD): Personal communication with M. J. Wells, University of Nebraska, Lincoln, NE, USA, 2017.
Puckett, L. J., Tesoriero, A. J., and Dubrovsky, N. M.: Nitrogen Contamination of Surficial Aquifers – A Growing Legacy, Environ. Sci. Technol., 45, 839–844, https://doi.org/10.1021/es1038358, 2011.
R Core Team: R: A Language and Environment for Statistical Computing, R Foundation for Statistical Computing, Vienna, Austria, available at: https://www.R-project.org/ (last access: 8 February 2021), 2017.
Rahmati, O., Choubin, B., Fathabadi, A., Coulon, F., Soltani, E., Shahabi, H., Mollaefar, E., Tiefenbacher, J., Cipullo, S., Ahmad, B. B., and Tien Bui, D.: Predicting Uncertainty of Machine Learning Models for Modelling Nitrate Pollution of Groundwater Using Quantile Regression and UNEEC Methods, Sci. Total Environ., 688, 855–866, https://doi.org/10.1016/j.scitotenv.2019.06.320, 2019.
Ransom, K. M., Nolan, B. T., A. Traum, J., Faunt, C. C., Bell, A. M., Gronberg, J. A. M., Wheeler, D. C., Z. Rosecrans, C., Jurgens, B., Schwarz, G. E., Belitz, K., M. Eberts, S., Kourakos, G., and Harter, T.: A Hybrid Machine Learning Model to Predict and Visualize Nitrate Concentration Throughout the Central Valley Aquifer, California, USA, Sci. Total Environ., 601–602, 1160–1172, https://doi.org/10.1016/j.scitotenv.2017.05.192, 2017.
Rodriguez-Galiano, V. F., Mendes, M. P., Garcia-Soldado, M. J., Chica-Olmo, M., and Ribeiro, L.: Predictive Modeling of Groundwater Nitrate Pollution Using Random Forest and Multisource Variables Related to Intrinsic and Specific Vulnerability: A Case Study in an Agricultural Setting (Southern Spain), Sci. Total Environ., 476–477, 189–206, https://doi.org/10.1016/j.scitotenv.2014.01.001, 2014.
Rossman, N. R., Zlotnik, V. A., Rowe, C. M., and Szilagyi, J.: Vadose Zone Lag Time and Potential 21st Century Climate Change Effects on Spatially Distributed Groundwater Recharge in The Semi-Arid Nebraska Sand Hills, J. Hydrol., 519, 656–669, https://doi.org/10.1016/j.jhydrol.2014.07.057, 2014.
Russoniello, C. J., Konikow, L. F., Kroeger, K. D., Fernandez, C., Andres, A. S., and Michael, H. A.: Hydrogeologic Controls on Groundwater Discharge and Nitrogen Loads in a Coastal Watershed, J. Hydrol., 538, 783–793, https://doi.org/10.1016/j.jhydrol.2016.05.013, 2016.
Saia, S. M., Nelson, N., Huseth, A. S., Grieger, K., and Reich, B. J.: Transitioning Machine Learning from Theory to Practice in Natural Resources Management, Ecol. Model., 435, 109257, https://doi.org/10.1016/j.ecolmodel.2020.109257, 2020.
Spalding, R. F., Watts, D. G., Schepers, J. S., Burbach, M. E., Exner, M. E., Poreda, R. J., and Martin, G. E.: Controlling Nitrate Leaching in Irrigated Agriculture, J. Environ. Qual., 30, 1184, https://doi.org/10.2134/jeq2001.3041184x, 2001.
Turkeltaub, T., Kurtzman, D., and Dahan, O.: Real-time monitoring of nitrate transport in the deep vadose zone under a crop field – implications for groundwater protection, Hydrol. Earth Syst. Sci., 20, 3099–3108, https://doi.org/10.5194/hess-20-3099-2016, 2016.
University of Nebraska – Lincoln (UNL): Quality-Assessed Agrichemical Contaminant Database for Nebraska Ground Water, available at: https://clearinghouse.nebraska.gov/Clearinghouse.aspx, last access: 5 September 2016.
USBR: Hydromet: Archive Data Access, available at: https://www.usbr.gov/gp/hydromet/hydromet_arcread.html, last access: 22 May 2018.
USDA: NAIP and NAPP Imagery, available at: https://dnr.nebraska.gov/data/digital-imagery, last access: 14 August 2017.
U.S. Geological Survey [USGS]: National Elevation Dataset (NED), available at: https://datagateway.nrcs.usda.gov/ (last access: 8 October 2020), 1997.
U.S. Geological Survey [USGS]: LANDSAT Imagery, available at: https://earthexplorer.usgs.gov/, last access: 14 August 2017.
U.S. Geological Survey [USGS]: NHDPlus High Resolution, available at: https://nhd.usgs.gov/NHDPlus_HR.html (last access: 29 June 2018), 2012.
Van Meter, K. J. and Basu, N. B.: Catchment Legacies and Time Lags: A Parsimonious Watershed Model to Predict the Effects of Legacy Storage on Nitrogen Export, edited by: Hong, Y., PLoS ONE, 10, e0125971, https://doi.org/10.1371/journal.pone.0125971, 2015.
Van Meter, K. J. and Basu, N. B.: Time Lags in Watershed-Scale Nutrient Transport: An Exploration of Dominant Controls, Environ. Res. Lett., 12, 084017, https://doi.org/10.1088/1748-9326/aa7bf4, 2017.
Vanclooster, M., Petit, S., Bogaert, P., and Lietar, A.: Modelling Nitrate Pollution Vulnerability in the Brussel's Capital Region (Belgium) Using Data-Driven Modelling Approaches, Journal of Water Resource and Protection, 12, 416–430, https://doi.org/10.4236/jwarp.2020.125025, 2020.
Verstraeten, I. M., Sibray, S. S., Cannia, J. C., and Tanner, D. Q.: Reconnaissance of Ground-Water Quality in the North Platte Natural Resources District, Western Nebraska, June–July 1991, United States Geological Survey Water-Resources Investigations Report 94–4057, https://doi.org/10.3133/wri944057, Earth Science Information Center, Reston, VA, United States, 1995.
Verstraeten, I. M., Steele, G. V., Cannia, J. C., Böhlke, J. K., Kraemer, T. E., Hitch, D. E., Wilson, K. E., and Carnes, A. E.: Selected Field and Analytical Methods and Analytical Results in the Dutch Flats Area, Western Nebraska, 1995–99, United States Geological Survey U.S. Geological Survey Open-File Report 00-413, 53, https://doi.org/10.3133/ofr00413, Reston, VA, United States, 2001a.
Verstraeten, I. M., Steele, G. V., Cannia, J. C., Hitch, D. E., Scripter, K. G., Böhlke, J. K., Kraemer, T. F., and Stanton, J. S.: Interaction of Surface Water and Ground Water in the Dutch Flats Area, Western Nebraska, 1995–99, United States Geological Survey Water-Resources Investigations Report 01-4070, 56, https://doi.org/10.3133/wri014070, Reston, VA, United States, 2001b.
Welch, H. L., Green, C. T., and Coupe, R. H.: The Fate and Transport of Nitrate in Shallow Groundwater in Northwestern Mississippi, USA, Hydrogeol. J., 19, 1239–1252, https://doi.org/10.1007/s10040-011-0748-8, 2011.
Wells, M. and Gilmore, T. E.: Dutch Flats Groundwater Nitrate for Machine Learning, https://doi.org/10.32873/unl.dr.20200428, 2020.
Wells, M., Gilmore, T., Mittelstet, A., Snow, D., and Sibray, S.: Assessing Decadal Trends of a Nitrate-Contaminated Shallow Aquifer in Western Nebraska Using Groundwater Isotopes, Age-Dating, and Monitoring, Water, 10, 1047, https://doi.org/10.3390/w10081047, 2018.
Wheeler, D. C., Nolan, B. T., Flory, A. R., DellaValle, C. T., and Ward, M. H.: Modeling Groundwater Nitrate Concentrations in Private Wells in Iowa, Sci. Total Environ., 536, 481–488, https://doi.org/10.1016/j.scitotenv.2015.07.080, 2015.
Yonts, D.: G02-1465 Crop Water Use in Western Nebraska, University of Nebraska-Lincoln Extension, available at: https://digitalcommons.unl.edu/extensionhist (last access: 8 February 2021), 2002.
Young, L.A. (UNL): Personal communication with M. J. Wells, University of Nebraska, Lincoln, NE, USA, 2016.