the Creative Commons Attribution 4.0 License.
the Creative Commons Attribution 4.0 License.
 | 05 Jan 2021
Drivers of nitrogen and phosphorus dynamics in a groundwater-fed urban catchment revealed by high-frequency monitoring
Liang Yu
Joachim C. Rozemeijer
Hans Peter Broers
Boris M. van Breukelen
Jack J. Middelburg
Maarten Ouboter
Ype van der Velde
Eutrophication of water bodies has been a problem causing severe degradation of water quality in cities. To gain mechanistic understanding of the temporal dynamics of nitrogen (N) and phosphorus (P) in a groundwater-fed low-lying urban polder, we applied high-frequency monitoring in Geuzenveld, a polder in the city of Amsterdam. The high-frequency monitoring equipment was installed at the pumping station where water leaves the polder. From March 2016 to June 2017, total phosphorus (TP), ammonium (NH4), turbidity, electrical conductivity (EC), and water temperature were measured at intervals of less than 20 min. This paper discusses the results at three timescales: annual scale, rain event scale, and single pumping event scale. Mixing of upwelling groundwater (main source of N and P) and runoff from precipitation on pavements and roofs was the dominant hydrological process governing the temporal pattern of the EC, while N and P fluxes from the polder were also regulated by primary production and iron transformations. In our groundwater-seepage controlled catchment, NH4 appeared to be the dominant form of N with surface water concentrations in the range of 2–6 mg N L−1, which stems from production in an organic-rich subsurface. The concentrations of NH4 in the surface water were governed by the mixing process in autumn and winter and were reduced down to 0.1 mg N L−1 during the algal growing season in spring. The depletion of dissolved NH4 in spring suggests uptake by primary producers, consistent with high concentrations of chlorophyll a, O2, and suspended solids during this period. Total P and turbidity were high during winter (range 0.5–2.5 mg P L−1 and 200–1800 FNU, respectively, where FNU represents Formazin Nephelometric Unit) due to the release of P and reduced iron from anoxic sediment to the water column, where Fe2+ was rapidly oxidized and precipitated as iron oxides which contributed to turbidity. In the other seasons, P is retained in the sediment by sorption to precipitated iron oxides. Nitrogen is exported from the polder to the receiving waters throughout the whole year, mostly in the form of NH4 but in the form of organic N in spring. P leaves the polder mainly during winter, primarily associated with Fe(OH)3 colloids and as dissolved P. Based on this new understanding of the dynamics of N and P in this low-lying urban catchment, we suggested management strategies that may effectively control and reduce eutrophication in urban polders and receiving downstream waters.
- Article
(6941 KB) - Full-text XML
-
Supplement
(16989 KB) - BibTeX
- EndNote


Eutrophication is one of the most notorious phenomena of water quality impairment in cities, caused by excess inputs of N and P. The identified sources of nutrients are from wastewater treatment plants, storm runoff, overflow of sewage systems, manure and fertilizer application in urban green areas, and atmospheric deposition (Walsh et al., 2005; Kabenge et al., 2016; Toor et al., 2017; Yang and Toor, 2018; Putt et al., 2019). Recently, groundwater has been identified as another important source of N and P in cities situated in low-lying deltas, where dissolved NH4 and PO4 in groundwater seep up into urban surface water (Yu et al., 2018, 2019). The upwelling nutrients in groundwater, originating from the organic-rich delta subsurface, reach the surface water of cities and are transferred to downstream waters and eventually reach the coastal zones, where they may induce harmful algal blooms or cause hypoxia along coastlines (He and Xu, 2015; Beusen et al., 2016; Le Moal et al., 2019). Hence, it is of pivotal importance to understand N and P dynamics in the urban freshwater bodies in order to mitigate the input of nutrients into the oceans (e.g., Nyenje et al., 2010; Toor et al., 2017; Paerl et al., 2016, 2017; Le Moal et al., 2019).
Nutrient dynamics are governed by biological, chemical, and physical processes as well as their interactions. Assimilation by primary producers is a major biological factor regulating N and P concentrations in the aquatic environment. Aquatic micro- and macroorganisms assimilate P as PO4 and N mainly in fixed forms, such as nitrate (NO3) and ammonium (NH4), but for some specific organisms also in the form of N2. In estuaries, NH4 is the preferred N form for microbes (Middelburg and Nieuwenhuize, 2000), but the uptake rate for both NH4 and NO3 can achieve maximum rates under sustained exposure of NH4 or NO3 (Bunch and Bernot, 2012). Moreover, the nitrogen species are also involved in redox transformations (Soetaert and Herman, 1995). Under anaerobic conditions, NO3 can be reduced to NH4, in particular with high organic matter contents. It may also be denitrified to N2 and N2O under such conditions (Mulder et al., 1995); the latter is a climate-active gas. Under aerobic conditions, NH4 can be oxidized to NO3 through nitrification by nitrifying microbes, which is an O2-consuming and acid-generating process. Nitrification even occurs under cold conditions (below 10 ∘C) (Painter, 1970; Wilczak et al., 1996; Cavaliere and Baulch, 2019).
The mixing of water from different flow routes is an important hydrological process that controls nutrient dynamics (Rozemeijer and Broers, 2007; Rozemeijer et al., 2010a; van der Grift et al., 2014; Yu et al., 2019). As nutrient concentrations and speciation differ among different flow routes (Wriedt et al., 2007; Rozemeijer et al., 2010a; Yu et al., 2019; Yang and Toor, 2018), the mixing process results in dilution or enrichment of nutrients in surface water bodies during precipitation events (Wang et al., 2016).
Retention is another factor that determines nutrient concentrations and transport (McGlathery et al., 2001; Zhu et al., 2004; Henry and Fisher, 2003), especially for phosphorus, most of which is retained in inland water body sediments (Audet et al., 2020). The retained P compounds are either being permanently buried in the sediment or temporarily stored and acting later on as an internal nutrient source (Kleeberg et al., 2007; Filippelli, 2008; Zhang et al., 2018). Multiple researchers have highlighted the influence of iron chemistry on the dynamics of P in pH-neutral environments (Chen et al., 2018; Van der Grift et al., 2018). This is especially relevant when iron-rich groundwater interacts with surface water (Griffioen, 2006; Rozemeijer et al., 2010a; van der Grift, 2014; Yu et al., 2019), in which P is immobilized by the formation of iron (oxy)hydroxides during groundwater aeration. However, changes in chemistry or temperature may lead to the release of P and reduced iron. For instance, under anaerobic conditions, Fe and P can be mobilized by sulfate reduction, but this can be counteracted by the presence of NO3 as electron acceptor (Smolders et al., 2006).
Most studies of eutrophication are based on discrete sampling events which can give a general pattern of nutrient dynamics but can easily miss important nutrient transport and processing phenomena (Rozemeijer et al., 2010b; Rode et al., 2016; Toor et al., 2017). The countermeasures to control eutrophication have been hampered because of limited knowledge of N and P dynamics, e.g., their response to changing weather conditions and land use (van Geer et al., 2016). In the past few years, the development of new sensors and sampling technologies allows us to obtain data with substantially shorter intervals. In this paper, the high-frequency monitoring technology is referred to as an automatic monitoring program with sampling and analyzing frequencies that are sufficient for obtaining detailed water quality variation information. High-frequency technology has proved to be a way to understand nutrient dynamics (Rode et al., 2016; van Geer et al., 2016; Bieroza et al., 2018). Due to the abundant information offered by this technology, combined methodologies have been developed to quantitatively understand the in-stream hydrochemistry of nutrients (Miller et al., 2016; van der Grift et al., 2016; Duncan et al., 2017).
In our previous study on the water quality of Amsterdam (Yu et al., 2019), the transport routes of N and P from groundwater to surface water through seepage and drains were identified. In addition, spatial and temporal concentration patterns from discrete sampling campaigns showed a clear dilution pattern of other water quality parameters such as electrical conductivity (EC). However, the temporal patterns of N and P were still poorly understood, probably due to their reactive nature and more complex biogeochemistry. In order to obtain insight into the controlling mechanisms of N and P transport and their fate in urban delta catchments affected by groundwater, we performed a year-round high-resolution N and P concentration monitoring campaign. A deep understanding of the water quality dynamic drivers would be a great asset for controlling eutrophication and improving aquatic ecological status (Fletcher et al., 2015; Díaz et al., 2016; Eggimann et al., 2017; Nizzoli et al., 2020). We conducted a 1-year high-frequency monitoring campaign in 2016–2017. Measured parameters were EC, NH4, total phosphorus (TP), turbidity, and water temperature. The temporal patterns of these parameters were studied at three timescales: the annual scale, rain event scale, and pumping event scale.
2.1 Study site
The Geuzenveld study site is part of an urban lowland polder catchment, which is characterized by groundwater seepage that constantly determines the surface water quality, being the main source of solutes in the water system. The groundwater seepage is a continuous source of slightly brackish, anoxic, and iron- and nutrient-rich water. Yu et al. (2019) presented the results of a 10-year monitoring program describing the main processes determining the water quality in the catchment, which is dominated by mixing of runoff water and seepage water. A high-frequency monitoring campaign was set up to further unravel the temporal patterns of the nutrient N and P, of which N is typically present in the form of NH4 from groundwater.
Geuzenveld is a newly built urban polder on the west side of the city of Amsterdam (Fig. 1). Since the 1990s, when it was converted from agricultural to urban land, it has developed into a highly paved area. Similar to other new neighborhoods, Geuzenveld is equipped with a separated drainage system. A rain-harvesting system was installed on all the buildings and houses in the polder, leading rain water from the roof and the street directly to the ditches, which results in fast and large amounts of runoff during storm events. Geuzenveld is a groundwater-fed catchment due to the constantly higher groundwater head (−2.5 to −3 m NAP, where NAP represents Normaal Amsterdams Peil, i.e., Amsterdam Ordnance Datum) in the main aquifer relative to the surface water level in the polder ditches ( m NAP) (Fig. 2). To keep the foundations of the buildings dry, there is a groundwater drainage system placed under an artificial sandy layer, right on top of a natural clay layer. The drain elevations range from −4.84 to −4.61 m NAP, which is below the phreatic groundwater level throughout the year, making sure that groundwater seepage either discharges through the drains or the ditches.
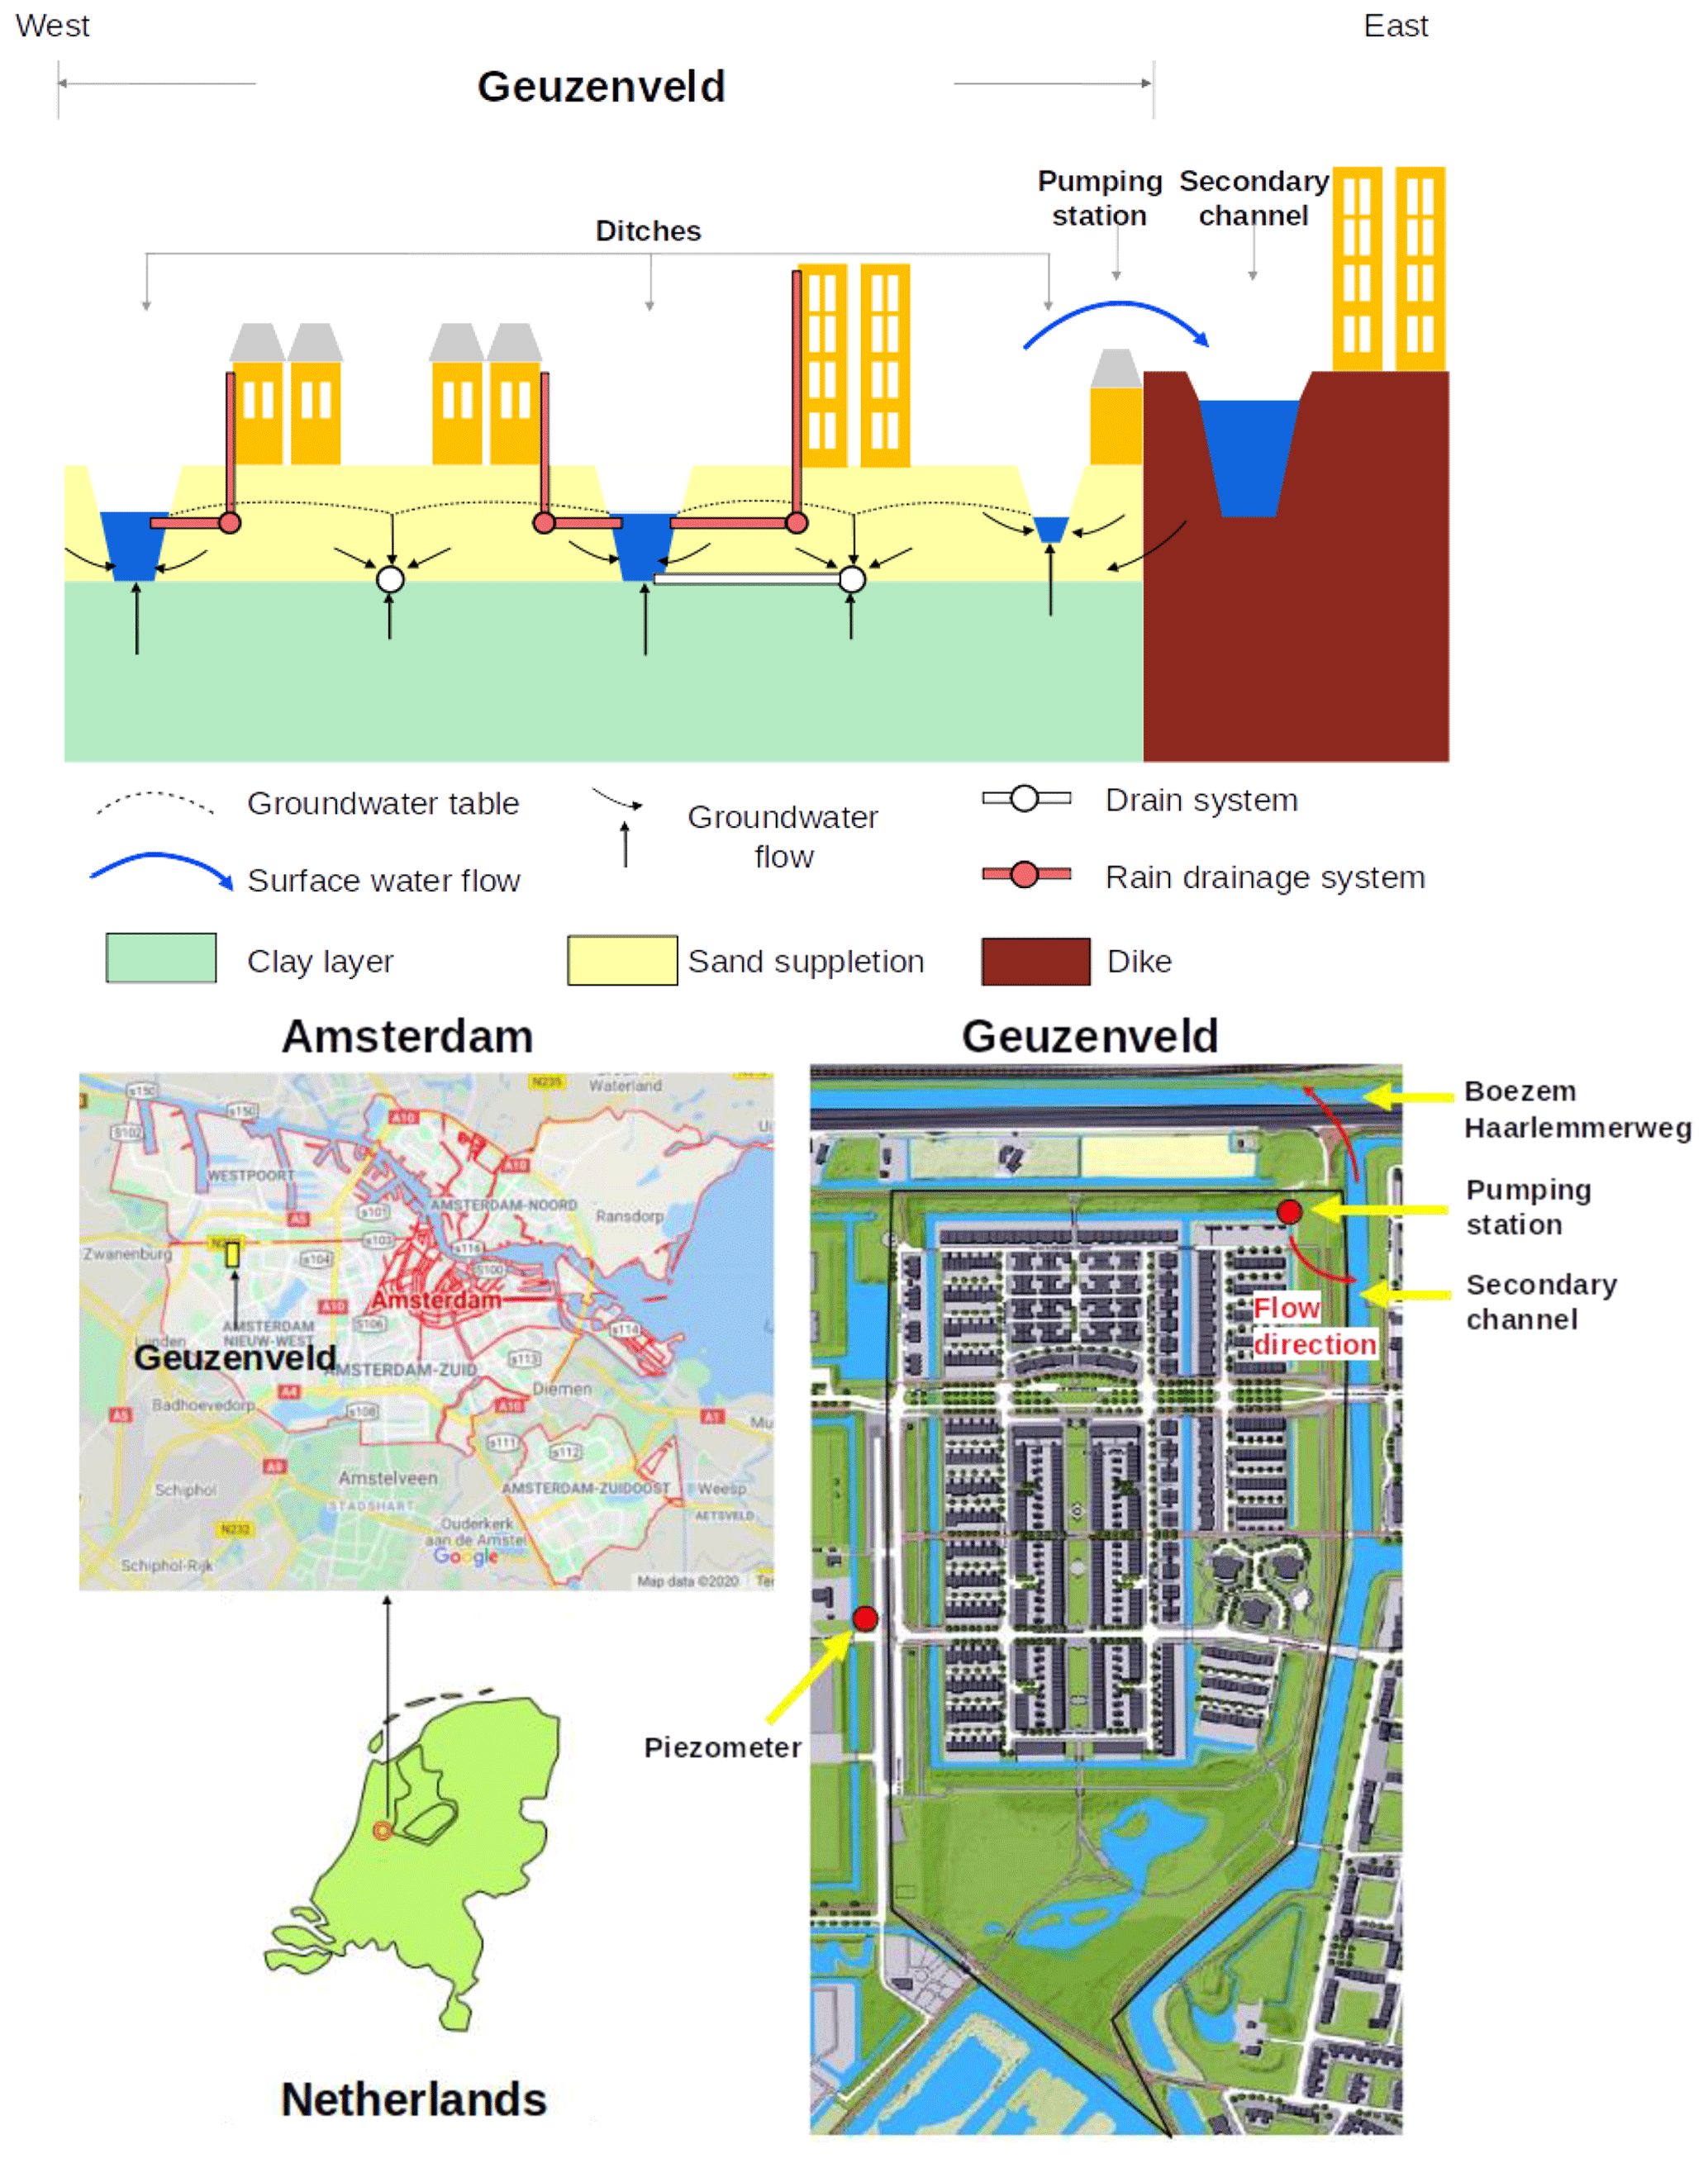
Figure 1Location of polder Geuzenveld (source: © Google Maps) and its landscape cross section as well as rain water and groundwater drainage system.
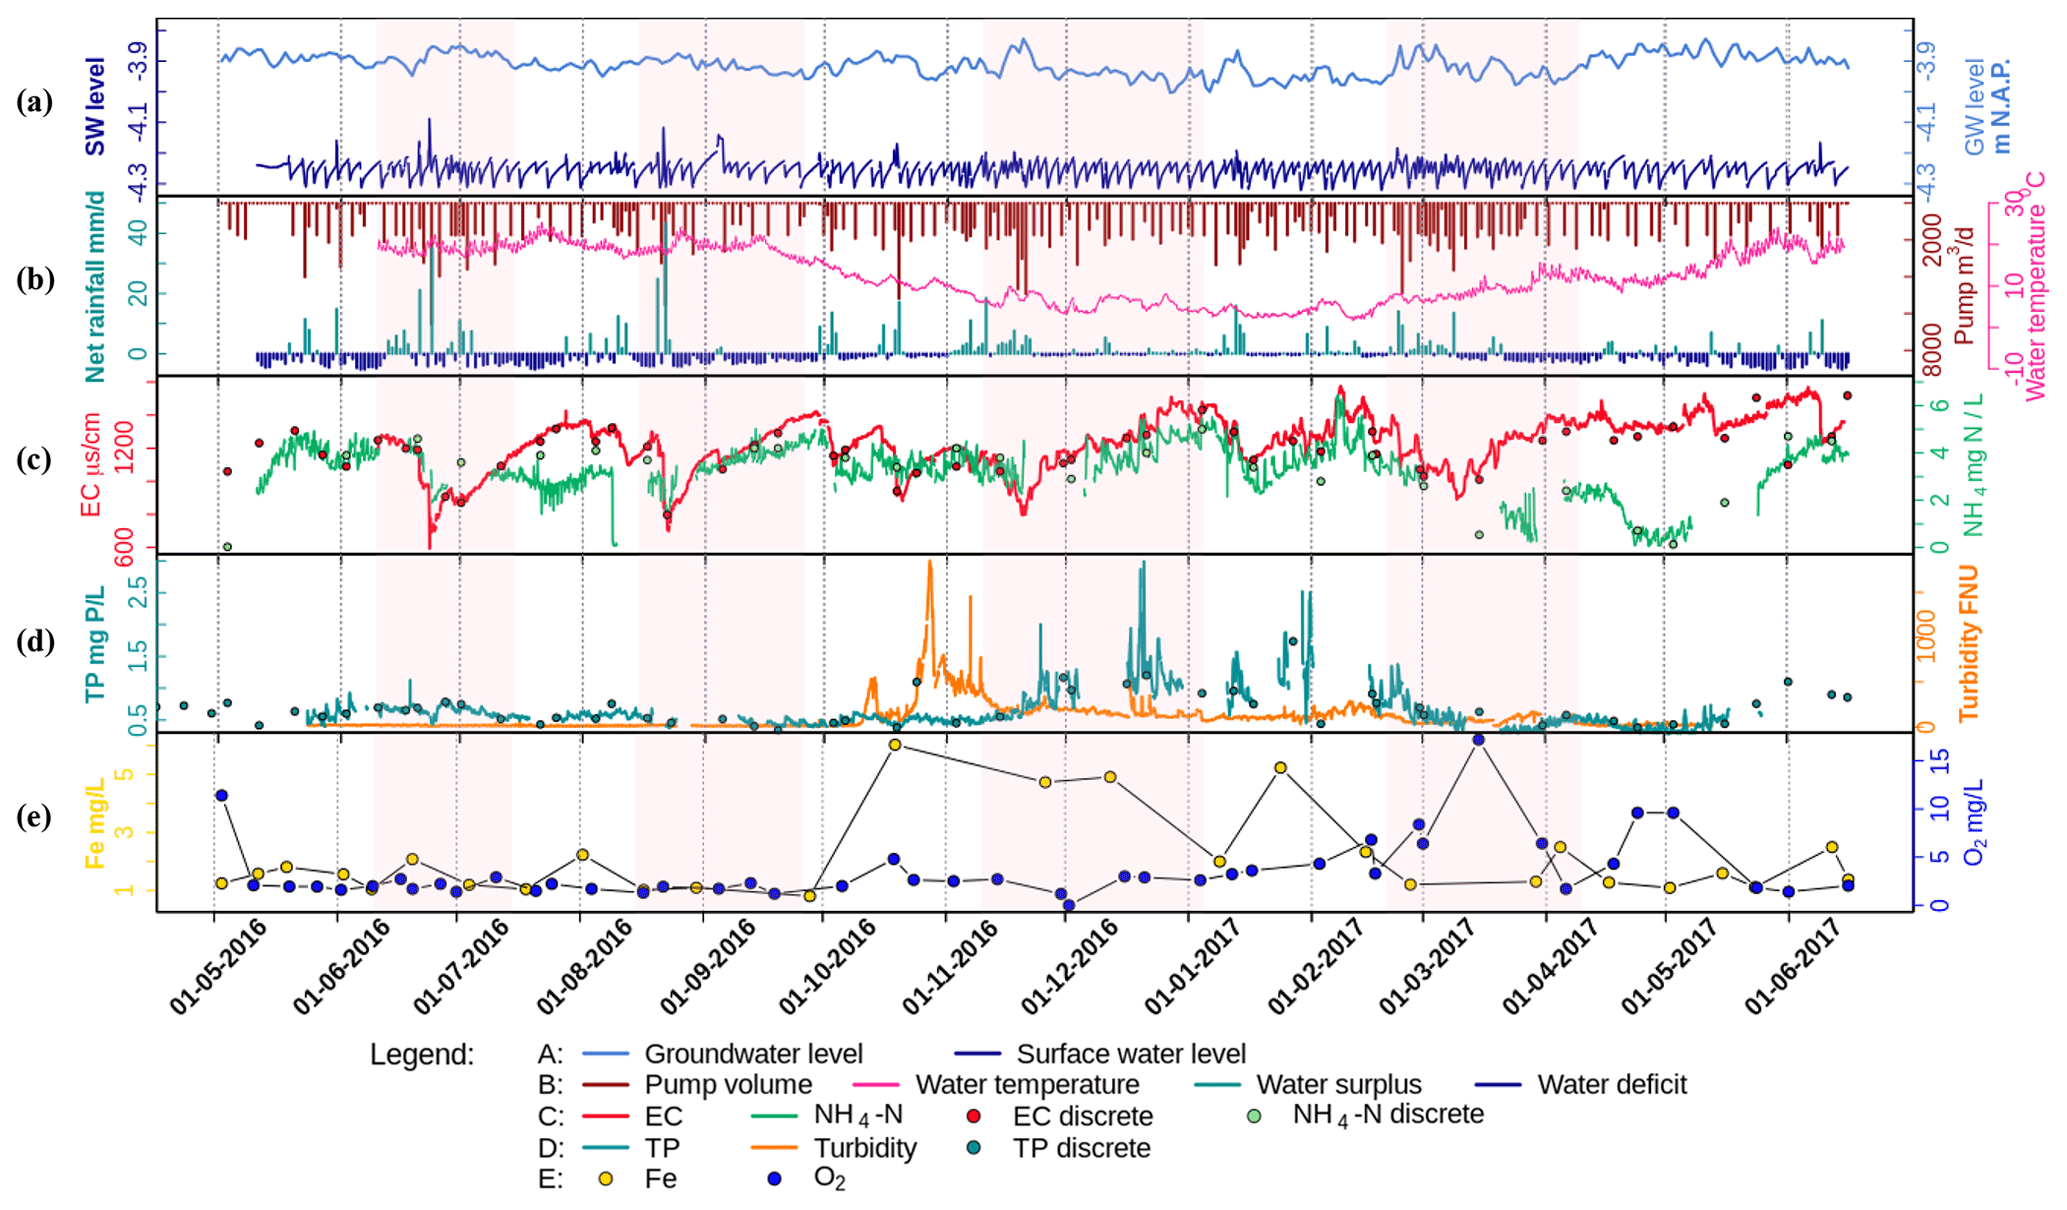
Figure 2Time series of (a) surface water level (SW level) and groundwater level (m NAP), (b) net rainfall (daily water surplus (+) (light blue) and deficit (−) (dark blue), mm d−1) and daily pumping volume (m3 d−1), (c) hourly time series of EC (µS cm−1) and NH4-N (mg N L−1), (d) hourly TP and turbidity, and (e) discrete samples of Fe (total iron in water column) and O2 concentrations (mg L−1). The dots in (c) and (d) are the corresponding discrete sampling data, which are plotted to show their close match to the continuous time series data, as well as to fill in the gaps. All data were monitored at the pump station. The transparent pink blocks are the selected rain events for further analysis in Sect. 3.3. See Tables S1–S3 for the correlation tests performed on the dataset.
The water system of Geuzenveld is connected to the secondary water channel to its east and then connected to the adjacent primary channel (boezem in Dutch) that is called the Boezem Haarlemmerweg. The boezem water level is −2.10 m NAP. It is much higher than the target surface water level of Geuzenveld, −4.25 m NAP. The surface water level in polder Geuzenveld is controlled by a pump station, which is the main outlet of this polder, situated in the northeastern corner.
There are two pumps (Pump 1 and Pump 2) in the pumping station, and they have different start and end pumping threshold points (Table 1).
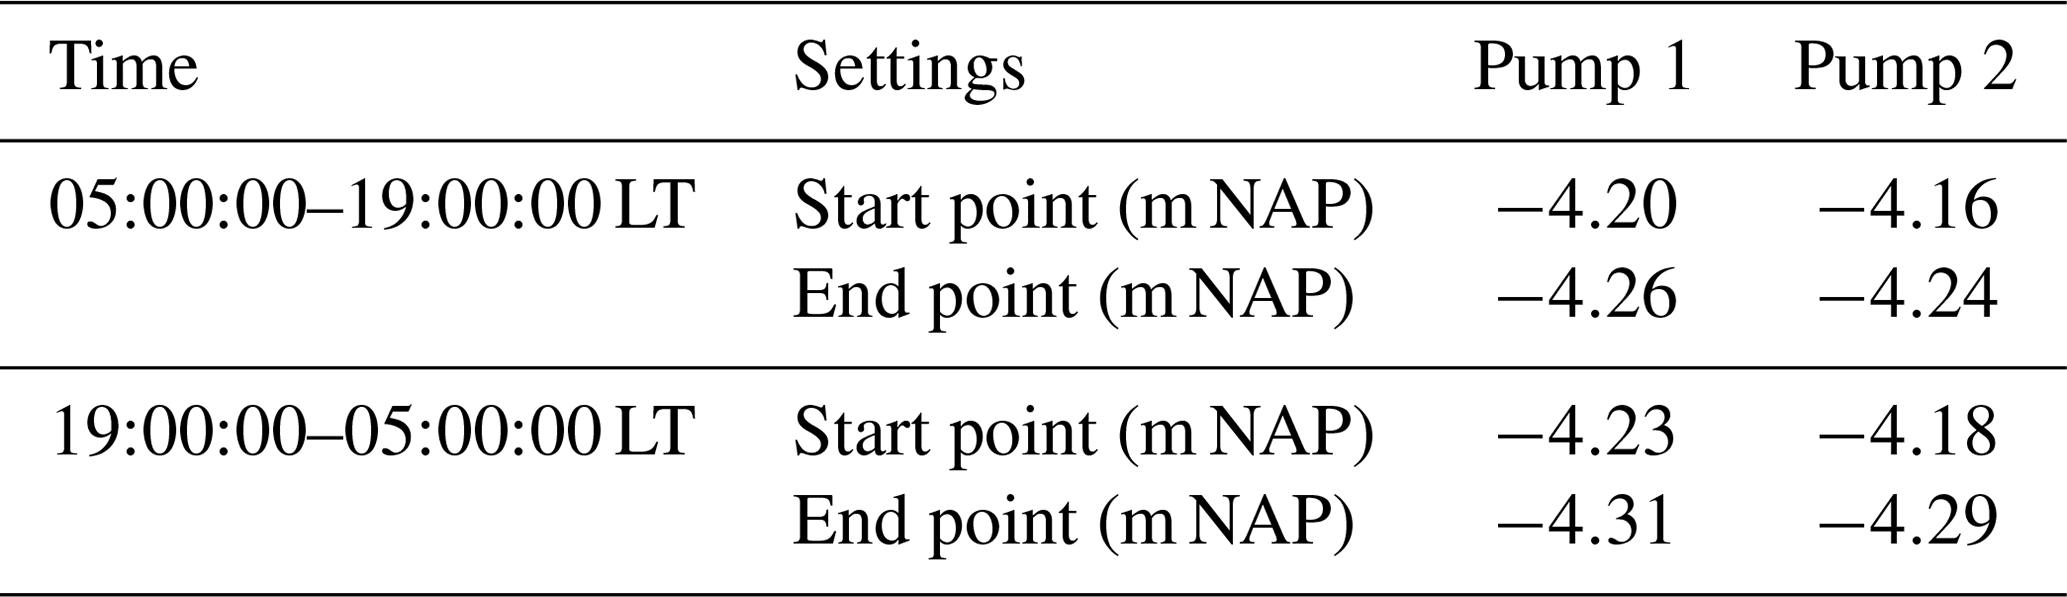
The two pumps are activated when the surface water level exceeds the triggering level, which are furthermore separated into day and night triggering levels (Table 1). The capacity of each pump is 3.6 m3 min−1. Most of the time, only one of the two pumps works and the surface water level is maintained between −4.31 and −4.23 m NAP, which are the night inactive and active pumping levels, respectively. Normally, the surface water level drops immediately when the pump(s) starts working. Once the pump(s) stops, the surface water level will steadily rise due to the continuous inflow of groundwater seepage. During rainfall events, the surface water level rises faster (Fig. 2a).
2.2 Monitoring network setup
2.2.1 High-frequency monitoring
A high-frequency monitoring network was built on a temporary floating platform in front of the pumping station. The water flowed around and underneath this platform to the pumping station when the pumps started working. One-year time series of NH4-N (mg L−1), TP (and orthophosphate) (mg L−1), turbidity (Formazin Nephelometric Unit, FNU), electrical conductivity (EC, µS cm−1), and water temperature (∘C) were collected by the following equipment: a Sigmatax sampler combined with a Phosphax sigma auto analyzer for total phosphorus (TP), Amtax for NH4-N combined with a Filtrax automatic sampler, a “Solitax t-line sc” for turbidity (manufactured by Hach Lange GmbH, Düsseldorf, Germany), and CTD-Diver for electrical conductivity (EC) and water temperature (manufactured by Van Essen Instruments, Delft, the Netherlands). The monitoring frequencies were set to 20, 10, 5, 5, and 5 min intervals for TP, NH4-N, turbidity, EC, and water temperature, respectively.
The Phosphax sigma is an analog analyzer for the high-precision determination of total phosphorus concentration in accordance with the EN 1189 phosphomolybdenum blue method. Samples are automatically taken through a Sigmatax sampling probe and include suspended solids. Subsequently, the sample is ultrasonically homogenized before delivery to the Phosphax sigma. It is digested by the sulfuric acid–persulfate method (APHAAWWA-WPCF, 1989) and analyzed with an LED photometer (at 880 nm) (Hach, user manual of Phosphax sigma, 2016).
Samples for NH4 are prepared by a filtration system (Filtrax). It continuously extracts samples through two ultra-filtration membrane (0.15 µm) plates. Particles get dispersed by a continuous aeration system near the surface of the membranes. (The aeration caused severe build-up of iron precipitants on the plates.) The samples are then delivered to Amtax sc for analysis. The ammonium in the sample is first converted to gaseous ammonia. Only the NH3 gas passes through the gas-permeable membrane of the electrode and is detected. This method guarantees a wide measuring range and is less sensitive to other compounds compared to methods that make use of an ion-selective electrode (ISE). The Amtax sc in our study was calibrated automatically at 22:00 LT every 24 h before September 2016 and every 48 h thereafter. Maintenance work was conducted weekly as the tubes were easily blocked by iron precipitates (Hach, user manual of Amtax sc, 2013).
The Solitax t-line sc sensor is a turbidity sensor with dual-beam optics and added backscatter. The measuring principle is based on a combined infrared absorption scattered light technique that measures the lowest turbidity values in accordance with DIN EN 27027 just as precisely and continuously as high sludge contents. Using this method, the light scattered sideways by the turbid particles is measured over an angle of 90∘ (Hach, user manual of Solitax sc, 2009).
The monitoring period of NH4 and turbidity is from 10 May 2016 to 16 June 2017. Time series of phosphorus were obtained from 23 May 2016 to 16 June 2017. Electrical conductivity and temperature data are from 10 June 2016 to 15 June 2017. The NO3 analyzer, Nitratax, time series consistently showed an artificial drift and proved to be unreliable in our field setting, possibly due to biofilm accumulation in combination with iron oxide precipitation (see the Discussion section). All the equipment outputs were integrated into one wireless station. The monitoring station was shut down several times by lightning, so an electricity restart program was also applied in this network. It worked for all equipment except for the Phosphax, which had to be restarted manually after a blackout.
Precipitation (hourly) and evapotranspiration (daily) data were downloaded from the Schiphol KNMI (Royal Netherlands Meteorological Institute) station which is about 2 km away from Geuzenveld. Hourly pumping activity and surface water level data were obtained from Waternet, the water authority of Amsterdam.
2.2.2 Low-frequency monitoring
Since 2006, Waternet has monitored the water quality with a frequency of 12 times per year by sampling at the pumping station of Geuzenveld. Between 2016 and 2017, the sampling frequency was increased to twice per month. We selected the following parameters from the routine monitoring campaign: (1) EC, NH4-N, and TP to fill in the gaps in the continuous time series and to verify and monitor the potential drift and offset of the high-frequency data and (2) pH, O2, HCO3, NO3, TN, Kjeldahl N, suspended solids (details of methods are described by Yu et al., 2019), chlorophyll a, and transparency for further understanding of the biogeochemical processes. Organic N was estimated by subtracting NH4-N from Kjeldahl N.
Biweekly total iron in the water column was analyzed separately using ICP-AES (inductively coupled plasma atomic emission spectrometry). Total Fe was analyzed from samples to which HgCl2 was added for preservation and that were stored in a dark and cool environment. To release all Fe that may have sorbed or precipitated during storage, we added 1 or 0.5 mL of HCl in the water samples to dissolve eventual flocs. Then the samples were homogenized in an ultrasonic bath for 24 h and mixed again to break down all the flocs. For extraction of all the Fe, we transferred 10 mL of the homogenized sample into a Teflon bottle, added 3.2 mL of HCl−HNO3 3:1, and stored it in a stove at 90 ∘C for 24 h. The final solutions were analyzed by ICP-AES. Blanks were included and treated identical to samples.
2.3 Data processing and analysis
A correlation analysis between the high-frequency and discrete monitoring data was applied to illustrate the reliability of the high-frequency time series. Furthermore, the time series data were analyzed at three timescales: annual scale, rainfall events (several days), and single pumping events (several hours). The relationships among the monitored parameters was explored by testing their correlations at each timescale. At the annual scale, a correlation analysis was applied to the complete time period and the wet and dry periods (definition in Sect. 3.1.1). To discern the hydrological and chemical or biological attributes to the observed dynamics, a linear mixing model was introduced at the annual scale, assuming that precipitation and groundwater seepage are the only water inputs, pumping and evapotranspiration are the only outputs, and pumping activity is the only way solutes leave the water system. In this model, we assumed a constant seepage rate. Accordingly, surface water level was calculated from
V is total water volume in the ditches, P is precipitation, S is a constant seepage, E is potential evapotranspiration, Apolder is area of the polder, Pump(t) is water volume being pumped out with a maximum capacity of 216 m3 h−1, and Aditch is the area of the ditches in the polder. L is surface water level in the ditches. Water level L determines the activation of pumping activity. Once L(t) exceeds the upper ranges of water level (start point, Sect. 2.1), the pumps will start to pump until L goes below the stopping point (Sect. 2.1) in the pumping scheme. Given the year-round seepage conditions throughout the polder, combined with an artificially drained subsurface, we assumed that the potential evapotranspiration was close to the actual evapotranspiration as no water shortages occur in our situation. In this study, we used the difference between groundwater head in the first aquifer and the surface water level (Fig. 2a) to estimate a range of the seepage. The actual rate of 2 mm d−1 was chosen based on the behavior of the mixing model and calibrated using the measured surface water levels (Fig. S1 in the Supplement).
A complete mixing of solutes was assumed in the model, which means that seepage, ditch water, and precipitation mix instantaneously when they enter the surface water. A delay from precipitation to runoff or drainage and to ditches was not specifically considered.
V is the ditch water volume given by Eq. (1), C(t) is solute concentration at time t, Cgw is the average groundwater concentration, and CP is the average concentration in runoff.
In our study area, the EC is a useful water quality parameter for describing the mixing processes between groundwater and runoff water, as the EC represents the end-members of the mixing: groundwater with a high EC (1750 µS cm−1) and runoff water (100 µS cm−1) with a low EC (see also Yu et al., 2019). Moreover, we assume that EC behaves as a conservative tracer as the EC is highly correlated with the Cl concentration (R2=0.71, p value < 0.05) and the temporal patterns of EC and Cl are very similar (see Fig. S2). In the model, seepage rate was adapted to get the best fit between the modeled and the measured EC. The calibrated seepage rate was 2.0 mm d−1. Compared to EC, nutrients are highly reactive solutes and thus can vary a lot along their flow routes due to biogeochemical processes. The model provided a tool to simulate hourly concentration dynamics under the assumption that EC, NH4, and TP were conservative. The simulated EC, NH4-N, and TP were plotted together with the high-frequency time series and the grab sampling data in Fig. 3. As in Fig. 2, the high-frequency measurements were aggregated from 5 min (EC), 10 min (NH4), and 20 min (TP) intervals into an hourly interval. The grab sampling results were all set to be measured at 10:00 LT as that coincides with the usual grab sampling times. Additionally, a comparison between the modeled and the measured results to the annual scale was performed by using correlation analysis and aggregating the model, the high-frequency results, and the grab sampling results at a 4 d average.
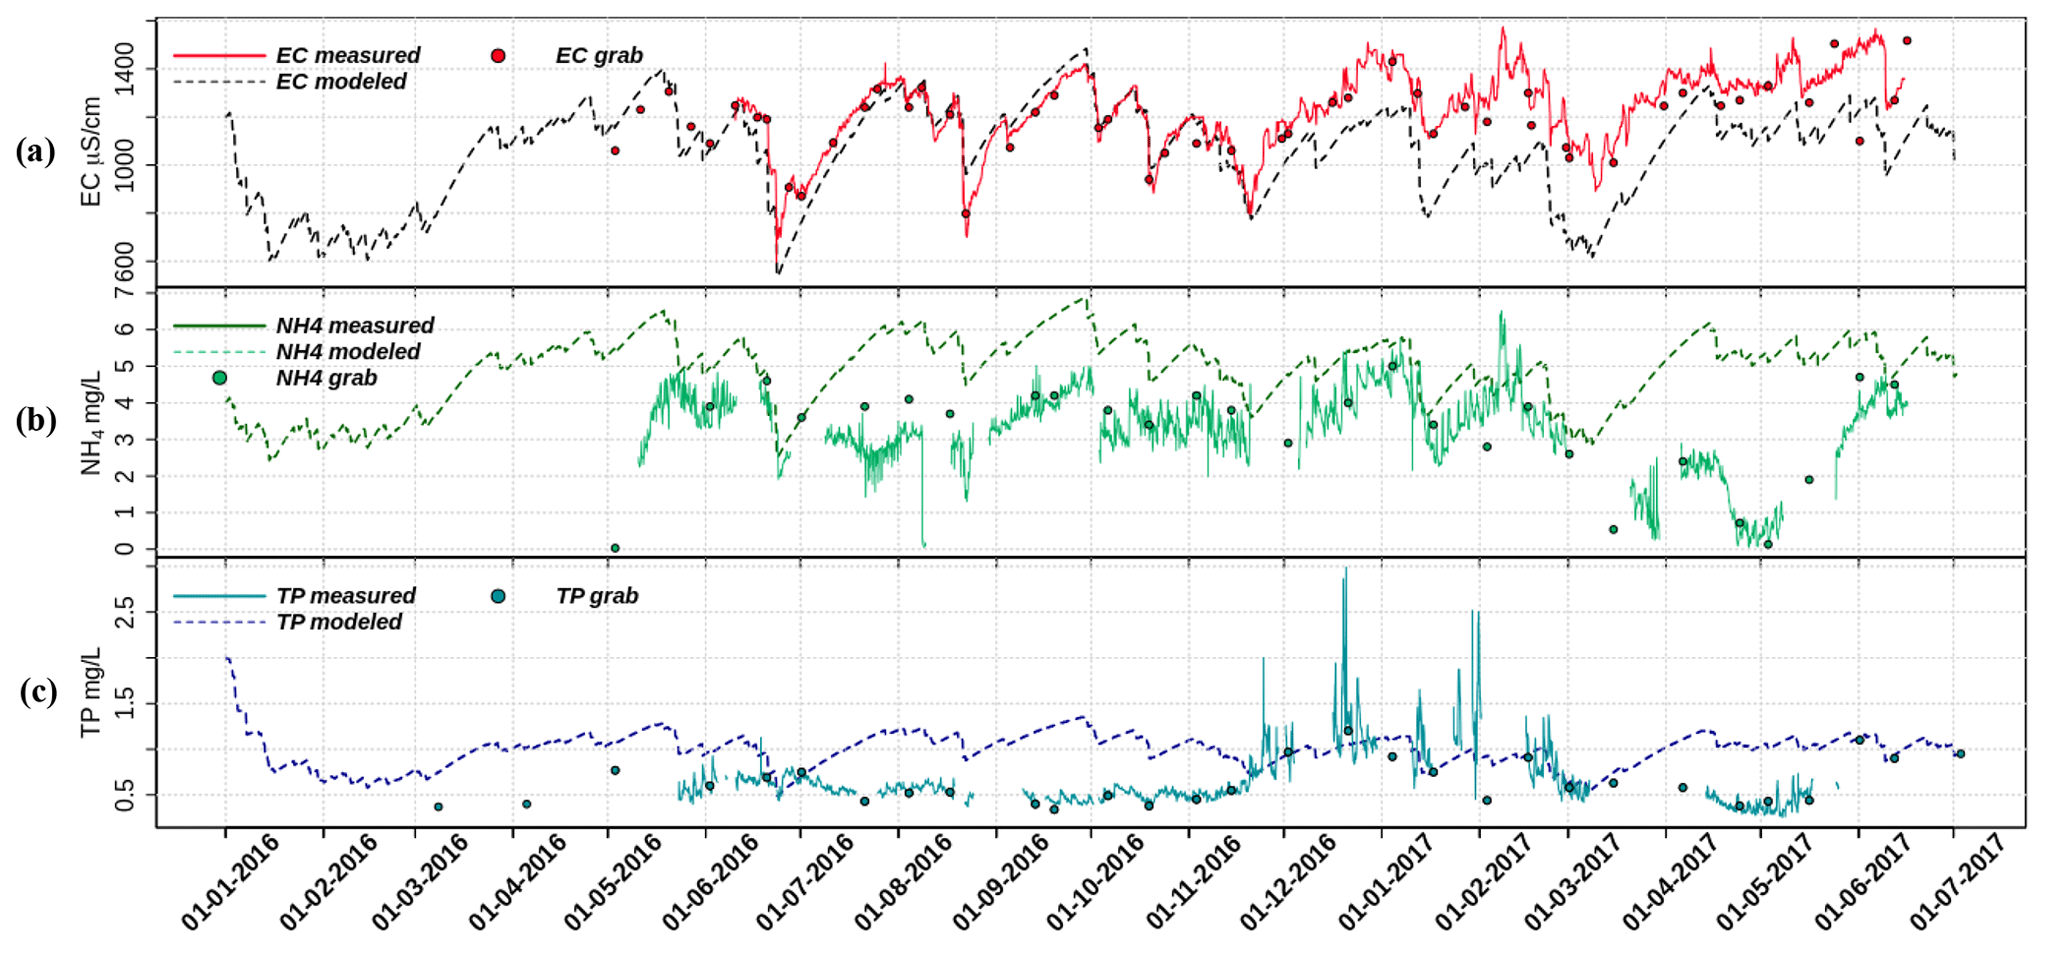
Figure 3Plots of fixed-end-member mixing model predicted (a) EC, (b) NH4, and (c) TP with their measured time series data and the discrete sampling results. See Tables S4–S6 for the correlation tests performed on the dataset.
The average concentration of EC in groundwater was set equal to the average of the sampling survey, which was 1750 µS cm−1 (including both deep and shallow groundwater; Yu et al., 2019). For the NH4 and TP concentration data, we chose the measurement from a drain sampling point (Drain 3; Yu et al., 2019) in the middle of the polder as the nondisturbed groundwater collected by the drains in this area of the polder. They were 8.1 mg N L−1 and 1.6 mg L−1, respectively. The starting (1 June 2015) concentrations were 1200 µS cm−1, 4 mg L−1, and 2 mg L−1 for EC, NH4, and TP, respectively. The model was not sensitive to the selected end-member values.
The time series data were further analyzed at shorter scales: rain event scale and pumping event scale. Four rain events were selected according to the dilution extent of EC, defined as an EC value reduced by over 35 %, they were 10 June–15 July 2016, 15 August–26 September 2016, 10 November 2016–5 January 2017, and 20 February–10 April 2017. These four events covered both EC dilution during rainfall and the recovery afterwards in different seasons. We selected four representative pumping events to present the response of EC, NH4, TP, and turbidity to the pumping activities. Those events were during 15–17 July 2016, 27–29 October 2016, 20–22 December 2016, and 5–7 May 2017. Correlation analysis was as well applied to each event at the two corresponding timescales, averaging over whole days for precipitation events and over hours for pumping events. Data processing and analyzing were performed using Rstudio (R version 4.0.2) and time series package “xts”.
3.1 Annual pattern of meteorological, hydrological, and water quality time series
3.1.1 Meteorological and hydrological conditions in polder Geuzenveld
To explain the time series (Fig. 2), we distinguish between dry and wet periods and dry and wet seasons. The wet and dry periods (days to weeks) are represented by a water surplus (light blue color in Fig. 2b, daily evapotranspiration < daily precipitation) or a water deficiency (dark blue in Fig. 2b, daily evapotranspiration > daily precipitation). We defined the wet and dry seasons based on water surplus and deficit. The average net rainfall (the water surplus/deficit in Fig. 2) is 1.4 mm d−1 for the period of 1 October 2016–15 March 2017 and −0.8 mm d−1 for the rest. Subsequently, we statistically analyzed the difference between these two periods for multiple parameters. Table 2 shows the mean of each parameter for the wet and dry seasons and their significance test results. The wet and dry season means are significantly different for all parameters except the EC.
Table 2The mean of each parameter and the significance for the wet and dry seasons.
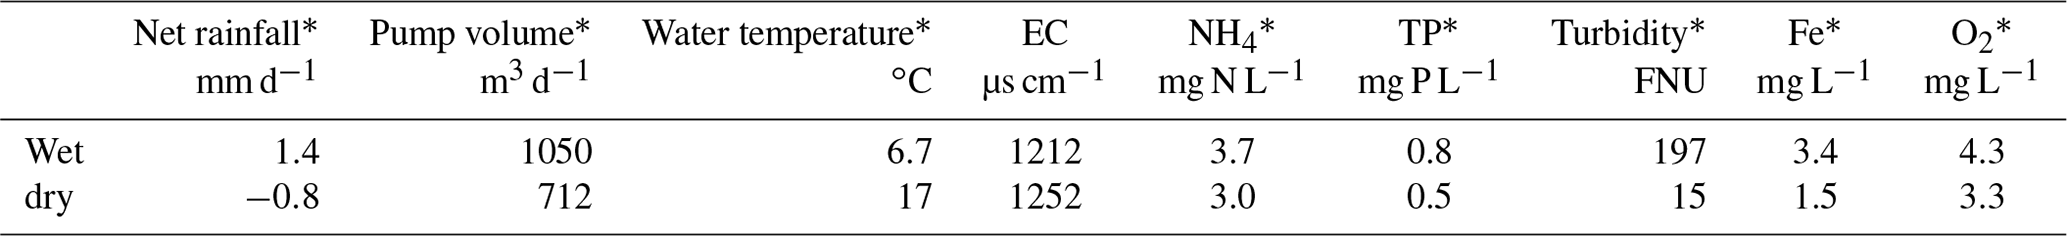
* p<0.05 Wilcoxon rank-sum test. The tests were performed in Rstudio (version 3.6.1), i.e. wilcox.text( ) in package “stats”.
Over the whole monitoring period, the water temperature ranged between 2 and 26 ∘C. From June to mid-September 2016, the temperature remained above 18 ∘C and then declined to become lower than 10 ∘C at the end of October. The following 4 months (November to February) were the coldest, especially in January and February 2017, during which the water temperature dropped to below 3 ∘C. By the end of February, temperatures started to rise again to reach 10 ∘C by the end of March 2017.
The surface water level in Geuzenveld has been maintained between −4.31 and −4.1 m NAP, strictly regulated by pumping (Fig. 2a). After the pumps stopped, the surface water level recovered faster during the wet season (between October 2016 and March 2017) than during the dry season. Similarly, the shallow groundwater level positively corresponded to the precipitation and negatively to the daily accumulative pumping volume. The phreatic groundwater level in Fig. 2a (light blue) was from one of the piezometers, which lies right outside of the polder (Fig. 1; 52∘ 22′ 46.0′′ N, 4∘ 47′ 15.6′′ E). In contrast to the constant surface water levels (Fig. 2a, dark blue), the shallow groundwater had relatively low levels in the wet season compared to the dry season. This is related to the water level regulation of the Boezem Haarlemmerweg with higher levels in summer than in winter (https://www.rijnland.net/actueel/water-en-weer/waterpeil, last access: 23 December 2020). Phreatic water levels were consistently 20–40 cm higher than the surface water level in the polder, which confirms the continuous groundwater seepage into the surface water system.
3.1.2 Annual water quality patterns
The Pearson's coefficients of determination (R2) between the high-frequency data and the routine discrete sampling data from the water authority are 0.88 for EC (p`value < 0.05), 0.92 for NH4 (p value < 0.05), and 0.97 for TP (p value < 0.05). The scatter plots between the high- and low-frequency measurements are shown in Fig. S7.
During a rainfall event, rain and runoff from pavements and roofs, which were collected by a separate drainage system, directly fed the surface water (Fig. 1). Distinct rainfall events cause a strong dilution pattern of both EC and NH4 (in Fig. 2c). The EC ranged from 600 to 1500 µS cm−1. In general, during rainfall events, the EC declined because of dilution, while, after the events, EC gradually rose back up to around 1500 µS cm−1. The duration of this process, i.e., recovery time, was longer in the wet season than in the dry season. A similar pattern of dilution and recovery is also visible for NH4, especially for the period August 2016–March 2017, where NH4 shows a very similar response as EC (Table S2, wet season, R2=0.73), although with somewhat larger day-to-day fluctuations. However, a contrasting pattern without NH4 recovery occurred twice: from the middle of June to the end of August 2016 and from the middle of March to the middle of May 2017. During these periods, concentrations of NH4 were considerably lower and deviated from the slope of the EC pattern. NH4 decreased from around 4 mg L−1 to around 2 mg L−1 between the middle of June to the end of August 2016, but the continuous NH4 measurements are not supported by the discrete samples which follow the EC pattern more closely. During the second period from March to the middle of May, the deviation from the recovery pattern is more pronounced, and NH4 concentrations dropped to almost 0 mg L−1 and started recovering from the beginning of May. This pattern is fully supported by the available discrete samples. During the same period in 2016, the high-frequency monitoring had not yet started; a single NH4 discrete measurement is available for 2 May that seems to reveal a similar pattern in the spring of 2016.
Both TP and turbidity showed contrasting patterns during the wet and dry seasons (Fig. 2b). Turbidity stayed below 60 FNU during the dry season until October and rapidly increased after a first rain event to 500 FNU (for more details refer to Fig. S3). A drop to about 200 FNU occurred right after this first peak, which seemed to correspond to excessive precipitation and a large pumping volume (Fig. 2b). Soon after, turbidity went up again and peaked at 1800 FNU. Turbidity leveled off towards values around 200 FNU for the rest of the wet season and dropped below 60 FNU from April 2017 onwards.
TP concentrations were significantly higher during the period between 15 November 2016 and 1 March 2017 than the rest of the time (p value < 0.001, Fig. S5), during which TP fluctuated around 0.5 mg L−1 but always below 1 mg L−1. During the wet season with the low temperatures (Table S2, ), TP almost constantly stayed above 1 mg L−1 and even reached values of about 3 mg L−1 in December. Although there were large gaps in the TP time series during this period, the high TP concentrations appear to have been diluted by rain events, e.g., the event at around 10 January 2017. Most discrete sample measurements of TP matched well with values from the high-frequency time series (Fig. 2d, Table S1 in the Supplement, R2=0.88).
Total Fe concentrations were most of the time lower than 2 mg L−1 (Fig. 2e), but for the wet season concentrations were higher and reached up to about 6 mg L−1. The initiation of Fe increases at the beginning of the wet season coincided with that of turbidity (Fig. 2d and Table S2, R2=0.72). Upon the increasing temperature in March 2017, total Fe concentrations dropped back to below 2 mg L−1 (a negative correlation between temperature and Fe is shown in Table S1). Dissolved O2 concentrations were generally low in the water column, i.e., usually below 5 mg L−1. Concentrations of over 3 mg L−1 were only found in March, April, and May.
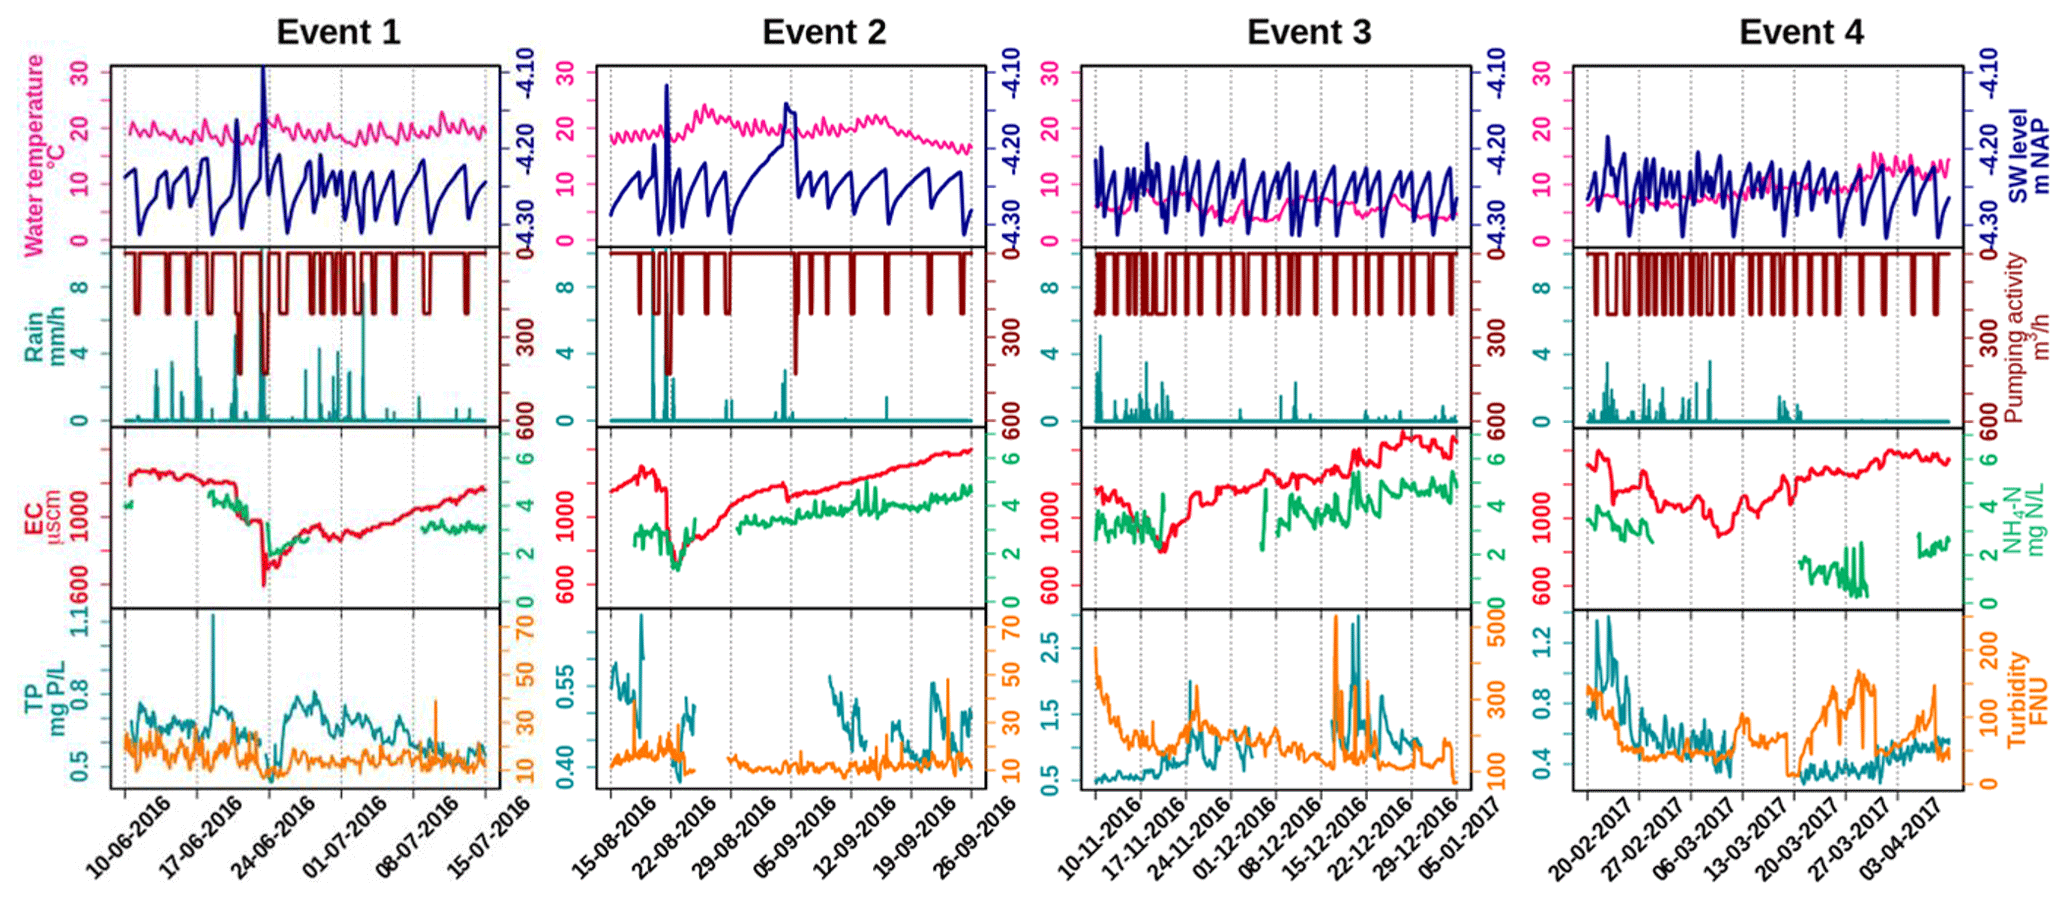
Figure 4Selected events showing dilution and peaks of water quality parameters, with hourly precipitation (mm h−1) and hourly pumping activity (m3 h−1). Note that between events different scales of TP and turbidity were used to reveal the dynamics. See Tables S7–S10 for the correlation tests performed on the dataset.
3.2 Model of water quality time series based on water balance
A simple fixed-end-member mixing model was used to reconstruct the conservative mixing of EC, NH4, and TP. The simulated and the measured EC, NH4, and TP are plotted in Fig. 3. The correlations between the modeled and measured results are shown in the Supplement (Tables S4–S6). Potential processes that might deprive or enrich nutrients relative to the conservative mixing process along the flow routes were inferred from the discrepancies between the modeled and the measured data. Figure 3a and Table S5 show that the predicted and observed EC dynamics agree reasonably well from May to 20 November 2016 (R2=0.91). After that, the conservative mixing approach underestimated the EC, but the main dynamics and the amplitudes were still reproduced (Table S6, R2=0.82); as groundwater is the only contributor to the high EC due to the seepage of quite mineralized, slightly brackish water, the model must underestimate the seepage flux from 20 November 2016 on. Overall, the observed dynamics of EC are consistent with mixing of high EC seepage water with low EC runoff water (coefficient of determination between the modeled and measured EC is 0.65 over the complete period, Table S4).
The dynamics of measured NH4 concentrations show close resemblance to the model results, especially during the wet season (1 October 2016–15 March 2017). Clearly, NH4 is diluted during the rain events and a gradual increase of NH4 starts after each rain event during the wet season, showing slopes that resemble the model reconstruction. Over the whole period, measured NH4 concentrations were overestimated by the model, indicating that some NH4 is probably lost due to nonconservative processes. This is especially true for the spring season of 2017, where NH4 concentrations must be controlled by additional processes. Concentrations of TP are generally far below the conservative model reconstruction, except between the end of November and the beginning of March. During this particular period, the minimum measured TP concentrations are captured nicely by the conservative model, but the distinct peaks up to 3 mg L−1 are not.
3.3 Water quality responses to single event analysis
To elucidate the response pattern of water quality to precipitation and pumping activity, we selected four major events (Fig. 2 (four pink shades) and Fig. 4) and four pumping events (Fig. 5). The former events were chosen according to their clear dilution pattern of EC (Fig. 4), while the latter were pumping events without occurrence of rainfall (Fig. 5). All seasons were covered, including some of the wet and dry periods.
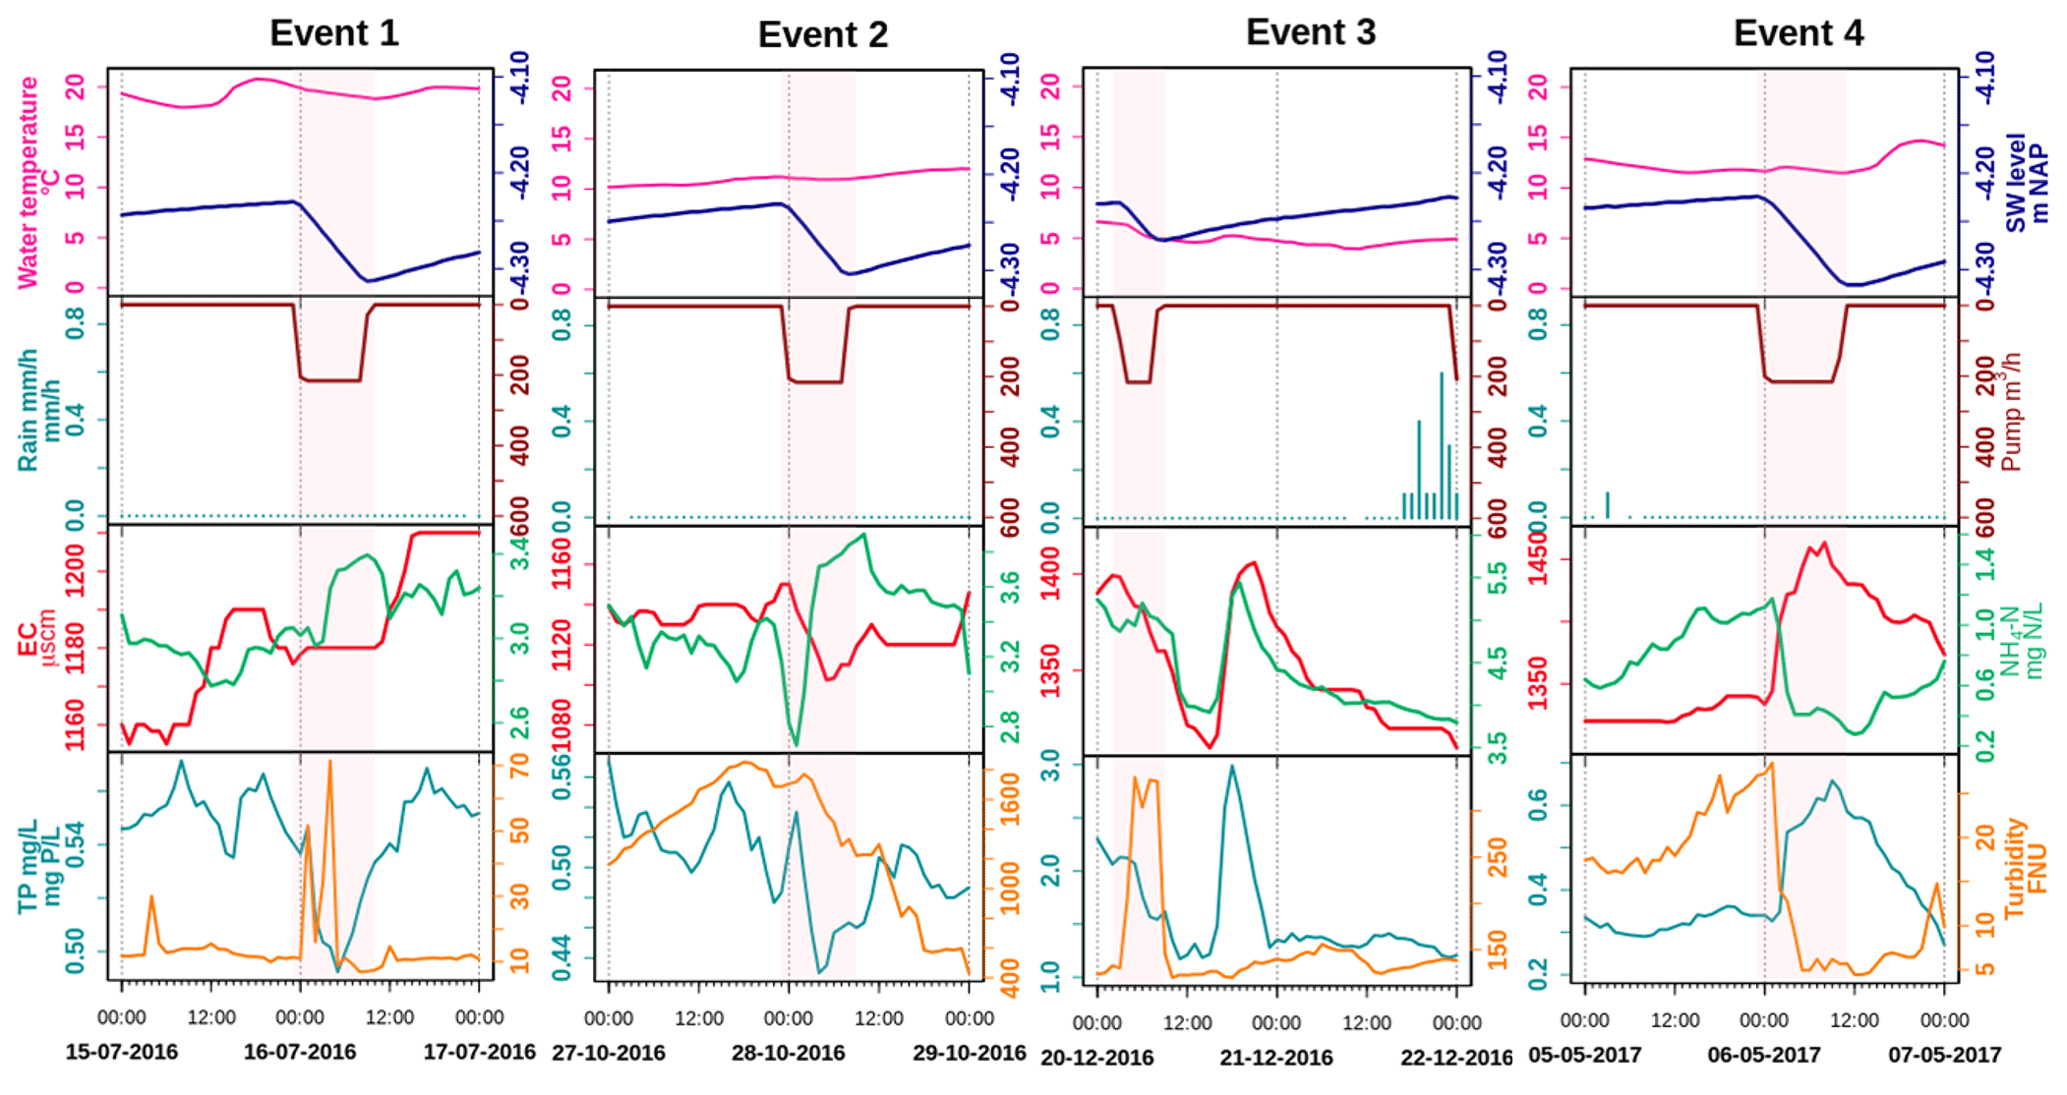
Figure 5Pumping and pumping effect patterns on water quality; pink blocks represent the pumping duration. See Tables S11–S14 for the correlation tests performed on the dataset.
3.3.1 Rainfall events
EC and NH4 showed clear dilution and recovery patterns during all events, while the pattern was not clear for TP and turbidity (Fig. 4). The extent of dilution of EC appears to depend on the precipitation intensity. Rainfall during the recovery period determined how long it took to recover back to the highest level. The short but intensive rainfall during dry season events 1 and 2 reduced EC rapidly from around 1300 to around 700 µS cm−1, while the recovery took about 1 month. Events 3 and 4 had less rainfall, dilution of EC was less (from about 1300 to about 800 µS cm−1), and recovery took more than 1.5 month in event 3, during which multiple small events occurred. The dilution patterns of NH4 in events 1 and 2 were similar to those of EC (R2=0.86 and 0.83, respectively, Tables S7 and S8) and show resemblance for event 3 (R2=0.75, Table S10). Moreover, a direct negative correlation between NH4 and rain intensity supports this dilution effect for event 2. Due to the data gaps of NH4 in event 4, we cannot completely describe the pattern of NH4 for this one, but it corresponds with the start of reduced NH4 which was described in Sect. 3.1 and 3.2.
The response of TP was generally not related to the intensity of rainfall and pumping, except for event 3 during the wet period. Dilution effects, as were observed for NH4, were not observed for TP for events 1, 2, or 4. During the wet season event 3, TP concentrations show negative correlations with precipitation and pumping intensity ( and −0.59, respectively, Table S9) and correspond with decreasing turbidity. Event 4 marks the transition between the wet and dry season, and the drop in TP coincides with the drop in NH4, independently from individual rain storms during the dry season.
During the dry season (with event 1 and 2 included) turbidity always stayed below 50 FNU. Turbidity sometimes showed single peaks which are likely related to disturbances of the floating platform by wind and should probably be treated as false signals. Turbidity is more variable and has higher variance for wet season events 3 and 4, which corresponds with the findings of the annual-scale analysis (Sect. 3.1.2). During event 3, turbidity varied between 100 and 500 FNU. Although clear relations exist between Fe, TP, and turbidity, all higher during the wet season (Fig. 2, Table S2), these are not clearly reflected at the scale of individual precipitation events. Simultaneous peaks of TP and turbidity occur that are not easily related to the weather conditions in November and December, but TP and turbidity show contrasting signals at the start of the event. The turbidity clearly decreases during rain storm event 3 and at the start of event 4. This change is not reflected by the correlation at the total event scale (Tables S9 and S10) but obvious when studying only the timescale of the decreasing limb of the EC dilution. Event 4 coincides with the transition to the spring season in 2017, showing decreasing EC, TP, and turbidity in the last rains of the wet season and a strong decrease of NH4 and increase of turbidity when conditions dried up and temperatures rose.
3.3.2 Pumping events and day and night pattern
The selected pumping events covered four seasons: summer (2016 July, event 1), autumn (2016 October, late autumn, event 2), winter (2016 December, event 3), and spring (2017 May, event 4) (Fig. 5). While the effects of pumping on EC are rather small, TP, NH4, and turbidity are all affected by pumping. The effects of pumping appear to be different for events in different seasons; turbidity, for example, increases during pumping in July and December but decreases in May. The increase during the December pumping is especially marked (R2 Pumping intensity versus Turbidity = 0.77, Table S13). TP decreases during pumping in July () and October and increases in May (R2=0.6). Event 2 seems to have started a major drop in turbidity (more than 1000 FNU) that continued some time after pumping.
This study aimed at understanding the dynamics of N and P fluxes from the low-lying urban polder of Geuzenveld to downstream surface waters in order to eventually support water managers to mitigate eutrophication. Based on our high-resolution water quality measurements, we found that the surface water chemistry at the polder outlet pumping station is governed by a complex combination of hydrological mixing and biogeochemical processing. In the following discussion, we start with the presentation of the relatively straightforward dilution behavior of EC, followed by adding the impact of primary production (i.e., algae growth) for understanding the NH4 concentration patterns, and then benthic primary producer and iron chemistry for understanding the turbidity and TP concentration patterns.
4.1 Hydrological mixing between groundwater and rainfall
In a highly manipulated low-lying urban catchment like Geuzenveld, mixing between rainwater and groundwater in the ditches is fast due to the high fraction of impervious area and the installation of both a rainwater and a groundwater drainage system that transport these contrasting water types efficiently to the ditches (Yu et al., 2019; Walsh et al., 2005). Runoff in Geuzenveld has EC of about 166 µS cm−1 (Yu et al., 2019), which is lower than the groundwater EC (1746 µS cm−1 on average). As a relatively conservative water quality parameter (Fig. S2), mixing between rainwater and groundwater should be the main process for EC. This presumption is supported by the agreement between the modeled and the measured EC dynamics for the period between May to November 2016. Precipitation events diluted the EC values at the pumping station, and the magnitude of dilution depended on the intensity of precipitation; heavy rainfall resulted in low EC values (Figs. 2d and 4). In periods with the absence of rainfall, the EC values follow a recovery curve that resembles a linearly mixed reservoir with concentrations increasing to values that approach the EC of the continuous groundwater supply of around 1500 µS cm−1. After November 2016, EC was underestimated by the model. The sudden increase of the measured EC around 20 November coincides with an intensive pumping event after the first intensive rainfall that happened after a prolonged period of cumulative water deficit. This may be related with a first flush from the drain system that starts to be activated more strongly, removing clogged material and lowering the overall resistance of the drain system for shallow and deep groundwater inflow (Van der Velde et al., 2010). It suggests that this triggered the inflow of somewhat more mineralized groundwater relative to the period before, creating a shift in the EC towards ∼250 µS cm−1 higher values that continued during the remainder of the monitoring campaign. It appeared that it raised the EC but did not change its amplitude or dynamics during the remainder of that period (Figs. 2 and 3, Table S6). The elevated EC may alternatively be due to the application of road salts in winter, which starts from November. But we did not find any evidence for the prolonged effects of road salts, as the chloride concentrations in the grab samples only showed two higher measurements: one in December 2016 and one in January 2017 (see Fig. S2).
The mixing process can explain part of the dynamics of NH4 and TP in the wet season but is insufficient for explaining the dynamics during the dry season due to the presence of biological and chemical processes. Compared with groundwater, which carries around 8 mg L−1 NH4 and 1.6 mg L−1 TP, rain and runoff have much lower nutrient concentrations, which makes groundwater the main nutrients source (Yu et al., 2019). Nutrients derived from groundwater mix with rainwater in the ditches through direct seepage and the efficient groundwater drainage systems. Clearly, NH4 is diluted during the rain events and a gradual increase of NH4 starts after each rain event during the wet season, showing slopes that resemble the model reconstruction. The overestimation of the modeled NH4 in general indicates a probable loss to transformation processes, especially in the spring of 2017. Concentrations of TP are also generally far below the conservative model reconstruction. The distinct peaks up to 3 mg L−1 are not captured by the model and must be determined by different physical or chemical processes.
4.2 Primary production and nutrients
NH4 dynamics during winter can be explained by mixing. However, biological processes are overruling the mixing process during spring and summer. It resulted in lower measured NH4 concentrations than modeled during this period. Studies have shown that benthic and planktonic primary producers (e.g., phytoplankton) assimilate nutrients and are an important factor controlling nutrient dynamics in rivers, lakes, and streams (Hansson, 1988; Jäger et al., 2017). In polder Geuzenveld, the biological nutrient uptake is not only reflected in the time series data (Figs. 2 and 3, Table S3) but is also evident in the monthly measurements from the water authority for the period 2007–2018, as summarized in Fig. 6 and Tables S15–S19.
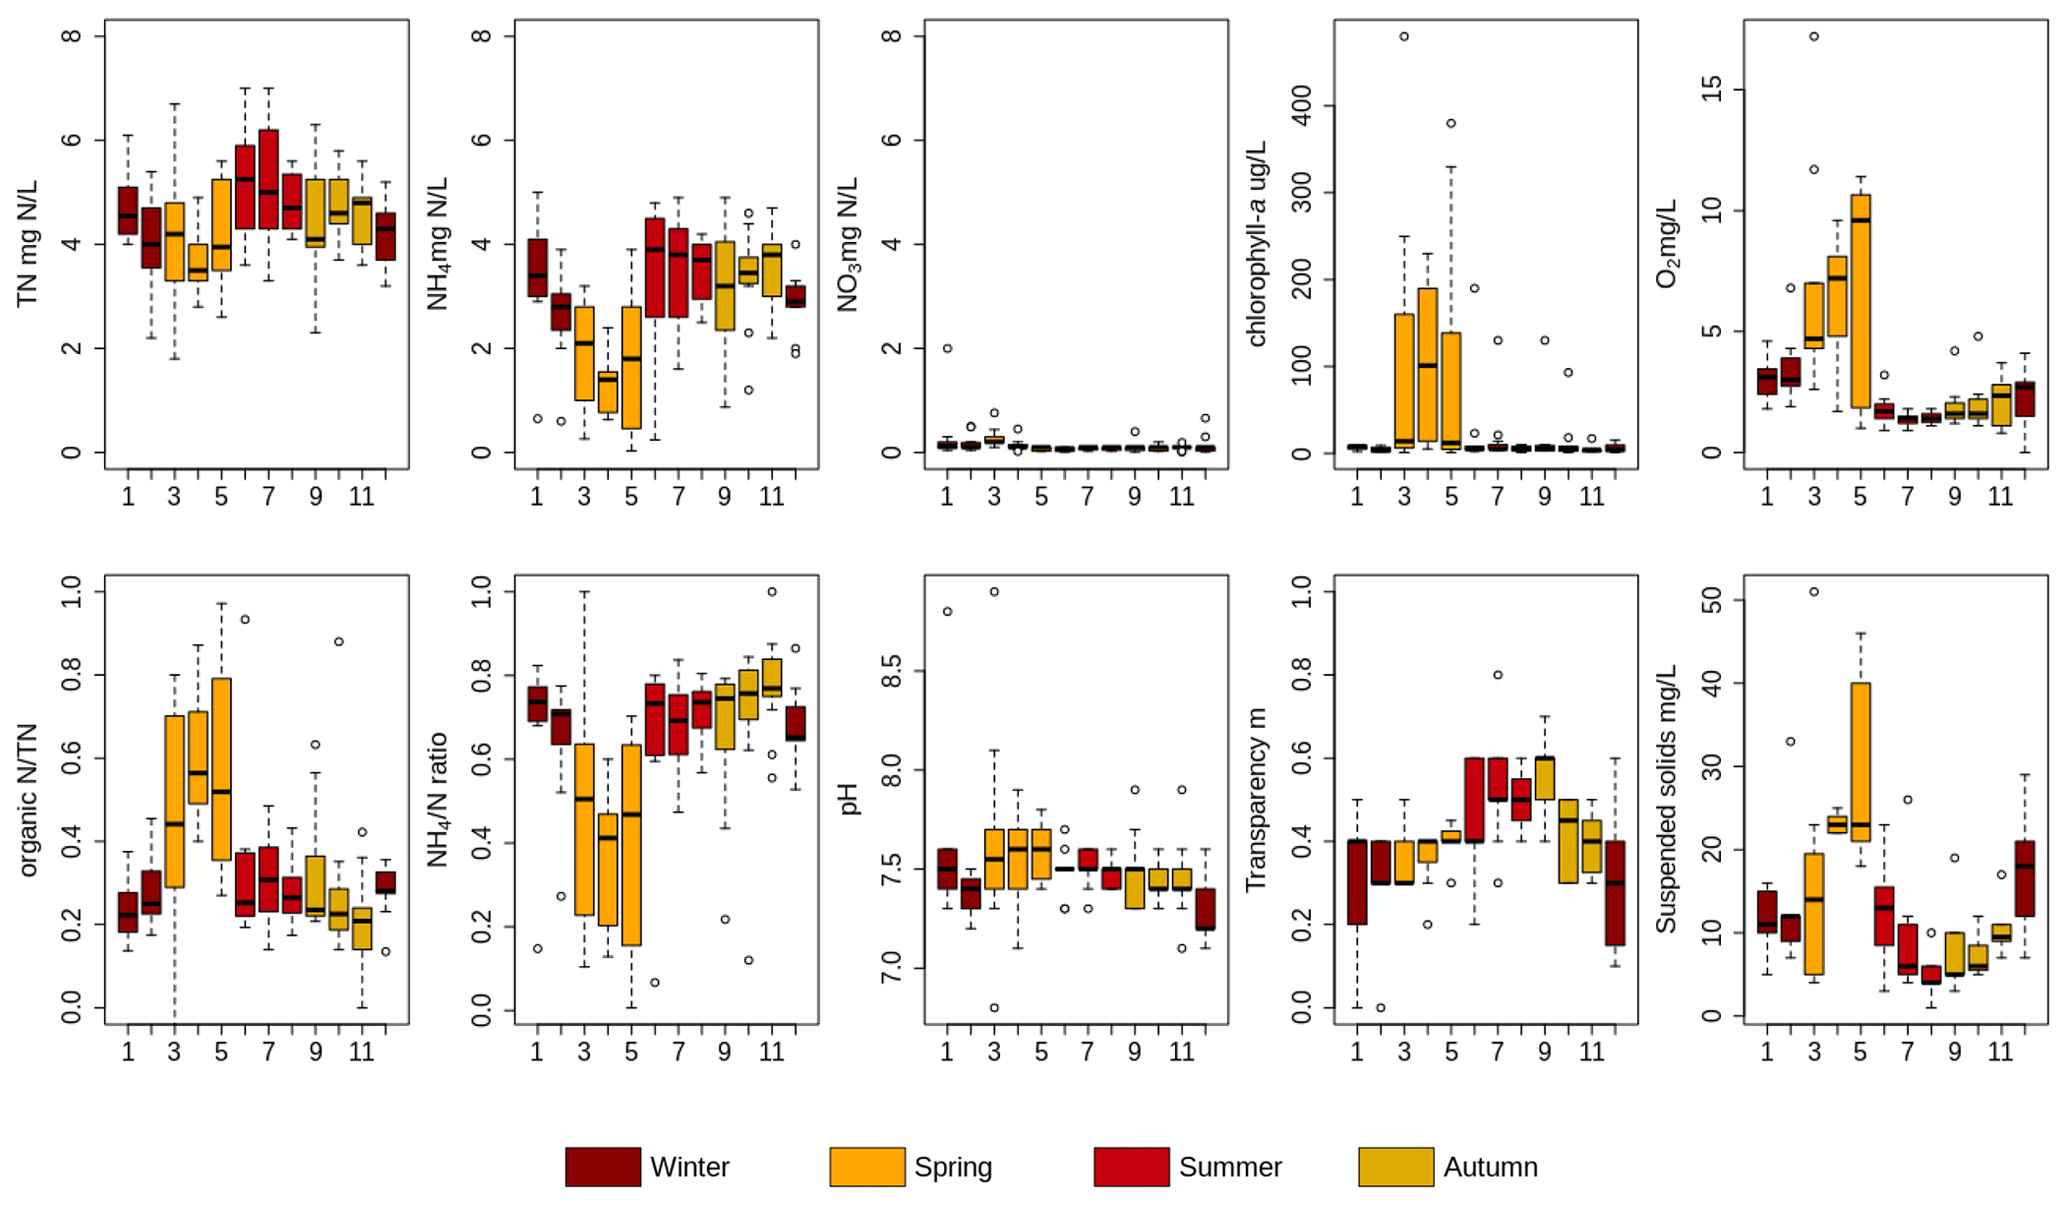
Figure 6Monthly measurements of TN, NH4-N, NO3-N, chlorophyll a, O2 organic N∕TN and NH4-N∕TN (NH4∕N) mass ratio, pH, water transparency, and suspended solids in Geuzenveld from 2007 to 2018. X axis is month. See Tables S15–S19 for the correlation tests performed on the dataset.
The increasing availability of light (and temperature increase) during spring (Fig. S6) induces growth of primary producers. Growth of primary producers results in consumption of ammonium and phosphate and a production of organic N, chlorophyll a, oxygen, and suspended solids, and this led to a relatively higher pH because of the uptake of CO2 (Fig. 6, Table S16). These patterns are also clearly reflected in the shift in the NH4∕TN and organic-N∕TN ratios during spring (Fig. 6). Primary production occurs both in the water column by phytoplankton as well as by benthic algae. Macrophytes could in principle also contribute, but they were absent in Geuzenveld. One of the structuring factors governing the relative importance of benthic and planktonic primary producers is light availability: benthic algae and macrophytes tend to dominate in shallow and clear waters, while phytoplankton is more likely to dominate in deeper and more turbid waters (Hartwig, 1978; Jäger and Borchardt, 2018; Petranich et al., 2018; Middelburg, 2019). Although our data do not allow for conclusive determination of whether benthic or pelagic primary producers dominate, it appears that their relative importance varies with season.
These primary producers also compete for nutrients. Benthic primary producers have direct (macrophytes) or first (benthic algae) access to nutrients that seep up from the subsurface, while planktonic primary producers depend on nutrient supply from surface runoff and nutrients remaining after consumption by benthic primary producers. For example, Henry and Fisher (2003) found that benthic algae can remove up to 80 % of nitrogen from an upwelling water source. As we stated above, nutrient-rich groundwater is the major source of N and P to surface waters in polder Geuzenveld. In addition, due to the shallow depth of the ditches, light reaches the bottom with the consequence that benthic algae can proliferate in this polder. These benthic primary producers might utilize the up-flowing nutrients from groundwater and intercept the nutrients from seeping further into the water column (Hansson, 1988; Pasternak et al., 2009). The increasing light availability and thus primary production during spring led to the nearly complete deprivation of NH4 in the water column (Fig. 2c).
Following the spring bloom, concentrations of chlorophyll a (proxy for phytoplankton biomass) and O2 dropped substantially, while NH4 concentrations rapidly recovered to around 4 mg L−1 in both the time series (Fig. 2c) and the long-term monthly sampling results (Fig. 6). Dissolved O2 remained low (close to hypoxia) during the whole summer (below 2 mg L−1) (Figs. 2e and 6), indicating that oxygen consumption by organic matter degradation and reoxidation of reduced components from groundwater seepage outcompeted oxygen production from primary production. During summer, suspended solid and chlorophyll a concentrations were low (Fig. 6), indicating low biomass of plankton algae. Suspended solid and phytoplankton dominate light attenuation (Scheffer, 1998; Middelburg, 2019). Consequently, during this period, we observed an abrupt shift of the water regime from a turbid state to completely clear, as reflected in the high transparency from June to September (Fig. 6). The low biomass of phytoplankton might be due to N limitation as nutrients are intercepted by benthic algae at the sediment interface. An alternative explanation is that zooplankton grazing maintained phytoplankton biomass at a low level (Strayer et al., 2008; Genkai-Kato et al., 2012).
Temperature and light reaching the sediment started to fall from September onwards (Fig. S6) and thereby reducing the intensity of biological activity, including NH4 assimilation. Consequently, NH4 started to behave conservatively again like EC (Figs. 2 and 3). The best fit between the modeled and measured NH4 was from the end of November to the beginning of March, i.e., during the winter period with lower light levels, shorter day lengths, and very low primary production. The absence of primary production during winter leads to conservative behavior of NH4 governed by the mixing between groundwater and rain water.
4.3 P binding and turbidity
Iron chemistry is considered the dominant process governing the P dynamics in shallow groundwater-fed ditches (Lijklema, 1994; Smolders et al., 2006; Van der Grift et al., 2018). However, primary producers take up P for growth and at the same time release O2 that regulates iron chemistry in lake water column (Tables S1–S3, Spear et al., 2007; Zhang and Mei, 2015; Lu et al., 2016). This web of interactions likely controls P dynamics in these ditches.
From spring to autumn, TP concentrations were fluctuating around 0.5 mg L−1, and the water had low turbidity (<50 FNU) and thus a high transparency, allowing the growth of benthic algae that produce oxygen. Consequently, when P- and Fe-rich anoxic groundwater reaches the surface water–sediment interface, Fe oxidized into iron hydroxides in a short time (van der Grift et al., 2014). P is then sorbed onto those Fe hydroxides and retained in the sediments. Oxidation of reduced iron consumes O2, contributing to the low-O2 conditions of the water column (Fig. 2e). Moreover, it leads to the formation of a reddish-brown film of ferric iron (hydrous ferric oxide; Baken et al., 2013; Van der Grift et al., 2018) on the bottom of the ditches, which can be seen in summer when the water was transparent. This slimy layer comprising iron hydroxides and benthic microbes can easily be resuspended and therefore act as a source of turbidity following perturbations by pumping, wind, rain, or foraging fish, e.g., event 1 (Fig. 5). Lu et al. (2016) showed that co-precipitation of P with metal oxides was stimulated by periphytic biofilm activity that increased the water pH. Consistently, a relatively higher pH was also observed in our spring monthly samples (Fig. 6).
From late autumn onwards, turbidity and total Fe concentrations substantially increased compared to the rest of the time (Fig. 2, p value < 0.001 for turbidity and =0.02 for Fe). Turbidity peaked first at 1800 FNU and stayed at a plateau of ∼200 FNU during the rest of the cold and wet season. Total Fe in the water column reached to 6 mg L−1 from below 1 mg L−1. During this period the water turned brownish and transparency declined (Fig. 6). Iron-rich particles are the most likely source of turbidity in freshwater (Lyvén et al., 2003; Gunnars et al., 2002; and Lofts et al., 2008). The suspension of these brownish iron colloids was likely stabilized by the presence of the dissolved organic matter (DOC) (Mosley et al., 2003; van der Grift et al., 2014), which increased up to 18–33 mg L−1 during events (Fig. S4). In the late autumn, the anoxic–oxic interface shifts from the sediment into the water column and so does the locus of colloid formation. The ditch sediment, which had benthic algae activity releasing O2 during spring and summer, became anoxic in the autumn by the upwelling of the anoxic groundwater. The anoxic seepage occurs year-round, but the production of oxygen by the benthic algae creates an anoxic–oxic transition at the water–sediment interface, which leads to iron hydroxides precipitation in the slimy layer at the bottom that disappears after the algae die off. As a consequence, Fe oxidation moved into the water column where the conditions were relatively oxic (van der Grift et al., 2014). Nevertheless, there was probably still enough Fe or other mineral oxides, such as aluminum hydroxide (Kopáček et al., 2005), binding capacity in the sediment for the fixation of P, as P concentrations remained low during this first turbidity peak. We suggest that the turbidity peak of 1800 FNU is caused by the mineralization of the benthic algae once they die off when light and temperature conditions decrease, combined with the shift of iron hydroxide formation from the sediment–water interface to the water column. The latter process continues through the whole winter season, until primary production restarts in spring (Fig. 7).
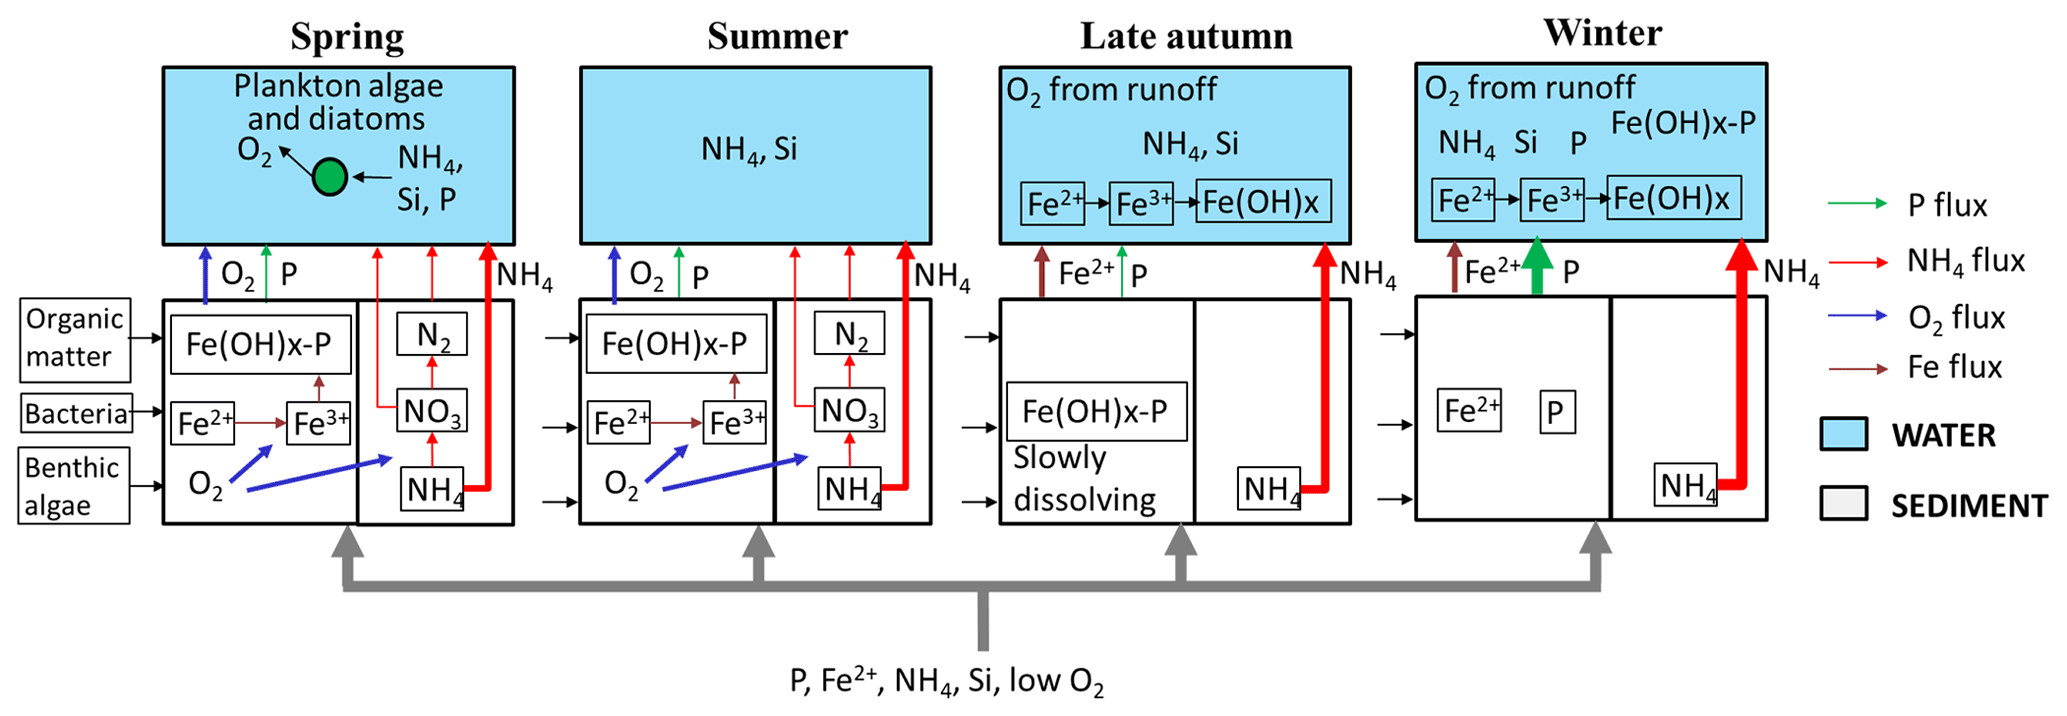
Figure 7Schematic representation of N and P dynamics in spring, summer, later autumn and winter. The thickness of the flow lines represents the concentration magnitudes, the thicker the line, the higher the concentrations.
During winter, temperatures were below 5 ∘C, pH values were relatively lowered, and TP achieved its peak concentrations (Fig. 2d). During this period, iron reduction in the sediments continued and P bounded to iron oxides gradually got released along with reduced iron (Li et al., 2016). In the water column, reduced iron was oxidized but much slower than during spring–autumn due to the lower temperatures (van der Grift et al., 2014), and dissolved P was incorporated into iron flocs with the result that particulate P concentrations and turbidity became high (Table S1, R2 for Fe–turbidity 0.81, TP–Fe 0.65; Table S2, Fe–turbidity: R2=0.72, TP grab–Fe 0.79; Yu et al., 2019).
4.4 Process synthesis
With the presence of benthic algae, abundant organic matter, and bacteria, the sediment functions as an active environment for biotic processes (such as primary production and nitrification–denitrification and anammox) and abiotic processes (such as iron oxidation). Figure 7 shows a conceptual diagram for the N and P dynamics in this lowland urban catchment during the four seasons, which summarizes our hypotheses about the functioning of the system.
4.4.1 Spring
The improved light (and temperature) conditions stimulated primary production and nutrient uptake (N, P, Si) by phytoplankton and benthic algae. The resulting oxygen production caused oxidation of reduced iron from groundwater and the formation of iron oxides at the sediment surface. P was mostly bounded to this particulate iron instead of being released into the upper water layer. In this period turbidity was relatively low, but suspended solids reached a high concentration due to the phytoplankton.
4.4.2 Summer
N and P were still being removed by biological processing, in particular by benthic algae. Phytoplankton biomass decreased because of competition for N or grazing activity. Benthic algae produced O2, which in turn was used to oxidize all reduced iron reaching the sediment–water interface, and P was still retained by iron hydroxides in the sediment. The water column was transparent (low TP and phytoplankton biomass) and relatively low in oxygen due to the continuous supply of anoxic groundwater, the mere absence of O2-rich runoff, the oxidation process of Fe(II), and possibly by microbial organic matter decomposition during warm periods with relatively stagnant water.
4.4.3 Late autumn
Biological activity declined (colder and less light), and more NH4 reached the water column. Moreover, the redox zone moved from the sediment–water interface into the water column (van der Grift et al., 2014, 2016); the oxidation of Fe in the water column caused a peak of turbidity. P was still sequestered to minerals in the sediment.
4.4.4 Winter
During winter, NH4 and TP showed the highest concentrations because of low biological activity. Iron oxides in the sediment dissolved under reductive, abundant organic matter conditions and released Fe2+ and P into the water column, increasing P concentrations therein. NH4 and EC dynamics were primarily governed by the conservative mixing between groundwater and precipitation and/or runoff.
4.5 Event-scale N and P dynamics
At the event scales, NH4 and EC were reduced by dilution from precipitation and/or runoff. For P and turbidity, there was no clear relation to precipitation events, except for events in late autumn and winter (e.g., Fig. 4, event 3). The responses to precipitation and pumping events were different from those reported in the literature. Rozemeijer et al. (2010b) studied an agricultural catchment and found that rainfall events led to NO3 decreases and P increases. Miller et al. (2016) observed NO3 decreases during large discharges in an urban catchment. The lowering of turbidity in our urban catchment during the dilution periods that was associated with the winter event 3 differs from the observations in literature (van der Grift et al., 2014; Rozemeijer et al., 2010b). In agricultural areas, turbidity usually peaks in response to rainfall events due to erosion and remobilization of sediments. In an urban, paved environment, erosion may be limited and runoff water has a low turbidity. Moreover, in the case of turbid pre-event conditions, fresh precipitation water flushes away this turbid water. In addition, Yu et al. (2019) showed that precipitation runoff delivers particles and O2 to the ditches. We suggest that this accelerates the further aggregation of the iron complexes; the resulting larger particles more readily settle to the bottom, causing a reduction of turbidity during the events itself (Fig. 4, EC dilution part of events 3 and 4).
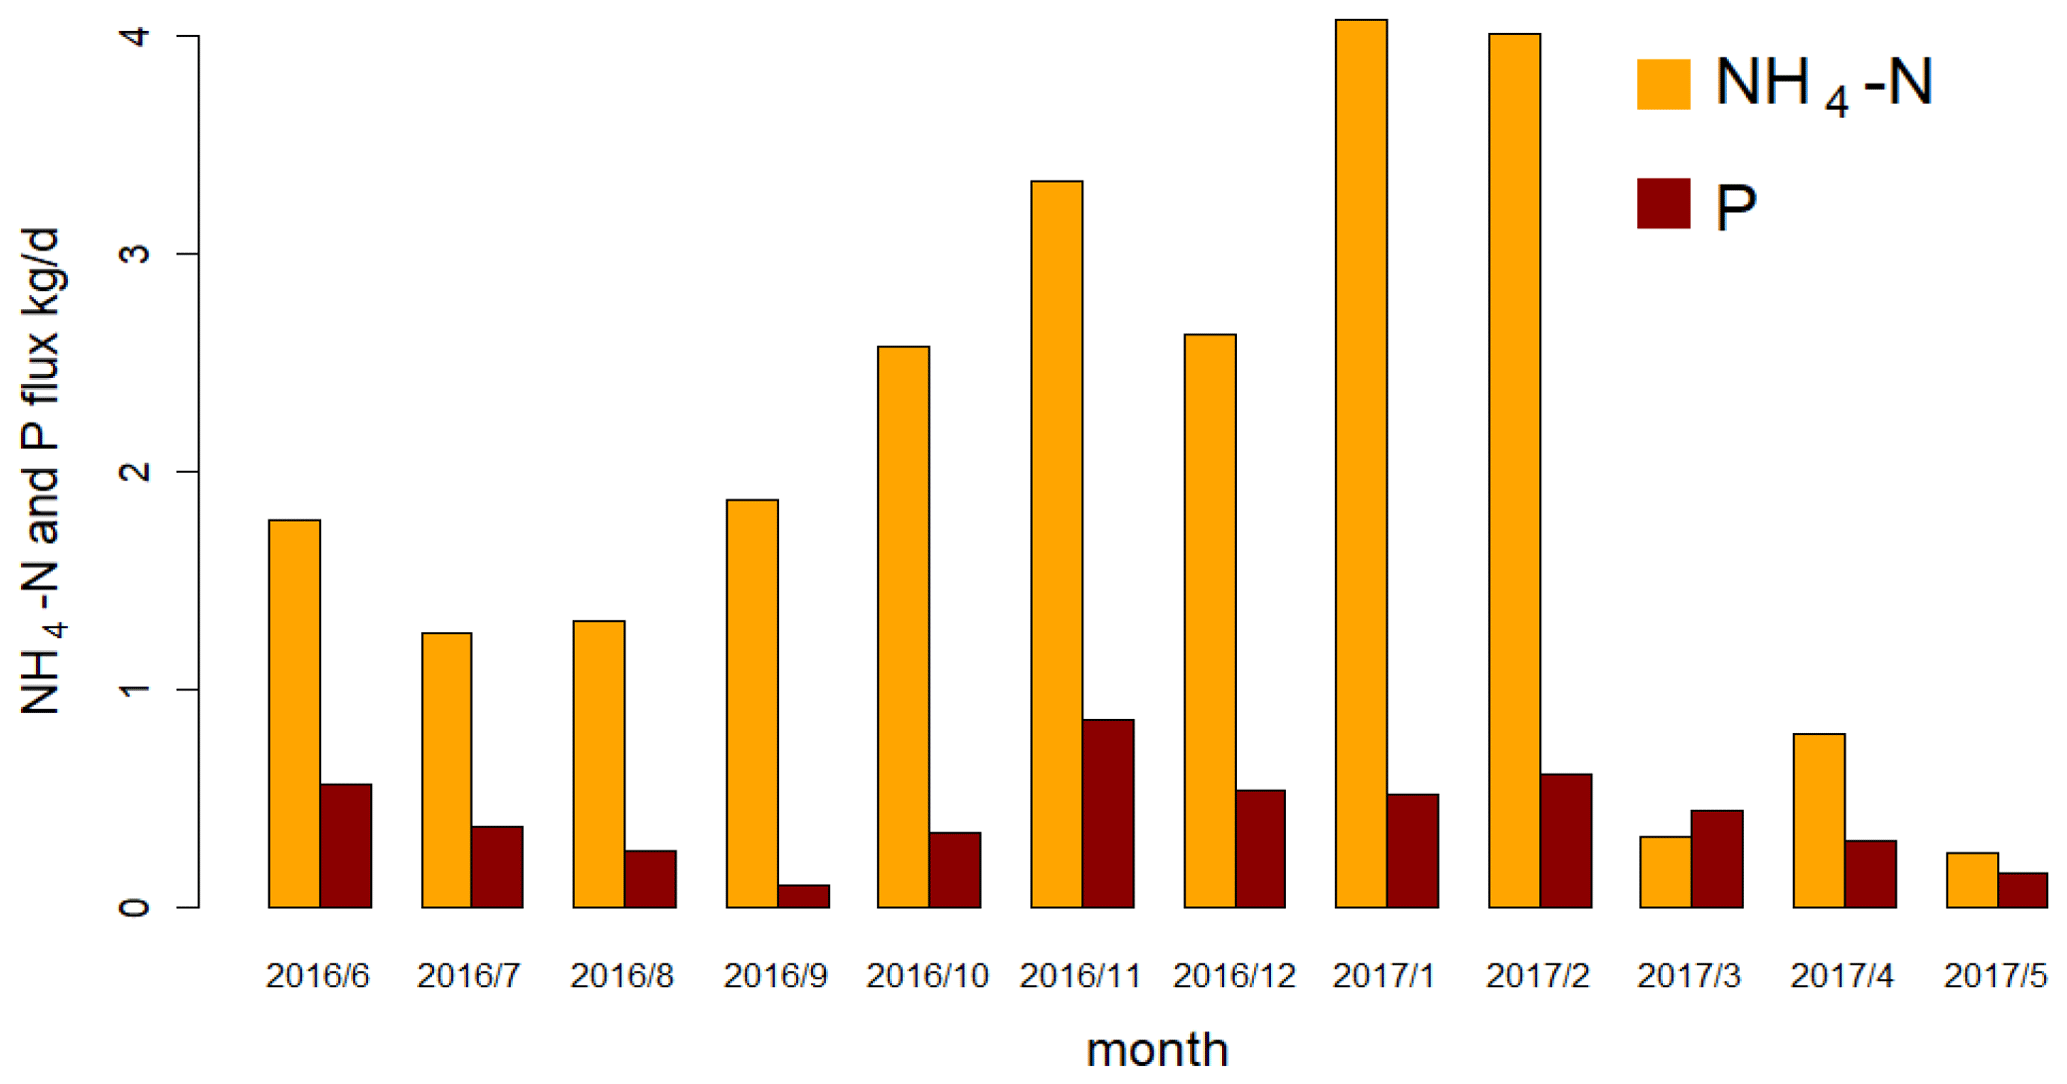
Figure 8Average daily NH4-N and P flux (kg d−1) in each month in the discharge (calculated from the continuous measurements) of polder Geuzenveld from June 2016 to May 2017.
In artificial lowland catchments, water systems are intensively regulated by pumping activity to prevent flood and drought. However, there is a substantial lack of knowledge about the possible consequences of such regulation on aquatic ecology and water quality. Peaks in P and turbidity by the activation of pumps was observed by van der Grift et al. in their high-frequency monitoring campaign in an agriculture lowland polder (van der Grift et al., 2014, 2016). This type of event-scale dynamics would be easily missed in a daily or lower-frequency sampling schedule, especially because pumping occurs almost solely overnight in our regulated catchments. As such, only a sampling schedule with 7 h intervals (e.g., Neal et al., 2011) or high-frequency monitoring is able to catch the short-term dynamics (van Geer et al., 2016).
Contrary to the findings of van der Grift et al. (2014, 2016), the effects of pumping activity on N, P, and turbidity dynamics were variable, depending on the season. During the phytoplankton bloom in spring, activation of pumps resulted in flushing and as a result reduced turbidity during the event (Fig. 5 event 4). Consequently, phytoplankton was transferred to the downstream channel and added to the total N pool in that system. In summer (Fig. 5 event 1), the dead detritus and the layer of iron compounds at the sediment surface were easily resuspended and contributed to turbidity peaks at the beginning of the pumping, but the materials also resedimented almost immediately once the flow reached stability. Resuspension also resulted in an increase of NH4 in the water column which was then being pumped out (Fig. 5 event 1). During late autumn, we observed that the water was highly turbid (see also Yu et al., 2019) which we suggest to be caused by the formation of iron hydroxide colloids in the water column, which is supported by correlations between Fe grab and turbidity measurements (R2=0.72, Table S2). We explain the reduced turbidity after a precipitation event as a result of the activation of the pumps which caused the export of the turbid water towards the receiving boezem in combination with aggregation of iron hydroxides in the water column and subsequent settling of the aggregates due to the supply of new O2-rich water (Fig. 5 event 2; see also van der Grift et al., 2014). Moreover, NH4 increased again by the pumping activity and was transferred downstream (Fig. 5 event 2). The eventual impact of regulation of the Geuzenveld water system turns the pumping discharge into a point source for nutrients to downstream water bodies as shown in Fig. 8.
Fluxes of N and P were highest during winter (Fig. 6). These high fluxes are caused not only by the more frequent pumping activity but also by the higher concentration of N and P in the water column in winter. In the time series data, NH4 (the major form of N) had concentrations above 2.4 mg N L−1 (the local environmental quality standard (EQS) for N total) in all seasons except spring. NH4 concentrations even reached up to 6.5 mg L−1. TP concentrations were constantly higher than 0.15 mg P L−1 (the local EQS); during winter it was always over 1 mg P L−1. Although the NH4 flux in the discharge was very low in spring (Fig. 8), the actual total N flux might have been much higher, as organic N (phytoplankton) was the major form of TN instead of NH4 during this period (Fig. 6, NH4∕N and organic-N/TN ratios). Therefore, even though the water authority measures have been effective in controlling the water quantities in the polder, they had unanticipated impacts on nutrient exports to the downstream water bodies. In order to prevent eutrophication in the urban waters, nutrient-rich discharge from these areas is exported directly to the North Sea Canal and to the North Sea.
4.6 Implications for urban water management in low-lying catchments
This study demonstrated high-frequency monitoring technology to be an effective tool for understanding the complex water quality dynamics. Investment in high-frequency monitoring would greatly benefit the management of urban lowlands with substantial groundwater seepage by elucidating the principle biogeochemical processes and nutrient temporal patterns for realizing efficient mitigation and control of eutrophication. For example, redirecting the drain water effluent into constructed wetlands could be considered a mitigation measure in low-lying areas with artificial water systems that resemble the Amsterdam region, e.g., in cities such as New Orleans, Shanghai, and Dhaka (Li et al., 2009; Nahar et al., 2014; Jones et al., 2016; Stahl, 2019). Centralizing the treatment of discharge water is also recommended, e.g., by harvesting N as phytoplankton from the discharge during spring or filtrating P at the pumping station during winter. Measures that artificially increase oxygen concentrations in the waters, such as the input of oxygen-rich water, aeration by fountains, or the artificial introduction of grazers or macrophytes may be considered to improve the ecological status of these urban waters. Moreover, aeration of the water in summer and autumn would possibly enhance processes such as coupled nitrification–denitrification and anammox, eventually converting NH4 to N2, before the water is discharged to downstream waters. Importantly, before the application of any measures or maintenance in urban low-lying catchments, managers should evaluate the potential effects on the biological and chemical resilience; for example, dredging of a layer with abundant benthic activity might destroy an important buffer to nutrients in growing seasons, especially P.
In this study, we focused on the analysis of the temporal patterns of water composition and on the deduction of the potential biogeochemical processes. Detailed studies about these processes and the biotic communities at the sediment–water interface were outside of the scope of this paper. A comprehensive study on the sediment–water interface would be necessary to further increase our knowledge on the role of the benthic zone in attenuating N and P seeping up from groundwater. Besides, further research would need to consider the optimal physical dimensions of water courses and drain configurations to benefit the ecological status of urban waters that are prone to nutrient-rich groundwater seepage.
This study aimed at improving our understanding of the mechanisms that control the temporal patterns of nutrients and other water quality parameters in an urban catchment. Time series of EC, NH4, TP, and turbidity were obtained by applying a high-frequency monitoring technology for 1 year (May to July 2016). Observed EC, NH4, and TP could only partly be explained by conservative mixing of groundwater and precipitation components. In particular, N and P fluxes in the shallow ditches were also impacted by biogeochemical processes, such as primary production and iron redox transformations.
NH4, the dominant form of N in surface water, originates primarily from groundwater seepage, and concentrations are lowered by primary producers (phytoplankton and benthic algae) in the growing season. High algal biomass was also clear from high chlorophyll a and suspended solids in the water column.
TP showed high concentrations in winter but relatively low concentrations in other seasons. Iron redox chemistry was the principle process controlling the P dynamics in shallow groundwater-fed ditches. P dynamics may also have been partly influenced by primary production which consumes P for growth and at the same time produces O2, influencing the redox status in the sediments and in the water column.
High turbidity levels occurred in the late autumn and winter, mostly in the form of iron hydroxides. It resulted from a shift of the anoxic–oxic interface where the formation of iron hydroxides moves from the sediment towards the water column.
Water pumped from the polder to downstream water bodies was rich in NH4 from summer to winter but rich in organic N in the form of algae during spring. P leaves the polder mainly during the winter season when it is released from the sediment and exported mostly in the form of P sorbed to Fe(OH)3 colloids and as dissolved P.
Precipitation diluted concentrations of most water quality parameters but delivered O2 to the water column and in that way indirectly affected P and turbidity by intensifying iron oxidation and precipitation.
Unlike many other natural and artificial catchments, rainfall and pumping events did not increase turbidity or TP concentrations at the short timescale but rather reduced turbidity and TP because of enhanced iron hydroxide precipitation due to oxygen inputs by runoff.
Our understanding of the N and P dynamics in this low-lying urban catchment may contribute to the development of effective water management strategies that reduce eutrophication conditions in both the urban polders and the downstream waters. Drainage of very low-lying areas (for use as residential and/or agricultural areas) not only increases pumping costs but can also result in difficult to manage water quality conditions. Controlling the source and redirecting and utilizing the drainage water might be strategies to reduce the input of N and P from groundwater into surface water. In addition, we showed that in lowland urban areas with high seepage rates the reactivity of the streambed sediments largely controls water quality of surface waters and thus should be managed with care when cleaning the surface water systems.
The time series data, the discrete sampling data, and the mixing model spreadsheet are available in the Supplement. The raw datasets and the data processing R scripts related to this paper are available on request to Liang Yu; contact email is xiaobaidrawing@gmail.com.
The supplement related to this article is available online at: https://doi.org/10.5194/hess-25-69-2021-supplement.
MO, JCR, and HPB funded this research. HPB and JCR designed the field work. LY carried out the field work, data collection, analysis, visualization, discussion, and the writing of the article, under the supervision of HPB and JCR before 2019 and YvdV as the main supervisor since 2019. All the authors participated in the discussion of the data analysis results and helped prepare the article.
The authors declare that they have no conflict of interest.
This work was funded through the China Scholarship Council (no. 201309110088) and supported by Waternet, the Strategic Research Funding of TNO, and Deltares. We highly appreciate the help and support from our Waternet co-workers: Eelco Wiebenga, Henk Molenaar, Sonja Viester, Laura Moria, and Frank Smits.
This research has been supported by the China Scholarship Council (grant no. 201309110088) and supported by Waternet, the Strategic Research Funding of TNO, and Deltares.
This paper was edited by Christian Stamm and reviewed by Matthias Gassmann and two anonymous referees.
Audet, J., Zak, D., Bidstrup, J., and Hoffmann, C. C.: Nitrogen and phosphorus retention in Danish restored wetlands. Ambio, 49, 324–336, https://doi.org/10.1007/s13280-019-01181-2, 2020.
Baken, S., Sjostedt, C., Gustafsson, J. P., Seuntjens, P., and Desmet, N.: Characterisation of hydrous ferric oxides derived from iron-rich groundwaters and their contribution to use suspended sediment of streams, Appl. Geochem., 39, 59–68, 2013.
Beusen, A. H. W., Bouwman, A. F., Van Beek, L. P. H., Mogollón, J. M., and Middelburg, J. J.: Global riverine N and P transport to ocean increased during the 20th century despite increased retention along the aquatic continuum, Biogeosciences, 13, 2441–2451, https://doi.org/10.5194/bg-13-2441-2016, 2016.
Bieroza, M. Z., Heathwaite, A. L., Bechmann, M., Kyllmar, K., and Jordan, P.: The concentration-discharge slope as a tool for water quality management, Sci. Total Environ., 630, 738–749, 2018.
Bunch, N. D. and Bermot, M. J.: Nitrate and ammonium uptake by natural stream sediment microbial communities in response to nutrient enrichment, Res. Microbiol., 163, 137–141, 2012.
Cavaliere, E. and Baulch, H. M.: Winter nitrification in ice-covered lakes, PLoS ONE, 14, e0224864, https://doi.org/10.1371/journal.pone.0224864, 2019.
Chen, M., Ding, S., Chen, X., Sun, Q., Fan, X., Lin, J., Ren, M., Yang, L., and Zhang, C.: Mechanisms driving phosphorus release during algal blooms based on hourly changes in iron and phosphorus concentrations in sediments, Water Res., 133, 153–164, 2018.
Díaz, P., Stanek, P., Frantzeskaki, N., and Yeh, D. H.: Shifting paradigms, changing waters: Transitioning to integrated urban water management in the coastal city of Dunedin, USA, Sustain. Cit. Soc., 26, 555–567, 2016.
Duncan, J.M., Welty, C., Kemper, J. T., Groffman, P. M., and Band, L. E.: Dynamics of nitrate concentation-discharge patterns in an urban watershed, Water Resour. Res., 53, 7349–7365, 2017.
Eggimann, S., Mutzner, L., Wani, O., Schneider, M. Y., Spuhler, D., de Vitry, M. M., Beutler, P., and Maurer, M.: The Potential of Knowing More: A Review of Data-Driven Urban Water Management, Environ. Sci. Technol., 51, 2538–2553, 2017.
Filippelli, M. G.: The global phosphorus cycle: Past, present, and future, Elements, 4, 89–95, 2008.
Fletcher, T. D., Shuster, W., Hunt, W. F., Ashley, R., Butler, D., Arther, S., Trowsdale, S., Barraud, S., Semadeni-Davies, A., Bertrand-Krajewski, J. L., Mikkelsen, P. S., Rivard, G., Uhl, M., Dagenais, D., and Viklander, M.: SUDS, LID, BMPs, WSUD and more – The evolution and application of terminology surrounding urban drainage, Urb. Water J., 12, 525–542, 2015.
Genkai-Kato, M., Vadeboncoeur, Y., Liboriussen, L., and Jeppesen, E.: Benthic-planktonic coupling, regime shifts, and whole-lake primary production in shallow lakes, Ecology, 93, 619–631, 2012.
Griffioen, J.: Extent of immobilisation of phosphate during aeration of nutrient-rich, anoxic groundwater, J. Hydrol., 320, 359–369, 2006.
Gunnars, A., Blomqvist, S., Johansson, P., and Andersson, C.: Formation of Fe (III) oxyhydroxide colloids in freshwater and brackish seawater, with incorporation of phosphate and calcium, Geochim. Cosmochim. Ac., 66, 745–758, 2002.
Hansson, L. A.: Effects of competitive interactions on the biomass development of planktonic and periphytic algae in lakes, Limnol. Oceanogr., 33, 121–128, 1988.
Hartwig, E. O.: Factors affecting respiration and photosynthesis by the benthic community of a subtidal siliceous sediment, Mar. Biol., 46, 283–293, 1978.
He, S. and Xu, Y. J.: Three decadal inputs of nitrogen and phosphorus from four major coastal rivers to the summer hypoxic zone of the northern Gulf of Mexico, Water Air Soil Pollut., 226, 1–18, https://doi.org/10.1007/s11270-015-2580-6, 2015.
Henry, J. C. and Fisher, S. G.: Spatial segregation of periphyton communities in a desert stream: causes and consequences for N cycling, J. N. Am. Benthol. Soc., 22, 511–527, 2003.
Jäger, C. G. and Borchardt, D.: Longitudinal patterns and response lengths of algae in riverine ecosystems: A model analysis emphasizing benthic-pelagic interactions, J. Theor. Biol., 442, 66–78, 2018.
Jäger, C. G., Hagemann, J., and Borchardt, D.: Can nutrient pathways and biotic interactions control eutrophication in riverine ecosystems? Evidence from a model driven mesocosm experiment, Water Res., 115, 162–171, 2017.
Jones, C. E., An, K., Blom, R. G., Kent, J. D., Ivins, E. R., and Bekaert, D.: Anthropogenic and geologic influences on subsidence in the vicinity of New Orleans, Louisiana, J. Geophys. Res.-Solid, 121, 3867–3887, 2016.
Kabenge, M., Wang, H., and Li, F.: Urban eutrophication and its spurring conditions in the Murchison Bay of Lake Victoria, Environ. Sci. Pollut. Res., 23, 234–241, 2016.
Kleeberg, A., Hupfer, M., and Gust, G.: Phosphorus entrainment due to resuspension in a lowland river, Spree, NE Germany – A laboratory microcosm study, Water Air Soil Pollut., 183, 129–142, 2007.
Kopáček, J., Borovec, J., Hejzlar, J., Ulrich, K., Norton, S. A., and Amirbahman, A.: Aluminum control of phosphorus sorption by lake sediments, Environ. Sci. Technol., 39, 8784–8789, 2005.
Kuenen, J.: Anammox bacteria: from discovery to application, Nat. Rev. Microbiol., 6, 320–326, 2008.blackboxThis reference is not cited in the text.
Le Moal, M., Cascuel-Odoux, C., Menesguen, A., Souchon, Y., Etrillard, C., Levain, A., Moatar, F., Pannard, A., Souchu, P., Lefebvre, A., and Pinay, G.: Eutrophication: A new wine in an old bottle, Sci. Total Environ., 651, 1–11, 2019.
Li, H., Song, C. L., Cao, X. Y., and Zhou, Y. Y.: The phosphorus release pathways and their mechanisms driven by organic carbon and nitrogen in sediments of eutrophic shallow lakes, Sci. Total Environ., 572, 280–288, 2016.
Li, X., Chen, M., and Anderson, B. C.: Design and performance of a water quality treatment wetland in a public park in Shanghai, China, Ecol. Eng., 35, 18–24, 2009.
Lijklema, L.: Nutrient dynamics in shallow lakes: effects of changes in loading and role of sediment-water interactions, Hydrobiologia, 275/276, 335–348, 1994.
Lofts, S., Tipping, E., and Hamilton-Taylor, J.: The Chemical Speciation of Fe(III) in Freshwaters, Aquat. Geochem., 14, 337–358, 2008.
Lu, H., Wang, J., Li, J., Shao, H., and Wu, Y.: Periphytic biofilm: A buffer for phosphorus precipitation and release between sediments and water, Chemosphere, 144, 2058–2064, 2016.
Lyvén, B., Hassellöv, M., Turner, D. R., Haraldsson, C., and Andersson, K.: Competition between iron- and carbon-based colloidal carries for trace metals in a freshwater assessed using flow field-flow fractionation coupled to ICPMS, Geochim. Cosmochim. Ac., 67, 3791–3802, 2003.
McGlathery, K. J., Anderson, I. C., and Tyler, A. C.: Magnitude and variability of benthic and pelagic metabolism in a temperate coastal lagoon, Mar. Ecol. Prog. Ser., 216, 1–15, 2001.
Middelburg, J. J.: Marine Carbon Biogeochemistry – A Primer for Earth System Scientists, Springer Briefs in Earth System Sciences, Switzerland, 2019.
Middleburg, J. J. and Nieuwenhuize, J.: Uptake of dissolved inorganic nitrogen in turbid, tidal estuaries, Mar. Ecol. Prog. Ser., 192, 79–88, 2000.
Miller, M. P., Tesoriero, A. J., Capel, P. D., Pellerin, B. A., Hyer, K. E., and Burns, D. A.: Quantifying watershed-scale groundwater loading and instream fate of nitrate using high-frequency water quality data, Water Resour. Res., 52, 330–347, 2016.
Mosley, L. M., Hunter, K. A., and Ducker, W. A.: Forces between Colloid Particles in Natural Waters, Environ. Sci. Technol., 37, 3303–3308, 2003.
Mulder, A., van de Graaf, A. A., Robertson, L. A., and Kuenen, J. G.: Anaerobic ammonium oxidation discovered in a denitrifying fluidized bed reactor, FEMS Microbiol. Ecol., 1, 177–184, 1995.
Nahar, M. S., Zhang, J., Ueda, A., and Yoshihisa, F.: Investigation of severe water problem in urban areas of a developing country: the case of Dhaka, Bangladesh, Environ. Geochem. Health, 36, 1079–1094, https://doi.org/10.1007/s10653-014-9616-5, 2014.
Neal, C., Reynolds, B., Norris, D., Kirchner, J. W., Neal, M., Rowland, P., Wickham, H., Harman, S., Armstrong, L., Sleep, D., Lawlor, A., Woods, C., Williams, B., Fry, M., Newton, G., and Wright, D.: Three decades of water quality measurements from the Upper Severn experimental catchments at Plynlimon, Wales: an openly accessible data resource for research, modelling, environmental management and education, Hydrol. Process., 25, 3818–3830, 2011.
Nizzoli, D., Welsh, D. T., and Viaroli, P.: Denitrification and benthic metabolism in lowland pit lakes: The role of trophic conditions, Sci. Total Environ., 703, 134804, https://doi.org/10.1016/j.scitotenv.2019.134804, 2020.
Nyenje, P. M., Foppen, J. W., Uhlenbrook, S., Kulabako, R., and Muwanga, A.: Eutrophication and nutrient release in urban areas of sub-Saharan Africa – A review, Sci. Total Environ., 408, 447–455, 2010.
Painter, H. A.: A review of literature on inorganic nitrogen metabolism in microorganisms, Water Res., 4, 393–450, 1970.
Pasterank, A., Hillebrand, H., and Flöder, S.: Competition between benthic and pelagic microalgae for phosphorus and light-long-term experiments using artificial substrates, Aquat. Sci., 71, 238–249, 2009.
Paerl, H. W., Scott, J. T., McCarthy, M. J., Newell, S. E., Gardner, W. S., Havens, K. E., Hoffman, D. K., Wilhelm, S. W., and Wurtsbaugh, W. A.: It Takes Two to Tango: When and Where Dual Nutrient (N & P) Reductions Are Needed to Protect Lakes and Downstream Ecosystems, Environ. Sci. Technol., 50, 10805–10813, 2016.
Petranich, E., Covelli, S., Acquavita, A., De Vittor, C., Faganeli, J., and Contin, M.: Benthic nutrient cycling at the sediment-water interface in a lagoon fish farming system (northern Adriatic Sea, Italy), Sci. Total Environ., 644, 137–149, https://doi.org/10.1016/j.scitotenv.2018.06.310, 2018.
Putt, A. E., MacIsaac, E. A., Herunter, H. E., Cooper, A. B., and Selbie, D. T.: Eutrophication forcings on a peri-urban lake ecosystem: Context for integrated watershed to airshed management, PLoS ONE, 4, e0219241, https://doi.org/10.1371/journal.pone.0219241, 2019.
Rode, M., Wade, A. J., Cohen, M. J., Hensley, R. T., Michael, J. B., Kirchner, J. W., Arhonditsis, G. B., Jordan, P., Kronvang, B., Halliday, S. J., Skeffington, R., Rozemeijer, J., Aubert, A. H., Rinke, K., and Jomaa, S.: Sensors in the stream: the high-frequency wave of the present, Environ. Sci. Techno., 50, 10297–10307, 2016.
Rozemeijer, J. C. and Broers, H. P.: The groundwater contribution to surface water contamination in a region with intensive agricultural land use (Noord-Brabant, The Netherlands), Environ. Pollut., 148, 695–706, 2007.
Rozemeijer, J. C., van der Velde, Y., van Geer, F. C., Bierkens, M. F. P., and Broers, H. P.: Direct measurements of the tile drain and groundwater flow route contributions to surface water contamination: From field-scale concentration patterns in groundwater to catchment-scale surface water quality, Environ. Pollut., 158, 3571–3579, 2010a.
Rozemeijer, J. C., van der Velde, Y., van Geer, F. C., de Rooij, G. H., Torfs, P. J. J. F., and Broers, H. P.: Improving load estimates for NO3 and P in surface water by characterizing the concentration response to rainfall events, Environ. Sci. Technol., 44, 6305–6312, 2010b.
Scheffer, M.: Ecology of shallow lakes, 1st Edn., Chapman & Hall, London, 1998.
Smolders, A. J. P., Lamers, L. P. M., Lucassen, E. C. H. E. T., Van Der Velde, G., and Roelofs, J. G. M.: Internal eutrophication: How it works and what to do about it – a review, Chem. Ecol., 22, 93–111, 2006.
Soetaert, K. and Herman, P. M. J.: Nitrogen dynamics in the Westerschelde estuary (SW Netherlands) estimated by means of the ecosystem model MOSES, Hydrobiologia, 311, 225–246, https://doi.org/10.1007/BF00008583, 1995.
Spears, B. M., Carvalho, L., Perkins, R., Kirika, A., and Paterson, D. M.: Sediment phosphorus cycling in a large shallow lake: spatio-temporal variation in phosphorus pools and release, Hydrobiologia, 584, 37–48, 2007.
Stahl, M. O. ; Groundwater pumping is a significant unrecognized contributor to global anthropogenic element cycles, Groundwater, 57, 455–464, 2019.
Strayer, D. L., Pace, M. L., Caraco, N. F., Cole, J. J., and Findlay, S. E. G.: Hydrology and grazing jointly control a large-river food web, Ecology, 89, 12–18, 2008.
Thamdrup, B. and Dalsgaard, T.: Production of N2 through anaerobic ammonium oxidation coupled to nitrate reduction in marine sediments, Appl. Environ. Microbiol., 68, 1312–1318, 2002.blackboxThis reference is not cited in the text.
Toor, G. S., Occhipinti, M. L., Yang, Y. Y., Majcherek, T., Haver, D., and Oki, L.: Managing urban runoff in residential neighbourhoods: Nitrogen and phosphorus in lawn irrigation driven runoff, PLoS ONE, 12, e0179151, https://doi.org/10.1371/journal.pone.0179151, 2017.
van der Grift, B., Rozemeijer, J. C., Griffioen, J., and van der Velde, Y.: Iron oxidation kinetics and phosphate immobilization along the flow-path from groundwater into surface water, Hydrol. Earth Syst. Sci., 18, 4687–4702, https://doi.org/10.5194/hess-18-4687-2014, 2014.
van der Grift, B., Broers, H. P., Berendrecht, W., Rozemeijer, J., Osté, L., and Griffioen, J.: High-frequency monitoring reveals nutrient sources and transport processes in an agriculture-dominated lowland water system, Hydrol. Earth Syst. Sci., 20, 1851–1868, https://doi.org/10.5194/hess-20-1851-2016, 2016.
Van der Grift, B., Osté, L., Schot, P., Kratz, A., van Popta E., Wassen, M., and Griffioen, J.: Forms of phosphorus in suspended particulate matter in agriculture-dominated lowland catchments: Iron as phosphorus carrier, Sci. Total Environ., 631–632, 115–129, 2018.
Van der Velde, Y., Rozemeijer, J. C., de Rooij, G. H., van Geer, F. C., and Broers, H. P.: Field-scale measurements for separation of catchment discharge into flow route contribution, Vadose Zone J., 9, 25–35, 2010.
van Geer, F. C., Kronvang, B., and Broers, H. P.: High-resolution monitoring of nutrients in groundwater and surface waters: process understanding, quantification of loads and concentrations, and management applications, Hydrol. Earth Syst. Sci., 20, 3619–3629, https://doi.org/10.5194/hess-20-3619-2016, 2016.
Walsh, C. J., Roy, J. W., Feminella, J. W., Cottingham, P. D., Groffman, P. M., and Morgan II, R. P.: The urban stream syndrome: current knowledge and the search for a cure, J. N. Am. Benthol. Soc., 24, 706–732, 2005.
Wang, T., Liu, G., Gao, L., Zhu, L., Fu, Q., and Li, D.: Biological and Nutrient Responses to a Typhoon in the Yangtze Estuary and the Adjacent Sea, J. Coast. Res., 32, 323–332, 2016.
Wilczak, A., Jacangelo, J. G., Marcinko, J. P., Odell, L. H., and Kirmeyer, G. J.: Occurrence of nitrification in chloraminated distribution systems, J. Am. Water Works Assoc., 88, 74–85, 1996.
Wriedt, G., Spindler, J., Neef, T., Meißner, R., and Rode, M.: Groundwater dynamics and channel activity as major controls of in-tream nitrate concentrations in a lowland catchment system?, J. Hydrol., 343, 154–168, 2007.
Yang, Y. Y. and Toor, G. S.: Stormwater runoff driven phosphorus transport in an urban residential catchment: Implications for protecting water quality in urban watersheds, Scient. Rep., 8, 11681, https://doi.org/10.1038/s41598-018-29857-x, 2018.
Yu L., Rozemeijer J.C., van Breukelen B.M., Ouboter M., van der Vlugt C., and Broers H.P.. Groundwater impacts on surface water quality and nutrient loads in lowland polder catchments: monitoring the greater Amsterdam area. Hydrology and Earth System Sciences, 22:487-508, 2018.
Yu, L., Rozemeijer, J. C., van der Velde, Y., van Breukelen, B. M., Ouboter, M., and Broers, H. P.: Urban hydrogeology: Transport routes and mixing of water and solutes in a groundwater influenced urban lowland catchment, Sci. Total Environ., 678, 288–300, 2019.
Zhang, W., Jin, X., Meng, X., Tang, W., and Shan, B.: Phosphorus transformations at the sediment-water interface in shallow freshwater ecosystems caused by decomposition of plant debris, Chemosphere, 201, 328–334, 2018.
Zhang, X. and Mei, X.: Effects of benthic algae on release of soluble reactive phosphorus from sediments: a radioisotope tracing study, Water Sci. Eng., 8, 127–131, 2015.
Zhu, W. X., Dillard, N. D., and Grimm, N. B.: Urban nitrogen biogeochemistry: status and processes in green retention basins, Biogeochemistry, 71, 177–196, 2004.
dirtierduring winter.