the Creative Commons Attribution 4.0 License.
the Creative Commons Attribution 4.0 License.
 | 21 Dec 2021
Identifying the dynamic evolution and feedback process of water resources nexus system considering socioeconomic development, ecological protection, and food security: A practical tool for sustainable water use
Yaogeng Tan
Zengchuan Dong
Sandra M. Guzman
Xinkui Wang
Wei Yan
The accelerated consumption of water resources caused by the rapid increase in population and urbanization is intensifying the complex interactions across water resources, socioeconomic development, ecological protection, and food security (WSEF), which causes not only the imbalance between water supply and demand but also the vulnerability of both food and ecological systems. Therefore, identifying the dynamic coevolution and feedback process is one of the most crucial ways of achieving the goal of sustainable water use. In this study, we developed an integrated modeling framework to better identify the dynamic interaction and coevolution process of the nexus across WSEF systems in the context of sustainable water uses by coupling system dynamic (SD) model and multi-objective optimization model. The SD model is used to simulate both the dynamic interaction of each agent and the coevolution process of the whole nexus system by positive/negative feedback loops. The multi-objective optimization model is used to quantify the negative feedback loops of the SD model by generating the optimal scheme of different water users. Finally, the model uncertainty considering different weighting factors is analyzed. The framework is applied to the upper reaches of the Guijiang River basin, China. Results show that (i) the rapid economic growth increases the conflict between the water uses for socioeconomic development and ecological protection, intensifying the ecological awareness and resulting in more water shortages of socioeconomic and food agents, which is unable to support such rapid development. (ii) Once the economic growth rate decreases, water resources are able to support economic development with a decreased overload index and stable crop yield, which further contributes to water sustainability. (iii) The river ecological agent is the critical factor that affects the robustness of the model. (iv) The equal consideration of each water usage is the most beneficial to sustainable development. These results highlight the importance of water resources management, considering the tradeoffs across multiple stakeholders, and give a strong reference to policymakers for comprehensive urban planning.
- Article
(7470 KB) - Full-text XML
-
Supplement
(370 KB) - BibTeX
- EndNote


In recent years, the rapid increase in economic development and urbanization is accelerating the consumption of water resources, further contributing to the imbalances and conflicts between water supply and demand (Carpenter et al., 2011; Yaeger et al., 2014; Perrone and Hornberger, 2016). The accelerated consumption of water resources not only influences the natural hydrological cycle and the process of agricultural water demand, affecting the agricultural water uses and eventually causing the vulnerability of food security, but also reduces the ecological streamflow, deteriorating the river's ecological health and affecting the aquatic biodiversity (Yang et al., 2019; Tan et al., 2019). The resulting huge pressure on food security, the river ecosystem, and socioeconomic development becomes more universal and complex, seriously restricting the achievement of regional sustainable development goals (Walter et al., 2012; Liu et al., 2014; Yang et al., 2019). Therefore, detecting the sustainable balance across the different water needs has become one of the hotspots of water resources planning and management communities (Baron et al., 2002; Falkenmark, 2003; Rockstrom et al., 2009; Perrone and Hornberger, 2016; Zhang et al., 2018; Luo and Zuo, 2019). At present, the water resources system is composed of numerous water sectors and is susceptible to the influence of external conditions, intensifying their complex dynamic interactions under external changes (Phillips, 2001; Thomas, 2001; Liu et al., 2007a; Parker et al., 2008; Wagener et al., 2010; Secchi et al., 2011; Yaeger et al., 2014). However, the dynamic interactions are usually characterized by high dimensionality and nonlinearity, which challenges the goal of sustainable water use (Gastélum et al., 2010; Yaeger et al., 2014). Thus, identifying the coevolution process and dynamic interactions across multiple water uses is one of the crucial and effective approaches to how the water resources system performs more sustainably (Sivapalan et al., 2012; Collins et al., 2011; Yaeger et al., 2014; Thompson et al., 2013; Wagener et al., 2010).
The water resources system is composed of spatial subsystems that include multiple water users, which contributes to its hierarchy and multiplicity. Thus, the systematic analysis approach (SAA) is one of the most effective methods for solving water resources management problems. Although SAA is characterized by its complexity, it has been carried out by many scholars (Faridah et al., 2014; Liu et al., 2008; Li et al., 2015; Jia et al., 2015). There are many approaches that are based on SAA, such as optimal algorithms (Abdulbaki et al., 2017), the decision support system (Chandramouli and Deka, 2005), multi-criteria decision analysis (MCDA; Afify, 2010), etc. Among all the SAAs, the system optimization approach is one of the most practical options to manage complex water resources systems in a nonlinear, integrated, and comprehensive way (Moraes et al., 2010; Singh, 2014; Chen et al., 2017; Li et al., 2019a). It gives insights on how to allocate the water resources on a regional or watershed scale in a balanced way (Li et al., 2015; Liu et al., 2019). The system optimization approach is essentially an adaptive system adjustment, or a complex adaptive system (CAS; Holland, 1995), that is susceptible to external conditions. As for the water resources system, external conditions are able to stimulate both the entire system and its agents (i.e., water users) to adjust and strengthen themselves to better adapt to the external changes. However, the system optimization approach usually puts emphasis on how to attain the optimal value of each water user and neglects the dynamic interactions and relations among these users.
The core content of sustainable water resources is to emphasize the value of water resources and the protection of the ecological environment while ensuring socioeconomic development and food security (Gohari et al., 2013). It also stresses the relevance and dynamic interactions of those water uses instead of their individual properties. In this respect, the term “nexus” is used to reveal the multiple components and their interlinkages within a system. This term was first conceived by World Economic Forum (2011) to promote and discuss the indivisible relationships between the multiple uses of resources. It provides the universal rights of water, energy, and food, and developed the food–energy–water (FEW) nexus framework (Hoff, 2011; Biggs et al., 2015). The definition of nexus thinking can be classified into two categories (Zhang et al., 2018). First, the nexus is interpreted as the interactions among different subsystems (or sectors) within the nexus system. Second, it is presented as an analytical approach to quantify the links between the nexus nodes. The feedback mechanism not only includes the inner features of the coupled system by capturing the interactions between different sectors but also the external forces or actors that drive nexus system dynamics. However, nexus thinking includes, while not being limited to FEW (Duan et al., 2019), the water–energy–food–environment nexus (Hellegers et al., 2008), the energy–water–environment (EWE) nexus (Shahzad et al., 2017), the water–power–environment (WPE) nexus (Feng et al., 2016, 2019), etc. In addition, the components of the water resources system also include the interaction between the natural hydrological cycle and human society, which can be regarded as a human–natural nexus system and is usually assessed on a watershed scale (Liu et al., 2007b). Although those nexus systems are made of different components, their common feature is that the coevolution and feedback process of such components are considered in a dynamic and integrated way.
Recently, many new technical methods based on nexus systems have emerged to deal with the problem of performances and interactions of a complex system in a more advanced and comprehensive way. Nair et al. (2014) stressed that the energy uses in an urban water system are from both water supply and wastewater and suggested that the life cycle analysis (LCA) is one of the most widely used approaches in the water–energy nexus. LCA is addressed based at the different stages of the evolution of the whole system and its components. Apart from LCA, ecological network analysis (ENA) is another systematic method that can provide a consolidated analysis for both direct and indirect flows reflected in complicated chains of production and consumption, indicating the potential to investigate the trade-off between multiple elements (Chen and Chen, 2016). The system dynamic (SD), based on the computer simulation method, is one of the most visualized approaches for analyzing information feedback systems (Forrester and Warfield, 1971). It can link different elements for analyzing the dynamic simulation under different external conditions. Its ability to dynamically simulate the system characterized by nonlinearity, multiple feedbacks, and complexity makes it popular among many scholars (Venkatesan et al., 2011; Li et al., 2018; Yang et al., 2019). Although those advanced systematic methods made decent contributions to simulating and characterizing a real system, there are still some shortcomings and limitations in applying to comprehensive water resources management including the following: (1) those methods are used to simulate the dynamic status and feedbacks in an objective way but have no inherently optimal function, which limits the goal of sustainable water uses to some extent, and (2) optimization algorithms are commonly addressed to water resources planning and allocation facing multiple water users but rarely evaluated in a dynamic way that takes other interactions into account. Therefore, coupling systematic methods of both SD and optimization approaches can integrate their advantages and further achieve the goal of accurate coordination among different water users of the nexus system.
To achieve the abovementioned goal, the objectives of this study are (1) to develop a nexus system that couples the water uses across the needs of socioeconomic development, ecological protection, and food security (WSEF) and explore its dynamic interaction and feedback loops under external changes by using system dynamic model; (2) to identify their dynamic evolution and feedback process in the perspective of sustainable water use by coupling the system dynamic (SD) model and optimization model; and (3) to identify the model uncertainty to assess the various tradeoffs for stakeholders and recognize the main factor(s) that most influences the model robustness to improve the reliability of the integrated framework.
2.1 Outlines of the integrated modeling framework
Nexus thinking is one of the crucial methods for dealing with complex systems and their dynamic interactions. Sustainable uses of water resources (i.e., water) are composed of those for socioeconomic development (i.e., socioeconomic), ecological protection (i.e., ecology), and food security (i.e., food) and their interactions (Hunt et al., 2018; Uen et al., 2018; Perrone and Hornberger, 2016; Feng et al., 2019), which is investigated as a WSEF nexus system. The external changes that affect the performances and interactions of WSEF nexus systems can be addressed by the pendulum model outlined by Kandasamy et al. (2014), who stressed that the term “pendulum swing” refers to the shift in the balance of water utilization between economic development and environmental protection. It has periodic changes that can be classified into several stages in a relatively long-term period. In short, it can be classified into the initial stage, in which productivity is about to emerge, the developing stage, in which production activities are negatively affecting the environment, and the environmental protection stage, in which environmental issues are paid great attention. The detailed description of the pendulum model can be found in Sect. S1 in the Supplement.
The external changes, which are quantified by the abovementioned pendulum model, are one of the main sources that affect the status of the entire WSEF nexus system. It not only influences the system's dynamic interactions but also starts the self-adjustment process of both the whole system and its components to attain the adaptive status. The system dynamic (SD) model is a powerful tool that simulates the dynamic interaction of the water resources system and its components. The self-adjustment process in this model can be outlined by the theory of complex adaptive system (CAS) that is first addressed by Holland (1995), who stressed that CAS is developed based on the system theory, indicating that each agent has its learning ability and stress mechanism to cope with external changes and then becomes a stronger agent through such a self-adjustment process to adapt to the change in the external environment. The self-adjustment process of each agent is essentially the optimal process, and the system optimization approach is thereby an effective tool that can quantify such a self-adjustment process of each agent.
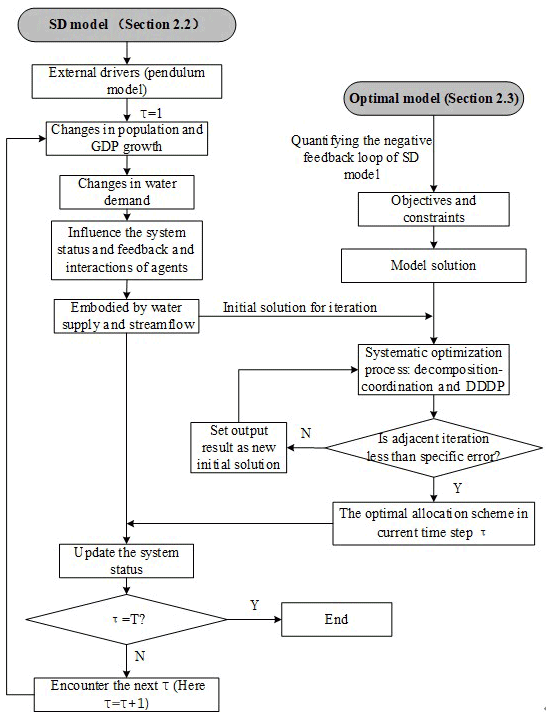
The overall research framework that couples SD and the optimization model of the WSEF nexus system is shown in Fig. 1, and a detailed model description is provided in the following sections. First, the external drivers of the whole nexus system are the changes in the development level of the socioeconomic system that can be separated into several time steps (hereafter represented by τ). Both the initial ecological streamflow and the initial water supply scheme, along with their interactions, can be simulated by the SD model under each τ. Next, the initial scheme acts as the input of the optimization model (Li et al., 2018). The SD model includes positive and negative feedback loops, and the optimization model is used to quantify the negative feedback loop of SD. The optimization result is generated by the iteration of the optimal algorithm with the initial value. The iteration process will not be terminated until the adjacent iteration result is within the specific error. Then, the optimization result will transfer back to update the system status of the current τ and start a new simulation with the next τ. If τ=T, then end the whole process; otherwise, repeat this process. Here T is the total length of simulation time. Finally, the dynamic process of the WSEF nexus system can be embodied by the trajectories of system variables connecting each τ, including water supply/demand, carrying capacity, ecological flow, crop yield, etc.
2.2 WSEF nexus system developed by SD model
WSEF nexus system includes water resources, socioeconomic development, ecological protection, and food security agents, with water resources supplying water for the other three agents. In addition, these three agents are greatly affected by water usage. Therefore, the dynamic interactions of these three agents are discussed.
2.2.1 Socioeconomic agent
The socioeconomic agent describes the regional population rate, urbanization rate, and gross domestic product (GDP). Their dynamic changing process in water recipient regions can be described within the logistic model, which can be expressed by the following differential equations (Jørgensen and Bendoricchio, 2001; Feng et al., 2019):
where N and I are population size and the total amount of GDP, and r is the natural growth rate of GDP or population. The natural growth rate can be assessed by collecting and analyzing the statistical data of the urban population, rural population, and the total amount of GDP (including primary, secondary, and tertiary industry). The water demand of socioeconomic agents can be outlined by the following:
where WDdom and WDindus are the annual domestic (including urban and rural) and industrial (including secondary and tertiary) water demand (cubic meters; hereafter m3), qdom and qindus are the domestic and industrial water usage quota, which means daily water consumption per person (liters per person per day – hereafter L/person/day) and water consumption of the industrial added value per 104 Yuan (cubic meters per million Yuan, where Yuan is the Chinese currency unit; hereafter m3/104 Yuan), respectively. It should be also noted that the economy also includes the agricultural economy. For the agricultural economy, the economic basis of farmer response is reflected by average incomes that can be expressed by the following:
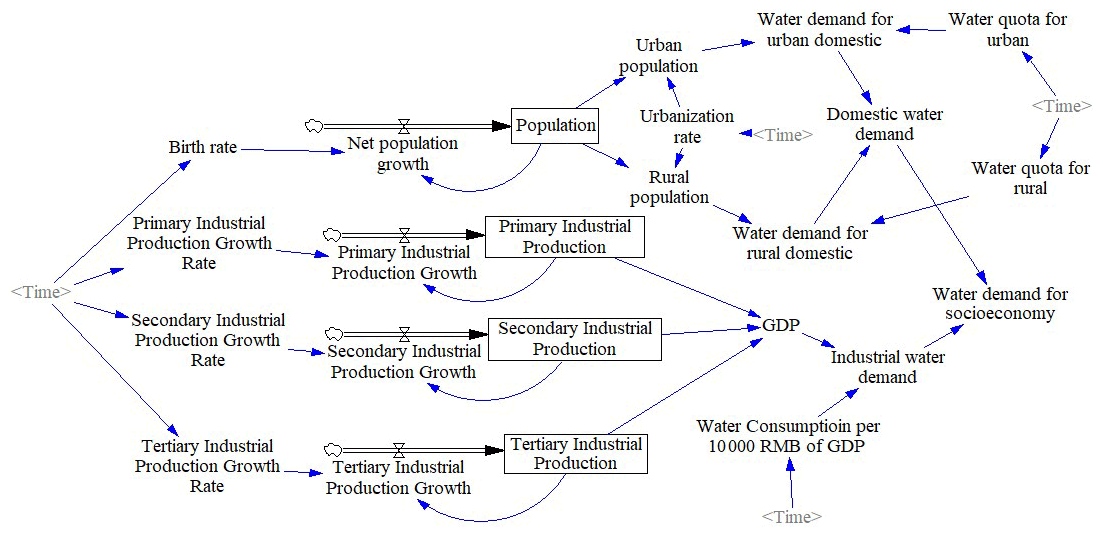
where I is the farmer's average income, Yi is the ith crop yield, and Nr is the rural population. Crop yield is a significant component of both primary industry values and can measure farmers' income because farmers sell these foods to customers and receive profits. The calculation of crop yield is shown in Sect. 2.2.3. The system dynamic model of the socioeconomic agent is presented in Fig. 2. The external changes outlined by the pendulum model are exactly embodied by the changing rate of population and GDP expressed by Eq. (1). In the scope of SD, the dynamic process of population growth can be expressed as follows:
The dynamic growth of the three industries is similar to Eq. (5). From Fig. 2, we can see that the changing population and GDP (i.e., the external drivers), will result in the changing water demand, which further affects the water supply and, eventually, the status of the entire nexus system (see Sect. 2.2.4).
2.2.2 Ecological agent
Ecological water demand includes vegetation and river streamflow. The ecological water demand of vegetation is used to maintain the physiological function of canopies. The method of evaluating the amount of vegetation ecological demand is based on their evapotranspiration that can be treated as the water gap, as follows (Shi et al., 2016; Saxton et al., 1986):
where WDveg is the vegetation water demand. Pe is the effective precipitation. ET0 is potential evapotranspiration based on the Penman–Monteith equation, and the particular variables can be seen in Neitsch et al. (2011). Ks and Kc are soil moisture and canopy coefficients, respectively, which denote the ratio of maximum water demand and potential evapotranspiration. S, Sc, and Sw are the coefficient of actual, wilting, and critical soil moisture, respectively.
For river streamflow, the Tennant method is adopted in this study, as follows:
where Weco is the ecological streamflow in the annual average level (m3), dm is the day number of month m, Qm is the observed streamflow (cubic meters per second; hereafter m3/s). Pm is the percentage of observed streamflow of the month m. It should be noted that the river streamflow calculated by Eq. (7) is just the initial value with given the s, and it will be input to the optimization model for an optimized solution.
2.2.3 Food agent
The food agent is mostly related to agricultural water usage, including crop water requirements based on phenological stages. It is also the fundamental condition of primary industry and farmer income (see Sect. 2.1.1). For crop yield, water usage is directly related to it, which is a crucial part of food security. The main water supply is provided by precipitation and irrigation. We use the crop coefficient method to estimate crop water demand based on the Food and Agricultural Organization (FAO) report no. 56 (FAO-56; Allen et al., 1998). For each crop, its growth process can be separated into several stages that have different potential crop water demands, as follows (Allen et al., 1998; Smilovic et al., 2016):
where Wp is the potential crop water demand and can also be called reference crop demand of crop i, Kc(t) is the crop coefficient of stage t for a specific crop, and t0 and tn are the first and last stages of the growth process of a specific crop. Wa is the irrigation water demand. The maximum crop yield is based on the hypothesis that the crop water supply (including precipitation) can meet Wp (Allen et al., 1998). According to FAO-56, crop growth is usually divided into four phenological stages, namely initial, development, middle, and end, and corresponds to three different crop coefficients, i.e., Kc,ini, Kc,mid, and Kc,end. For details, see Allen et al. (1998). For each crop, the crop yield is presented as follows (Smilovic et al., 2016):
where Ws,t is the actual irrigation water supply for crop i at time t, Ys and Yp are the crop yield under actual and ideal conditions (both irrigation water supply Ws and precipitation Pe can meet the crop water demand Wp), and Ky,t is the yield response factor of the crop i at time t. Due to the limitation of local water resource conditions, crop water supply is usually equal to or less than crop water demand. That is, (, and crop water supply is greatly related to crop yield. The value of is also equal to or less than one, and it takes the equals sign when the crop yield attains the maximum. In this case, the water supply also attains the maximum.
It should be noted that the agricultural and vegetation water demand in the future will be hard to predict because these demands are related to meteorological and land use variables that will require long-term global scenario analysis. Fortunately, the statistical characteristics of regional weather data are usually assumed to be consistent on a multiyear scale (Feng et al., 2019). That is, the characteristics of the future precipitation can be captured by multiannual historical data. Therefore, the average level of the water demand of a historical multiyear is proposed in this study because historical data can represent the hydrological conditions of a certain area.
2.2.4 Overall simulation of SD and system status update
The overall simulation of the SD model is to reveal the dynamic interactions influenced by dynamic external drivers and the update process. The dynamic interactions are embodied by the positive/negative feedback linkages/loops among different agents (including their water supply and demand). The update process of the SD model is reflected by some relevant variables that are greatly affected by the water supply of different agents. The relevant variables include water shortage (aiming at all agents), carrying capacity and overload index farmer income (socioeconomic agent), the deviation between ecological and observed streamflow (ecological agent), and crop yield (food agent). These variables are shown in the boxes in Fig. 3.
Dynamic interactions revealed by positive/negative feedback loop
Figure 3 outlines the overall simulation process of the SD model, including the interaction between each agent of the SD model and how the initial water supply and other variables are simulated. The symbols “+” and “−”, besides the arrows, represents the positive/negative feedback linkage, respectively. The words in gray represent the shadow variables. The feedback linkages among socioeconomic and ecological agents under external drivers are revealed as follows (the arrows in parentheses indicate the increase and decrease, respectively):
-
Population (↑) → domestic water demand (↑) → domestic water supply (↑) → ecological streamflow (↓)
-
GDP (↑) → industrial water demand (↑) → industrial water supply (↑) → ecological streamflow (↓)
-
Domestic/industrial water supply (↑) → carrying capacity (↑) → population/GDP (↑).

Here the term carrying capacity quantifies the population/GDP that can be supported by a certain amount of water. The overload index is given by dividing the predicted population/GDP by the carried population/GDP. The higher value of the overload index, the more serious the degree of overload. The feedback linkages also occur in other agents. For example, the socioeconomic agent affects the food agent and, finally, transfers back to the socioeconomic agent itself, as follows:
-
Precipitation (↑) → crop/vegetation water supply (↑) → crop yield (↑)
-
Population (↑) → food demand (↑) → crop water supply (↑) → crop yield (↑)
-
Crop yield (↑) → crop carrying capacity (↑) → population (↑)
-
Crop yield (↑) → primary industrial production (↑) → farmer income (↑) → GDP (↑).
Here the term crop carrying capacity quantifies the population size that can be supported by a certain amount of crop yield. Those feedback linkages can be expressed by the causal loop diagram (Fig. 4). The symbols + and − beside the arrow show the positive/negative feedback linkage, respectively. The clockwise arrow with a + symbol inside is a positive feedback loop, while the counterclockwise arrow with a − symbol inside is a negative feedback loop.
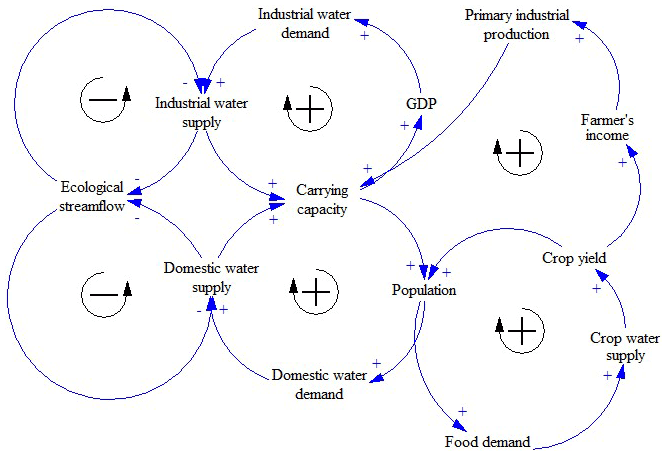
Adequate water supply is one of the most important conditions to ensure socioeconomic development and is also a prerequisite for crop yield. Therefore, in the socioeconomic agent, policymakers expect to decrease the water shortage by increasing water supply to ensure socioeconomic development, since increased population/GDP is accompanied by increased water demand (Li et al., 2019b). Then, the increasing water supply leads to an increased carrying capacity, and the population/GDP will increase again. Such a linkage can be regarded as a positive feedback loop. Similarly, in the food agent, an increased population intensifies the crop demand, and more water supply is needed to increase the crop yield, which can eventually support a greater population size. This linkage can also be regarded as a positive feedback loop. Adequate water supply can be embodied by the following equation by minimizing the water shortage ratio:
where WSj, WDj, and WSRj are water supply, water demand, and water shortage ratio for jth sector, respectively. Here j is each component of the WSEF nexus system. Crop and vegetation water supply also include effective precipitation (Pe).
It should be noted that the water supply expressed by Eq. (10) is just the expected value for policymakers. However, water for socioeconomic development and the rivers' ecological health always conflict with each other as both of them consume natural runoff. In the scope of SD, it is embodied by the negative feedback loop. That is, the increased (domestic and industrial) water supply will contribute to decreased river streamflow that deteriorates ecological health (Yin et al., 2010, 2011; Yu et al., 2017) and vice versa. To consider this issue, a certain percentage of streamflow (usually for ensuring basic flow) is the rigid constraint for the ecological agent, and the water supply considering ecological basic flow is expressed as follows:
where R and Wreuse are the natural runoff and reused water (including rainfall utilization and recycled). The water supply presented in Eq. (11) is the initial water supply simulated by SD.
Update process of the SD model
Considering that a certain percentage of streamflow is still not enough for each aspect of water use, it is worth nothing that, if the adequate water supply is ready for ensuring socioeconomic development and crop yield, the ecological streamflow will decrease. Even if the ecological basic flow is ensured, the ecological function of a river will be limited. Therefore, the optimization model is presented in this study to reveal the negative feedback loop and then achieve the sustainable water uses of each agent (see the next section) by inputting the initial simulated result of SD and iteration (Li et al., 2018). The initial simulated result is calculated by Eq. (11). Finally, the optimal scheme of the water supply and ecological streamflow is transferred back to the SD model to update the status of the current time step (as shown in Fig. 1). The update process of the SD model refers to the variables listed in Table 1. Then all the dynamic changes of each variable can be assessed. Other variables and equations can be seen in the Supplement (Sect. S2).

2.3 Optimization approach of the WSEF nexus system
2.3.1 Model conceptualization
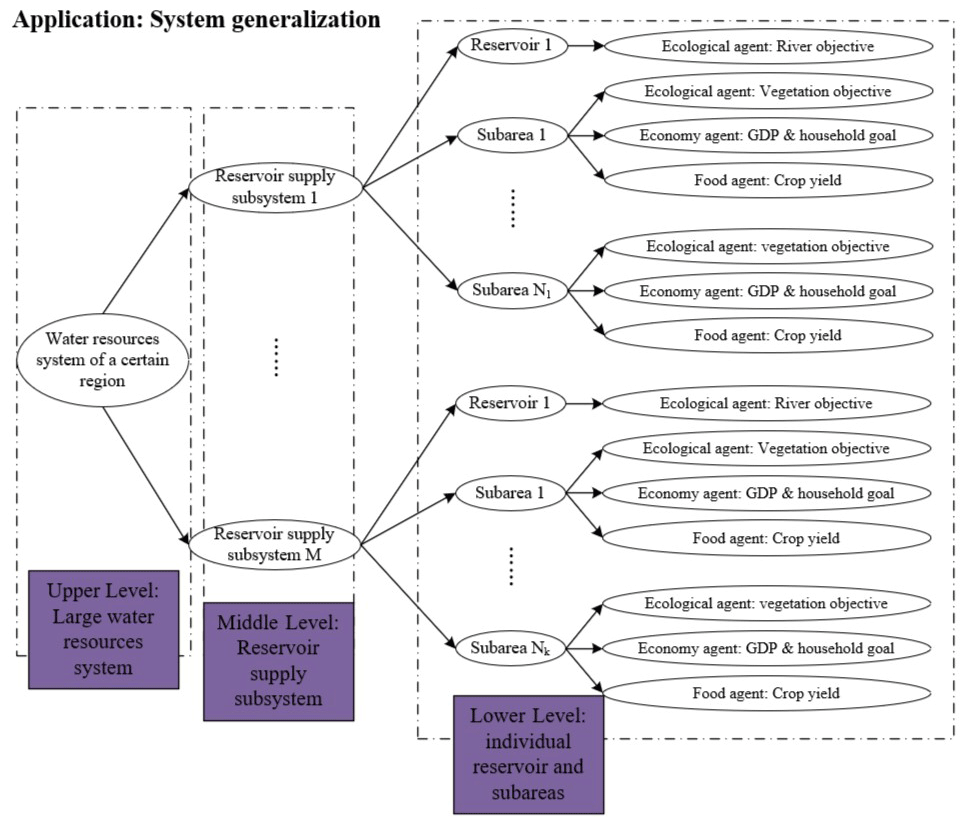
In a water system inside a watershed or a region, there are multiple water supply projects to different water users. This system in a watershed is called a large water resources system (Fig. 5a). It is subdivided into multiple sub-watersheds or subregions that are called subsystems (Fig. 5b). In this case, reservoirs can provide not only socioeconomic developments but also environmental impacts. They are constructed across the rivers for both the water supply of the whole region or watershed and to adjust the downstream river streamflow, which should be considered individually to target the rivers' ecological concerns.
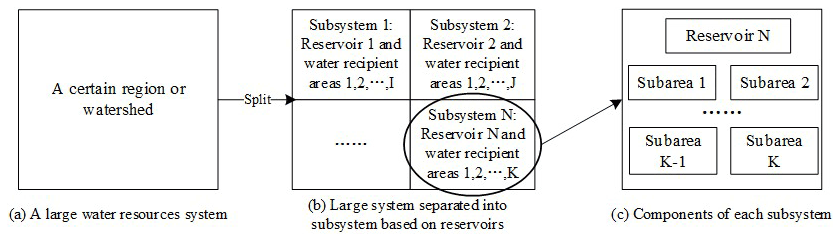
The whole system is separated into subsystems that contain one individual reservoir and several corresponding water recipient areas (Fig. 5b) as there is usually more than one reservoir in a certain region. We call these subsystems reservoir supply subsystems. Such a subsystem can be further separated into the smallest unit, namely a reservoir and each water recipient region (also called a subarea; Fig. 5c). In this way, the total system of the water resources in a certain region (watershed) can be divided into several subsystems or subareas that consist of a three-level hierarchical structure.
It should be noted that the term large water resources system is not the same thing as the framework of the WSEF nexus system presented in this study. To combine these two terms, each agent of the WSEF nexus system can be distributed to each subarea (with the objective of food, socioeconomics, and vegetation) and reservoir (river ecology; see Fig. 6). Therefore, we can coordinate these objectives to achieve sustainable development by setting up a multi-objective optimization model.
2.3.2 Objective function
-
Socioeconomic development agent
The objective of the socioeconomic agent is expressed by the minimum water shortage rate as follows:
where Fsocemy is the objective function of the socioeconomic agent. WD and WS are the total water demand and supply (including reservoirs and other water projects) of this agent. T is the time length of the reservoir operation horizon. Subscripts k and t are the number of subareas and time steps, respectively. It should be noted that farmer income affiliated with the socioeconomic agent is greatly related to crop yield. Thus, this goal will be discussed in the food agent section.
-
Ecological protection agent
Ecological protection comprises two aspects, i.e., river ecology and vegetation ecology. For river ecology, the artificial intervention in the natural flow regime is a crucial factor in the severe deterioration of river ecosystems (Shiau et al., 2013; Tan et al., 2019). It has been proved that the term amended annual proportional flow deviation (AAPFD) is used to embody the river's health degree and is used in many studies in terms of river ecology, and it is assumed that the minimum deviation between observed (natural) and actual streamflow contributes to the healthy status of a river's ecological health (Gehrke et al., 1995; Ladson and White, 1999; Liu et al., 2019; Feng et al., 2019). The objective function can be expressed as follows:
where the subscript riv represents river ecology, and QN is the observed streamflow. The variable AAPFD ranges from zero to five, and the minimum value represents the best status of the river's ecological health (Gehrke et al., 1995; Ladson and White, 1999; Yin et al., 2010). Thus, we divided it by five to normalize the objective function and make it range from zero to one. The subscripts n, m, and j are the total year number, mth month, and jth year, respectively.
Vegetation, similar to the river environment, is also an indispensable part of ecology because it produces oxygen to improve air pollution and it purifies water bodies. The abundant water supply contributes to these goals. Therefore, the objection of vegetation is expressed as follows:
where the subscript veg represents vegetation ecology.
The objective of the ecological agent is reflected by maintaining both aspects, which is reflected by the following normalized form (from zero to one):
where Feclgy is the total objective function of the ecological agent.
-
Food agent
The goal of the food agent is to maximize crop yield, and it is the indispensable condition of increasing primary industry products and farmer income. Also, food is the most fundamental prerequisite for people's survival and farmers' income. The mathematical expression is presented as follows:
where N is the total number of crops, respectively. Ya and Yp are the crop yield under the actual and ideal conditions, respectively.
The calculation of crop yield is based on the Food and Agricultural Organization report no. 56 (FAO-56; Allen et al., 1998). According to the crop yield equation based on FAO-56 (see Eq. 9), crop yield that determines farmer profit is directly related to irrigation water (FAO, 2012; Liu et al., 2002; Lyu et al., 2020). Therefore, the maximum supply of crops (including both precipitation and artificial water supply for crops) is the most critical condition for maximum crop yield. Thus, the normalized objective of the food agent can be rewritten as follows:
2.3.3 Tradeoffs between objectives
As can be seen in the objective functions, three benefits are set as being the minimum (Eqs. 12, 13c, and 14b), which may contribute to the conflict between objectives. The tradeoffs across the WSEF nexus can be reflected by Pareto frontier that can describe a set of non-dominated optimal solutions that any one of these three objectives are unable to improve on unless other objectives are sacrificed (Reddy and Kumar, 2007; Feng et al., 2019; Beh et al., 2015; Burke and Kendall., 2014). We can reclassify all the water users from each of the three agents into two categories, i.e., Instream and off-stream water users (Hong et al., 2016). River ecological water demand can be regarded as an instream water user, and all others can be considered as off-stream water users. Therefore, according to the objective function expressed by Eqs. (12), (13c), and (14b), the weighted objective function can be rewritten by the following:
where () is off-stream water users, and Friv is the instream water user. The subscript j is the index of the off-stream water users, respectively. j=1, 2, 3 represents socioeconomic, food, and vegetation water usage, which corresponds to the subscripts socemy, eclgy, and food. α and θ are weight factors, and . Previous literature has demonstrated that the optimal solution, shaped like Eq. (15), is Pareto optimal because of the positive weights and concave objectives, and the non-dominated sorting process is used to find the optimal solution of Eq. (15) because the characteristic of either concave or convex is difficult to prove (Marler and Arora, 2009; Feng et al., 2019; Goicoechea et al., 1982; Zadeh, 1963). For each given combination set of α and θ, the optimal solution can be attained by decomposition–coordination (DC) principle and discrete differential dynamic programming (DDDP; see Sect. 2.3.5).
The tradeoff across objectives is reflected in the values of multiple sets of weighting factors, r=(α1, α2, α3, θ)T, revealing different decision-makers' preferences. Considering that contradictions also occur in off-stream water users, the balanced priority should be addressed to consider each off-stream water user (Casadei et al., 2016), that is, . Therefore, the tradeoff and decision preference between instream and off-stream is reflected by the different values of θ (). The larger value of θ represents more concerns about river ecology. In this study, the parameter θ is initially set as 0.5 to give equal consideration to both instream and off-stream water usage. It should be noted that this weight combination is one possible set that considers the equal use of instream and off-stream water uses, and different weights of the weighting factor reveal the preferences of stakeholders. Different vectors of r can affect the performance of the WSEF nexus and are used to assess the uncertainty and robustness of the model to improve its reliability (see Sect. 5.2 and 5.3).
2.3.4 Constraints
The model constraints include the connection of subsystems, the water balance equation, and the upper and lower limits. The details are found in Sect. S3.
2.3.5 Overall model solution
The WSEF nexus system of water resources sustainability is a compound system that is classified into multiple hierarchical structures (Fig. 6). Therefore, the model solution of this structure should be solved by systematical analysis techniques. In this study, we use the decomposition–coordination (DC) method to solve this model. The core procedure of this method comprises the following two parts: first, the large system is decomposed by several subsystems (i.e., reservoir and recipients) using the Lagrangian function, considering the interrelations between subsystems, and its coordination process is performed by coordination variables, and second, the optimization process using the discrete differential dynamic programming (DDDP) method of each subsystem. In fact, for each subsystem, traditional dynamic programming (DP) is applied in this study. However, traditional DP is susceptible to the curse of dimensionality in which the increased calculation time caused by high dimension would be beyond the computer's memory. Therefore, the improved DP, which is called DDDP (Larson, 1968), is used to solve the problem. For details, see Sect. S4. The monthly historical streamflow observations with the length of decades are the important model input for the DDDP method (i.e., subscript t in the variables of the entire optimization model), assuming that the characteristics of future streamflow are captured by the historical data (Feng et al., 2019). The detailed descriptions are found in Sect. S4. The entire procedure for the overall framework of the model is outlined below.
- Step 1.
-
Initialize the parameters, including initial reservoir storage, water recession coefficient, the total amount of water resources of the recipient area, etc.
- Step 2.
-
Calculate the initial water supply of each subarea and reservoir streamflow at τ=1 (set as S0) for each reservoir supply system. These variables can be simulated by the SD model (see Sect. 2.2.4 and Table 1).
- Step 3.
-
Use the DDDP algorithm to optimize each subsystem decomposed by the Lagrangian function with coordinate variables. The expression of coordinate variables is the function of the initial scheme, which is shown in Sect. S4. To use DDDP, the width of the corridor is given (set as ΔI), and the traditional DP is optimized within ΔI. Mark the result generated by DP (include both the water supply, i.e., WS, and river ecological streamflow, i.e., Weco) generated by DP as S1. If , go to the next step; otherwise, repeat this step.
- Step 4.
-
Narrow the width of the corridor and continue the DP process, and set Si as the optimal result, where i is the iteration number. If , go to the next step; otherwise, repeat this step.
- Step 5.
-
Update the coordinate variables and compare them with the initial coordinate variables. If the error is within ε, the optimal solution (i.e., water supply and streamflow) will be generated; otherwise, repeat steps 3–5.
- Step 6.
-
Optimize the next reservoir supply subsystem by repeating steps 2–5, and the summary of each subsystem is the global optimal solution.
- Step 7.
-
Find the optimal result in step 6 under τ=1, and prepare to encounter the next time step (τ=2) of external drivers by repeating overall procedures until τ=T.
2.4 Sustainable development degree (SDD) assessment
The evaluation index system used in this study as the WSEF nexus system includes different agents, and each agent includes several variables. The water resources agent is used to supply water for other agents, and other agents are the key factor influencing the sustainable development degree. Therefore, we selected the indicators listed in Table 2 based on the three agents, and these are used to evaluate the impact of sustainable development.
Table 2Sustainable development evaluation index system of three agents.
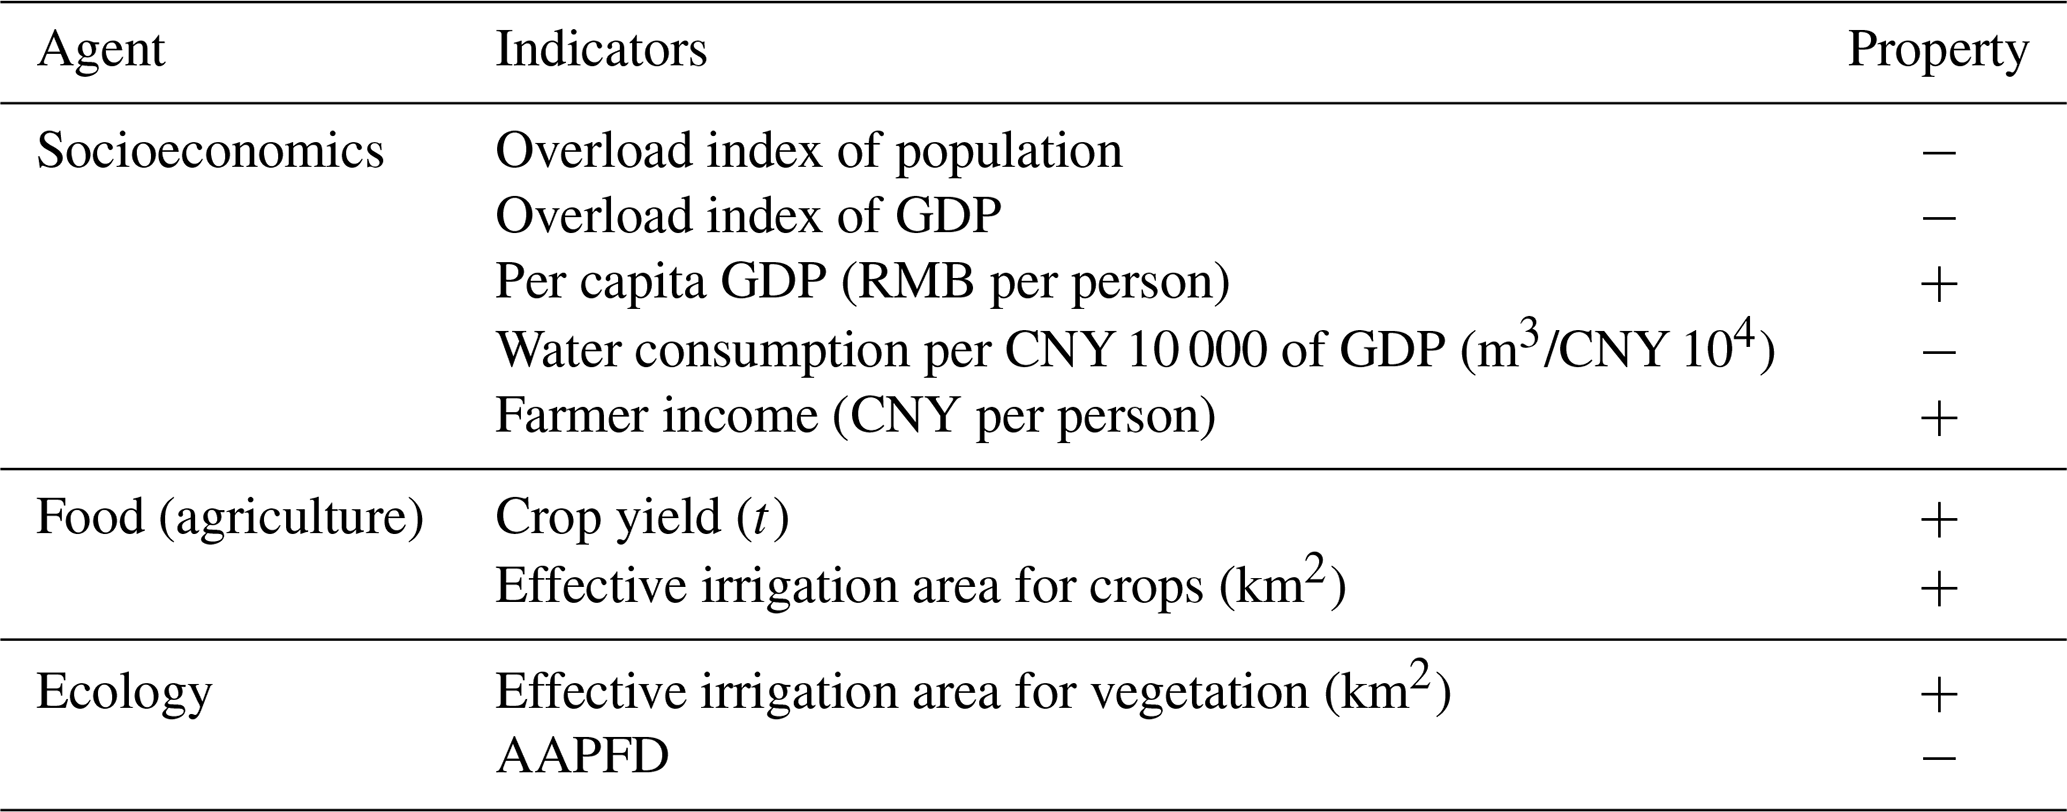
The property (+; −) of the indicators denotes positive and negative indicators, respectively. The positive/negative indicators mean they have positive (negative) impacts on the corresponding agent and were termed as being a development/constraint index (Yang et al., 2019). Considering that the ranges of indicators listed in Table 2 are different, they should be normalized before evaluation. The normalization of the positive and negative indicators is shown by Eq. (16a) and (16b).
where xij and yij are the original and normalized indicators of j in sample i, and m is the total number of samples. The entropy weight method is then adopted to calculate the SDD, which calculates the information entropy of indicators that reflect their relative change degree on the whole WSEF nexus system (Wang et al., 2019). The information entropy of indicator j in sample i is expressed by the following:
Finally, the entropy weight of each indicator is expressed by the following:
where n is the total number of indicators in a certain agent.
The SDD is calculated based on the coupling coordination degree (Sun and Cui, 2018), which reflects the degree of coordination of various factors or subsystems. In this study, SDD is calculated based on the coordination of three agents and expressed by the following:
where SOCEMY(t), ECLGY(t), and FOOD(t) are the coordination degrees of the socioeconomic, ecology, and food agents, respectively, and, in the following:
where P, Q, and R are the total indicator numbers for socioeconomic, ecology, and food agents.
3.1 A brief description of the study area
The Guijiang River basin (GRB) is one of the most important branch basins of the Pearl River basin (PRB) in southern China. PRB belongs to the typical karst area and is the second-largest river basin in China in terms of total runoff and also the third-largest river basin in terms of total area. The upper reach of Guijiang River basin (UGRB) (24∘6′–25∘55′ N, 110–111∘20′ E) is selected as a case study as it represents the conflict between socioeconomic growth and ecological protection in karst areas. Furthermore, reservoirs are widely constructed in the UGRB to supply water for socioeconomic reasons but are likely to deteriorate the river's ecological health by alternating the natural flow (Yin et al., 2010, 2011). The UGRB is also a karst area with a total area of 13 131 km2, with about 3 million people. Also, the UGRB has a total crop planting area of about 2400 km2, a total vegetation area of about 3700 km2, and a yearly average precipitation of about 1600 mm. The UGRB is located in Guilin city and refers to eight administrative regions (or counties). A total of seven reservoirs have been constructed in the UGRB to provide water resources support and maintain the socioeconomic development. The detailed parameters of the seven reservoirs and their three-level hieratical structure, including subareas, are found in Sect. S5. Guilin city is both a heavy industrial city and a major tourist city, and the population and economic development is expected to continue to increase rapidly in the short term. It will exacerbate the conflicts between social development, food security, and environmental protection, especially for the water use of the river's ecological environment, resulting in a severe ecological deterioration of the lower Guijiang River basin and even lower PRB. Therefore, how to achieve coordination and sustainable development in UGRB between these aspects will become a challenging problem in the upcoming years, and it is necessary to find solutions.
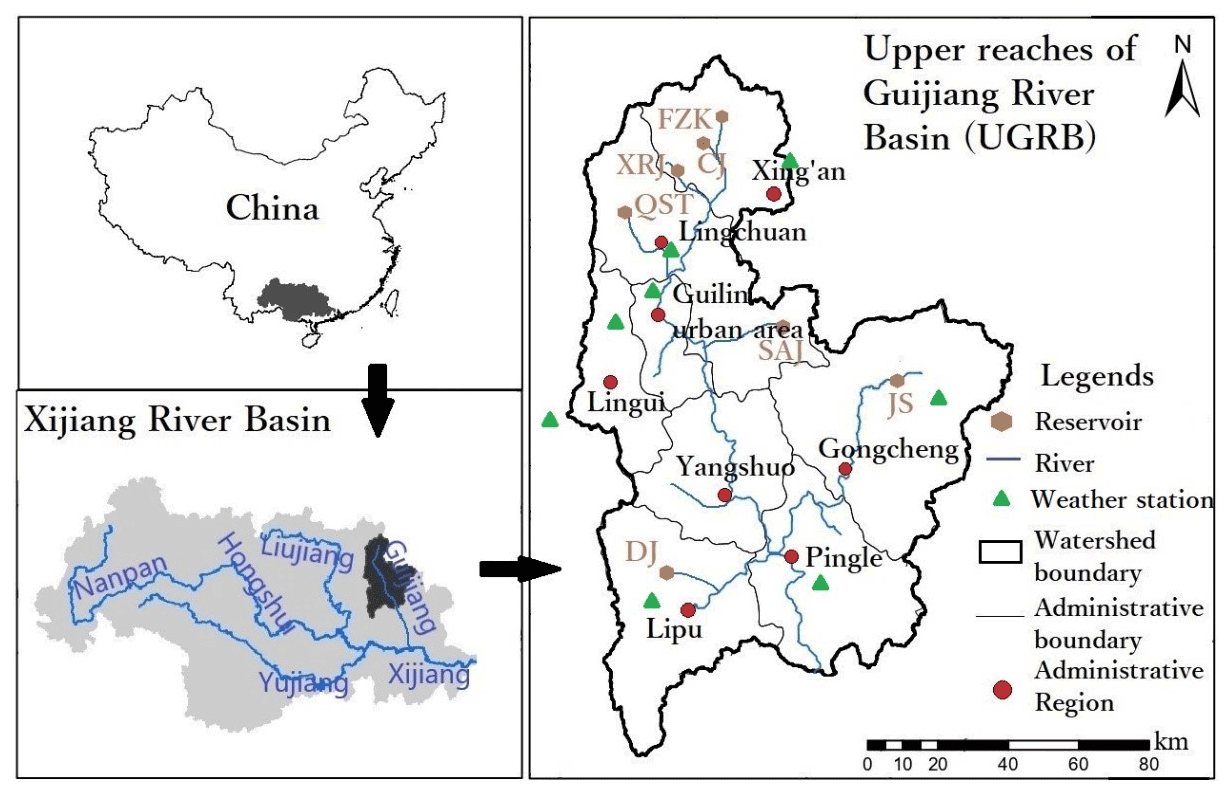
Figure 7A brief location of UGRB.
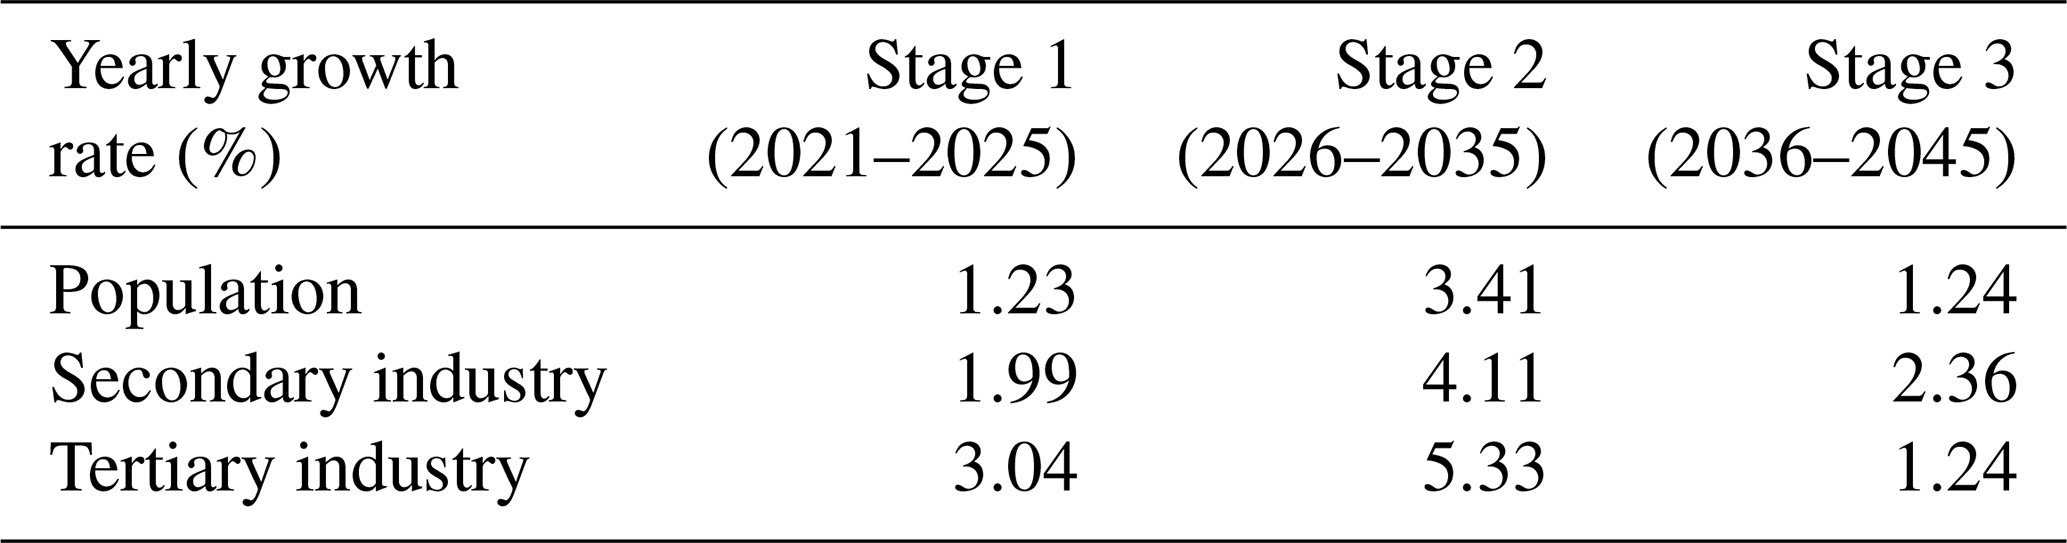
3.2 Data sets and parameter initialization
Data sets of the case study include socioeconomic, water use, land use, meteorological, and hydrological data. The major sources of socioeconomic data, including population and GDP, are the statistical yearbooks of both Guilin city and Guangxi autonomous region from 2005 to 2019. The municipal government of Guilin city (MGGC) has predicted the population and GDP until 2045, along with per capita water use from the water industry standard of the People's Republic of China, to predict the water demand of socioeconomic agent (Venkatesan et al., 2011). These predicted socioeconomic indexes are exactly the external drivers of the whole integrated modeling framework (see Sect. 2), and the corresponding growth rate in different stages is shown in Table 3. Water use data include historical water usage and the total water amount found in the Guilin water resources bulletin (2005–2019). Land use data contain the spatial distribution of crops and vegetation, with a resolution of 1 km×1 km that can be found in the Resource and Environment Data Cloud Platform of the Chinese Academy of Sciences (REDCP-CAS). The crops in the study areas are mainly corns, rice, and vegetables, and their crop coefficients are found in FAO-56 (the detailed values are found in Sect. S6). Meteorological data from 1956 to 2013, including daily average wind speed, sunshine duration, maximum and minimum temperature, relative humidity, and precipitation, are found in meteorological stations. The hydrological data from 1958 to 2013, including the monthly inflow of each reservoir, can be found in the hydrological stations for the input of the optimal algorithm. All the initialized parameters and the total index of the data sources can be found in Sect. S6.
Table 3External drivers (i.e., socioeconomic changes) of the entire research framework based on the pendulum model.
4.1 Model calibration and validation
Before the model can be simulated, the main parameters in this model should be calibrated and validated. The historical data of socioeconomic and water usage from 2012 to 2016 are used to calibrate the model, while the data from 2017 to 2019 are used to validate the model. Domestic, industrial, and agricultural water use from 2017 to 2019 are calculated by calibrated results and are used to validate the model by comparing them with their observed value. The calibration and validation results are shown in Sect. S7, and from the validation result, we can see that the relative error of domestic and industrial water use is around 1 %, while that of agricultural water use is less than 2 %, which can reveal the general situation of the current area.
4.2 Coevolution process of WSEF nexus
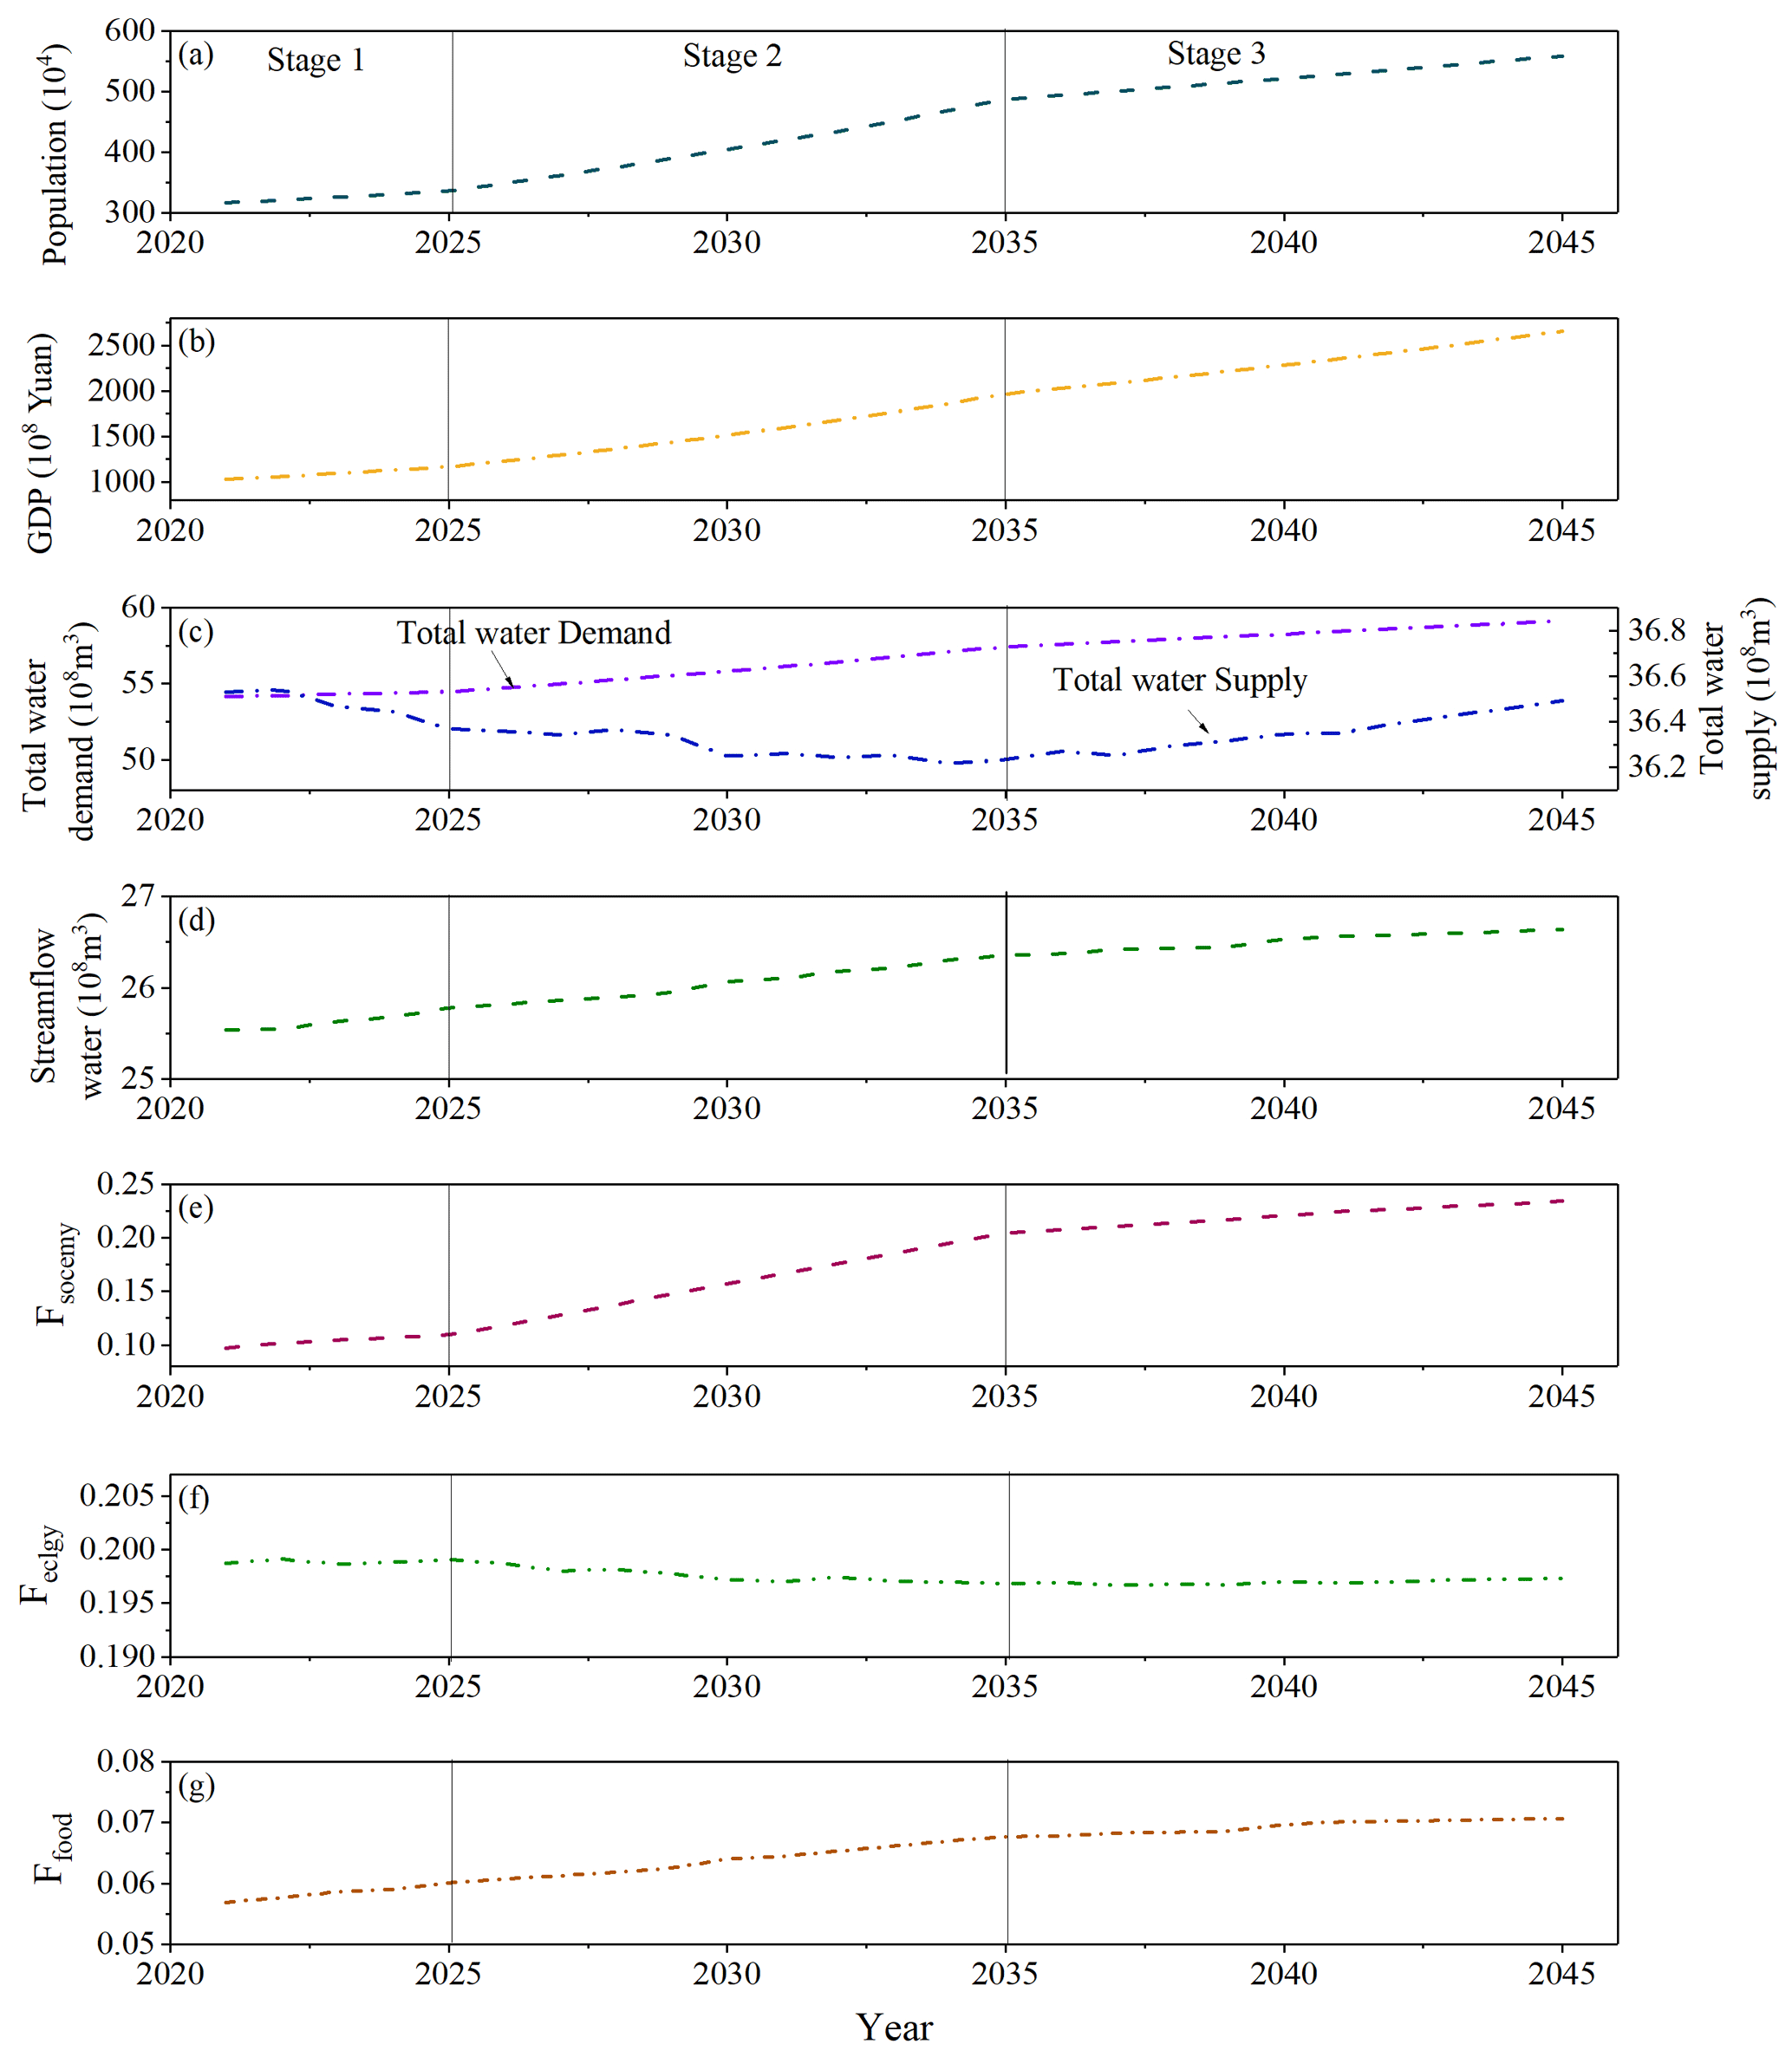
The coevolution trajectories of population, GDP, water supply and demand, streamflow, and objective function (Fsocemy, Feclgy, Ffood; based on Eqs. 12, 13c, and 14b) refer to each component of the WSEF nexus, as shown in Fig. 8. As can be seen in Fig. 8, the coevolution process of all the items depicts the characteristics of the different stages. Then, the (quasi-)stable state is converged, i.e., the variations in each variable are small or close to zero. This happens because the rate of external changes in the last stage (i.e., economic indexes) is much lower than in the previous stage, which decreases the internal changes (i.e., streamflow water and three objective functions). In the first stage, the growth rate is relatively low and is based on the historical data, and the growth rate of Fsocemy, Feclgy, and Ffood is also slow. When entering the second stage, the economic growth will lead to increased water demand. However, according to the achievement of sustainable development based on the optimization model, ecological concerns should not be neglected. Therefore, the increase in river streamflow will also be driven by the optimization model to maintain the river's ecological health, consequently reducing the total water supply and increasing the water shortage of water users (Fig. 8c). As Ffood and Fsocemy can reflect the water shortage of the corresponding water users, their value will also increase sharply (Fig. 8e and g) due to the rapid increase in socioeconomic indexes. When entering the last stage, the development of socioeconomics will tend to be stable, and the increasing speed of Ffood and Fsocemy will decrease compared with that in the second stage. This is because the relatively stable development of socioeconomics does not need too much of an increase in streamflow water (i.e., the increasing rate of streamflow water is closed to a relatively stable state), and consequently, both changing rates of water supply and demand tend to be stable (Fig. 8c).
We can also see that the off-stream water supply system competes for the instream ecological system. As shown in Fig. 8, especially in stage 2, increased streamflow is accompanied by increased Fsocemy and Ffood (Fig. 8e and g), reflecting the decreased satisfaction degree of the water supply of socioeconomics and agriculture, thereby revealing the competition use between instream and off-stream water uses. The tradeoff between instream and off-stream water users can be obtained by the optimization model to solve for the best coordination status between them by adjusting economic development modes and balancing the priority of each water user. It should be noted that the ecological objective (Feclgy) is in a relatively stable status in all stages compared with other objectives (Fig. 8f). This is because the ecological agent contains not only river streamflow but also the vegetation. The booming economy drives the optimization model to focus more on rivers' ecological health (Friv), and there are limited water resources for off-stream water users, including vegetation. The dual effect of increasing streamflow water and decreasing water for vegetation makes the Feclgy relatively stable. However, the optimization model takes the effect that the optimal allocation scheme is obtained by shifting streamflow water because instream and off-stream water use is intrinsically conflicted with each other and should be coordinated by adjusting different weights of each component (see Sect. 5.2 and 5.3).
4.3 Dynamic interactions of WSEF nexus system
4.3.1 Socioeconomic–ecology response linkages
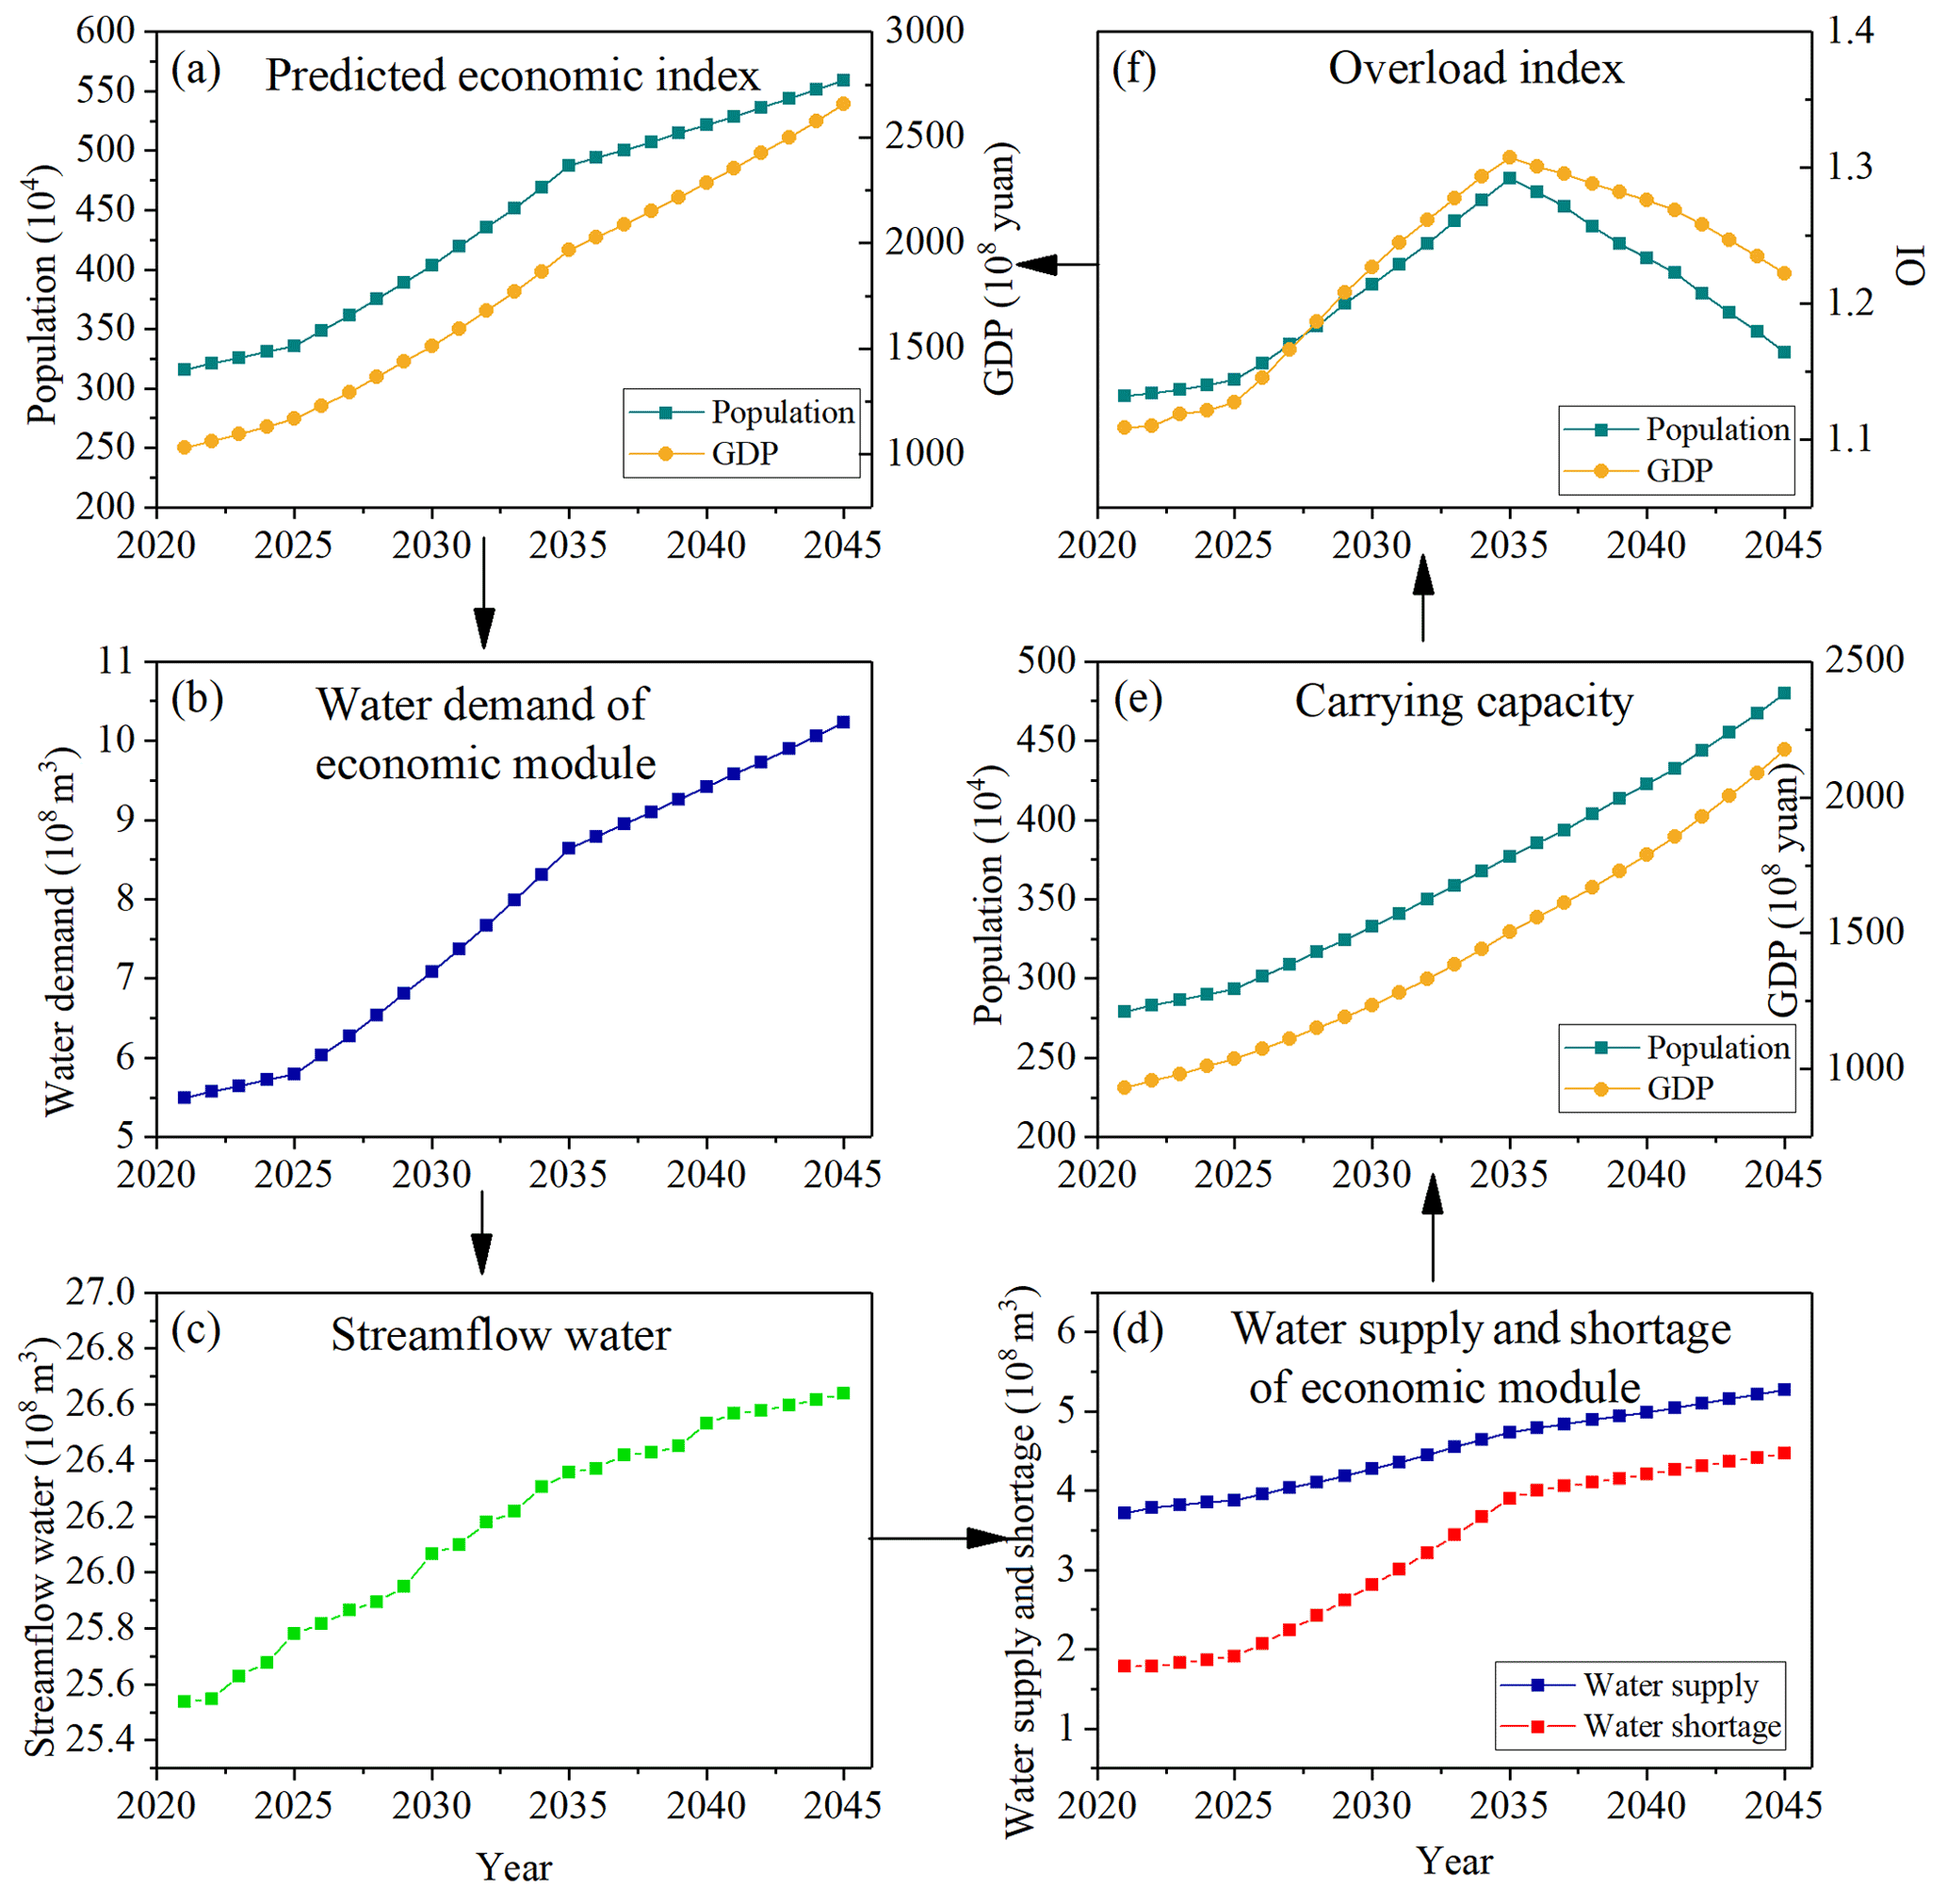
Figure 9 illustrates the loop of socioeconomic–ecology feedback. As demonstrated in Fig. 9, the response linkage of carrying capacity and overload index involves the changes in economic indexes, water supply and demand, and streamflow water (Feng et al., 2019). At the beginning, the economy is still increasing slowly, and the increasing rate of water demand is also slow. The population and GDP are near the carrying capacity in this stage (i.e., the value of the overload index is near 1). In the following stage, both increasing population and GDP intensify the water demand (Fig. 9a and b). To satisfy socioeconomic development demands, the water supply of the economic agent has also increased. However, there will be more significant concerns about the river's ecological system (Figs. 8d, 9c) because ecological streamflow is an important part of sustainable water use and is simulated by the optimization model. In this view, the growing rate of the water supply of domestic and industry (Fig. 9d) will be less than the growth rate of water demand (Fig. 9b), and therefore, this contributes to the increasing water shortage, which is in accordance with the performance shown in Fig. 8e. The increasing water shortage will generate a gap between carrying capacity (Fig. 9e) and predicted economic indexes (Fig. 9a). Then, the overload index will further increase, consequently affecting socioeconomic development. It further contributes to the overload of the WSEF nexus system, which even restricts the socioeconomics instead. In the last stage, as the growth rate of population and GDP alleviates (Fig. 9a), there will be a relatively slower increase rate of streamflow water, and there will be more water space for socioeconomic development. Although the water shortage is increasing, its rate is lower than that in the second stage. The carrying capacity will be able to catch the predicted economic index if the stable or slower growth rate continues. The overload index is also decreased (Fig. 9f), and the whole system tends to be stable. This response linkage indicates that the excessive population and GDP growth will eventually lead to increased overload status by increased ecological streamflow, and moderate socioeconomic growth will promote the best status of both each agent and the entire WSEF nexus system and, eventually, promote sustainable water use.
4.3.2 Ecology–food response linkages
Another performance is the ecology–food response linkage, as shown in Fig. 10. It not only illustrated the linkage between crop and ecological water usage but also demonstrated the coevolution of ecology components of both instream (river ecology) and off-stream (vegetation) aspects. Figure 10 shows that the increased streamflow water is the driving force of the ecology–food response. However, the increasing streamflow of water was driven by the rapidly increasing socioeconomic scale. The optimization model is used to achieve the goal of sustainable development to balance the needs of different users, especially that of instream and off-stream. The increased streamflow has two effects on the ecology–food response linkage. First, the variable Friv describes the ecological health of a certain river. According to the definition of AAPFD, a higher value of streamflow water indicates a lower value of Friv, which indicates that the river ecology is improving. Second, the increasing streamflow water restricts the water supply of all off-stream water users, including agricultural and vegetation water (Fig. 10b). Irrigation and vegetation water use is the largest off-stream water consumer, and their increased water shortage was also driven by increased streamflow water (Fig. 10d).
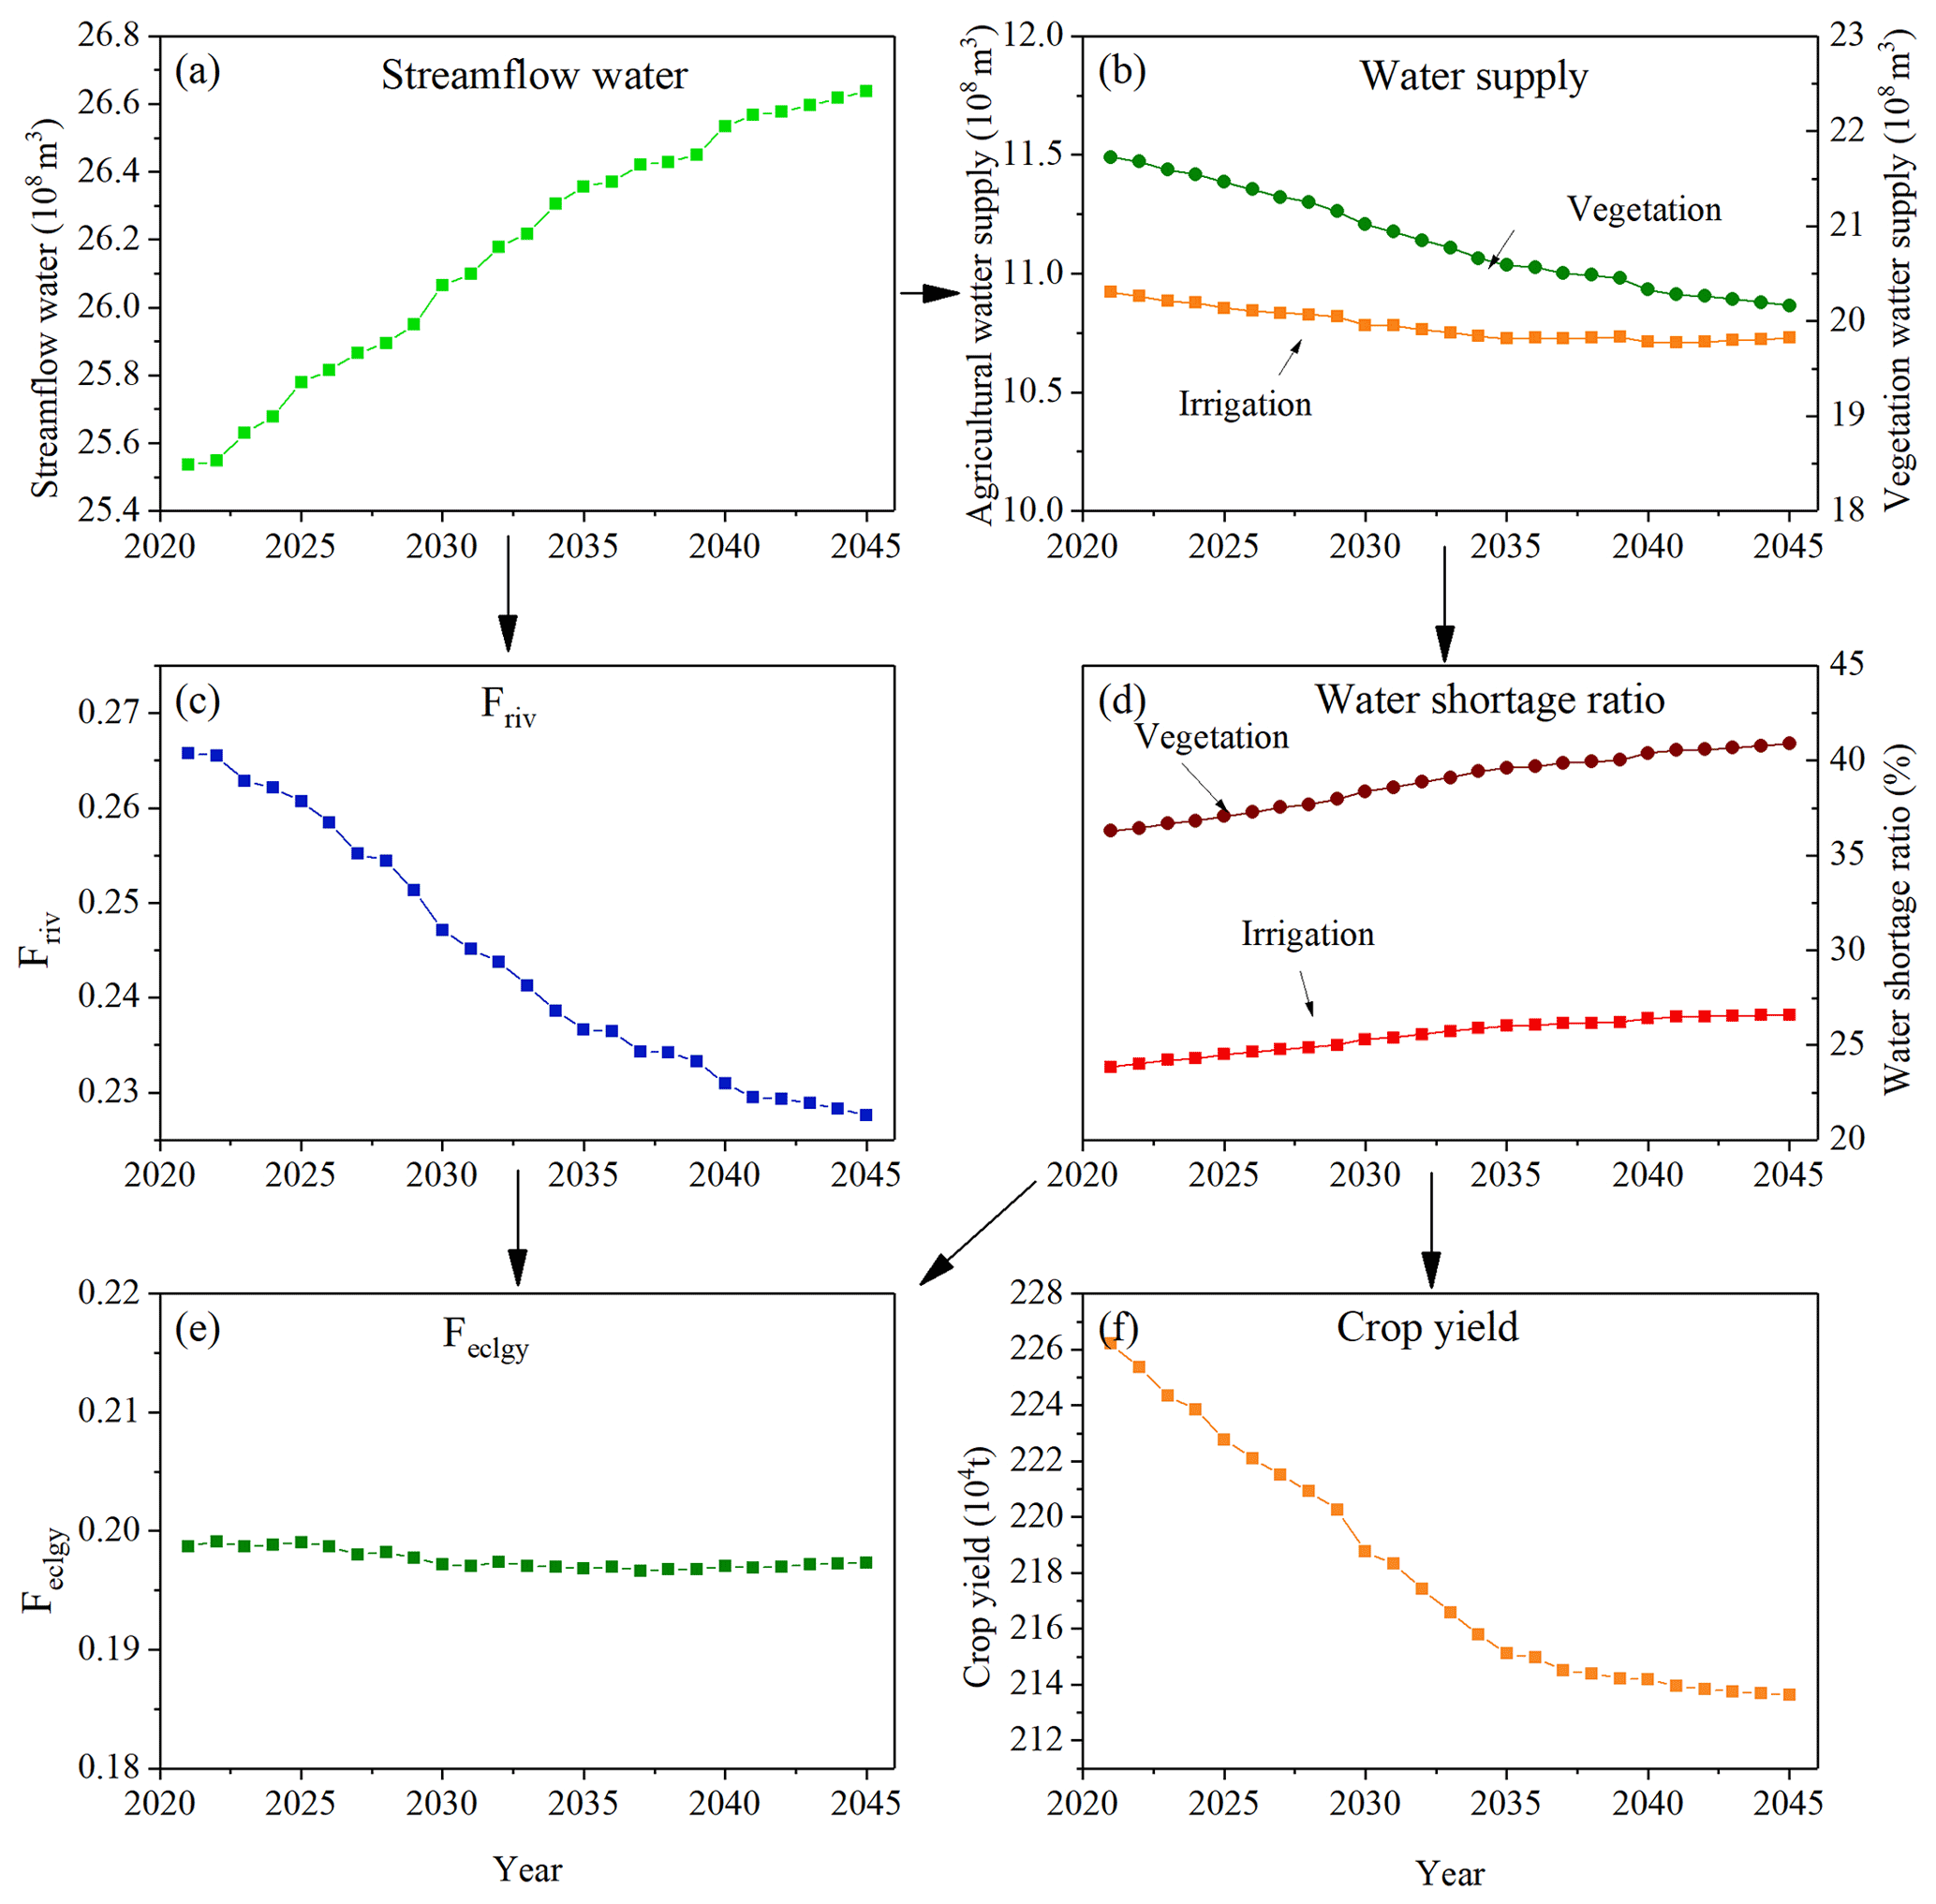
For the ecological agent, the dual effect of increased streamflow water and decreased vegetation water makes the stable change of Feclgy (Fig. 10e), indicating that the ecological aspect of the UGRB is maintaining a good status. For the food agent, crop yield is strongly affected by the satisfaction degree of irrigation water, and an increased shortage of crop water will, therefore, indicate a decrease in crop yields (Fig. 10f). But it tends to be stable in stage 3 because of the slower growth rate of the socioeconomic index, which contributes to the stable changing trend of streamflow water and further contributes to the stable changes of crop yield.
4.3.3 Socioeconomic–food response linkage
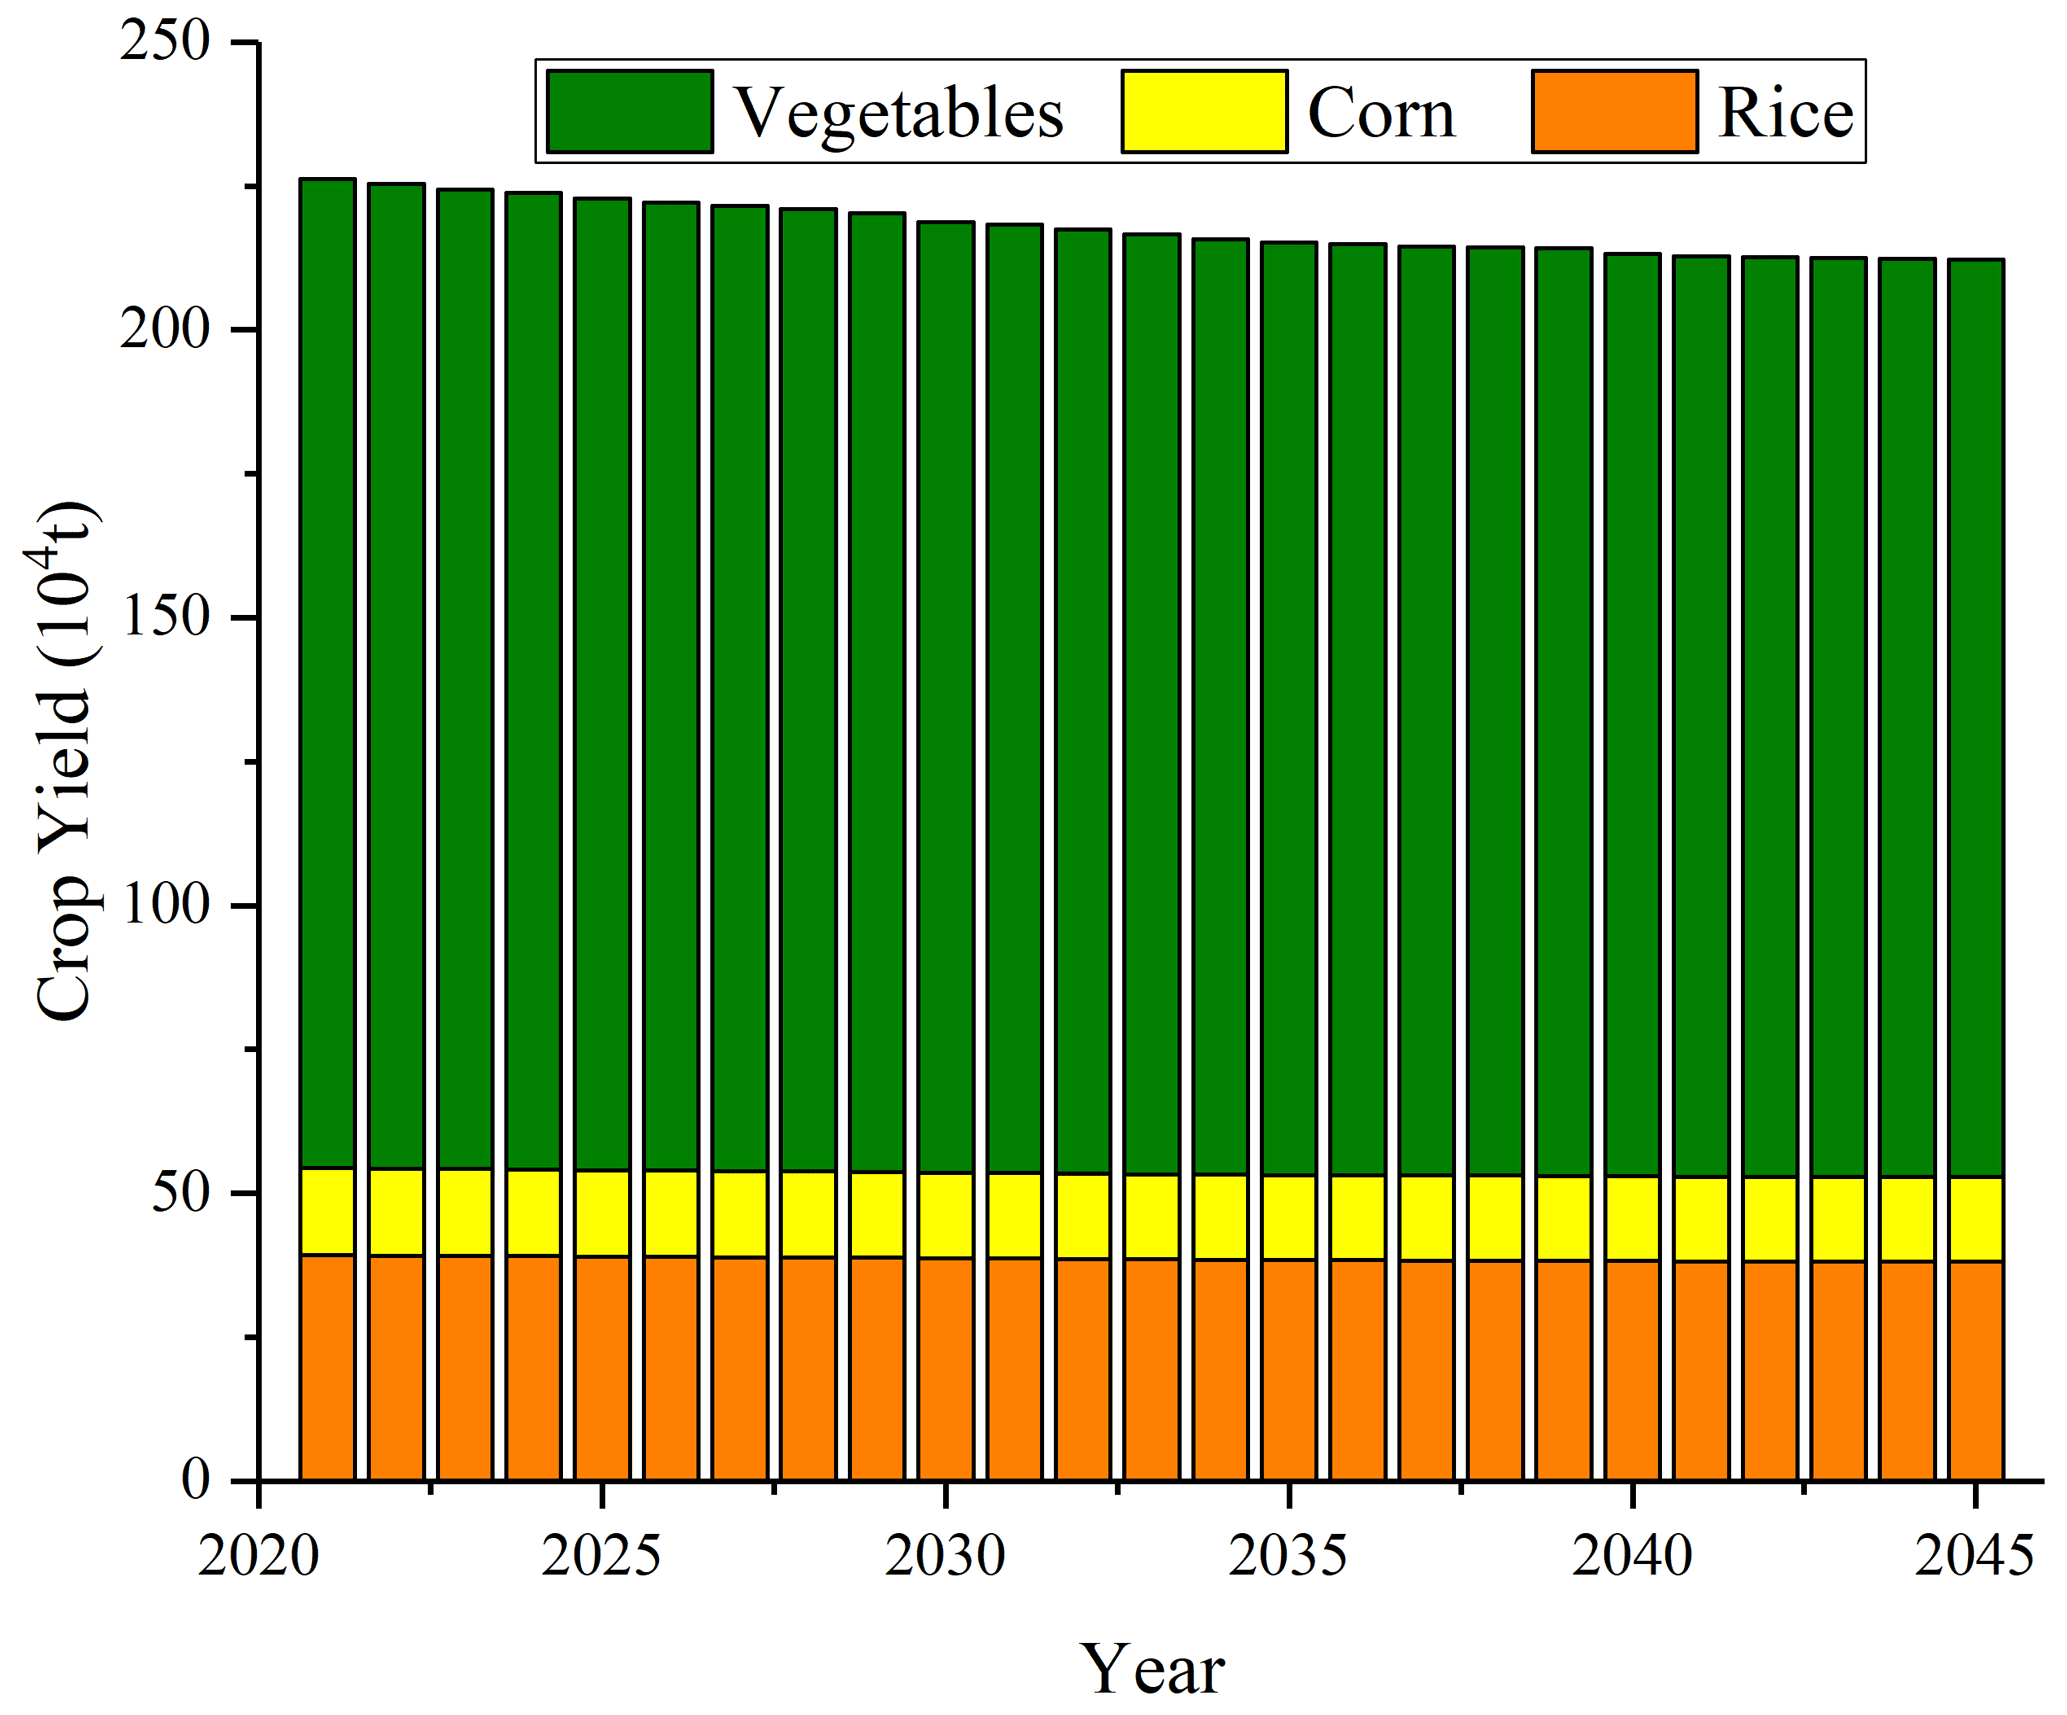
Because food security ensures that people survive, decreased crop yield is driven by increased streamflow water that also causes an increasing overload index (Fig. 9f) in the second stage, which is reflected by the socioeconomic–food response linkage (Fig. 12). The detailed crop yield is shown in Fig. 11. Due to the sharp increase in population and GDP, the increased water shortage of agricultural water contributes to the decreased crop yield (Fig. 12b), which also results in the stagnant farmer income (Fig. 12c). The increased water shortage happens because of the socioeconomic–ecology linkage, and the increased ecological streamflow reduces crop water supply. The stagnant farmer income is the result of the dual effect of both the decreased crop yield and the increased population. The total value of the primary industry is considerably related to crop yield. The reduced crop yield increases the crop price, but its rate is still less than the rate of population growth. As crop yield and income are closely related to the survival of the people, the stagnant income and decreased crop yield will finally decrease the carrying capacity and further intensify the overload index (Fig. 12d). If the growth rate of the predicted population decreases (stage 3), there will be less pressure on the water supply, and this can balance the agricultural and streamflow water well, further contributing to a stable crop yield, increased farmer income, and decreased overload index. Hence, how crop yield affects socioeconomics in this linkage can be embodied by the following three aspects: first, the decreased crop yield may lead to a food crisis to some extent, which contributes to decreased population because of the limited access to food; second, the main source of a farmer income is the total value of the primary industry, which is directly embodied by yield, and less income caused by decreased crop yield make it hard for a farmer to survive; and third, the decline in population also decreases the labor force, which also hinders socioeconomic development.
So far, the linkage of socioeconomic–food, socioeconomic–ecology, and ecology–food were all presented, which indicated that the three components interact with and respond to each other.

4.4 Assessment of the coordinative degree of each subsystem and SDD
The calculation result of the SDD of the WSEF nexus and coordination degree of the socioeconomic (SOCEMY), ecology (ECLGY), and food (FOOD) is demonstrated in Fig. 13. We can see that the variation in the four variables is also showing the state characteristics. The SOCEMY in the first stage is increasing, but it either had an decreasing (UGRB, Guilin urban area, Lingui, etc.) or stable (Xing'an and Yangshuo) trend in the second stage, indicating that the coordinative status of socioeconomics is not good and that it is caused by the excessive growth rate of the economy. The decreased coordinative status of the socioeconomic subsystem also influences other subsystems and the SDD of total WSEF nexus, as reflected by the decrease in ECLGY, FOOD, and further SDD. Fortunately, the decreasing rate of ECLGY is smoother compared with that of FOOD, indicating that the performance of the ecology of UGRB is relatively good compared with socioeconomics and agriculture. This performance could be due to the dual effect of increasing streamflow water and decreasing vegetation irrigation. The same was true for other administrative regions of UGRB. Moreover, for the whole basin, the value of SOCEMY in the later period of the second stage (about 2033–2035) is even lower than FOOD and ECLGY. From the perspective of administrative regions, it is more obvious in the Guilin urban area and the Pingle and Lipu counties. It happens because the economically stressed stage lasts almost 10 years in 2035, which is similar to the pendulum model that takes the effect that the pendulum swings towards the economically stressed system (see Sect. 2.1). As the socioeconomic index increases sharply and continuously, the ecological protection mechanism will also be continuously triggered to increase the overload index, resulting in both SOCEMY and SDD reaching the minimum.
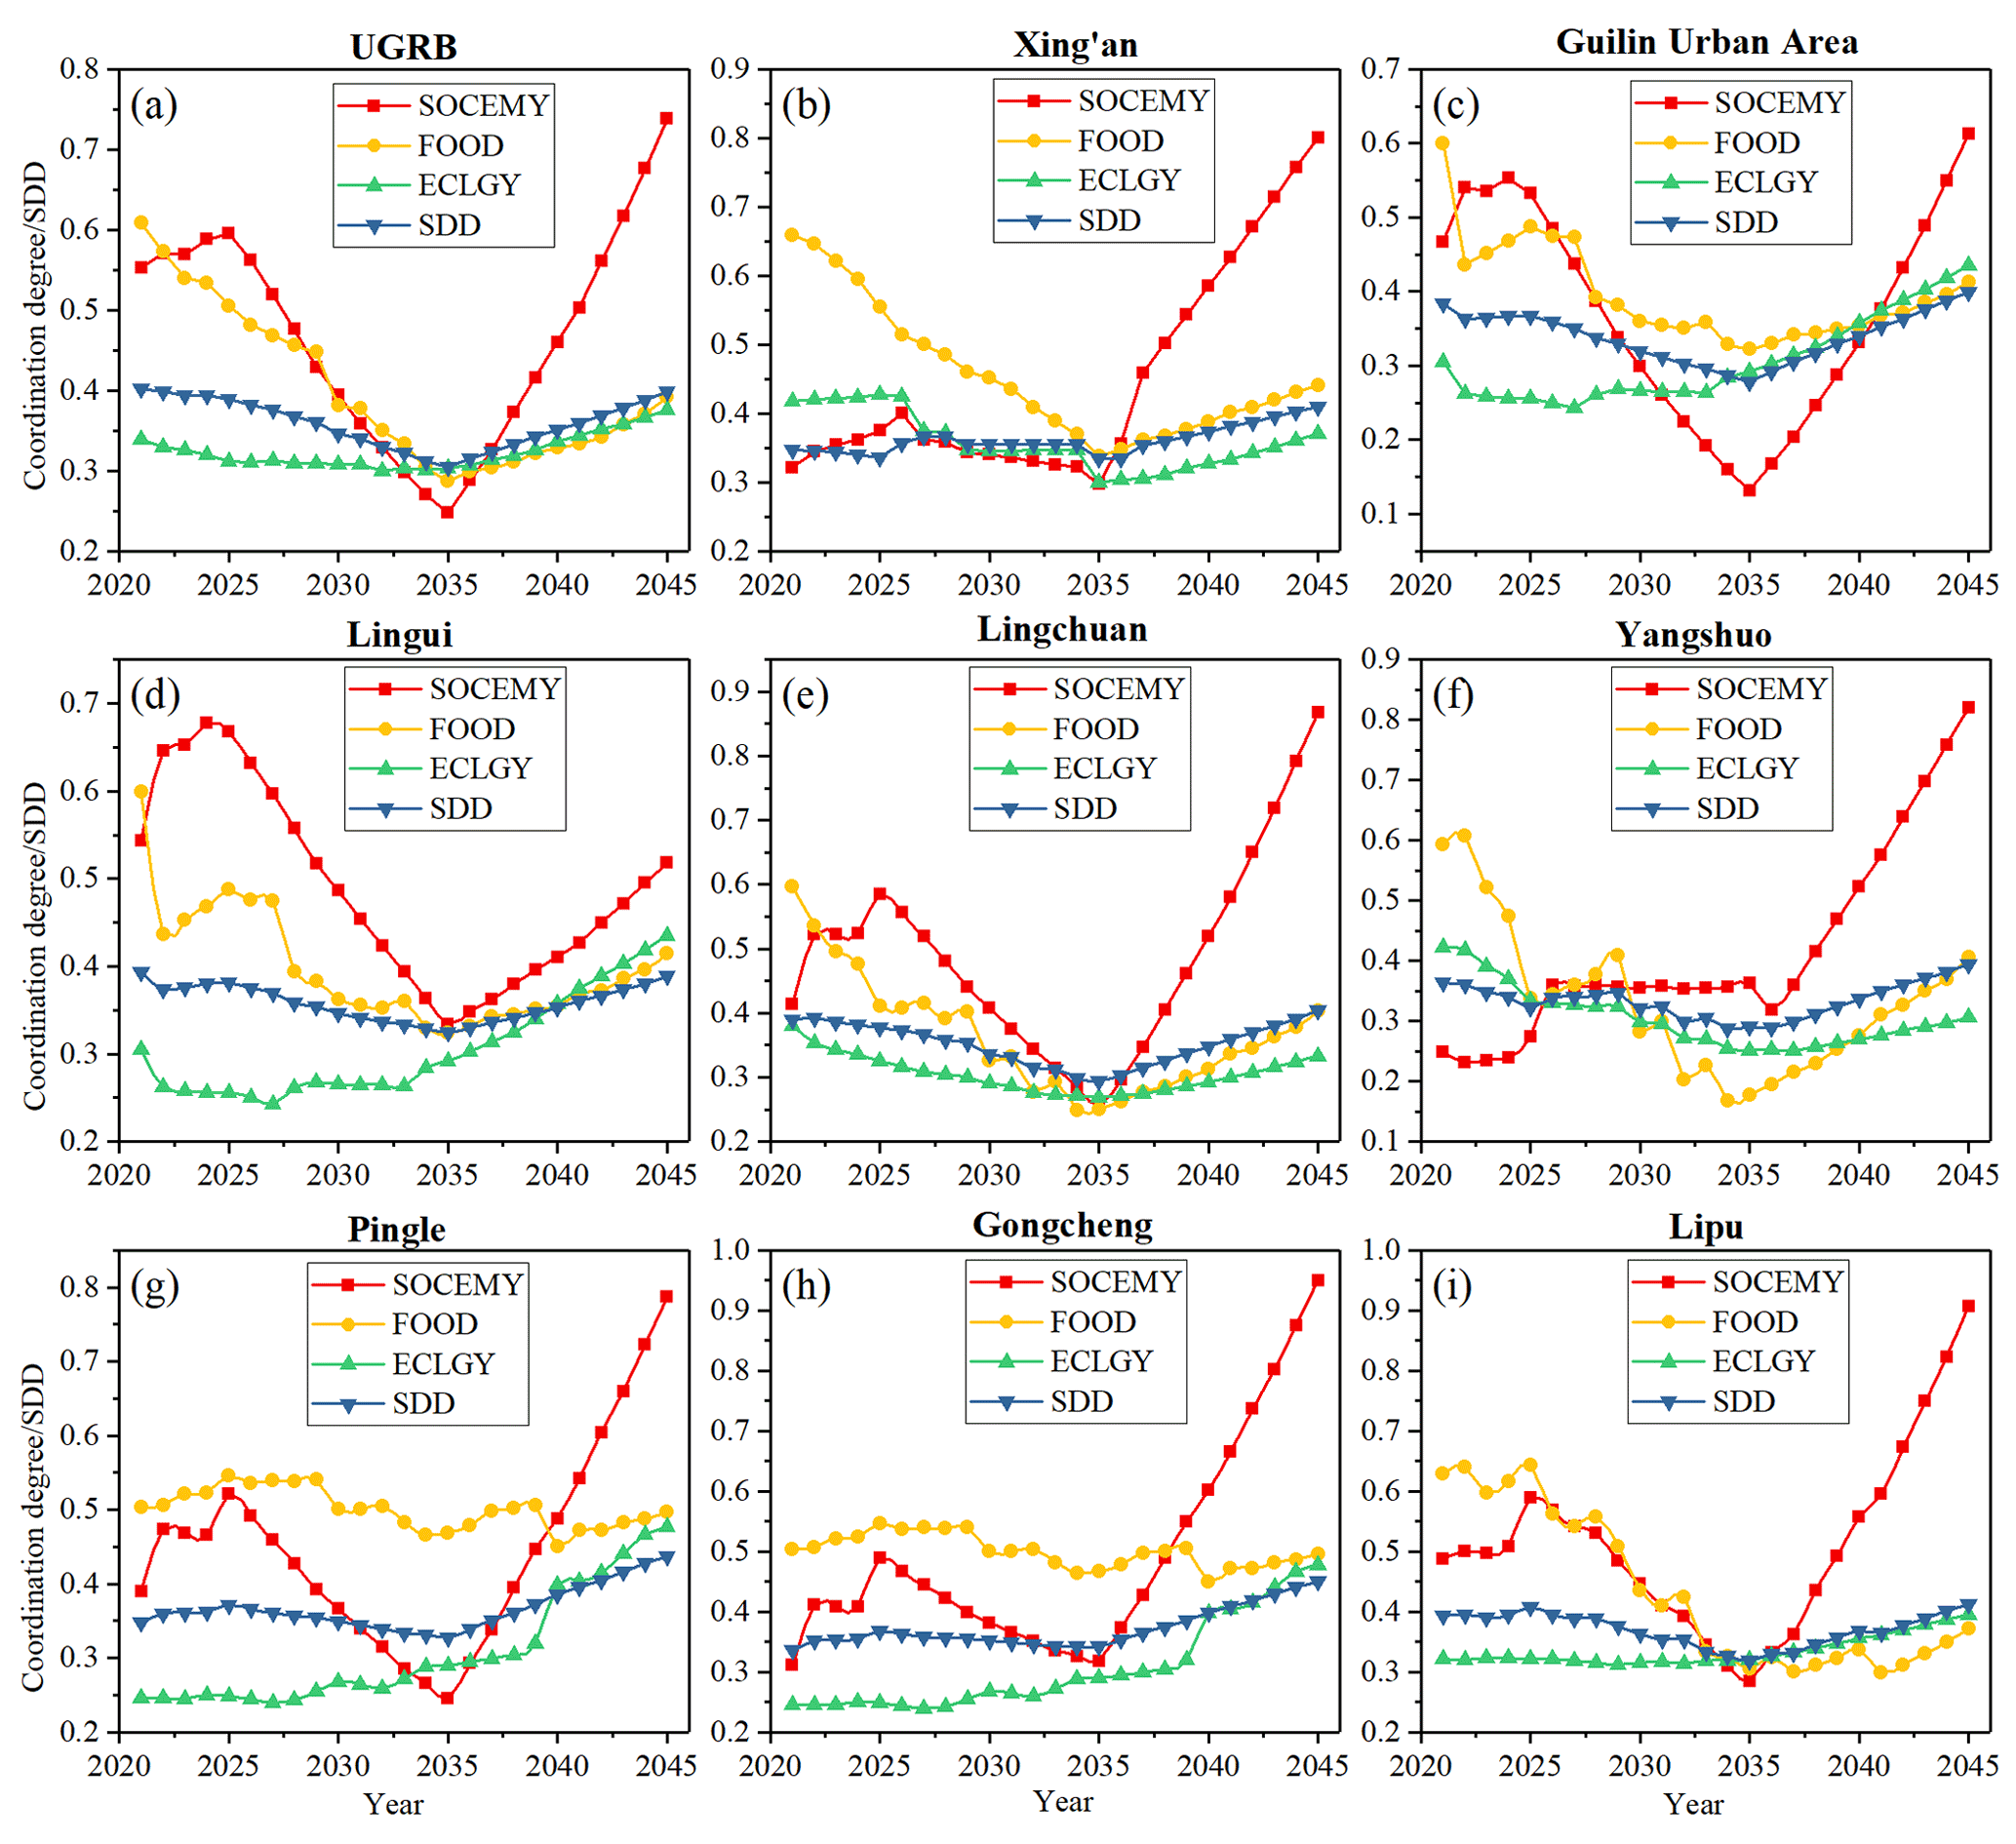
Figure 13Time variation of sustainable development degree (SDD) of WSEF nexus and coordination degree of each agent.
When it comes to the third stage, the value of SOCEMY increases, indicating that the coordination of the socioeconomic subsystem is improving. It revealed the decrease in the overload index and an increased carrying capacity due to the relatively slower increasing rate of water demand of the economic agent. The increasing value of SOCEMY promotes the coordinative degree of ecology and food, and the value of SDD is, consequently, increased, revealing that stable economic growth will promote the sustainable development of the WSEF nexus. The good phenomenon of the last stage happens because the relatively slow growth rate of water demand for the economic agent will generate more water for food and ecological agent, and the increasing sewage and recycled water treatment rate will provide relatively more water for users. The coevolution process assumes the pendulum model presented by van Emmerik et al. (2014) and Kandasamy et al. (2014), where environmental awareness has been raised, and a stable population rate occurred in the last era. The result presented in this study is similar to the findings in van Emmerik et al. (2014) and Kandasamy et al. (2014). Furthermore, we can speculate that, in the decade of 2045, the pendulum of UGRB will also swing back to the stage of protective resources and environment and the stable development of socioeconomics.
5.1 The reasons for coevolution trends and model performances
The overall coevolution changes and performances are affected by the external drivers embodied by the growth rate of population and GDP (see Table 3). The sharply increased rate in the second stage exactly corresponds to the era in which the investment and population grow rapidly, which is stressed in the pendulum model by Kandasamy et al. (2014; see Sects. 2 and S1). The growth rate from 2036 to 2045 is lower compared with that from 2026 to 2035, which corresponds to the era of remediation and the emergence of the environmental customer. That is why the coevolution process of all the items depicts the characteristics of different stages. Although the optimization model is used in this study, the objective function of both socioeconomic and food agents still increases in stage 2, which is accompanied by the decreased crop yield (Fig. 12b), increased overload index (Fig. 9f), and even lower SDD (Fig. 13). This is because the optimization model is just a crucial tool for achieving sustainable water use in which the ecological agent is an indispensable part. Ecological streamflow must be guaranteed to maintain river health, and hence, we can see the river streamflow increase rapidly in this stage simulated by the optimization model and further intensifies the water shortage.
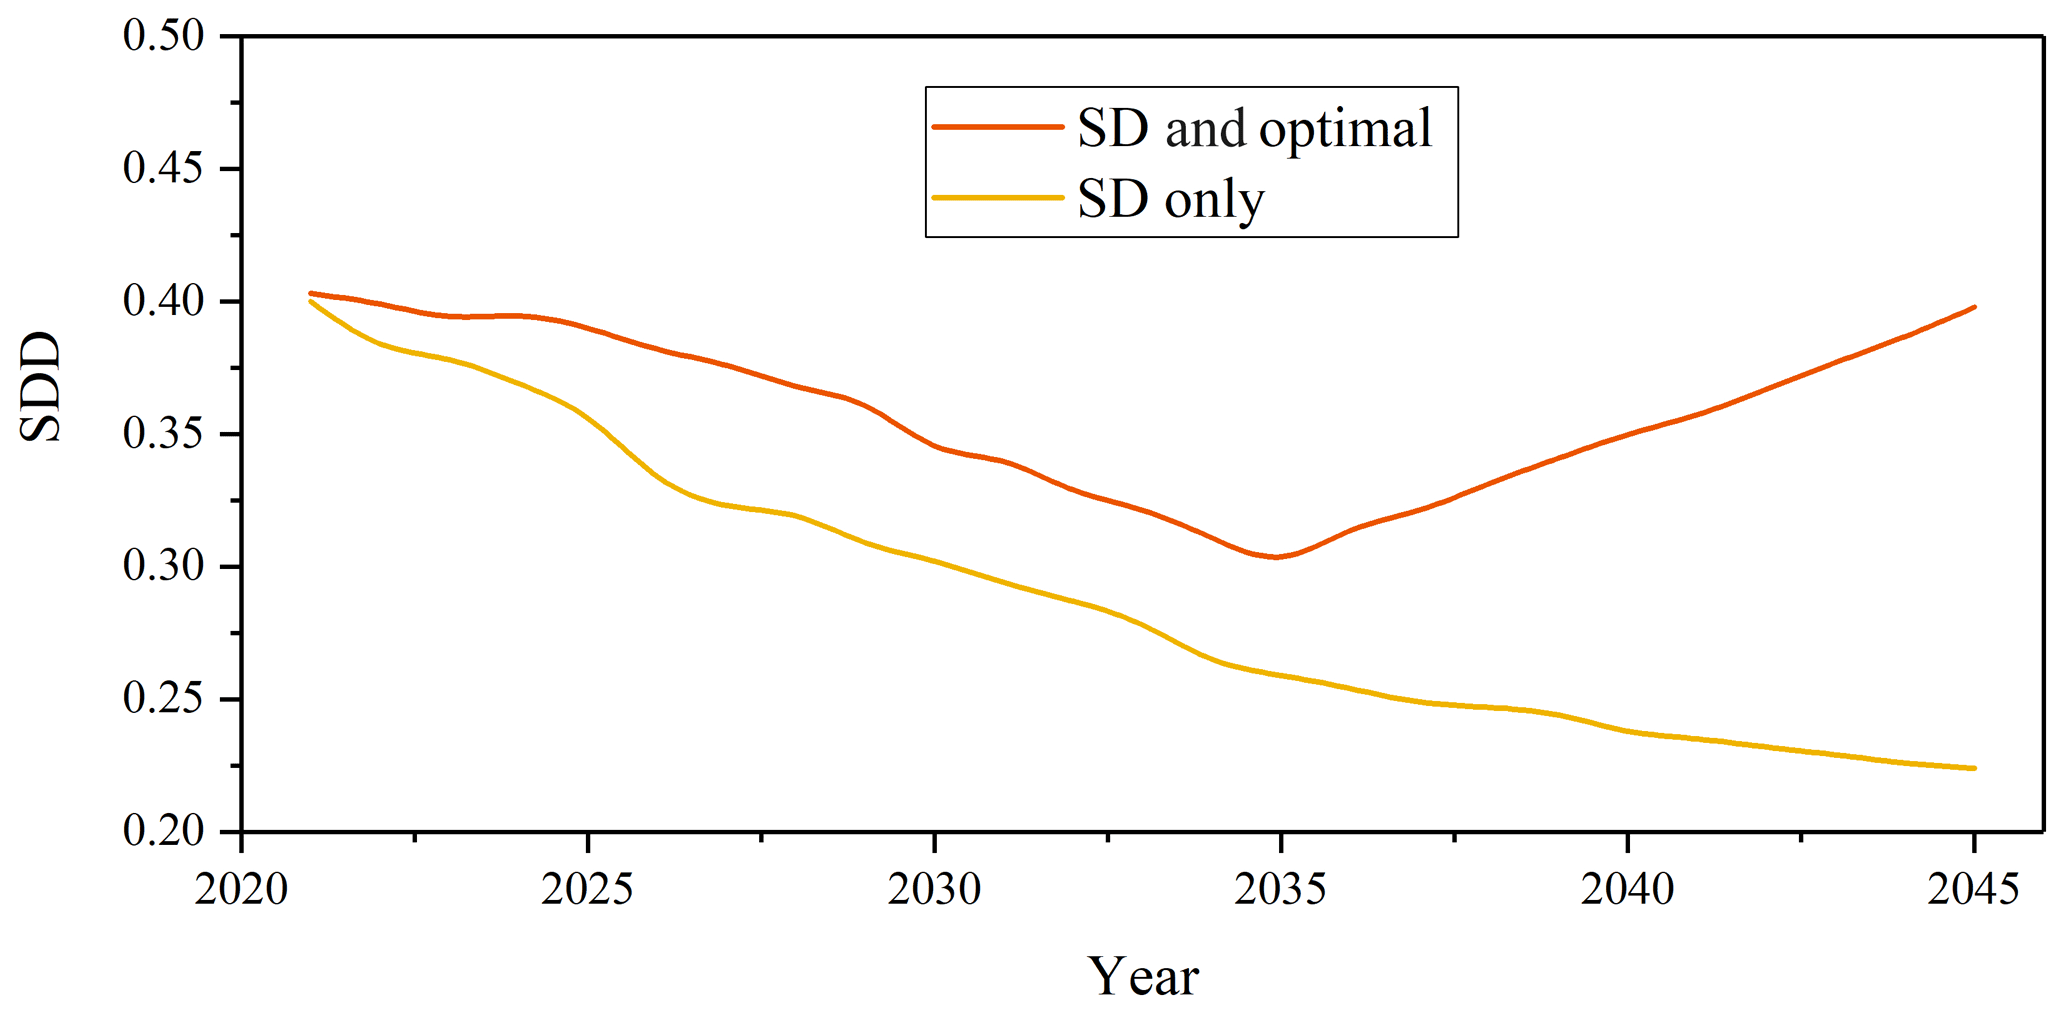
The positive feedback loop in the SD model (see Fig. 4) will take effect if the optimization model is not coupled with the entire framework. However, this positive linkage will lead to divergence in the socioeconomic agent subsystem. That is, both water supply and population will increase circularly and are likely to result in unlimited socioeconomic growth, which directly reduces the river streamflow and causes severe ecological problems. That is also the reason why the value of SDD is decreasing (see Fig. 14). The socioeconomic/food agent and the ecological agent constitute the negative feedback loop, and the optimization model will then be coupled with SD to help find the balance in this loop. With a sharply increasing population/GDP, the optimization model intensified the ecological streamflow to ensure river health. The optimization model does try its utmost to achieve a sustainable goal, but there is no guarantee that the ideal status (higher SDD) will be achieved. The accelerated growth of water demand, caused by a rapid population growth rate, is the main reason for the negative performance of the WSEF nexus (e.g., high overload index). Fig. 14 demonstrates the comparison of model performances between two cases (SD model only and SD and optimization model) of the entire UGRB. Figure 14 shows that the value of the SDD of the coupled SD and optimization model is higher than that of the SD model only, indicating that the coupled model performs better and is able to increase the accuracy and reliability of the SDD model. In addition, the situation in stage 3 has been improved, with a decreased overload index and stable streamflow and crop yield. The moderate growth rate contributes to more water supply to support reasonable economic development. We can conclude that the technologies (such as optimization approaches) are just a tool that help water sustainability, but management regimes and policy adjustment on external drivers is the fundamental approach to achieving this goal.
5.2 Decision-making performance considering model uncertainty
The chain of the model is complex and usually contains lots of uncertainties, and decision-makers usually aim to achieve multiple performance objectives and have to make tradeoffs among those conflicting objectives which arise from uncertainties (Herman et al., 2014, 2015). For uncertainties of the multi-objective model, it is reflected mathematically by the portfolios of all the non-dominant optimal solutions (also called the Pareto frontier; Fig. 15). Each dot in Fig. 15 corresponds to a certain weight vector that represents one possible alternative. Therefore, the way we choose those optimal solutions from the Pareto alternative is the main source of the model uncertainty by which the weight of each objective is reflected (Tingstad et al., 2014; Liu et al., 2019), that is, the tradeoff analysis. This study provides several alternatives based on different weighting factors to assess model performances. There are 12 alternatives are presented in Table 4, and these represent the preferences of decision-makers, and the different performances are shown in Fig. 16.
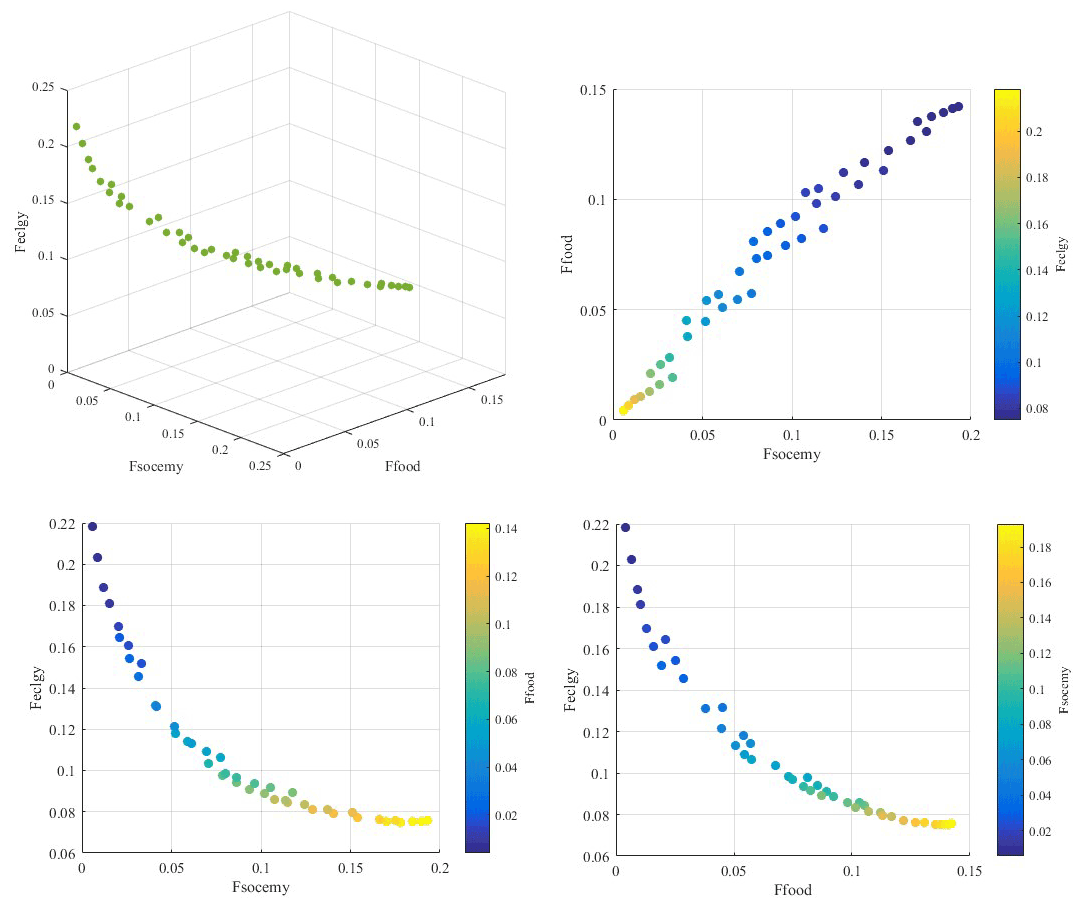
Table 4The 12 alternatives based on weighting factors for the uncertainty assessment.

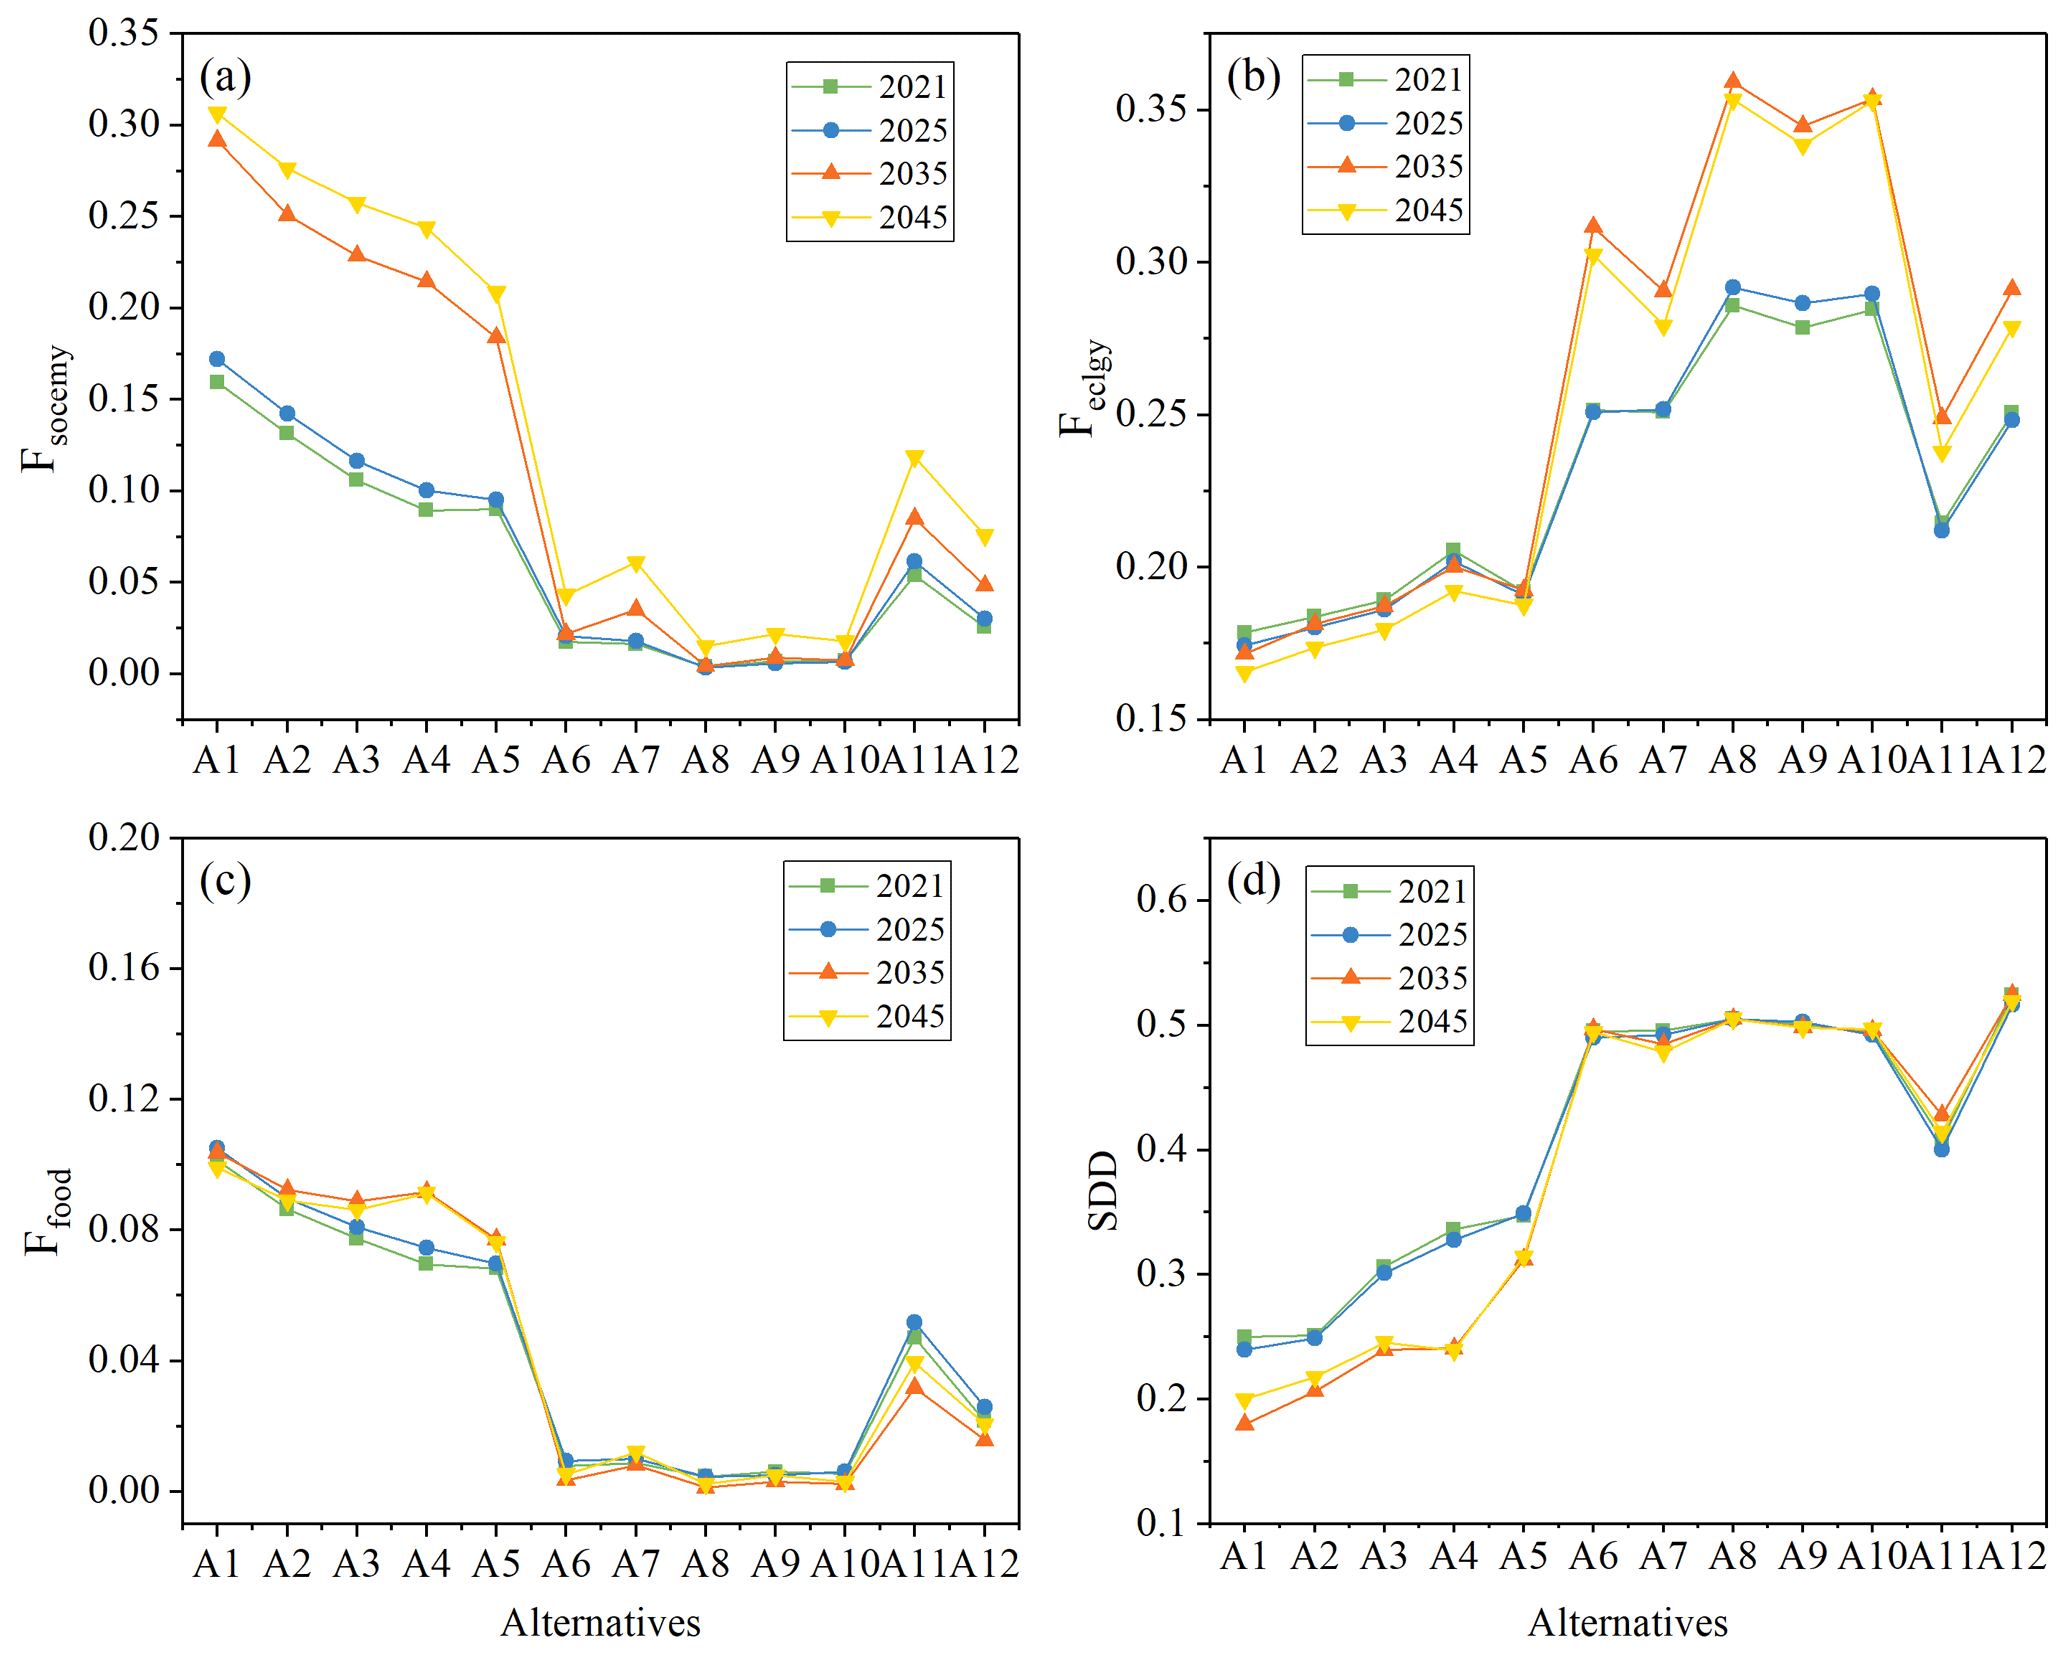
Approximately, A1 to A3 in Table 4 focus more on ecological streamflow with higher θ, while that of A4–A7 and A8–A10 are lower. A4–A7 focus more on the food agent, while A8–A11 focus more on the economic agent. A11 focuses on both economic and streamflow issues. A12 is the average level at which each weight is set as equal. The value of both objective functions of each agent and SDD under each alternative is shown in Fig. 16. From Fig. 16, we can see that the values of SDD under A1–A5 and A11 are smaller than those under other alternatives. Meanwhile, the objective function of both economy and food agents under A1–A5 and A11 is higher than that under other alternatives, suggesting more of a water shortage. On the contrary, the objective function of the ecology agent shows the opposite trend. We can attribute this result to the relatively higher weighting factor of θ and the lower weighting factor of α in those alternatives, resulting in the relatively low levels of water for the economic and food agents. Moreover, of all the alternatives, A12 performs the best, with an equal value of the weighting factor (0.25), suggesting that equal consideration to each agent is more likely to attain sustainable development. The value in other alternatives is either more or less than 0.25, suggesting that excessive or lower weighting factors prevent the sustainable development of water resources to some extent. Therefore, this uncertainty analysis can serve as a reference for the decision-making process in water resources management. based on the primary needs of each stakeholder, multiple weighting scenarios can be identified and explored.
5.3 Robustness analysis for WSEF nexus
The key factor(s) that affect(s) the robustness of the WSEF nexus system is (are) assessed to improve its reliability. The alternatives of A5, A7, A9, and A11 are set particularly by controlling the relative variables to assess the robustness of the WSEF nexus. In the case of both A5 vs. A7 and A9 vs. A11, we change θ, while α1 and α3 remain unchanged to assess the influences of river ecology water changes on the performance of the WSEF nexus. While, in the cases of both A5 vs. A11 and A7 vs. A9, we change α1 and α3, while θ and α2 remain unchanged to assess the influences of water changes of both economic and food agents on the performance of WSEF nexus. According to Fig. 16, the differences between both cases are shown in Table 5. To illustrate, the SDD value of 0.06 in row A5 vs. A11 and in column 2016 means that the difference in the SDD value between A5 and A11 in 2016 is 0.06. From Table 5, we can see that the values in the lower two rows are smaller than those in the upper two rows. It indicates that, when the weighting factors of both socioeconomic and food agents are certain, changing the weighting factor of the streamflow will have a relatively significant impact on the performance of the WSEF nexus in both the objective function and sustainable development degree. Additionally, changing the weighting factor of both socioeconomic and crop water uses will have less influence on model performance. In other words, the streamflow agent has a relatively great influence on the robustness of the WSEF nexus model.
Table 5Comparison of the performance of WSEF nexus between different alternatives.
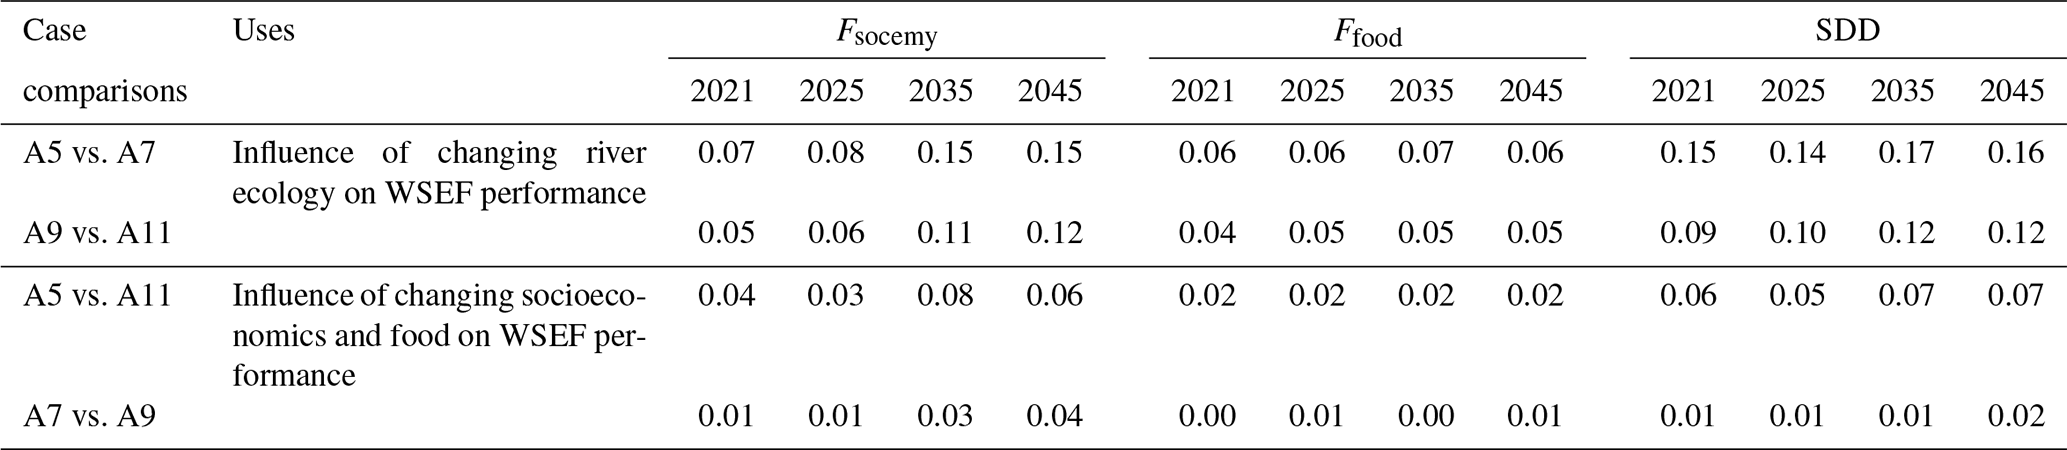
The robustness of river ecology can also be reflected in the model performance of different years. From Fig. 16, we can also see that both objective functions and SDD under A1–A5 have a greater difference between 2021 and 2025 and 2035 and 2045 compared with other alternatives. There will be a rapid economic increase from 2025 to 2035, and the ecological awareness in these alternatives outweighs other alternatives (with higher θ), which is more likely to trigger the adaptive adjustment of the WSEF nexus system and further accelerate river streamflow. Then, there will be not enough economic water services, and the overload index will increase, further decreasing SDD in 2035 compared with 2025.
5.4 Simplifications of model dynamics and limitations
The proposed model simulates the dynamic evolution and feedback loops based on the three agents of socioeconomics, food, and ecology. The findings proposed in this study are similar to those in Kandasamy et al. (2014). This study stressed that environmental awareness arises when an accelerated population is about to consume freshwater. This is translated into a population decrease to protect the environment. The study also showed the stable status of the sustainability of both social productivity and environmental issues because the population growth rate is moderate and steady in the third stage; this means we will have to pay more attention to environmental awareness.
These individual three nexus agents also have prominent theories or disciplines that contain numerous individual principles. Therefore, several assumptions and simplifications are often conducted to develop the nexus models that are, to some extent, one of the most necessary and significant ways for natural resources management practices to ensure sustainable development. For example, the linkage between crop yield and carrying population may not be as easy as a linear relationship (Lyu et al., 2020). The main goal of this study is to assess the viability of WSEF nexus models as a framework for decision-making. For individual dynamics between two agents, a simplified version of our proposed model, incorporating more detailed and localized assumptions that incorporate nonlinear relationships, could be used. Our study focuses on linear-based relationships as a practical way to develop a more comprehensive analysis. Also, the proposed model was used in humid areas but may not be suitable in dry areas, which can be conducted in further studies.
Moreover, it should be noted that the analysis in Sect. 5.3 is one of the most widely used methods of robust analysis, which is based on changes in the weighting factors (Herman et al., 2015; Liu et al., 2019). Also, Feng et al. (2019) established the integrated framework of the water resources system and applied it in Danjiangkou Reservoir by introducing many parameters. The robust analysis is conducted based on the changes in these parameters, and the model performance (revealed by certain variables) under the different values of these parameters is analyzed. Other methods use weight analysis to assess model changes and scenario analysis. For example, the robust analysis presented in Tan et al. (2019) is conducted by changing the reservoir's streamflow and comparing the value of the objective function of both instream and off-stream water users. The increasing streamflow results in decreasing water supply for off-stream use, which leads to the increasing rate of the off-stream objective function. In terms of robust analysis, both Tan et al. (2019) and this study attempt to make the initial analysis and develop practical frameworks that could be implemented by water resources managers and other stakeholders. Further research should evaluate the effect of more advanced analysis methods on the efficiency and practicality of WSEF nexus models.
This paper presented a new integrated framework that is used to analyze the dynamic interactions within coupled human and natural systems in the context of socioeconomic development, food security, and environmental protection by establishing system dynamic and optimization modeling. The system dynamics show how the dynamic status of water supply is performed, while optimization modeling gives insights on how sustainable water uses can be achieved. The dynamic optimal results are generated by using, as input, the initial result of the SD model of each time step and iteration process. The changing external conditions, i.e., the socioeconomic development changes, result in nonlinear and multiscale feedback responses. The uncertainty analysis is also helpful for multiple tradeoffs and robustness analysis in the decision-making process. The result can give a firm reference and provide a practical tool for sustainable water use from the following two aspects:
-
This coupled modeling tool enables a dynamic evolution and feedback process by generating the whole scale of future trajectories that reveals the interactions across socioeconomic development, food security, and ecological protection dynamically and optimally. All the trajectories differed at different stages; that is, depending on the external drivers in terms of the different stages, the dynamic changes manifest differently in water supply, streamflow water, farmer profit, and population size. There are no obvious changes in the performances of the model in the first stage. In stage 2 (2026–2035), the severe increase in the economy intensifies the water for the increased population and the need for economic productivities, which contributes to the positive feedback loop. However, it deteriorates the river health in ecological agents, and the negative feedback loop is used to find their balance. Therefore, the interaction of the entire WSEF nexus system is intensified by triggering more streamflow water from reservoirs for the ecological agent. It results in less water for agriculture and socioeconomics and cannot afford the rapidly increasing population and economy (increased overload index) and decreased crop yield. In stage 3 (2035–2045), concerning moderate socioeconomic development, the interaction of the WSEF nexus system will be alleviated; that is, the changes in streamflow water will tend to be stable, and there will be more water to support the proper population size and economy, as well as crop yield. In terms of the sustainable development degree, the increasing trend occurred in stage 3 compared with the declining trend in stage 2. These results suggest that only considering the economic benefits (stage 2) will accelerate the overload index of the overall WSEF nexus system, which inversely affects the socioeconomic development and cannot achieve sustainable water use. If ecological awareness arises and the economic growth rate tends to be stable, it will be beneficial for the sustainability of water. Thus, the coevolution process and dynamic interactions between humans and natural systems can provide valuable information and guidelines for policymakers on how to decide on the development degree and manage water resources on a regional scale, considering economic development, food security, and ecological protection.
-
The uncertainty analysis result of the coupled model also revealed the different performances considering the need of various stakeholders, giving references to multiple tradeoffs influencing the WSEF nexus system and stakeholders, notably the tradeoffs between water for social development, food security, and ecological protection. The Pareto portfolio of the multi-optimization model based on different weighting factors reveals the competitive mechanism of the three agents of the coupled model. The alternatives based on different weighting factors show the varied sustainable development degrees and objective functions of each agent. Of all the alternatives, the equal consideration of each stakeholder (weighting factor) is more likely to achieve sustainable development (with the greater SDD). Therefore, policymakers can explore the future water allocation scheme among the different needs of stakeholders based on those different alternatives. Of all the agents within the WSEF nexus system, the river ecological part is more likely to influence its robustness. This result suggests that the ecological agent of the WSEF nexus system should be paid more attention in the processes of both water allocation and policymaking compared with other aspects. This paper not only reveals the dynamic evolution and feedback responses across multiple agents more precisely by coupling SD with the optimization model and improving the model's reliability compared with the traditional SD model but also provides valuable predictive insights into the decision-making process of nexus systems.
The code used to support the findings of this study are available from the corresponding author upon request.
The data used to support the findings of this study are available in Sect. 3.2 in this paper and Sects. S6 and S7 in the Supplement.
The supplement related to this article is available online at: https://doi.org/10.5194/hess-25-6495-2021-supplement.
YT prepared the paper and developed the model. ZD and SMG revised the paper. XW and WY helped collect the data.
The authors declare that they have no conflict of interest.
Publisher's note: Copernicus Publications remains neutral with regard to jurisdictional claims in published maps and institutional affiliations.
The authors are grateful to the sources of hydrological and meteorological data from the hydrological authority and statistical bureau, and the organizations and comments handled by Zengchuan Dong and Sandra M. Guzman. The authors are grateful for the insights and views of the editors and reviewers, which improved the quality of our paper.
This research has been supported by the National Defense Basic Scientific Research Program of China (grant no. 2018YFC1508200) and the China Scholarship Council.
This paper was edited by Thom Bogaard and reviewed by three anonymous referees.
Abdulbaki, D., Al-Hindi, M., Yassine, A., and Abou Najm, M. An optimization model for the allocation of water resources, J. Clean. Prod., 164, 994–1006, 2017.
Afify, A.: Prioritizing desalination strategies using multi-criteria decision analysis, Desalination, 250, 928–935, 2010.
Allen, R. G., Pereira, L. S., Raes, D., and Smith, M.: Crop Evapotranspiration-Guidelines for Computing Crop Water Requirements-FAO Irrigation and Drainage Paper 56, Food and Agriculture Organization of the United States, Rome, 1998.
Baron, J. S., Poff, N. L., Angermeier, P. L., Dahm, C. N., Gleick, P. H., Hairston, N. G., Jackson, R. B., Johnston, C. A., Richter, B. D., and Steinman, A. D.: Meeting ecological and societal needs for freshwater, Ecol. Appl., 12, 1247–1260, 2002.
Beh, E. H. Y., Maier, H. R., and Dandy, G. C.: Adaptive, multi-objective optimal sequencing approach for urban water supply augmentation under deep uncertainty, Water Resour. Res., 51, 1529–1551, 2015.
Biggs, E. M., Bruce, E., Boruff, B., Duncan, J. M. A., Horsley, J., Pauli, N., McNeill, K., Neef, A., Ogtrop, E. M., Curnow, J., Haworth, B., Duce, S., and Imanari, Y.: Sustainable development and the water–energy–food nexus: A perspective on livelihoods, Environ. Sci. Policy, 54, 389–397, 2015.
Burke, E. K. and Kendall, G.: Search methodologies: Introductory tutorials in optimization and decision support techniques, Springer, New York Heidelberg Dordrecht London, 2014.
Carpenter, S. R., Stanley, E. H., and Vander Zanden, M. J.: State of the world's freshwater ecosystems: Physical, chemical, and biological changes, Annu. Rev. Environ. Resour., 36, 75–99, 2011.
Casadei, S., Pierleoni, A., and Bellezza, M.: Integrated water resources management in a lake system: A case study in central Italy, Water, 8, 570, https://doi.org/10.3390/w8120570, 2016.
Chandramouli, V. and Deka, P.: Neural network based decision support model for optimal reservoir operation, Water Resour. Manag., 19, 447–464, 2005.
Chen, S. and Chen, B.: Urban energy-water nexus: a network perspective, Appl. Energy, 184, 905–914, 2016.
Chen, Y., Lu, H., Li, J., Ren, L., and He, L.: A leader-follower-interactive method for regional water resources management with considering multiple water demands and eco-environmental constraints, J. Hydrol., 548, 121–134, 2017.
Collins, S. L., Carpenter, S. R., Swinton, S. M., Orenstein, D. E., Childers, D. L., Gragson, T. L., Grimm, N. B., Grove, J. M., Harlan, S. L., Kaye, J. P., Knapp, A. K., Kofinas, G. P., Magnuson, J. J., McDowell, W. H., Melack, J. M., Ogden, L. A., Robertson, G. P., Smith, M. D., and Whitmer, A. C.: An integrated conceptual framework for long-term social–ecological research, Front. Ecol. Environ., 9, 351–357, 2011.
Duan, W., Chen, Y., Zou, S., and Nover, D.: Managing the water-climate-food nexus for sustainable development in Turkmenistan, J. Clean. Prod., 220, 212–224, 2019.
Falkenmark, M.: Freshwater as shared between society and ecosystems: From divided approaches to integrated challenges, Philos. Trans. R. Soc. London B, 358, 2037–2049, 2003.
FAO: Crop yield response to water, FAO Irrigation and Drainage Paper, Paper 66, ISSN 0254-5284, 2012.
Faridah, O., Mohammad, H., Mohammad, S. S., Rashidi, M., and Parsa, M. S.: The necessity of systematic and integrated approach in water resources problems and evaluation methods, a review, Adv. Environ. Biol., 8, 307–315, 2014.
Feng, M., Liu, P., Li, Z., Zhang, J., Liu, D., and Xiong, L.: Modeling the nexus across water supply, power generation and environment systems using the system dynamics approach: Hehuang Region, China, J. Hydrol., 543, 344–359, 2016.
Feng, M., Liu, P., Guo, S., David, J. Y., Cheng, L., Yang, G., and Xie, A.: Adapting reservoir operations to the nexus across water supply, power generation, and environment systems: An explanatory tool for policymakers, J. Hydrol., 574, 257–275, 2019.
Forrester, J. W. and Warfield, J. N.: World dynamics, IEEE Trans. Syst. Man. Cybern., 2, 558–559, 1971.
Gastélum, J., Valdés, J., and Stewart, S.: A system dynamics model to evaluate temporary water transfers in the Mexican Conchos basin, Water Resour. Manage., 24, 1285–1311, 2010.
Gehrke, P. C., Brown, P., Schiller, C. B., Moffatt, D. B., and Bruce, A. M.: River regulation and fish communities in the Murray-Darling river system, Australia, Regul. River., 11, 363–375, 1995.
Gohari, A., Eslamian, S., Mirchi, A., Abedi-Koupaei, J., Massah Bavani, A., Madani, K.: Water transfer as a solution to water shortage: a fix that can backfire, J. Hydrol., 491, 23–39, 2013.
Goicoechea, A., Hansen, D. R., and Duckstein, L.: Multi-objective Decision Analysis with Engineering and Business Applications, Wiley, New York, 1982.
Hellegers, P., Zilberman, D., Steduto, P., and McCornick, P.: Interactions between water, energy, food, and environment: evolving perspectives and policy issues, Water Policy, 10, 1–10, 2008.
Herman, J. D., Zeff, H. B., Reed, P. M., and Characklis, G. W.: Beyond optimality: Multi-stakeholder robustness tradeoffs for regional water portfolio planning under deep uncertainty, Water Resour. Res., 50, 7692–7713, 2014.
Herman, J. D., Reed, P. M., Zeff, H. B., and Characklis, G. W.: How should robustness be defined for water systems planning under change?, J. Water Resour. Plann. Manage., 141, 04015012, https://doi.org/10.1061/(ASCE)WR.1943-5452.0000509, 2015.
Hoff, H.: Understanding the Nexus. Background Paper for the Bonn 2011 Conference: The Water, Energy and Food Security Nexus, Stockholm Environment Institute, Stockholm, 2011.
Holland, J. H.: Hidden Order: How Adaptation Builds Complexity, Addison-Wesley, MIT press, Massachusetts, 1995.
Hong, X., Guo, S., Wang, L., Yang, G., Liu, D., Guo, H., and Wang, J.: Evaluating water supply risk in the middle and lower reaches of Hanjiang river basin based on an integrated optimal water resources allocation model, Water, 8, 364, https://doi.org/10.3390/w8090364, 2016.
Hunt, J. D., Byers, E., Riahi, K., and Langan, S.: Comparison between seasonal pumped- storage and conventional reservoir dams from the water, energy and land nexus perspective, Energy Convers. Manage., 166, 385–401, 2018.
Jia, B., Zhong, P., Wan, X., Xu, B., and Chen, J.: Decomposition–coordination model of reservoir group and flood storage basin for real-time flood control operation, Hydrol. Res., 46, 11–25, 2015.
Jørgensen, S. E. and Bendoricchio, G.: Fundamentals of ecological modelling (Vol. 21), Elsevier, Kidlington, 2001.
Kandasamy, J., Sounthararajah, D., Sivabalan, P., Chanan, A., Vigneswaran, S., and Sivapalan, M.: Socio-hydrologic drivers of the pendulum swing between agricultural development and environmental health: a case study from Murrumbidgee River basin, Australia, Hydrol. Earth Syst. Sci., 18, 1027–1041, https://doi.org/10.5194/hess-18-1027-2014, 2014.
Ladson, A. R. and White, L. J.: An Index of Stream Condition: Reference Manual, Department of Natural Resources and Environment, Melbourne, 1999.
Larson, R. E.: State increment dynamic programming, No. 12, Elsevier Publishing Company, New York, 1968.
Li, C., Zhou, J., Ouyang, S., Wang, C., and Liu, Y.: Water Resources Optimal Allocation Based on Large-scale Reservoirs in the Upper Reaches of Yangtze River, Water Resour. Manag., 29, 2171–2187, 2015.
Li, M., Fu, Q., Singh, V. P., Ji, Y., Liu, D., Zhang, C., and Li, T.: An optimization modeling approach for managing agricultural water-energy-food nexus under uncertainty, Sci. Total Environ., 651, 1416–1434, 2019a.
Li, T., Yang, S., and Tan, M.: Simulation and optimization of water supply and demand balance in Shenzhen: A system dynamics approach, J. Clean. Prod., 207, 882–893, 2019b.
Li, Z., Li, C., Wang, X., Peng, C., Cai, Y., and Huang, W.: A hybrid system dynamics and optimization approach for supporting sustainable water resources planning in Zhengzhou City, China, J. Hydrol., 556, 50–60, 2018.
Liu, J., Dietz, T., Carpenter, S. R., Alberti, M., Folke, C., Moran, E., Pell, A. N., Deadman, P., Kratz, T., Lubchenco, J., Ostrom, E., Ouyang, Z., Provencher, W., Redman, C. L., Schneider, S. H., and Taylor, W. W.: Complexity of coupled human and natural systems, Science, 317, 1513–1516, 2007a.
Liu, J., Dietz, T., Carpenter, S. R., Folke, C., Alberti, M., Redman, C. L., Schneider, S. H., Ostrom, E., Pell, A. N., Lubchenco, J., Taylor, W. W., Ouyang, Z., Deadman, P., Kratz, T., and Provencher, W.: Coupled human and natural systems, Ambio, 36, 639–649, 2007b.
Liu, K. K., Li, C. H., Cai, Y. P., Xu, M., and Xia, X. H.: Comprehensive evaluation of water resources security in the Yellow River basin based on a fuzzy multi-attribute decision analysis approach, Hydrol. Earth Syst. Sci., 18, 1605–1623, https://doi.org/10.5194/hess-18-1605-2014, 2014.
Liu, W., Hunsaker, D., Li, Y., Xie, X., and Wall, G.: Interrelations of yield, evapotranspiration, and water use efficiency from marginal analysis of water production functions, Agric. Water Manage., 56, 143–151, 2002.
Liu, W., Zhu, F., Chen, J., Wang, H., Xu, B., Song, P., Zhong, P., Lei, X., Wang, C., Yan, M., Yang, M., and Li, J.: Multi-objective optimization scheduling of wind–photovoltaic–hydropower systems considering riverine ecosystem, Energ. Convers. Manage., 196, 32–43, 2019.
Liu, Y., Gupta, H., Springer, E., and Wagener, T.: Linking science with environmental decision making: Experiences from an integrated modeling approach to supporting sustainable water resources management, Environ. Model. Softw., 23, 846–858, 2008.
Luo, Z. and Zuo, Q.: Evaluating the coordinated development of social economy, water, and ecology in a heavily disturbed basin based on the distributed hydrology model and the harmony theory, J. Hydrol., 574, 226–241, 2019.
Lyu, H., Dong, Z., and Pande, S.: Interlinkages between human agency, water use efficiency and sustainable food production, J. Hydrol., 582, 124524, https://doi.org/10.1016/j.jhydrol.2019.124524, 2020.
Marler, R. T. and Arora, J. S.: The weighted sum method for multi-objective optimization: new insights, Struct. Multidiscip. Optim., 41, 853–862, 2009.
Moraes, M. M. G. A., Cai, X., Ringler, C., Albuquerque, B. E., da Rocha, S. P. V., and Amorim, C. A.: Joint water quantity-quality man- agement in a biofuel production area – Integrated economic-hydrologic modeling analysis, J. Water Resour. Plann. Manage., 136, 502–511, 2010.
Nair, S., George, B., Malano, H. M., Arora, M., and Nawarathna, B.: Water–energy–greenhouse gas nexus of urban water systems: Review of concepts, state-of-art and methods, Resour. Conserv. Recycl., 89, 1–10, 2014.
Neitsch, S. L., Arnold, J. G, Kiniry, J. R., and Williams, J. R.: Soil and Water Assessment Tool Theoretical Documentation Version 2009, Texas Water Resources Institute, Texas A&M University, USA, 2011.
Parker, D. C., Hessl, A., and Davis, S. C.: Complexity, land-use modeling, and the human dimension: Fundamental challenges for map- ping unknown outcome spaces, Geoforum, 39, 789–804, 2008.
Perrone, D. and Hornberger, G.: Frontiers of the food–energy–water trilemma: Sri Lanka as a microcosm of tradeoffs, Environ. Res. Lett., 11, 014005, https://doi.org/10.1088/1748-9326/11/1/014005, 2016.
Phillips, J. D.: Human impacts on the environment: Unpredictability and the primacy of place, Phys. Geogr., 22, 321–332, 2001.
Reddy, M. J. and Kumar, D. N.: Multi-objective particle swarm optimization for generating optimal tradeoffs in reservoir operation, Hydrol. Process., 21, 2897–2909, 2007.
Rockstrom, J., Falkenmark, M., Karlberg, L., Hoff, H., and Rost, S.: Future water availability for global food production: The potential of green water for increasing resilience to global change, Water Resour. Res., 45, W00A12, https://doi.org/10.1029/2007WR006767, 2009.
Saxton, K. E., Rawls, W. J., Romberger, J. S., and Papendick, R. I.: Estimating generalized soil-water characteristics from texture, Soil Sci. Soc. Am. J., 50, 1301–1306, 1986.
Secchi, S., Gassman, P. W., Jha, M., Kurkalova, L., and Kling, C. L.: Potential water quality changes due to corn expansion in the Upper Mississippi River basin, Ecol. Appl., 21, 1068–1084, 2011.
Shahzad, M. W., Burhan, M., Ang, L., and Ng, K. C.: Energy-water-environment nexus underpinning future desalination sustainability, Desalination, 413, 52–64, 2017.
Shi, C., Xia, J., She, D., Wan, H., and Huang, J.: Temporal and Spatial Variation of Ecological Water Requirement of Forests in the Upper Reaches of the Hanjiang Basin Under Climate Change, Resources and Environment in the Yangtze Basin, 25, 580–589, 2016 (in Chinese).
Shiau, J. T. and Wu, F. C.: Optimizing environmental flows for multiple reaches affected by a multipurpose reservoir system in Taiwan: Restoring natural flow regimes at multiple temporal scales, Water Resour. Res., 49, 565–584, 2013.
Singh, A.: Irrigation planning and management through optimization modelling, Water Resour. Manage., 28, 1–14, 2014.
Sivapalan, M., Savenije, H. H. G., and Blöschl, G.: Socio-hydrology: a new science of people and water, Hydrol. Process., 26, 1270–1276, 2012.
Smilovic, M., Gleeson, T., and Adamowski, J.: Crop kites: determining crop-water production functions using crop coefficients and sensitivity indices, Adv. Water Resour., 97, 193–204, 2016.
Sun, Y. and Cui, Y.: Analyzing the Coupling Coordination among Economic, Social, and Environmental Benefits of Urban Infrastructure: Case Study of Four Chinese Autonomous Municipalities, Math. Probl. Eng., 8280328, https://doi.org/10.1155/2018/8280328, 2018.
Tan, Y., Dong, Z., Xiong, C., Zhong, Z., and Hou, L.: An Optimal Allocation Model for Large Complex Water Resources System Considering Water supply and Ecological Needs, Water, 11, 843, https://doi.org/10.3390/w11040843, 2019.
Thomas, M. F.: Landscape sensitivity in time and space – An introduction, Catena, 42, 83–98, 2001.
Thompson, S. E., Sivapalan, M., Harman, C. J., Srinivasan, V., Hipsey, M. R., Reed, P., Montanari, A., and Blöschl, G.: Developing predictive insight into changing water systems: use-inspired hydrologic science for the Anthropocene, Hydrol. Earth Syst. Sci., 17, 5013–5039, https://doi.org/10.5194/hess-17-5013-2013, 2013.
Tingstad, A. H., Groves, D. G., and Lempert, R. J.: Paleoclimate scenarios to inform decision making in water resource management: Example from southern California's inland empire, J. Water Resour. Plann. Manage., 140, 04014025, https://doi.org/10.1061/(ASCE)WR.1943-5452.0000403, 2014.
Uen, T. S., Chang, F. J., Zhou, Y., and Tsai, W. P.: Exploring synergistic benefits of Water-Food-Energy Nexus through multi-objective reservoir optimization schemes, Sci. Total Environ., 633, 341–351, 2018.
Van Emmerik, T. H. M., Li, Z., Sivapalan, M., Pande, S., Kandasamy, J., Savenije, H. H. G., Chanan, A., and Vigneswaran, S.: Socio-hydrologic modeling to understand and mediate the competition for water between agriculture development and environmental health: Murrumbidgee River basin, Australia, Hydrol. Earth Syst. Sci., 18, 4239–4259, https://doi.org/10.5194/hess-18-4239-2014, 2014.
Venkatesan, A. K., Ahmad, S., Johnson, W., and Batista, J. R.: Systems dynamic model to forecast salinity load to the Colorado River due to urbanization within the Las Vegas Valley, Sci. Total Environ., 409, 2616–2625, 2011.
Wagener, T., Sivapalan, M., Troch, P. A., McGlynn, B. L., Harman, C. J., Gupta, H. V., Kumar, P., Rao, P. S. C., Basu, N. B., and Wilson, J. S.: The future of hydrology: An evolving science for a changing world, Water Resour. Res., 46, W05301, https://doi.org/10.1029/2009WR008906, 2010.
Walter, A., Cadenhead, N., Lee, V.S.W., Dove, C., Milley, E., and Elgar, M. A.: Water as an essential resource: orb web spiders cannot balance their water budget by prey alone, Ethology, 118, 534–542, 2012.
Wang, X., Dong, Z., Xu, W., Luo, Y., Zhou, T., and Wang, W.: Study on Spatial and Temporal Distribution Characteristics of Coordinated Development Degree among Regional Water Resources, Social Economy, and Ecological Environment Systems, Int. J Env. Res. Pub. He., 16, 4213, https://doi.org/10.3390/ijerph16214213, 2019.
World Economic Forum (WEF): Water Security: The Water–Food–Energy–Climate Nexus, World Economic Forum, Washington D.C., 2011.
Yaeger, M. A., Housh, M., Cai, X., and Sivapalan, M.: An integrated modeling framework for exploring flow regime and water quality changes with increasing biofuel crop production in the U.S.Corn Belt, Water Resour. Res., 50, 9385–9404, 2014.
Yang, Z., Song, J., Cheng, D., Xia, J., Li, Q., and Ahamad, M. I.: Comprehensive evaluation and scenario simulation for the water resources carrying capacity in Xi'an city, China, J. Environ. Manage., 230, 221–233, 2019.
Yin, X., Yang, Z., Yang, W., Zhao, Y., and Chen, H.: Optimized reservoir operation to balance human and riverine ecosystem needs–model development, and a case study for the Tanghe reservoir, Tang river basin, China, Hydrol. Process., 24, 461–471, 2010.
Yin, X., Yang, Z., and Petts, G. E.: Reservoir operating rules to sustain environmental flows in regulated rivers, Water Resour. Res., 47, W08509, https://doi.org/10.1029/2010WR009991, 2011.
Yu, Y., Wang, P. F., Wang, C., Qian, J., and Hou, J.: Combined Monthly Inflow Forecasting and Multiobjective Ecological Reservoir Operations Model: Case Study of the Three Gorges Reservoir, J. Water Resour. Plan. Manag., 143, https://doi.org/10.1061/(ASCE)WR.1943-5452.0000786, 2017.
Zadeh, L. A.: Optimality and non-scalar-valued performance criteria, IEEE Trans. Autom. Control., 8, 59–60, 1963.
Zhang, C., Chen, C., Li, Y., Ding, W., and Fu, G.: Water-energy-food nexus: Concepts, questions, and methodologies, J. Clean. Prod., 195, 625–639, 2018.