the Creative Commons Attribution 4.0 License.
the Creative Commons Attribution 4.0 License.
 | 20 Dec 2021
Extreme precipitation events in the Mediterranean area: contrasting two different models for moisture source identification
Daniel Garaboa-Paz
Damián Insua-Costa
Gonzalo Miguez-Macho
Vicente Pérez-Muñuzuri
Concern about heavy precipitation events has increasingly grown in the last years in southern Europe, especially in the Mediterranean region. These occasional episodes can result in more than 200 mm of rainfall in less than 24 h, producing flash floods with very high social and economic losses. To better understand these phenomena, a correct identification of the origin of moisture must be found. However, the contribution of the different sources is very difficult to estimate from observational data; thus numerical models are usually employed to this end. Here, we present a comparison between two methodologies for the quantification of the moisture sources in two flooding episodes that occurred during October and November 1982 in the western Mediterranean area. A previous study, using the online Eulerian Weather Research and Forecasting (WRF) Model with water vapor tracer (WRF-WVT) model, determined the contributions to precipitation from moisture evaporated over four different sources: (1) the western Mediterranean, (2) the central Mediterranean, (3) the North Atlantic Ocean and (4) the tropical and subtropical Atlantic and tropical Africa. In this work we use the offline Lagrangian FLEXPART-WRF model to quantify the role played by these same sources. Considering the results provided by WRF-WVT as “ground truth”, we validated the performance of the FLEXPART-WRF. Results show that this Lagrangian method has an acceptable skill in identifying local (western Mediterranean) and medium-distance (central Mediterranean and North Atlantic) sources. However, remote moisture sources, like tropical and subtropical areas, are underestimated by it. Notably, for the October event, the tropical and subtropical area reported a relative contribution 6 times lower than with the WRF-WVT. In contrast, FLEXPART-WRF overestimates the contribution of some sources, especially from North Africa. These over- and underestimates should be taken into account by other authors when drawing conclusions from this widely used Lagrangian offline analysis.
- Article
(10368 KB) - Full-text XML
- BibTeX
- EndNote


Extreme rainfall and associated floods are one of the most devastating agents in the weather context. As an example, in 2019 alone, more than 5000 people died as a result of floods, and more than 30 million people were affected, resulting in economic losses of more than USD 35 billion (International Disaster Database; EMDAT.database, 2021). Therefore, the study of such catastrophic events is fundamental for prediction and anticipation.
Heavy precipitation events (HPEs) are distributed unevenly across the planet, and there are places that are very prone to receiving large rain accumulations in a short time, as opposed to other areas where the precipitation regime is much more moderate. One of these regions where extreme precipitation and flooding are very recurrent is the western Mediterranean Region (WMR) (Llasat et al., 2010). Several characteristics make this part of the planet so exposed to heavy precipitation; the Mediterranean Sea is a large and mild water body, enclosed by very complex orography and in a relatively northern latitude (e.g., Buzzi et al., 1998; Llasat, 2009; Dayan et al., 2015). In this area, most of the events take place in autumn (Mariotti et al., 2002), when Atlantic lows or cutoff lows (Nieto et al., 2005) often interact with warm Mediterranean Sea waters, leading to strong convection.
While HPEs are a regional phenomena, moisture feeding them not only comes from nearby sea evaporation but can originate in remote regions and be transported by different atmospheric mechanisms. In this sense, it has been shown that long-distance moisture transport through atmospheric rivers (ARs) is a crucial contributor to total precipitation amounts recorded in Europe and the United States (e.g., Lavers and Villarini, 2015; Hu and Dominguez, 2019; Pérez-Muñuzuri et al., 2018) and also to extreme rainfall episodes (e.g., Stohl et al., 2008; Eiras-Barca et al., 2017). As for the WMR, recent studies (e.g., Winschall et al., 2012; Pinto et al., 2013; Krichak et al., 2015; Insua-Costa et al., 2019) suggest that remote sources of moisture such as the North Atlantic or tropical or subtropical areas could contribute significantly to the frequent torrential rains there.
In order to find the origin of the moisture, different methodologies have been used in the past (see Gimeno et al., 2012, for a detailed review of numerical methods used in moisture source studies), with the Lagrangian models being the most widely used technique. It is based on the analysis of the moisture content change of air parcels being tracked backward (or, less commonly, forward) in time. Lagrangian methods are generally offline and therefore very efficient from a computational point of view. On the other hand, online Eulerian-type methods are much more computationally expensive and therefore have been less used. However, they are considered to be the most accurate tool for moisture sources studies (see Dominguez et al., 2020, for a classification by complexity of the different models used for moisture tracking). In the western Mediterranean, Lagrangian methods have been used by several authors (e.g., Reale et al., 2001; Turato et al., 2004; Nieto et al., 2010; Duffourg and Ducrocq, 2011), while the online Eulerian approaches have only been used by Winschall et al. (2012) and Insua-Costa et al. (2019).
In this study, we analyzed the moisture sources in two catastrophic flooding episodes that occurred in the WMR, using both the Lagrangian and Eulerian approaches. The online Eulerian model for moisture tracking employed was the Weather Research and Forecasting (WRF) Model with water vapor tracer diagnostics (WRF-WVT; Insua-Costa and Miguez-Macho, 2018). The results obtained using this tool have already been presented in a previous article (Insua-Costa et al., 2019). Thus, the objective of this study is to repeat the same strategy but in this case using the offline Lagrangian FLEXPART-WRF model (Brioude et al., 2013), so that we can intercompare the results provided by both methodologies. This type of comparison has already been presented recently by Winschall et al. (2014). However, the present study is especially focused on identifying the possible limitations of the FLEXPART-WRF and their causes, based on the assumption that WRF-WVT represents the “ground truth”. This was the same strategy followed by van der Ent et al. (2013) and Dominguez et al. (2020) in previous studies. One of the novelties with respect to these articles is that here the moisture sources will be analyzed from a nonlocal point of view; that is to say, a large-scale domain has been employed to be able to cover sources of remote origin. The aim is to check whether the FLEXPART-WRF has the same capacity to detect short-distance sources as well as long-distance ones. In summary, the present work is intended to contribute to the improvement of a type of Lagrangian analysis widely used for moisture source attribution on the basis of another technique (WRF-WVT) that is more accurate but much more computationally expensive and therefore less practical.
This study is structured as follows: in Sect. 2, Lagrangian and Eulerian methodologies are described and the procedure presented. The two case studies are briefly introduced in the first part of Sect. 3.1.1 and 3.1.2 respectively. More detailed description can be found in Insua-Costa et al. (2019). After that, results are structured as follows: Sect. 3.1 presents the moisture source analysis obtained from the offline Lagrangian method, Sect. 3.2 shows the comparison between the results provided by the FLEXPART-WRF and WRF-WVT techniques and Sect. 3.3 discusses the limitations of the Lagrangian technique used. Finally, Sect. 4 summarizes and concludes this work.
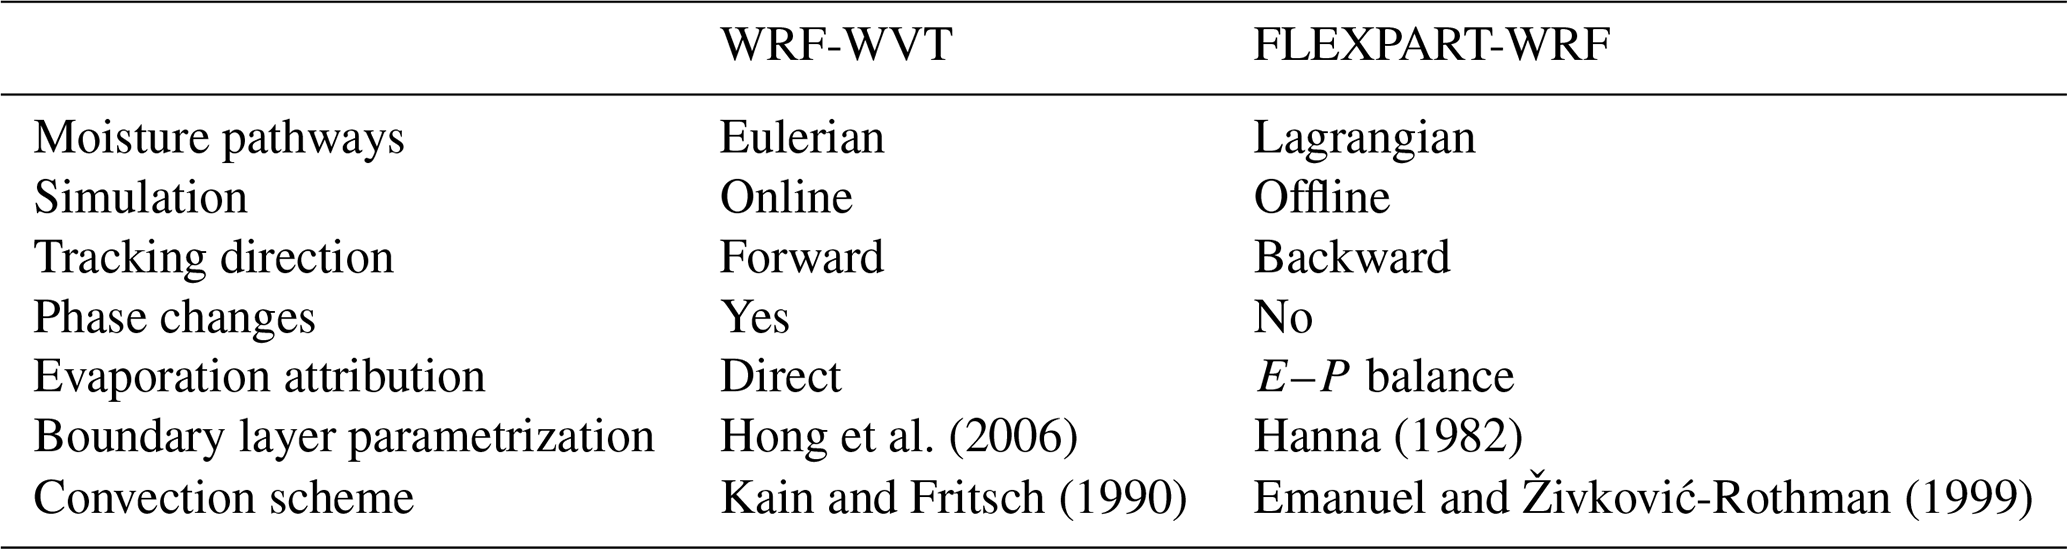
This section will describe the techniques used in the study. It is important to highlight that there are different types of Eulerian and Lagrangian tools for moisture tracking, so from now on, when we refer to the Lagrangian or Eulerian approach, we will be referring to the specific methodology explained here. A summary of the characteristics of the models discussed below can be found in Table 1.
Hong et al. (2006)Hanna (1982)Kain and Fritsch (1990)Emanuel and Živković-Rothman (1999)Table 1Some differences between the WRF-WVT model and the FLEXPART-WRF model.
2.1 Lagrangian approach
In this study we use the offline FLEXPART model (FLEXible PARTicle dispersion model; Pisso et al., 2019), which has been widely used to study moisture sources from a climatological perspective (e.g. James et al., 2003; Ciric et al., 2018; Drumond et al., 2014; Gimeno et al., 2013) as well as in particular heavy precipitation events (e.g. Stohl et al., 2008; Sun and Wang, 2014). Specifically, we use a version of FLEXPART that works with the Weather Research and Forecasting (WRF) regional atmospheric model (Skamarock et al., 2008), known as FLEXPART-WRF (Brioude et al., 2013).
The FLEXPART-WRF model itself is not a model for moisture source analysis but a Lagrangian particle dispersion model. This means that additional processing of the data provided by the model is necessary for its use in the study of moisture origin. Two hydrological techniques for this purpose based on moisture tracking along the trajectories calculated by FLEXPART-WRF are explained below. Although FLEXPART-WRF only deals with the dynamical part of the calculation (particle trajectories), we will refer with this name to the complete Lagrangian methodology (dynamical and hydrological part) used for the analysis of moisture sources.
2.1.1 E–P balance
According to the distribution of atmospheric mass, the simulation domain (covering 90∘ W to 60∘ E and 3∘ S to 65∘ N) is homogeneously divided into 4 million air parcels (or particles), which are subsequently advected backward in time during 11 d forced by the atmospheric fields provided by the WRF simulations. To find moisture origin, specific humidity q content change along the trajectory described by each particle is calculated as
where m is the mass of the particle, and the difference between e and p accounts for the increasing or decreasing water vapor ratio along the trajectory. From the previous equation, we can estimate the net water flux over a model grid cell of area A (), summing the variation rate in specific humidity for all the air parcels (K) contained in the atmospheric column over that area:
To analyze the moisture source regions that fed the 1982 WMR catastrophic precipitations, we calculate the balance E–P only for those air parcels involved in these episodes. Based on the precipitation fields provided by the WRF simulations (Figs. 2b and 5b), for the October 1982 case we only consider those particles contained within the affected region (blue in Fig. 1c) at some point during the event (from 19 October at 06:00 UTC to 21 October at 21:00 UTC). Likewise, for the November 1982 event, we consider particles within the red area in Fig. 1c from 6 November at 06:00 UTC to 8 November at 21:00 UTC. Furthermore, to ensure that we only select the particles contributing to precipitation, we will only select those that lose moisture g (kg⋅3 h)−1 over an area with outstanding accumulated rainfall rates E– mm (3 h)−1. Since we are only considering a subset of the total air parcels, E–P cannot be seen in this case as the net surface water flux but as an indicator of where the particles contributing to the extreme rains gained or lost moisture. The E–P field is calculated every 3 h and subsequently accumulated during 1, 4, 7 and 11 d prior to the precipitation events studied. This procedure for the identification of moisture sources based on the E–P field has been widely used since it was described by Stohl and James (2004).
2.1.2 Quantifying the contribution of the moisture sources
An air parcel tracked back in time over a 11 d period can experience different gains and losses of water vapor during that period. Let us suppose for example that one of the air parcels involved in the 1982 Mediterranean rains has positive values of dq dt 8 d before the event, when it was located over the tropical Atlantic. The fact that the particle gains humidity in that area does not guarantee that this region will end up contributing to the event because it is likely that this humidity will precipitate before that particle reaches the Mediterranean. Therefore, areas with positive values E–P should not be interpreted as moisture sources but as potential moisture sources. Sodemann et al. (2008) proposes a method to avoid this problem and to quantify the relative contribution of the sources. It is based on tracking, for a given moisture uptake, all subsequent gains and losses to know whether that gained moisture reaches the study area or precipitates before it does. Once we know the uptakes that really contribute to the rain event analyzed, we can define the relative contribution (RC) of a particular region of area Ai as
where is the total water vapor gained over the region of interest in a period of 11 d prior to the event, and is the equivalent for the total domain area AT.
Sodemann et al. (2008) also propose retaining only moisture uptakes from particles below 1.5 boundary layer height (BLH), since water vapor uptakes in the free atmosphere cannot be due to a surface flux but to deficiencies in the methodology. This attempt to reduce the possible errors of the method leads to the reformulation of Eq. (3) as
where and are calculated in the same way as and but taking into account only the air parcels within the boundary layer.
2.2 Eulerian approach
The Eulerian online method consists of a moisture tagging tool coupled to a regional or a global atmospheric model. The model code is modified in order to calculate new variables, called moisture tracers, which represent, for example, water vapor or cloud water coming from a desired moisture source region. This allows for the detailed estimation of the relative contribution of each considered source to a given precipitation event. As mentioned in the Introduction, the Eulerian tool used in this study is the WRF-WVT (Insua-Costa and Miguez-Macho, 2018), a moisture technique recently implemented in the WRF model version 3.8.1 (Skamarock et al., 2008).
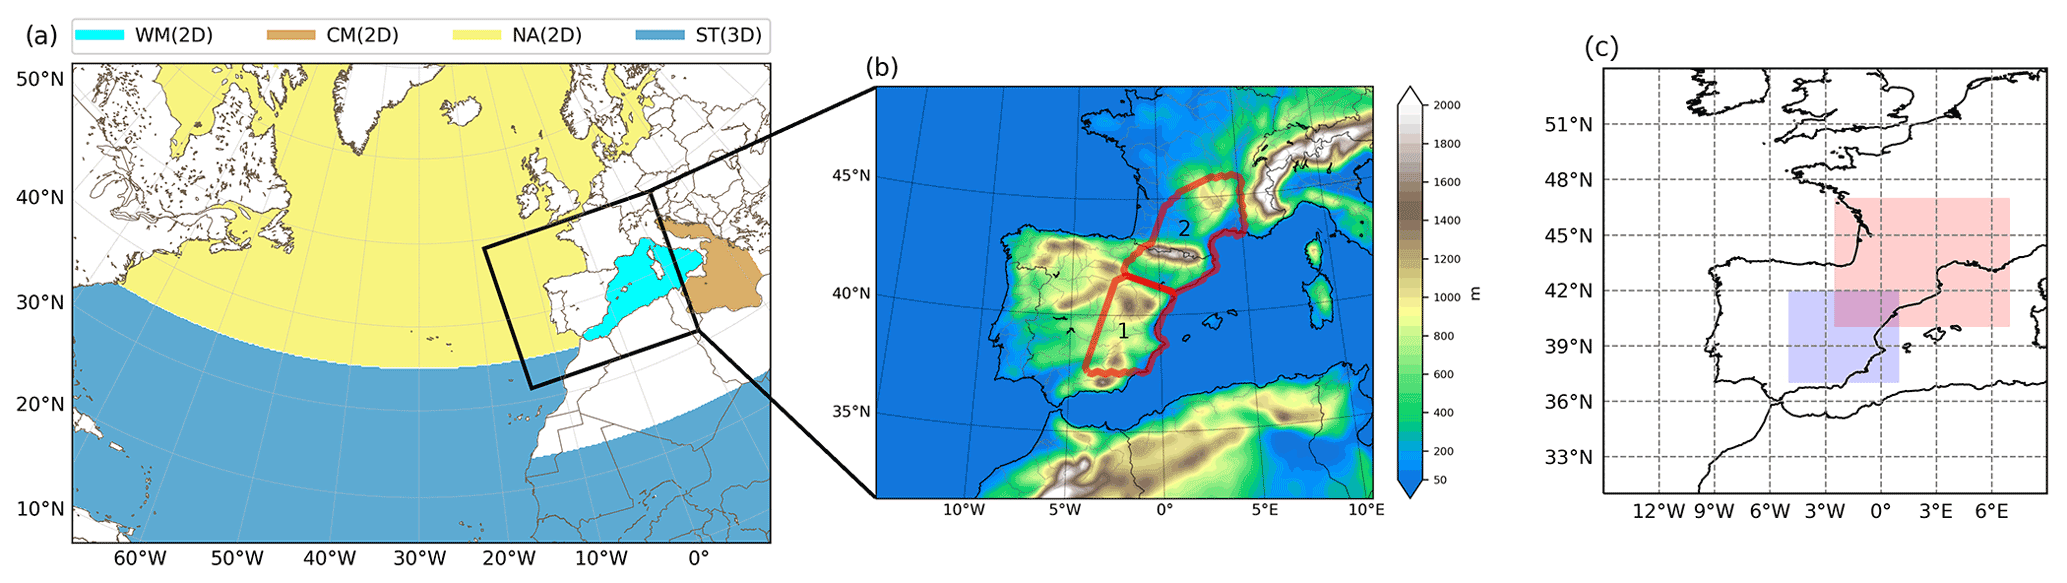
Figure 1(a) Moisture sources considered: western Mediterranean (cyan), central Mediterranean (brown) and North Atlantic (yellow) 2D sources; and tropical and subtropical 3D source(blue). (b) Regions most affected by the October (1) and November (2) events (original figure from Insua-Costa et al., 2019). (c) FLEXPART-WRF particle selection areas for the October (blue) and November (red) events.
The results obtained with the WRF-WVT for both 1982 precipitation events were already presented in Insua-Costa et al. (2019). For these two case studies, these authors analyzed moisture coming from two-dimensional (2D) and three-dimensional (3D) sources. To take into account moisture coming from sea surface evaporation over the western Mediterranean, central Mediterranean and North Atlantic, they used three different 2D sources, while to track moisture from tropical and subtropical regions, they considered a 3D source in order to include both evaporation and atmospheric water transport from other neighboring tropical regions. These source regions and the simulation domain used by Insua-Costa et al. (2019) are shown in Fig. 1a. In addition, Fig. 1b shows the regions most affected by the October (1) and November (2) events, respectively, on which Insua-Costa et al. (2019) calculated the precipitation fractions coming from the four source regions studied. For each analyzed source, a 11 d simulation was run with the WRF model over a large domain of 20 km of horizontal resolution and 35 vertical levels. For initial and boundary conditions, they used the ERA-Interim reanalysis (Dee et al., 2011), with spatial resolution of 0.7∘ and updated every 6 h. In the present study, the simulations of Insua-Costa et al. (2019) are used as (1) input fields to run the FLEXPART-WRF model and (2) to compare the results provided by this offline Lagrangian tool. Note that this strategy is especially appropriate for validating the results provided by the Lagrangian model, since both the WRF-WVT and the FLEXPART-WRF are driven by the same WRF meteorological model.
3.1 FLEXPART-WRF moisture source diagnosis
3.1.1 October event
On 20 October 1982, also known as “the Tous case”, there was a catastrophic flooding event caused by the extraordinary rains that fell over the Spanish Levante on that day. Heavy rainfall especially affected the Valencian Community (Fig. 2b), over which a quasi-stationary mesoscale convective complex was formed, the first identified in Europe (see Romero et al., 2000, for a detailed analysis of this episode). The synoptic situation leading to such extraordinary rainfall corresponded to the classic configuration usually affecting that region (Fig. 2a): a cutoff low near the Iberian Peninsula increasing thermal and dynamic instability and, simultaneously, low pressures emerging from North Africa at lower levels, causing a warm and humid flow that permanently feeds and sustains convection.
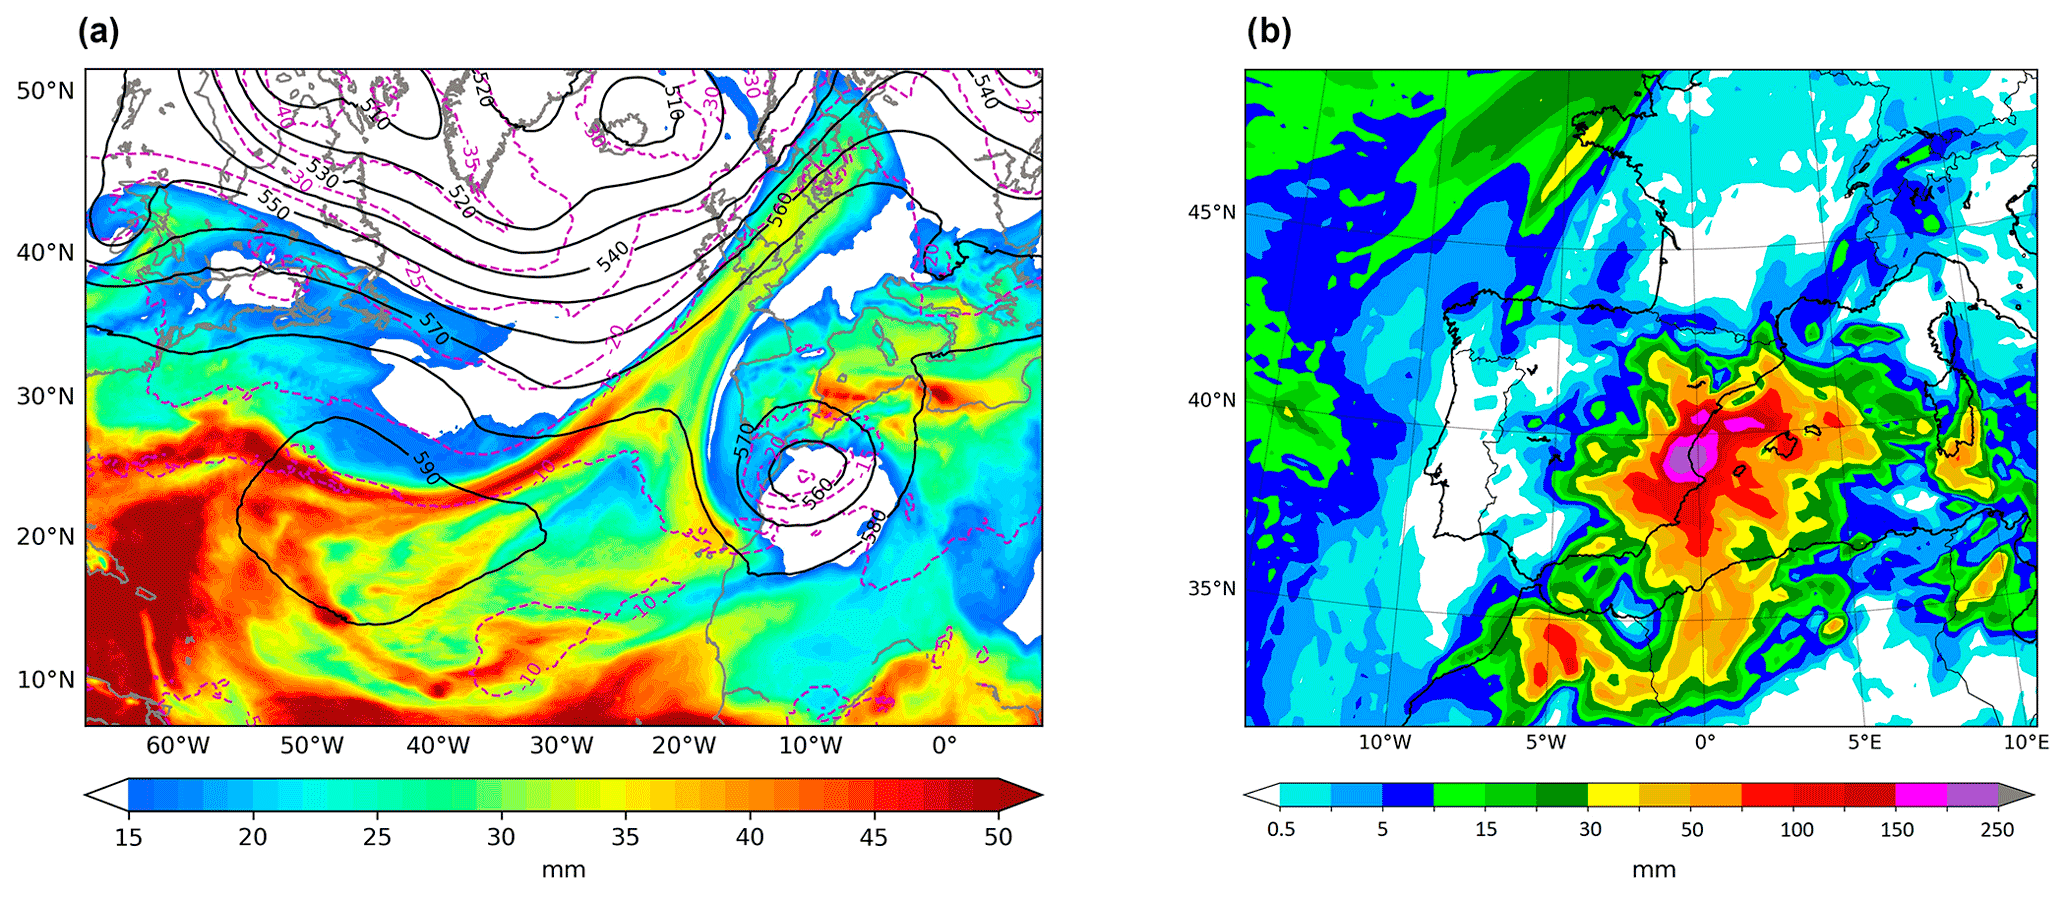
Figure 2(a) Synoptic situation (from WRF simulation) on 20 October 1982 at 12:00 UTC. Geopotential height (solid black contours, dam) and temperature at 500 hPa and total precipitable water (shades, mm). (b) Simulated total precipitation (mm) from 19 October at 06:00 UT to 22 October at 06:00 UTC (Insua-Costa et al., 2019).
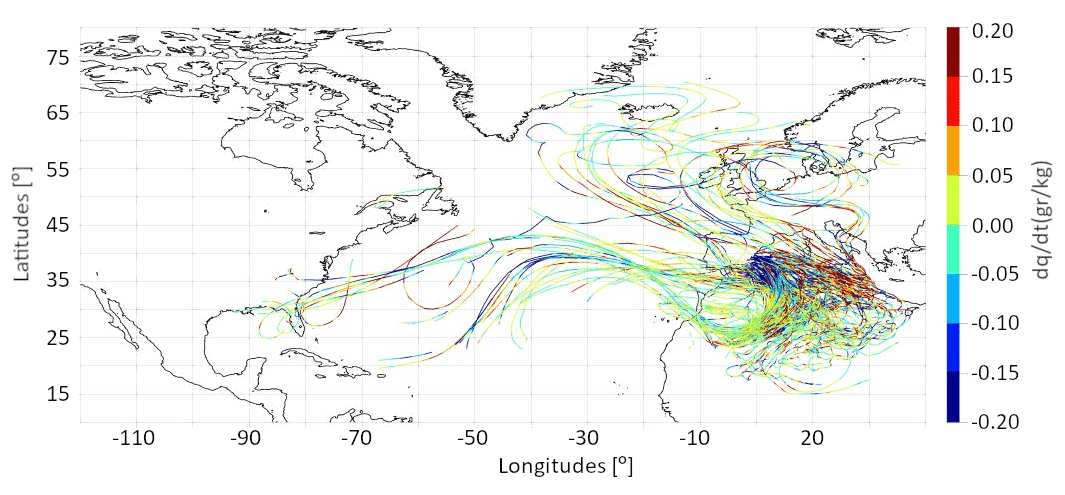
Figure 3A period of 11 d backtracking for a reduced subset of selected particles precipitating over the target area (blue in Fig. 1c) between 18:00–21:00 UTC on 20 October. Moisture exchanges are represented along the particle path.
Humidity exchanges along trajectories for a small subset of particles previously selected are shown in Fig. 3. Only those particles that experience a significant moisture decrease for 20 October, 18:00–21:00 UTC, were considered. The high density of trajectories over the western and central Mediterranean indicates that much of the moisture could come from evaporation over this area. In fact, the dq dt values for air parcels crossing the Mediterranean are generally positive, indicating that they gain moisture along their paths over this sea. In addition, part of the trajectories point to a remote origin of the moisture. Some of the particles comes from the tropical Atlantic and reach the affected region after crossing the Atlantic and North Africa. The counterclockwise turn of the trajectories over Morocco reflects the position of the cutoff low that led to the heavy rains (Fig. 2). Finally, other air parcels originated over the North Atlantic, indicating that various moisture sources may have contributed to the event.
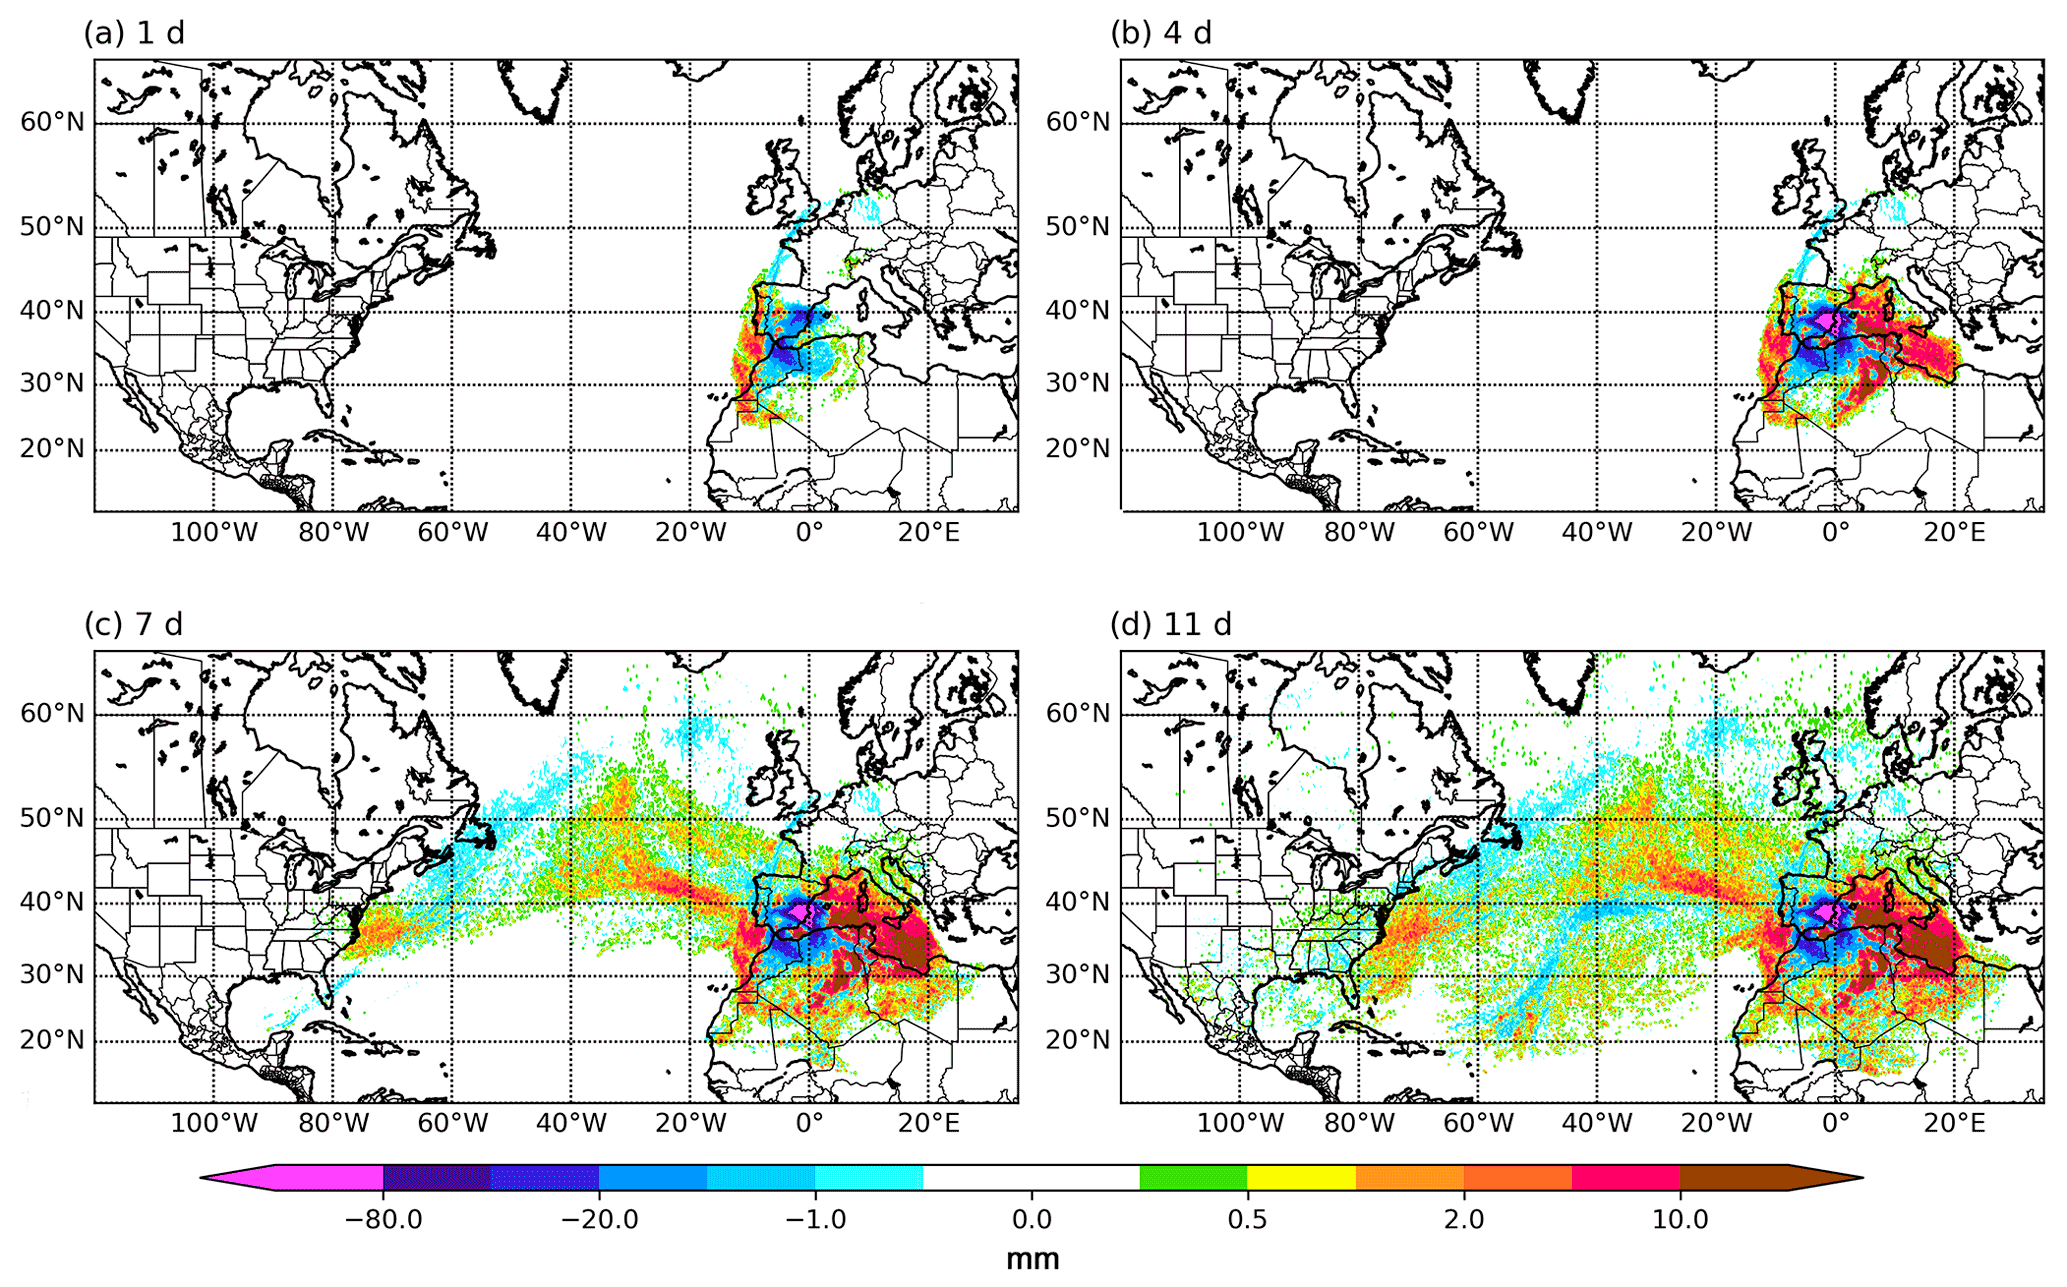
Figure 4E–P balance evolution back in time for 1 (a), 4 (b), 7 (c) and 11 d (d). Particles were selected from 5∘ W–1∘ E and 37–42∘ N for 19 October at 06:00 UTC to 21 October at 21:00 UTC.
The E–P balance shown in Fig. 4 more clearly points to the areas where the air parcels contributing to precipitation in the events gained or lost moisture. Specifically, we show the E–P balance evolution for the time periods of 1, 4, 7 and 11 d prior to the end of the event (21 October at 06:00 UTC). As expected, the lowest values of E–P are found over the target region during the first 3 d, which reflects the moisture discharge during the extreme precipitation event. Thus, negative values in the first days show the area most affected by the extreme rainfall. In the first 24 h, the highest positive values of E–P are found in the eastern end of the Atlantic. Backwards in time, up to 4 d before the end of the event, the areas with positive E–P values expand to much of the western and central Mediterranean. Therefore, these areas nearby would have fed the air parcels contributing to the event just hours before they reached the target region. In the case of the Mediterranean, E–P values continue to increase up to 7 d before, indicating that not only was the contribution of evaporation in the hours prior to the event significant, but the evaporation in the previous days was too. In addition, a clear difference between days 4 and 7 is that positive (and also negative) values of E–P appear in remote regions, mainly over the North Atlantic. These positive values extend even into the tropical and subtropical Atlantic when we calculate the accumulated E–P of the previous 11 d. This indicates that the contribution of humidity from the Atlantic may have been significant. Furthermore, this humidity would be older; i.e., it would have had a longer residence time. One last area with positive E–P values is North Africa. Although the values on the northern coast of the continent might be realistic, the values inland are totally inconsistent since evaporation in that area of the Sahara is practically zero throughout the year. Therefore, these values must necessarily be due to the limitations of the method. We will return to this subject below.
Finally, we would like to clarify again that while positive E–P values occur in areas with a high probability of having contributed to the event, this is not entirely certain, since some of the moisture gains, especially those more distant in time and space, are likely to have been lost in a previous precipitation discharge. Regions with negative E–P could also have contributed moisture to the event, although this is less likely. For example, the Spanish east coast in Fig. 4 has very negative values because there the P values were very high during the event. However, this does not mean that the E values were zero; a preliminary analysis shows that a significant fraction of the total evaporation occurs when E–P < 0 (see https://doi.org/10.5194/hess-2020-651-RC2, Tuinenburg, 2021). In fact, it is very likely that evaporation in this area in the previous days contributed significant amounts of moisture. This contribution, which would correspond to local precipitation recycling, would be completely ignored if one considers that only areas with E–P > 0 can contribute to the event. It is therefore very important to take these nuances into account in order to make a proper reading of the E–P field.
3.1.2 November event
Only a few days after the Tous case, on 7 November, catastrophic flooding occurred again in the WMR. In this case, heavy rainfall particularly affected northeast Spain, southeast France and Andorra (Fig. 5b). The atmospheric configuration that led to the excessive rainfall was very different from that occurring in October (Fig. 5a): a deep low-pressure system centered off the Atlantic coast of Galicia drove a very humid and relatively warm southwesterly flow that impacted perpendicularly against the Pyrenees and the southern face of the French Massif Central. The orographic lift in these areas triggered convective cores embedded in a wider area of stratiform rainfall, which in turn gave rise to persistent and occasionally very intense precipitation (see Trapero et al., 2013, for a more detailed discussion about this event).
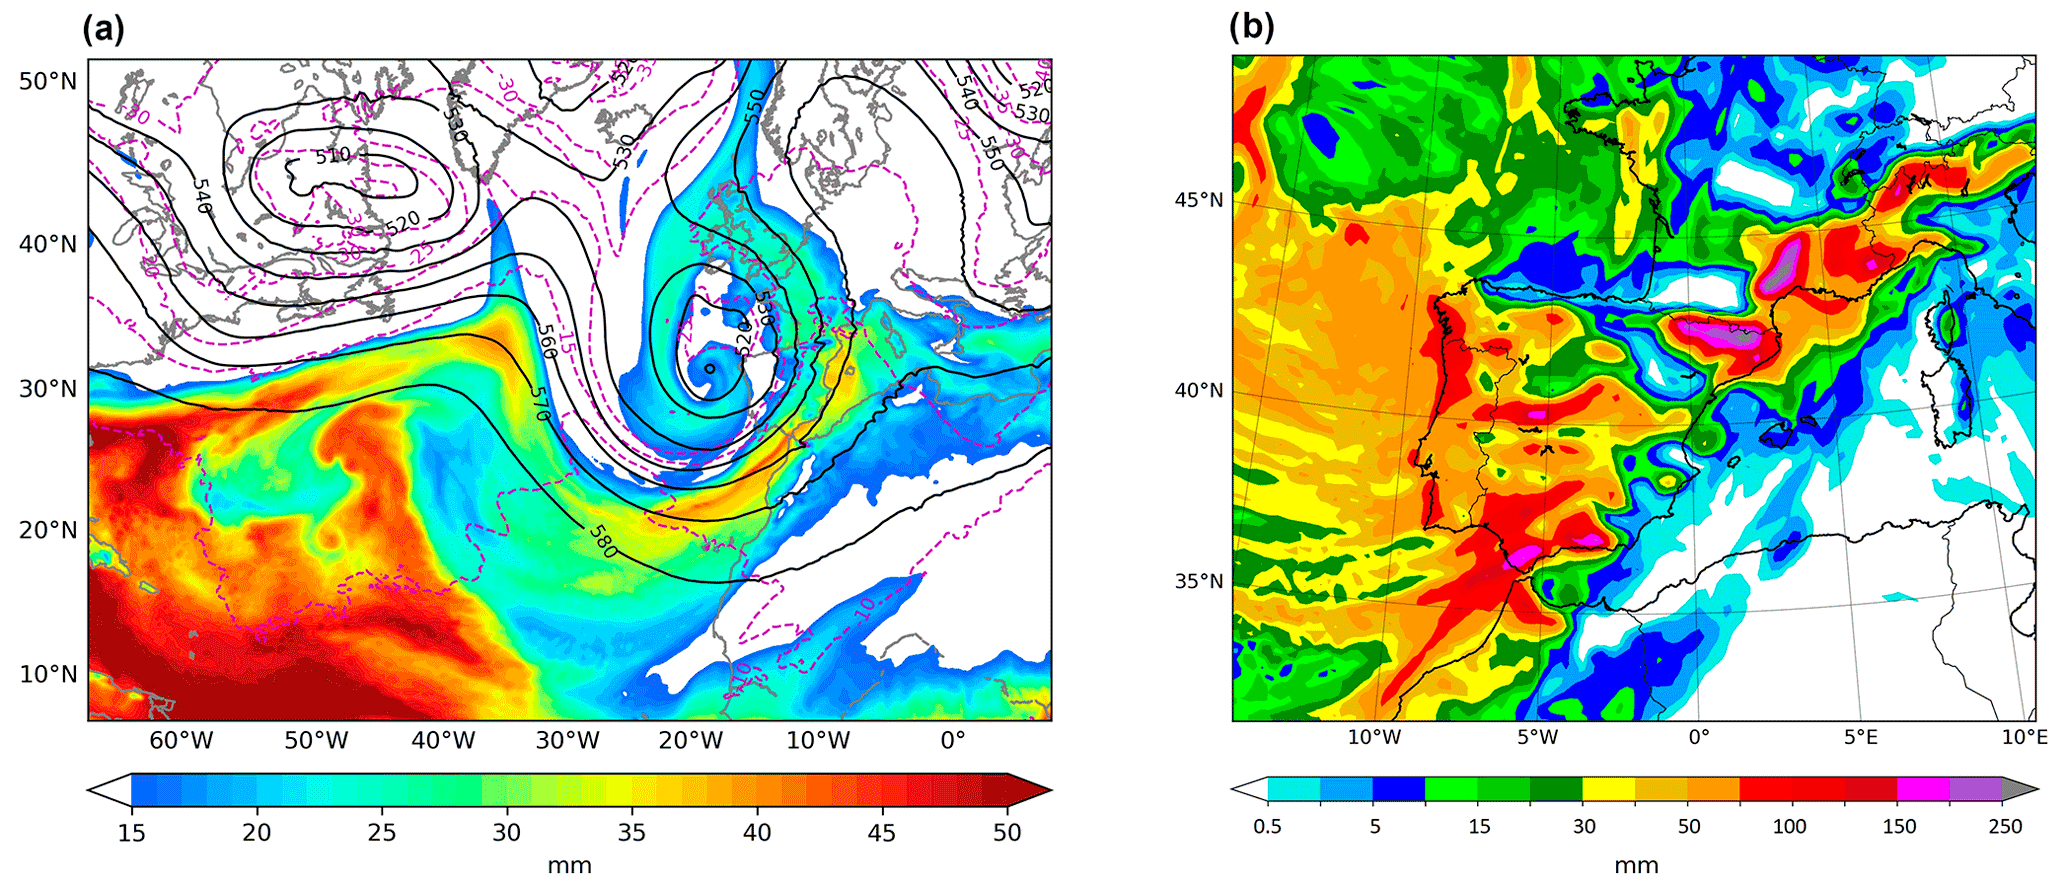
Figure 5(a) Synoptic situation (from WRF simulation) on 7 November 1982 at 12:00 UTC. Geopotential height (solid black contours, dam) and temperature at 500 hPa and total precipitable water (shades,mm). (b) Simulated total precipitation (mm) from 6 November at 06:00 UTC to 9 November at 06:00 UTC (Insua-Costa et al., 2019).
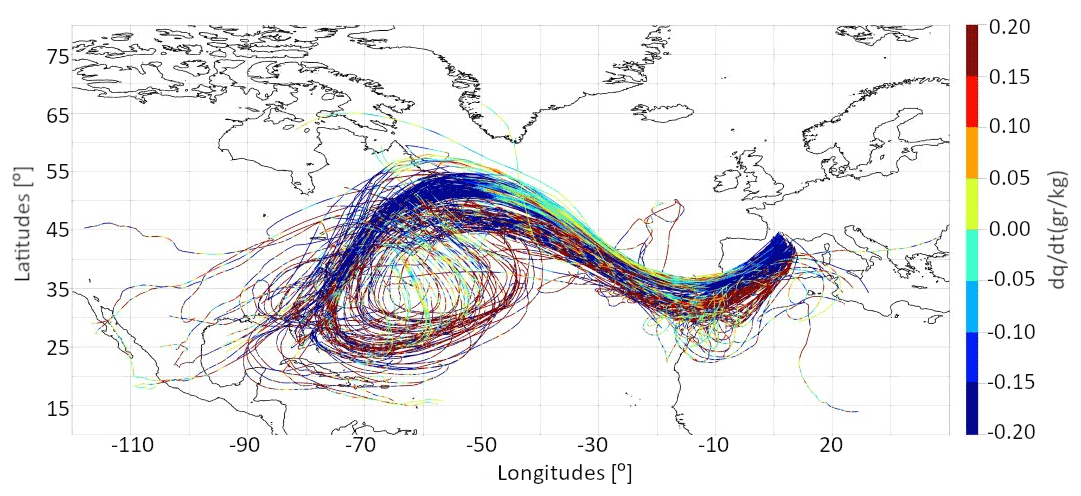
Figure 6A period of 11 d backtracking for a subset of particles precipitating over the region of interest between 12:00–15:00 UTC on 7 November. Color corresponds to moisture exchanges along the paths followed by particles.
Figure 6 shows the specific humidity content change for a subset of particles with significant moisture losses between 12:00–15:00 UTC on 7 November. In this case the particle trajectories are not as varied as in the case of October, but a main route distinguishes itself. Most of the trajectories have their origin in the western tropical Atlantic. From there, the parcels are advected towards the north and cross the Atlantic driven by the deep low-pressure system that gave rise to the extreme rainfall event (Fig. 5). In the final phase, a few hours before the particles reached the northeast of the Iberian Peninsula, the air parcels were advected northward again, entering via North Africa and southern Spain. Some of them crossed the western end of the Mediterranean before their impact on the target area. It follows that in this case the main source of moisture must be the Atlantic, while the contribution of the Mediterranean should be minor because the time that air parcels spend over this potential moisture source is limited.
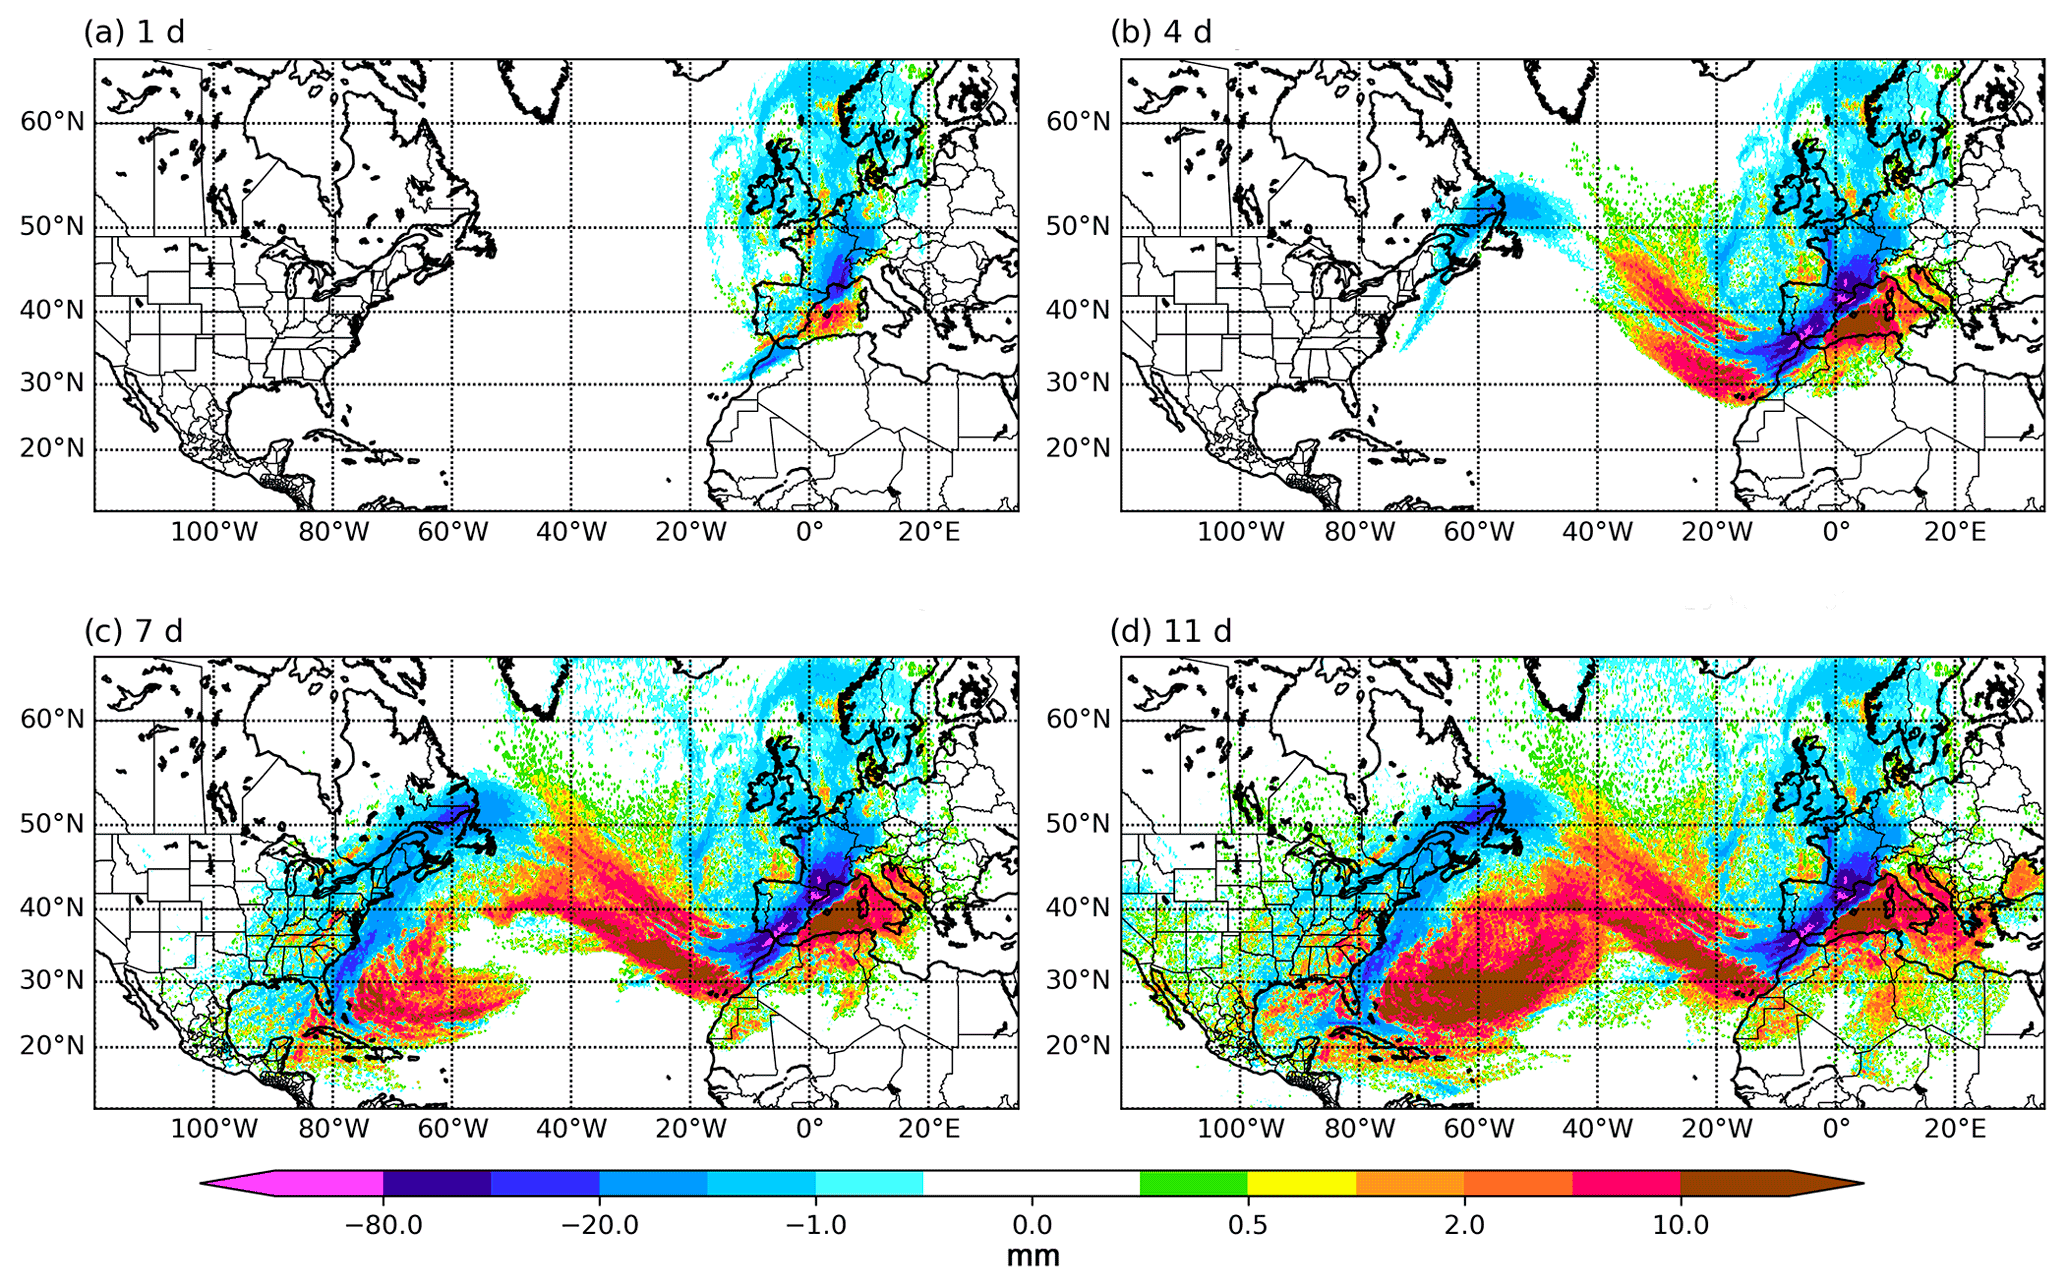
Figure 7Similar to Fig. 4. Balance E–P evolution back in time for 1 (a), 4 (b), 7 (c) and 11 d (d). Particles were selected from 2.5∘ W–7∘ E and 40–47∘ N for 6 November at 06:00 UTC to 8 November at 21:00 UTC.
Figure 7 is analogous to Fig. 4 but for the November event. In this case, the negative values of E–P in the first 24 h cover a vast region, due to the large size of the low-pressure system located off the coast of Galicia (Fig. 5). Positive values of E–P in the first 24 h are only found in the western Mediterranean. Therefore, the Mediterranean provided a last humidity recharge before the air parcels contributing to the precipitation reached the affected region. The E–P field accumulated in the 4 d prior to the end of the event clearly shows the areas most affected by extreme rainfall (northeast and southwest Spain, south of France and Andorra). The positive values of E–P extend towards the Atlantic and increase in the Mediterranean. Further back in time, between days 7 and 11, the highest values are found in the tropical and subtropical western Atlantic. The way the E–P values are distributed is consistent with the particle trajectories (Fig. 6) and also with the precipitable water field (Fig. 5a). In summary, the air mass in this event had a tropical/subtropical origin and was recharging its moisture content as it passed through the Atlantic and finally through the western Mediterranean.
3.2 Comparison of WRF-WVT vs. FLEXPART-WRF methodologies
The previous analysis of the particles trajectories and the E–P field allows for a qualitative diagnostic of the moisture sources but not a quantitative one. In contrast, the WRF-WVT method of Insua-Costa et al. (2019) calculates the exact percentage of precipitation coming from the four source regions of Fig. 1a for the two infamous events of autumn 1982. In order to compare the results provided by the FLEXPART-WRF technique with those obtained by Insua-Costa et al. (2019), these same percentages have been computed using the methodology introduced by Sodemann et al. (2008), previously described.
Figure 8a shows the fraction (RC, Eq. 3) of the total precipitation accumulated during the case of October 1982 coming from each of the four analyzed sources, calculated with the WRF-WVT (blue) and the FLEXPART-WRF (purple). Both methods yield similar contributions from the western Mediterranean Sea (16.81 % versus 19.14 %) and North Atlantic Ocean (13.25 % versus 14.89 %). However, the central Mediterranean contribution according to the FLEXPART-WRF is half of that calculated with the WRF-WVT (7.38 % versus 18.28 %). The most surprising difference between the results provided by both methods is found in the tropics and subtropics; while for the WRF-WVT this is the main source (31.02 %), for the FLEXPART-WRF its contribution is only 5.39 %. The great difference for this source finally results in the WRF-WVT assigning about 83 % of the relative contribution to the ensemble of the four considered sources, while the FLEXPART-WRF reports a much smaller contribution for these same areas in conjunction (45.49 %).
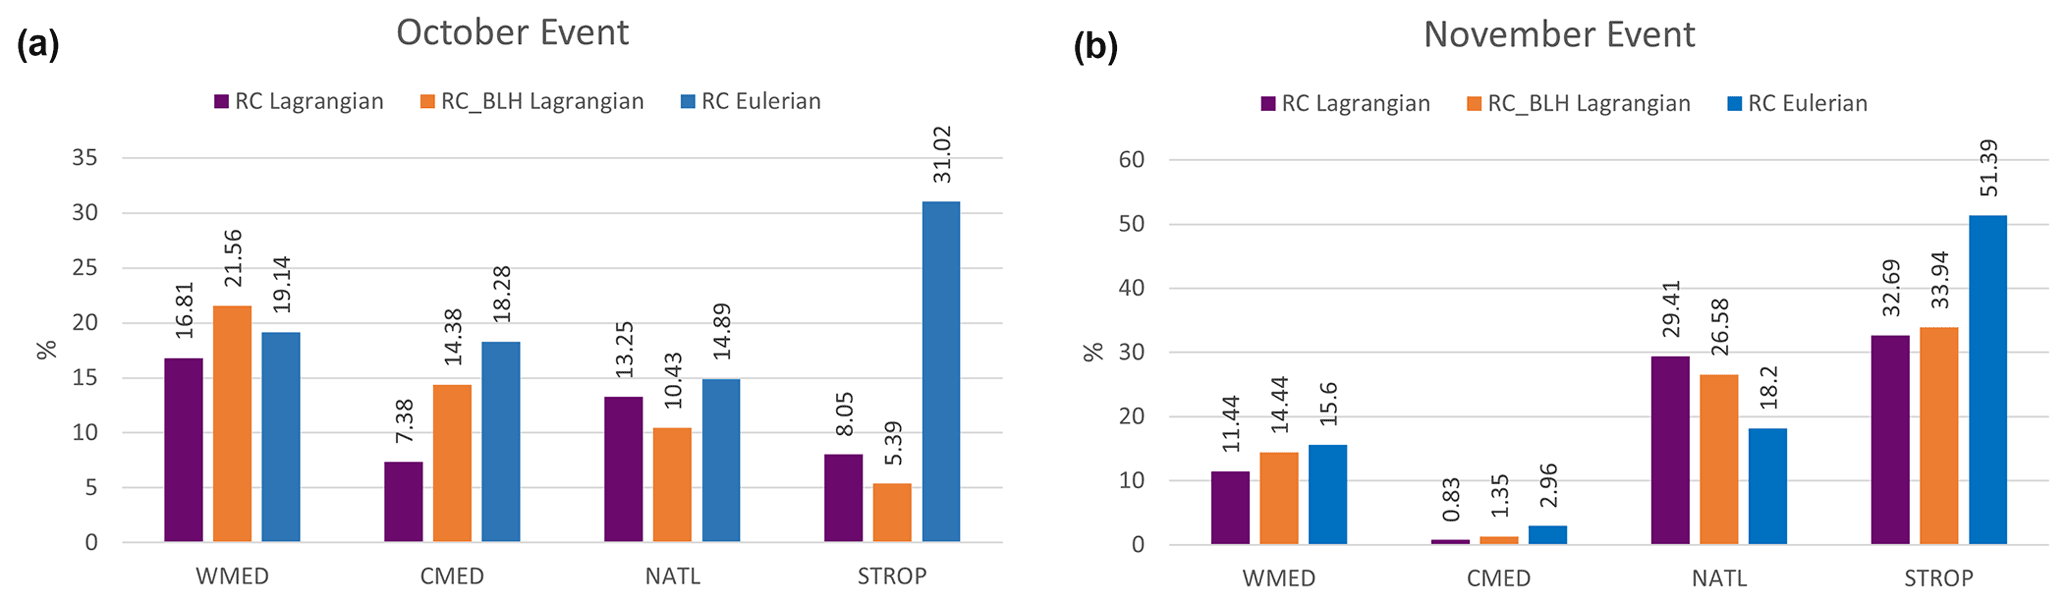
Figure 8Comparison between the relative contributions provided by the FLEXPART-WRF and the WRF-WVT models for the October event (a) and the November event (b). WMED, CMED, NATL and STROP correspond to western Mediterranean, central Mediterranean, North Atlantic and tropical/subtropical areas, respectively.
For the November event, the relative contributions are shown in Fig. 8b. In this case, the FLEXPART-WRF estimates 74.37 % of joint relative contribution for the four considered sources, a very similar value to that obtained by the WRF-WVT (88.15 %). A comparison between both approaches shows similar estimations for the central Mediterranean Sea (0.83 % versus 2.96 %) and the western Mediterranean Sea (11.44 % versus 15.60 %), the least important moisture sources for this episode. Nevertheless, for the North Atlantic, the FLEXPART-WRF results in a significant overestimation compared with the WRF-WVT (29.41 % versus 18.20 %). On the contrary, the FLEXPART-WRF underestimates the contribution of moisture from the tropics and subtropics (32.69 % versus 51.39 %).
3.3 Limitations of the analysis with FLEXPART-WRF and possible causes
The above results show a great difference between the relative contributions obtained with the FLEXPART-WRF and the WRF-WVT methods. The biggest discrepancy is found in the subtropical and tropical contribution. For the case of October, FLEXPART-WRF underestimates this source by 74 %, while in the case of November this underestimation is 36 %. For local moisture sources, such as the Mediterranean Sea, there is generally a better match, but significant biases remain.
Our experiments suggest that the FLEXPART-WRF is limited for quantitative moisture source analysis in specific case studies. That limitation seems to especially affect estimates of the moisture contribution from remote sources, such as the tropics and subtropics in our case. Notwithstanding, in the November event the underestimation for tropical and subtropical moisture was substantially less than in the October case. The November episode was more “dynamic”, with higher winds that would have made air parcels travel faster along a narrower pathway. In the October event, particles move slower and through diverse paths, so that they disperse further backward in time and spend more time in regions with weak wind. This difference could have been crucial in making the calculations in the October case more problematic.
In an attempt to reduce these large biases, we have recalculated the relative contributions of each source considered in Insua-Costa et al. (2019) by considering only the moisture increases of those air parcels within the boundary layer (RCBLH, Eq. 4), as proposed in Sodemann et al. (2008). Results are also shown in Fig. 8 (orange bars). In general, this new approach improves the results; i.e., they are closer to those provided by the WRF-WVT. However, the error reduction is small, and large biases remain for remote sources. Therefore, we conclude that most of the errors of this analysis are associated with air parcels located within the boundary layer.
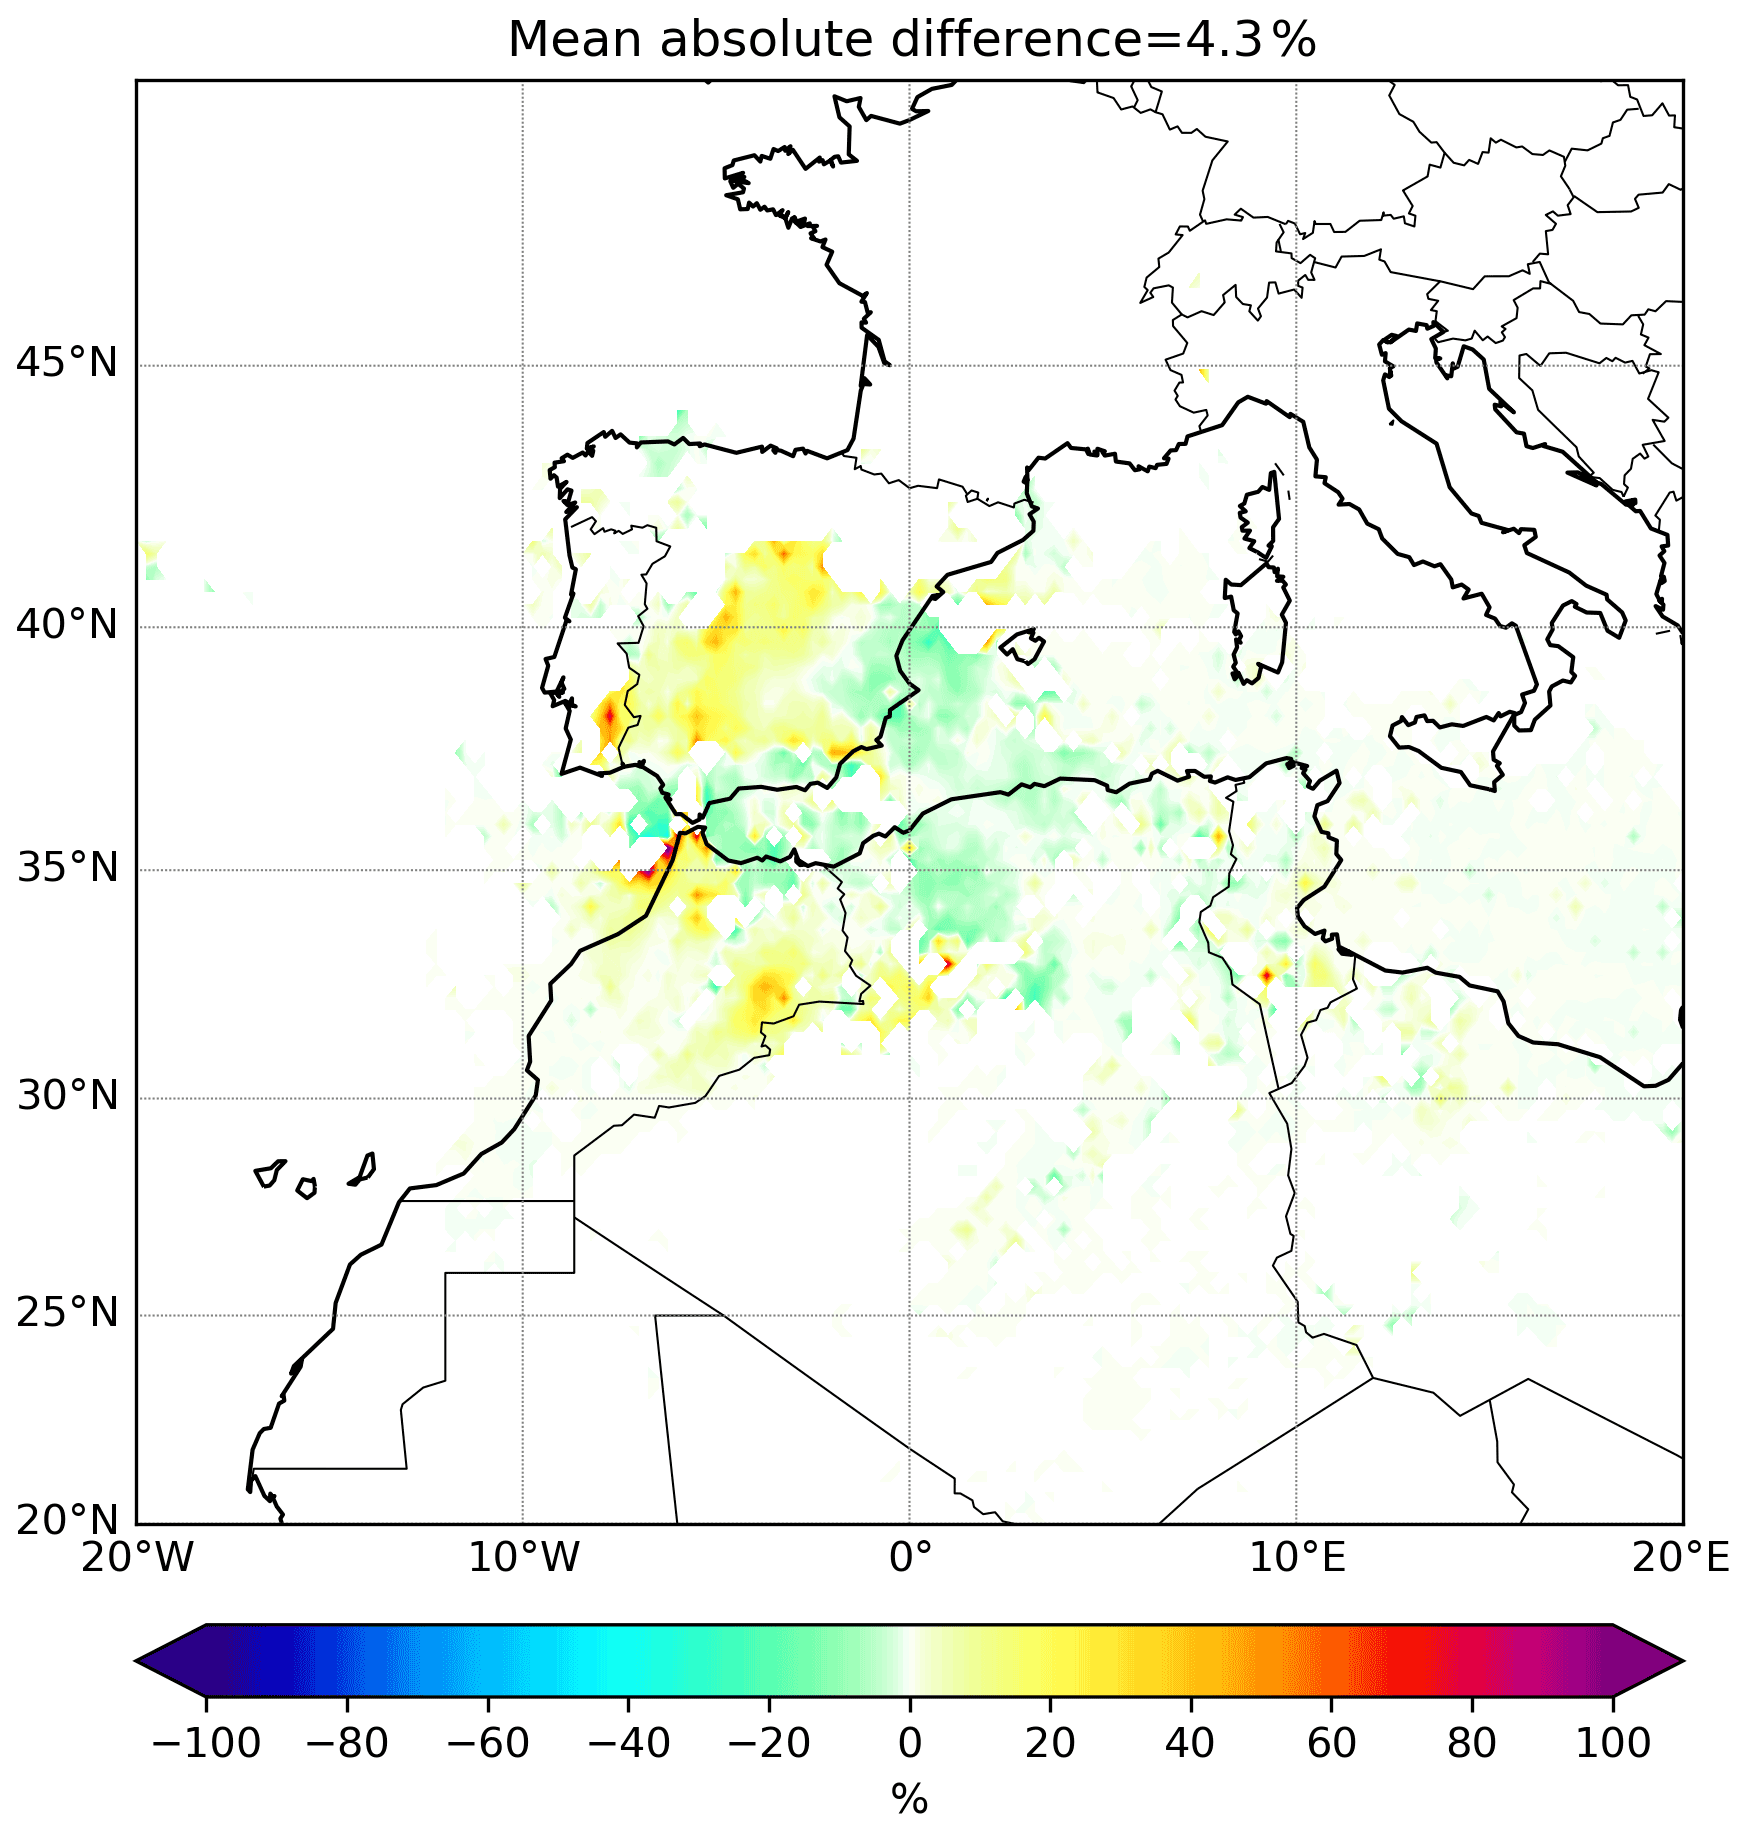
Another important consideration is related to the unrealistic values that the FLEXPART-WRF yields in some parts of the region of study. This problem is especially evident for the October case over the Sahara, as stated above. E–P values are highly positive, suggesting an important moisture gain. However it is not possible for that gain to come from a surface evaporation flux because evaporation over that area is essentially zero. Initially, we had hypothesized that these unrealistic values might be due to phase changes, which are not taken into account by the FLEXPART-WRF. Cloudiness was abundant over most of North Africa, so that some of this water could have evaporated into the very dry Saharan lower atmosphere, leading to an increase in the particles' water vapor content. To quantify this effect, we have taken advantage of the fact that the WRF model includes six moisture species (vapor, cloud water, rain water, snow, ice and graupel) to incorporate the sum of all these species in the FLEXPART-WRF. That is, we have repeated the calculation shown in Eq. (1) but in this case with q being the sum of all moisture species within an air parcel instead of just water vapor. Results show that the effect of including liquid and solid water in the model is very small. Specifically, the average relative difference in E–P field values is about 4 % (Fig. 9). These results agree with those of van der Ent et al. (2013), who reached the same conclusion using a totally different methodology.
Therefore, the errors found must have their causes in other physical or numerical processes that the FLEXPART-WRF is not considering correctly. The increase over time of inaccuracies in the calculations of particle trajectories or in the interpolations of specific moisture content could be some examples. Importantly, one of the problems that could have contributed the most to the errors encountered is the fact that the FLEXPART-WRF neglects the convergence and divergence of moisture (see https://doi.org/10.5194/hess-2020-651-CC1, van der Ent, 2021). Figure 10 describes this process. In a “normal” situation, a Lagrangian air parcel moves (dynamic situation), and variations in the specific moisture content along its trajectory are associated with evapotranspiration or precipitation processes. However, when the particle is in a converging air flow, the position of the particle does not change (zero net velocity) if convergence takes place equally from all sides of the particle, but the moisture content increases. The FLEXPART-WRF will associate this increase with a surface evaporation process, when in fact it has nothing to do with it. On the contrary, if a particle is in a diverging flow, its moisture content could be reduced without this being associated with a precipitation process. This could be especially problematic when tracking a small set of parcels (Tuinenburg and Staal, 2020). This issue requires further and more detailed investigation, specifically focused on moisture convergence and divergence situations, to establish a more robust and definite conclusion.

Figure 10Schematic representation of the problem with convergence and divergence of moisture undergone by the FLEXPART-WRF.
Two of the most used techniques for the study of moisture origin are the Lagrangian offline and the Eulerian online models. The use of one or the other can be a controversial point (van der Ent et al., 2013), but in general it is clear that Lagrangian models are more computationally efficient, which makes them more practical. For this reason, they have been widely used. However, it is important to take into account the limitations of these methods for a more rigorous analysis.
Here, we have compared the results of the Lagrangian FLEXPART-WRF model with those obtained from the Eulerian WRF-WVT model for two extreme rainfall events occurred in the western Mediterranean region in October and November 1982, respectively. The objective was to validate the performance of the FLEXPART-WRF, considering the WRF-WVT results as the “truth” with which to compare.
The results show that the use of the FLEXPART-WRF is very limited for a quantitative study of moisture sources because large biases were found when compared with the WRF-WVT. For the nearest sources, in our case the Mediterranean Sea and the North Atlantic Ocean, the results obtained with both methods have a remarkable coincidence in general. However, the contribution of tropical and subtropical areas is not adequately captured by FLEXPART-WRF, since it is grossly underestimated. In addition, the model produces unrealistic values in some areas. These unrealistic values become especially evident over the Sahara region during the case of October. Due to the low evaporation rate in that zone, it is impossible for it to act as one of the main moisture sources, as the FLEXPART-WRF suggests.
Therefore, we propose that the FLEXPART-WRF is more appropriate for a qualitative description of the origin of moisture rather than to estimate precise source contribution numbers. Finally, we have delved into some of the causes and found possible solutions to the errors. We have shown that phase changes, which had been raised as a potential source of error by other authors (Stohl and James, 2004), actually affect the calculations very little. A simple approach to improve the performance of the Lagrangian method, which was proposed by Sodemann et al. (2008) and consisted in considering only the air parcels within the boundary layer, has proved insufficient to reduce the errors encountered. Therefore, we conclude that it is necessary to make further progress in the improvement of these types of tools for moisture tracking.
All relevant data are presented within the paper. The ERA-Interim reanalysis data can be found at https://www.ecmwf.int/en/forecasts/dataset/ecmwf-reanalysis-interim (ECMWF, 2021).
SC carried out the experiment and wrote the manuscript with support from DGP and DIC. VPM and GMM helped supervise the project. GMM conceived the original idea, and DGP supervised the project.
The contact author has declared that neither they nor their co-authors have any competing interests.
Publisher’s note: Copernicus Publications remains neutral with regard to jurisdictional claims in published maps and institutional affiliations.
This research has been supported by the Ministerio de Ciencia e Innovación (grant no. OPERMO-CGL2017-89859-R). This program is co-funded by the European Union ERDF and the Xunta de Galicia (grant no. 2021-PG036).
This paper was edited by Daniel Viviroli and reviewed by Obbe Tuinenburg, Ruud van der Ent, and one anonymous referee.
EMDAT.database: https://public.emdat.be/data, last access: 15 December 2021. a
Brioude, J., Arnold, D., Stohl, A., Cassiani, M., Morton, D., Seibert, P., Angevine, W., Evan, S., Dingwell, A., Fast, J. D., Easter, R. C., Pisso, I., Burkhart, J., and Wotawa, G.: The Lagrangian particle dispersion model FLEXPART-WRF version 3.1, Geosci. Model Dev., 6, 1889–1904, https://doi.org/10.5194/gmd-6-1889-2013, 2013. a, b
Buzzi, A., Tartaglione, N., and Malguzzi, P.: Numerical simulations of the 1994 piedmont flood: Role of orography and moist processes, Mon. Weather Rev., 126, 2369–2383, https://doi.org/10.1175/1520-0493(1998)126<2369:NSOTPF>2.0.CO;2, 1998. a
Ciric, D., Nieto, R., Losada, L., Drumond, A., and Gimeno, L.: The mediterranean moisture contribution to climatological and extreme monthly continental precipitation, Water, 10, 519, https://doi.org/10.3390/w10040519, 2018. a
Dayan, U., Nissen, K., and Ulbrich, U.: Review Article: Atmospheric conditions inducing extreme precipitation over the eastern and western Mediterranean, Nat. Hazards Earth Syst. Sci., 15, 2525–2544, https://doi.org/10.5194/nhess-15-2525-2015, 2015. a
Dee, D. P., Uppala, S. M., Simmons, A. J., Berrisford, P., Poli, P., Kobayashi, S., Andrae, U., Balmaseda, M. A., Balsamo, G., Bauer, P., Bechtold, P., Beljaars, A. C. M., van de Berg, L., Bidlot, J., Bormann, N., Delsol, C., Dragani, R., Fuentes, M., Geer, A. J., Haimberger, L., Healy, S. B., Hersbach, H., Hólm, E. V., Isaksen, L., Kållberg, P., Köhler, M., Matricardi, M., Mcnally, A. P., Monge-Sanz, B. M., Morcrette, J. J., Park, B. K., Peubey, C., de Rosnay, P., Tavolato, C., Thépaut, J. N., and Vitart, F.: The ERA-Interim reanalysis: Configuration and performance of the data assimilation system, Q. J. Roy. Meteor., 137, 553–597, https://doi.org/10.1002/qj.828, 2011. a
Dominguez, F., Hu, H., and Martinez, J. A.: Two-layer dynamic recycling model (2L-DRM): learning from moisture tracking models of different complexity, J. Hydrometeorol., 21, 3–16, 2020. a, b
Drumond, A., Marengo, J., Ambrizzi, T., Nieto, R., Moreira, L., and Gimeno, L.: The role of the Amazon Basin moisture in the atmospheric branch of the hydrological cycle: a Lagrangian analysis, Hydrol. Earth Syst. Sci., 18, 2577–2598, https://doi.org/10.5194/hess-18-2577-2014, 2014. a
Duffourg, F. and Ducrocq, V.: Origin of the moisture feeding the Heavy Precipitating Systems over Southeastern France, Nat. Hazards Earth Syst. Sci., 11, 1163–1178, https://doi.org/10.5194/nhess-11-1163-2011, 2011. a
ECMWF: ECMWF Reanalysis – Interim (ERA-Interim), available at: https://www.ecmwf.int/en/forecasts/dataset/ecmwf-reanalysis-interim, last access: 16 December 2021. a
Eiras-Barca, J., Dominguez, F., Hu, H., Garaboa-Paz, D., and Miguez-Macho, G.: Evaluation of the moisture sources in two extreme landfalling atmospheric river events using an Eulerian WRF tracers tool, Earth Syst. Dynam., 8, 1247–1261, https://doi.org/10.5194/esd-8-1247-2017, 2017. a
Emanuel, K. A. and Živković-Rothman, M.: Development and evaluation of a convection scheme for use in climate models, J. Atmos. Sci., 56, 1766–1782, https://doi.org/10.1175/1520-0469(1999)056<1766:DAEOAC>2.0.CO;2, 1999. a
Skamarock, W. C., Klemp, J. B., Dudhia, J., Gill, D. O., Barker, D. M., Wang, W., and Powers, J. G.: A description of the advanced research WRF version 3, NCAR Tech. Note, NCAR/TN-468+STR, Natl. Cent. for Atmos. Res. Boulder, Colorado, 2008. a, b
Gimeno, L., Stohl, A., Trigo, R. M., Dominguez, F., Yoshimura, K., Yu, L., Drumond, A., Durn-Quesada, A. M., and Nieto, R.: Oceanic and terrestrial sources of continental precipitation, Rev. Geophys., 40, 1443–1450, https://doi.org/10.1029/2012RG000389, 2012. a
Gimeno, L., Nieto, R., Drumond, A., Castillo, R., and Trigo, R.: Influence of the intensification of the major oceanic moisture sources on continental precipitation, Geophys. Res. Lett., 40, 1443–1450, https://doi.org/10.1002/grl.50338, 2013. a
Hanna, S. R.: Applications in air pollution modeling. Atmospheric Turbulence and Air Pollution Modelling: A Course Held in The Hague, 21–25 September 1981, edited by: Nieuwstadt, F. T. M. and van Dop, H., and Reidel, D., 275–310, 1982. a
Hong, S. Y., Noh, Y., and Dudhia, J.: A new vertical diffusion package with an explicit treatment of entrainment processes, Mon. Weather Rev., 134, 2318–2341, https://doi.org/10.1175/MWR3199.1, 2006. a
Hu, H. and Dominguez, F.: Understanding the Role of Tropical Moisture in Atmospheric Rivers, J. Geophys. Res.-Atmos., 124, 13826–13842, https://doi.org/10.1029/2019JD030867, 2019. a
Insua-Costa, D. and Miguez-Macho, G.: A new moisture tagging capability in the Weather Research and Forecasting model: formulation, validation and application to the 2014 Great Lake-effect snowstorm, Earth Syst. Dynam., 9, 167–185, https://doi.org/10.5194/esd-9-167-2018, 2018. a, b
Insua-Costa, D., Miguez-Macho, G., and Llasat, M. C.: Local and remote moisture sources for extreme precipitation: a study of the two catastrophic 1982 western Mediterranean episodes, Hydrol. Earth Syst. Sci., 23, 3885–3900, https://doi.org/10.5194/hess-23-3885-2019, 2019. a, b, c, d, e, f, g, h, i, j, k, l, m, n
James, P., Stohl, A., Forster, C., Eckhardt, S., Seibert, P., and Frank, A.: A 15-year climatology of stratosphere-troposphere exchange with a Lagrangian particle dispersion model: 1. Methodology and validation, J. Geophys. Res.-Atmos., 108, 8519, https://doi.org/10.1029/2002jd002637, 2003. a
Kain, J. S. and Fritsch, J. M.: A one-dimensional entraining/detraining plume model and its application in convective parameterization, J. Atmos. Sci., 47, 2784–2802, https://doi.org/10.1175/1520-0469(1990)047<2784:AODEPM>2.0.CO;2, 1990. a
Krichak, S. O., Barkan, J., Breitgand, J. S., Gualdi, S., and Feldstein, S. B.: The role of the export of tropical moisture into midlatitudes for extreme precipitation events in the Mediterranean region, Theor. Appl. Climatol., 121, 499–515, https://doi.org/10.1007/s00704-014-1244-6, 2015. a
Lavers, D. A. and Villarini, G.: The contribution of atmospheric rivers to precipitation in Europe and the United States, J. Hydrol., 2015, 382–390, https://doi.org/10.1016/j.jhydrol.2014.12.010, 2015. a
Llasat, M. C.: High magnitude storms and floods, The Physical Geography of the Mediterranean, edited by: Woodward, JC, Oxford University Press, Oxford, 513–540, 2009. a
Llasat, M. C., Llasat-Botija, M., Prat, M. A., Porcú, F., Price, C., Mugnai, A., Lagouvardos, K., Kotroni, V., Katsanos, D., Michaelides, S., Yair, Y., Savvidou, K., and Nicolaides, K.: High-impact floods and flash floods in Mediterranean countries: the FLASH preliminary database, Adv. Geosci., 23, 47–55, https://doi.org/10.5194/adgeo-23-47-2010, 2010. a
Mariotti, A., Struglia, M. V., Zeng, N., and Lau, K. M.: The hydrological cycle in the Mediterranean region and implications for the water budget of the Mediterranean sea, J. Climate, 15, 1674–1690, https://doi.org/10.1175/1520-0442(2002)015<1674:THCITM>2.0.CO;2, 2002. a
Nieto, R., Gimeno, L., de la Torre, L., Ribera, P., Gallego, D., García-Herrera, R., García, J. A., Nuñez, M., Redaño, A., and Lorente, J.: Climatological features of cutoff low systems in the Northern Hemisphere, J. Climate, 18, 3085–3103, https://doi.org/10.1175/JCLI3386.1, 2005. a
Nieto, R., Gimeno, L., Drumond, A., and Hernandez, E.: A Lagrangian identification of the main moisture sources and sinks affecting the Mediterranean area, WSEAS Transactions on Environment and Development, 6, 365–374, 2010. a
Pérez-Muñuzuri, V., Eiras-Barca, J., and Garaboa-Paz, D.: Tagging moisture sources with Lagrangian and inertial tracers: application to intense atmospheric river events, Earth Syst. Dynam., 9, 785–795, https://doi.org/10.5194/esd-9-785-2018, 2018. a
Pinto, J. G., Ulbrich, S., Parodi, A., Rudari, R., Boni, G., and Ulbrich, U.: Identification and ranking of extraordinary rainfall events over Northwest Italy: The role of Atlantic moisture, J. Geophys. Res.-Atmos. 118, 2085–2097, https://doi.org/10.1002/jgrd.50179, 2013. a
Pisso, I., Sollum, E., Grythe, H., Kristiansen, N. I., Cassiani, M., Eckhardt, S., Arnold, D., Morton, D., Thompson, R. L., Groot Zwaaftink, C. D., Evangeliou, N., Sodemann, H., Haimberger, L., Henne, S., Brunner, D., Burkhart, J. F., Fouilloux, A., Brioude, J., Philipp, A., Seibert, P., and Stohl, A.: The Lagrangian particle dispersion model FLEXPART version 10.4, Geosci. Model Dev., 12, 4955–4997, https://doi.org/10.5194/gmd-12-4955-2019, 2019. a
Reale, O., Feudale, L., and Turato, B.: Evaporative moisture sources during a sequence of floods in the Mediterranean region, Geophys. Res. Lett., 28, 2085–2088, https://doi.org/10.1029/2000GL012379, 2001. a
Romero, R., Doswell, C. A., and Ramis, C.: Mesoscale numerical study of two cases of long-lived quasi-stationary convective systems over eastern Spain, Mon. Weather Rev., 128, 3731–3751, https://doi.org/10.1175/1520-0493(2001)129<3731:MNSOTC>2.0.CO;2, 2000. a
Sodemann, H., Schwierz, C., and Wernli, H.: Interannual variability of Greenland winter precipitation sources: Lagrangian moisture diagnostic and North Atlantic Oscillation influence, J. Geophys. Res.-Atmos., 113, D03107, https://doi.org/10.1029/2007JD008503, 2008. a, b, c, d, e
Stohl, A. and James, P.: A Lagrangian analysis of the atmospheric branch of the global water cycle: Part 1: Method description, validation, and demonstration for the August 2002 flooding in central Europe, J. Hydrometeorol., 5, 656–678, https://doi.org/10.1175/1525-7541(2004)005<0656:ALAOTA>2.0.CO;2, 2004. a, b
Stohl, A., Forster, C., and Sodemann, H.: Remote sources of water vapor forming precipitation on the Norwegian west coast at 60∘ N – A tale of hurricanes and an atmospheric river, J. Geophys. Res.-Atmos., 113, D05102, https://doi.org/10.1029/2007JD009006, 2008. a, b
Sun, B. and Wang, H.: Moisture sources of semiarid grassland in China using the lagrangian particle model FLEXPART, J. Climate, 27, 2457–2474, https://doi.org/10.1175/JCLI-D-13-00517.1, 2014. a
Trapero, L., Bech, J., Duffourg, F., Esteban, P., and Lorente, J.: Mesoscale numerical analysis of the historical November 1982 heavy precipitation event over Andorra (Eastern Pyrenees), Nat. Hazards Earth Syst. Sci., 13, 2969–2990, https://doi.org/10.5194/nhess-13-2969-2013, 2013. a
Tuinenburg, O.: Referee comment 2, https://doi.org/10.5194/hess-2020-651-RC2, 2021. a
Tuinenburg, O. A. and Staal, A.: Tracking the global flows of atmospheric moisture and associated uncertainties, Hydrol. Earth Syst. Sci., 24, 2419–2435, https://doi.org/10.5194/hess-24-2419-2020, 2020. a
Turato, B., Reale, O., and Siccardi, F.: Water vapor sources of the October 2000 Piedmont flood, J. Hydrometeorol., 5, 693–712, https://doi.org/10.1175/1525-7541(2004)005<0693:WVSOTO>2.0.CO;2, 2004. a
van der Ent, R.: Community comment 1, https://doi.org/10.5194/hess-2020-651-CC1, 2021. a
van der Ent, R. J., Tuinenburg, O. A., Knoche, H.-R., Kunstmann, H., and Savenije, H. H. G.: Should we use a simple or complex model for moisture recycling and atmospheric moisture tracking?, Hydrol. Earth Syst. Sci., 17, 4869–4884, https://doi.org/10.5194/hess-17-4869-2013, 2013. a, b, c
Winschall, A., Pfahl, S., Sodemann, H., and Wernli, H.: Impact of North Atlantic evaporation hot spots on southern Alpine heavy precipitation events, Q. J. Roy. Meteor. Soc., 138, 1245–1258, https://doi.org/10.1002/qj.987, 2012. a, b
Winschall, A., Pfahl, S., Sodemann, H., and Wernli, H.: Comparison of Eulerian and Lagrangian moisture source diagnostics – the flood event in eastern Europe in May 2010, Atmos. Chem. Phys., 14, 6605–6619, https://doi.org/10.5194/acp-14-6605-2014, 2014. a