the Creative Commons Attribution 4.0 License.
the Creative Commons Attribution 4.0 License.
 | 09 Dec 2021
Simulating sediment discharge at water treatment plants under different land use scenarios using cascade modelling with an expert-based erosion-runoff model and a deep neural network
Valentin Landemaine
Jérôme Ledun
Arnaud Soulignac
Matthieu Fournier
Jean-François Ouvry
Olivier Cerdan
Benoit Laignel
Excessive sediment discharge in karstic regions can be highly disruptive to water treatment plants. It is essential for catchment stakeholders and drinking water suppliers to limit the impact of high sediment loads on potable water supply, but their strategic choices must be based on simulations integrating surface and groundwater transfers and taking into account possible changes in land use. Karstic environments are particularly challenging as they face a lack of accurate physical descriptions for the modelling process, and they can be particularly complex to predict due to the non-linearity of the processes generating sediment discharge. The aim of the study was to assess the sediment discharge variability at a water treatment plant according to multiple realistic land use scenarios. To reach that goal, we developed a new cascade modelling approach with an erosion-runoff geographic information system (GIS) model (WaterSed) and a deep neural network. The model was used in the Radicatel hydrogeological catchment (106 km2 in Normandy, France), where karstic spring water is extracted to a water treatment plant. The sediment discharge was simulated for five design storms under current land use and compared to four land use scenarios (baseline, ploughing up of grassland, eco-engineering, best farming practices, and coupling of eco-engineering/best farming practices). Daily rainfall time series and WaterSed modelling outputs extracted at connected sinkholes (positive dye tracing) were used as input data for the deep neural network model. The model structure was found by a classical trial-and-error procedure, and the model was trained on 2 significant hydrologic years. Evaluation on a test set showed a good performance of the model (NSE = 0.82), and the application of a monthly backward-chaining nested cross-validation revealed that the model is able to generalize on new datasets. Simulations made for the four land use scenarios suggested that ploughing up 33 % of grasslands would increase sediment discharge at the water treatment plant by 5 % on average. By contrast, eco-engineering and best farming practices will significantly reduce sediment discharge at the water treatment plant (respectively in the ranges of 10 %–44 % and 24 %–61 %). The coupling of these two strategies is the most efficient since it affects the hydro-sedimentary production and transfer processes (decreasing sediment discharge from 40 % to 80 %). The cascade modelling approach developed in this study offers interesting opportunities for sediment discharge prediction at karstic springs or water treatment plants under multiple land use scenarios. It also provides robust decision-making tools for land use planning and drinking water suppliers.
- Article
(5667 KB) - Full-text XML
- BibTeX
- EndNote


In karstic environments, erosion and runoff can lead to a high load of sediments in surface and underground streams. Sediment discharge (SD) can occur through rapid and direct transfer via sinkholes and/or via re-suspension of sediment in the karst network itself (Masséi et al., 2003). For suppliers of drinking water, excessive sediment input can be highly disruptive, requiring additional treatment or, in the worst cases, temporary shutdowns of a water treatment plant (WTP; Stevenson and Bravo, 2019). Impacts can be significant, including restrictions on the use of drinking water. Upper Normandy (France) is particularly affected, and the economic cost linked to the restrictions on the use of drinking water due to excessive sediment inputs in raw water was estimated at EUR 5 million during the period 1992–2018 (Patault et al., 2021a); 10 000 to 20 000 people are still affected every year by restrictions on the use of drinking water in the region (ARS, 2013). Reducing sediment delivery to sinkholes is therefore essential for catchment managers in order to reduce the impact on potable water supply. One way to achieve this would be to build a complex decision-making process modelling chain, integrating surface and groundwater transfers. Several approaches have been proposed to model erosion/runoff and the karstic response induced by rainfall, but these approaches are often treated separately, which does not make it possible to evaluate the impact of a change in land use on the sediment load delivered to a WTP. Many studies in the literature have focused on hillslope erosion processes using different types of erosion models (Merritt et al., 2003; De Vente et al., 2013). Empirical models, such as RUSLE (Renard and Freidmund, 1994), are frequently used because of limited data requirements but are not able to fully represent spatial and temporal dynamics of erosion processes at the catchment scale (Verstraeten et al., 2007). Physical models, such as WEPP or LISEM (Laflen et al., 1991; Takken et al., 1999), can more accurately describe processes but may require many input parameters that are not available for application to large areas. Expert-based models (e.g. STREAM, WaterSed; Cerdan et al., 2001; Landemaine, 2016) offer an interesting compromise focusing on the main driving factors of runoff and erosion. These models have been designed with cultivated areas of the European loess belt in mind and are particularly efficient where Hortonian overland flow dominates (Souchère et al., 2005; Evrard et al., 2010; Landemaine, 2016). Some hillslope erosion studies conducted in similar karstic environments do not account for the transmissivity loss of water and sediment in sinkholes. Other studies that have focused on modelling karst processes have mainly examined karstic floods but, for the most part, have overlooked sedimentary fluxes (see the review of Hartmann et al., 2014). Due to the non-linearity of the processes generating sediment at karstic springs and the lack of accurate physical descriptions of karstic environments, modelling surface–subsurface interactions with physical models can therefore be a difficult task (Savary et al., 2017; Jourde et al., 2018). Based on systemic approaches, as initiated by Mangin (1984), karst can be considered a system able to transform an input (rainfall) into an output (discharge), and the input–output relation can be evaluated using mathematical functions. This approach can be considered a “black-box” model to some extent, and recent research emphasized the advantages of using data-driven techniques, such as deep neural networks (DNNs) in similar situations (Yaseen et al., 2015; Kratzert et al., 2018, 2019). DNNs are advanced artificial neural networks (ANNs) which have been gaining momentum since 2012 in the computer sciences and whose adoption has been gradual in hydrology (Shen, 2018). DNNs are now commonly used for modelling real-world problems due to their ability to represent and generalize complex non-linear relationships between inputs and outputs (Meyers et al., 2016, 2017; Hafeez et al., 2019). DNNs can help by providing both stronger predictive capabilities and a complementary avenue toward knowledge discovery in the hydrologic sciences (Shen et al., 2018). Limited but conclusive applications were made to predict inflows to reservoirs, water levels of combined sewage outflow structures, turbidity, and flood forecasting in karst regions and integrated in rainfall–runoff modelling to better predict streamflows (Siou et al., 2011; Bai et al., 2016; Savary et al., 2017; Hu et al., 2018; Kratzert et al., 2018). The main objectives of this study were (i) to develop a cascade modelling approach able to simulate hydro-sedimentary transfer at a WTP for specific daily rainfall events and (ii) to evaluate the impact of different land use scenarios on the SD variability. This study was conducted in the Radicatel hydrogeological catchment (Normandy, France), where spring water is extracted to a WTP. We benefited from the use of an existing expert-based geographic information system (GIS) model (WaterSed), developed and successfully applied to the studied area, to simulate the impact of land use management on hydro-sedimentary transfers to connected sinkholes. Rainfall event characteristics and WaterSed outputs were then used as input for a data-driven model (i.e. a DNN) to simulate SD at the WTP. The cascade modelling approach was applied to multiple design storms (DS) under different scenarios in order to simulate hydro-sedimentary transfer in the hydrogeological catchment and evaluate the efficiency of different land use management strategies.
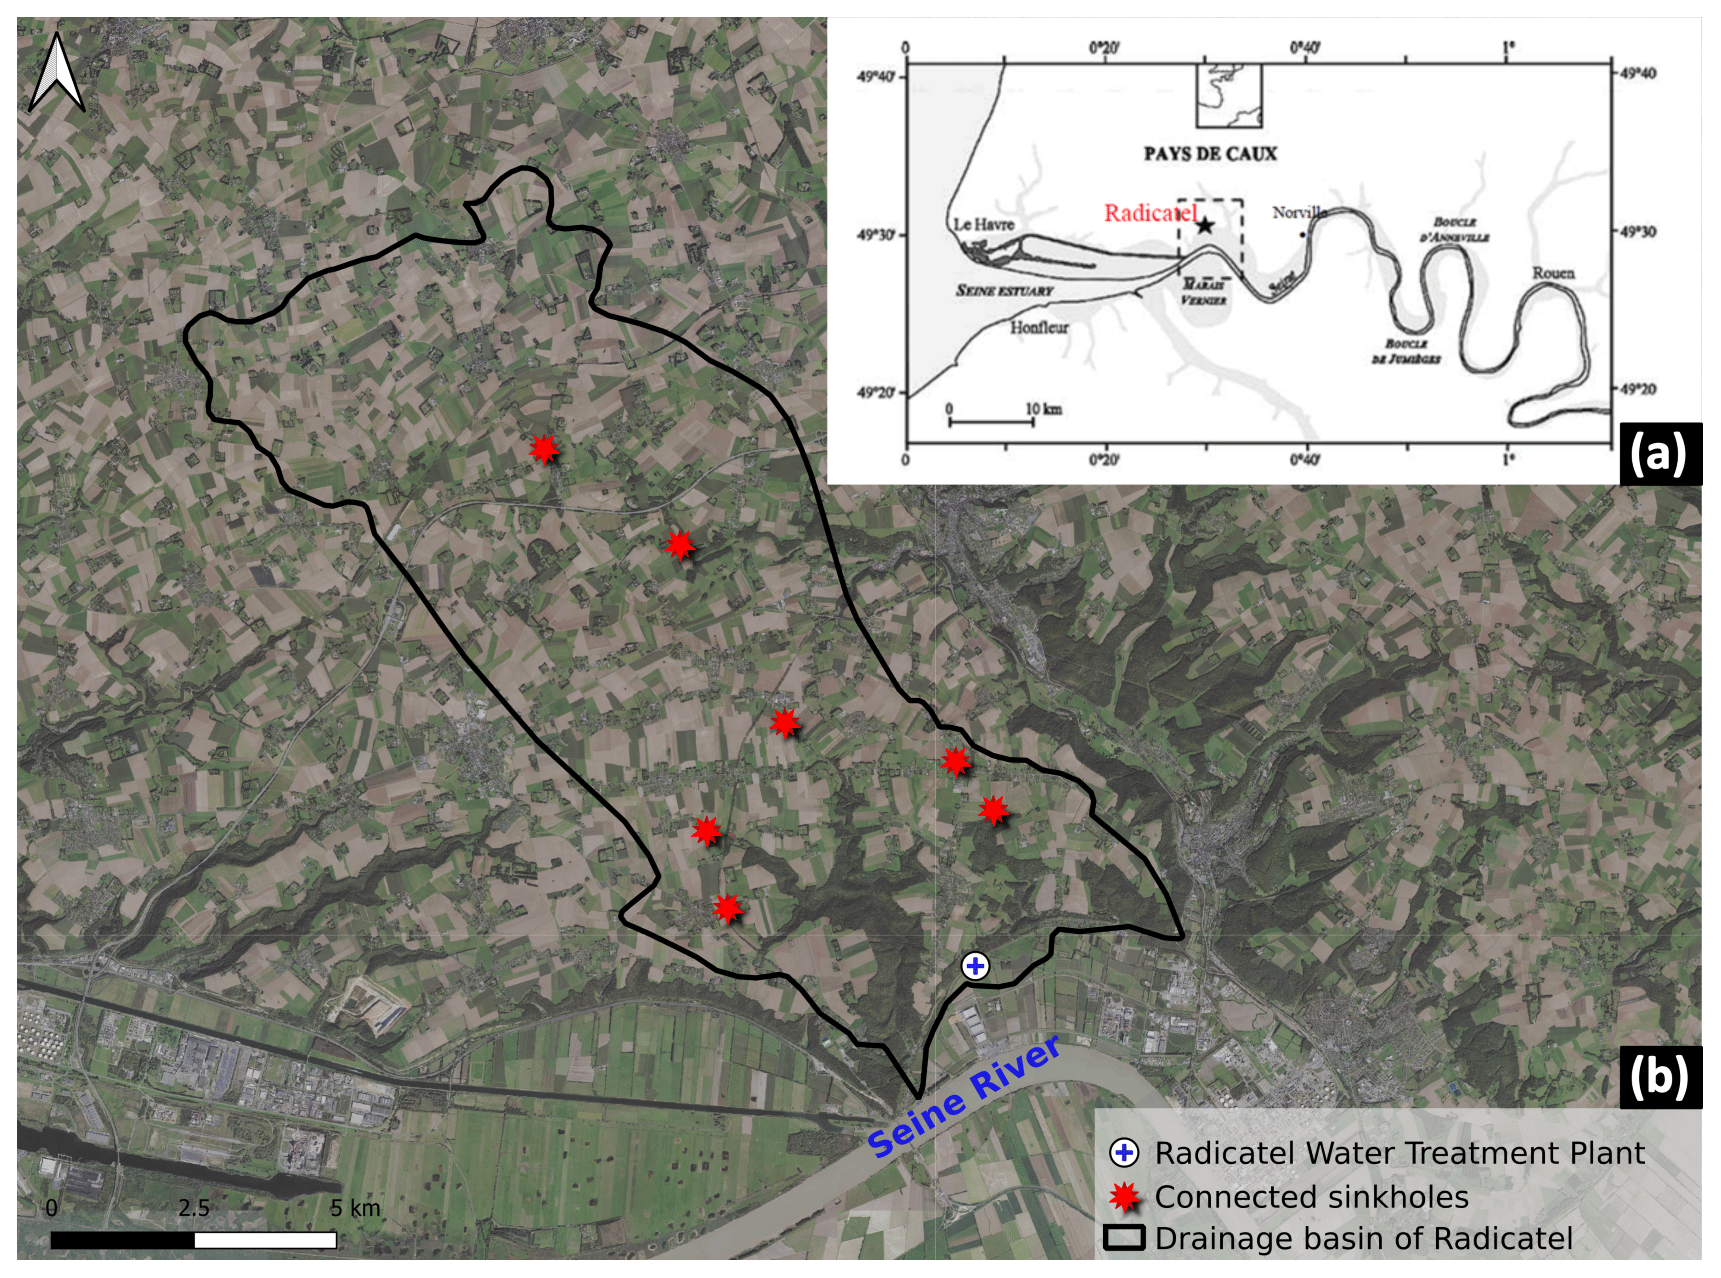
Figure 1(a) Location of the study site in the lower Seine Valley (Normandy, France) on the right bank of the Seine River (Hanin, 2011) and (b) location of the water treatment plant of Radicatel and the seven connected sinkholes. The background map was retrieved from BD Ortho © IGN.
The study site is in the Pays de Caux (Normandy, France) on the right bank of the Seine River about 30 km from the Seine estuary (Fig. 1a). The climate is temperate with an average temperature of 11 ∘C. Annual precipitation ranges between 600 and 1100 mm yr−1 with a rainy season occurring between October and May. The karst is typical of the geological setting of the lower Seine Valley. The karstic chalk plateaus of the north-eastern side of the Normandy region are part of the western edge of the Paris Basin. The elevation ranges from 138 to 0 m a.s.l. (above sea level), and the median slope is 5.9 %. The geology consists of Cenomanian to Campanian chalk overlaid by thick surficial formations. The major formation is composed of clay with flints, which results from the weathering of the chalk (Laignel, 2003), loess, and tertiary sands (Lautridou, 1985). The thickness of the formation overlying the chalk ranges from 5 to 10 m. Water infiltrates from the uplands of the chalk aquifer to the valleys via rapid transfer through a highly developed karstic network and via slower drainage through the thick surficial formations.
The hydrogeological catchment of Radicatel covers 106 km2 and the WTP is located at the interface of the Seine alluvium and the karstic chalk (Fig. 1b). Water is pumped from four different springs and seven pumping wells near the WTP (Chédeville, 2015). According to the information system for groundwater management in Seine–Normandy (http://sigessn.brgm.fr/, last access: 1 September 2020), hydrogeological investigations reported seven sinkholes positively connected to the springs (in situ dye tracing already performed and confirming the connection). The WTP of Radicatel is exploited by the Le Havre-Seine Métropole (LHSM) to supply Le Havre inhabitants. Turbidity (NTU) is measured with a nephelometer at the inlet of the pumping station and has been recorded since 1987 (Fig. 2). The maximum turbidity value is recorded every day (Δt=1 d) and LHSM provided access to the entire turbidity time series (1987–2017). Incomplete periods or hydrologic years with missing data were discarded. Twenty-two hydrologic years with a complete time series of turbidity were kept for the rest of the study.
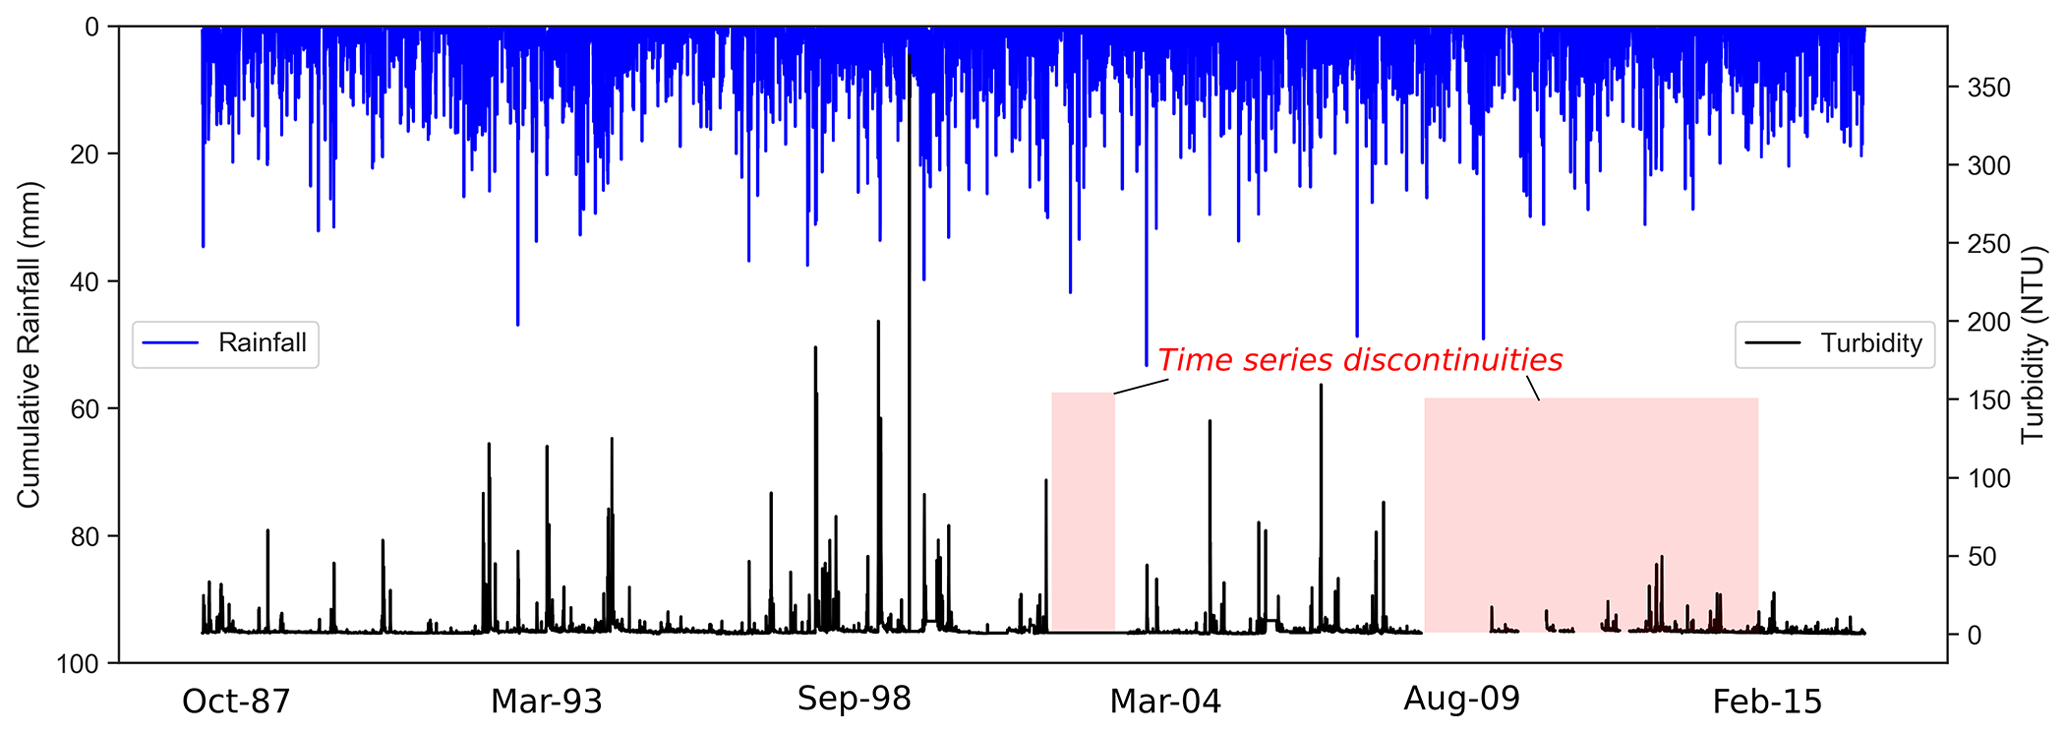
Figure 2Cumulative daily rainfall (mm) extracted from the SAFRAN database over the Radicatel hydrogeological catchment and maximum daily turbidity (NTU) observed at the water treatment plant from 1987 to 2017.
The proposed cascade modelling for the simulation of SD at a WTP incorporates two different models that can be used separately or as part of an integrated modelling framework. These components are described in detail in the following sections.
3.1 Expert-based GIS model
The WaterSed model uses a raster-based distributed approach to model the spatial distribution of runoff and soil erosion within a catchment for a given rainfall event. The WaterSed model is an upgrade of the STREAM model (Souchère et al., 1998; Cerdan et al., 2001) simulating hydrological processes by conceptualizing each raster grid cell as a reservoir whose properties are calculated at the event scale and by routing both water and sediment according to the surface flow network. The WaterSed model requires several datasets to compute runoff and erosion for any location in the catchment: (i) a digital elevation model (DEM) to extract the slope and the runoff flow network, (ii) a stream network (used to modify the DEM to ensure a steady downstream gradient according to the observed hydrographic network) and river width, (iii) a land cover and soil texture map to associate each land cover in the catchment with the appropriate soil surface characteristics, (iv) decision tables, adapted for the local conditions, to associate each soil surface characteristic (soil surface crusting, surface roughness, and crop cover) observed in the land cover or field with a steady-state infiltration rate, a Manning roughness coefficient, a single potential sediment concentration, and a soil erodibility value (Cerdan et al., 2002a), and (v) rainfall events including total precipitation, antecedent moisture (48 h), and effective rainfall duration.
3.2 Deep neural network
In this study, a multi-layer feed-forward network (DNN) was built under Python version 3.6 using the high-level API Keras (Chollet, 2015) and Tensorflow (Abadi et al., 2016) as a background engine. A multi-layer feed-forward neural network is an interconnection of perceptrons in which data and calculations flow in a single direction, from the input data to the outputs. The number of layers in a neural network is the number of layers of perceptrons. The number of hidden layers and perceptrons depends on the characteristics of the input data, and there is no specific rule for selecting these parameters (Le et al., 2019). Neural networks are adjusted during a training stage when the parameters are calculated iteratively in a gradient descent that seeks to minimize a mean squared error. For efficient learning, input variables were rescaled between 0 and 1 using normalization and re-transformed for the simulations using the normalization parameters. The mean squared error (MSE) was chosen as a loss function, and the adaptive moment estimation (Adam) was adopted as the model optimization algorithm. After training, the quality of the model is evaluated on a test set. The ability of the model on the test set is known as generalization, and it can be influenced by overfitting during the training stage. To avoid overfitting and increase model robustness, we used two regularization methods in this study: (i) early stopping and (ii) cross-validation. Early stopping is an efficient regularization method that prevents the model from overfitting (Sjörberg and Ljung, 1992). We visually monitored the learning curves and stopped the training as soon as the validation error reached a minimum. Then, we rolled back the model parameters to the point where the validation error was at the minimum. The choice of the training/test set remains arbitrary and may need to be evaluated to compute a robust estimate of model error. With time series data, care must be taken when splitting the data in order to prevent data leakage (Cochrane, 2018). To address this issue, we adapted a monthly backward-chaining nested cross-validation procedure, which provides an almost unbiased estimate of the true error (Varma and Simon, 2006). The procedure contains an inner loop for parameter tuning and an outer loop for error estimation (see Fig. B1). The parameters that minimize error are chosen on the inner loop, and we add an outer loop, which splits the data into multiple training/test sets. Then, the error is averaged on each split to evaluate the overall performance of the model. The optimum structure and configuration of the network (model design) were found by a classical trial-and-error procedure (training-evaluation process through optimization of errors; Ortiz-Rodriguez et al., 2013).
3.3 Performance evaluation
The performance of the model was evaluated through the Nash–Sutcliffe efficiency (NSE) and the root mean square error (RMSE). The RMSE corresponds to the standard deviation of the residuals (prediction errors). The residuals are a measure of the distance from the data points of the regression line. They evaluate how the predictions match to the observations, and values may range from no fit (+∞) to perfect fit (0) based on the relative change in the data. The NSE (Nash and Sutcliffe, 1970) indicates the model's ability to predict variables different from the mean and gives the proportion of the initial variance accounted for by the model. NSE values vary between −∞ (poor model) and 1, indicating a perfect fit between observed and predicted values. Finally, to ensure that the model does not suffer from a weakness when making simulations during extreme events, we performed an additional evaluation using the generalized extreme value (GEV) distribution that is broadly applied to extreme events such as rainfall or river discharges (Carreau et al., 2013; De Michele and Avanzi, 2018). The GEV distribution was fitted to SD time series at the WTP of Radicatel. The maximum annual SD observed at the WTP was extracted for all complete hydrologic years (i.e. annual maximal blocks; n=22) and the distribution was fitted using the package “extRemes” of the R software (R Development Core Team, 2008; Gilleland and Katz, 2016; see Fig. C1). We compared the SD simulated at the WTP by the DNN to the values calculated by the GEV.
Appropriate data handling can help address various concerns in DNN modelling, such as its ability to generalize beyond training limits (Kourgialas et al., 2015). Moreover, cascade modelling with a GIS and a DNN can require important computational effort; therefore, the input data must be carefully selected.
4.1 WaterSed data
To compute erosion and runoff, the WaterSed model needs a DEM. The DEM (5 m resolution) was retrieved from BD Alti®. Depressions in the DEM were filled according to the algorithm developed by Wang and Liu (2006). The stream network location and width were provided by BD TOPO®. To define the soil surface characteristics needed by the WaterSed model, we computed a land cover map and a soil texture map. The land cover map was developed for 2016 by combining two national databases: the French Land Parcel Identification System (RPG) and the Soil Observatory of Upper Normandy (OSCOM). The soil texture map (three classes: clay, silt, and sand) was derived from the Regional Pedological Referential (RRP) with a precision of 1:250 000. The parametrization consists of a characterization of the main parameters influencing runoff and infiltration in the studied context: soil surface crusting, surface roughness, and crop cover. These soil surface characteristics were defined for each month and for each crop class according to the cropping calendar developed by Evrard et al. (2010) and Delmas et al. (2012). Steady-state infiltration and potential sediment concentration were assigned to each soil surface characteristic according to Cerdan et al. (2001, 2002b). The WaterSed model requires Manning's roughness coefficient in order to compute flow velocity. Based on soil surface characteristics, Manning's values were derived from surface roughness (Morgan, 2005) and the percentage of crop cover (Gilley et al., 1991). Last, soil surface characteristics were also used to define the soil erodibility factor, varying in the [0–1] interval, by adapting the table developed by Souchère et al. (2003). Calibration parameters were extracted from a previous study (Landemaine, 2016; Landemaine et al., 2020b) conducted in the Austreberthe catchment, located 30 km east of the Radicatel catchment. For the training phase of the DNN, erosion and runoff were calculated with the WaterSed model for 269 events to reduce computational efforts, considering that erosion and runoff occur only for significant rainfall events (P>2.5 mm d−1, the threshold below which no effective rainfall is generated, and runoff and sediment discharge entering connected sinkholes were set to 0).
4.2 DNN data
Cumulative daily rainfall (mm) from 1987 to 2017 was extracted from the SAFRAN database over the hydrogeological catchment of Radicatel. SAFRAN data are hydroclimatic data covering France at a resolution of 8 km on an extended Lambert-II projection and produced by Météo-France (Quintana-Segui et al., 2008; Vidal et al., 2010). We used the rainfall time series (i.e. daily cumulative rainfall, P, and 48 h antecedent rainfall, P48) retrieved from the SAFRAN database and WaterSed modelling outputs – runoff (RWS) and sediment discharge (SDWS) – at connected sinkholes as input data for the DNN model. The SD time series at the Radicatel WTP was retrieved from turbidity data and considered the output for the DNN. In this study, turbidity data distribution was explored using scatter plots (Fig. A1). The turbidity data were chosen so that they include the best dispersion of values (0–370 NTU) and a strong recurrence of extreme turbidity values (>150 NTU). Thus, 2 significant hydrologic years (H12–H13; from 1 October 1998 to 30 September 2000) were selected, accounting for 731 daily events. These 2 hydrologic years were selected as the training/test set of the model. Data were split as a training set (70 %) and a test set (30 %) while respecting the chronology of daily rainfall amounts. The training set was also split into training and stop sets to fine-tune the hyperparameters (70 %–30 %). At the Radicatel WTP, the mean pumping flow rate is estimated to 19 733 m3 d−1, and the volume of water pumped in 2018 was approximately 7.2 million m3. SD (kg d−1) was assessed considering turbidity time series, mean pumping flow rate at the Radicatel WTP, and the relation between turbidity and sediment concentration resulting from field investigations ([mg L−1] = 0.96 ⋅ [NTU]; R2=0.97; Hanin, 2011). In accordance with previous studies by Masséi et al. (2006) and Hanin (2011) in a karstic environment in Normandy, a lag of 1 d was applied to the SD time series to properly match the rainfall input.
4.3 Design storms and land use scenarios
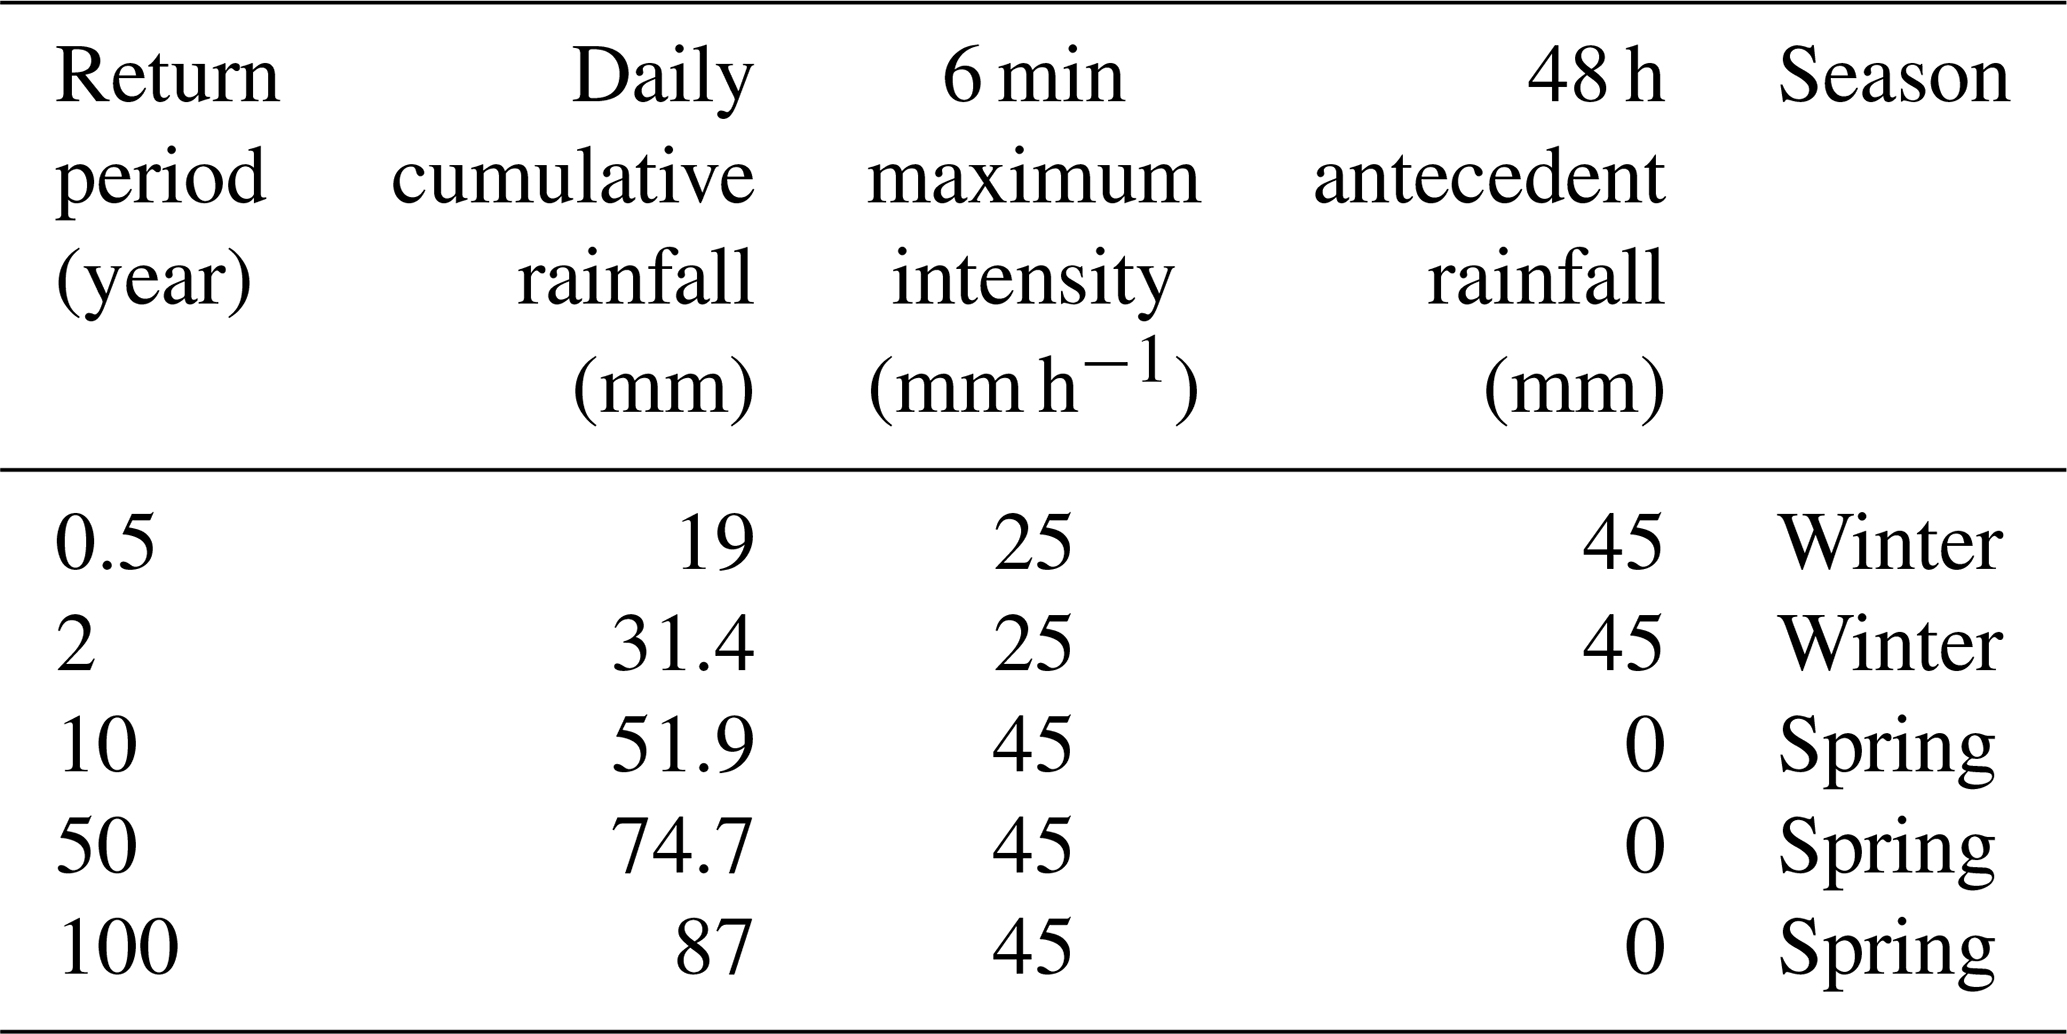
Five design storms were constructed for the cascade modelling approach based on expert knowledge and depth–duration–frequency curves of the French Meteorological Survey (Météo-France) available from 1996 to 2006 on the studied area (Table 1). We considered winter events for low return period rainfall (0.5 and 2 years). In the studied region, even low daily rainfall depths can lead to severe erosion by water runoff due to saturated soils induced by heavy cumulated rainfall on antecedent days (Le Bissonnais et al., 2002; Evrard et al., 2010). For higher return periods (i.e. 10, 50, and 100 years), we considered spring events that are characterized by stronger rainfall intensities and that can be particularly damaging in this region (Evrard et al., 2007).
Table 1Design storms defined for the Radicatel catchment and considered for the simulations.
Four land use change scenarios for the year 2050 were investigated and compared to a baseline land use scenario (2018). The scenarios were incorporated into the model in order to simulate SD variability at the WTP and evaluate their impacts. All scenarios are described below.
-
Baseline scenario (S_base): this scenario served as a reference and was built considering the latest available land use data on the catchment (see Sect. 3.3). Existing erosion control measures in 2018 were considered and extracted from a regional database (BD CASTOR; http://bdcastor.fr/, last access: 1 September 2020). The database contained 45 dams/retention ponds, 16 ponds, 1 fascine, and 4 hedges for the actual land use scenario on the Radicatel catchment, which have been included in the WaterSed model.
-
Ploughing up of grassland (S_grass): based on regional benchmarks (DRAAF; https://draaf.normandie.agriculture.gouv.fr/, last access: 1 September 2020) for the 1970–2010 period in the studied region (Pays de Caux), we observed an average conversion rate of grasslands up to 900 ha yr−1. Extrapolation by 2050 led to the conversion of 33 % of existing grasslands. The extrapolated rate was applied on the Radicatel catchment. Grasslands were ploughed up based on a slope criterion, taking into account the working conditions of farmers and prioritizing those with mild slopes (<12 %) and therefore mainly located on the plateau upstream of the catchment.
-
Eco-engineering (S_engi): based on expert knowledge, 181 fascines and 13.1 ha of grass strips were implemented in addition to existing erosion control measures to mitigate runoff/erosion on the catchment and reduce rapid transfer via the connected sinkholes. Grass strips were deployed on the flow paths in the vicinity of the sinkholes. Fascines were deployed throughout the catchment, also on flow paths and along plot boundaries. This scenario allows for a shift from a 0.19 per 30 ha erosion control measure density to nearly 1 per 30 ha, which is advised to promote sedimentation and landscape restructuring (Ouvry et al., 2019). The localization was optimized according to the baseline scenario simulations.
-
Best farming practices (S_farm): this scenario promotes the adoption of farming practices improving infiltration on the catchment (increasing crop cover or delaying the formation of the slaking crust). Fifty percent of the plots were randomly selected and applied a 15 % increase in infiltration capacity, respecting the actual proportions of winter and spring crops on the catchment. The applied value was set based on the study of Maetens et al. (2012), who synthesized the reduction in erosion and runoff following different agricultural practices across Europe. According to their results, a 15 % increase in infiltration capacity can be regarded as a conservative assumption that can be easily achieved through simplified agricultural techniques (e.g. minimum tillage, no till, direct seeding, crop cover).
-
Coupling eco-engineering and best farming practices (S_farm + engi): both scenarios, S_farm and S_engi, were combined. Experiments carried out in the study area suggested that combining both approaches is necessary to reduce the impact on sensitive or vulnerable areas (Ouvry et al., 2012).
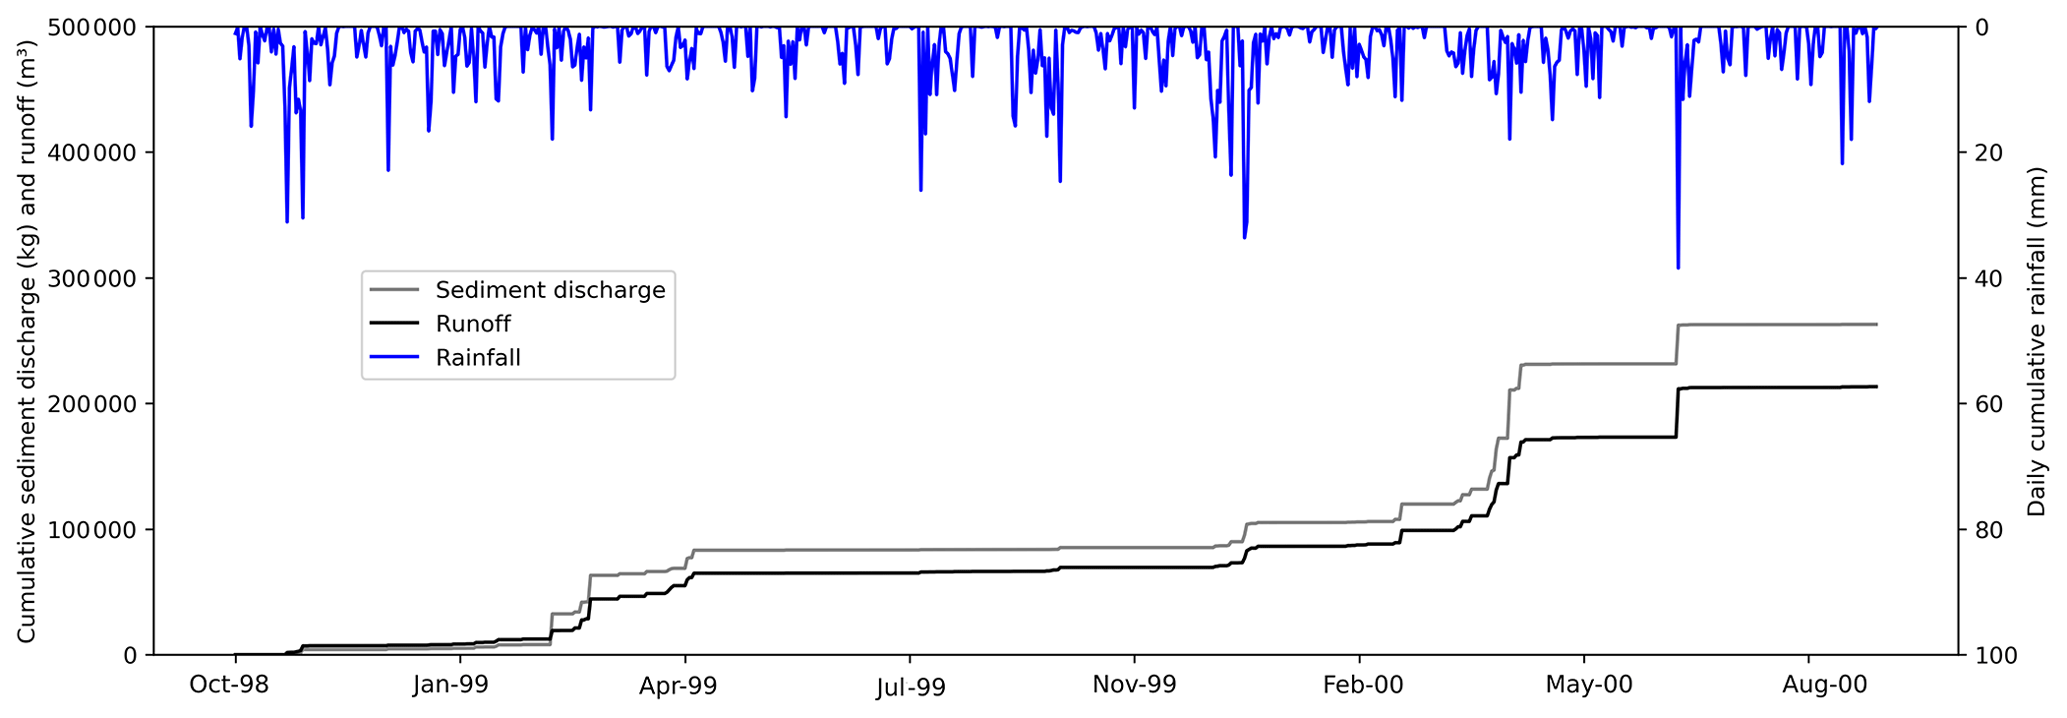
Figure 3Cumulative sediment discharge (kg) and runoff (m3) simulated by the WaterSed model, extracted and summed over all positively connected sinkholes from October 1998 to September 2000.
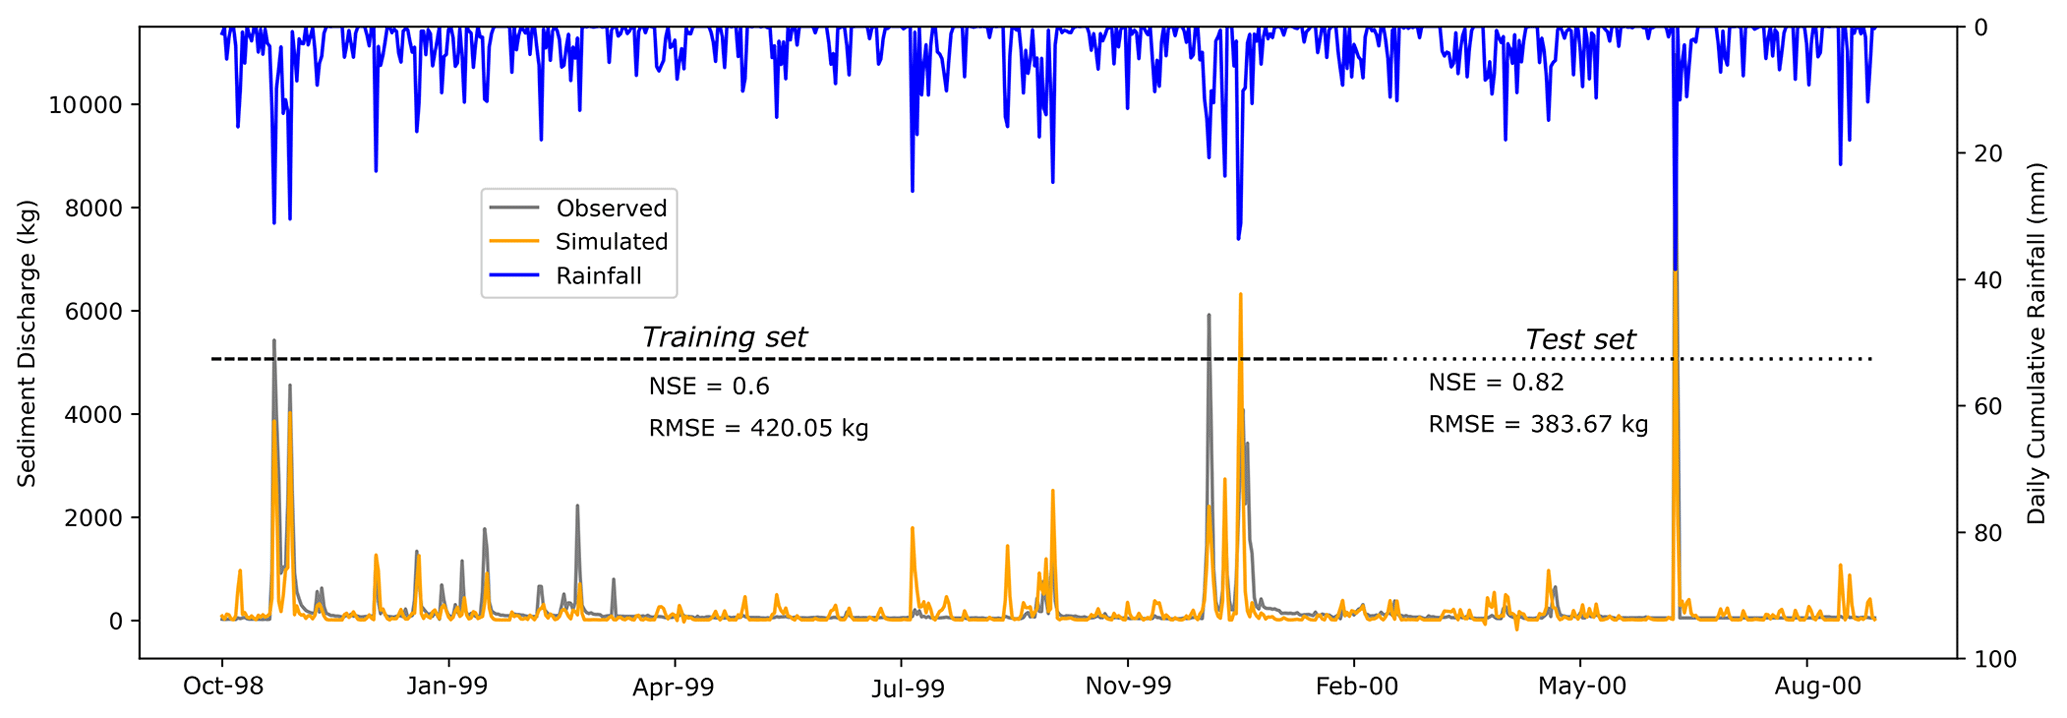
Figure 4Observed and simulated sediment discharge (kg) at the water treatment plant using the DNN model.
5.1 Modelling the inputs
In order to feed the DNN, erosion and runoff were simulated with the WaterSed model for 269 rainfall events over the entire Radicatel catchment. We used the WaterSed parametrization that was carried out on the adjacent catchment (La Lézarde; Landemaine et al., 2020a) and that had already proved to be valid in the same area of the Pays de Caux (Landemaine, 2016; Landemaine et al., 2020b) and Belgium (Baartman et al., 2020). For each event, WaterSed outputs – i.e. runoff (RWS; m3) and sediment discharge (SDWS; kg d−1) values – were independently extracted over the connected sinkholes and summed to consider a unique contribution from the seven sinkholes to the spring. Figure 3 shows that from October 1998 to September 2000, rainfall events led to a significant cumulative runoff and sediment discharge to the sinkholes (RWS=213 225 m3; SDWS=262 806 kg). Most of the events occurred during spring (SDWS_spr=131 672 kg; RWS_spr=94 732 m3) and winter (SDWS_win=88 413 kg; RWS_win=62 590 m3). Sediment discharge and runoff occurred on the catchment for only 126 events over the 269 simulated; 61 % of the SDWS (i.e. 162 168 kg) and 52 % of the RWS (i.e. 110 877 m3) were transported during seven major events (i.e. 0.95 % of the time). Over the 126 events, the maximum RWS and SDWS reached 38 471 m3 and 38 380 kg (μSDWS=2102 kg; μRWS=1705 m3; σSDWS=5826 kg; σRWS=4437 m3).
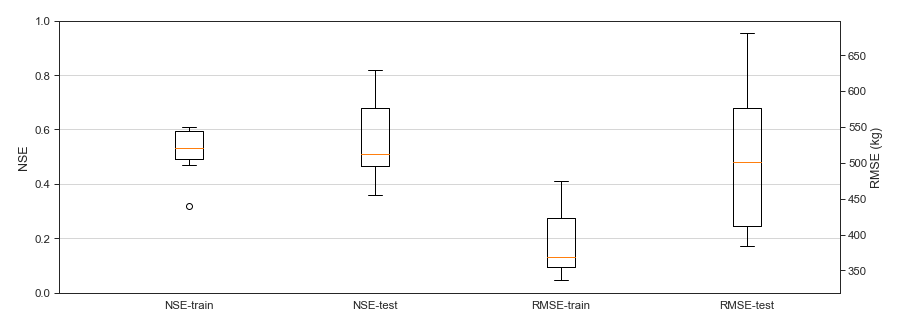
Figure 5Boxplots of the performance metrics over the training and test sets using the monthly backward-chaining nested cross-validation.
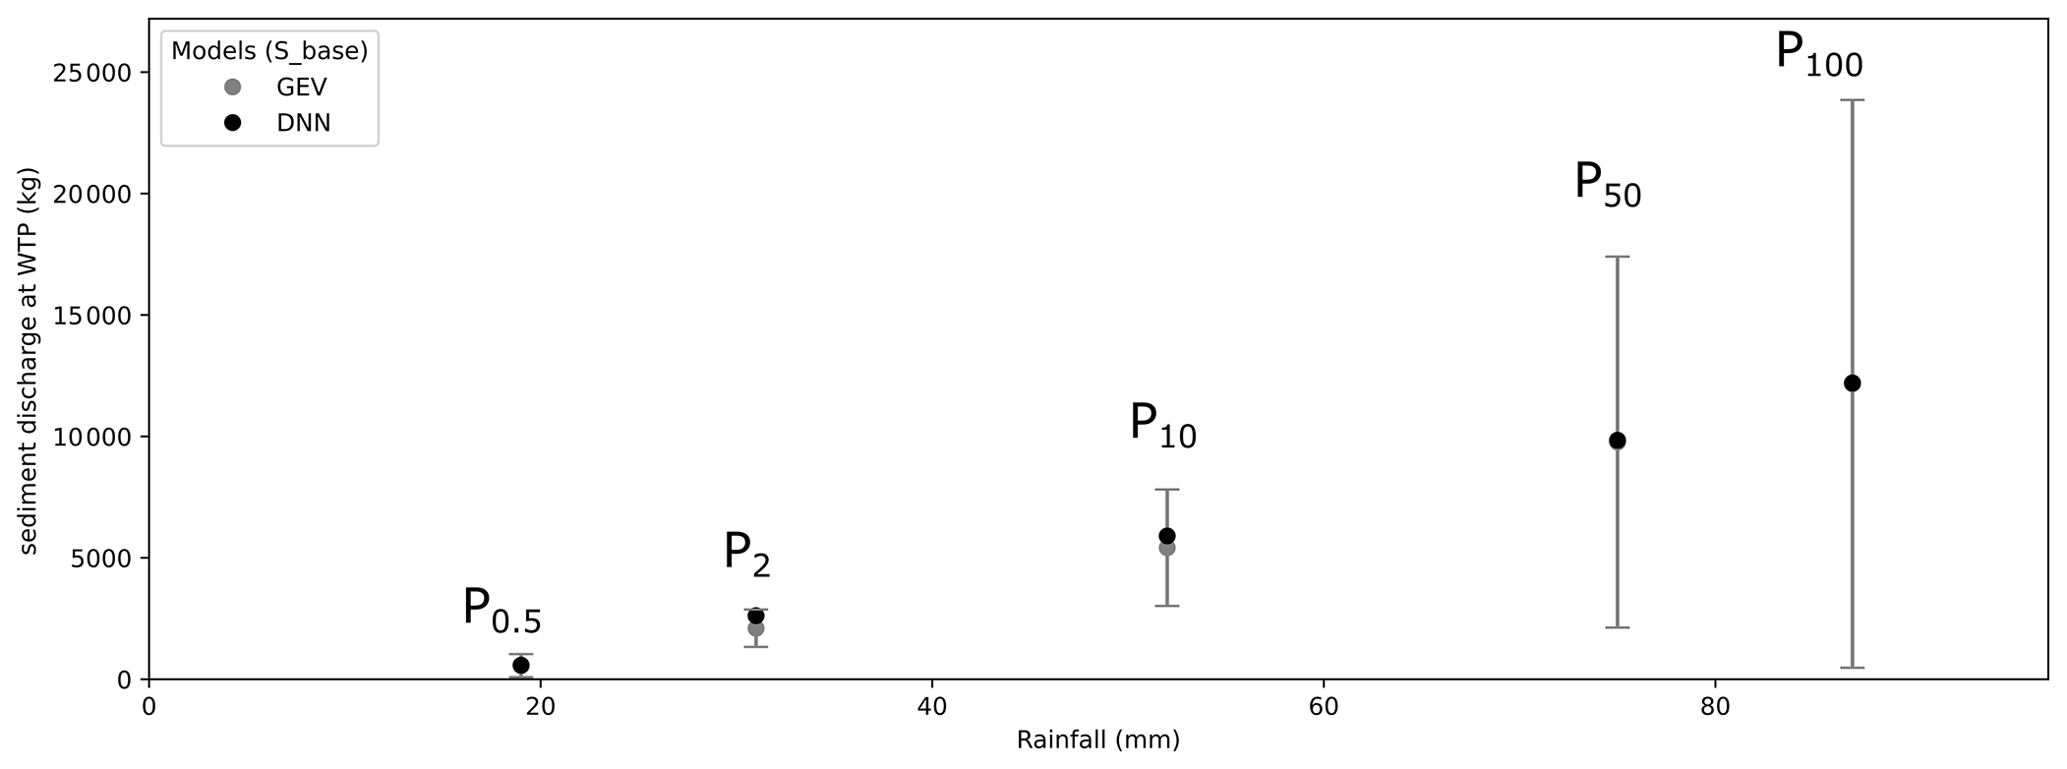
Figure 6Simulated sediment discharge (kg) at the water treatment plant of Radicatel for the five design storms and the land use baseline scenario by (1) generalized extreme value distribution and (2) DNN modelling. The grey bars represent the 95 % confidence intervals.
5.2 DNN: calibration and generalization
The final structure of the DNN was composed of one input layer with four variables, two hidden layers, and one output layer with the targeted variable. We set 40 neurons in the hidden layers as follows: 30–10. We used the rectified linear (ReLU) activation function for the two hidden layers. The optimal number of iterations was set to 15 and the batch size to 1. We used the runoff and sediment discharge simulated by the WaterSed model for the 2 selected hydrologic years as inputs for the DNN. The rainfall time series (P, P48) available on the catchment were also considered as inputs. A turbidity time series recorded at the WTP was transformed into sediment discharge knowing the mean pumping flow rate at the Radicatel WTP and considering a mean sediment concentration of 1 mg L−1 from field investigations made by Hanin (2011). Thus, sediment discharge at the WTP was considered as output of the DNN. The DNN was trained from October 1998 to February 2000 (n=511 daily events). The remaining period from March 2000 to September 2000 was used as the test set (n=220 daily events). Modelling results (Fig. 4) suggested a good agreement between observed and simulated SD at the WTP over the test set, with a NSE criterion reaching 0.82 and a RMSE around 383 kg. The temporal variability was also well reproduced. The results over the training set were slightly worse and reached a NSE of 0.6 and a RMSE of 420 kg. Over the investigated period, the cumulative SD observed at the WTP reached 158 611 kg, whereas the simulated cumulative SD reached 129 253 kg (underestimation of 19 %). Comparing SDWS and observed SD at the WTP resulted in a 60 % recovery rate from WaterSed outputs, which was consistent with previous hydrogeological tracing results on connected sinkholes. Hanin (2011) suggested the existence of fast karstic connections between sinkholes and springs on the Radicatel catchment, with a 62 % recovery rate. For the 126 events for which erosion and runoff occurred on the catchment, the cumulative amount for both observed and simulated SD was estimated to 88 114 and 78 870 kg respectively, suggesting that direct transfers account for 55 %–61 %. These results were consistent with previous published results of Masséi et al. (2003) in the same karstic environment (Norville catchment, Normandy, France), which evaluated the proportion of direct transfers at 73 % during erosive events.
The monthly backward-chaining nested cross-validation procedure made it possible to assess the generalization capacity of the DNN on a new dataset. This procedure removed 1 month from the initial dataset (i.e. 731 events) and was repeated 12 times while keeping at least 1 full hydrologic year as input for the modelling. The modelling results were more efficient for the inner loop (Fig. 4) than for the outer loops (Figs. 5 and B1). Overall, the median NSE value for the training and test sets for the outer loops was above 0.5. The median RMSE value on the training and test sets was on the same order of magnitude as for the complete dataset (300–500 kg). The difficulties of the model in generalizing suggested a classical problem in machine learning, the bias–variance dilemma (Geman et al., 1992). Ideally, the model should accurately reflect irregularities in the training data while generalizing to data testing, but it was not possible to achieve both at the same time. The higher NSE and lower RMSE values on training sets suggest a complex model with high variance and a reliable bias that represents the training data fairly well but that presents a learning risk on the test data. The model can thus represent part of the random noise of the learning dataset.
To validate the approach for extreme values, we simulated overall SD for the baseline scenario at the connected sinkholes and for the five DS using the WaterSed model. Then, we used these modelling results as inputs for the DNN model and applied them to the five DS. Secondly, we compared the results with the calculated GEV distribution (Fig. 6). The SD simulated at the WTP by the DNN model can be considered to be in good agreement with the values calculated by the GEV, even if the latter shows a high dispersion for higher return periods.
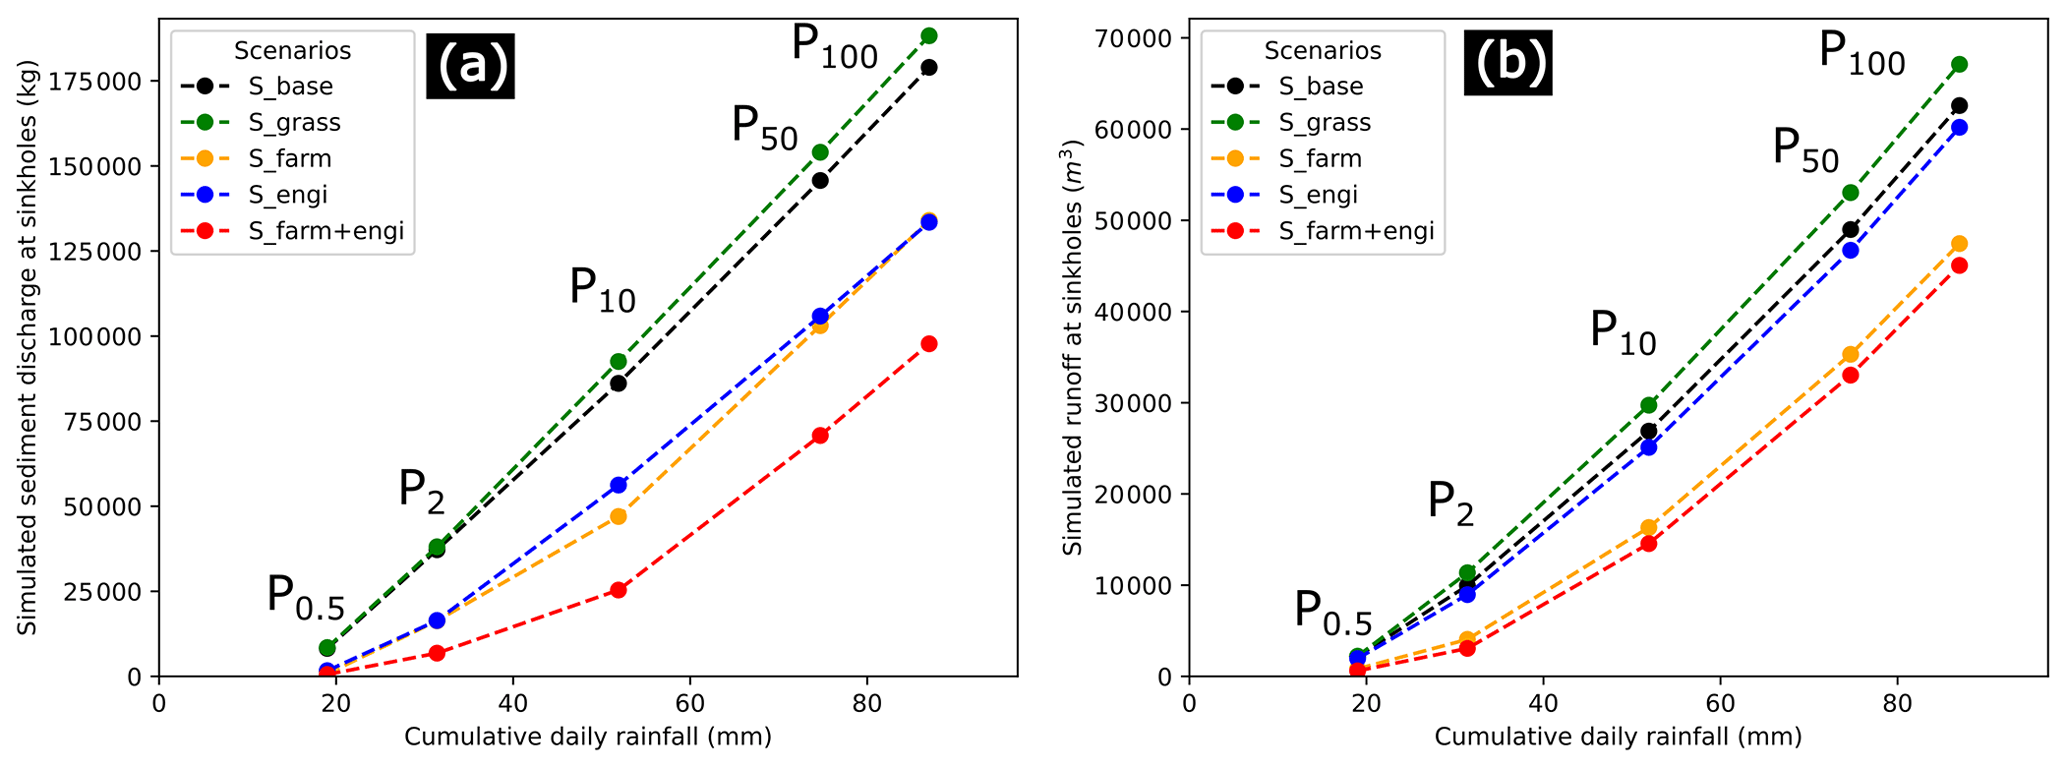
Figure 7WaterSed modelling results according to the five designed storms for the four scenarios: simulated (a) sediment discharge (kg) and (b) runoff (m3), extracted and summed over the seven connected sinkholes on the Radicatel catchment (S_base: baseline scenario in 2018; S_grass: 33 % of grasslands ploughed up; S_farm: +15 % infiltration capacity on 50 % of the plots; S_engi: implementation of 181 fascines and 13.1 ha of grass strips; S_farm + engi: combination of S_farm and S_engi).
In parallel, we selected the 1 % highest sediment discharge on records from October 1998 to September 2000, which represented 28 % of the total sediment discharge observed at the WTP, and compared the results with simulated sediment discharge in a scatter plot. We observed a good relation between those two variables (R2=0.72; Fig. D1), which strengthens our confidence in the model for simulating extreme events. While the performance of deep learning-based methods in modelling extreme events is discussed (Zhang et al., 2019), the results obtained here provide confidence in the model's ability to simulate them due to a careful selection of input data that allow the model to learn patterns of extreme events in historical time series.
5.3 Prospective analysis
Once the calibration was completed and the architecture of the DNN defined, we applied the cascade modelling for all predefined scenarios. As a first step, and using the WaterSed model, we simulated SDWS and RWS at the connected sinkholes for the three additional scenarios and the five DS, comparing them to the baseline scenarios (Fig. 7a and b). For the first scenario (S_grass), 33 % of grasslands were ploughed up, which led to an increase in the spatial extent of runoff generation on the catchment. SDS_grass ranged from 8468 to 188 264 kg for the five DS, with an average increase of 4.74 % compared to the results of the baseline scenario. The effect on runoff was higher, with an average increase of 8.4 % for the five DS, ranging from 2211 to 67 097 m3. The second scenario (S_engi) considered the implementation of erosion control measures by 2050 (i.e. 181 fascines and 13.1 ha of grass strips), which led to a global decrease in sediment flux rates. Simulated SDS_engi to connected sinkholes ranged from 1659 to 133 458 kg, resulting in an average decrease of 44 %. This scenario was more effective in small return periods (i.e. 0.5 and 2 years), with a SD decrease between 79 % and 55 % respectively. Erosion control measures were less effective on the three other DS, with decreases ranging from 25 % to 34 %. The effects on runoff were not as important, with an average decrease of 7 %. This was not surprising because the considered management plan only included 13.1 ha of grass strips, and the main interest of the fascines lies in their ability to trap suspended sediments, especially their coarsest elements (AREAS, 2012). The third scenario (S_farm) represented the adoption of good farming practices (i.e. +15 % infiltration capacity) on 50 % of the plots. It can be observed that this scenario significantly reduced sediment production on the hillslopes (Fig. 8a and b). The simulated SDS_farm ranged from 741 to 134 001 kg, leading to an average decrease of 49 % compared to the baseline scenario results. The simulated values on runoff ranged from 720 to 47 442 m3. This scenario was more effective in reducing SD and runoff, on average, than the eco-engineering scenario. The SD decrease induced by good farming practices ranged from 25 % to 90 % at the connected sinkholes. The fourth scenario (S_farm + engi) combined both effects of the erosion control measures and good farming practices. We observed the highest decrease in sediment discharge and runoff at connected sinkholes. The simulated values on SD ranged from 547 to 97 739 kg and from 598 to 45 051 m3 for runoff.
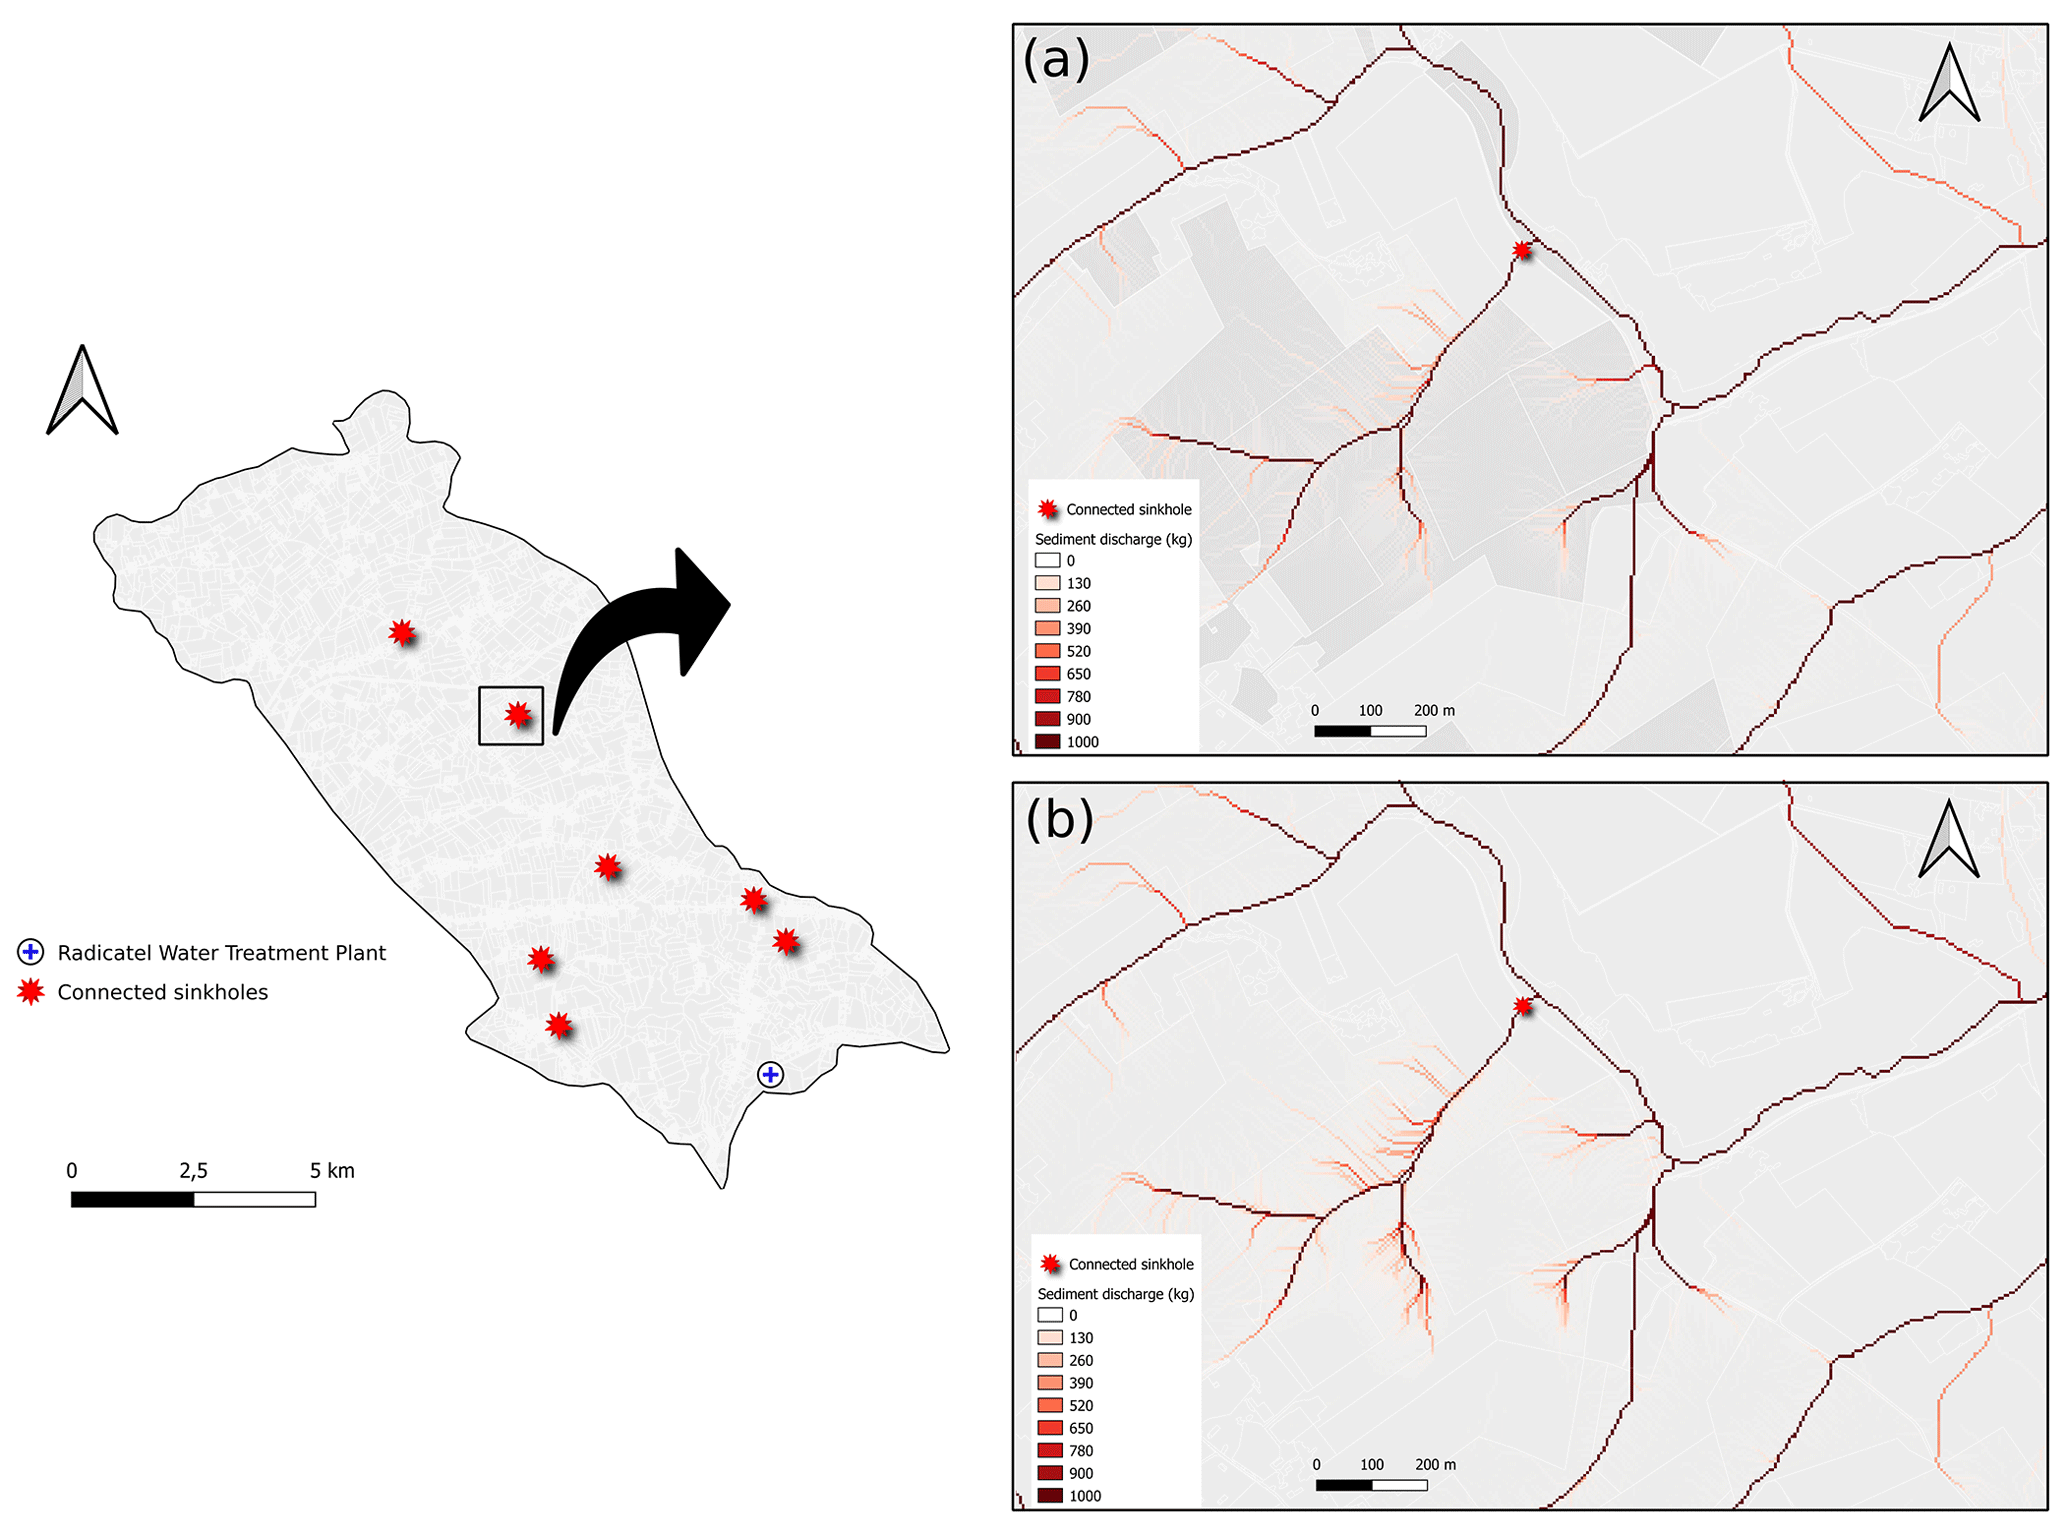
Figure 8Mapping of flow path and sediment discharge for (a) the scenario including an increase of 15 % of the infiltration capacity on selected plots (stronger grey colour) and (b) the baseline scenario, for the 10-year return period designed storm on the Radicatel catchment.

Figure 9Simulated sediment discharge (kg) for designed storms and all scenarios at the Radicatel water treatment plant (WTP) using the DNN model (S_base: baseline scenario in 2018; S_grass: 33 % of grasslands ploughed up; S_farm: +15 % infiltration capacity on 50 % of the plots; S_engi: implementation of 181 fascines and 13.1 ha of grass strips; S_farm + engi: combination of S_farm and S_engi).
DS characteristics and simulated SD/runoff by the WaterSed model at connected sinkholes, and for all scenarios, were injected as inputs in the DNN model. In the baseline scenario, simulated SD at the WTP ranged from 576 to 12 200 kg (see Sect. 4.2), and Fig. 9 shows the global trends of the scenario modelling results. For the S_grass scenario, simulated SD at the WTP was slightly higher than the baseline scenario, reaching 12 894 kg for the 100-year DS. This scenario resulted in an average increase of 4.5 % for the SD at the WTP. The SD increase was less significant in small return periods (+0.42 %–3.29 %) than longer return periods (+5.68–6.82 %). In the second scenario (S_engi), the modelling results suggested a significant SD decrease at the WTP. The simulated SD ranged from 515 to 9810 kg, which led to an average decrease of 25.4 %. The SD reduction was particularly effective on the 2-year DS, reaching a decrease of 44.7 %. The smallest SD reduction was observed for the 0.5-year DS (10 %) and ranged from 19 % to 30 % on longer return periods. These results were consistent with those found by Fournier et al. (2008), who showed by a parametric interpolation model that erosion control measures at connected sinkholes on the Caumont aquifer led to a 36 % decrease in the turbidity in the Varras WTP (Normandy, France). The third scenario (S_farm) was more efficient, with simulated SD ranging from 223 to 9165 kg and an average decrease of 43 %. The SD reduction ranged from 28.9 % to 61.3 % and was more efficient for the 0.5- and 2-year return periods (55.6 %–61.3 %). For the last scenario (S_farm + engi), we observed a global decrease of 59.6 %. The simulated SD values at the WTP ranged from 167 to 7298 kg. This scenario was more efficient for the 0.5-, 2-, and 10-year return periods (70 % on average).
6.1 Cascade modelling approach: strength and uncertainties
The original cascade modelling approach developed in this study allowed the evaluation of surface and subsurface sediment transfer processes. As karstic processes are complex and difficult to model due to the lack of knowledge of their geometry, the cascade modelling with a process-based GIS model and a data-driven model (i.e. DNN) proved to be a powerful tool. This approach is efficient at assessing the impact of different land use scenarios on drinking water quality at drinking water treatment plants. Despite very encouraging results, one may notice that the cascade model was trained on only 2 years of complete selected measurements and therefore may not have captured the full distribution of possible cumulative daily rainfall on the catchment and/or turbidity values at the drinking water treatment plant. The degree of confidence in the model's output could be further improved with longer time series. Two limitations of the presented cascade approach are the data availability and its ability to be validated at other study sites, as the turbidity data backups are not always properly done in all WTPs. One specific issue for DL applications in the hydrological sciences, as mentioned by Sit et al. (2020), is that data provided by the authorities are dispersed and that they occasionally have mismatches in temporal or spatial coverage. We thus encourage the drinking water supplier to keep turbidity records to allow the application of these data-driven models and to ensure that the time series do not have interruptions.
6.2 Implications for future land use strategies
The modelling results in this study suggest that two different land use strategies (i.e. increase in infiltration capacity and eco-engineering) can significantly reduce the SD incoming to connected sinkholes during extreme rainfall events (up to 90 %) and therefore decrease the SD at the WTP (from 10 % to 61 %). The first strategy leads to a decrease in sediment production through simplified cultural techniques, while the second affects transfer processes. The adoption of better farming practices (e.g. increase in crop cover, no-tillage, reduced tillage) inducing an increase of 15 % of the infiltration capacity on 50 % of the agricultural plots of the catchment appears to be slightly more efficient than the implementation of eco-engineering infrastructures (181 fascines + 13.1 ha of grass strips) at reducing SD at the WTP. These results thus show that it is more interesting to adopt a land use strategy aimed at reducing hydro-sedimentary production directly on cultivated plots than transfer processes on the catchment, but these strategies could be combined. Additional simulations integrating both effects of best farming practices on cultivated plots and the implementation of eco-engineering infrastructures show a 10-fold effect. As illustrated in Fig. 9, the coupling of the two strategies makes it possible to reduce significantly the SD at the WTP. The combined effect will not add up, but we can expect an improved decrease in sediment discharge at the WTP from 40 % to 80 %. Both land use strategies can also provide interesting effects on biodiversity and ecosystem services (Posthumus et al., 2015) and/or can improve soil resilience and promote sustainable agriculture (Lal, 2014). Public policies leading to the implementation of erosion control measures can be economically viable and efficient (Patault et al., 2021b). Even if some simplified cultural techniques may imply negative returns for farmers, they may be eligible for agri-environment payments (Posthumus et al., 2015). The implementation of these land use strategies may also require specific maintenance to keep their initial performance (Frankl et al., 2018) or specific training and machines for farmers.
According to the simulations, the ploughing up of 33 % of grasslands for the benefit of agricultural plots on the catchment by 2050 will not increase significantly the SD at the WTP (less than 5 % on average). Our simulations just extended the current trend observed in the studied region. Despite everything, some precautions must be taken regarding the results of this scenario, which could be higher or lower depending on the localization of the ploughed-up plots. The same observations were made by Souchère et al. (2005), who suggested, according to their results, that the efficiency of all developments in reducing erosion and runoff is linked to their location within the catchment. Indeed, it is well known that hydrologic connectivity may lead to increments in runoff (Appels et al., 2011).
In this study, a new cascade modelling approach was developed in order to help decision-makers choose an adapted erosion and runoff management strategy to reduce the impact of sediment discharge on drinking water supply. The expert-based GIS model (WaterSed) was used to simulate erosion and runoff at connected sinkholes (positive dye tracing) on the Radicatel catchment (Normandy, France) and used to feed a data-driven model (i.e. deep neural network) to simulate karstic transfers. This new approach does not require knowledge of the geometry of the karstic system studied and demonstrated the value of understanding hillslope erosion and runoff processes to model underground hydro-sedimentary transfers in karstic systems. Our modelling results suggest that the cascade model performed well during the calibrating phase. The cascade model was able to generalize on unknown datasets through an adapted monthly backward-chaining nested cross-validation procedure, and the cascade model was efficient at simulating extreme events. The results also suggest that a land use change scenario considering the adoption of simplified cultural techniques can significantly reduce sediment discharge at the water treatment plant (up to 61 %). This scenario also outperformed the one which considered the implementation of eco-engineering control measures reducing erosion and runoff on the catchment (up to 45 % at the water treatment plant). The coupling of the two previous land use strategies can be even more effective since it operates on both the hydro-sedimentary production and transfer processes (decreasing SD at WTP from 40 % to 80 %). Finally, ploughing up 33 % of actual grasslands on the catchment will not significantly increase sediment discharge at the water treatment plant. However, the results might be influenced by the spatial organization of grasslands on the catchment that is a key parameter for hydro-sedimentary connectivity and hydro-sedimentary transfers to the sinkholes. In the framework of this study, we suggest conducting a specific study on this hypothesis.
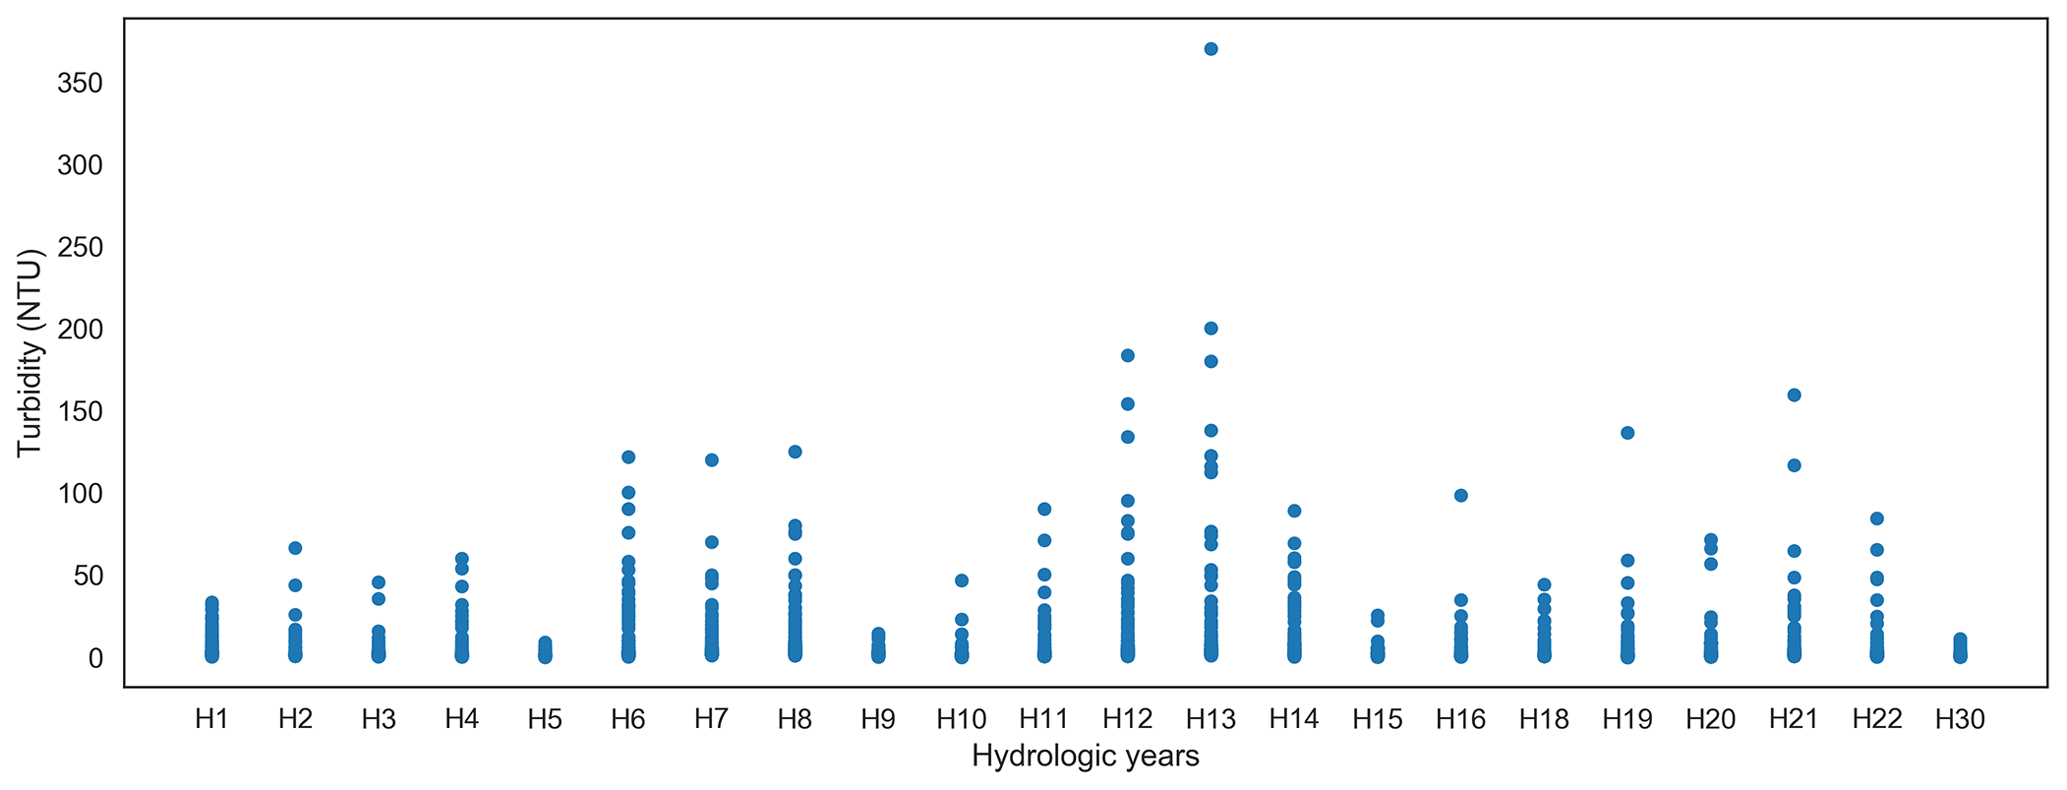
Figure A1Scatter plot of turbidity time series recorded at the water treatment plant in the Radicatel catchment, Normandy, France.
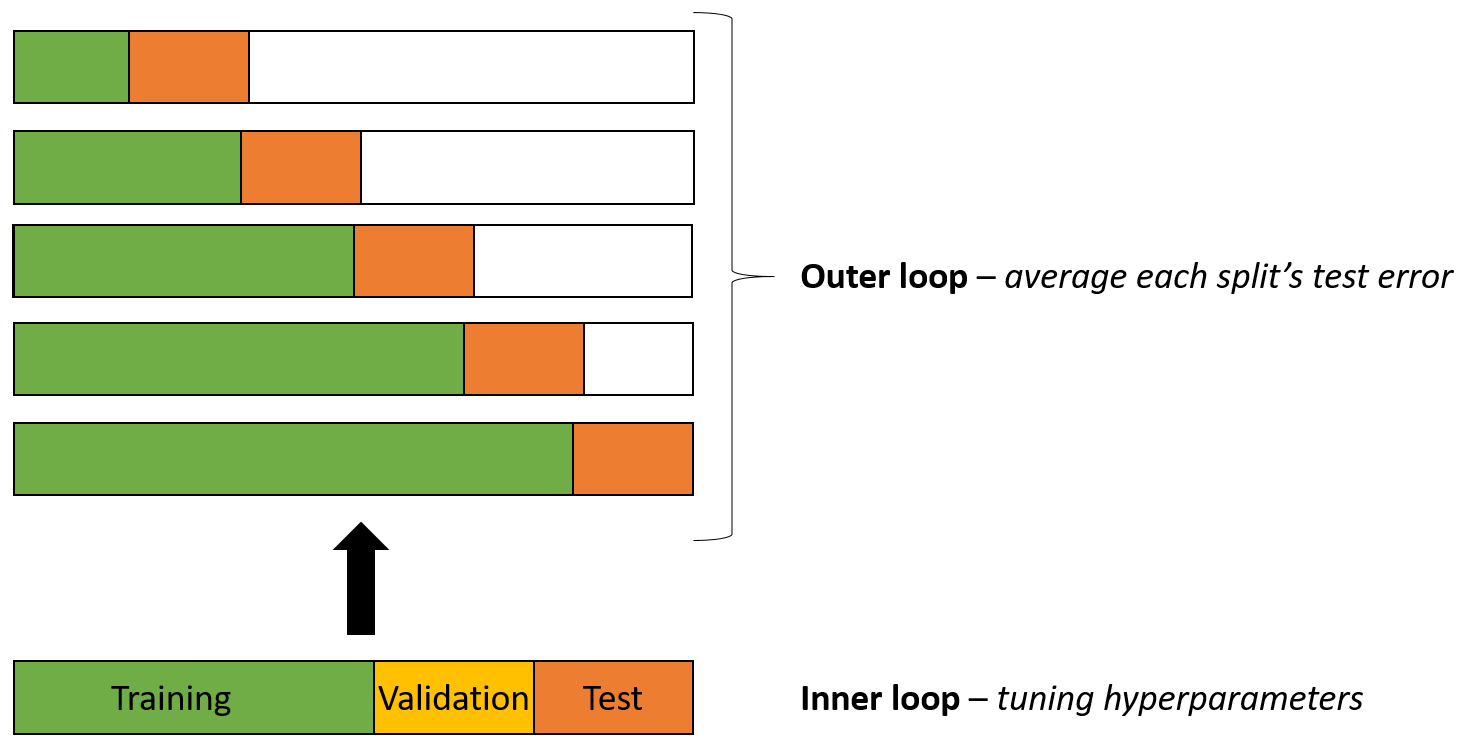
Figure B1Monthly backward-chaining nested cross-validation procedure developed to test the generalization capacity of the model (modified after Cochrane, 2018).
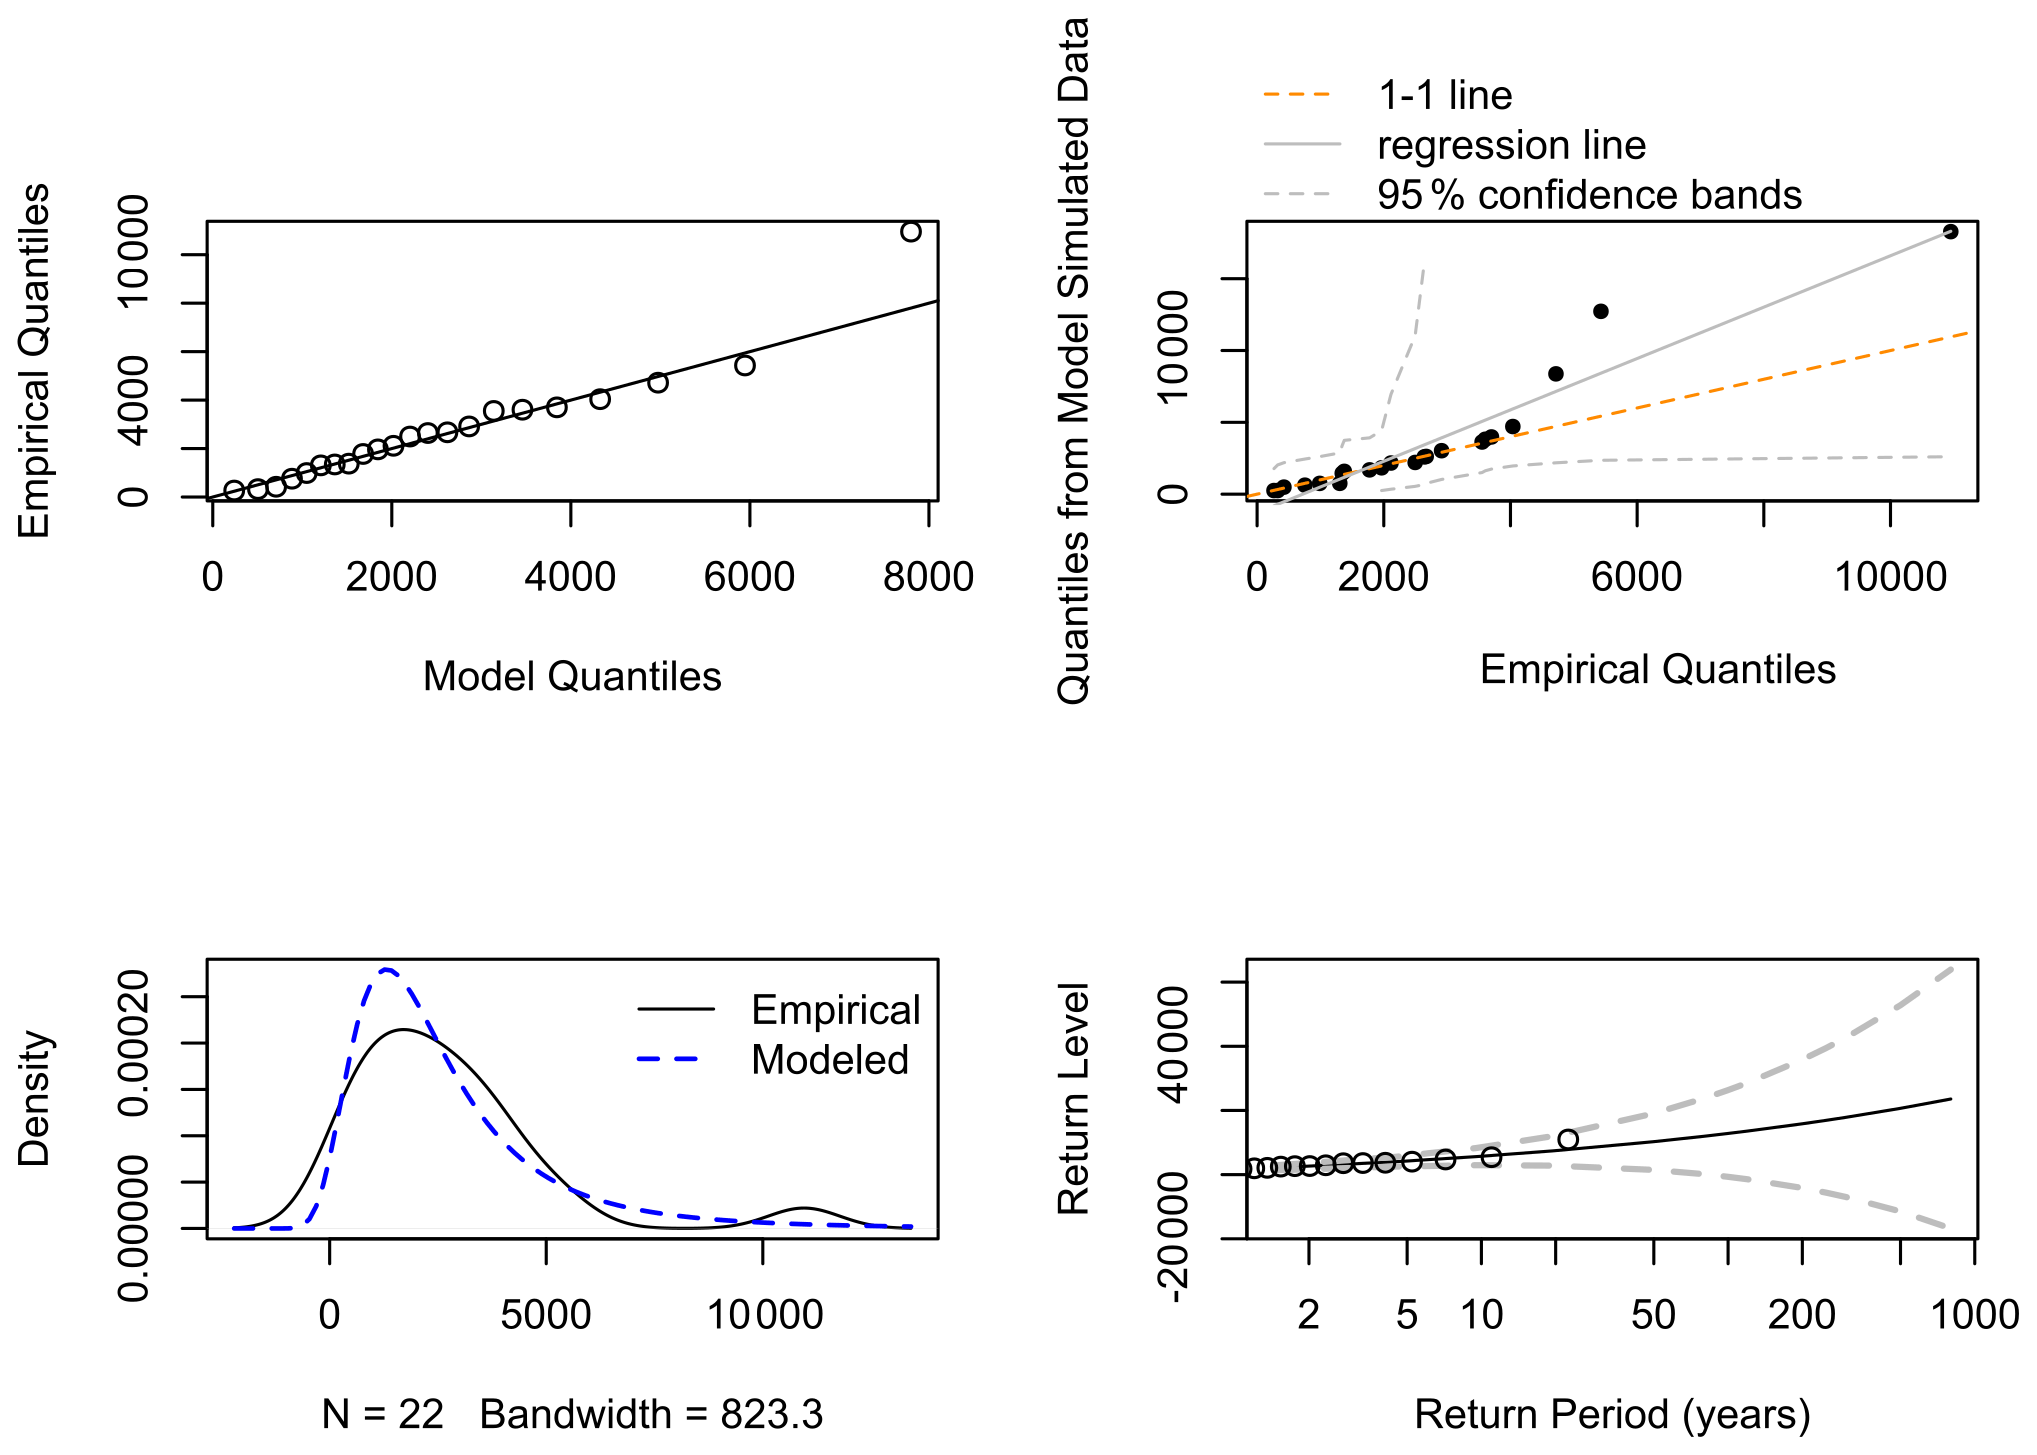
Figure C1Generalized extreme value distribution modelled with the “exTremes” R package on the sediment discharge time series (22 hydrologic years) at the water treatment plant of the Radicatel catchment.
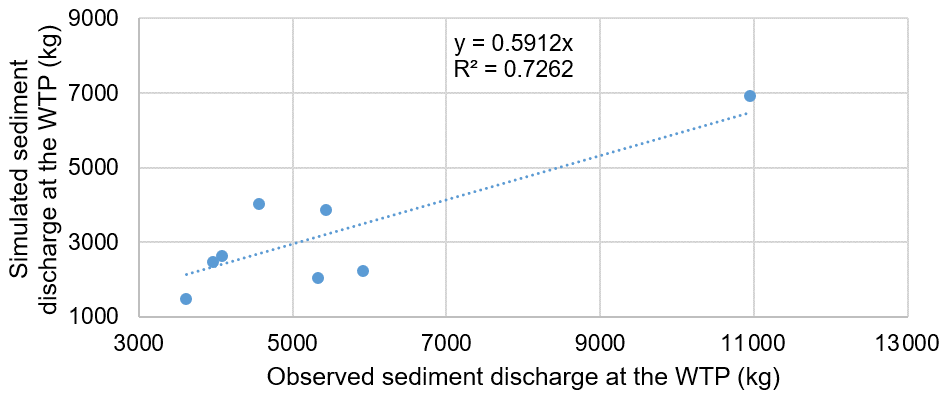
Figure D1Scatter plot of the observed versus simulated sediment discharge by the DNN at the WTP for the 1 % highest sediment discharge on record.
The code that supports the findings of this study is available on request from the corresponding author (Matthieu Fournier).
EP, MF, BL, VL, OC, JFO, JL, and AS conceptualized the study. EP and VL made the formal analysis. BL, OC, MF, and JFO worked on the funding acquisition and the project administration. EP worked on visualization and edition of the paper. EP, VL, MF, and OC took responsibility for the methodology, software, investigation, original draft preparation, and reviewing of the paper.
The contact author has declared that neither they nor their co-authors have any competing interests.
Publisher's note: Copernicus Publications remains neutral with regard to jurisdictional claims in published maps and institutional affiliations.
This study is based on research undertaken as part of the EVAPORE project, “EVAluation de l'efficacité des POlitiques publiques pour les actions visant à REduire les impacts du ruissellement”, to evaluate the efficiency of public policy in reducing erosion and runoff impacts in Normandy, France. The authors are thankful to the University of Rouen, AREAS, and BRGM, who co-founded this project. The authors are also thankful to the LHSM, “Le Havre Seine Métropole”, who provided access to their data.
This research has been supported by the Seine-Normandy Water Agency (grant no. 1071837).
This paper was edited by Dominic Mazvimavi and reviewed by two anonymous referees.
Abadi, M., Agarwal, A., Barham, P., Brevdo, E., Chen, Z., Citro, C., Corrado, G. S., Davis, A., Dean, J., Devin, M., Ghemawat, S., Goodfellow, I., Harp, A., Irving, G., Isard, M., Jia, Y., Jozefowicz, R., Kaiser, L., Kudlur, M., Levenberg, J., Mane, D., Monga, R., Moore, S., Murray, D., Olah, C., Schuster, M., Shlens, J., Steiner, B., Sutskever, I., Talwar, K., Tucker, P., Vanhoucke, V., Vasudevan, V., Viegas, F., Vinyals, O., Warden, P., Wattenberg, M., Wicke, M., Yu, Y., and Zheng, X.: TensorFlow: Large-Scale Machine Learning on Heterogeneous Systems, available at: https://www.tensorflow.org/ (last access: 1 September 2020), 2016.
Appels, W. M., Bogaart, P. W., and van der Zee, S. E. A. T. M.: Influence of spatial variations of microtopography and infiltration on surface runoff and field scale hydrological connectivity, Adv. Water Resour., 34, 303–313, https://doi.org/10.1016/j.advwatres.2010.12.003, 2011.
AREAS: Fascines & Haies pour réduire les effets du ruissellement érosif, Caractérisation de l'efficacité et conditions d'utilisation, p. 68, available at: https://www.areas-asso.fr/images/expe autres/efficacite_haies_fascines_AREAS_68p.pdf (last access: 1 September 2020), 2012.
ARS: Bilan 2013 de la qualité des eaux destinées à la consommation humaine et la protection des captages en Seine-Maritime, available at: https://www.normandie.ars.sante.fr/sites/default/files/2017-03/bilan_76_qualite_eau_2013.pdf (last access: 1 September 2020), 2013.
Baartman, J. E. M., Nunes, J. P., Masselink, R., Darboux, F., Bielders, C., Degre, A., Cantreul, V., Cerdan, O., Grangeon, T., Fiener, P., Wilken, F., Schindewolf, M., and Wainwright, J.: What do models tell us about water and sediment connectivity?, Geomorphology, 367, 107300, https://doi.org/10.1016/j.geomorph.2020.107300, 2020.
Bai, Y., Chen, Z., Xie, J., and Li, C.: Daily reservoir inflow forecasting using multiscale deep feature learning with hybrid models, J. Hydrol., 532, 193–206, 2016.
Carreau, J., Neppel, L., Arnaud, P., and Cantet, P.: Extreme rainfall analysis at ungauged sites in the south of France: Comparison of three approaches, Journal de la Société Française de Statistique, 154, 119–138, 2013.
Cerdan, O., Souchère, V., Lecomte, V., Couturier, A., and Le Bissonnais, Y.: Incorporating soil surface crusting processes in an expert-based runoff model: Sealing and transfer by runoff and erosion related to agricultural management, Catena, 46, 189–205, https://doi.org/10.1016/S0341-8162(01)00166-7, 2001.
Cerdan, O., Le Bissonnais, Y., Souchère, V., Martin, P., and Lecomte, V.: Sediment concentration in interrill flow : interactions between soil surface conditions, vegetation and rainfall, Earth Surf. Proc. Land., 27, 193–205, https://doi.org/10.1002/esp.314, 2002a.
Cerdan, O., Le Bissonnais, Y., Couturier, A., and Saby, N.: Modelling interrill erosion in small cultivated catchments, Hydrol. Process., 3226, 3215–3226, https://doi.org/10.1002/hyp.1098, 2002b.
Chédeville, S.: Etude de la variabilité du fonctionnement hydro-sédimentaire des karsts de l'Ouest du Bassin de Paris à partir de la comparaison des remplissages sédimentaires karstiques anciens, actuels et du signal turbide des eaux souterraines, Thèse de doctorat, Université de Rouen-Normandie, France, p. 458, 2015.
Chollet, F.: Keras, available at: https://github.com/fchollet/keras (last access: 1 September 2020), 2015.
Cochrane, C.: Time Series Nested Cross-Validation, available at: https://towardsdatascience.com/time-series-nested-cross-validation-76adba623eb9, last access: 10 November 2021.
Delmas, M., Pak, L. T., Cerdan, O., Souchère, V., Le Bissonnais, Y., Couturier, A., and Sorel, L.: Erosion and sediment budget across scale: a case study in a catchment of the European loess belt, J. Hydrol., 420, 255–263, https://doi.org/10.1016/j.jhydrol.2011.12.008, 2012.
De Michele, C. and Avanzi, F.: Superstatistical distribution of daily precipitation extremes: A worldwide assessment, Scient. Rep., 8, 14204, https://doi.org/10.1038/s41598-018-31838-z, 2018.
De Vente, J., Poesen, J., Verstraeten, G., Govers, G., Vanmaercke, M., Van Rompaey, A., Arabkhedri, M., and Boix-Fayos, C.: Predicting soil erosion and sediment yield at regional scales: Where do we stand?, Earth-Sci. Rev., 127, 16–29, https://doi.org/10.1016/j.earscirev.2013.08.014, 2013.
Evrard, O., Bielders, L. C., Vandaele, K., and van Wesemael, B.: Spatial and temporal variation of muddy floods in central Belgium, off-site impacts and potential control measures, Catena, 70, 443–454, https://doi.org/10.1016/j.catena.2006.11.011, 2007.
Evrard, O., Nord, G., Cerdan, O., Souchère, V., Le Bissonnais, Y., and Bonté, P.: Modelling the impact of land use change and rainfall seasonality on sediment export from an agricultural catchment of the northwestern European loess belt, Agr. Ecosyst. Environ., 138, 83–94, https://doi.org/10.1016/j.agee.2010.04.003, 2010.
Fournier, M., Mouhri, A., Ratajczak, M., Rossi, A., Slimani, S., and Mesquita, J.: Fonctionnement hydrogéologique de l'aquifère de Caumont et incidence des aménagements de bassin versant sur la qualité des eaux du forage des Varras, available at: https://www.unicaen.fr/m2c/IMG/pdf/rapportsersaep.pdf?262/447a7b605f6dbc8a8df025b439812a0bc73d39bf (last access: 1 September 2020), 2008.
Frankl, A., Prêtre, V., Nyssen, J., and Salvador, P.-G.: The success of recent land management efforts to reduce soil erosion in northern France, Geomorphology, 303, 84–93, https://doi.org/10.1016/j.geomorph.2017.11.018, 2018.
Geman, S., Bienenstock, E., and Doursat, R.: Neural networks and the bias/variance dilemma, Neural Comput., 4, 1–58, 1992.
Gilleland, E. and Katz, R. W.: extRemes 2.0: An extreme Value Analysis Package in R, J. Stat. Softw., 72, 1–39, https://doi.org/10.18637/jss.v072.i08, 2016.
Gilley, J. E., Kottwitz, E. R., and Wieman, G. A.: Roughness coefficients for selected residue materials, J. Irrig. Drain. Eng., 117, 503–514, 1991.
Hafeez, S., Sing Wong, M., Chak Ho, H., Nazeer, M., Nichol, J., Abbas, S., Tang, D., Ho Lee, K., and Pun, L.: Comparison of machine learning algorithms for retrieval of water quality indicators in case-II waters: a case study of Hong-Kong, Remote Sens., 11, 617, https://doi.org/10.3390/rs11060617, 2019.
Hanin, G.: Contrôles structural et hydrogéologique sur la dynamique d'un champ captant en contexte crayeux karstique et sa sensibilité aux variations du signal climatique: Implications en matière de vulnérabilité de la ressource, PhD thesis, University of Rouen-Normandy, France, p. 320, 2011.
Hartmann, A., Goldscheider, N., Wagener, T., Lange, J., and Weiler, M.: Karst water resources in a changing world: Review of hydrological modeling approaches, Rev. Geophys., 52, 218–242, https://doi.org/10.1002/2013RG000443, 2014.
Hu, C., Wu, Q., Jian, S., Li, N., and Lou, Z.: Deep learning with a long short-term memory networks approach for rainfall-runoff simulation, Water, 10, 1543, https://doi.org/10.3390/w10111543, 2018.
Jourde, H., Masséi, N., Mazzilli, N., Binet, S., Batiot-Guilhe, C., Labat, D., Steinmann, M., Bailly-Comte, V., Seidel, J.-L., Arfib, B., Charlier, J.-B., Guinot, V., Jardani, A., Fournier, M., Aliouache, M., Babic, M., Bertrand, C., Brunet, P., Boyer, J.-F., Bricquet, J.-P., Camboulive, T., Carrière, S.-D., Celle-Jeanton, H., Chalikakis, K., Chen, N., Cholet, C., Clauzon, V., Dal Soglio, L., Danquigny, C., Défargue, C., Denimal, S., Emblanch, C., Hernandez, F., Gillon, M., Gutierrez, A., Hidalgo Sanchez, L., Hery, M., Houillon, N., Johannet, A., Jouves, J., Jozja, N., Ladouche, B., Leonardi, V., Lorette, G., Loup, C., Marchand, P., de Montety, V., Muller, R., Ollivier, C., Sivelle, V., Lastennet, R., Lecoq, N., Maréchal, J-C., Perotin, L., Perrin, J., Petre, M.-A., Peyraube, N., Pistre, S., Plagnes, V., Probst, J.-L., Simler, R., Stefani, V., Valdes-Lao, D., Viseur, S., and Wang, X.: SNO KARST: A French network of observatories for the multidisciplinary study of critical zone processes in karst watersheds and aquifers, Vadose Zone J., 17, 180094, https://doi.org/10.2136/vzj2018.04.0094, 2018.
Kourgialas, N. N., Dokou, Z., and Karatzas, G. P.: Statistical analysis and ANN modeling for predicting hydrological extremes under climate change scenarios: The example of a small Mediterranean agro-watershed, J. Environ. Manage., 154, 86–101, 2015.
Kratzert, F., Klotz, D., Brenner, C., Schulz, K., and Herrnegger, M.: Rainfall–runoff modelling using Long Short-Term Memory (LSTM) networks, Hydrol. Earth Syst. Sci., 22, 6005–6022, https://doi.org/10.5194/hess-22-6005-2018, 2018.
Kratzert, F., Klotz, D., Herrneger, M., Sampson, A. K., Hochreiter, S., and Nearing, G. S.: Toward Improved Predictions in Ungauged Basins: Exploiting the Power of Machine Learning, Water Resour. Res., 55, 11344–11354, https://doi.org/10.1029/2019WR026065, 2019.
Laflen, J. M., Lane, L. J., and Foster, G. R.: WEPP: a new generation of erosion prediction technology, J. Soil Water Conserv., 46, 34–38, 1991.
Laignel, B.: Caractérisation et dynamique érosive de systèmes géomorphologiques continentaux sur substrat crayeux, Exemple de l'Ouest du Bassin de Paris dans le contexte Nord-Ouest Européen, mémoire HDR, University of Rouen-Normandy, Rouen, France, p. 138, 2003.
Lal, R.: Soil conservation and ecosystem services, Int. Soil Water Conserv. Res., 2, 36–47, https://doi.org/10.1016/S2095-6339(15)30021-6, 2014.
Landemaine, V.: Erosion des sols et transferts sédimentaires sur les bassins versants de l'Ouest du bassin de Paris: analyse, quantification et modélisation à l'échelle pluriannuelle, PhD thesis, University of Rouen-Normandy, France, p. 236, 2016.
Landemaine, V., Soulignac, A., and Cerdan, O.: Analyse coût-bénéfice des actions de lutte contre le ruissellement et l'érosion des sols sur le bassin de la Lézarde, Rapport final BRGM/RP-69650-FR, p. 142, available at: http://infoterre.brgm.fr/rapports/RP-69650-FR.pdf (last access: 1 September 2020), 2020a.
Landemaine, V., Cerdan, O., Grangeon, T., Vandromme, R., Laignel, B., Evrard, O., Salvador-Blanes, S., and Laceby, P.: Saturation-excess overland flow in the European loess belt: An underestimated process?, in preparation, 2020b.
Lautridou, J.-P.: Le cycle périglaciaire pléistocène en Europe du Nord-Ouest et plus particulièrement en Normandie, PhD thesis, University of Caen, Caen, France, p. 908, 1985.
Le, X.-H., Ho, H. V., Lee, G., and Jung, S.: Application of Long Short-Term Memory (LSTM) Neural Network for Flood Forecasting, Water, 11, 1387, https://doi.org/10.3390/w11071387, 2019.
Le Bissonnais, Y., Thorette, J., Bardet, C., and Daroussin, J.: L'érosion hydrique des sols en France, Rapport INRA-IFEN, p. 106, available at: http://eduterre.ens-lyon.fr/thematiques/sol/degradation-du-sol/erosion-hydrique-2002-br.pdf (last access: 1 September 2020), 2002.
Maetens, W., Poesen, J., and Vanmaercke, M.: How effective are soil conservation techniques in reducing plot runoff and soil loss in Europe and the Mediterranean?, Earth-Sci. Rev., 115, 21–36, https://doi.org/10.1016/j.earscirev.2012.08.003, 2012.
Mangin, A.: Pour une meilleure connaissance des systèmes hydrologiques à partir des analyses corrélatoire et spectrale, J. Hydrol., 67, 25–43, 1984.
Masséi, N., Wang, H. Q., Dupont, J. P., Rodet, J., and Laignel, B.: Assessment of direct transfer and resuspension of particles during turbid floods at a karstic spring, J. Hydrol., 275, 109–121, 2003.
Masséi, N., Dupont, J. P., Mahler, B. J., Laignel, B., Fournier, M., Valdes, D., and Ogier, S.: Investigating transport properties and turbidity dynamics of a karst aquifer using correlation, spectral, and wavelet analyses, J. Hydrol., 329, 244–255, 2006.
Merritt, W. S., Letcher, R. A., and Jakeman, A. J.: A review of erosion and sediment transport models, Environ. Model. Softw., 18, 761–799, 2003.
Meyers, G., Kapelan, Z., Keedwell, E., and Randall-Smith, M.: Short-term forecasting of turbidity in a UK water distribution system, Proced. Eng., 154, 1140–1147, 2016.
Meyers, G., Kapelan, Z., and Keedwell, E.: Short-term forecasting of turbidity in trunk main networks, Water Res., 124, 67–76, 2017.
Morgan, R. P. C.: Soil Erosion and Conservation, National Soil Resources Institute, Cranfield University, Jown Wiley & Sons, ISBN 13:9781405117814, 2005.
Nash, J. E. and Sutcliffe, J. V.: River flow forecasting through conceptual models part I – a Discussion of Principles, J. Hydrol., 10, 282–290, 1970.
Ortiz-Rodriguez, J. M., Martinez-Blanco, M. R., Cervantes-Viramontes, J. M., and Vega-Carrillo, H. R.: Robust Design of Artificial Neural Networks Methodology in Neutron Spectrometry, Artificial Neural Networks – Architectures and Applications, Kenji Suzuki, IntechOpen, https://doi.org/10.5772/51274, 2013.
Ouvry, J.-F., Coufourier, N., Richet, J.-B., Lhériteau, M., and Pivain, S.: Maîtrise du ruissellement et de l'érosion des sols: expérimentations sur les pratiques culturales: synthèse des résultats du ruissellement et d'érosion, Expérimentations sur les pratiques culturales, 2001–2010, 2021, Hal-02811122, available at: https://www.areas-asso.fr/images/resultats essais simul/brochure_10ans_essais_PC_ruissellement.pdf (last access: 1 September 2020), 2012.
Ouvry, J.-F., Richet, J.-B., and Saunier, M.: “Le rebocagement”: une réponse pertinente face aux enjeux érosifs? Retour d'expérience du Pays de Caux, Revue Science Eaux & Territoires, Ressources en eau, ressources bocagères, 30, 54–59, https://doi.org/10.14758/SET-REVUE.2019.4.11, 2019.
Patault, E., Ledun, J., Landemaine, V., Soulignac, A., Richet, J.-B., Fournier, M., Ouvry, J.-F., Cerdan, O., and Laignel, B.: Analysis of off-site economic costs induced by runoff and soil erosion: Example of two areas in the northwestern European loess belt for the last two decades (Normandy, France), Land Use Policy, 108, 105541, https://doi.org/10.1016/j.landusepol.2021.105541, 2021a.
Patault, E., Soulignac, A., Landemaine, V., Ledun, J., Allard, E., Fournier, M., Ouvry, J.-F., Cerdan, O., and Laignel, B.: Analyse coût-bénéfice du programme d'actions visant à réduire les impacts du ruissellement et de l'érosion en Haute-Normandie: évaluation des actions passées et projections futures sur le bassin versant de la Lézarde, LHB Hydrosci. J., 107, 1–10, https://doi.org/10.1080/00186368.2021.1912963, 2021b.
Posthumus, H., Deeks, L. K., Rickson, R. J., and Quinton, J. N.: Costs and benefits of erosion control measures in the UK, Soil Use Manage., 31, 16–33, https://doi.org/10.1111/sum.12057, 2015.
Quintana-Segui, P., Le Moigne, P., Durand, Y., Martin, E., Habets, F., Baillon, M., Canellas, C., Franchistéguy, L., and Morel, S.: Analysis of near surface atmospheric variables: validation of the SAFRAN analysis over France, J. Appl. Meteorol. Clim., 47, 92–107, https://doi.org/10.1175/2007JAMC1636.1, 2008.
R Development Core Team: R: A language and environment for statistical computing, R Foundation for Statistical Computing, Vienna, Austria, ISBN 3-900051-07-0, available at: http://www.R-project.org (last access: 1 September 2020), 2008.
Renard, K. G. and Freidmund, J. R.: Using monthly precipitation data to estimate the R factor in the revised USLE, J. Hydrol., 157, 287–306, 1994.
Savary, M., Johannet, A., Masséi, N., Dupont, J.-P., and Hauchard, E.: Operational turbidity forecast using both recurrent and feed-forward based multilayer perceptrons, in: Advances in time series analysis and forecasting, ITISE 2016, Contributions to Statistics, edited by: Rojas, I., Pomares, H., and Valenzuela, O., Springer, Cham, 2017.
Shen, C.: A transdisciplinary review of deep learning research and its relevance for water resources scientists, Water Resour. Res., 54, 8558–8593, https://doi.org/10.1029/2018WR022643, 2018.
Shen, C., Laloy, E., Elshorbagy, A., Albert, A., Bales, J., Chang, F.-J., Ganguly, S., Hsu, K.-L., Kifer, D., Fang, Z., Fang, K., Li, D., Li, X., and Tsai, W.-P.: HESS Opinions: Incubating deep-learning-powered hydrologic science advances as a community, Hydrol. Earth Syst. Sci., 22, 5639–5656, https://doi.org/10.5194/hess-22-5639-2018, 2018.
Siou, L. K. A., Johannet, A., Borrell, V., and Pistre, S.: Complexity selection of a neural network model for karst flood forecasting: The case of the Lez Basin (southern France), J. Hydrol., 403, 367–380, 2011.
Sit, M., Demiray, B. Z., Xiang, Z., Ewing, G. J., Sermet, Y., and Demir, I.: A comprehensive review of deep learning applications in hydrology and water resources, Water Sci. Technol., 82, 2635–2670, https://doi.org/10.2166/wst.2020.369, 2020.
Sjörberg, J. and Ljung, L.: Overtraining, regularization, and searching for minimum in neural networks, in: IFAC Adaptative Systems in Control and Signal Processing, Grenoble, France, 1992.
Souchère, V., King, D., Daroussin, J., Papy, F., and Capillon, A.: Effects of tillage on runoff directions: Consequences on runoff contributing area within agricultural catchments, J. Hydrol., 206, 256–267, https://doi.org/10.1016/S0022-1694(98)00103-6, 1998.
Souchère, V., Cerdan, O., Ludwig, B., Le Bissonnais, Y., Couturier, A., and Papy, F.: Modelling ephemeral gully erosion in small cultivated catchments, Catena, 50, 489–505, https://doi.org/10.1016/S0341-8162(02)00124-8, 2003.
Souchère, V., Cerdan, O., Dubreuil, N., Le Bissonnais, Y., and King, C.: Modelling the impact of agri-environmental scenarios on runoff in a cultivated catchment (Normandy, France), Catena, 61, 229–240, 2005.
Stevenson, M. and Bravo, C.: Advanced turbidity prediction for operational water supply planning, Decis. Support Syst., 119, 72–84, 2019.
Takken, I., Beuselinck, L., Nachtergaele, J., Govers, G., Poesen, J., and Degraer, G.: Spatial Evaluation of physically-based distributed erosion model (LISEM), Catena, 37, 431–447, 1999.
Varma, S. and Simon, R.: Bias in error estimation when using cross-validation for model selection, BMC Bioinform., 7, 91, https://doi.org/10.1186/1471-2105-7-91, 2006.
Verstraeten, G., Prosser, I. P., and Fogarty, P.: Predicting the spatial patterns of hillslope sediment delivery to river channels in the Murrumbidgee catchment, Australia, J. Hydrol., 334, 440–454, https://doi.org/10.1016/j.jhydrol.2006.10.025, 2007.
Vidal, J. P., Martin, E., Franchisteguy, L., Baillon, M., and Soubeyroux, J. M.: A 50-year high-resolution atmospheric reanalysis over France with the Safran system, Int. J. Climatol., 30, 1627–1644, 2010.
Wang, L. and Liu, H.: An efficient method for identifying and filling surface depressions in digital elevation model for hydrologic analysis and modelling, Int. J. Geogr. Inf. Sci., 20, 193–213, https://doi.org/10.1080/13658810500433453, 2006.
Yaseen, Z. M., El-shafie, A., Jaafar, O., Afan, H. A., and Sayl, N. K.: Artificial intelligence based models for stream-flow forecasting: 2000–2015, J. Hydrol., 530, 829–844, https://doi.org/10.1016/j.jhydrol.2015.10.038, 2015.
Zhang, M. D. D., Yan, M. X. P., and He, X.: Modeling extreme events on time series prediction, in: KDD'19, 4–8 August 2019, Anchorage, AK, USA, https://doi.org/10.1145/3292500.3330896, 2019.
- Abstract
- Introduction
- Study site
- Methodology
- Data
- Results
- Discussion
- Conclusions
- Appendix A: Scatter plot of turbidity time series
- Appendix B: Monthly backward-chaining nested cross-validation
- Appendix C: Generalized extreme values distribution
- Appendix D: Scatter plot of extreme events
- Code and data availability
- Author contributions
- Competing interests
- Disclaimer
- Acknowledgements
- Financial support
- Review statement
- References