the Creative Commons Attribution 4.0 License.
the Creative Commons Attribution 4.0 License.
 | 02 Dec 2021
Response of water fluxes and biomass production to climate change in permanent grassland soil ecosystems
Veronika Forstner
Jannis Groh
Matevz Vremec
Markus Herndl
Harry Vereecken
Horst H. Gerke
Steffen Birk
Thomas Pütz
Effects of climate change on the ecosystem productivity and water fluxes have been studied in various types of experiments. However, it is still largely unknown whether and how the experimental approach itself affects the results of such studies. We employed two contrasting experimental approaches, using high-precision weighable monolithic lysimeters, over a period of 4 years to identify and compare the responses of water fluxes and aboveground biomass to climate change in permanent grassland. The first, manipulative, approach is based on controlled increases of atmospheric CO2 concentration and surface temperature. The second, observational, approach uses data from a space-for-time substitution along a gradient of climatic conditions. The Budyko framework was used to identify if the soil ecosystem is energy limited or water limited.
Elevated temperature reduced the amount of non-rainfall water, particularly during the growing season in both approaches. In energy-limited grassland ecosystems, elevated temperature increased the actual evapotranspiration and decreased aboveground biomass. As a consequence, elevated temperature led to decreasing seepage rates in energy-limited systems. Under water-limited conditions in dry periods, elevated temperature aggravated water stress and, thus, resulted in reduced actual evapotranspiration. The already small seepage rates of the drier soils remained almost unaffected under these conditions compared to soils under wetter conditions. Elevated atmospheric CO2 reduced both actual evapotranspiration and aboveground biomass in the manipulative experiment and, therefore, led to a clear increase and change in seasonality of seepage. As expected, the aboveground biomass productivity and ecosystem efficiency indicators of the water-limited ecosystems were negatively correlated with an increase in aridity, while the trend was unclear for the energy-limited ecosystems.
In both experimental approaches, the responses of soil water fluxes and biomass production mainly depend on the ecosystems' status with respect to energy or water limitation. To thoroughly understand the ecosystem response to climate change and be able to identify tipping points, experiments need to embrace sufficiently extreme boundary conditions and explore responses to individual and multiple drivers, such as temperature, CO2 concentration, and precipitation, including non-rainfall water. In this regard, manipulative and observational climate change experiments complement one another and, thus, should be combined in the investigation of climate change effects on grassland.
- Article
(2621 KB) - Full-text XML
-
Supplement
(207 KB) - BibTeX
- EndNote


Current and future climate change is expected to alter air temperature, CO2 concentration in the atmosphere, and precipitation (P; Abbott et al., 2019; IPCC, 2018). Changes in these conditions will alter hydrological processes and affect the soil water availability, which is of critical importance for the agricultural sector in terms of plant development and food production (Thornton et al., 2014). Grassland represents one of the Earth's main biomes (Blair et al., 2014). Managed grassland areas are important for carrying the capacity of livestock and for herbage and hay production for forage. Moreover, these areas are also important for several other ecosystem services beside food production like water supply and flow regulation, erosion control, climate mitigation, pollination, carbon storage, and cultural services (Bengtsson et al., 2019). However, services are strongly dependent on weather and climate conditions and, thus, potentially highly vulnerable to climate change (Gobiet et al., 2014). Since the late 19th century, air temperatures in the Alpine region have risen about twice as much as the global or Northern Hemispheric average (Auer et al., 2007). These strongly changing climatic conditions, in particular the expected increase in frequency and magnitude of extreme events such as droughts and heavy rainfall, potentially have adverse effects on the soil water balance and biomass production of grasslands, especially in mountainous regions. Depending on the regional climate change and its local impacts, altered P regimes and higher temperatures will potentially increase actual evapotranspiration (ETa) and, thus, negatively affect the local ecosystem services related to water (Schirpke et al., 2017; Rahmati et al., 2020). In addition, a shift in the temperature regime will prolong the growing season, which might change the vegetation composition, water use efficiency (WUE) of grasslands, enable a more intensified use of grassland sites (more frequent mowing), and increase the biomass production (Eitzinger et al., 2009; Tello-García et al., 2020). But this might largely depend on the hydrological status of the ecosystem, which can be characterised by the Budyko framework as energy limited or water limited (Budyko and Miller, 1974). For regions that are currently disadvantaged because of the climatic and topographic conditions, it may be expected that, in the future, aboveground biomass (AGB) production will increase due to higher temperatures (Eitzinger et al., 2009). However, the combined effect of higher temperatures, causing increased ETa and the expected decrease in summer P, also suggests more frequent and more severe occurrences of droughts (e.g. the 2018 European drought; Peters et al., 2020), which may lead to a lower water availability in the soil and, thus, adversely affect the AGB production of grassland, as well as the quantity and quality of the drainage water (Herndl et al., 2019).
To contribute to the assessment of climate change impacts on mountain grassland, there is the general need to understand the individual and combined effects of changes in temperature and P with and without elevated atmospheric CO2 concentrations on the water balance components (including non-rainfall water – NRW; i.e. dew and fog) and the connected biomass production of mountain grasslands. The use of a high-precision weighable lysimeter allows quantifying the water balance components of ecosystems and determining their productivity, such as shown, for instance, by Groh et al. (2020). It may be expected that, even for northern humid ecosystems, the formation of NRW temporarily gains importance in the water budget during droughts (Groh et al., 2018), and that under such extreme conditions, heat and/or water stress can cause a decrease in the AGB production of grasslands (Fu et al., 2006). To explore how ecosystems will respond to changes in environmental conditions, key hydroclimatic and ecohydrological indicators, such as the precipitation use efficiency (PUE; Wang et al., 2019), the WUE (Hatfield and Dold, 2019; Groh et al., 2020), and the runoff coefficient (Chen et al., 2007), have been proposed to assess the impact of changing climatic conditions on the ecosystems.
To identify the response of water fluxes and AGB production to climate change in permanent grassland soil ecosystems, two major approaches have been proposed. These include either manipulative experiments (using multifactorial drivers) or observational experiments on environmental gradients, which can serve to explore the relationship between changing climate factors and ecosystem responses (Hanson and Walker, 2020; Song et al., 2019; Kreyling and Beier, 2013; Knapp et al., 2018). According to Yuan et al. (2017), the main difference between these approaches is the issue of association versus causality. Observational approaches can identify a relationship between a set of randomly selected variables of a system under natural conditions, while manipulative approaches are more likely to identify and confirm the underlying mechanism based on measuring responses of the system by controlling certain variables. It is often assumed that manipulative or observational climate change experiments lead to similar results in the assessment of climate change impacts on, for example, the components of the water balance. However, a recent meta-analysis on climate change experiments showed that the impacts of climate change on the nutrient cycle differed among the tested approaches (Yuan et al., 2017). Knapp et al. (2018) compared the response of different grassland ecosystems to climate change from manipulative and observational climate change experiments. In particular, they found that both approaches achieved a similar functional relationship between growing season precipitation (GSP) and AGB, when the GSP was within the range of historical observations. The predictions outside the range of historic events, however, led to non-linear relations in the AGB response to changes in GSP (Knapp et al., 2018). This clearly demonstrates the need to impose relatively extreme changes in the boundary conditions (e.g. P reduction) in climate change experiments in order to observe the non-linear response of the soil ecosystem (i.e. AGB) to changes in the climate regime (Knapp et al., 2018). We, therefore, hypothesise that the response of the grassland ecosystems to changing climatic conditions will differ among the two approaches, particularly if the soil ecosystem changes from an energy-limited to a water-limited hydrological status.
The objective of the present study was to test this hypothesis by comparing the impact of climatic factors on (i) the water balance and (ii) the AGB production within and between the manipulative and observational approaches and (iii) to identify the impact of altered climatic conditions on the functional relationships between water balance components, AGB, and hydroclimatical and ecohydrological indicators. Data are provided from two distinct climate change experiments, namely Lysi-T-FACE (climate impact research on grassland; Herndl et al., 2010, 2011) and TERENO-SOILCan (TERrestrial ENnvironmental Observatories; Pütz et al., 2016). The Lysi-T-FACE experiment is denoted here as manipulative approach and TERENO-SOILCan as an observational approach. In both experiments, high-precision weighing lysimeters were used to quantify the water balance components and the AGB of grassland ecosystem in mountainous regions.
2.1 Manipulative and observational approaches
The climate change experiment Lysi-T-FACE is an experimental concept that has been designed to enable the warming of grassland plots, using an infrared heating system (Kimball et al., 2008), and enriching the CO2 content of the air using a Mini-FACE system (T-FACE; Miglietta et al., 2001). This experimental set-up was implemented at an alpine grassland site in 2010 and 2011 (Herndl et al., 2011). The overall experimental design at this site is based on a surface response approach (Piepho et al., 2017) and includes factor combinations of two elevated temperatures and two elevated CO2 concentrations at 24 grassland plots under open-field conditions. The Lysi-T-FACE approach at weighable lysimeters (Fank and Unold, 2007) is implemented at six of these plots. The proper functioning of the T-FACE performance has been repeatedly tested and has been fully operational since May 2014 at the experimental site.
The observational approach for quantifying climate change impacts in the soil–plant system has been implemented in the TERENO-SOILCan lysimeter network since 2010–2011 (Pütz et al., 2016, 2018). Intact soil monoliths were transferred within and between TERENO observatories to expose them, apart from the observations at their original site, to other climatic conditions (space-for-time substitution; see details in Pütz et al., 2016; Groh et al., 2020). The concept of the space-for-time substitution means that soils were translocated in space instead of waiting at the same location for changes in climatic conditions in time. The change in the climate regime by the transfer of the lysimeters was abrupt, which implies that we are not able to detect gradual changes in the grassland ecosystem over time, as suggested in standard space-for-time approach, but we can account for unsuspected effects from the past (Groh et al., 2020).
2.2 Lysimeter set-up
The study was conducted at three test sites (Table 1). The Lysi-T-FACE test site is located at the Agricultural Research Centre Raumberg-Gumpenstein (GS) in Austria. The experimental site is located at an altitude of 707 m a.s.l. (above sea level) within the Enns valley of the Austrian Alps. The mean air temperature at the site is 7.2 ∘C, mean annual P is 1000 mm, and the soil is a Cambisol. Thus, the site may be considered as representative of permanent grassland in the Alps (Schaumberger, 2011). The grasses Arrenatherum elatius and Festuca pratensis and the leguminous species Lotus corniculatus, and Trifolium pratense dominate the grassland established at the Lysi-T-FACE site. The grassland was mowed three times per year (see the Supplement; Table S1), each followed by mineral fertilisation (Herndl et al., 2010), and the average length of the growing season over the observation period from 2015 to 2018 was 197 d (for more details on the method, see Sect. 2.3 and Table S2).
At GS, six lysimeters were installed; one lysimeter was operated under ambient conditions (C0T0), two under a constant warming of 3 ∘C of grassland (C0T2) relative to the ambient surface temperature, two under a constant elevated CO2 concentration (300 ppm – parts per million) relative to the ambient atmospheric CO2 concentration (C2T0), and one with a combination of elevated temperature and elevated CO2 (C2T2). The used abbreviations of C and T within the treatments stand for CO2 and temperature, and the number 0 is for ambient conditions and is 2 for a specific level of the elevated conditions. A nearby weather station was used to obtain meteorological observations of reference P (tipping-bucket method; Young), air temperature, air humidity, solar radiation, net radiation, and wind speed at a height of 2 m above ground. Data from the weather station were used to calculate grass reference evapotranspiration (ET0) according to Penman–Monteith (Allen et al., 2006).
The two other test sites are part of the TERENO-SOILCan lysimeter network, located in the northwest of Germany, in Rollesbroich (RO) and Selhausen (SE). Both sites have a humid, temperate climate, with an average annual air temperature of 8 and 10 ∘C and an average annual P of 1150 and 720 mm for Rollesbroich and Selhausen, respectively. The plant community consists mainly of Lolium perenne and Trifolium repens. The grassland lysimeters at both sites were subject to management (cutting and fertiliser), according to the local agricultural management of the surrounding field at Rollesbroich. This includes three to four cuts per growing season (Table S1) and the application of liquid manure or mineral fertiliser three to four times per year (Pütz et al., 2016). Mean length of the growing season over the observation period was 208 and 243 d in RO and SE, respectively.
At RO (C0CL0; CL stands for climate) six lysimeters were installed to quantify the soil water budget and AGB under ambient conditions (RO – C0CL0). At SE (C0CL2), three lysimeter were installed to quantify soil water fluxes and AGB under altered climatic conditions (SE – C0CL2; less precipitation; higher ET0). A weather station (WXT510; Vaisala Oyj) was installed at both sites, logging the same meteorological parameters as at GS. The reference P was measured with a weighing rain gauge (OTT Pluvio2; OTT HydroMet GmbH), and a net radiation sensor (LP Net07; Delta OHM S.r.l.) was installed above one lysimeter at each site. In addition, the vegetation height observations were obtained for calculating ET0 with Penman–Monteith model (Allen et al., 2006).
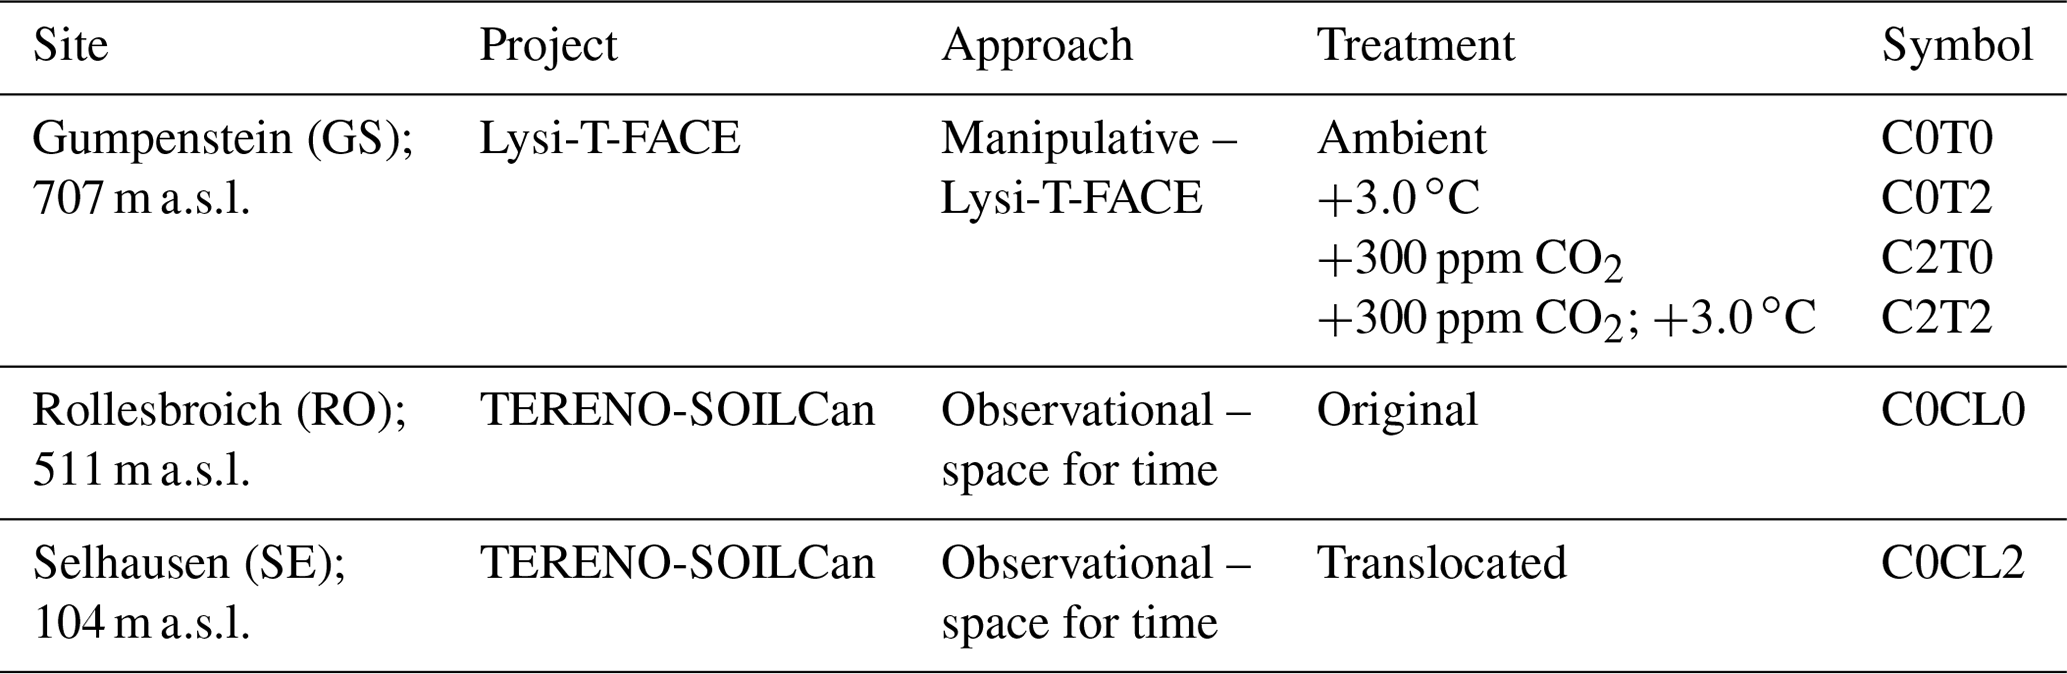
Table 1Overview of the three test sites with their different approaches at the locations of Gumpenstein (GS), Rollesbroich (RO), and Selhausen (SE). The experiments at GS comprise treatments that have ambient (C0T0), elevated air temperature (T; C0T2), an elevated concentration of CO2 (C2T0), and a combined elevated concentration of CO2 and T (C2T2) conditions. In the observational space-for-time substitution approach, site RO represents the ambient atmospheric demand for evapotranspiration and ambient precipitation (C0CL0). The site SE represents the elevated atmospheric demand for evapotranspiration and reduce amount of precipitation (C0CL2).
2.3 Quantifying water balance components
Weighable high-precision lysimeter systems provide measurements of the components of the soil water balance equation, P, NRW, ETa, and the vertical net flux above the lysimeter bottom (NetQ). The NetQ component comprises water flow out of (Q; seepage) and into the lysimeter at the bottom; note that the latter represents the upward flow by capillary rise. The change in soil water storage (ΔS), which affects water availability in the soil ecosystem, was calculated as follows:
The water balance components P, NRW, and ETa were obtained at each site from the highly resolved (1 min) and precise (0.01 mm resolution) lysimeter observations over a period of 4 consecutive years (1 January 2015 until 31 December 2018). NetQ was obtained at the same time interval from a weighable water tank (0.001 mm resolution).
Lysimeter mass changes are prone to external disturbances like management operations or wind. Thus, the lysimeter data of mass changes have been processed by a pre- and post-processing routine to prevent external errors and noise affecting the determination and separation of water fluxes across the land surface (P, NRW, and ETa). The procedure included in a first step a visual data quality check of the 1 min lysimeter data. In a second step, the adaptive window and adaptive threshold filter (AWAT; Peters et al., 2017) was applied, which has been shown to allow the quantification of small water fluxes like dew, water vapour adsorption, or nighttime ETa (Groh et al., 2019; Kohfahl et al., 2019). Water fluxes across the land surface and bottom boundary were aggregated to 10 min time intervals for detailed analysis of P, especially for the identification of NRW (Groh et al., 2018) and ETa. Gaps in the time series of measured P and ETa were filled with observations from parallel lysimeter observations. In the case of missing parallel lysimeter observations, gaps in the hourly time series were filled using linear regression between observed water fluxes and external observations or calculations (i.e. a rain gauge and ET0). Finally, all water balance components were aggregated on a daily timescale and were averaged over the number of available repetitions for each treatment. At GS, the water balance components for the treatment C2T0 in 2017 and 2018 were taken only from one lysimeter due to technical problems.
The component NRW, which includes fog, dew, and hoar frost formation, was determined by lysimeter mass increases between sunset and sunrise, when the corresponding rain gauge from the meteorological station did not detect P during the corresponding 10 min time step (Groh et al., 2018). The treatment of the Lysi-T-FACE plots at GS, i.e. free air carbon enrichment together with infrared heating, was active only during the growing season when plant growth occurs. In winter periods, CO2 enrichment was out of operation. The CO2 enrichment was also deactivated when the soil temperature at a depth of 10 cm was below 3 ∘C. This condition was used in the set-up at GS to define the non-growing season. However, in this work, the non-growing season was defined in a different way to that described next for comparing the manipulative approach with the observational approach. In contrast to the CO2 enrichment, the heating was not generally out of operation in winter periods but only turned off if the snow cover was higher than 10 cm. Thus, a comparison of the two treatments, i.e. free air carbon enrichment and infrared heating, was possible only in the growing season. Hence, the water balance components of the different soils at the specific sites under the original and climate change conditions were compared separately for the growing season and non-growing season.
The mean error representing the average deviation between the daily values obtained under changed conditions and those of the ambient reference was calculated using the R software (R Core Team, 2016) and the function me of the package hydroGOF (Zambrano-Bigiarini, 2017) as follows:
where n is the number of samples, and ObsTi and Obsrefi are the daily value on the corresponding water balance term from the treatment (subscript Ti) and reference (subscript refi). The AGB production of the grassland ecosystem were analysed solely for the growing season. A thermal-based definition of the growing season and non-growing season, proposed by Ernst and Loeper (1976), was employed in this study to identify the beginning and end of the growing season and non-growing season at the corresponding site. In this approach, the beginning of the growing season can be obtained by adding up all positive average daily air temperatures from 1 January and considering specific weight factors for each month. The daily means of air temperatures were multiplied by weighting factors of 0.5 (January), 0.75 (February), and 1 (March) and summed up. The beginning of the growing season in spring was defined as the day on which the cumulative temperature sum exceeded a threshold of 200 ∘C. The same approach was used to obtain the end of the growing season; this was achieved by starting the temperature sums backward from 31 December, with weighting factors of 0.5 and 0.75 for December and November, respectively.
2.4 Budyko plot
The Budyko framework (Budyko and Miller, 1974) was used to obtain information about the hydrological status of the corresponding soil ecosystem. The Budyko plot characterises how the aridity index (AI = ET) controls the fraction of P into evapotranspiration (evaporative index is EI = ET) and runoff (Berghuijs et al., 2020). In case of values of AI <1, the system can be described as a demand (i.e. energy limited) and in case of AI >1 as a supply (i.e. water limited). Please note that, instead of considering P alone in the Budyko framework, we have also used NRW inputs here.
2.5 Hydroclimatological and ecohydrological indicators
The dry matter AGB was gravimetrically determined with a precision balance (Gumpenstein – EA 6DCE-I, Sartorius; Selhausen and Rollesbroich – EMS 6K0.1, KERN). At GS, AGBs were dried at 55 ∘C for 48 h, and AGBs were dried at RO and SE at 60 ∘C for 24 h. The AGBs from the different cuts were summed over the growing season to the annual values and averaged over the replicated treatments (see Table 1).
The crop WUE, defined here as the amount of dry AGB produced per unit of water used by a plant (Tello-García et al., 2020), was estimated as follows:
where AGB represents the dry matter biomass production (grams per square metre; hereafter g m−2) and ETa the actual evapotranspiration (millimetres) during the growing season of the corresponding year and treatment. The annual PUE (grams per square metre per millimetre; hereafter g m−2 mm−1), which are defined as the ratio of AGB and mean annual P (Zhou et al., 2020), and NRW were calculated as follows:
The PUE is a key indicator that explains the response of the ecosystem productivity to P (Wang et al., 2019) and NRW. Hence, PUE is used here to explore how the relationship between water balance and the crop components in the carbon cycle reacts to changes in the environmental conditions (Zhou et al., 2020).
The aridity index (–) and the ratio of seepage (Q) to P and NRW (–) were determined by Eqs. (5) and (6) as follows:
The QP ratio is a dimensionless indicator that describes the portion of P and NRW that becomes seepage and will eventually contribute to groundwater recharge. Here, we used the QP ratio as an indicator to assess how changing climatic conditions affect the hydrological functioning of the soil ecosystem. It should be noted that, for QP, AI, and PUE, normally only P is used, as quantitative information on NRW is often not available. Linear correlations between AGB, ETa, ET0, WUE, GSP, PUE, and AI were generated by the use of the package lm (R Core Team, 2016) to determine the responses of the corresponding variable/indicator under changing climate and the reference conditions of the manipulative or observational approach. The significance level (p<0.05) was used to indicate if the relationship between the variables are statistically significant.
3.1 Impact on the water balance components
3.1.1 Precipitation and non-rainfall water
The average annual P for the manipulative climate change approach at GS ranged from 1088 to 1131 mm a−1 across the observation period (2015–2018; Table 2; more details in Table S3). The values of P were generally larger during growing (691 to 724 mm average range) than non-growing seasons (396 to 408 mm average range; Table 2). The average annual NRW ranged between 52 and 76 mm (Table 2; more details in Table S4), which corresponds to 4.8 % to 6.7 % of P (Table S5). In contrast to P, NRW was, on average, larger during the non-growing season (34 to 48 mm) than during the growing seasons (20 to 28 mm). The treatments at GS showed differences in P and NRW, despite no active direct control on these variables. The lysimeters solely enriched with CO2 (1131 mm C2T0) achieved on average similar annual P amounts over the observation period to the reference lysimeter (1125 mm C0T0). In contrast, the annual P amounts of the temperature-increased treatment (1096 mm C0T2) and the combined CO2-enriched and temperature-increased treatment (1088 mm C2T2) were, on average, smaller than the reference observation (C0T0). A similar tendency in the daily P between the treatments and the ambient measurement was observed for the non-growing (Fig. 1a) and growing season (Fig. 1b), with negative mean error values for treatments C0T2 and C2T2 and positive values for C2T0. The most pronounced differences between treatments with an elevated temperature and reference were detected during the growing season, and the mean error of daily P ranged between −0.12 and −0.14 mm d−1 (Fig. 1b).
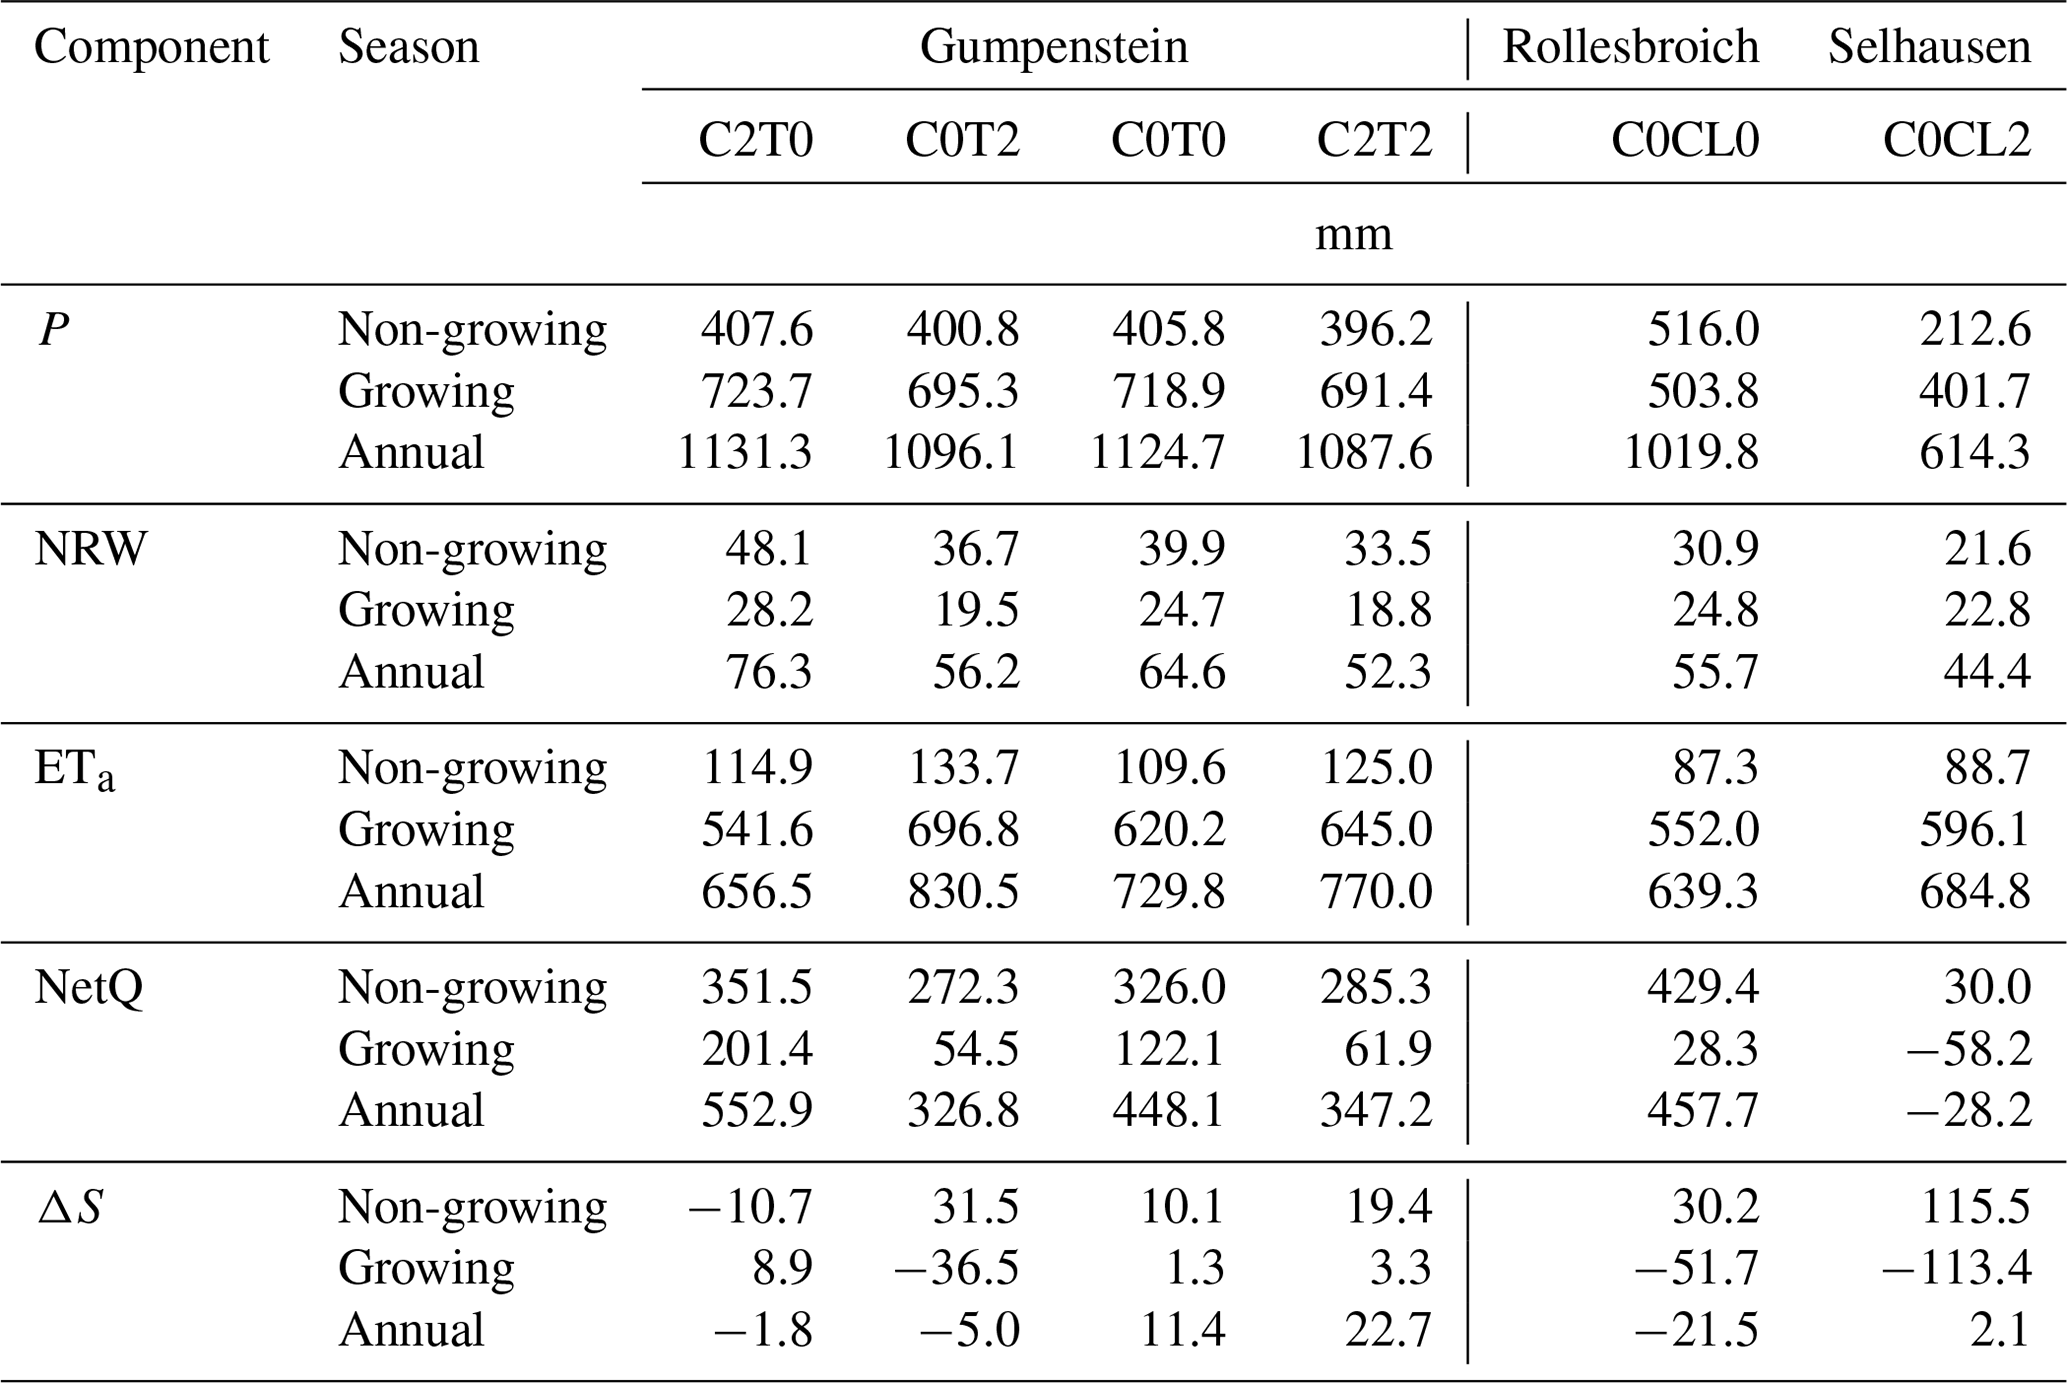
Table 2Average values of the soil water balance components of precipitation (P), non-rainfall water (NRW), actual evapotranspiration (ETa), net water flux across the lysimeter bottom (NetQ), and change in the soil water storage (ΔS). The values were averaged across the non-growing seasons, growing seasons, and annual values for the period 2015–2018 from replicated lysimeter measurements at each test site. This includes Gumpenstein (GS) with C2T0 (CO2 – +300 ppm; two lysimeters), C0T2 (temperature – +3 ∘C; two lysimeters), C0T0 (ambient; one lysimeter), C2T2 (CO2 – +300 ppm; temperature – +3 ∘C; one lysimeter), Rollesbroich (RO) with C0CL0 (original; six lysimeters) and Selhausen (SE) with C0CL2 (translocated; three lysimeters).
All treatments had a visible impact on the formation of dew in comparison to the ambient conditions (C0T0; Table 2). Observations reveal that an increase in canopy surface temperature (C0T2 or C2T2) goes along with a decreasing formation of NRW, with negative mean error values during both periods (Fig. 1e and f). The change in temperature and CO2 concentration reduced the annual NRW on average for C0T2 by 13 % and for C2T2 by 19 % in comparison to the ambient variant C0T0. Results for C2T2 indicate that the elevated surface temperature is the dominating factor in dew formation. This treatment generally achieved the lowest relative contribution of NRW at the annual scale and the largest negative mean error values. Our results reveal that an elevated CO2 concentration also seems to influence the formation of NRW, as NRW increases by 18 % for treatment C2T0 compared to the reference C0T0. Seasonal and annual values of P and NRW amounts were generally significantly lower for 2018 compared to the other 3 years (Tables S3 and S4). However, the relative contribution of NRW to P is similar to the previous years.
The annual P at the observational site RO was, in general, lower in the growing seasons (388 to 569 mm average range) than during the non-growing seasons (484 to 581 mm average range). Similar to GS, the lysimeters from RO in SE obtained higher values of P in growing seasons (402 mm average) than in non-growing seasons (213 mm average). The transfer of lysimeter brought the soil ecosystem from a region with high (RO) to a region with low P (SE). As compared to RO, the average annual P at SE is lower by 406 mm (i.e. a decline of 40 %), and there is a shift in the seasonal P distribution, with higher P during the growing season. According to the Budyko framework, the change in P and the higher ET0 in SE lead to a shift from an energy-limited (RO) to a water-limited regime (SE), with values for AI larger than one (Fig. 2). The latter one is important, as the soil ecosystems at the two sites are characterised by different soil water dynamics at the beginning of the growing season. Daily P values in C0CL2, on average, were 1.57 and 0.76 mm fewer per day during the non-growing and growing season compared to C0CL0 (mean error; Fig. 1c and d). The annual average NRW was 20 % larger for C0CL0 (55.7 mm) than for C0CL2 (44.4 mm; Table S4). However, the amount of water from NRW relative to P was higher for C0CL2 (7.2 %) than for C0CL0 (5.5 %; Table S5). The seasonal distribution of NRW at RO and SE shows, similar to GS, larger values of NRW during non-growing seasons. The mean daily deviation of NRW between RO and SE was similar during the non-growing and growing season (−0.03 mm). Larger differences were found during winter, when snow covered the grassland at RO (i.e. no measurements of P and NRW were possible), whereas in SE NRW inputs could be determined (Fig. 1g).
The lowest annual P values of the observation period 2015–2018 were observed in the drought year 2018, with 872 mm at RO and 485 mm at SE (Table S3). Similarly, relatively small NRW values were also observed at both sites in 2018 (45 mm – RO; 38 mm – SE). Despite the lower NRW inputs in 2018, the amount of water from NRW relative to P was 7.9 % at SE, which is the highest value during the observation period. Again, this demonstrates the importance of NRW inputs in dry years when the rainfall is low.
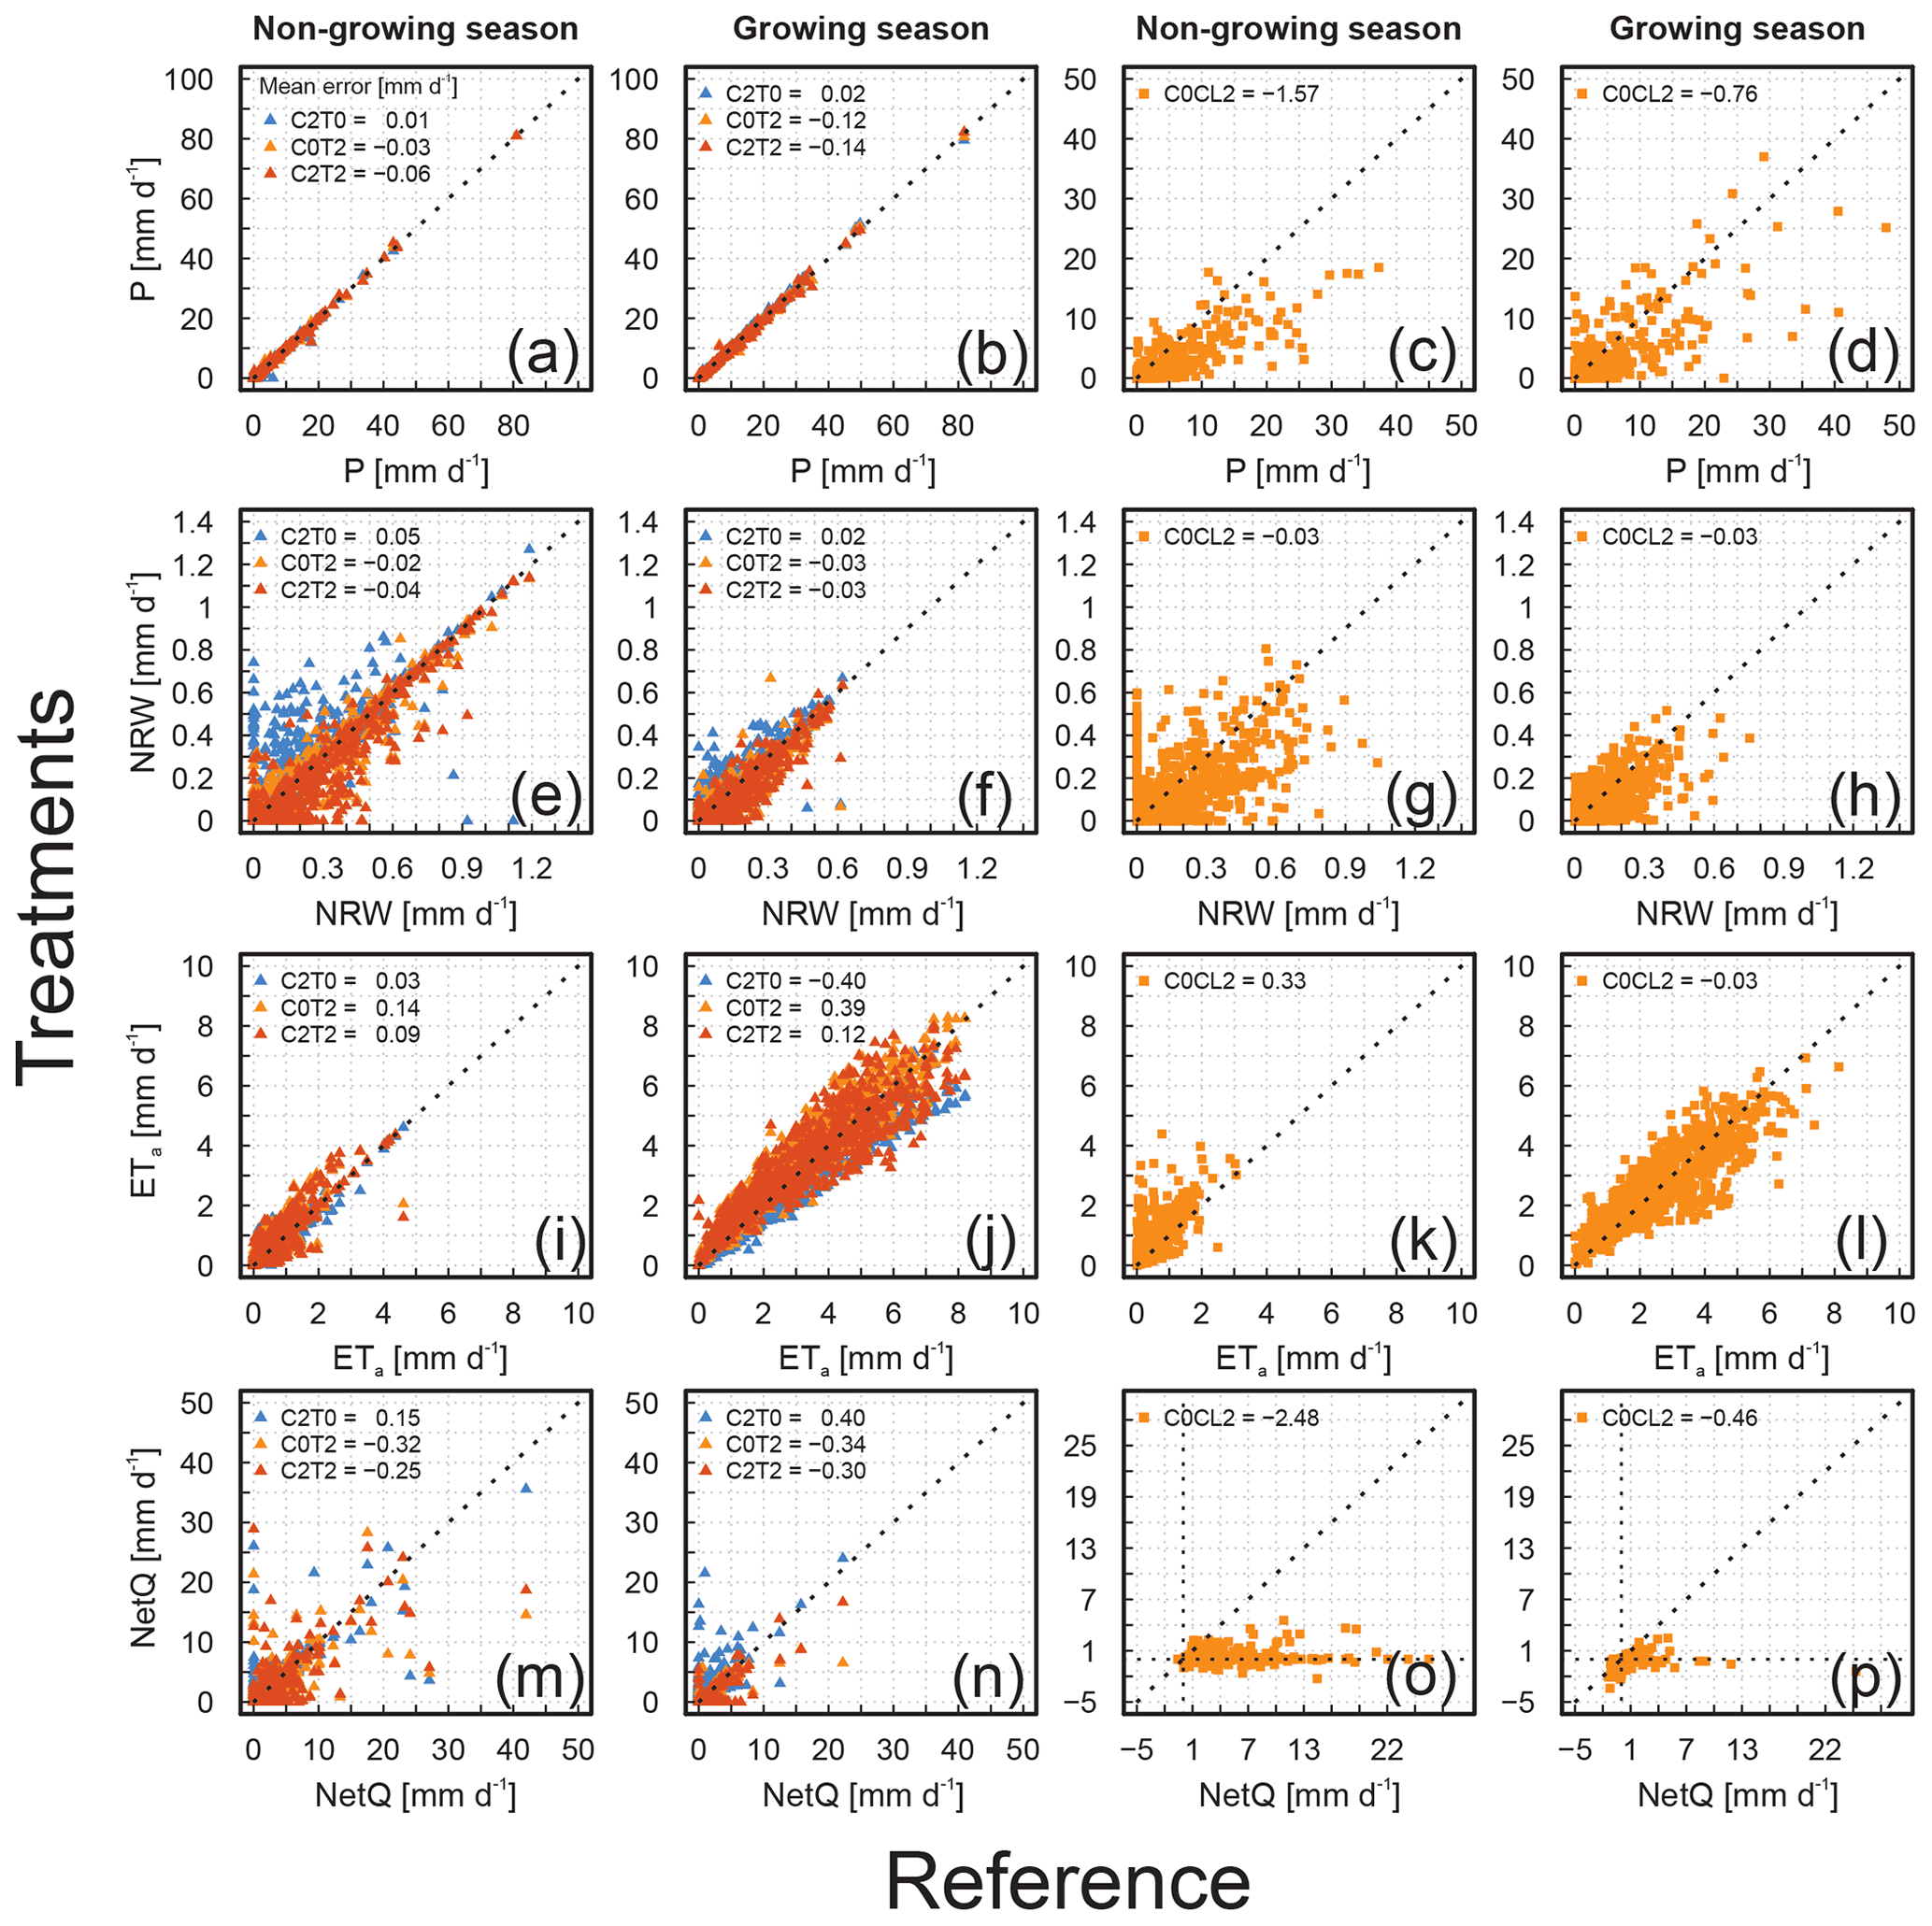
Figure 1Comparison of all soil water balance components for all treatments or sites of the two approaches (Lysi-T-FACE – C2T0, C0T2, and C2T2; TERENO-SOILCan – C0CL2) to the ambient reference of the two approaches (Lysi-T-FACE – C0T0; TERENO-SOILCan – C0CL0). Panels (a)–(d) show the daily precipitation (P) of the treatments against the reference observation for the non-growing and growing season (2015 to 2018) for the manipulative (a, b) and the observational experiment (c, d). The same is shown for the non-rainfall water (NRW) in panels (e)–(h), for the actual evapotranspiration (ETa) in (i)–(l), and for the net water flux across the lysimeter bottom (NetQ) in (m)–(p). Average daily values were obtained from replicate lysimeter of the same treatment or site. The mean error (millimetres per day; hereafter mm d−1) was calculated to express the average deviation between the daily values obtained under changed conditions and those of the ambient reference.
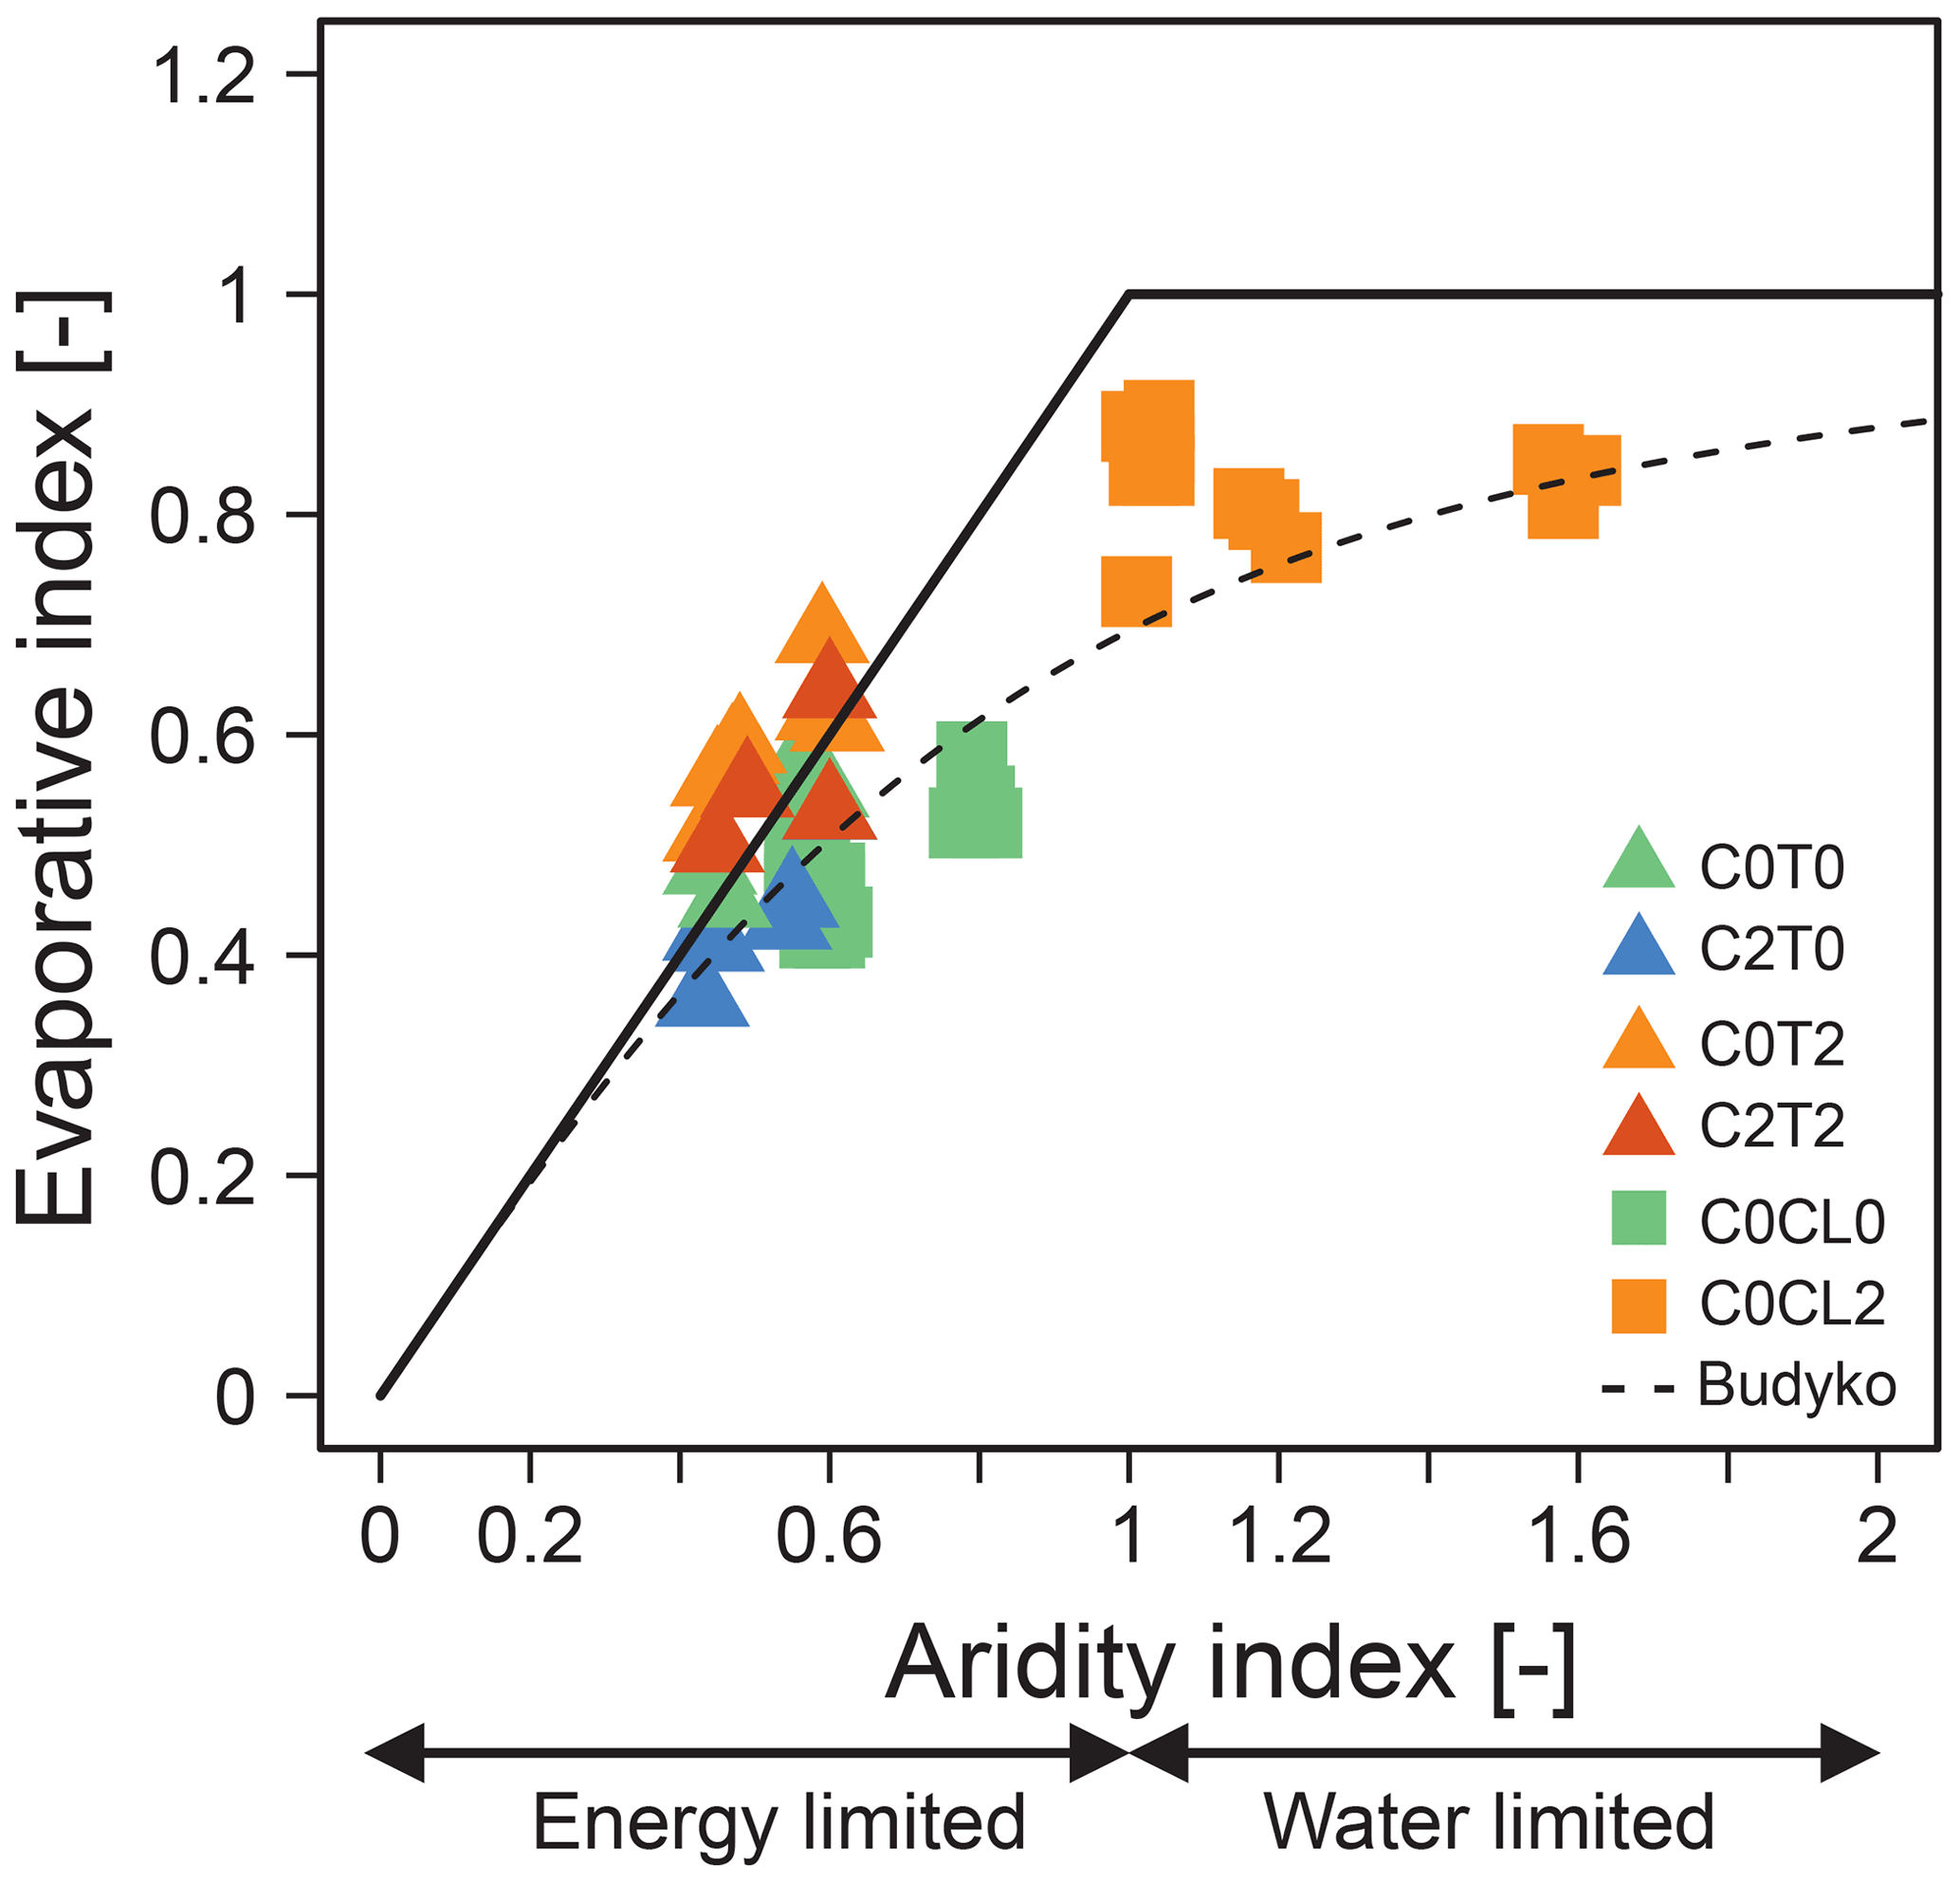
Figure 2Budyko plots comparing the two approaches (Lysi-T-FACE – C2T0, C0T2, and C2T2; TERENO-SOILCan – C0CL2) to the ambient reference of the two approaches (Lysi-T-FACE – C0T0; TERENO-SOILCan – C0CL0) during 2015–2018. The aridity index and evaporative index are the ratios of the cumulated yearly grass reference evapotranspiration and actual evapotranspiration to the incoming atmospheric water (i.e. precipitation and non-rainfall water). The dotted curve shows the Budyko curve (ω=2.6).
3.1.2 Evapotranspiration
The average annual ETa for the manipulative approach at GS ranged between 657 and 831 mm among the different treatments and reference during the observation period (Table 2; more details in Table S6). The average difference between the treatments in the non-growing season was relatively small (max. 24 mm per period) in comparison to the growing season (max. 155 mm per period; Tables 2 and S6). During time periods with an active control on CO2 and surface temperature, treatments largely differed from the reference observations. Compared to the reference, the average daily ETa of the treatment with CO2 enrichment (C2T0) decreased by 0.40 mm, whereas that of the treatment with an elevated surface temperature (C0T2) increased by 0.39 mm (Fig. 1j). Our results for the combined treatment C2T2, in general (despite 2018), showed larger daily ETa values in comparison to the reference, but the average deviation was only 0.12 mm. In the growing season of the exceptionally dry and warm year of 2018, the ETa response to treatment changed as compared to the previous years. For C2T0, the growing season ETa in 2018 showed an increase by 42 mm compared to average values from previous years (2015 to 2017). Despite the observed increase relative to previous years, C2T0 still showed the lowest ETa rates of the treatments in 2018. For C0T2 and C2T2, ETa in 2018 was lower than the average of the previous years (46 and 80 mm, respectively). This decline suggests that ETa at the heated plots was temporarily limited by the low soil water availability resulting from a decrease in soil water storage in 2018. In contrast, ETa of the reference C0T0 did not differ in the growing season 2018 from the average ETa values of the previous years (2015 to 2017). This demonstrates that the ETa at the reference plot was not limited by water (Fig. 2). The annual average ETa of the observational approach was lower at RO (639 mm) than at SE (685 mm; Table 2). The length of the growing season increased on average by 36 d over the observation period due to the translocation from RO (C0CL0) to SE (C0CL2). Compared with the reference C0CL0, the average daily ETa of C0CL2 was lower by 0.03 mm in the growing season and higher by 0.33 mm in the non-growing season (Fig. 1k and l). Interestingly, during the 2018 European drought-affected growing season, average daily ETa responded with an increase of 4 % for C0CL0, while it decreased for C0CL2 by 18 % in 2018 compared to the previous years.
3.1.3 Seepage and soil water storage
The water flux across the lysimeter bottom (NetQ) of C2T0 was larger than that of the reference C0T0 at GS (Figs. 1m and n). As expected, this difference is most pronounced during the growing seasons when the physiological effect of CO2 enrichment reduces ETa (Table S7). Elevated CO2 (i.e. C2T0) thus appears to affect the observed seasonality of seepage through the reduction in ETa in the growing season. In contrast, the seepage of the treatments C0T2 and C2T2 was lower than that of C0T0, both in the growing and the non-growing periods (see values in Table S7 and the negative mean errors in Fig. 1m and n). Thus, water savings due to elevated CO2 resulted in a significant increase in seepage (23 % compared to the reference), whereas higher temperatures reduced seepage (27 % for C0T2 and 23 % for C2T2, compared to the reference). Likewise, different effects of the treatments are apparent in the changes in the soil water storage (ΔS) during the growing season (Table S8). C0T2 showed a depletion of the soil water storage in the growing seasons of all years, whereas the other treatments tend to have positive values of ΔS in the growing season. An exception is the drought year 2018, where an increase in soil water storage during the growing season was observed only at C2T0. Also, the combined treatment C2T2 shows less depletion of the soil water storage than the reference in the growing season of 2018. This suggests that the aforementioned water savings due to CO2 enrichment are particularly effective under drought conditions.
Impacts of the European drought in 2018 were also clearly visible in the measured NetQ during the growing season, which were nearly zero at all treatments (Table S7). Compared to the averages of the previous years, the seepage in the growing season of 2018 decreased by between 95 % and 98 %. This suggests that the seepage and, thus, groundwater recharge at such alpine grassland sites were considerably affected by the 2018 drought. Interestingly, the water saving effect of CO2, which was found to mitigate the depletion of the soil water storage under drought (Table S8), was not evident in the seepage rates observed in 2018 (Table S7).
The NetQ from the observational approach showed extreme differences between the seasonal values over the observation period. The largest difference in NetQ between C0CL0 and C0CL2 were observed especially during the non-growing season (mean error of −2.48 mm; Fig. 1o). In comparison to the reference C0CL0, NetQ of C0CL2 changed, on average, by −106 %. This demonstrates that for the water-limited site at SE the rewetting in the non-growing season is not sufficient to contribute to NetQ, and hence, water from P and NRW is mainly used to refill the depleted soil water storage. This is confirmed by the increase in soil water storage during the non-growing season, which, on average, is much larger at SE (116 mm) compared to RO (30 mm). Values of NetQ during the growing season were always negative for C0CL2, which indicates an upward-directed flow from deeper soil or groundwater (Table S7). However, the upward-directed water fluxes did not compensate for losses of water by ETa, and thus, on average, resulted in a clear depletion of the soil water storage at RO (−52 mm) and SE (−113 mm; Table S8) in the growing season.
During the drought in 2018, RO showed, similar to GS, a significant decrease in NetQ. However, the impact on NetQ at SE (−20 mm) was low compared to observations from the previous years (−31 mm). This was mainly related to large amounts of P during the autumn and winter months of 2017, which caused a much faster refilling of the soil water storage (Table S8) in comparison to other years and, consequently, a higher seepage that compensated the larger upward directed water flux at the site during the drought in 2018.
3.2 Hydroclimatological and ecohydrological indicators
3.2.1 Aboveground biomass and water use efficiency
At GS, annual AGB was largest in 2016, with an average value of 845.2 g m−2. The lowest AGB production was obtained in 2015, with an average amount of 709.7 g m−2. For the years 2017 and 2018, average AGB values of 821.1 and 795.2 g m−2 were obtained (see Table S9 for more details). The year-by-year fluctuations of AGB are mainly induced by varying weather conditions at GS, as the management (cutting and fertiliser) was identical during the different growing seasons (Fig. 3a). The reference C0T0 showed on average the largest AGB (1092.5 g m−2). Among the treatments, C0T2 had, on average, the largest annual AGB (743.3 g m−2) and C2T2 (635.0 g m−2) had the lowest. This reveals that the combined treatment with elevated temperature and elevated CO2 concentration (C2T2) resulted in reduced grassland productivity compared to the reference C0T0. The average annual AGB of C2T0 (700.5 g m−2) was also smaller than that of the reference C0T0. In 2018, C2T0 yielded slightly higher values of AGB than C0T2, but, for the other years, the AGB of C2T0 was lower than that of C0T2 (Fig. 3a).
The negative effect of elevated temperature and elevated CO2 concentration on the AGB was also seen for WUE (Fig. 3c). The WUE of C2T2 (1.0 g m−3) was, on average, smaller than that of C0T2, C2T0, and C0T0 (1.1, 1.3, and 1.8 g m−3). For all years, the ambient WUE was much larger than the respective WUE of the treatments. This reveals a negative effect of elevated CO2 concentration and elevated temperature on WUE for this grassland ecosystem. Among the treatments, the highest WUE was obtained for C2T0, which corresponds to the aforementioned water saving effect of elevated CO2 (see Sect. 3.1.2 and 3.1.3).
For the observational approach, on average, a higher grassland productivity was obtained under wetter and colder conditions (794 g m−2 C0CL0; 721 g m−2 C0CL2). The year 2015 was an exception, where AGB was higher at the warmer and drier site (Fig. 3b). During this year, the larger AGB mainly resulted from the first cut in the season, where the grassland ecosystems of C0CL2 and C0CL0 achieved, on average, values of 556 and 316 g m−2 (Table S9). For the other cuts, AGB was, on average, much larger under wetter and colder conditions (C0CL0), despite the longer growing season at the warmer and drier site of SE (C0CL2). This was especially visible for the last cuts of the season in 2016 and 2018, when AGB was lower for C0CL2 than C0CL0. Heatwaves in 2016 and 2018 and the decrease in the growing season P by 36 % in 2018, in comparison to the average values of the previous years, drastically reduced the AGB of C0CL2.
The WUE at the wetter and colder climate was, on average, 1.53 g m−3 and, thus, clearly higher than under warm and dry conditions (1.29 g m−3; Fig. 3d). These results show that decreasing P and increasing ET0 led to a decrease in WUE by 22 %. Average differences of WUE between both sites of the second and third cut showed values up to 0.63 g m−3. For these two cuts, the differences between C0CL0 and C0CL2 were largest, whereas WUE of the first cut was similar at the two sites (data not shown). This suggests that the difference in soil water availability between C0CL0 and C0CL2 increases within the growing season (large depletion of soil water storage at C0CL2), which affects plant growth. The exceptional drought in 2018 largely affected the WUE, as the value for last cut in 2018 was vanishingly small at C0CL2 (0.16 g m−3) and lower by 65 % in comparison to results from C0CL0.

Figure 3Dry aboveground biomass (AGB) during the observational periods of 2015–2018 for the manipulative approach of Lysi-T-FACE (C2T0, C0T0, C0T2, and C2T2) (a) and observational approach of TERENO-SOILCan (Rollesbroich – C0CL0; Selhausen – C0CL2) (b), as well as the crop water use efficiency (WUE), for the manipulative (c) and observational approach (d).
3.2.2 Precipitation use efficiency and seepage to precipitation ratio
For the manipulative approach, PUE ranged from 0.5 to 1.1 g m−2 mm−1 across the reference and the different treatments (Fig. 4a). The highest value was obtained under ambient conditions (C0T0) in the drought year 2018. All treatments led to a decline of PUE in comparison to C0T0 (1.2 g m−2 mm−1) and showed the same average PUE (0.61 g m−2 mm−1). These observations suggest that all treatments had a strong effect on the PUE of the grassland ecosystem. In the drought year 2018, however, the PUE of C2T0 was much larger than that of C0T2 and C2T2. This might be a result of a CO2 fertilisation effect yielding higher AGB at C2T0 compared to the other treatments under the drought conditions of 2018.
Results from the observational approach showed different patterns under warmer and drier climate conditions. The PUE at C0CL2 was, on average, 45 % higher than at C0CL0. Nevertheless, Fig. 4b also shows a clear decline of PUE at C0CL2 from 2015 (1.37 g m−2 mm−1) to 2018 (0.8 g m−2 mm−1), which is accompanied by a decrease in P and NRW by 31 % and 22 %, respectively.
The QP ratio obtained for both approaches (Fig. 4c and d) shows declines if the grassland ecosystem was exposed to warming (i.e. C0T2 and C0CL2). Elevated CO2 increased the QP ratio; on average, the values were 21 % higher than for the reference C0T0. However, the most drastic changes in the QP ratio were visible in the observational approach, where QP changed, on average, by 81 % due to the transfer to a warmer and drier climate (Fig. 4d). The increase in the QP ratio observed for C0CL2 in 2018 relative to the previous years is related to the large amounts of P during the autumn and winter months of 2017 (see also Sect. 3.1.3).
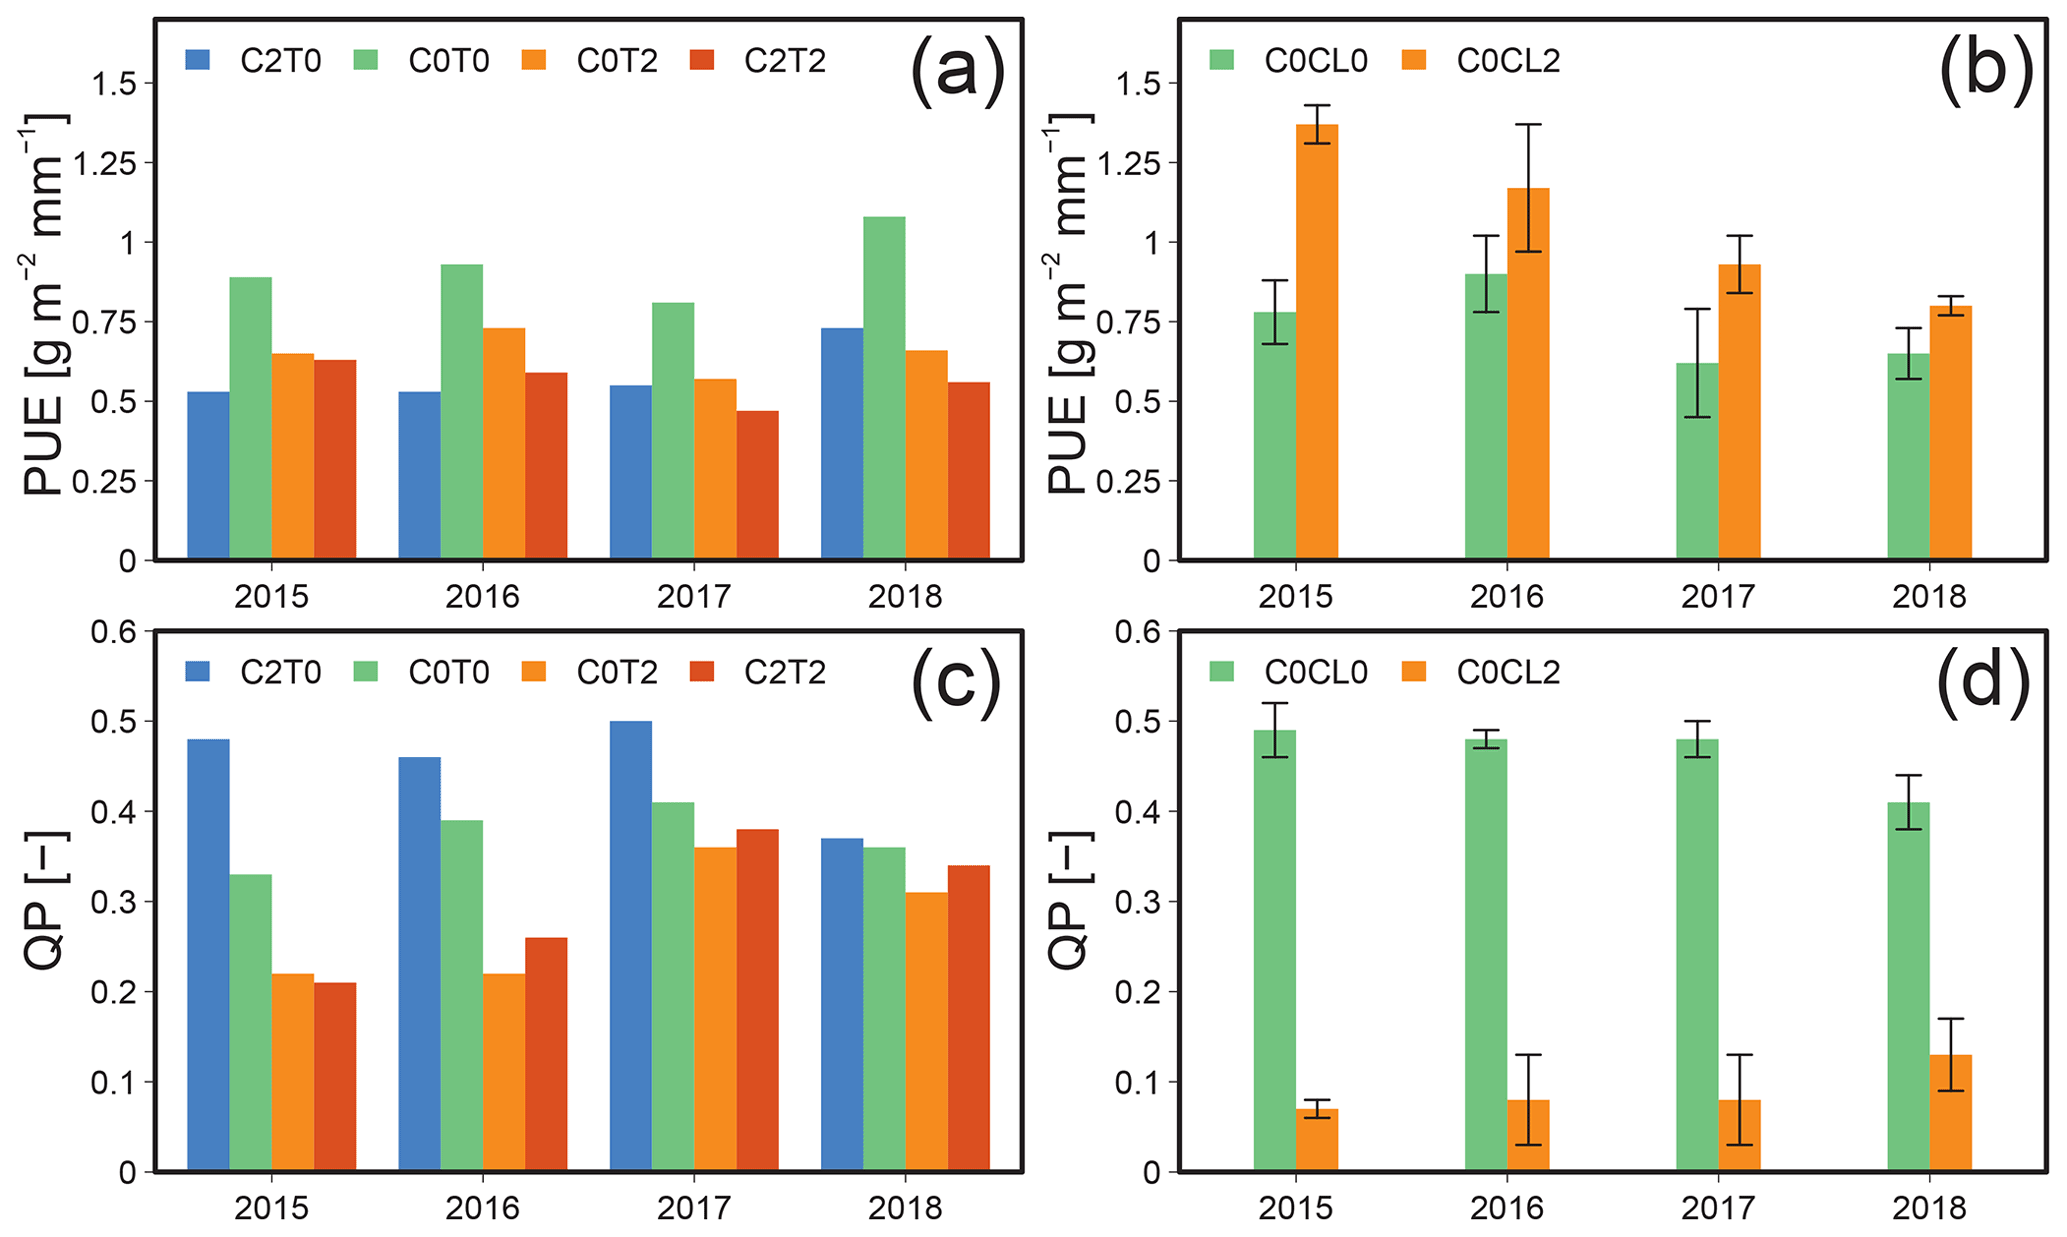
Figure 4Precipitation use efficiency (PUE) during the observational periods of 2015–2018 for the manipulative approach of Lysi-T-FACE (C2T0, C0T0, C0T2, and C2T2) (a) and observational approach of TERENO-SOILCan (Rollesbroich – C0CL0; Selhausen – C0CL2) (b), as well as the seepage to precipitation and the NRW ratio QP (–), for the manipulative (c) and observational approach (d).
3.2.3 Relationship between hydroclimatological and ecohydrological indicators
The ecosystem productivity (i.e. AGB), in general, increased with GSP and growing season NRW (Fig. 5a). Thus, the response of ecosystem productivity to P and NRW follows a similar pattern in the manipulative and the observational approach. However, only for the observational approach were the relationships found to be significant (p<0.05). ETa in the growing season also increased with increasing GSP and growing season NRW for both approaches, but this relationship was statistically significant only for the observational approach, except for C0T2 (Fig. 5b). ETa showed a particularly strong correlation with GSP and the growing season NRW for C0CL2 from the observational approach (adjusted R2 of 0.9). The relationship between ETa and ET0 during the growing season was significant and found to be negative for the observational approach but positive for the manipulative approach (Fig. 5c). The relationship between the AGB and AI of the observational approach indicates a decrease in ecosystem productivity, with increasing aridity under water- and energy-limited conditions. Yet, when the water limitation diminishes according to the Budyko framework (AI < 1), the correlation between AGB and AI weakens (i.e. C0CL0) or disappears (i.e. GS; see Fig. 5d). Thus, for the manipulative approach, no clear changes in AGB with changing AI were visible because of the relatively wet conditions (low AI). The relationships between WUE and AI are similar to those shown before for AGB and AI (Fig. 5e). The relationships between the PUE and AI (Fig. 5f) in the observational approach show that the PUE of the grassland ecosystem adapts to the increasing water limitation. No relationships from the manipulative climate change experiment were significant, as the interannual variability in climate conditions (wet and dry) was relatively well buffered by the soil water storage, and the hydrological status of the alpine site generally is energy limited rather than water limited. Nevertheless, the dependencies of AGB, WUE, and PUE on AI found in the manipulative approach appear to be similar to those at the energy-limited site (C0CL0) of the observational approach.
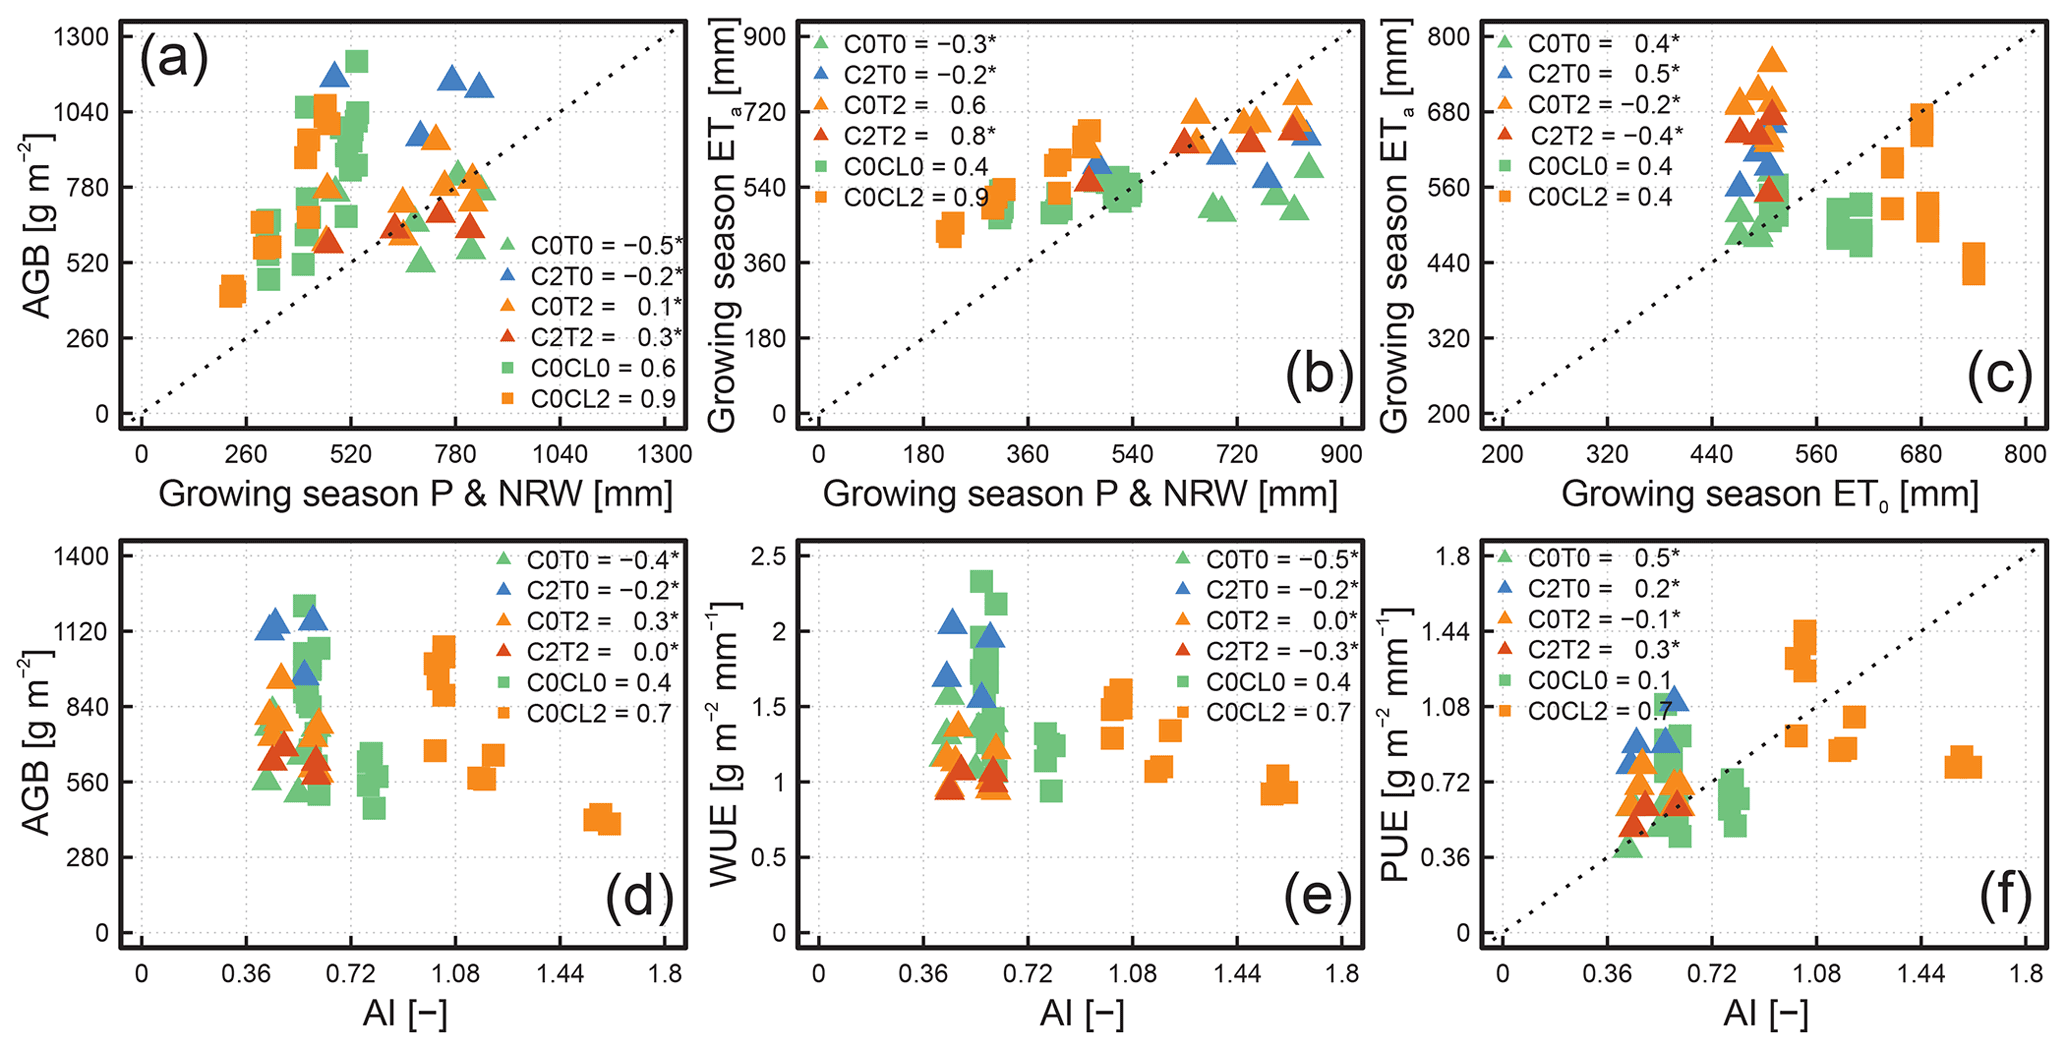
Figure 5Scatterplots of aboveground biomass (AGB) to growing season precipitation (P) and non-rainfall water (NRW; a), growing season evapotranspiration (ETa) to growing season P and NRW (b), growing season ETa to growing season grass-reference evapotranspiration (ET0; c), AGB to aridity index (AI; d), water use efficiency (WUE) to AI (e), and precipitation use efficiency (PUE) to AI (f). In each subplot, variables are shown for all treatments from the manipulative (Lysi-T-FACE C2T0, C0T0, C0T2, and C2T2) and observational climate change approaches (TERENO-SOILCan; Rollesbroich – C0CL0; Selhausen – C0CL2) for the period 2015 to 2018. The adjusted R2 values for each soil ecosystem are given in the legend, and the asterisk means that the linear relationship was not statistically significant (p value >0.05).
4.1 Response of water fluxes to climatic changes
The quantitative contribution of NRW to the soil water balance is of ecological relevance (e.g. by foliar water uptake; Dawson and Goldsmith, 2018) and can become important for crop production, especially under water-limiting conditions. This is demonstrated by the impact of the extreme weather conditions in 2018, which were associated with a decrease in the northern European crop production (i.e. drought and heatwave; Beillouin et al., 2020). The results from both experimental approaches show that the amount of NRW formed in the non-growing season is higher than that of the growing season. This agrees well with previous findings on the seasonality of dew formation across different climate zones (Zhang et al., 2019; Groh et al., 2019; Atashi et al., 2019). The results from the treatments with elevated temperature demonstrate an impact of warming on the incoming atmospheric water, i.e. NRW and P. Under these treatments, the amount of water reaching the soil ecosystem in the growing season decreases by up to 4 % for P and by up to 24 % for NRW. The observed decrease in NRW agrees well with Feng et al. (2021), who showed that heating with an infrared heater system reduced dew formation for an alpine grassland ecosystem of the Tibetan Plateau by up to 91 %. Surprisingly, not only warming but also elevated CO2 was found to alter the amount of NRW. One possible reason for the observed increase in NRW might be related to the plants themselves. It is frequently assumed that an increase in atmospheric CO2 concentration leads to a decrease in stomatal conductivity, which increases leaf temperature (less evaporative cooling; Kirschbaum and McMillan, 2018), but simulation at the leaf level showed that leaf temperature is far more affected by leaf size or wind speed than by the indirect effects of elevated atmospheric CO2 (Konrad et al., 2021). However, the effects might be more complex; a recent investigation by Habermann et al. (2019) demonstrated a clear impact of elevated atmospheric CO2 on the leaf anatomy and physiology of the C4 forage species Panicum maximum. Thus, the anatomical and physiological changes in the plant leaves might also be a possible explanation of higher dew amounts because surface properties (i.e. radiative and wetting) are of crucial importance for the formation of dew and dew yield (Trosseille et al., 2021).
As mentioned above, both experimental approaches show that the formation of NRW declines if temperature increases. This agrees well with Tomaszkiewicz et al. (2016), who predicted a decline in dew formation for forecasted trends of increasing temperature and relative humidity under future climatic scenarios for the Mediterranean region. As opposed to the changes in the absolute values of NRW, the percentage of NRW relative to P was found to be lower only under the elevated temperature of the manipulative approach, whereas this percentage increased under the warmer conditions in the observational approach. This is related to an important difference in the two approaches, namely the controlled change of individual factors in the manipulative experiment as opposed to the concurrent change of multiple drivers in the observational approach. More specifically, in the observational approach, the site with elevated temperature receives less P than the higher elevated, colder site. Thus, the relative contribution of NRW appears to be more affected by the changes in P than by the effect of warming.
A direct comparison of effects resulting from changes in P in the two experiments is difficult because only the observational approach explicitly includes a change in P within its design. Including a change in P, especially during the growing season, is important for climate change studies as the interannual variability in the ecosystem productivity (i.e. AGB), at least under water-limited conditions, is strongly correlated (Knapp et al., 2018). Hence, climate change experiments that contain information on key interacting variables such as P are indispensable to provide observations that enable a more mechanistic understanding of the ecosystem response (Hanson and Walker, 2020). The manipulative experiment shows a relatively low interannual variability in AGB (Fig. 3a), although the observation period includes the drought of the year 2018. According to the Budyko framework, the hydrological status at the experimental site was energy limited even in 2018 (Fig. 2). Thus, the interannual changes in P were not sufficiently strong to cause a shift to water-limited conditions. Assessing impacts of water stress at the site of the manipulative experiment thus requires including P as an additional treatment in the experimental design. Despite no active control on P within the manipulative approach, treatments with an increased surface temperature affected not only the formation of NRW but, to some extent, also the amount of P. Apparently, the effect of local warming on the relative humidity of the air within and above the canopy plays a role here. The local decrease in relative humidity might enable some ETa during P events, thus violating the assumption of zero ETa during rainfall, underlying the analysis of the lysimeter data. Such local effects on NRW and P in manipulative climate change experiments need further investigation, as they may lead to an under- or overestimation of ecosystem responses.
For ETa, treatments at GS with elevated CO2 and an increased temperature resulted in contrasting impacts due to their opposite individual effects on transpiration (Sorokin et al., 2017). Plants respond to elevated atmospheric CO2 concentrations with a reduced stomatal opening and an increase in photosynthesis (Kruijt et al., 2008; Ainsworth and Rogers, 2007). This is expected to lead to lower ETa and higher AGB and, thus, an enhanced plant WUE (Hovenden et al., 2017) compared to other treatments. Our results confirm the water saving effect of CO2, whereas an effect on AGB was not observed.
In contrast to elevated CO2, elevated temperatures lead to an increase in the vapour pressure deficit and, thus, enhanced evapotranspiration (Kirschbaum and McMillan, 2018). Kirschbaum and McMillan (2018) suggested that, for a range of locations from tropical to boreal forest, the transpiration-depressing effect of elevated CO2 was stronger than the opposite effect of elevated temperatures. Lenka et al. (2020) showed that treatments with an elevated CO2 concentration and a combined increase in CO2 and temperature reduced the stomatal conductance, lowered the ETa, and, consequently, improved the WUE of soybeans. In our experiments, the ETa of C2T2 was higher compared to the reference but clearly below values of ETa from C0T2. This suggests that the effect of elevated CO2 in reducing ETa only partially compensated for the effect of elevated temperature in the combined C2T2 treatment.
Kirschbaum (2004) suggested that the effect of CO2 on ETa is more pronounced for C3 plants under water-limited conditions and at higher temperatures (Kirschbaum, 2004) because it enhances the WUE of the plant (Kirschbaum and McMillan, 2018). However, its effect under non-water-limited but temperature-limited growth conditions on plants is still unclear. The low ETa of the treatment C2T0 during the dry year of 2018 indicates that elevated CO2 can mitigate the effects of summer droughts on alpine grasslands, which agrees well with Inauen et al. (2013). They showed that elevated CO2 reduced ETa by up to 7 % across a range of different grassland types in the central Swiss Alps.
Interestingly, the ETa response to the drought conditions in 2018 differed between the manipulative and observational approach. In the manipulative experiment, ETa was found to be mainly energy limited (Fig. 2) and, thus, increased under conditions with elevated temperatures (Fig. 1j). In contrast, the observational approach showed a clear decrease in ETa under conditions with elevated temperatures, as the soil ecosystem was shifted from an energy-limited to a water-limited regime (Fig. 2) due to the transfer from RO to SE (Rahmati et al., 2020). A similar reduction in ETa across different ecosystem types was observed for sites in Europe affected by the drought in 2018 (i.e. forests, grasslands, croplands, and peatlands; Graf et al., 2020). Our results revealed that the limitation of the water supply at site SE increased during the drought, and the heatwave intensified the water stress (AI in 2018 ≥1.6) and, thus, significantly reduced grassland ETa.
The above discussion shows that the manipulative experiment mainly provides insights into effects of climatic changes under energy-limited conditions, whereas the observational approach enables investigations under both energy-limited and water-limited conditions. Despite this advantage in the design of the observational approach, the influence of elevated atmospheric CO2 on the ETa response of the soil ecosystem is missing, which is an important aspect for assessment of future climate change impacts.
Another question was how climatic changes affected the drainage behaviour (NetQ) and water storage of the soil ecosystems. In the manipulative approach, elevated CO2 resulted in a significant increase in NetQ, whereas elevated temperatures (C0T2 and C2T2) significantly reduced NetQ. Ultimately, this is a result of the above-described changes in grassland ETa, which agrees well with the findings of Mastrotheodoros et al. (2020) for the European Alps. A previous investigation for a grassland at the Swiss Alps showed only a slight increase in the seepage under elevated atmospheric CO2 (Inauen et al., 2013). These changes in seasonal seepage potentially affect the catchment runoff, which is important for hydropower productivity and profitability in Alpine regions (Anghileri et al., 2018).
The observational approach also showed the tendency for NetQ to decrease under elevated temperature but in a much more pronounced way and for different reasons. At the water-limited site of SE, the non-growing season P is mainly used to replenish the large decrease in ΔS observed during the growing season. This partly explains the low impact of the dry year of 2018 on NetQ at the water-limited site of SE. However, for the energy-limited ecosystem, a strong decline in growing season NetQ (159 %) was observed in 2018 compared to the average for 2015 to 2017, which, eventually, is expected to affect streamflow. Although streamflows are buffered by groundwater, reduced recharge will deplete regional water storage reserves, as shown by Fennell et al. (2020) for a catchment in 2018 in Scotland. Long-lasting droughts can affect the soil water storage even in the following year if the winter P is not sufficient to fully replenish the depleted soil water storage (Riedel and Weber, 2020). The decrease in NetQ underlines the fact that the physical and biological response to changing climatic conditions, as well as the hydrological status of the ecosystem, controls water fluxes. Warming of the land surface, reduced P, increased atmospheric concentrations of CO2, and a higher atmospheric demand for evaporation reduce seepage and, thus, groundwater replenishment.
4.2 Climate change impact on biomass production and ecohydrological indicators
The partially sharp decline in AGB production under changing climatic conditions observed in both experimental approaches can be attributed to very distinct reasons. The AGB decrease for the manipulative approach might be related to an increase in heat stress due to the treatments, which is either directly induced by an elevated canopy temperature or, in case of elevated CO2, indirectly because elevated CO2 probably reduces evaporative cooling of plants (Obermeier et al., 2018). The results are in contrast to the widely expected positive effects of increasing CO2 on productivity of agricultural land (Amthor, 2001; Degener, 2015; Zheng et al., 2018). The positive effect of CO2 fertilisation on AGB was only visible for the treatment C2T0 under the conditions with less P and higher temperatures in the year 2018. This agrees well with previous studies (see, e.g., Morgan et al., 2004; Ainsworth and Rogers, 2007). In addition, the vegetation composition might have changed between the treatments and reference, as drought- and heat-induced shifts at the community and plant functional group level impact the AGB production of alpine grasslands (Tello-García et al., 2020).
The decline of AGB under a drier and warmer climate of C0CL2 in the observational approach is closely related to the hydrological status of the soil ecosystem. The combination of lower incoming atmospheric water (i.e. P and NRW) coupled with higher evaporative demand and a longer growing season results in greater pressure on the soil water resources under water-limited rather than under energy-limited conditions. The AGB for C0CL2 was reduced during the heatwaves in 2016 and 2018. In the summer of 2018, the soil ecosystem was exposed to an increasing drought intensity, and the plants turned slightly dry and brown and were visibly affected by drought stress (Rahmati et al., 2020).
In 2015, the AGB of C0CL2 was higher than that of C0CL0, which differs from the other years. This might be related to a moderate drought in 2015 (Ionita et al., 2017) combined with higher temperatures and solar radiation. For the first and most important cut in the season, C0CL0 achieved a below-average biomass, which can be explained by the exceptionally dry conditions in May in this region (i.e. second-driest month since 1950; Ionita et al., 2017). The soil ecosystem C0CL2 in SE, however, was less affected by this drought, as biomass production was able to develop much earlier in this season. The year 2015 had the longest growing season (250 d) in SE, and the warm conditions before the drought in May, and a sufficient water availability after the winter, led to similar AGB as in 2016. However, here a change in plant community composition might also be the reason for the altered AGB production. Observations on the species abundance from the observational approach underlines this explanation, as the plant community of the transferred soil ecosystem changed under water-limited conditions by reducing the abundance of herbs at the cost of grass species (Jarvis et al., 2021). Ecohydrological simulation of the grassland at RO and SE by Jarvis et al. (2021) for the years 2013 to 2018 suggests that the plant community adapted to the changing climate conditions in SE by developing a deeper root system, with a greater proportion of assimilates being distributed below ground, while stomatal conductance also increased significantly. These results show the importance of the interplay between environmental conditions (i.e. temperature) and the seasonal development of the plants (e.g. duration of the vegetation period), which cannot be taken into account in the treatments of the manipulative approach and thus represents a further limitation.
As expected, the different treatments also affected the WUE of the alpine grassland. Among the different treatments, C2T0 achieved the highest WUE. It was also shown previously for a range of different agricultural ecosystems (Nendel et al., 2009; Roy et al., 2016) that the WUE increases, as plants increase their assimilation rates and simultaneously reduce their water loss by decreasing stomatal conductance under elevated CO2 (Lammertsma et al., 2011). A higher temperature, however, seems to increase the non-productive water losses, as evident from treatment C0T2 or C2T2, which led to less efficient crop water use as compared to the unheated plots (Fig. 3c). The small difference between the WUE of C0T2 and C2T2 suggests that the higher temperatures dominated the response of the grassland ecosystem under conditions with elevated temperature and atmospheric CO2 concentration (no compensation). The largest difference in WUE between C2T2 and C0T0 was seen in 2016 and 2018. This might be related to increasing heat stress under this treatment (Obermeier et al., 2018).
Similar to the manipulative approach, the observational approach showed lower WUE under elevated temperature. De Boeck et al. (2006) also showed that the warming of several grasslands in Belgium led to a decrease in biomass production and WUE. But the same study also implied that the WUE of individual species was affected differently by warming, which might have led to compositional changes in the ecosystem. One reason for the lower WUE under elevated temperature and/or water-limited conditions might be the divergent biomass partitioning to above and below the ground in grasslands. Experimental studies found that frequent soil drying and droughts enhance root growth and the production of belowground biomass production (e.g. Hofer et al., 2017; Nosalewicz et al., 2018; Padilla et al., 2013). At least for the observational approach, the simulation of crop growth and water fluxes with an ecohydrological model reveals a deeper root growth (i.e. more belowground biomass) under drier climatic conditions at SE (Jarvis et al., 2021).
Comparing the results of WUE and AGB between both approaches suggests that the impact of the drought in 2018 on the WUE and AGB under ambient conditions is much larger in the lowlands than at higher altitudes. Both approaches showed a decline in AGB and WUE under dry conditions. In addition to the possible plant compositional changes, an elevated heat stress might further explain the different response to AGB and WUE within the manipulative experiment, whereby, for the observational approach, additional water stress due low GSP and a more depleted soil water storage were the main drivers for the changes in AGB and WUE.
The PUE values obtained are within the range (0.05 to 1.81 g m−2 mm−1) reported by Le Houérou et al. (1988) and Jia et al. (2015). The observed effect of the elevated temperature on PUE was different among the approaches. The water-limited soil ecosystem C0CL2 consumed nearly all incoming atmospheric water (i.e., P and NRW) for plant growth and drastically reduced drainage (average QP<0.1), whereas, at the energy-limited ecosystem, water was not limiting plant productivity (QP range from 0.2 to 0.5). Our results further suggest that the formation of NRW should be part of the PUE calculations as, under dry conditions, water from dew or fog might be beneficial for plants and their biomass production. NRW can be either directly taken up by plants (Berry et al., 2019) or indirectly improve their growth conditions (Dawson and Goldsmith, 2018) by, for example, reducing leaf temperature, increasing the albedo, and decreasing the vapour pressure deficit (Gerlein-Safdi et al., 2018).
4.3 Climate change impact on functional relationships
The observational approach demonstrates a clear pattern in the functional relationships. Decreasing incoming atmospheric water during the growing season (P and NRW) significantly reduced the biomass productivity of the grassland, which is consistent with other studies (Zhang et al., 2020; Hossain and Beierkuhnlein, 2018; Bernhardt-Römermann et al., 2011). Our results are in contrast to the findings of Knapp et al. (2018), as the slope of the relationship between AGB and the incoming atmospheric water in the growing season was steeper in the observational compared to the manipulative approach (Fig. 5a). The lower sensitivity of AGB to P and NRW in the manipulative approach suggests that, under non-water-limited conditions, other climatic variables, such as temperature, or additional factors, such as the frequency of disturbance and fertilisation, may be more important for AGB productivity (Bradford et al., 2006). This is consistent with the low interannual variability in the growing season ETa. Even between years with contrasting P and NRW (e.g. average reduction of 23 % from 2017 to 2018), ETa was only slightly reduced (e.g. average reduction of 9 % from 2017 to 2018). Thus, water availability generally is not the limiting factor for ETa at the alpine site, although water stress may occur temporarily under drought. Our results agree well with a previous study by Wieser et al. (2008), which showed that, for 16 sites across different altitudes (580 and 2550 m a.s.l.), grassland ecosystems in the Austrian Alps seem not to suffer from water stress even in drier years.
The functional relationship of AGB, WUE, or PUE with AI also reflects the importance of the hydrological status (i.e. water limitation) on ecosystem productivity and efficiency. These functional relationships were significantly negative under the water-limited conditions of the observational approach, i.e. increasing aridity caused decreases in these indicators. A negative significant relationship also found for the energy-limited soil ecosystem (C0CL0) is mainly related to the exceptionally dry year of 2018. In other years, AGB and WUE varied considerably at the energy-limited sites both in the observational and the manipulative approach, while AI did not change (Fig. 5d–f).
The analysis of the functional relationships between hydroclimatological and ecohydrological indicators reveals that climate change experiments need to include sufficiently extreme conditions to resolve the key question of how changes in the climate regime will affect and alter the ecosystem function in the future (Knapp et al., 2018). Ecosystem responses to changes in P are of crucial importance to assess future changes in the carbon and water cycle (Paschalis et al., 2020). More distinct changes in the P conditions, for example, by using rain shelter in the manipulative approach would, thus, allow us to better capture the response of the ecosystem to future climate change.
A manipulative and an observational lysimeter-based approach was used to assess the climate change impacts on the water balance and productivity of a low mountain and alpine grassland ecosystem. Both approaches showed that elevated temperature increases actual evapotranspiration (ETa) and decreases aboveground biomass (AGB) of grassland ecosystems but has the opposite effect on ETa under drought conditions. This is most evident from the results of the observational approach but is also found in the manipulative experiment during the exceptionally dry periods in 2018. The incoming amount of atmospheric water (i.e. precipitation, P, and non-rainfall water, NRW) and the temporal variability of the events, thus, played a major role in the response of the ecosystem. The responses in terms of the water balance and biomass production were partially buffered by the soil. In the manipulative approach, both elevated temperature and elevated CO2 concentration altered P and NRW, suggesting that effects of the experimental conditions on NRW and P need to be considered to avoid an over- (elevated temperature) or underestimation (elevated CO2) of the effects on ecosystems response, especially for sites where water limitation plays a role. Elevated temperature was the dominant factor for changes in ETa under the non-water-limited conditions of the manipulative experiment. The elevated CO2 concentration only partially compensated for the effect of higher temperatures (increasing ETa) within the combined treatment. However, the water-saving effect of elevated CO2 gained importance under drought conditions.
The imposed changes in the climatic conditions resulted in a modification of the seasonal patterns of seepage and thus the groundwater recharge had an effect in both experimental approaches. The effects of drought on drainage and soil water storage were more pronounced at sites under wetter (i.e. energy limited) soil conditions because there the higher demand for evapotranspiration could be satisfied at the expense of a decreasing soil water storage. Under water-limited conditions, seepage was found to depend strongly on the replenishment of the soil water storage during the non-growing season.
Indicators such as the aridity index and its relationship to ecosystem productivity (AGB) and efficiency (i.e. water and precipitation use efficiency) differed between the two approaches. It was found that distinguishing between energy-limited and water-limited conditions is important to understand the response of the ecosystem to changing climatic conditions. Water-limited ecosystems show distinct relationships between hydrological and ecological indicators. In contrast, ecological indicators may vary considerably in energy-limited systems even if hydrological indicators remain nearly constant.
The responses of soil water fluxes and biomass production strongly depend on the ecosystems' status with respect to energy or water limitation. In the present study, only the observational approach covered both of these conditions, confirming our hypothesis about the different ecosystem response to changing climatic conditions between the approaches. Yet, only the manipulative approach included elevated CO2. It was found that manipulative and observational approaches complement each other but also that it is important to consider both the general state of the ecosystem and the occurrence of extreme conditions in the approaches. Future studies should integrate all factors (precipitation, temperature, and CO2) from the manipulative and the observational approach in order to obtain a complete ecosystem response and better understanding of tipping points in ecosystems, which may help with improving model predictions of how changes in climate regimes will affect the function of ecosystems.
All data for the specific lysimeter and weather station (raw data) can be freely obtained from the TERENO data portal (https://teodoor.icg.kfa-juelich.de/ddp/index.jsp (last access: 9 February 2021; Kunkel et al., 2013), lysimeter station Rollesbroich and Selhausen: RO_Y_01 and SE_Y_02). The processed data to support the findings of this study can be acquired upon request from Jannis Groh. The raw data for the lysimeter and weather station can be obtained upon request from Markus Herndl.
The supplement related to this article is available online at: https://doi.org/10.5194/hess-25-6087-2021-supplement.
MH and TP conceived the experiments at the corresponding sites in Austria and Germany. JG and VF had the idea and designed the study. MH and JG provided the data for the corresponding lysimeter stations. VF and JG performed the data analysis and reviewed and wrote the paper, with equal contributions from all co-authors.
The contact author has declared that neither they nor their co-authors have any competing interests.
Publisher's note: Copernicus Publications remains neutral with regard to jurisdictional claims in published maps and institutional affiliations.
We acknowledge the support of TERENO-SOILCan, which were funded by the Helmholtz Association (HGF) and the Federal Ministry of Education and Research (BMBF). The lysimeter facility and the project “Lysi-T-FACE” (DaFNE; grant no. 100719) at Gumpenstein was funded by the Austrian Federal Ministry of Agriculture, Forestry, Environment and Water Management (BMLFUW). Veronika Forstner has been funded by a DOC Fellowship from the Austrian Academy of Sciences (ÖAW). Matevz Vremec has been funded by the Earth System Sciences research programme of the ÖAW (project ClimGrassHydro). We thank the following colleagues at the corresponding lysimeter stations for their kind support: Martina Schink, Matthias Kandolf, Irene Sölkner (Gumpenstein), Werner Küpper, Ferdinand Engels, Philipp Meulendick, Rainer Harms, and Leander Fürst (Selhausen and Rollesbroich). The authors acknowledge the financial support by the University of Graz.
This research has been supported by the Karl-Franzens-Universität Graz, Zentrale Registratur und Postadministration (grant no. 4500375222).
This paper was edited by Natalie Orlowski and reviewed by three anonymous referees.
Abbott, B. W., Bishop, K., Zarnetske, J. P., Hannah, D. M., Frei, R. J., Minaudo, C., Chapin III, F. S., Krause, S., Conner, L., Ellison, D., Godsey, S. E., Plont, S., Marçais, J., Kolbe, T., Huebner, A., Hampton, T., Gu, S., Buhman, M., Sayedi, S. S., Ursache, O., Chapin, M., Henderson, K. D., and Pinay, G.: A water cycle for the Anthropocene, Hydrol. Process., 33, 3046–3052, https://doi.org/10.1002/hyp.13544, 2019.
Ainsworth, E. A. and Rogers, A.: The response of photosynthesis and stomatal conductance to rising [CO2]: mechanisms and environmental interactions, Plant Cell Environ,, 30, 258–270, https://doi.org/10.1111/j.1365-3040.2007.01641.x, 2007.
Allen, R. G., Pruitt, W. O., Wright, J. L., Howell, T. A., Ventura, F., Snyder, R., Itenfisu, D., Steduto, P., Berengena, J., Yrisarry, J. B., Smith, M., Pereira, L. S., Raes, D., Perrier, A., Alves, I., Walter, I., and Elliott, R.: A recommendation on standardized surface resistance for hourly calculation of reference ETo by the FAO56 Penman-Monteith method, Agric. Water Manage., 81, 1–22, https://doi.org/10.1016/j.agwat.2005.03.007, 2006.
Amthor, J. S.: Effects of atmospheric CO2 concentration on wheat yield: review of results from experiments using various approaches to control CO2 concentration, Field Crops Res., 73, 1–34, https://doi.org/10.1016/S0378-4290(01)00179-4, 2001.
Anghileri, D., Botter, M., Castelletti, A., Weigt, H., and Burlando, P.: A Comparative Assessment of the Impact of Climate Change and Energy Policies on Alpine Hydropower, Water Resour. Res., 54, 9144–9161, https://doi.org/10.1029/2017wr022289, 2018.
Atashi, N., Rahimi, D., Goortani, B. M., Duplissy, J., Vuollekoski, H., Kulmala, M., Vesala, T., and Hussein, T.: Spatial and Temporal Investigation of Dew Potential based on Long-Term Model Simulations in Iran, Water, 11, 2463, https://doi.org/10.3390/w11122463, 2019.
Auer, I., Böhm, R., Jurkovic, A., Lipa, W., Orlik, A., Potzmann, R., Schöner, W., Ungersböck, M., Matulla, C., Briffa, K., Jones, P., Efthymiadis, D., Brunetti, M., Nanni, T., Maugeri, M., Mercalli, L., Mestre, O., Moisselin, J.-M., Begert, M., Müller-Westermeier, G., Kveton, V., Bochnicek, O., Stastny, P., Lapin, M., Szalai, S., Szentimrey, T., Cegnar, T., Dolinar, M., Gajic-Capka, M., Zaninovic, K., Majstorovic, Z., and Nieplova, E.: HISTALP – historical instrumental climatological surface time series of the Greater Alpine Region, Int. J. Climatol., 27, 17–46, https://doi.org/10.1002/joc.1377, 2007.
Beillouin, D., Schauberger, B., Bastos, A., Ciais, P., and Makowski, D.: Impact of extreme weather conditions on European crop production in 2018, Philos. T. Roy. Soc. B, 375, 20190510, https://doi.org/10.1098/rstb.2019.0510, 2020.
Bengtsson, J., Bullock, J. M., Egoh, B., Everson, C., Everson, T., O'Connor, T., O'Farrell, P. J., Smith, H. G., and Lindborg, R.: Grasslands – more important for ecosystem services than you might think, Ecosphere, 10, e02582, https://doi.org/10.1002/ecs2.2582, 2019.
Berghuijs, W. R., Gnann, S. J., and Woods, R. A.: Unanswered questions on the Budyko framework, Hydrol. Process., 34, 5699–5703, https://doi.org/10.1002/hyp.13958, 2020.
Bernhardt-Römermann, M., Römermann, C., Sperlich, S., and Schmidt, W.: Explaining grassland biomass – the contribution of climate, species and functional diversity depends on fertilization and mowing frequency, J. Appl. Ecol., 48, 1088–1097, https://doi.org/10.1111/j.1365-2664.2011.01968.x, 2011.
Berry, Z. C., Emery, N. C., Gotsch, S. G., and Goldsmith, G. R.: Foliar water uptake: Processes, pathways, and integration into plant water budgets, Plant Cell Environ., 42, 410–423, https://doi.org/10.1111/pce.13439, 2019.
Blair, J., Nippert, J., and Briggs, J.: Grassland Ecology, in: Ecology and the Environment, edited by: Monson, R. K., Springer New York, New York, NY, 389–423, 2014.
Bradford, J. B., Lauenroth, W. K., Burke, I. C., and Paruelo, J. M.: The Influence of Climate, Soils, Weather, and Land Use on Primary Production and Biomass Seasonality in the US Great Plains, Ecosystems, 9, 934–950, https://doi.org/10.1007/s10021-004-0164-1, 2006.
Budyko, M. I. and Miller, D. H.: Climate and life, International geophysics series, Academic Press, New York, xvii, 508 pp., 1974.
Chen, L., Liu, C., Li, Y., and Wang, G.: Impacts of climatic factors on runoff coefficients in source regions of the Huanghe River, Chinese Geogr. Sci., 17, 047–055, https://doi.org/10.1007/s11769-007-0047-4, 2007.
Dawson, T. E. and Goldsmith, G. R.: The value of wet leaves, New Phytologist, 219, 1156–1169, https://doi.org/10.1111/nph.15307, 2018.
De Boeck, H. J., Lemmens, C. M. H. M., Bossuyt, H., Malchair, S., Carnol, M., Merckx, R., Nijs, I., and Ceulemans, R.: How do climate warming and plant species richness affect water use in experimental grasslands?, Plant Soil, 288, 249–261, https://doi.org/10.1007/s11104-006-9112-5, 2006.
Degener, J.: Atmospheric CO2 fertilization effects on biomass yields of 10 crops in northern Germany, Front. Environ. Sci., 3, 1–14, https://doi.org/10.3389/fenvs.2015.00048, 2015.
Eitzinger, J., Kersebaum, K. C., and Formayer, H.: Landwirtschaft im Klimawandel. Auswirkungen und Anpassungsstrategien für die land- und forstwirtschaftlichen Betriebe in Mitteleuropa, Agrimedia, Clenze, ISBN 978-3-86037-378-1, 320 pp., 2009.
Ernst, P. and Loeper, E. G.: Temperaturentwicklung und Vegetationsbeginn auf dem Grünland, Das Wirtschaftseigene Futter, 22, 5–11, 1976.
Fank, J. and Unold, G.: High-precision weighable field Lysimeter – a tool to measure water and solute balance parameters, Int. Water Irrig., 27, 28–32, 2007.
Feng, T., Zhang, L., Chen, Q., Ma, Z., Wang, H., Shangguan, Z., Wang, L., and He, J.-S.: Dew formation reduction in global warming experiments and the potential consequences, J. Hydrol., 593, 125819, https://doi.org/10.1016/j.jhydrol.2020.125819, 2021.
Fennell, J., Geris, J., Wilkinson, M. E., Daalmans, R., and Soulsby, C.: Lessons from the 2018 drought for management of local water supplies in upland areas: A tracer-based assessment, Hydrol. Process., 34, 4190–4210, https://doi.org/10.1002/hyp.13867, 2020.
Fu, Y., Yu, G., Wang, Y., Li, Z., and Hao, Y.: Effect of water stress on ecosystem photosynthesis and respiration of a Leymus chinensis steppe in Inner Mongolia, Sci. China Ser. D, 49, 196–206, https://doi.org/10.1007/s11430-006-8196-3, 2006.
Gerlein-Safdi, C., Gauthier, P. P. G., and Caylor, K. K.: Dew-induced transpiration suppression impacts the water and isotope balances of Colocasia leaves, Oecologia, 187, 1041–1051, https://doi.org/10.1007/s00442-018-4199-y, 2018.
Gobiet, A., Kotlarski, S., Beniston, M., Heinrich, G., Rajczak, J., and Stoffel, M.: 21st century climate change in the European Alps – A review, Sci. Total Environ., 493, 1138–1151, https://doi.org/10.1016/j.scitotenv.2013.07.050, 2014.
Graf, A., Klosterhalfen, A., Arriga, N., Bernhofer, C., Bogena, H., Bornet, F., Brüggemann, N., Brümmer, C., Buchmann, N., Chi, J., Chipeaux, C., Cremonese, E., Cuntz, M., Dušek, J., El-Madany, T. S., Fares, S., Fischer, M., Foltýnová, L., Gharun, M., Ghiasi, S., Gielen, B., Gottschalk, P., Grünwald, T., Heinemann, G., Heinesch, B., Heliasz, M., Holst, J., Hörtnagl, L., Ibrom, A., Ingwersen, J., Jurasinski, G., Klatt, J., Knohl, A., Koebsch, F., Konopka, J., Korkiakoski, M., Kowalska, N., Kremer, P., Kruijt, B., Lafont, S., Léonard, J., Ligne, A. D., Longdoz, B., Loustau, D., Magliulo, V., Mammarella, I., Manca, G., Mauder, M., Migliavacca, M., Mölder, M., Neirynck, J., Ney, P., Nilsson, M., Paul-Limoges, E., Peichl, M., Pitacco, A., Poyda, A., Rebmann, C., Roland, M., Sachs, T., Schmidt, M., Schrader, F., Siebicke, L., Šigut, L., Tuittila, E.-S., Varlagin, A., Vendrame, N., Vincke, C., Völksch, I., Weber, S., Wille, C., Wizemann, H.-D., Zeeman, M., and Vereecken, H.: Altered energy partitioning across terrestrial ecosystems in the European drought year 2018, Philos. T. Roy. Soc. B, 375, 20190524, https://doi.org/10.1098/rstb.2019.0524, 2020.
Groh, J., Slawitsch, V., Herndl, M., Graf, A., Vereecken, H., and Pütz, T.: Determining dew and hoar frost formation for a low mountain range and alpine grassland site by weighable lysimeter, J. Hydrol., 563, 372–381, https://doi.org/10.1016/j.jhydrol.2018.06.009, 2018.
Groh, J., Pütz, T., Gerke, H. H., Vanderborght, J., and Vereecken, H.: Quantification and Prediction of Nighttime Evapotranspiration for Two Distinct Grassland Ecosystems, Water Resour. Res., 55, 2961–2975, https://doi.org/10.1029/2018wr024072, 2019.
Groh, J., Vanderborght, J., Pütz, T., Vogel, H.-J., Gründling, R., Rupp, H., Rahmati, M., Sommer, M., Vereecken, H., and Gerke, H. H.: Responses of soil water storage and crop water use efficiency to changing climatic conditions: a lysimeter-based space-for-time approach, Hydrol. Earth Syst. Sci., 24, 1211–1225, https://doi.org/10.5194/hess-24-1211-2020, 2020.
Habermann, E., San Martin, J. A. B., Contin, D. R., Bossan, V. P., Barboza, A., Braga, M. R., Groppo, M., and Martinez, C. A.: Increasing atmospheric CO2 and canopy temperature induces anatomical and physiological changes in leaves of the C4 forage species Panicum maximum, PloS one, 14, e0212506–e0212506, https://doi.org/10.1371/journal.pone.0212506, 2019.
Hanson, P. J. and Walker, A. P.: Advancing global change biology through experimental manipulations: Where have we been and where might we go?, Global Change Biol., 26, 287–299, https://doi.org/10.1111/gcb.14894, 2020.
Hatfield, J. L. and Dold, C.: Water-Use Efficiency: Advances and Challenges in a Changing Climate, Front. Plant Sci., 10, 1–14, https://doi.org/10.3389/fpls.2019.00103, 2019.
Herndl, M., Pötsch, E., Kandolf, M., Bohner, A., Schaumberger, A., Resch, R., Graiss, W., Krautzer, B., and Buchgraber, K.: “Lysi-T-FACE” an experiment to simulate global warming impact on, EGU General Assembly, Vienna, 2010.
Herndl, M., Pötsch, E., Bohner, A., and Kandolf, M.: Lysimeter als Bestandteil eines technischen Versuchskonzeptes zur Simulation der Erderwärmung im Grünland, in: Bericht LFZ Raumberg-Gumpenstein, 14. Gumpensteiner Lysimetertagung “Lysimeter in der Klimafolgenforschung und Wasserwirtschaft”, Raumberg-Gumpenstein, Austria, 119–126, 2011 (in German, with English abstract).
Herndl, M., Slawitsch, V., Pötsch, E., Schink, M., and Kandolf, M.: Auswirkungen von erhöhter Temperatur und CO2-Konzentration im Dauergrünland auf den im Sickerwasser gelösten organischen Kohlenstoff und Stickstof (In German, with English abstract.), 18. Gumpensteiner Lysimetertagung 2019, HBLFA Raumberg-Gumpenstein, 41–48, 2019.
Hofer, D., Suter, M., Buchmann, N., and Lüscher, A.: Nitrogen status of functionally different forage species explains resistance to severe drought and post-drought overcompensation, Agric. Ecosyst. Environ., 236, 312–322, https://doi.org/10.1016/j.agee.2016.11.022, 2017.
Hossain, M. L. and Beierkuhnlein, C.: Enhanced aboveground biomass by increased precipitation in a central European grassland, Ecol. Process., 7, 37, https://doi.org/10.1186/s13717-018-0149-1, 2018.
Hovenden, M. J., Newton, P. C. D., and Porter, M.: Elevated CO2 and warming effects on grassland plant mortality are determined by the timing of rainfall, Ann. Botany, 119, 1225–1233, https://doi.org/10.1093/aob/mcx006, 2017.
Inauen, N., Körner, C., and Hiltbrunner, E.: Hydrological consequences of declining land use and elevated CO2 in alpine grassland, J. Ecol., 101, 86–96, https://doi.org/10.1111/1365-2745.12029, 2013.
Ionita, M., Tallaksen, L. M., Kingston, D. G., Stagge, J. H., Laaha, G., Van Lanen, H. A. J., Scholz, P., Chelcea, S. M., and Haslinger, K.: The European 2015 drought from a climatological perspective, Hydrol. Earth Syst. Sci., 21, 1397–1419, https://doi.org/10.5194/hess-21-1397-2017, 2017.
IPCC: Global Warming of 1.5 ∘C: An IPCC Special Report on the Impacts of Global Warming of 1.5 ∘C Above Pre-Industrial Levels and Related Global Greenhouse Gas Emission Pathways, in the Context of Strengthening the Global Response to the Threat of Climate Change, Sustainable Development, and Efforts to Eradicate Poverty, World Meteorological Organization, Geneva, 2018.
Jarvis, N., Groh, J., Lewan, E., Meurer, K., Durka, W., Baessler, C., Pütz, T., Rufullayev, E., and Vereecken, H.: Coupled modelling of hydrological processes and grassland production in two contrasting climates, Hydrol. Earth Syst. Sci. Discuss. [preprint], https://doi.org/10.5194/hess-2021-316, in review, 2021.
Jia, X., Xie, B., Shao, M. A., and Zhao, C.: Primary Productivity and Precipitation-Use Efficiency in Temperate Grassland in the Loess Plateau of China, PLOS ONE, 10, e0135490, https://doi.org/10.1371/journal.pone.0135490, 2015.
Kimball, B. A., Conley, M. M., Wang, S., Lin, X., Luo, C., Morgan, J., and Smith, D.: Infrared heater arrays for warming ecosystem field plots, Global Change Biol., 14, 309–320, https://doi.org/10.1111/j.1365-2486.2007.01486.x, 2008.
Kirschbaum, M. U. F.: Direct and Indirect Climate Change Effects on Photosynthesis and Transpiration, Plant Biol., 6, 242–253, https://doi.org/10.1055/s-2004-820883, 2004.
Kirschbaum, M. U. F. and McMillan, A. M. S.: Warming and Elevated CO2 Have Opposing Influences on Transpiration. Which is more Important?, Curr. Forestry Rep., 4, 51–71, https://doi.org/10.1007/s40725-018-0073-8, 2018.
Knapp, A. K., Carroll, C. J. W., Griffin-Nolan, R. J., Slette, I. J., Chaves, F. A., Baur, L. E., Felton, A. J., Gray, J. E., Hoffman, A. M., Lemoine, N. P., Mao, W., Post, A. K., and Smith, M. D.: A reality check for climate change experiments: Do they reflect the real world?, Ecology, 99, 2145–2151, https://doi.org/10.1002/ecy.2474, 2018.
Kohfahl, C., Molano-Leno, L., Martínez, G., Vanderlinden, K., Guardiola-Albert, C., and Moreno, L.: Determining groundwater recharge and vapor flow in dune sediments using a weighable precision meteo lysimeter, Sci. Total Environ., 656, 550–557, https://doi.org/10.1016/j.scitotenv.2018.11.415, 2019.
Konrad, W., Katul, G., and Roth-Nebelsick, A.: Leaf temperature and its dependence on atmospheric CO2 and leaf size, Geol. J., 56, 866–885, https://doi.org/10.1002/gj.3757, 2021.
Kreyling, J. and Beier, C.: Complexity in Climate Change Manipulation Experiments, BioScience, 63, 763–767, https://doi.org/10.1525/bio.2013.63.9.12, 2013.
Kruijt, B., Witte, J.-P. M., Jacobs, C. M. J., and Kroon, T.: Effects of rising atmospheric CO2 on evapotranspiration and soil moisture: A practical approach for the Netherlands, J. Hydrol., 349, 257–267, https://doi.org/10.1016/j.jhydrol.2007.10.052, 2008.
Kunkel, R., Sorg, J., Eckardt, R., Kolditz, O., Rink, K., and Vereecken, H.: TEODOOR: a distributed geodata infrastructure for terrestrial observation data, Environ. Earth Sci., 69, 507–521, https://doi.org/10.1007/s12665-013-2370-7, 2013 (data available at: https://teodoor.icg.kfa-juelich.de/ddp/index.jsp (last access: 9 February 2021).
Lammertsma, E. I., Boer, H. J. D., Dekker, S. C., Dilcher, D. L., Lotter, A. F., and Wagner-Cremer, F.: Global CO2 rise leads to reduced maximum stomatal conductance in Florida vegetation, P. Natl. Acad. Sci. USA, 108, 4035–4040, https://doi.org/10.1073/pnas.1100371108, 2011.
Le Houérou, H. N., Bingham, R. L., and Skerbek, W.: Relationship between the variability of primary production and the variability of annual precipitation in world arid lands, J. Arid Environ., 15, 1–18, https://doi.org/10.1016/S0140-1963(18)31001-2, 1988.
Lenka, N. K., Lenka, S., Thakur, J. K., Yashona, D. S., Shukla, A. K., Elanchezhian, R., Singh, K. K., Biswas, A. K., and Patra, A. K.: Carbon dioxide and temperature elevation effects on crop evapotranspiration and water use efficiency in soybean as affected by different nitrogen levels, Agric. Water Manage., 230, 105936, https://doi.org/10.1016/j.agwat.2019.105936, 2020.
Mastrotheodoros, T., Pappas, C., Molnar, P., Burlando, P., Manoli, G., Parajka, J., Rigon, R., Szeles, B., Bottazzi, M., Hadjidoukas, P., and Fatichi, S.: More green and less blue water in the Alps during warmer summers, Nat. Clim. Change, 10, 155–161, https://doi.org/10.1038/s41558-019-0676-5, 2020.
Miglietta, F., Peressotti, A., Vaccari, F. P., Zaldei, A., DeAngelis, P., and Scarascia-Mugnozza, G.: Free-air CO2 enrichment (FACE) of a poplar plantation: the POPFACE fumigation system, New Phytol., 150, 465–476, https://doi.org/10.1046/j.1469-8137.2001.00115.x, 2001.
Morgan, J. A., Pataki, D. E., Körner, C., Clark, H., Del Grosso, S. J., Grünzweig, J. M., Knapp, A. K., Mosier, A. R., Newton, P. C. D., Niklaus, P. A., Nippert, J. B., Nowak, R. S., Parton, W. J., Polley, H. W., and Shaw, M. R.: Water relations in grassland and desert ecosystems exposed to elevated atmospheric CO2, Oecologia, 140, 11–25, https://doi.org/10.1007/s00442-004-1550-2, 2004.
Nendel, C., Kersebaum, K. C., Mirschel, W., Manderscheid, R., Weigel, H. J., and Wenkel, K. O.: Testing different CO2 response algorithms against a FACE crop rotation experiment, NJAS – Wageningen Journal of Life Sciences, 57, 17–25, https://doi.org/10.1016/j.njas.2009.07.005, 2009.
Nosalewicz, A., Siecińska, J., Kondracka, K., and Nosalewicz, M.: The functioning of Festuca arundinacea and Lolium perenne under drought is improved to a different extend by the previous exposure to water deficit, Environ. Exp. Bot., 156, 271–278, https://doi.org/10.1016/j.envexpbot.2018.09.016, 2018.
Obermeier, W. A., Lehnert, L. W., Ivanov, M. A., Luterbacher, J., and Bendix, J.: Reduced Summer Aboveground Productivity in Temperate C3 Grasslands Under Future Climate Regimes, Earth's Future, 6, 716–729, https://doi.org/10.1029/2018ef000833, 2018.
Padilla, F. M., Aarts, B. H. J., Roijendijk, Y. O. A., de Caluwe, H., Mommer, L., Visser, E. J. W., and de Kroon, H.: Root plasticity maintains growth of temperate grassland species under pulsed water supply, Plant Soil, 369, 377–386, https://doi.org/10.1007/s11104-012-1584-x, 2013.
Paschalis, A., Fatichi, S., Zscheischler, J., Ciais, P., Bahn, M., Boysen, L., Chang, J., De Kauwe, M., Estiarte, M., Goll, D., Hanson, P. J., Harper, A. B., Hou, E., Kigel, J., Knapp, A. K., Larsen, K. S., Li, W., Lienert, S., Luo, Y., Meir, P., Nabel, J. E. M. S., Ogaya, R., Parolari, A. J., Peng, C., Peñuelas, J., Pongratz, J., Rambal, S., Schmidt, I. K., Shi, H., Sternberg, M., Tian, H., Tschumi, E., Ukkola, A., Vicca, S., Viovy, N., Wang, Y.-P., Wang, Z., Williams, K., Wu, D., and Zhu, Q.: Rainfall manipulation experiments as simulated by terrestrial biosphere models: Where do we stand?, Global Change Biol., 26, 3336–3355, https://doi.org/10.1111/gcb.15024, 2020.
Peters, A., Groh, J., Schrader, F., Durner, W., Vereecken, H., and Pütz, T.: Towards an unbiased filter routine to determine precipitation and evapotranspiration from high precision lysimeter measurements, J. Hydrol., 549, 731–740, https://doi.org/10.1016/j.jhydrol.2017.04.015, 2017.
Peters, W., Bastos, A., Ciais, P., and Vermeulen, A.: A historical, geographical and ecological perspective on the 2018 European summer drought, Philos. T. Roy. Soc. B, 375, 20190505, https://doi.org/10.1098/rstb.2019.0505, 2020.
Piepho, H.-P., Herndl, M., Pötsch, E. M., and Bahn, M.: Designing an experiment with quantitative treatment factors to study the effects of climate change, J. Agron. Crop Sci., 203, 584–592, https://doi.org/10.1111/jac.12225, 2017.
Pütz, T., Kiese, R., Wollschläger, U., Groh, J., Rupp, H., Zacharias, S., Priesack, E., Gerke, H. H., Gasche, R., Bens, O., Borg, E., Baessler, C., Kaiser, K., Herbrich, M., Munch, J.-C., Sommer, M., Vogel, H.-J., Vanderborght, J., and Vereecken, H.: TERENO-SOILCan: a lysimeter-network in Germany observing soil processes and plant diversity influenced by climate change, Environ. Earth Sci., 75, 1–14, https://doi.org/10.1007/s12665-016-6031-5, 2016.
Pütz, T., Kiese, R., Groh, J., Vogel, H.-J., Rupp, H., Zacharias, S., Priesack, E., Gerke, H., Gasche, R., Borg, E., Kaiser, K., Sommer, M., Vanderborght, J., and Vereecken, H.: Studying the effects of climate and land use on ecosystems: The lysimeter network TERENO-SOILCAN, in: Novel Methods and Results of Landscape Research in Europe, Central Asia and Siberia (in five volumes). Vol. 1. Landscapes in the 21th Century: Status Analyses, Basic Processes and Research Concepts, edited by: Sychev, V. G., and Mueller, L., Publishing House FSBSI Pryanishnikov Institute of Agrochemistry, Moscow, 504, 2018.
Rahmati, M., Groh, J., Graf, A., Pütz, T., Vanderborght, J., and Vereecken, H.: On the impact of increasing drought on the relationship between soil water content and evapotranspiration of a grassland, Vadose Zone J., 19, e20029, https://doi.org/10.1002/vzj2.20029, 2020.
R Core Team: R: A language and environment for statistical computing, R Foundation for Statistical Computing, Vienna, 2016.
Riedel, T. and Weber, T. K. D.: Review: The influence of global change on Europe's water cycle and groundwater recharge, Hydrogeology J., 28, 1939–1959, https://doi.org/10.1007/s10040-020-02165-3, 2020.
Roy, J., Picon-Cochard, C., Augusti, A., Benot, M.-L., Thiery, L., Darsonville, O., Landais, D., Piel, C., Defossez, M., Devidal, S., Escape, C., Ravel, O., Fromin, N., Volaire, F., Milcu, A., Bahn, M., and Soussana, J.-F.: Elevated CO2 maintains grassland net carbon uptake under a future heat and drought extreme, P. Natl. Acad. Sci. USA, 113, 6224–6229, https://doi.org/10.1073/pnas.1524527113, 2016.
Schaumberger, A.: Räumliche Modelle zur Vegetations- und Ertragsdynamik im Wirtschaftsgrünland, PhD, Institut für Geoinformation, Technische Universität Graz, Graz, 264 pp., 2011.
Schirpke, U., Kohler, M., Leitinger, G., Fontana, V., Tasser, E., and Tappeiner, U.: Future impacts of changing land-use and climate on ecosystem services of mountain grassland and their resilience, Ecosystem Services, 26, 79–94, https://doi.org/10.1016/j.ecoser.2017.06.008, 2017.
Song, J., Wan, S., Piao, S., Knapp, A. K., Classen, A. T., Vicca, S., Ciais, P., Hovenden, M. J., Leuzinger, S., Beier, C., Kardol, P., Xia, J., Liu, Q., Ru, J., Zhou, Z., Luo, Y., Guo, D., Adam Langley, J., Zscheischler, J., Dukes, J. S., Tang, J., Chen, J., Hofmockel, K. S., Kueppers, L. M., Rustad, L., Liu, L., Smith, M. D., Templer, P. H., Quinn Thomas, R., Norby, R. J., Phillips, R. P., Niu, S., Fatichi, S., Wang, Y., Shao, P., Han, H., Wang, D., Lei, L., Wang, J., Li, X., Zhang, Q., Li, X., Su, F., Liu, B., Yang, F., Ma, G., Li, G., Liu, Y., Liu, Y., Yang, Z., Zhang, K., Miao, Y., Hu, M., Yan, C., Zhang, A., Zhong, M., Hui, Y., Li, Y., and Zheng, M.: A meta-analysis of 1,119 manipulative experiments on terrestrial carbon-cycling responses to global change, Nat. Ecol. Evol., 3, 1309–1320, https://doi.org/10.1038/s41559-019-0958-3, 2019.
Sorokin, Y., Zelikova, T. J., Blumenthal, D., Williams, D. G., and Pendall, E.: Seasonally contrasting responses of evapotranspiration to warming and elevated CO2 in a semiarid grassland, Ecohydrology, 10, e1880, https://doi.org/10.1002/eco.1880, 2017.
Tello-García, E., Huber, L., Leitinger, G., Peters, A., Newesely, C., Ringler, M.-E., and Tasser, E.: Drought- and heat-induced shifts in vegetation composition impact biomass production and water use of alpine grasslands, Environ. Exp. Bot., 169, 103921, https://doi.org/10.1016/j.envexpbot.2019.103921, 2020.
Thornton, P. K., Ericksen, P. J., Herrero, M., and Challinor, A. J.: Climate variability and vulnerability to climate change: a review, Global Change Biol., 20, 3313–3328, https://doi.org/10.1111/gcb.12581, 2014.
Tomaszkiewicz, M., Abou Najm, M., Beysens, D., Alameddine, I., Bou Zeid, E., and El-Fadel, M.: Projected climate change impacts upon dew yield in the Mediterranean basin, Sci. Total Environ., 566, 1339–1348, https://doi.org/10.1016/j.scitotenv.2016.05.195, 2016.
Trosseille, J., Mongruel, A., Royon, L., and Beysens, D.: Radiative cooling for dew condensation, Int. J. Heat Mass T., 172, 121160, https://doi.org/10.1016/j.ijheatmasstransfer.2021.121160, 2021.
Wang, Y., Sun, J., Liu, M., Zeng, T., Tsunekawa, A., Mubarak, A. A., and Zhou, H.: Precipitation-use efficiency may explain net primary productivity allocation under different precipitation conditions across global grassland ecosystems, Global Ecol. Conserv., 20, e00713, https://doi.org/10.1016/j.gecco.2019.e00713, 2019.
Wieser, G., Hammerle, A., and Wohlfahrt, G.: The Water Balance of Grassland Ecosystems in the Austrian Alps, Arctic Antarct. Alpine Res., 40, 439–445, https://doi.org/10.1657/1523-0430(07-039)[WIESER]2.0.CO;2, 2008.
Yuan, Z. Y., Jiao, F., Shi, X. R., Sardans, J., Maestre, F. T., Delgado-Baquerizo, M., Reich, P. B., and Peñuelas, J.: Experimental and observational studies find contrasting responses of soil nutrients to climate change, eLife, 6, e23255, https://doi.org/10.7554/eLife.23255, 2017.
Zambrano-Bigiarini, M.: hydroGOF: Goodness-of-fit functions for comparison of simulated and observed hydrological time series, R package version 0.3-10, available at: http://hzambran.github.io/hydroGOF/ (last access: 22 October 2021), 2017.
Zhang, J., Zuo, X., Zhao, X., Ma, J., and Medina-Roldán, E.: Effects of rainfall manipulation and nitrogen addition on plant biomass allocation in a semiarid sandy grassland, Sci. Rep.-UK, 10, 9026, https://doi.org/10.1038/s41598-020-65922-0, 2020.
Zhang, Q., Wang, S., Yue, P., and Wang, S.: Variation characteristics of non-rainfall water and its contribution to crop water requirements in China's summer monsoon transition zone, J. Hydrol., 578, 124039, https://doi.org/10.1016/j.jhydrol.2019.124039, 2019.
Zheng, Y., Li, F., Hao, L., Shedayi, A. A., Guo, L., Ma, C., Huang, B., and Xu, M.: The optimal CO2 concentrations for the growth of three perennial grass species, BMC Plant Biol., 18, 27–27, https://doi.org/10.1186/s12870-018-1243-3, 2018.
Zhou, T., Liu, M., Sun, J., Li, Y., Shi, P., Tsunekawa, A., Zhou, H., Yi, S., and Xue, X.: The patterns and mechanisms of precipitation use efficiency in alpine grasslands on the Tibetan Plateau, Agric. Ecosyst. Environ., 292, 106833, https://doi.org/10.1016/j.agee.2020.106833, 2020.