the Creative Commons Attribution 4.0 License.
the Creative Commons Attribution 4.0 License.
 | 11 Nov 2021
Changes in glacial lakes in the Poiqu River basin in the central Himalayas
Pengcheng Su
Jingjing Liu
Wei Liu
Yang Wang
Chun Ma
Qimin Li
The Poiqu River basin is an area of concentration for glaciers and glacial lakes in the central Himalayas, where 147 glacial lakes were identified, based on perennial remote sensing images, with lake area ranging from 0.0002 to 5.5 km2 – a total of 19.89 km2. Since 2004, the retreat rate of glacier has reached as high as 5.0 km2 a−1, while the growth rate of glacial lake has reached 0.24 km2 a−1. We take five typical lakes as our case study and find that the retreat of glacier area reaches 31.2 %, while the glacial lake area has expanded by 166 %. Moreover, we reconstruct the topography of the lake basin to calculate the water capacity and propose a water balance equation (WBE) to explore the lake evolution. By applying the WBE to the five lakes, we calculate the water supplies of the last few years and compare this with the results of field surveys, which are in agreement, within an error of only 1.86 % on average. The WBE also reveals that the water supplies to the lake depend strongly on the altitude. Lakes at low altitudes are supplied by glacier melting, and lakes at high altitudes are supplied by snowmelts. The WBE is not only applicable for predicting future changes in glacial lakes under climate warming conditions but is also useful for assessing water resources from rivers in the central Himalayas.
- Article
(38760 KB) - Full-text XML
- BibTeX
- EndNote


Worldwide glacial retreat due to global warming has led to great changes in alpine glacial lakes (IPCC, 2013; Mergili et al., 2013; Nie et al., 2014; Wang and Zhang, 2014; Prakash and Nagarajan, 2017). Most glaciers retreat at increasing rates (Solomina et al., 2016). In the mountains of the Andes, Caucasus, Altai, and the Canadian Arctic region, glaciers have reduced in thickness by 3.6–11 m, while in the mountains of Tianshan, Alaska, Svalbard, the Alps, and the Pacific coast, glaciers have thinned by up to 30 m (Zhang et al., 2015, 2019). As the warming rate is much higher in Asian alpine areas, it is expected that approximately 36 % of the ice will be lost by the end of this century (Kraaijenbrink et al., 2017). In particular, in the central Himalayas, temperature increased at a rate of 0.3–0.4 ∘C per decade, nearly 2 times the global rate; and at present, the glacial lake area increases by 40 % at a rate of 0.28 km2 a−1, which is higher than the other regions in the Himalayas (Nie et al., 2017).
Inventory indicates that the area of glaciers has reduced by 9.5 % (767 km2) in the last 40 years (Wang et al., 2012; Nie et al., 2017) and at a higher rate in the south than in the north (Wei et al., 2014). The retreat of glaciers has led to the expansion and generation of glacial lakes (Richardson and Reynolds, 2000; Komori, 2008; Bolch et al., 2008; Bajracharya et al., 2007; Yao, 2010; Shrestha and Aryal, 2011; Raj et al., 2013). A total of 4950 lakes were identified in the Himalayas in 2015, mainly located between altitudes of 4000 and 5700 m, with a total area of 455.3 ± 72.7 km2, which has increased by approximately 14.1 % since 1990 (Nie et al., 2017). In the central Chinese Himalayas, the glacial lake area has increased greatly, from 166.48 to 215.28 km2, although the number of lakes has decreased from 1750 to 1680 in the last 40 years (Wang et al., 2012). This implies that the changes in glacial lakes are mainly due to the area expansion, which accounts for 67 % of the area increase, while the formation of a new glacial lake contributes only 33 % (Wang et al., 2015). This expansion depends on the fact that most lakes are fed by the meltwater of glaciers. In fact, the lakes associated with glaciers increased by 122.1 % in area during 1976–2010 in the central Himalayas, while lakes without meltwater remained steady, increasing only by 2.8 % in area during the same period (Wang et al., 2015).
Glacial retreat appears most remarkably in the south central Himalayas (Nie et al., 2017), where the last 30 years have witnessed a glacier length reduction of 48.2 m, on average, and an area reduction at a rate of 0.57 % (Yao et al., 2012). In the southern Himalayas lies the Koshi River, which has attracted great attention because glaciers have decreased by 19 % in area in the last 40 years (Shangguan et al., 2014; Xiang et al., 2018), and the melting rate has been accelerating in the last decade (Zhang et al., 2019). Moreover, the Poiqu River (Bhote Koshi River), a tributary of the Sun Koshi River, is a more active location for dramatic changes in glaciers and glacial lakes. Landsat data indicate that the annual retreat rate of glaciers in Poiqu basin was approximately 0.54 % in 1976–2010, and the area of glacier lakes increased up to 1.3 % per year in 1986–2001 (Chen et al., 2007). Consequently, the glacial lake increased by 47 % in area (0.37 km2 a−1; Chen et al., 2007) in 1986–2001.
The retreat of glaciers and the growth of lakes are generally believed to be caused by rising temperatures and decreasing rainfall (Yao et al., 2012; Xiang et al., 2014; Mir et al., 2014). Records show that the temperature in the west Himalayas has increased by approximately 1.7 ∘C in the last century, while the rainfall is decreasing (e.g., Bhutiyani et al., 2009; Mir et al., 2015a, b). In particular, observations in the Tibetan Plateau indicate that there is a strong tendency of temperature rise at high elevations (Liu and Chen, 2000), and the rising rate increases with elevation, reaching its highest value at approximately 4800 to 6200 m (Qin et al., 2009), which is in the range of glacier development.
Although it is well acknowledged that glaciers and glacial lakes are sensitive indicators of climate change, most studies are merely taken at large spatial and temporal scales, and only a gross tendency is outlined for the changes (Chen et al., 2007; Wang and Zhang, 2014; Wang et al., 2015; Wang and Jiao, 2015; Xiang et al., 2018; Zhang et al., 2019); special cases are only concerned with lake breaks (Xu and Feng, 1988; Chen et al., 2007; Wang et al., 2018; Nie et al., 2018). In the present study, we use multisource images from the last 30 years to explore the lake variation in the Poiqu River basin and provide a quantitative analysis of the water balance, which leads to a method for assessing glacial lake change under a warming climate and sheds new light on the mechanism of glacial lake evolution.
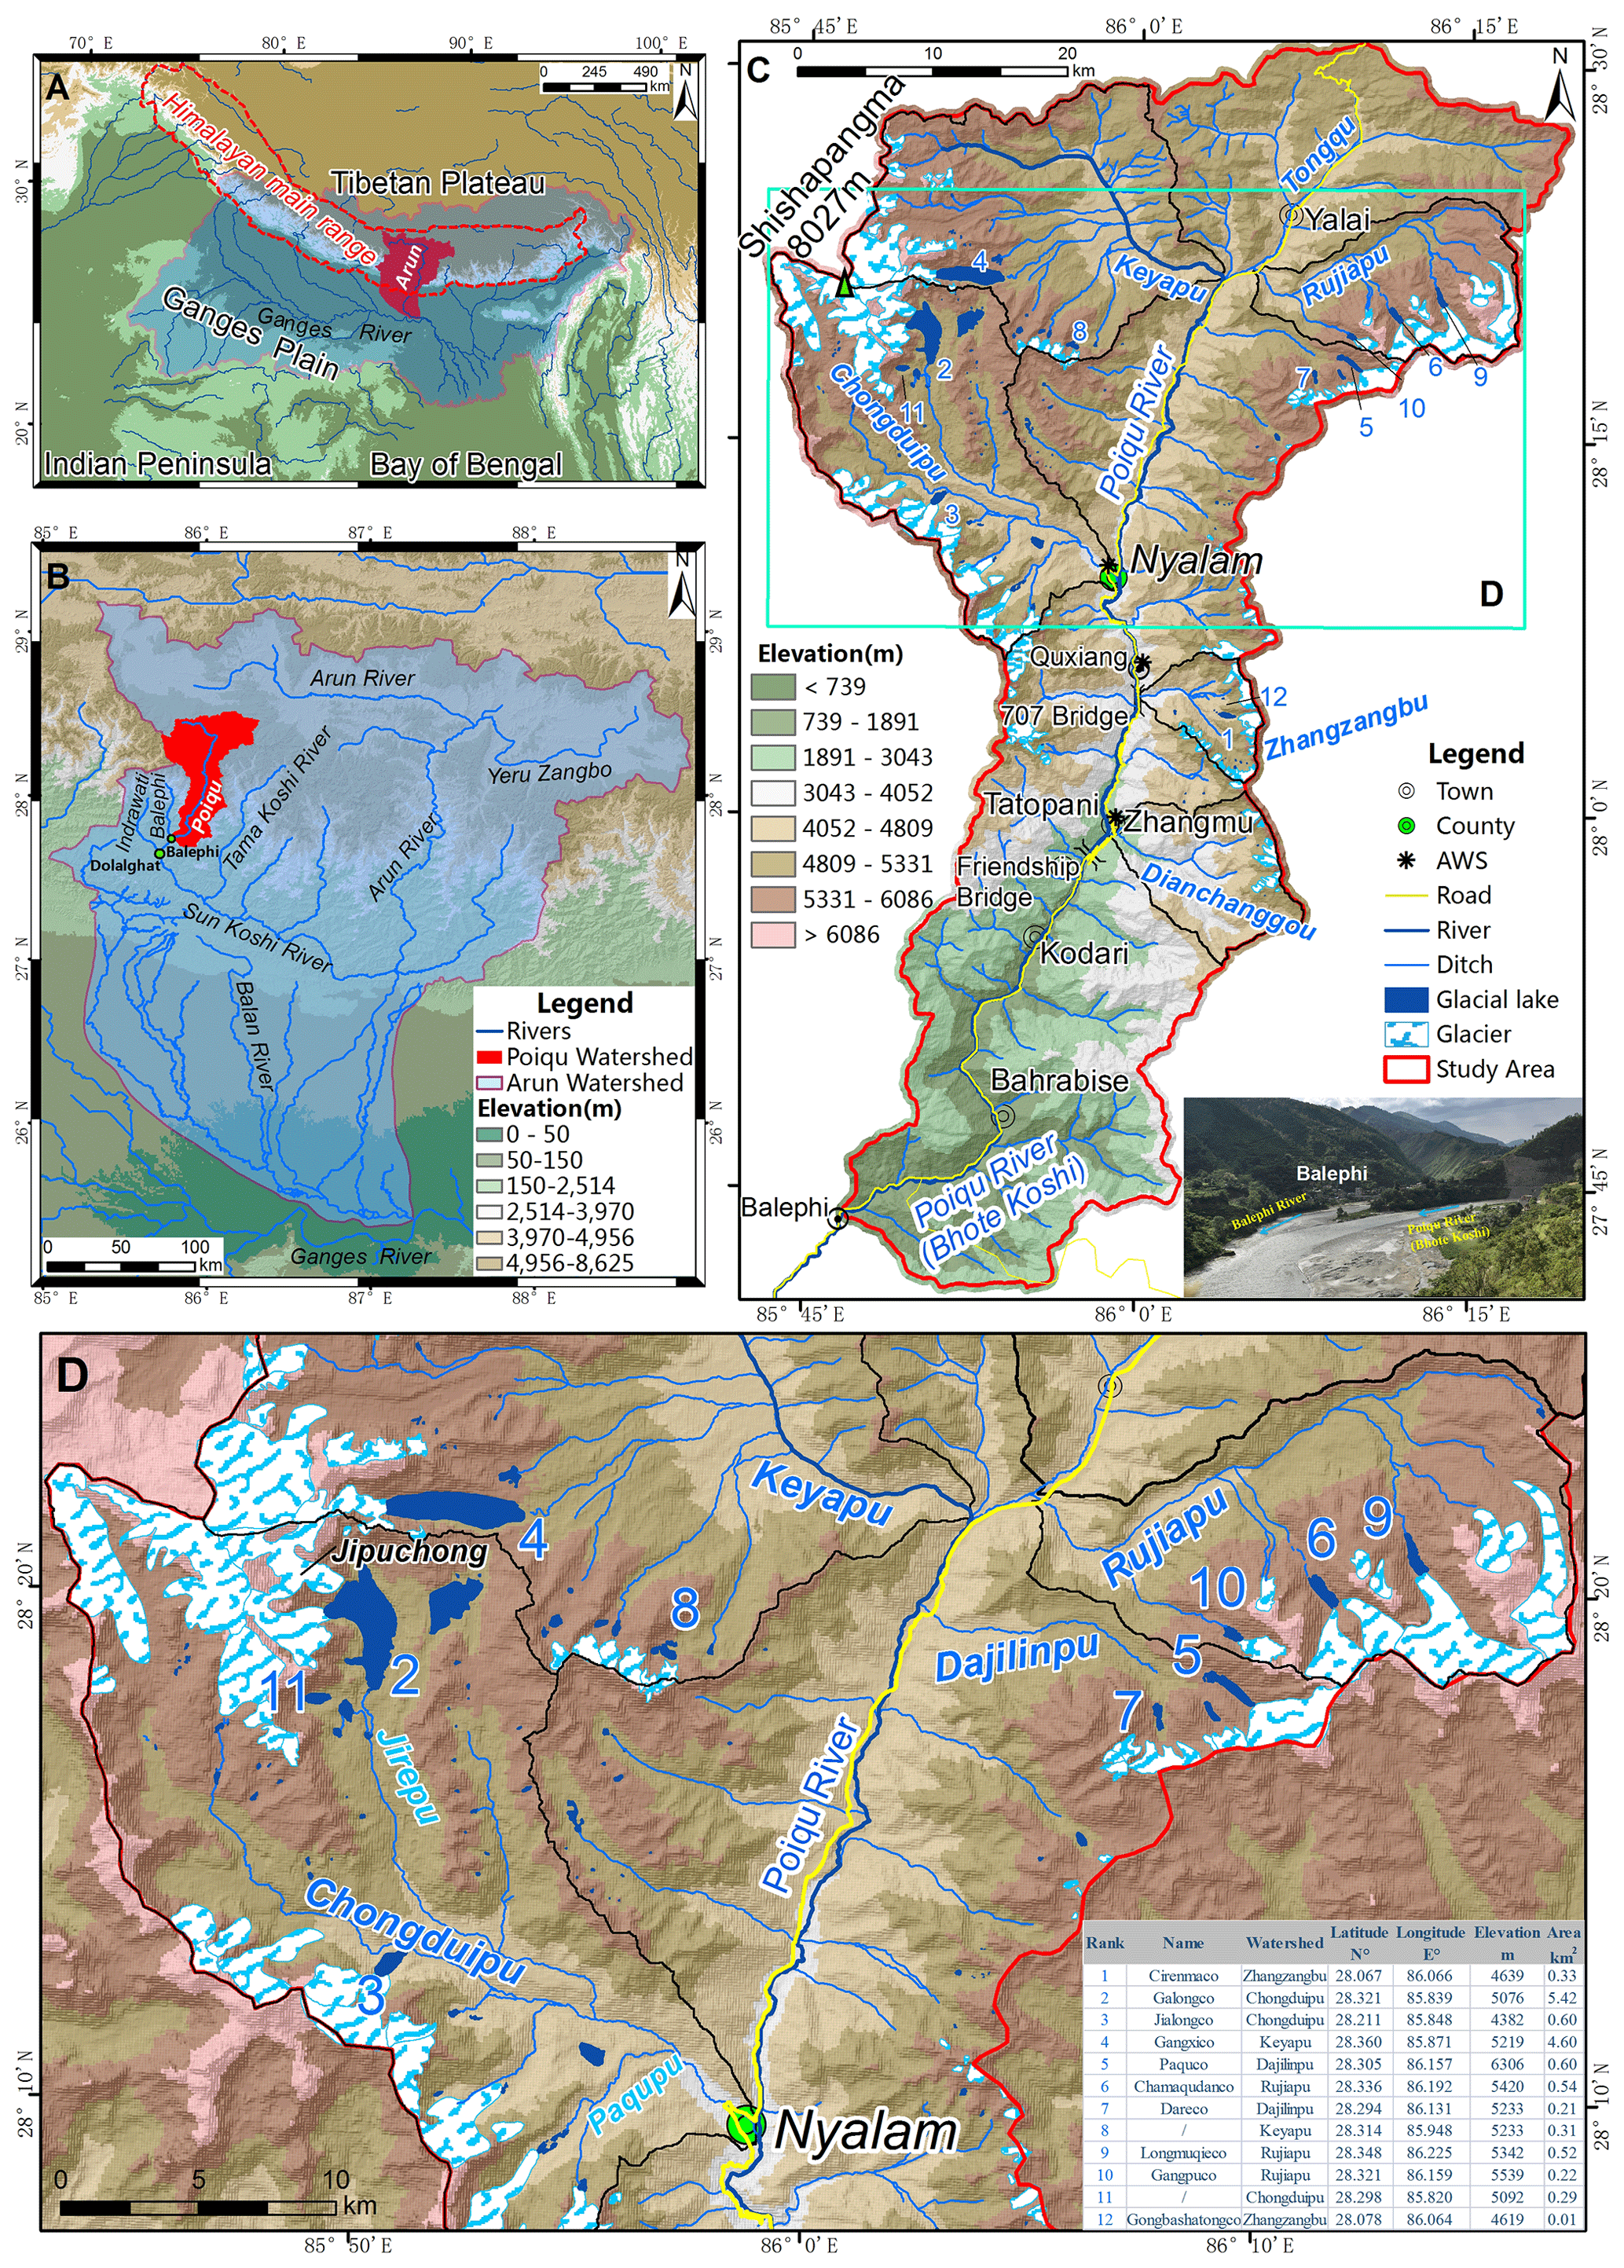
Figure 1The Poiqu River basin in the central Himalayas.
2.1 Background of the Poiqu River basin
2.1.1 Geomorphic and geological background
The Poiqu River basin is an area of concentration for glaciers and glacial lakes (Lambrecht et al., 2009). The Poiqu River (known as the Bhotekoshi River in Nepal) is the boundary river between China and Nepal, which is located along the southern slope of the central Himalayas, between the Himalayas and Laguigang mountains (Fig. 1). The river is 117.1 km and 2602 km2, originating from the Shishapangma mountain at 8027 m down to 1567 m at the outlet. The upper stream is located in the Chinese territory, and the length of the Poiqu River is 90 km.
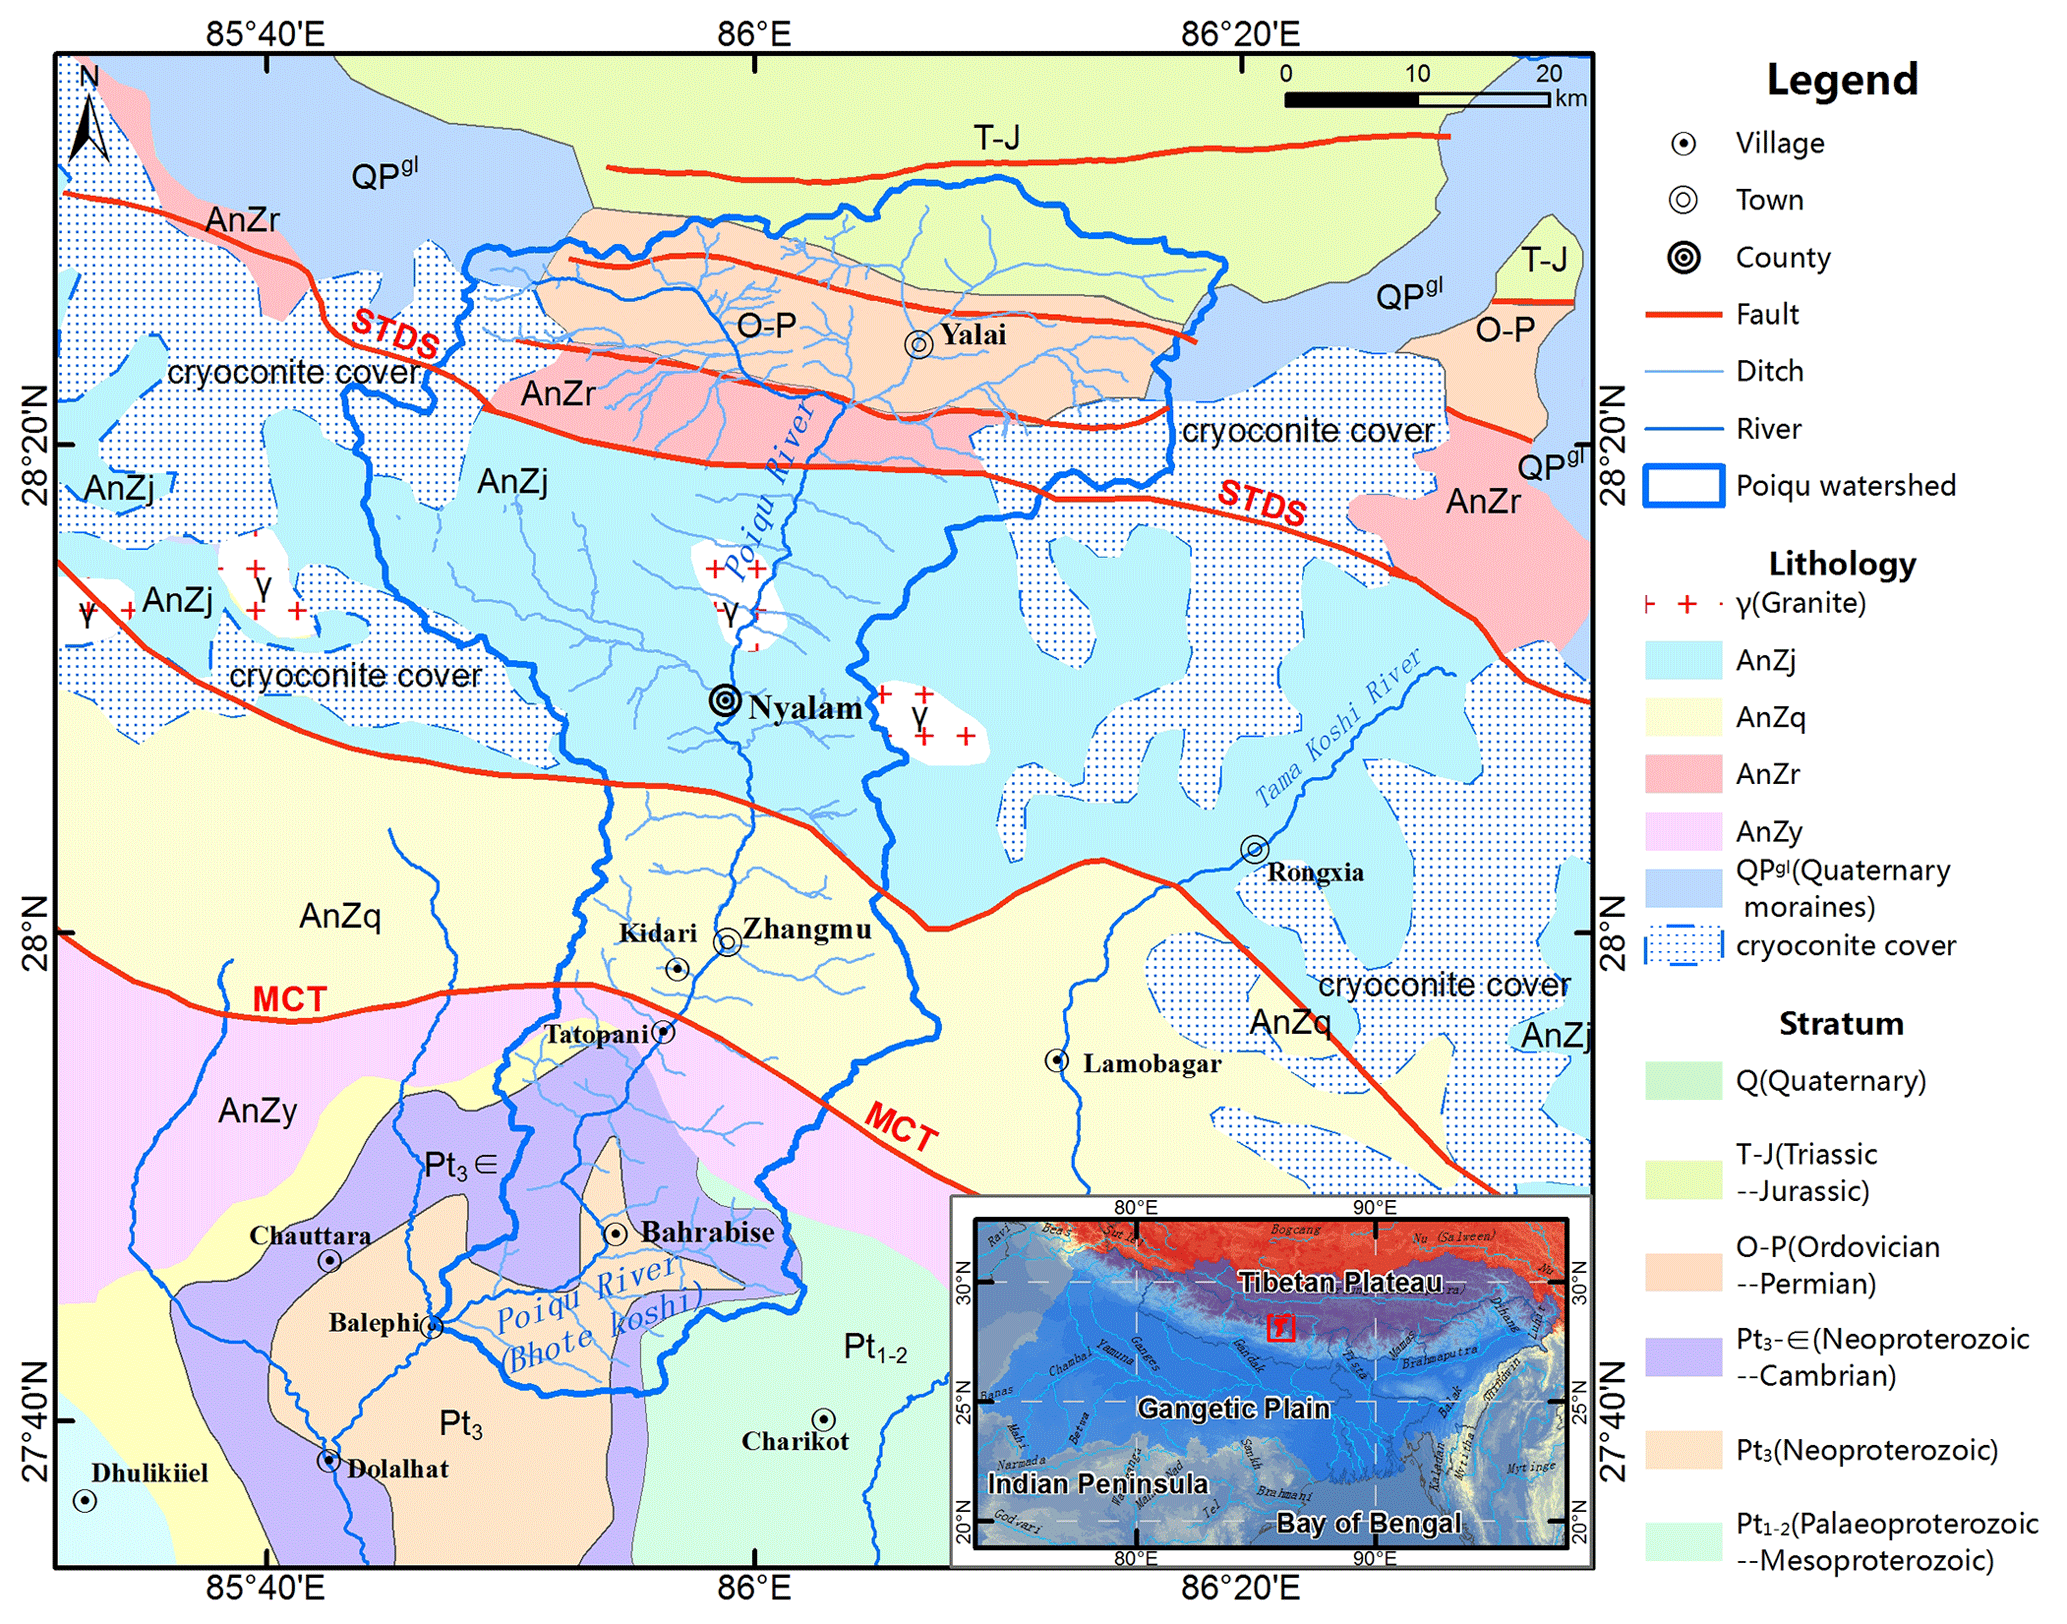
Figure 2Geological background of the Poiqu River basin (the base map is based on Wang et al., 2013).
Geologically, the Poiqu River basin is located in the central Himalayan terrane (Zhang et al., 2015), which was formed by the Indian–Eurasian plate collision (Zheng et al., 2014). The Himalayan orogenic belt has a crystalline basement complex anticline north wing (the anticline is located in Nepal). The whole basin runs through the northern Himalayan Tethyan sedimentary rock belt and the high Himalayan, low Himalayan, and other tectonic units, all of which are bounded by the South Tibetan detachment system (STDS) and the Main Central Thrust (MCT; Fig. 2).
The Sun Koshi River developed and cut through the MCT, and the Poiqu River has experienced many tectonic movements since the Pliocene; however, the difference in the local zone due to tectonic effects has been relatively reduced because of the large uplift of the plateau. The uplifted mountains continue to be eroded and denuded, while the relatively sloped gullies receive uneven amounts of loose accumulation. Under such a background, the Poiqu River is mainly characterized by alluvial and diluvial valleys, with widths of 20 to 200 m. The riverbed twists and turns and develops multilevel terraces. To the south of Nyalam County, the valley bottom is narrow with steep walls, most of which are V-shaped and Y-shaped valleys. The longitudinal section of the riverbed is undulating, with multiple waterfalls and turbulence.
2.1.2 Climate background
The main Himalayas edge divides the Poiqu River into the following two climate zones: the northern zone, featuring the village of Yalai, which is temperate and subhumid, with an average annual temperature (Ta) of 3.5 ∘C and rainfall (Ra) of 1100 mm, and the southern zone, featuring the town of Zhangmu, is in the subtropical monsoon climate, with Ta of 10 ∼ 20 ∘C, Ra of 2500 ∼ 3000 mm, and a frost-free period of 250 d, which is the area with the highest concentration of rainfall worldwide. Temperature and precipitation decreases from south to north with the rising altitude. The Poiqu has five major tributary rivers larger than 100 km2, i.e., Chongduipu, Keyapu, and Dianchanggou, where floods occur frequently in rainy seasons. The average annual discharge in the Chongduipu is 5.8 m3 s−1, and it is 31.7 m3 s−1 in the Poiqu main stream.
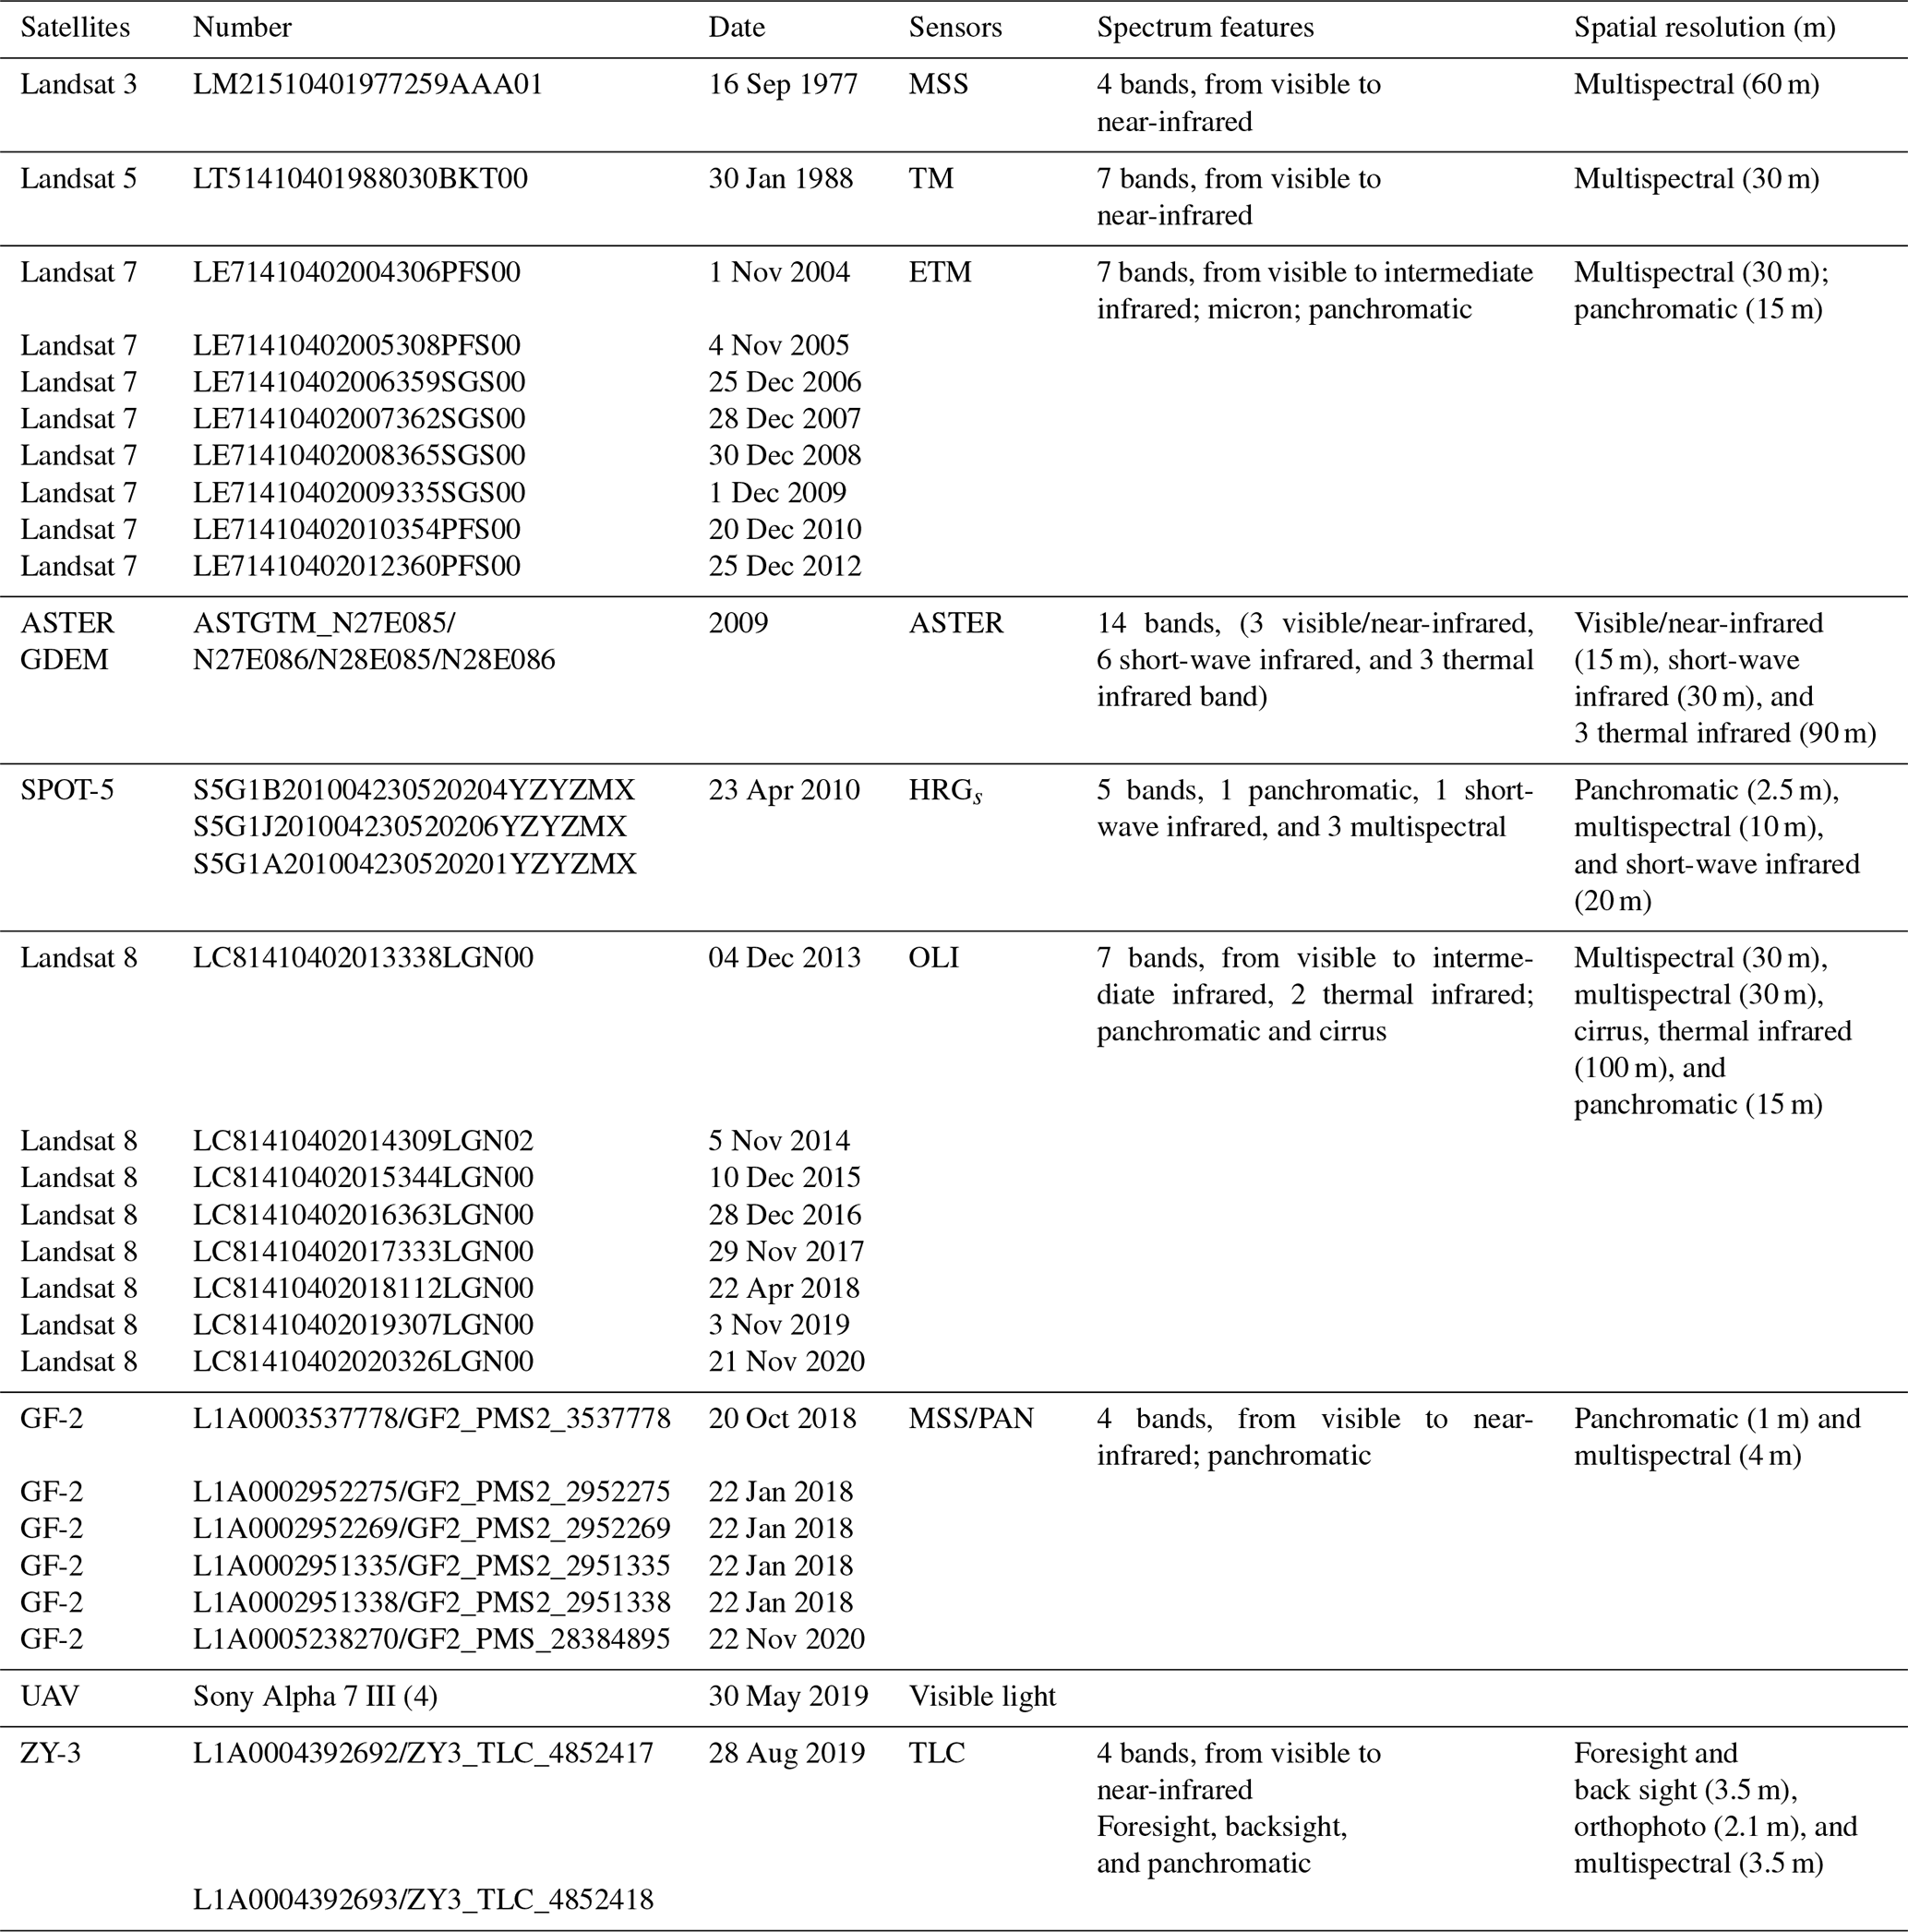
Table 1Data sources and features for the interpretation of glaciers and glacial lakes.
2.2 Data sources and processing method
2.2.1 Sources of image data
Landform data are mainly from ALOS 12.5 m and ASTER 30 m elevation data, which are used for correcting remote sensing data and interpretation. Geological data come from geological maps of the Tibetan Plateau. Remote sensing data come from the Landsat, GF-2, ZY-3, and unoccupied aerial vehicle (UAV) satellites, as listed in Table 1.
2.2.2 Processing method of image data
We use the fusion method to integrate the multispectrum data of 4 m GF-2 and the full-color data of 1 m GF-2 to create a base map for interpretation. In detail, for TM data, we use 742 band combinations and 432 combinations to highlight the colors of glaciers and glacial lakes; for the data from GF-2, we combine the 321 bands of true color and the standard 432 bands of false color images. Then, the ratios between different bands of the multispectrum data are used to create images at different gray levels (Shangguan et al., 2014; Mir et al., 2014; Wang et al.,2014).
For glaciers, reflectivity is large for the green light and small for intermediate the infrared light. Thus, the gray images can be obtained by The normalized difference snow index (NDSI) as follows (Zhang et al., 2006):
where bG is the green band, and bS is the intermediate infrared band. The index falls between −1 and 1, which can be further readjusted using ENVI software to provide the proper threshold. In this study, we set NDSI > 0.35 as the threshold for glaciers.
For glacial lakes, reflectivity of the blue light is large and it approaches zero for near-infrared, so the gray images are obtained by the normalized difference water index (NDWI) as follows (Zhang et al., 2006):
where pG and pN are the reflectivity of green and near-infrared light, respectively. Similar to the NDSI, we set NDWI > 0 for water, which can be used as a criterion to identify glacial lakes since there are no other water bodies in the study area.
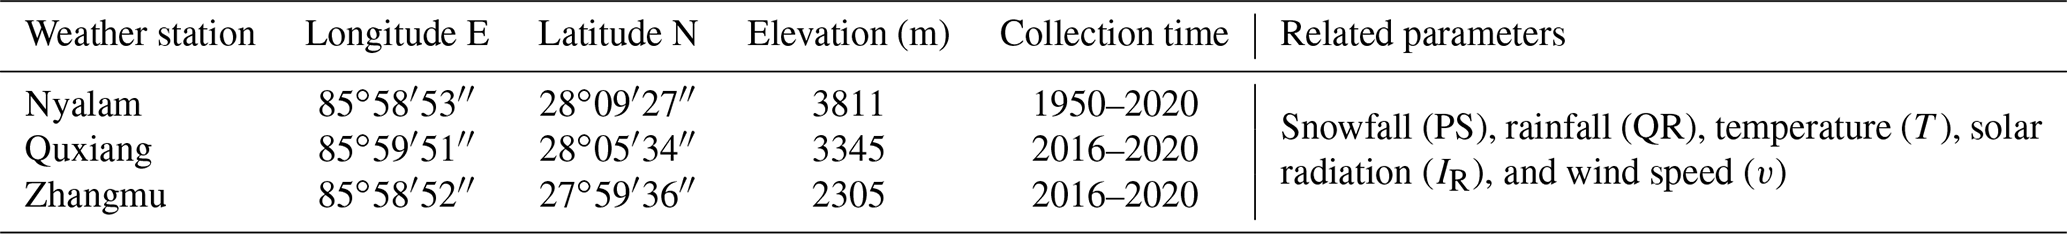
Table 2Information about meteorological stations and meteorological data.
2.2.3 Sources of meteorological data
As glaciers are sensitive to temperature, it is reasonable to consider the effects of weather on the changes in glaciers and glacial lakes. Unfortunately, weather stations are very sparse in the Himalayas, and no stations in the tributaries are under consideration; only records from nearby stations are accessible. Near the study area, we have three weather stations in Nyalam, Quxiang, and Zhangmu at altitudes of 3811, 3345, and 2305 m (Table 2). The Nyalam weather station was built before 1950, while the Quxiang and Zhangmu stations was built as late as 2016, so the data before 2016 in our study are from the National Center (http://data.cma.cn/, last access: 2 October 2021) at the Nyalam station.
Table 3Area distribution of glacial lakes in the Poiqu River basin.

2.2.4 Processing method of meteorological data
The data from weather stations cannot be used directly to represent the lake temperature. All the lakes in study are distant from the stations and located in high-altitude regions with significant differences in elevation. Data correction, especially the altitude correction, is necessary before we analyze the temperature variations (Liu et al., 2014a).
Combining the data from the three stations may comprehensively reflect the weather features of the study area. The key factor for interpolation is the gradient of temperature (RT) varying with elevation. To obtain the RT, we take the records of Nyalam and Zhangmu in 2016. The daily average temperature TT is defined as follows:
where TN and TZ are the daily average temperature in Nyalam and Zhangmu weather station, respectively, and AlN and AlZ are the altitudes of the two stations. Equations (3) and (4) give the RT of −6.1 .
Then, the interpolated temperature for the target point can be obtained in the same way, as follows:
where the subscript H means the altitude of the target points (i.e., the tributary rivers or the glacial lakes), and 0 indicates the recorded values.
2.3 Distribution of glacial lakes in the Poiqu River basin
According to the ZY-3 satellite image of 28 August 2019, a total of 147 glacial lakes and related glaciers have been identified in the Poiqu River basin (Fig. 1), with the area ranging from 0.0002 to 5.5 km2, which is a total of 19.89 km2. There are 55 lakes greater than 0.02 km2 in area, accounting for 19.24 km2. For comparison, the lake number in 2001 was 49, and the total area was 17.61 km2 (Chen et al., 2007).
Lakes larger than 0.1 km2 are mainly in the tributaries of Keyapu, Rujiapu, and Chongduipu in upper Poiqu and in Zhangzangbu in middle Poiqu. More than half of the lake area is located in Chongduipu, approximately 9.51 km2, and the second largest is Keyapu at approximately 5.44 km2. These lakes account for 83 % of the total area of glacial lakes (Table 3).
Table 4Altitude distribution of glacial lakes in the Poiqu River basin.
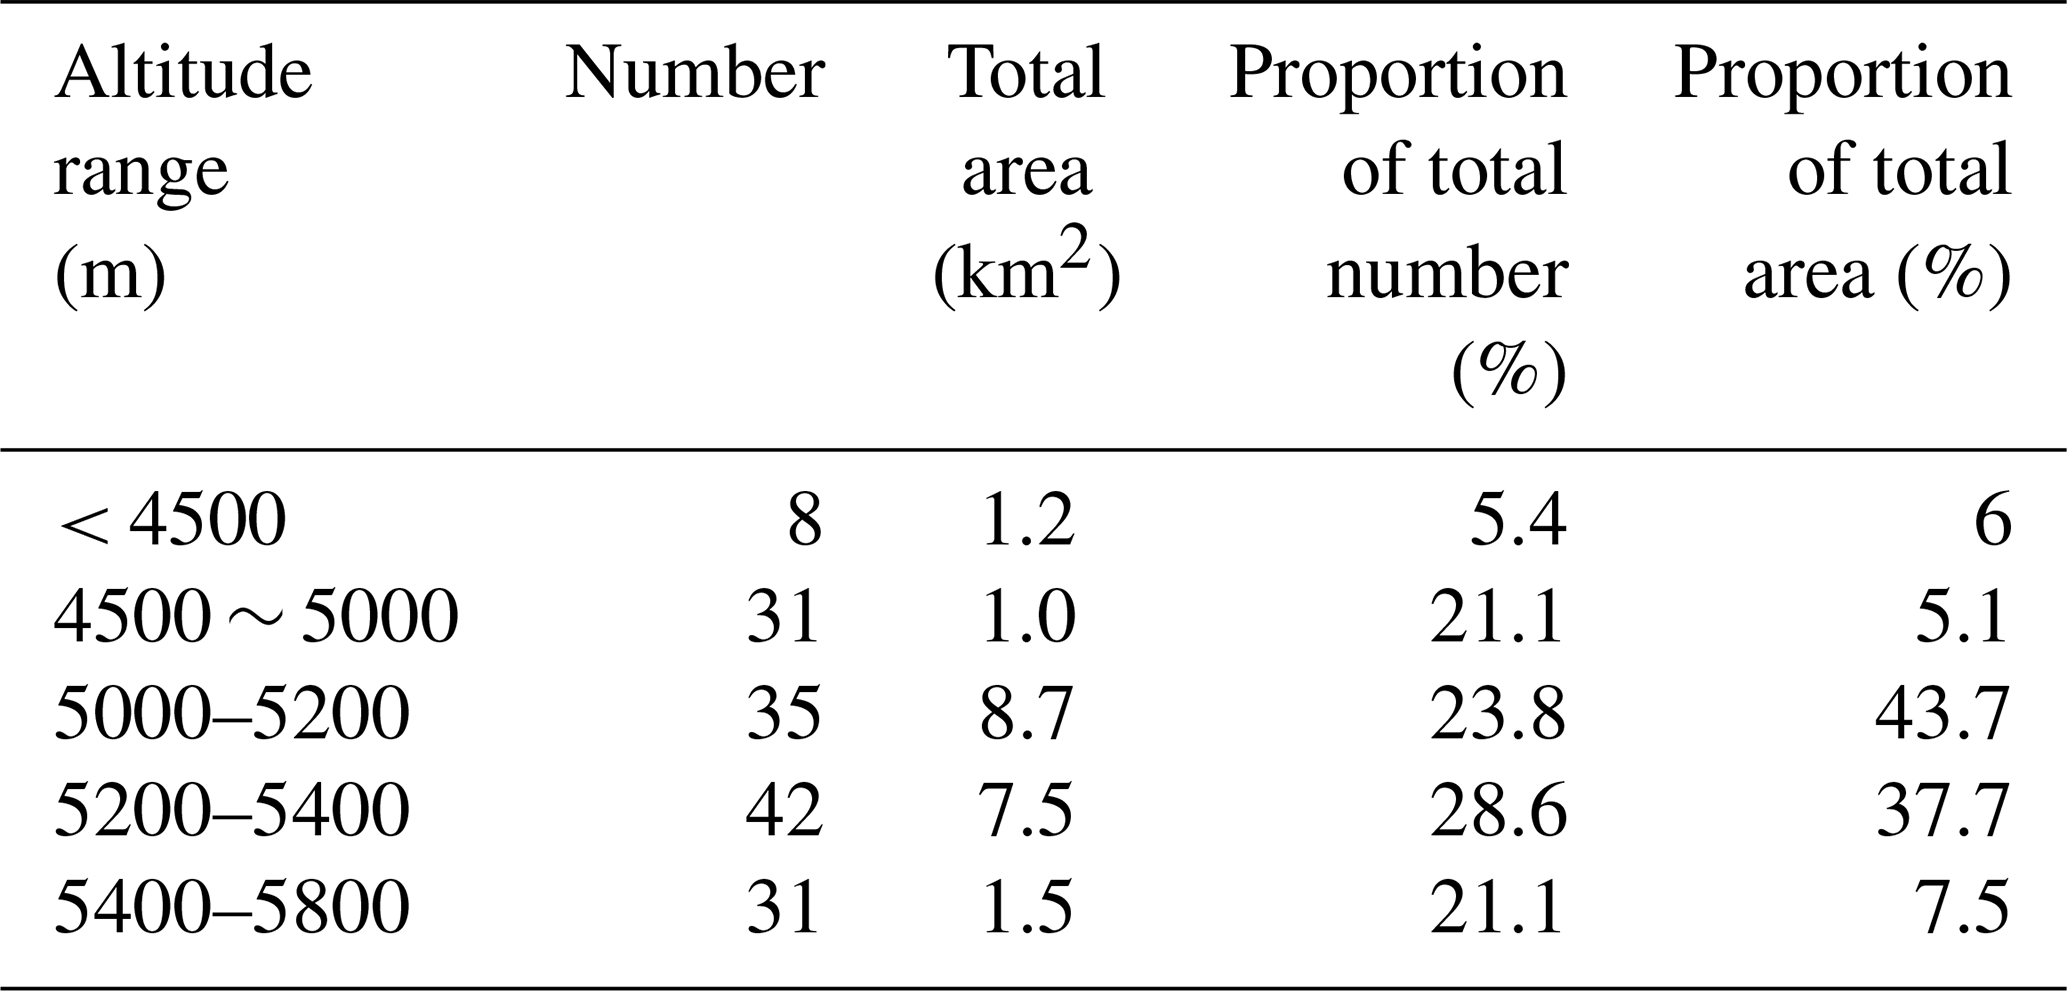
The lakes are distributed between 4200 ∼ 5800 m and concentrated at 5000 ∼ 5800 m, coinciding with the range of maximal retreat of glaciers (Ji et al., 2020). More than 84 % glaciers are located between 4800 ∼ 6200 m (Table 4). This fact suggests that the meltwater from glaciers has supplied the lakes.

There are moraine lakes, glacial erosion lakes, ice surface lakes, and cirque lakes in the area, and moraine lakes dominate (Table 5).
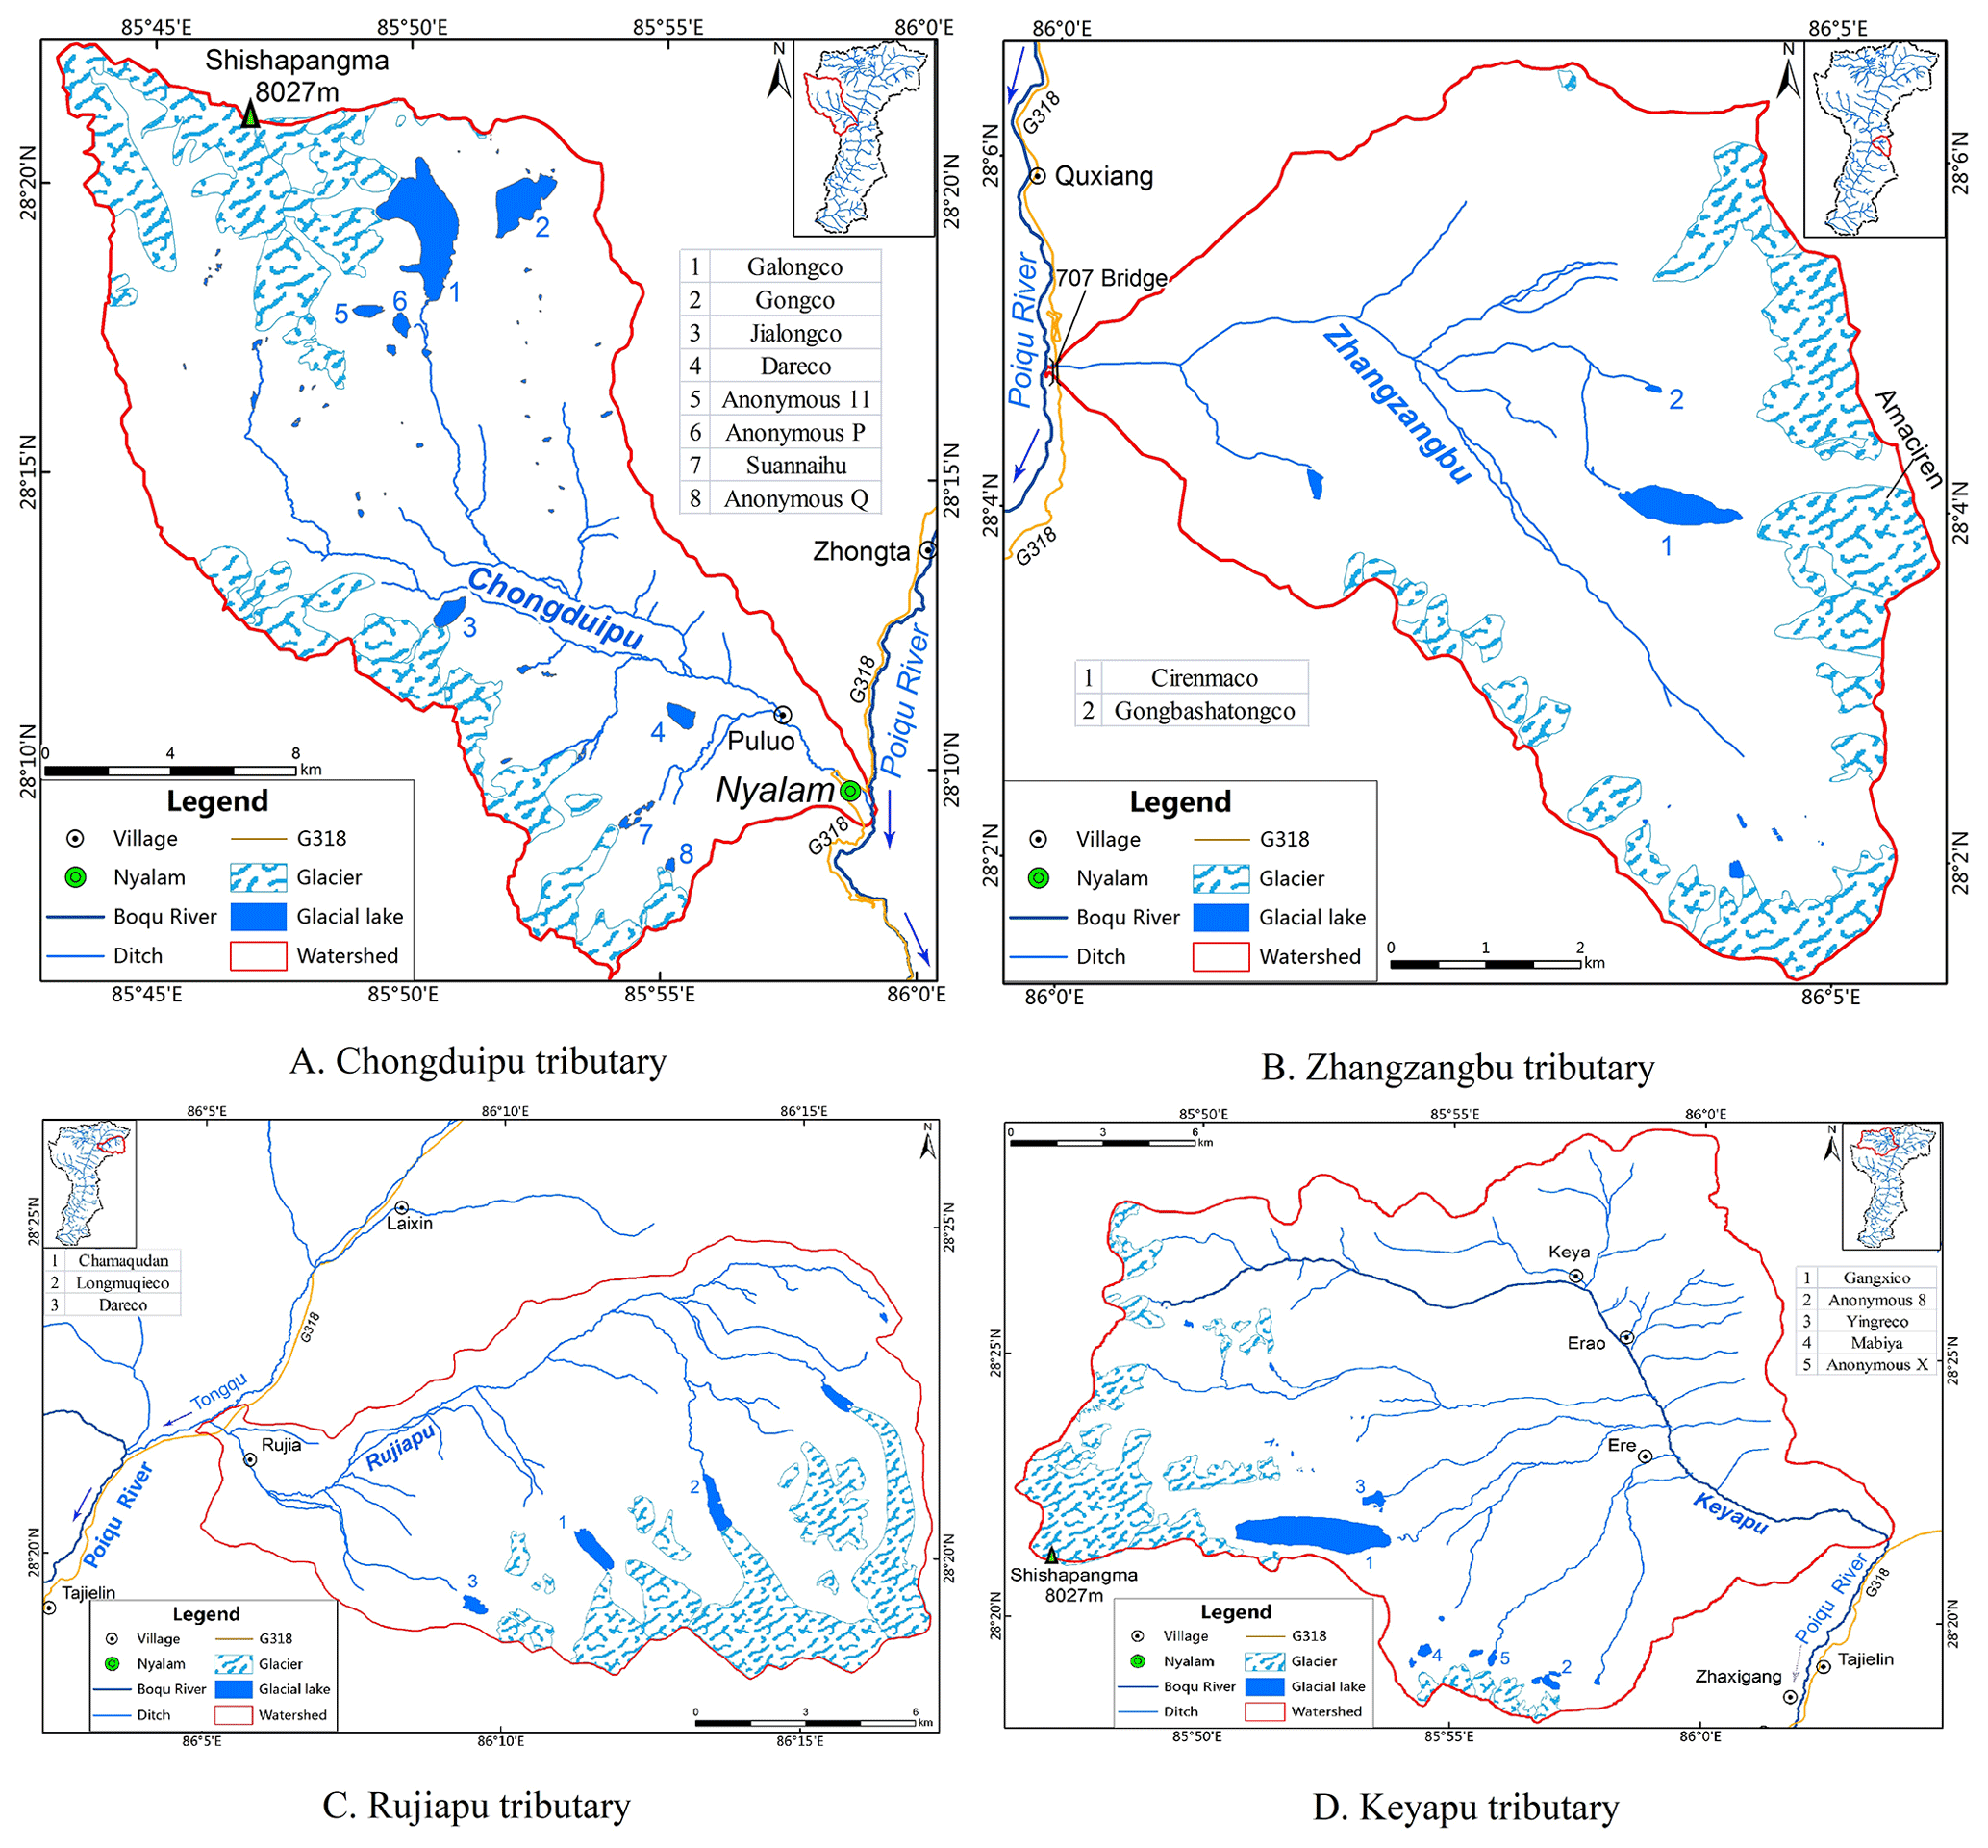
Figure 3The distribution of glaciers and glacial lakes in the four major tributaries of the Poiqu River basin.
3.1 The five typical glacial lakes
In order to explore the detailed evolution processes of glacial lakes, we take the case studies of five large (> 0.3 km2) glacial lakes, i.e., the Galongco Lake (5.50 km2), the Gangxico Lake (4.63 km2), the Jialongco Lake (0.64 km2), the Longmuqieco Lake (0.54 km2), and the Cirenmaco Lake (0.31 km2).
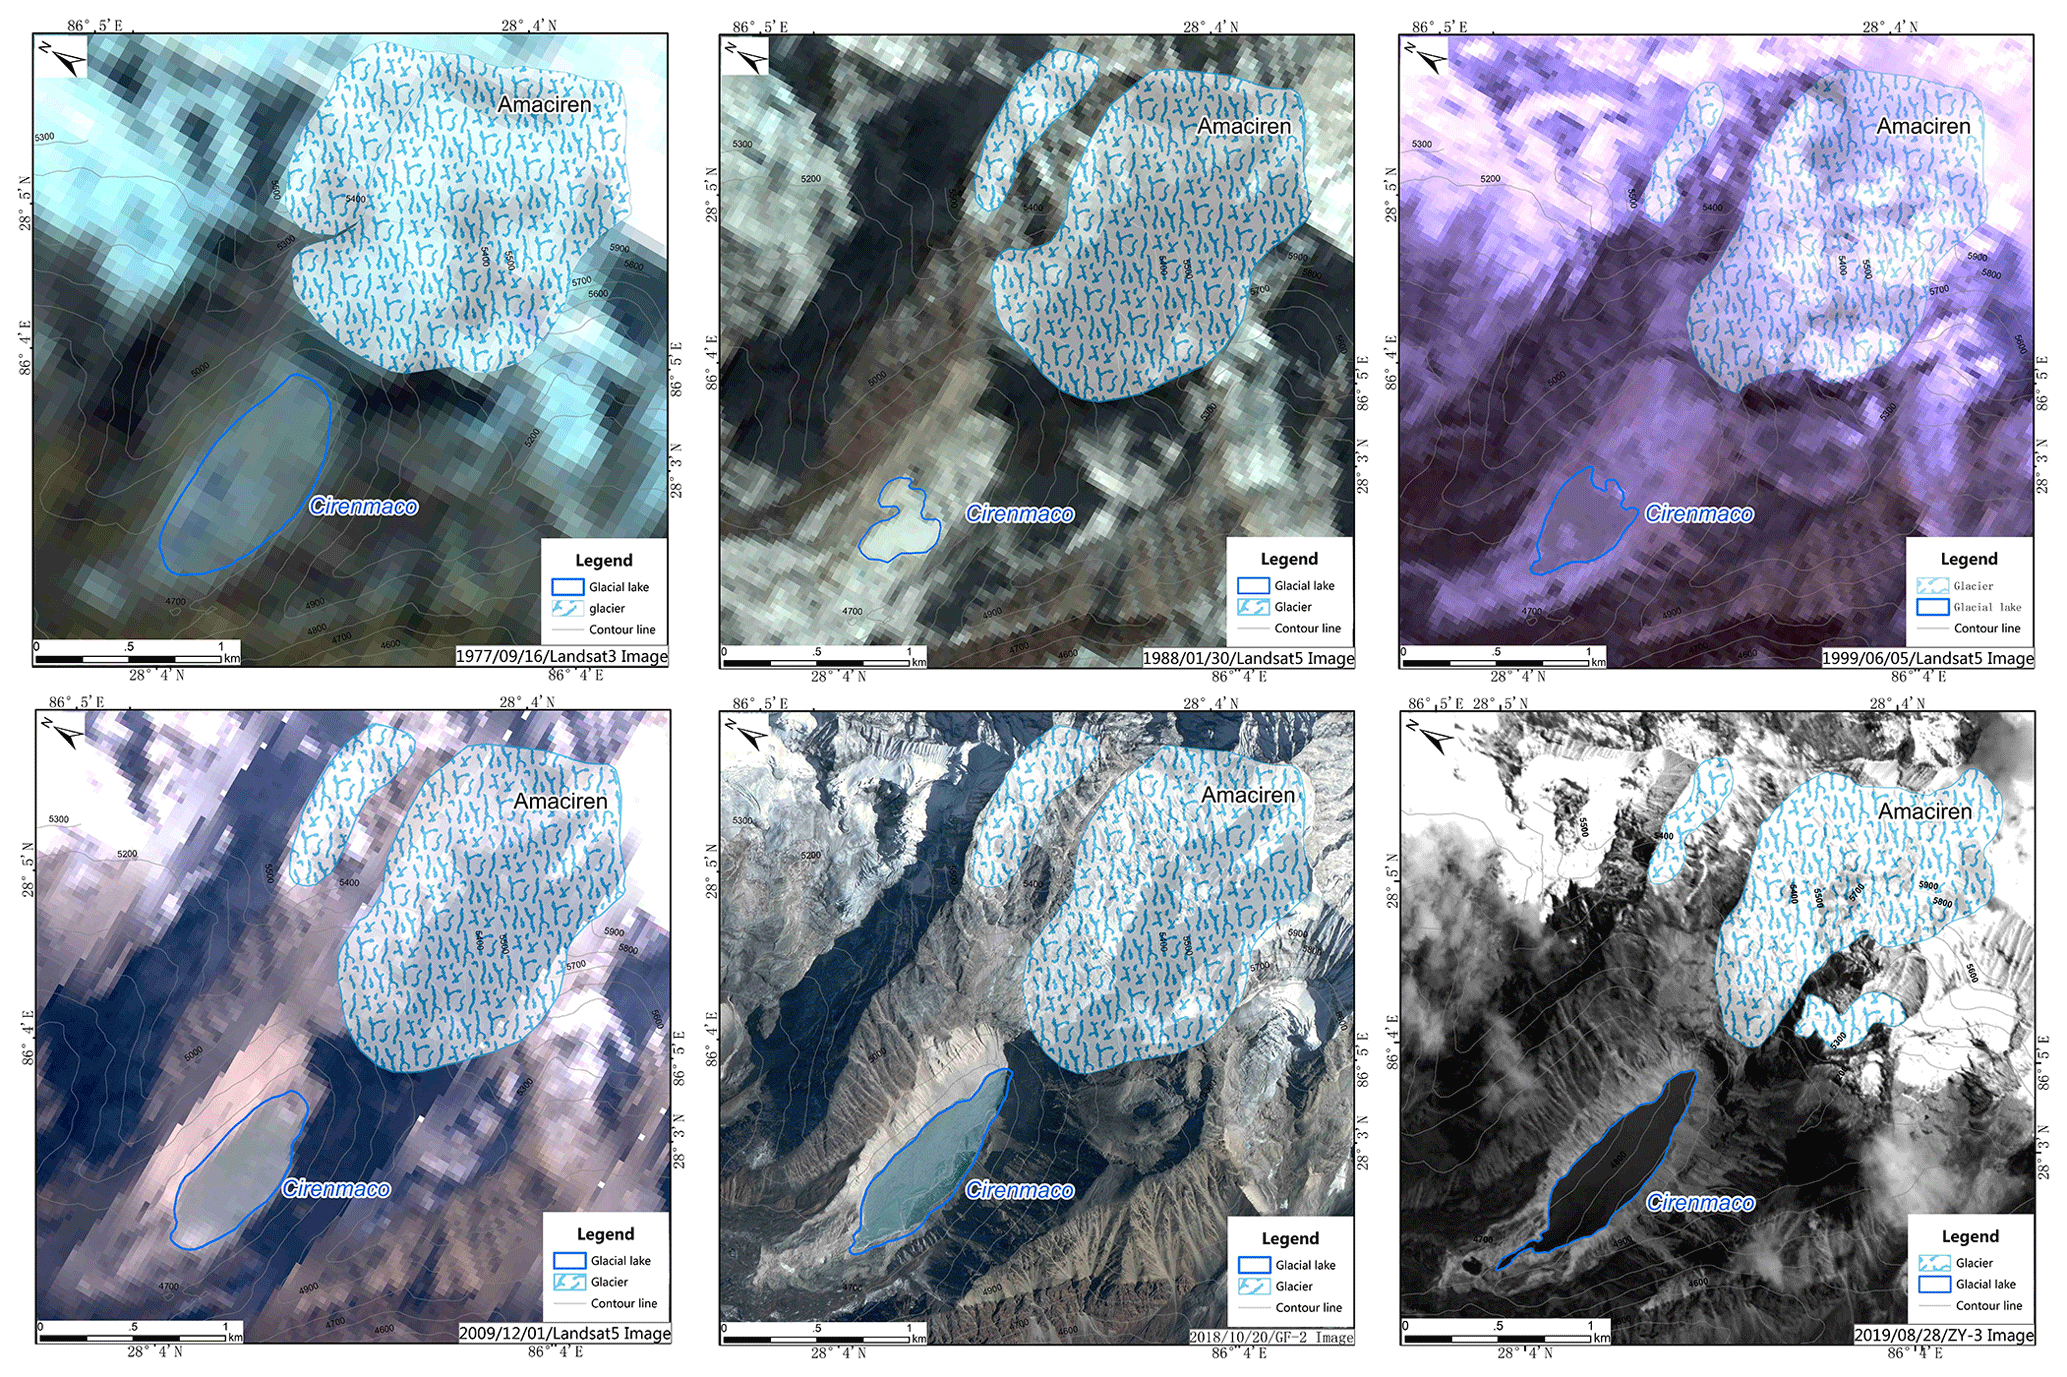
Figure 4A comparison of the area change between the Cirenmaco Lake and its connected glacier.
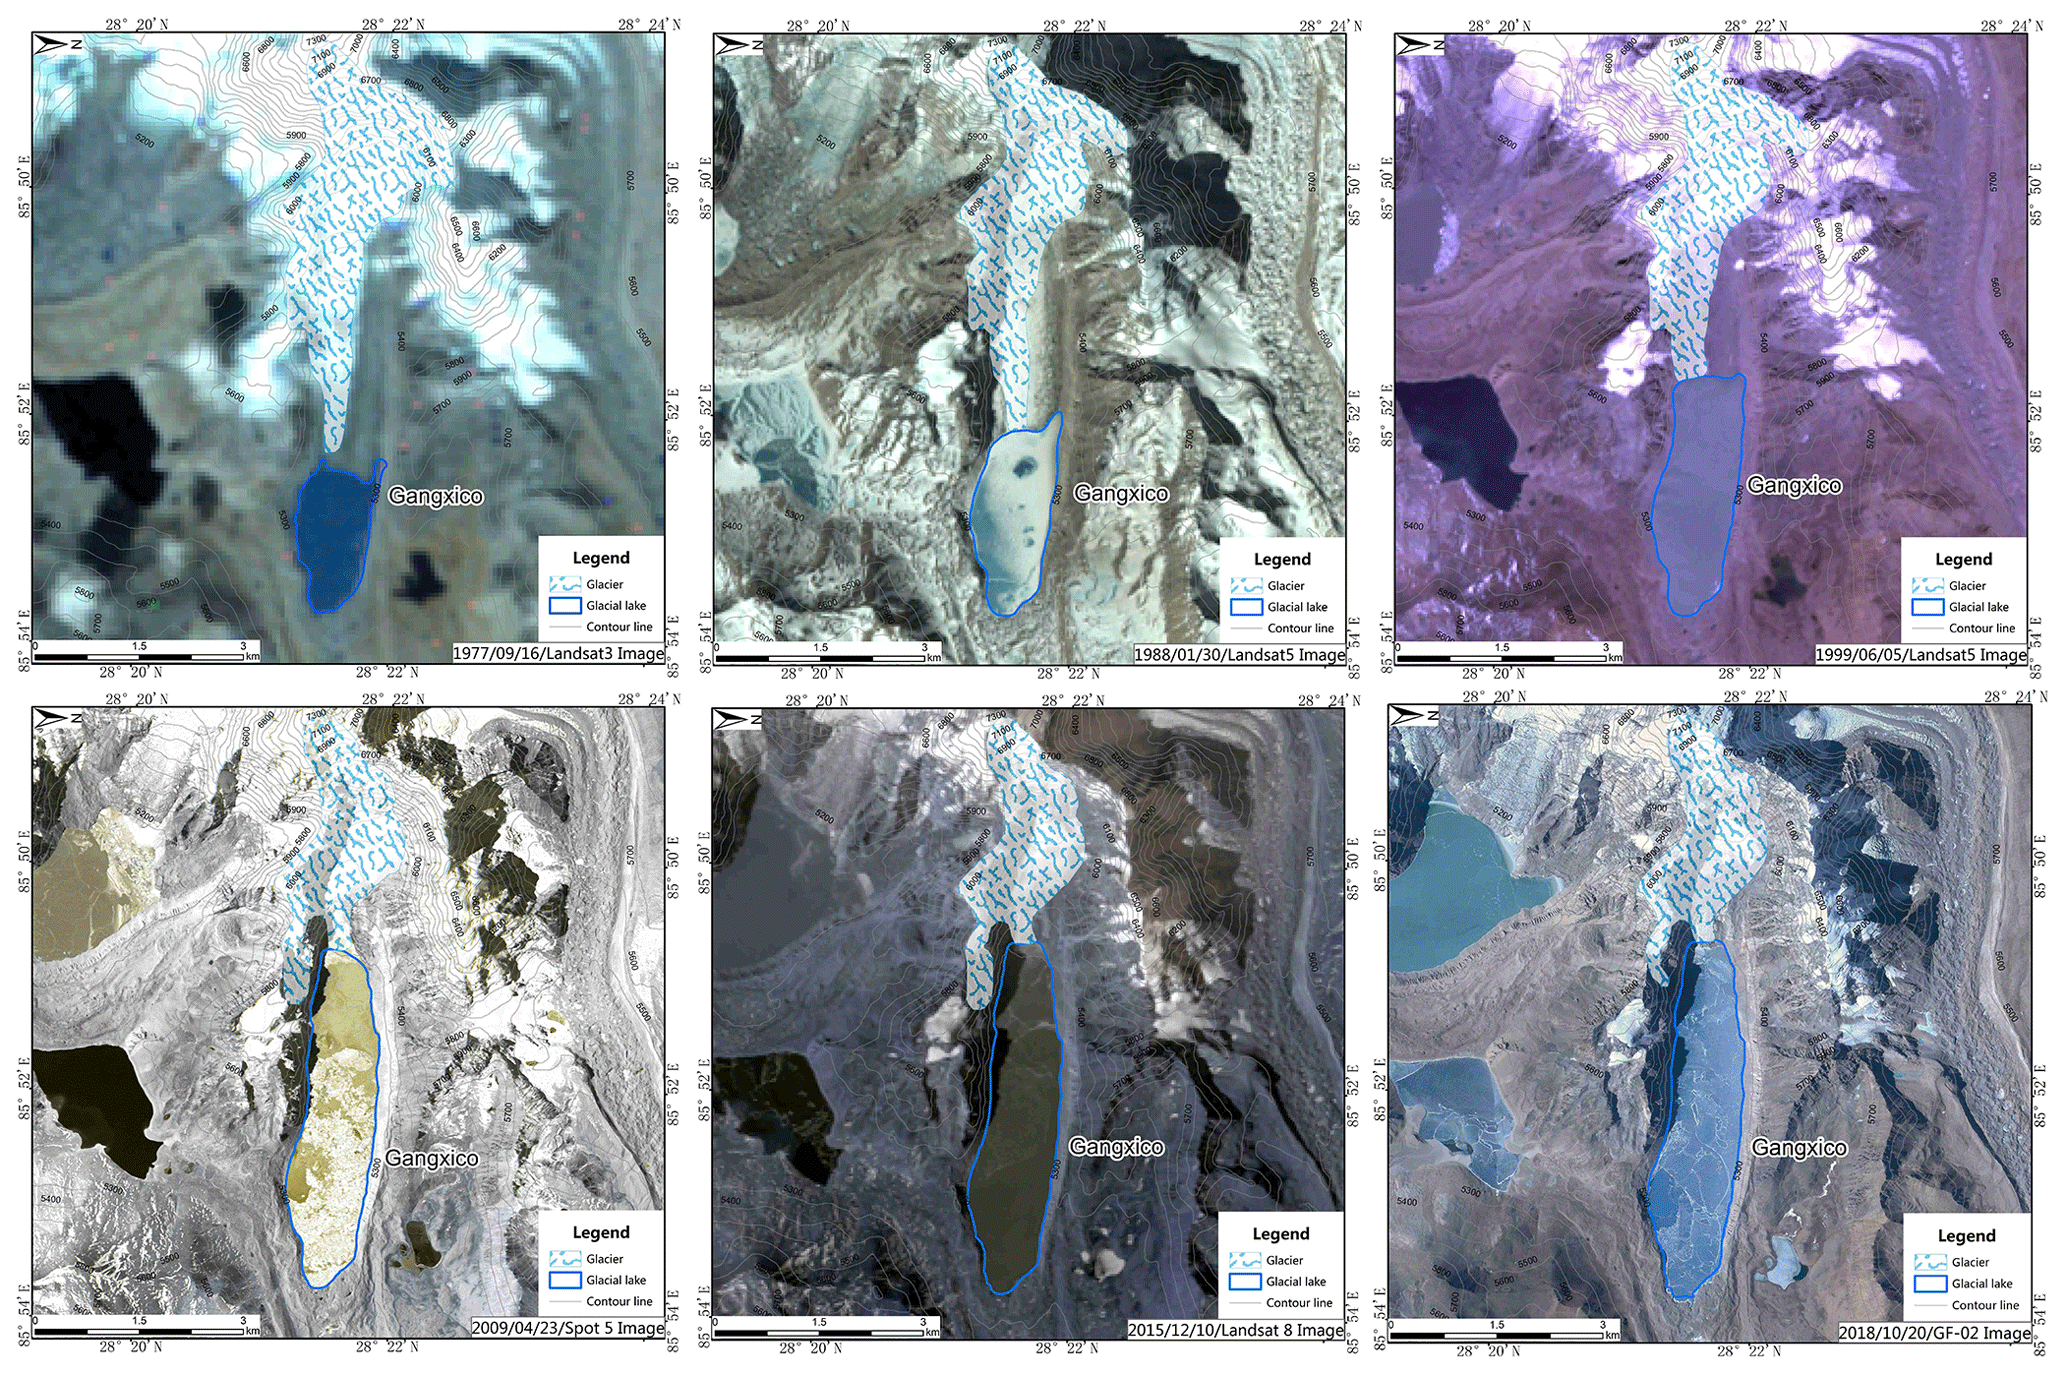
Figure 5A comparison of the area change between the Gangxico Lake and its connected glacier.
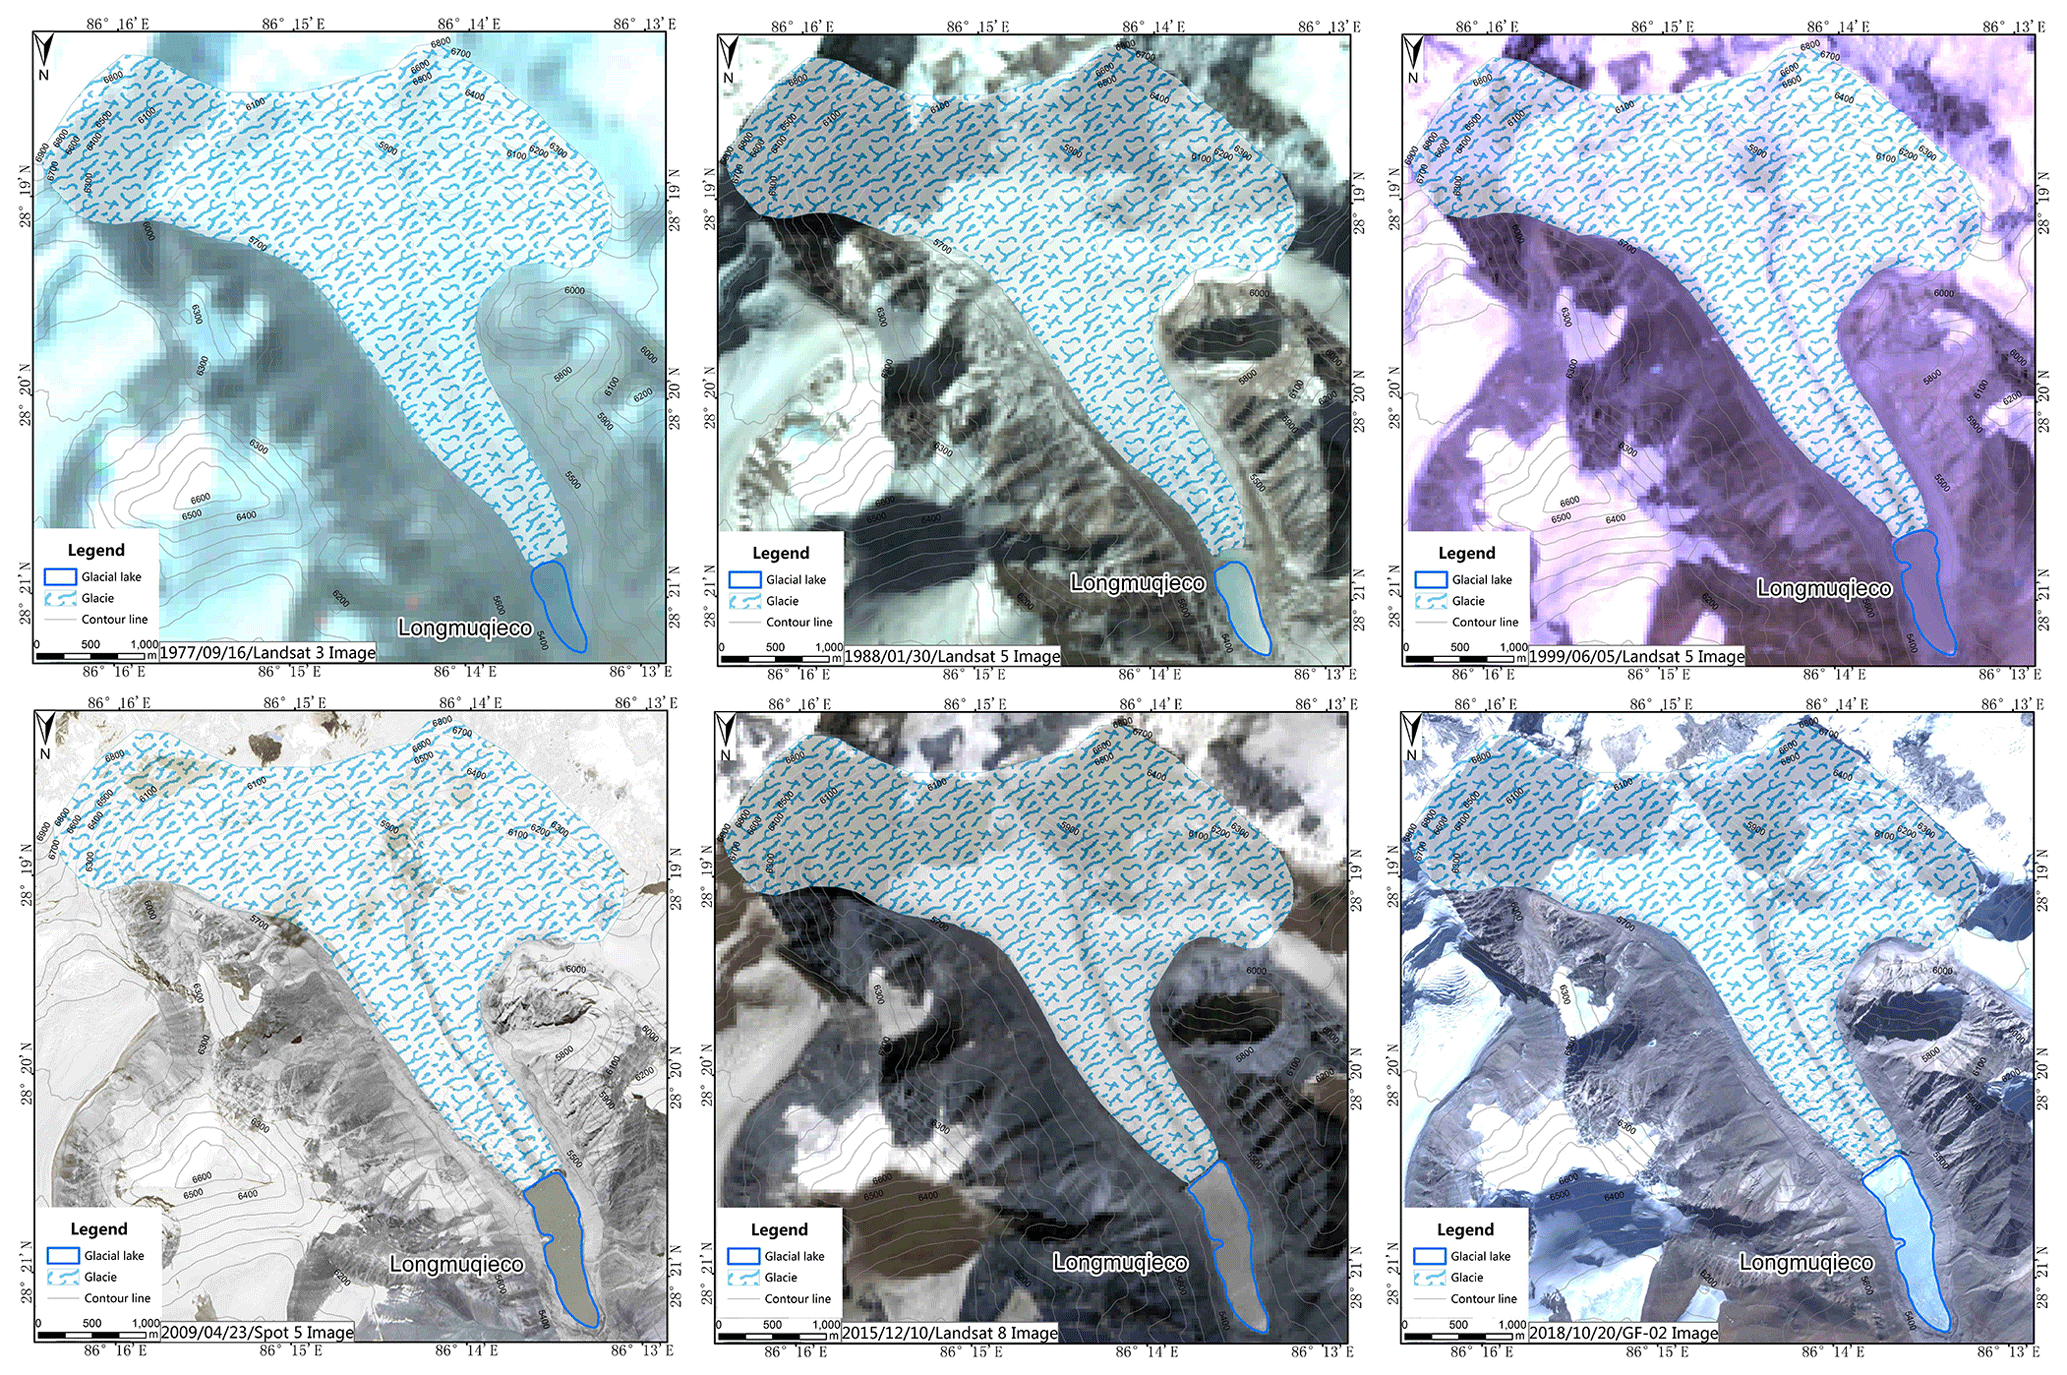
Figure 6A comparison of the area change between the Longmuqieco Lake and its connected glacier.
These lakes are located in the following four major tributaries with a high concentration of glacial lakes: Chongduipu, Keyapu, and Rujiapu and Zhangzangbu (Fig. 3). And Figs. 4–6 show the Cirenmaco, Gangxico, and Longmuqieco lakes and their related mother glaciers that are associated with their generation and water supplies, including pictures in different years between 1977 and 2018.
-
Chongduipu lies in the western part of the middle of the Poiqu River, with a long, lobate form and U-shaped channel, which flows from northwest to southeast. Chongduipu has four tributaries, and the largest glacial lake, Galongco, is located in the Jirepu tributary and supplied by the Jipuchong glacier on the southeastern slope of the Shishapangma mountain.
-
Zhangzangbu joins Poiqu from the east in the middle reach in the form of broad branches and V-shaped channels, which deeply cut the valley and leave flow marks of approximately 30 m. Glaciers are mainly distributed in the upper reaches, and Cirenmaco Lake is located in a tributary in the eastern source area.
-
Rujiapu is a tributary of Tongqu and, thus, a secondary tributary of Poiqu. Rujiapu lies in the eastern part of the upper reaches, forming long branches and U-shaped channels. It has a 90∘ turn near the mainstream, flowing from northeast to southwest, and the glacial lakes are concentrated in the southeast. Moreover, the Rujiapu tributary has four tributaries with distributions of glaciers and lakes.
-
Keyapu lies in the upper western part of Poiqu, near Chongduipu in the source area. Keyapu has broad branches and a U-shaped channel. Glaciers and glacial lakes are mainly distributed in the southeast.

Table 7Basic parameters for major glacial lakes in the Poiqu River basin.
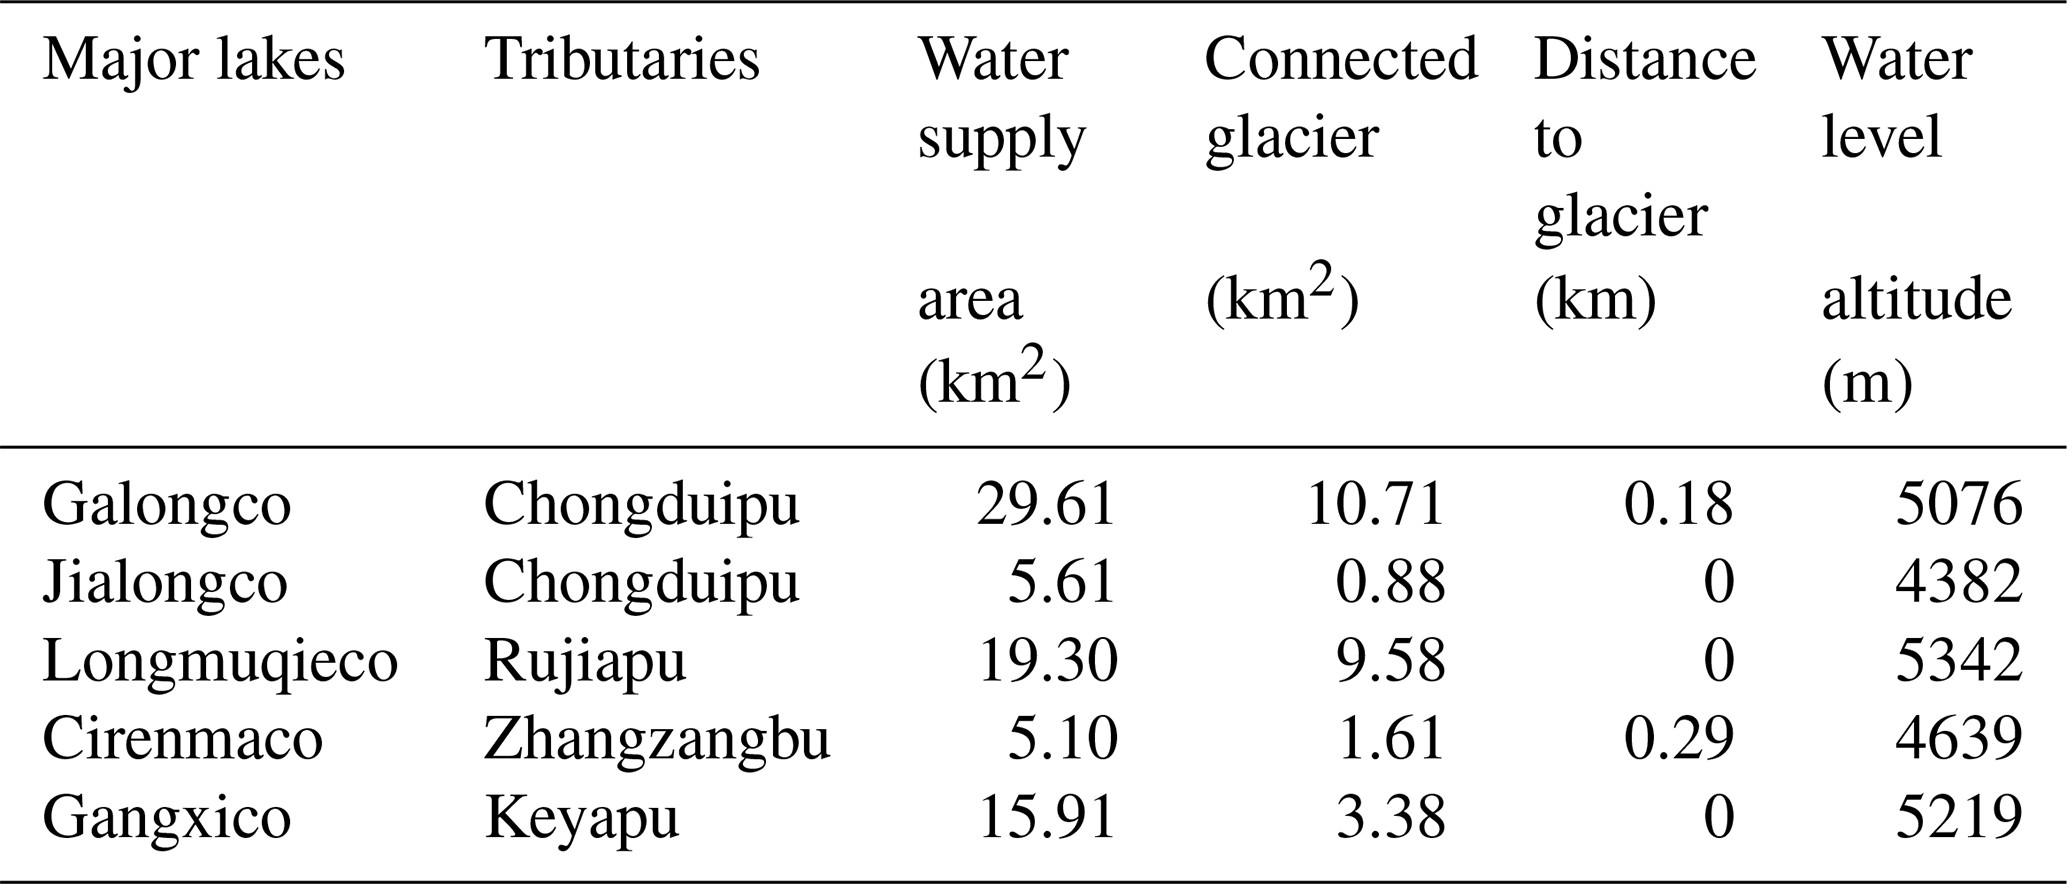
Table 6 lists the basic parameters of the tributaries, which are crucial for the formation and evolution of the lakes, and Table 7 lists the parameters for the major lakes in the present state, based on the interpretation of images in 2018. Table 7 also lists the distance of the lake from its connected glacier, indicating that most lakes are nearly linked to the glacier, and thus, their changes are expected to be well correlated.
3.2 Change in lake area
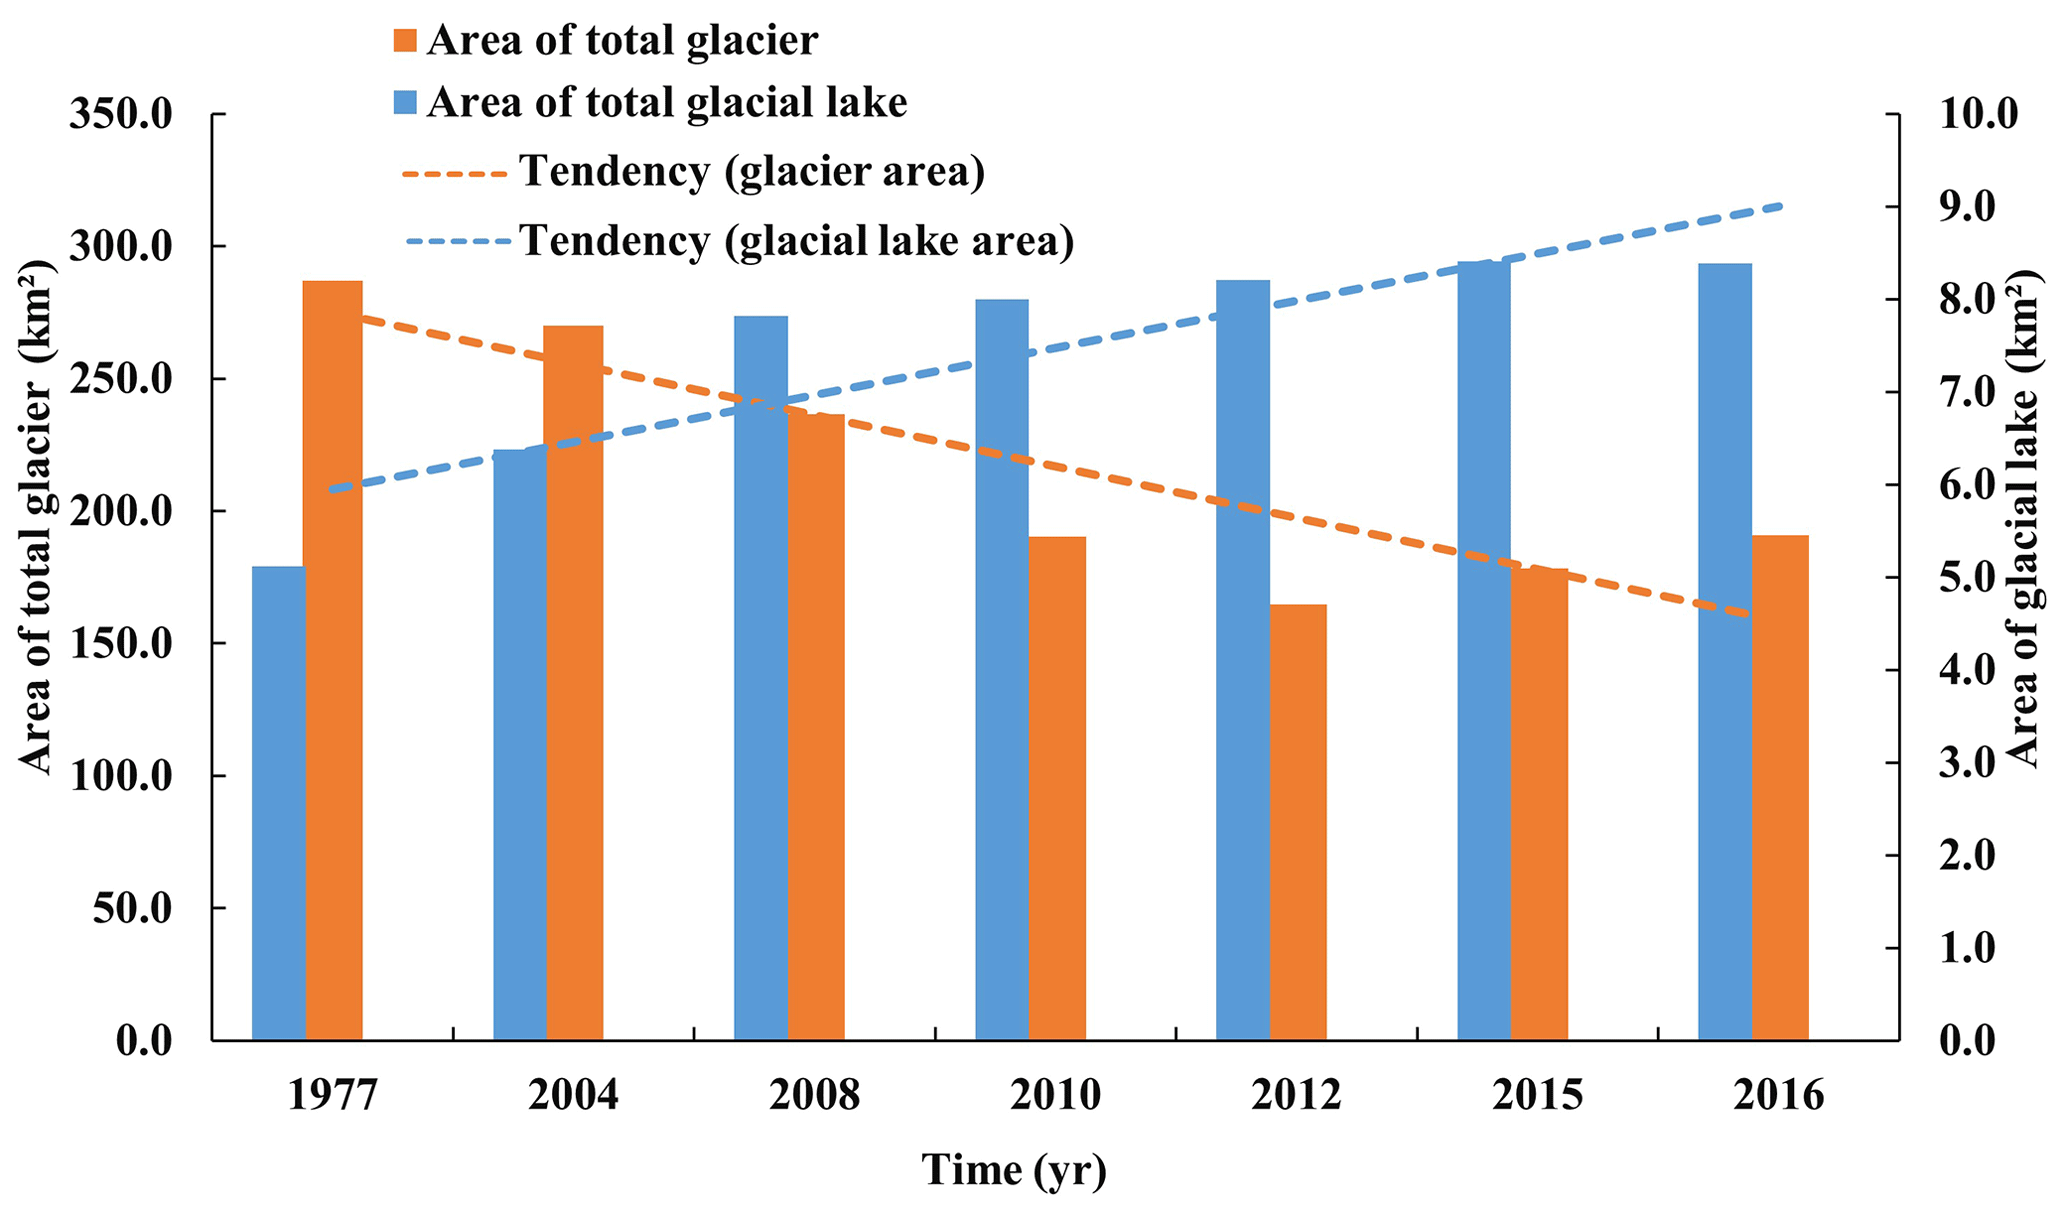
We may trace the lake variations using multisource images. Figure 7 shows the total area changes in the five lakes and related glaciers since 1977; the dotted line means that the curve is inferred only because of the lack of data before 1999, and the gross tendency of glacier loss and glacial lake growth is clear. The retreat of glacier area reaches 31.2 %, at a rate of 2.91 km2 a−1; accordingly, the glacial lake area has expanded by 166 %, at a rate of 0.17 km2 a−1. Since 2004, the retreat rate has reached as high as 5.0 km2 a−1, while the growth rate of lake has reached 0.24 km2 a−1 (in Table 8). These are comparable with the results in literatures. For example, from 1975 to 2010, glaciers decreased by 19 % in area (Xiang et al., 2014), while glacial lake area increased by 83 % (0.26 km2 a−1) from 1976 to 2010 (Wang et al., 2015). In 1986–2001, the glacial area increased by 47 % (0.37 km2 a−1; Chen et al., 2007).
Table 8Area changes in the 5 typical glacial lakes and their glaciers since 1977.
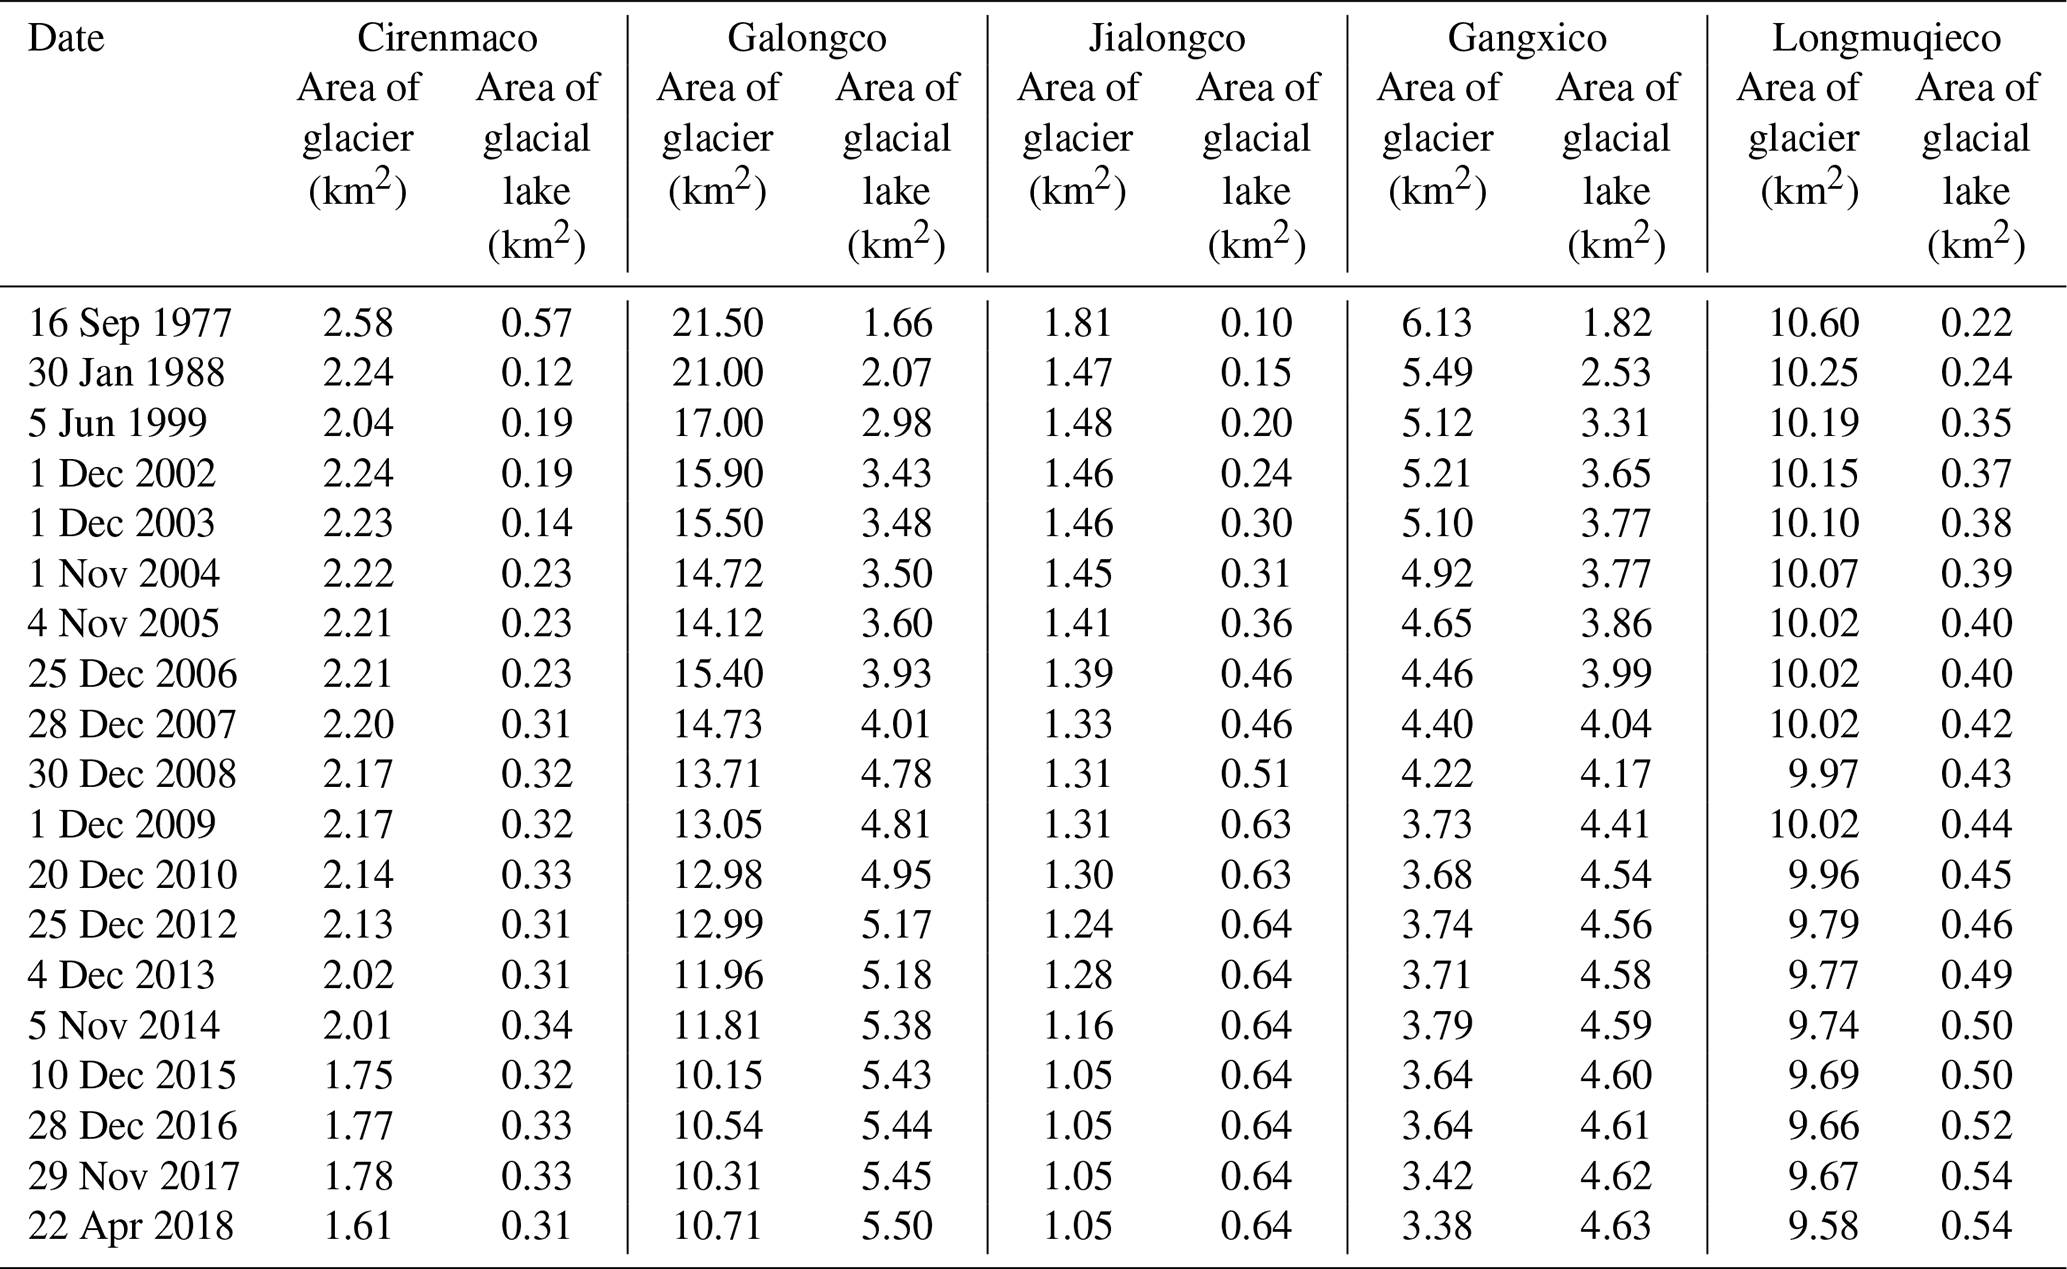
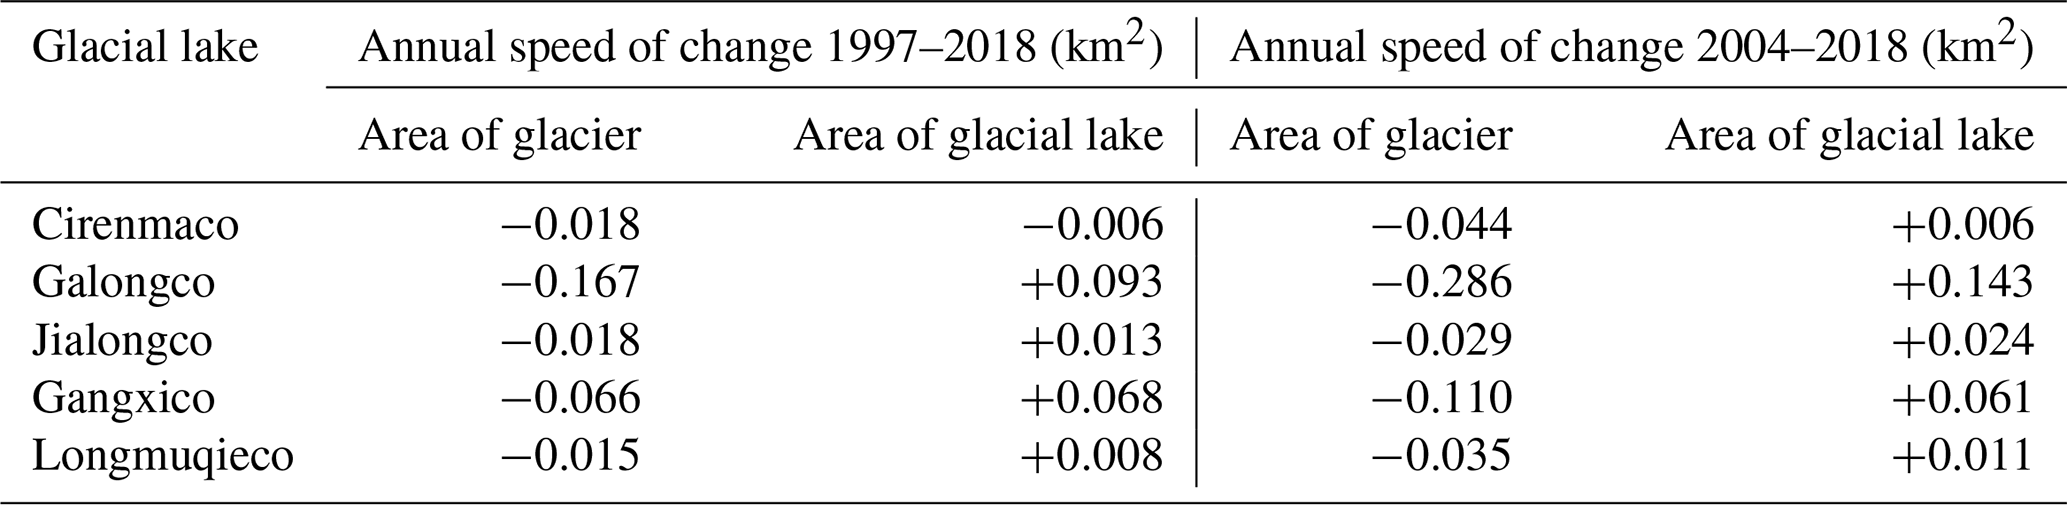
Table 9Annual rates of change in five typical glacial lakes and their glaciers.
For comparison, glacial lakes increased by 29.7 % in the entire Chinese Koshi River (including Poiqu and six other tributary rivers) in 1976–2000 (Shrestha and Aryal, 2011; Wang et al., 2012) at a rate of 1.6 km2 a−1. In the Koshi River, the glacier area has decreased by 19 % (23.48 km2 a−1), and the glacial lake area has increased by 10.6 % (Shangguan et al., 2014; Xiang et al., 2018). In 2000–2010, the glacial lake increased by 6 % in area (0.72 km2 a−1; Wang et al., 2015). This result means that Poiqu undergoes more dramatic changes in glaciers and glacial lakes. Specifically, the Cirenmaco, Galongco, Jialongco, Gangxico, and Longmuqieco lakes, have increased up to −54 %, 313 %, 640 %, 254 %, and 245 % at rates of −0.006, 0.094, 0.013, 0.069, and 0.008 km2 a−1, respectively, from 1977 to 2018. For each lake, the retreat–growth correlation is clearly shown in Table 9 and Fig. 8. Notably, there was a sudden decrease in area in 1981, simply because there was an outburst flood (Xu and Feng, 1988). Thus, historical anomalies in glacial lake areas may be caused by lake outburst floods.
As an illustration, Fig. 9 shows the variation in Galongco Lake since 1977, which increased abruptly from 1.66 to 5.50 km2 from 1977 to 2018. The left image is from Google Earth and the right image (overlain) of the Galongco Lake is from a UAV image.
Corresponding to the decrease in glaciers, the variations in glacial lakes under consideration have presented the following three patterns in recent years:
-
Fluctuation in area, as in the case of the Cirenmaco and Jialongco lakes
Both lakes are located at relatively low altitudes (Jialongco is at 4382 m, and Cirenmaco is at 4639 m), are sensitive to temperature, and both experienced an outburst flood in this episode (in 1981 and 2002, respectively) and then increased steadily. Jialongco Lake even experienced a sudden rise during 2006 and 2008 (Fig. 10), when the local temperature reached its 50-year peak. Moreover, a field survey indicates that Jialongco has an overflow at 0.3 m3 s−1 in the rainy season, meaning that the lake has reached its maximum and, thus, fluctuates, similar to ordinary lakes undergoing seasonal changes. This finding implies that small amounts of variation in glacial lakes do not mean that the related glaciers also vary by small amounts. A dramatic change in glaciers results in a great loss of water but does not necessarily increase the size of the connected lake.
-
Remarkable increase in area, as in the case of the Galongco and Longmuqieco lakes
Historic remote sensing data (1954 ∼ 2018) indicate that Galongco formed in the late 1960s as a result of a warming climate. Then, the lake increased steadily, with no marks of historic outburst floods and no overflow events, based on recent UAV images. Indeed, the lake level is still 10 m below the front moraine bank, and it is only at 1 km downstream that the water flows from infiltration. Thus, the lake has had little loss of water and increases steadily in size. Despite no field survey data, the same case can be expected for Longmuqieco, which has a similar altitude and water supply areas and connected glaciers.
-
Gentle increase in area, as in the case of the Gangxico Lake
The Gangxico Lake is supplied by the back glacier. As the glacier is small, the lake grows slowly. Moreover, the Gangxico Lake is hydraulically connected to the Gongco and Galongco lakes, and its water enters the Gongco Lake in the southern area through infiltration, while the water of Gongco infiltrates into the Galongco (Fig. 11). As the Gongco Lake has remained steady in last 50 years, the Gangxico Lake is also in a balanced state and shows a small tendency to increase.
These observations suggest that glacial lakes change in various patterns, even under the same local conditions. Furthermore, little variation in glacial lake area does not necessarily mean that there are no changes in related glaciers. In this sense, glaciers are more sensitive to changes in weather or climate.
3.3 Relation to temperature and precipitation
The temperature in Poiqu has risen at a rate of 0.02 between 1989 and 2018, accompanied by a rainfall rate of 0.76 mm a−1. Figure 12 shows the temperature series in the last 40 years in contrast to the areas of the five lakes and the related glaciers, indicating that the temperature is negatively and positively related to glaciers and glacial lakes. Figure 13 shows the precipitation series in contrast to the areas of glaciers and glacial lakes, indicating that the tendency of precipitation is negatively associated with glaciers but positively associated with glacial lakes. In short, the growth of glacial lakes following the retreat of glaciers is governed by warming conditions.

Figure 8The retreat of the five typical glaciers, growth of five typical glacial lakes, and rates of change in the Poiqu River basin.
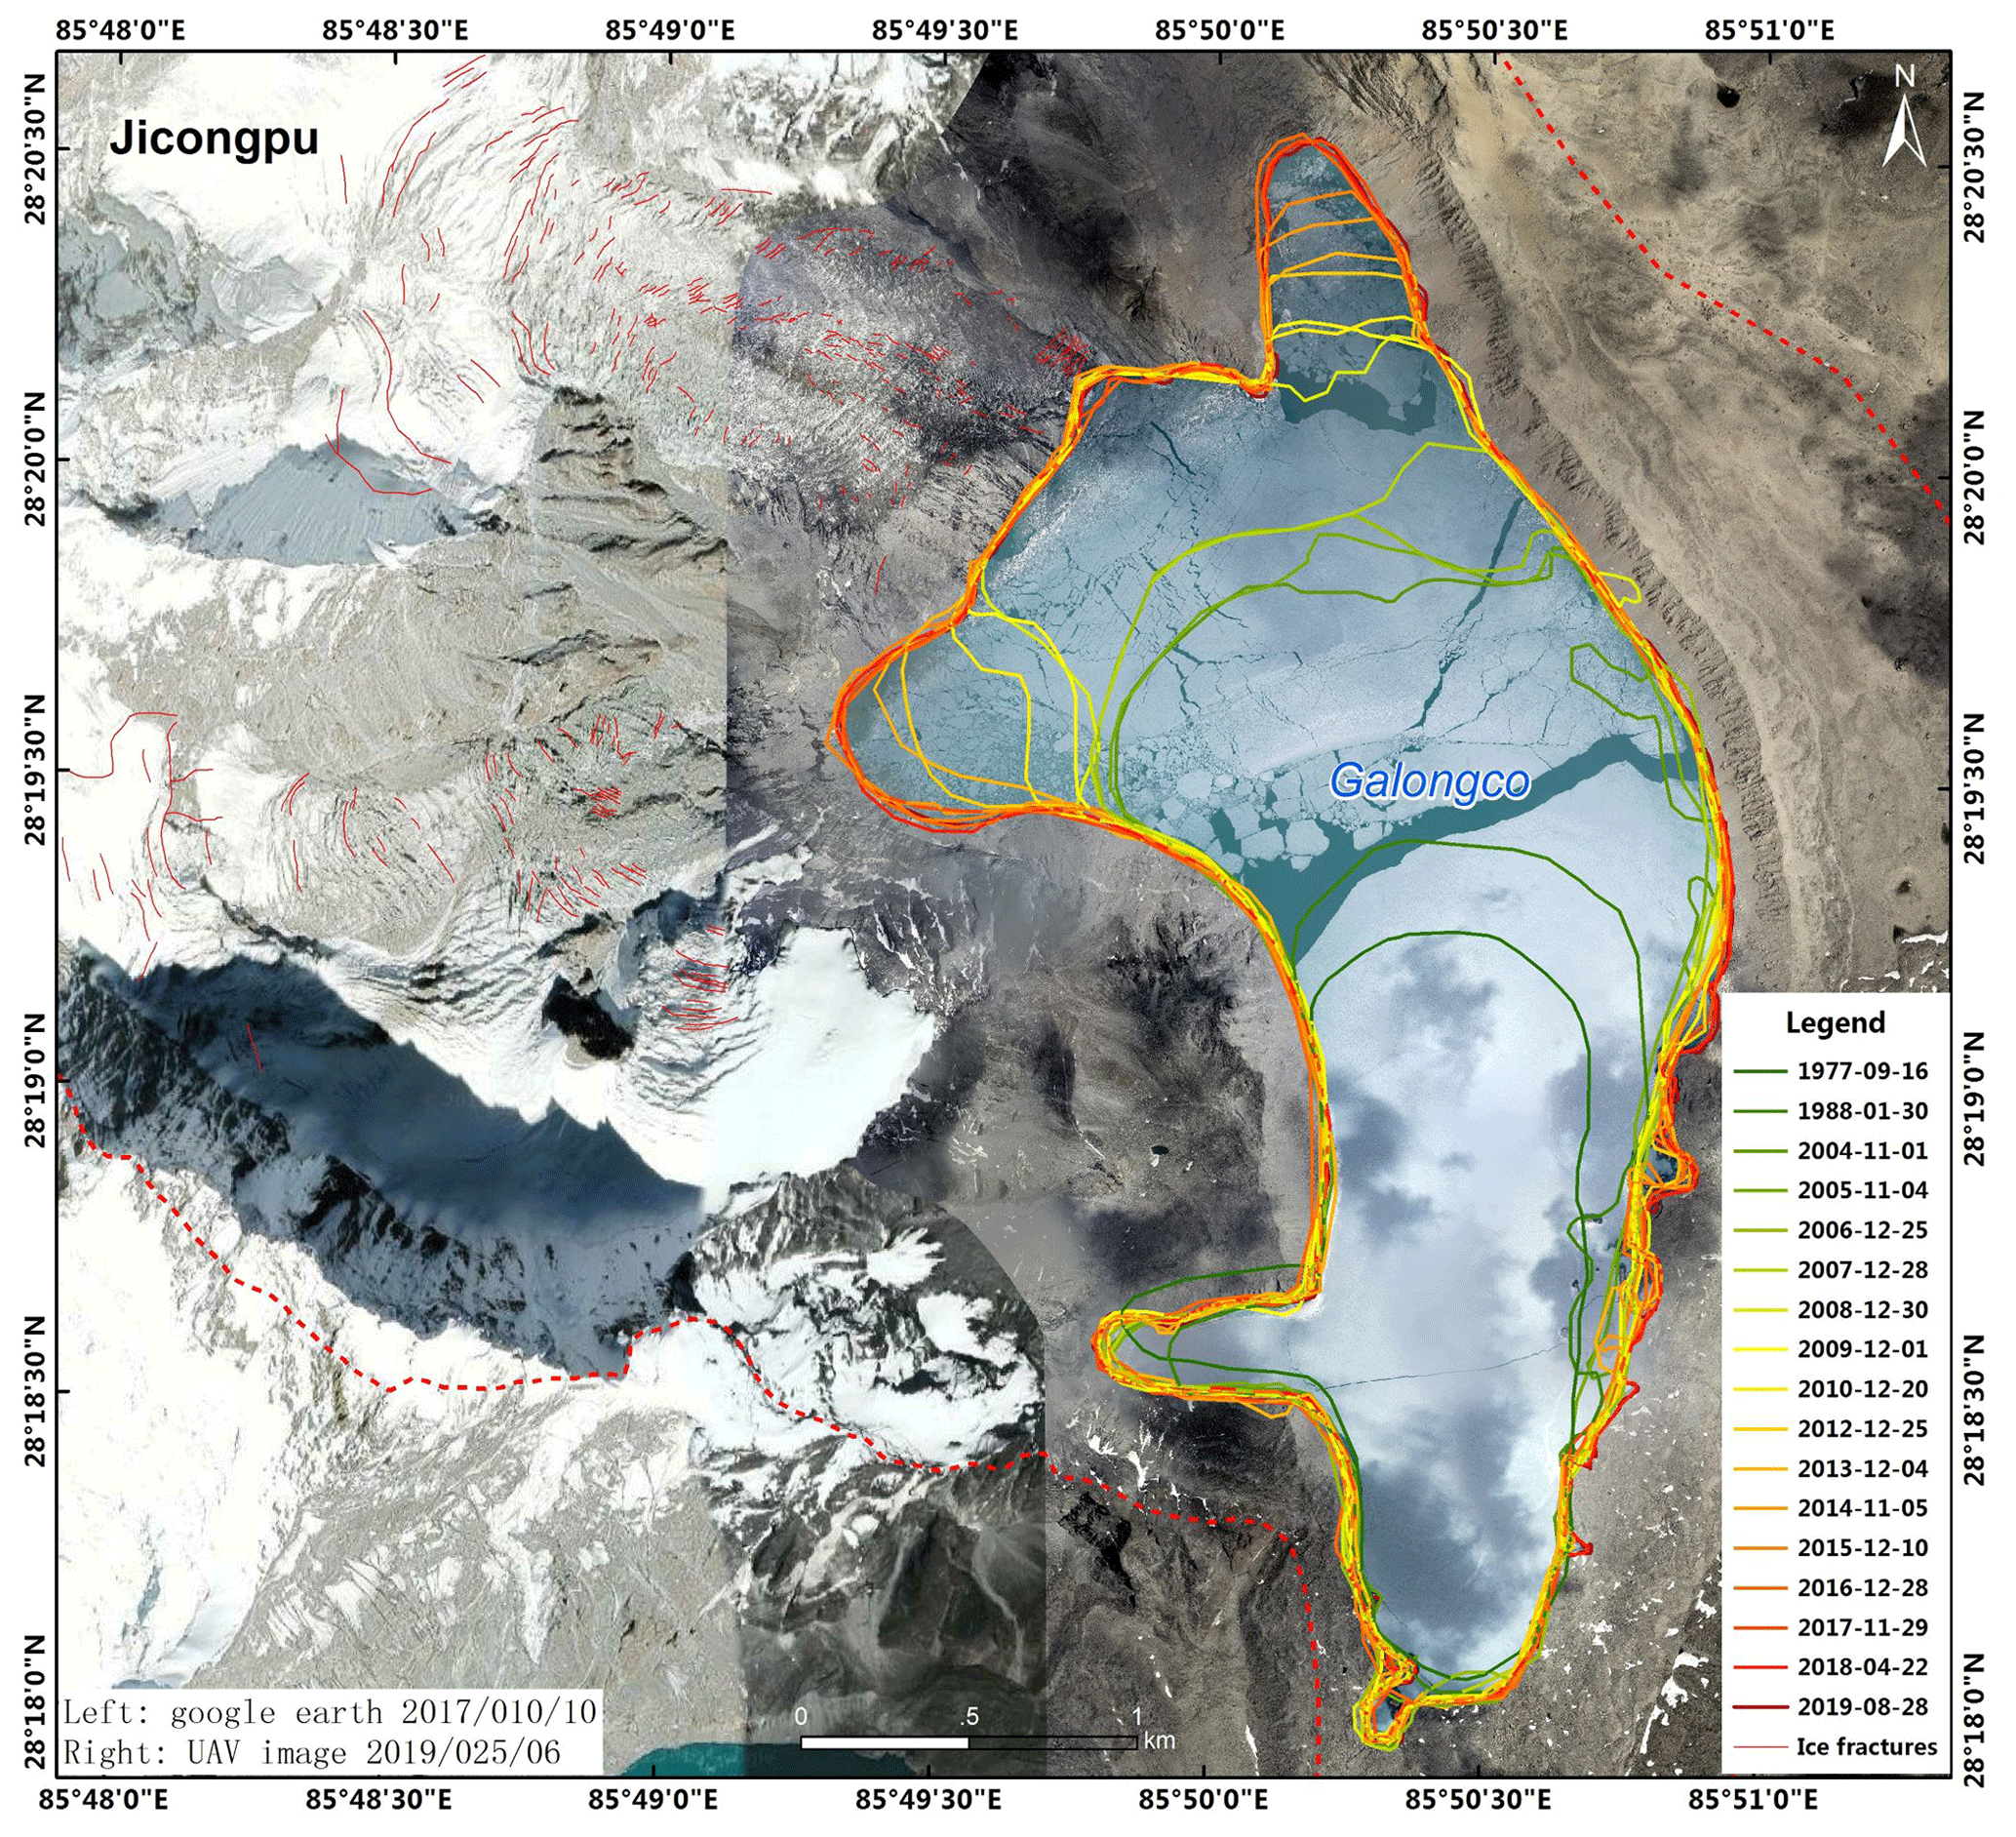
Figure 9The variation in the area of Galongco Lake (1977–2019). The left image is from Google Earth, and the right image (overlain) of the Galongco Lake is from a UAV image.
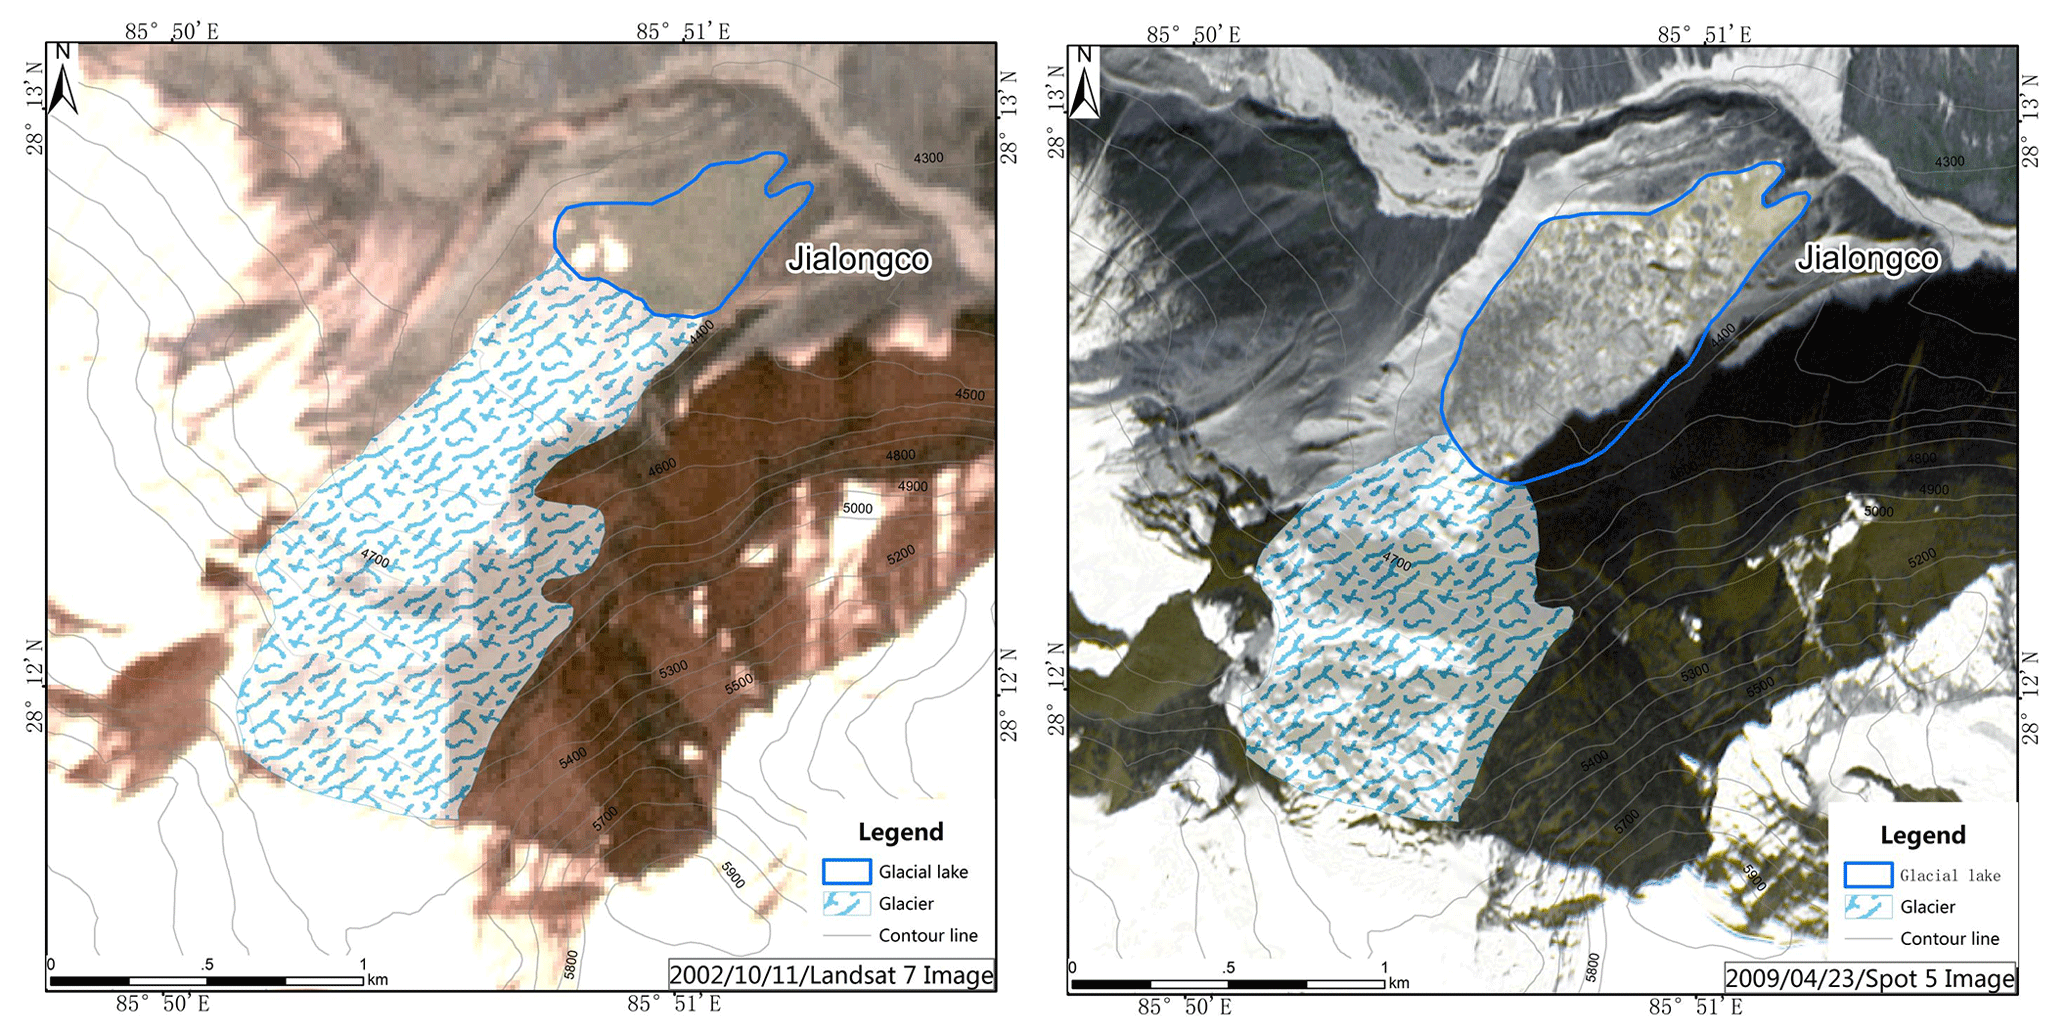
Figure 10The Rapid expansion in the area of the Jialongco Lake due to glacial loss (2002–2009).
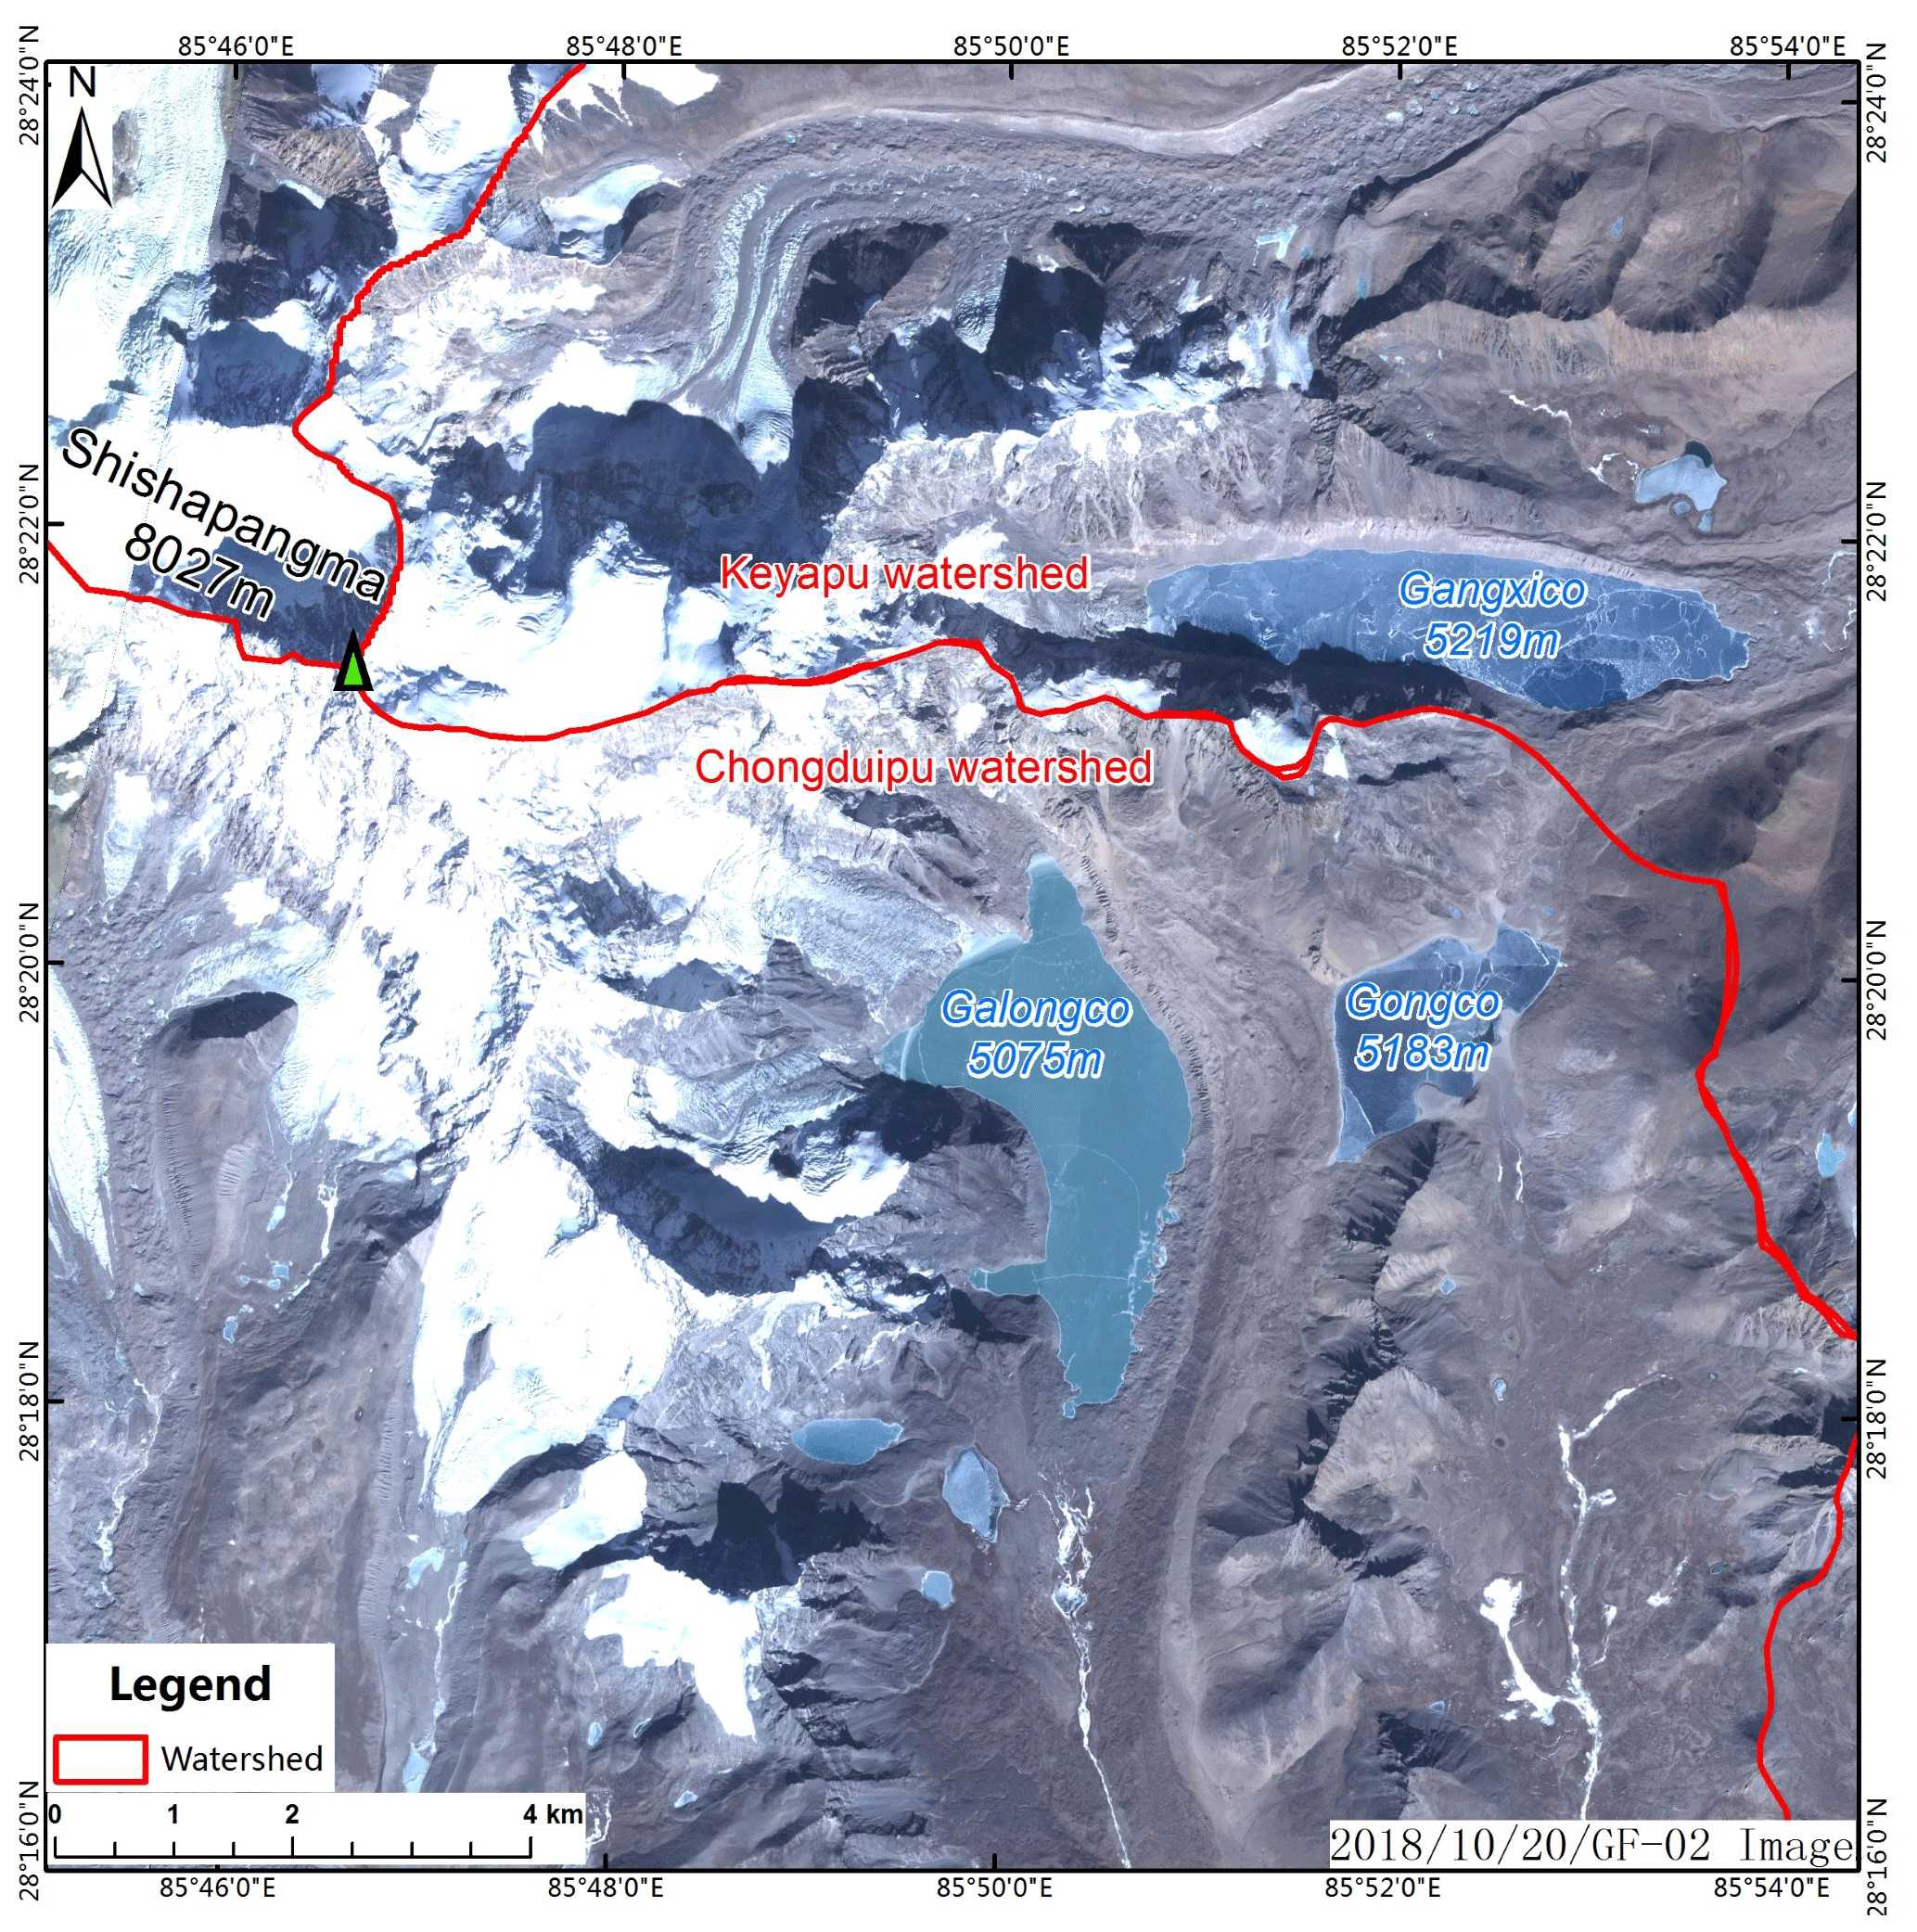
Figure 11Hydraulically connected glacial lakes (Galongco, Gongco, and Gangxico).
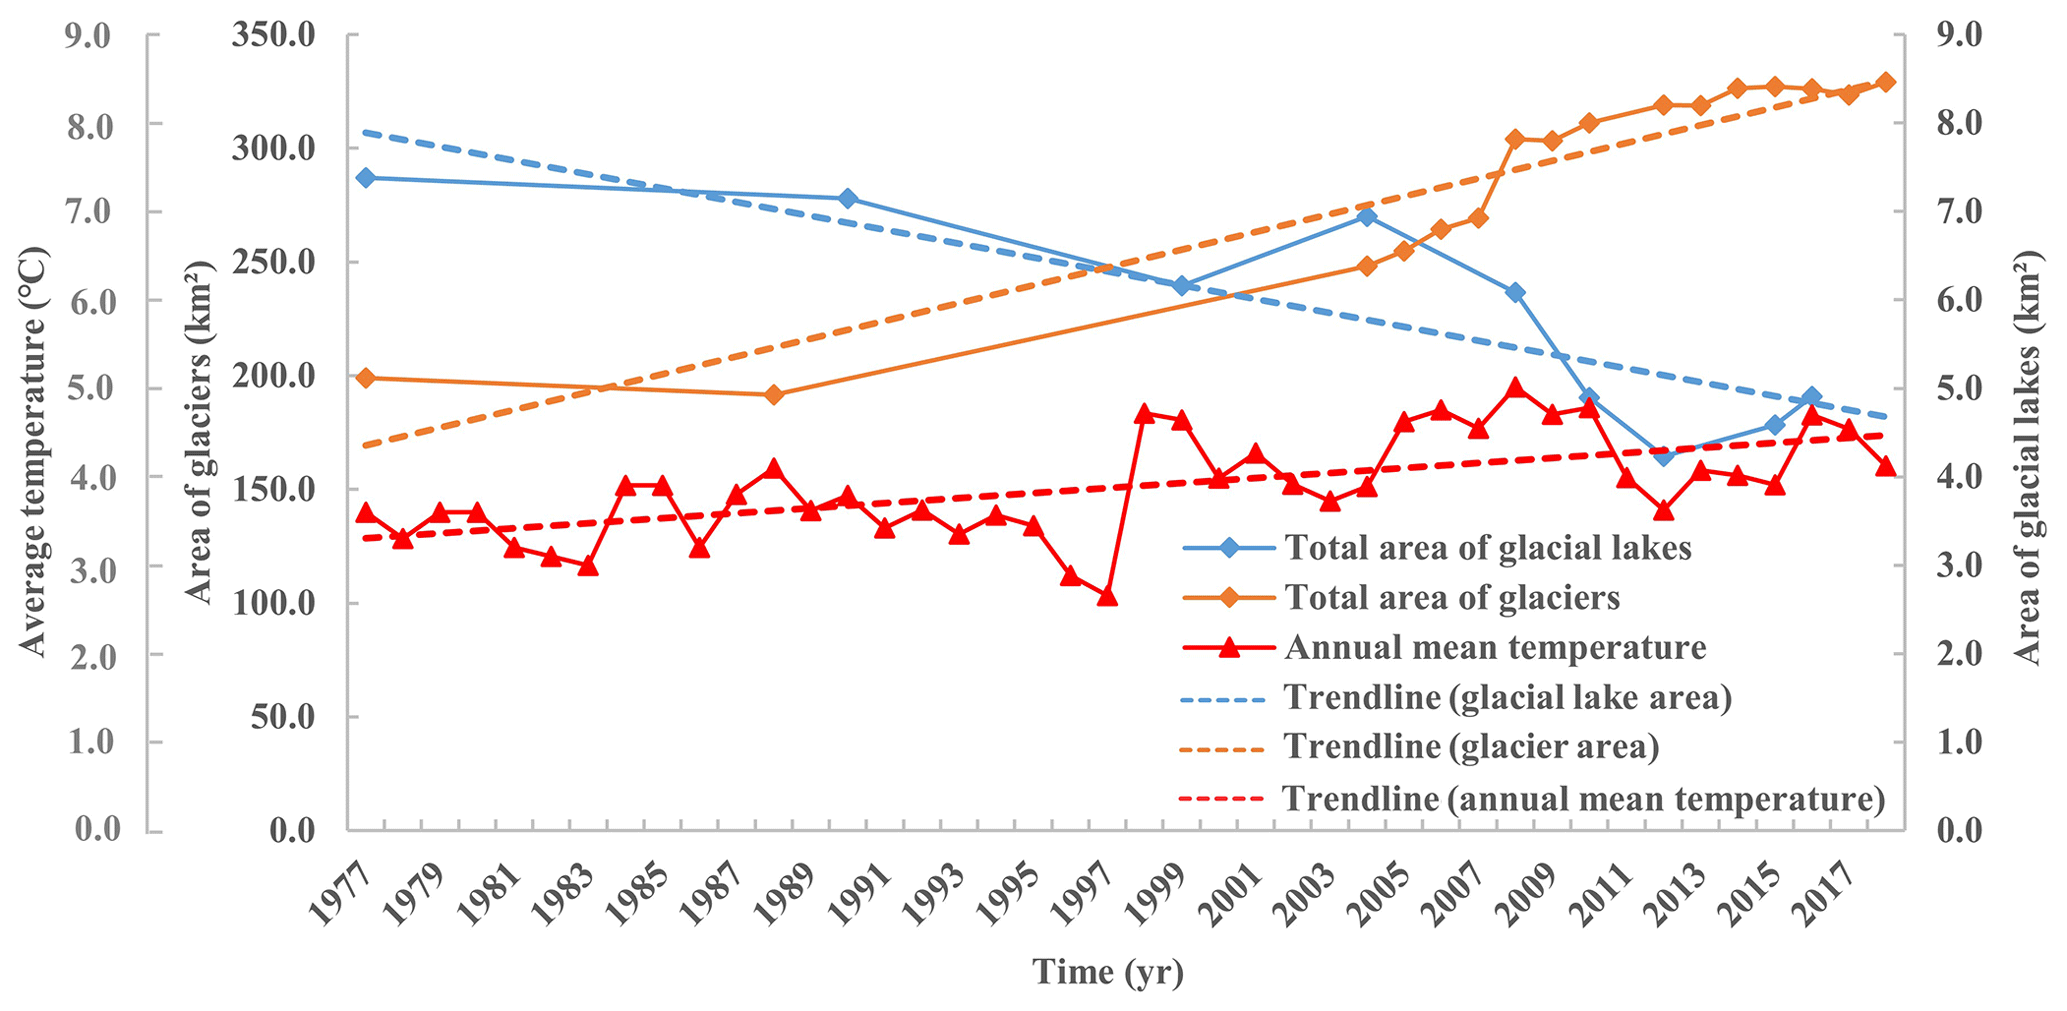
Figure 12Changes in the area of the five typical glacial lakes and glaciers vs. temperature.
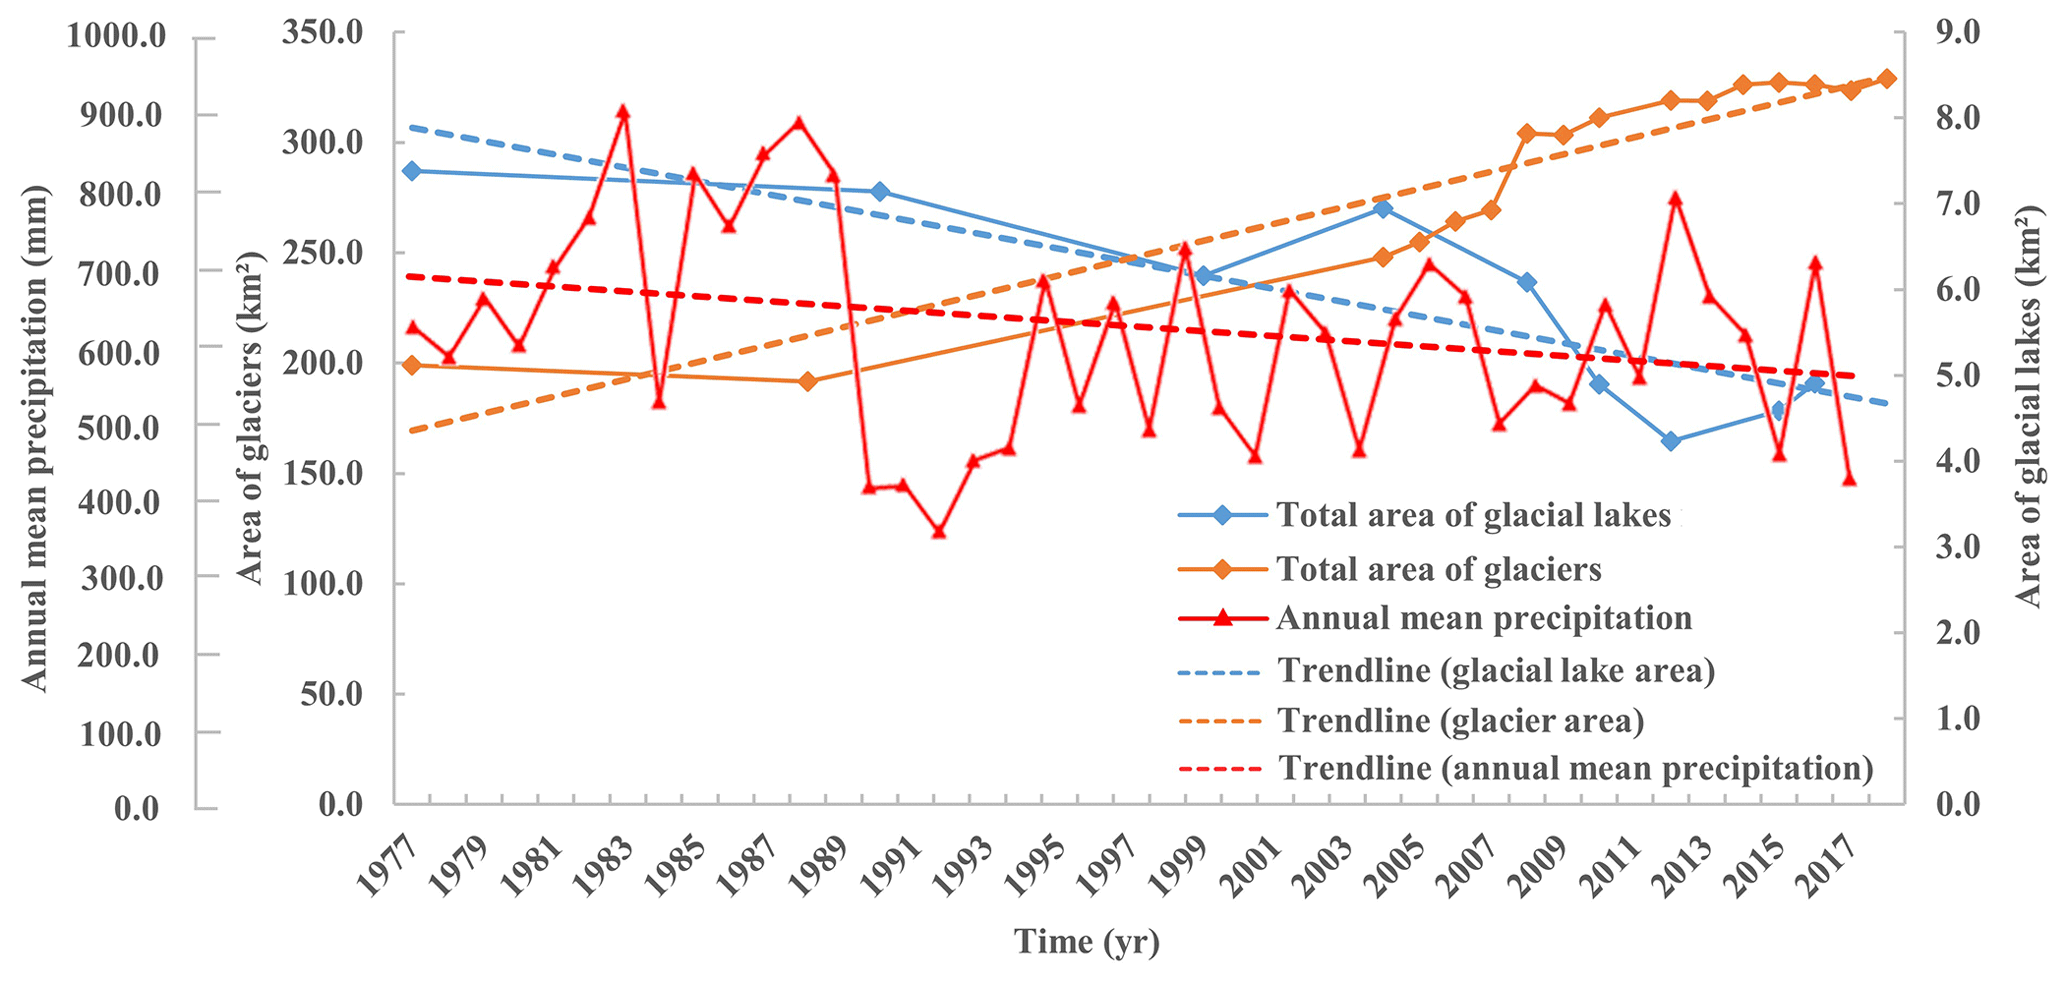
Figure 13Changes in the area of the five typical glacial lakes and glaciers vs. precipitation.
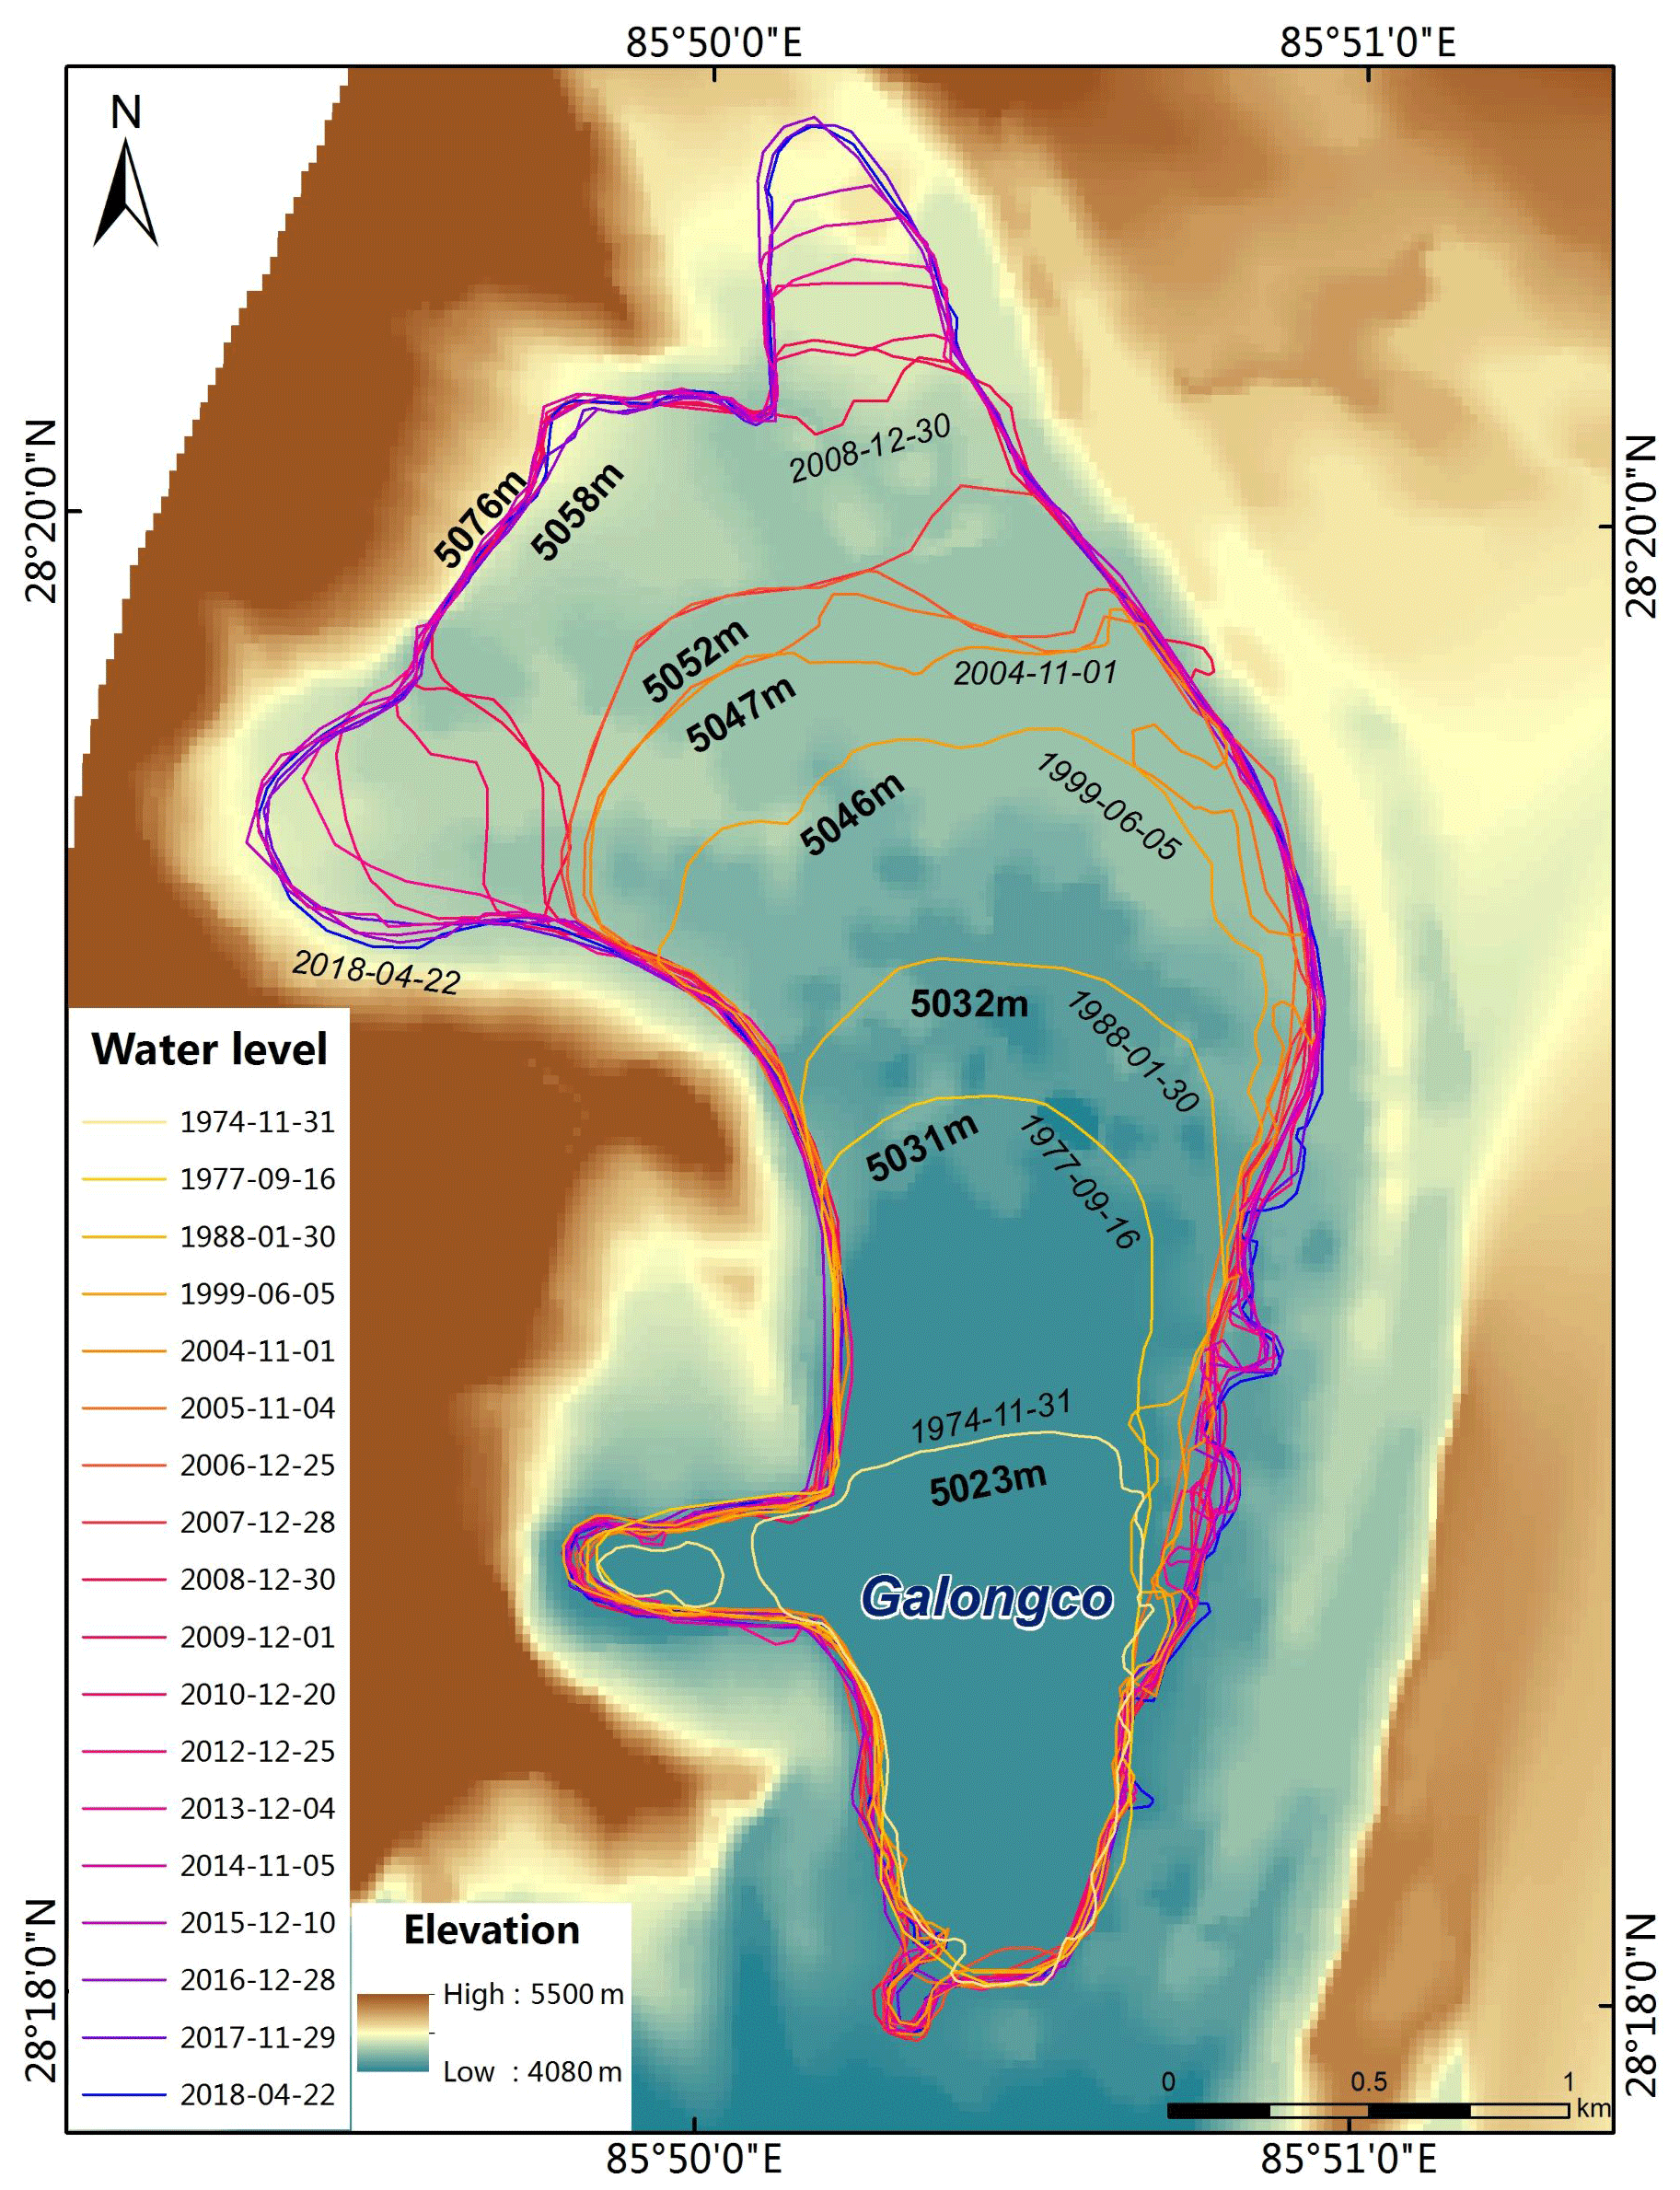
Figure 14Terrain reconstruction of Galongco Lake below the water level.
4.1 Calculation of glacial lake volume
The discussions above are focused on the changes in lake area, and it is still necessary to know the variation in water volume of the lake. For this, the key point is to construct the lake basin topography using multiphase remote sensing (RS) images. Generally, the water level represents a contour line for the lake, and lake boundaries in a period provide evidence for the variation in water level, which can be easily identified in RS images. The water contours can be used to correct the digital elevation model (DEM) data and create the topography of lake basin, and then the variation in volume can be estimated (Fig. 14).
The procedures are as follows: (1) interpret the water level as the lake boundary, (2) transform the water-level vector data to point data in ArcGIS, with a high point density representing high accuracy, and (3) assign DEM data to the point data. Then, the average of the point data is the altitude of water level (lake boundary). After these procedures, we may use the level data of multiple years to create a triangulated irregular network (TIN), and transform the TIN to grid data to obtain the morphology model of lake above the minimum water level, which represents the topography of lake.
The lake volume is simply the integral of the boundary area s (h) over the level difference between base (h0) and surface (hs), as follows:
In practice, we may take a discrete form, i.e., , with Δhi being the difference in altitude (water level) between two successive measurements of the lake.
4.2 Water balance equation (WBE)
The observations above indicate that the expansion of glacial lakes is well related to the retreat of glaciers, which, in turn, relies on the changes in temperature and precipitation (rainfall and snow) in recent years. Then, it is possible to propose the following water balance equation (WBE) for a glacial lake:
where V, P, G, I, and E are the water quantities of the glacial lake, the water supplies from precipitation (rainfall and snow), glacier loss and ice–snow melting, and water loss through infiltration and evaporation, respectively. Δ represents the annual increment.
In detail, the items in WBE are closely related to weather and geomorphologic conditions and can only be determined empirically.
-
Water supplies from precipitation (PR; PS)
This involves rainfall and snowfall. The water supply from rainfall (PR) is governed by the hydrological process in the valley. For a given valley, the runoff depends on the rainfall process (often featured by intensity R and quantity QR), the drainage area contributing to the lake (S), and the geomorphologic factors such as slope θ, vegetation cover, and permeability K. In general, this can be expressed as follows:
Water supplies from snowfall (PS) also depend on temperature T, solar radiation IR, snow density ρS, and snow permeability k, in addition to the geomorphologic factors, as follows:
Then, the water supplied from precipitation is as follows:
-
Water supplies from glaciers (G)
The major controlling factors are temperature T, solar radiation IR, glacier density ρG, fracture density σ, and geomorphologic factors, as follows:
-
Water loss from infiltration (I)
Infiltration mainly depends on the permeability of the materials constituting the lake, and in the present case, the materials are mainly moraines, which are generally poorly graded in terms of grain composition and have high porosity. Infiltration also occurs underground and depends on the substrate sediment of the valley channel downstream of the lake.
where GSD (grain size distribution) describes the granular features of moraines and sediments (Li et al., 2013, 2017) in terms of grain size distribution, and J is the hydraulic slope between the water level and seepage points.
In addition, when the lake is saturated, i.e., the capacity reaches the maximum due to the limitation of the local landform, the lake will not increase in area, and the water supplies exceeding the capacity will be lost through overflow. In such a case, the supply is balanced by the loss.
-
Water loss from evaporation (E)
Theoretically, evaporation is controlled by temperature, solar radiation, lake area A, wind speed v, surface saturated vapor pressure p, and turbulent energy ε, as follows (Lu et al., 2017):
However, for the present case, the effect due to evaporation is much smaller and is usually ignorable compared with the other contributing terms.
4.3 Practical operation of the balance equation
In practice, each item introduced in the WBE can be empirically estimated, especially in the present case, where we suffer from a severe lack of basic data. In the following section, we provide a practical routine for the calculations.
-
Water supplies from rainfall and snow
In principle, the supply is equal to the runoff drainage to the lake, which is calculated using the standard hydrologic method for each rainfall event, depending on the temporal process and spatial distribution of the rainfall over the drainage area. However, for the case of glacial lakes, we have only annual area variation and weather data from nearby stations, and it is impossible to perform standard hydrograph calculations; instead, we reduce the calculation to the runoff of the slope as follows (Gao et al., 2019):
where PR is the runoff and is employed here as the water supply from rainfall, S is the drainage area contributing to the lake, Ra is the annual rainfall, and α is the coefficient, depending on local conditions of the drainage slope, such as the material properties and vegetation cover, which is empirically determined as follows (Liang et al. 2018):
where θ is the slope angle, and ALs varies among arid, semiarid, semihumid, and humid areas. As the Poiqu River basin is located in a semiarid area but has sufficient moisture content in the air, ALs can be taken as the upper limit of 0.75. Then, α is mainly governed by the slope gradient of the drainage area to the lake.
-
Meltwater from ice and snow
There have been various methods used in glacial hydrology (Braithwaite and Olesen, 1989). Physical models have incorporated many influencing factors, such as temperature and radiation intensity; thus, these models have a high calculation accuracy. However, they do not apply to areas lacking a sufficient database, as in the case in the Himalayas. Instead, empirical methods are widely employed, among which the degree-day model (DDM) is generally most used to calculate the melting of glaciers and snow cover (Kayastha et al., 2005; Zhang et al., 2006; Pradhananga et al., 2014). The DDM is practical, simple, and well-accepted, considering the influence of the degree-day factor (DDF) and the normal accumulated temperature. Following the method, the melted thickness of the glacier (M) is determined by the production of DDF and the positive cumulative temperature in a certain period (PDD) as follows:
where DDF is in units of millimeters per day per degree Celsius (hereafter ) and varies with elevation (Liu et al., 2014b). PDD can be directly calculated from the daily temperature record, i.e., the cumulative temperature of the days with temperatures higher than 2 ∘C. In fact, the PDD involves two components applied to the melt of snow cover and glaciers, PDDS and PDDG. In other words, only the residual cumulative temperature PDDG applies to glacial melting.
Then the meltwater quantity is the production of M and the glacier area (AG), as follows:
Similarly, this also applies to the water supply from snow cover melting. DDF is generally hard to obtain, but, in Poiqu, we may make a reference to the results in the nearby area, which is 80 km away at Mt. Everest. According to previous studies, the DDF is 16.9 for the Khumbu Glacier at an altitude of 5350 m (86∘52′ E, 27∘59′ N) (Kayastha et al., 2005), and the DDF is 8.21 for the Rongbuk Glacier at the same altitude (Liu et al., 2014b). Then, we take the average value, 12.6, as the overall DDF for glaciers in Poiqu, and for individuals, we make some corrections depending on the slope orientations of the glaciers. For the west-oriented slope (e.g., Cirenmaco Lake), the melt is relatively more intense than the east-oriented slope (e.g., the Galongco and Gangxico lakes). For the cases of Jialongco and Longmuqieco, the slopes are north oriented, the sunshine is shielded, and the melt is relatively weak. Based on these results, we obtain a corrected DDF for each glacier (Table 10).
According to studies on the snow cover of the Dokriani Glacier in the Indian Himalayas (78∘50′ E, 28∘50′ N; Singh et al., 2000), the DDF for snow is approximately 30 % less than that for glaciers. As this is geographically similar to the Poiqu area, a reduction rate of 30 % can be used for determining the DDF of the snow cover for the glaciers and glacial lakes under consideration, as listed in Table 10.
On the other hand, not all meltwater can reach the connected lake; some infiltrates into the bed through the crevasses. This creates a loss of water supplies from meltwater, and a reduction coefficient, Rc, is considered when the water supplies are estimated (Table 10).
-
Water loss through evaporation
The Poiqu River is located at a high altitude, where the stored water is in a liquid state only in July and August. It is reasonable to assume that the evaporation is very weak and ignorable in estimating water balance. We take Gongco Lake as the reference. The lake is located in the tributary of Chongduipu, similar to Galongco and Gangxico, and at similar altitudes (5173, 5075, and 5218 m, respectively). However, it is distinctive in that the Gongco does not receive a water supply from glaciers; the majority of the water supplies come from rainfall. Notably, Gongco has not increased in area, remaining at approximately 2.1 km2 in recent years. It is possible that the water supplies are balanced by the water losses due to infiltration and evaporation. Since Gongco receives seepage flow from Gangxico and simultaneously feeds Galongco through seepage, the supplies from rainfall are balanced by evaporation. However, according to the estimation, water supplies from rainfall are generally very small compared with those from the meltwater of glaciers and snow cover. Therefore, evaporation is negligible in the Poiqu River.
-
Water loss through infiltration
Water loss due to infiltration is controlled by the permeability of the moraine bank of the lake and the sediment in the valley channel. As it is inaccessible to most glacial lake areas, we can only trace the marks of infiltration through RS images (including UAV and Google Earth).
For the permeability coefficient K, we conducted experiments on material samples from the moraines and sediments, and it was found that K (in centimeters per second; hereafter cm s−1) is well related to the grain size distribution (GSD) of the loose granular materials, as follows:
where Dc and μ are GSD parameters (Li et al., 2013, 2017) which can be directly obtained from the granulometric analysis of moraine and sediment samples for each lake. Then, the infiltration discharge can be calculated by Darcy's law, as follows:
where J is the hydraulic slope, and A is the infiltration area. For a given valley, the water loss from infiltration is I = QT, with T as the effective time for infiltration, which is mainly the rainy season when the valley has flow water.
The discussions above suggest that the WBE can be simplified as follows:
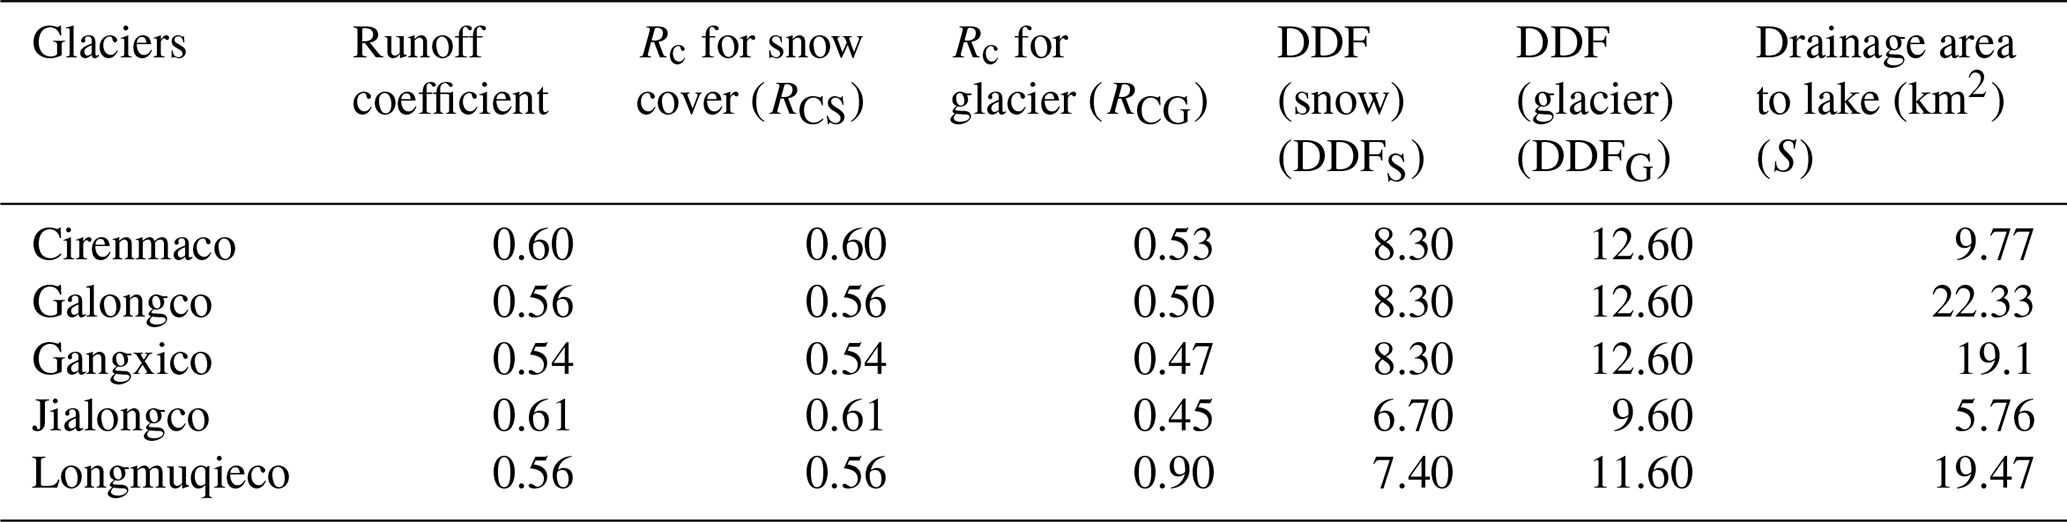
where α is a coefficient related to local topography (see Eq. 13), S is the drainage area of the lake, AG is the glacier lake, and Ra is the annual rainfall. Since not all meltwater supplies to the lakes, we consider the reduction ratio of snowmelt RCS and glacier melt RCG. Other symbols are referred to the equations above (e.g., Eqs. 14–18). Finally, we tabulate the parameters for the WBE calculation (Table 10).
Table 10Parameters for the water balance calculation of glacial lakes.
4.4 Cases calculations
4.4.1 An exemplification of the Galongco Lake
Now, we apply the WBE to the five major lakes to see how the area has increased in recent decades. For this procedure, we first take the glacial lake of Galongco in 2006 as an example to show the calculation process.
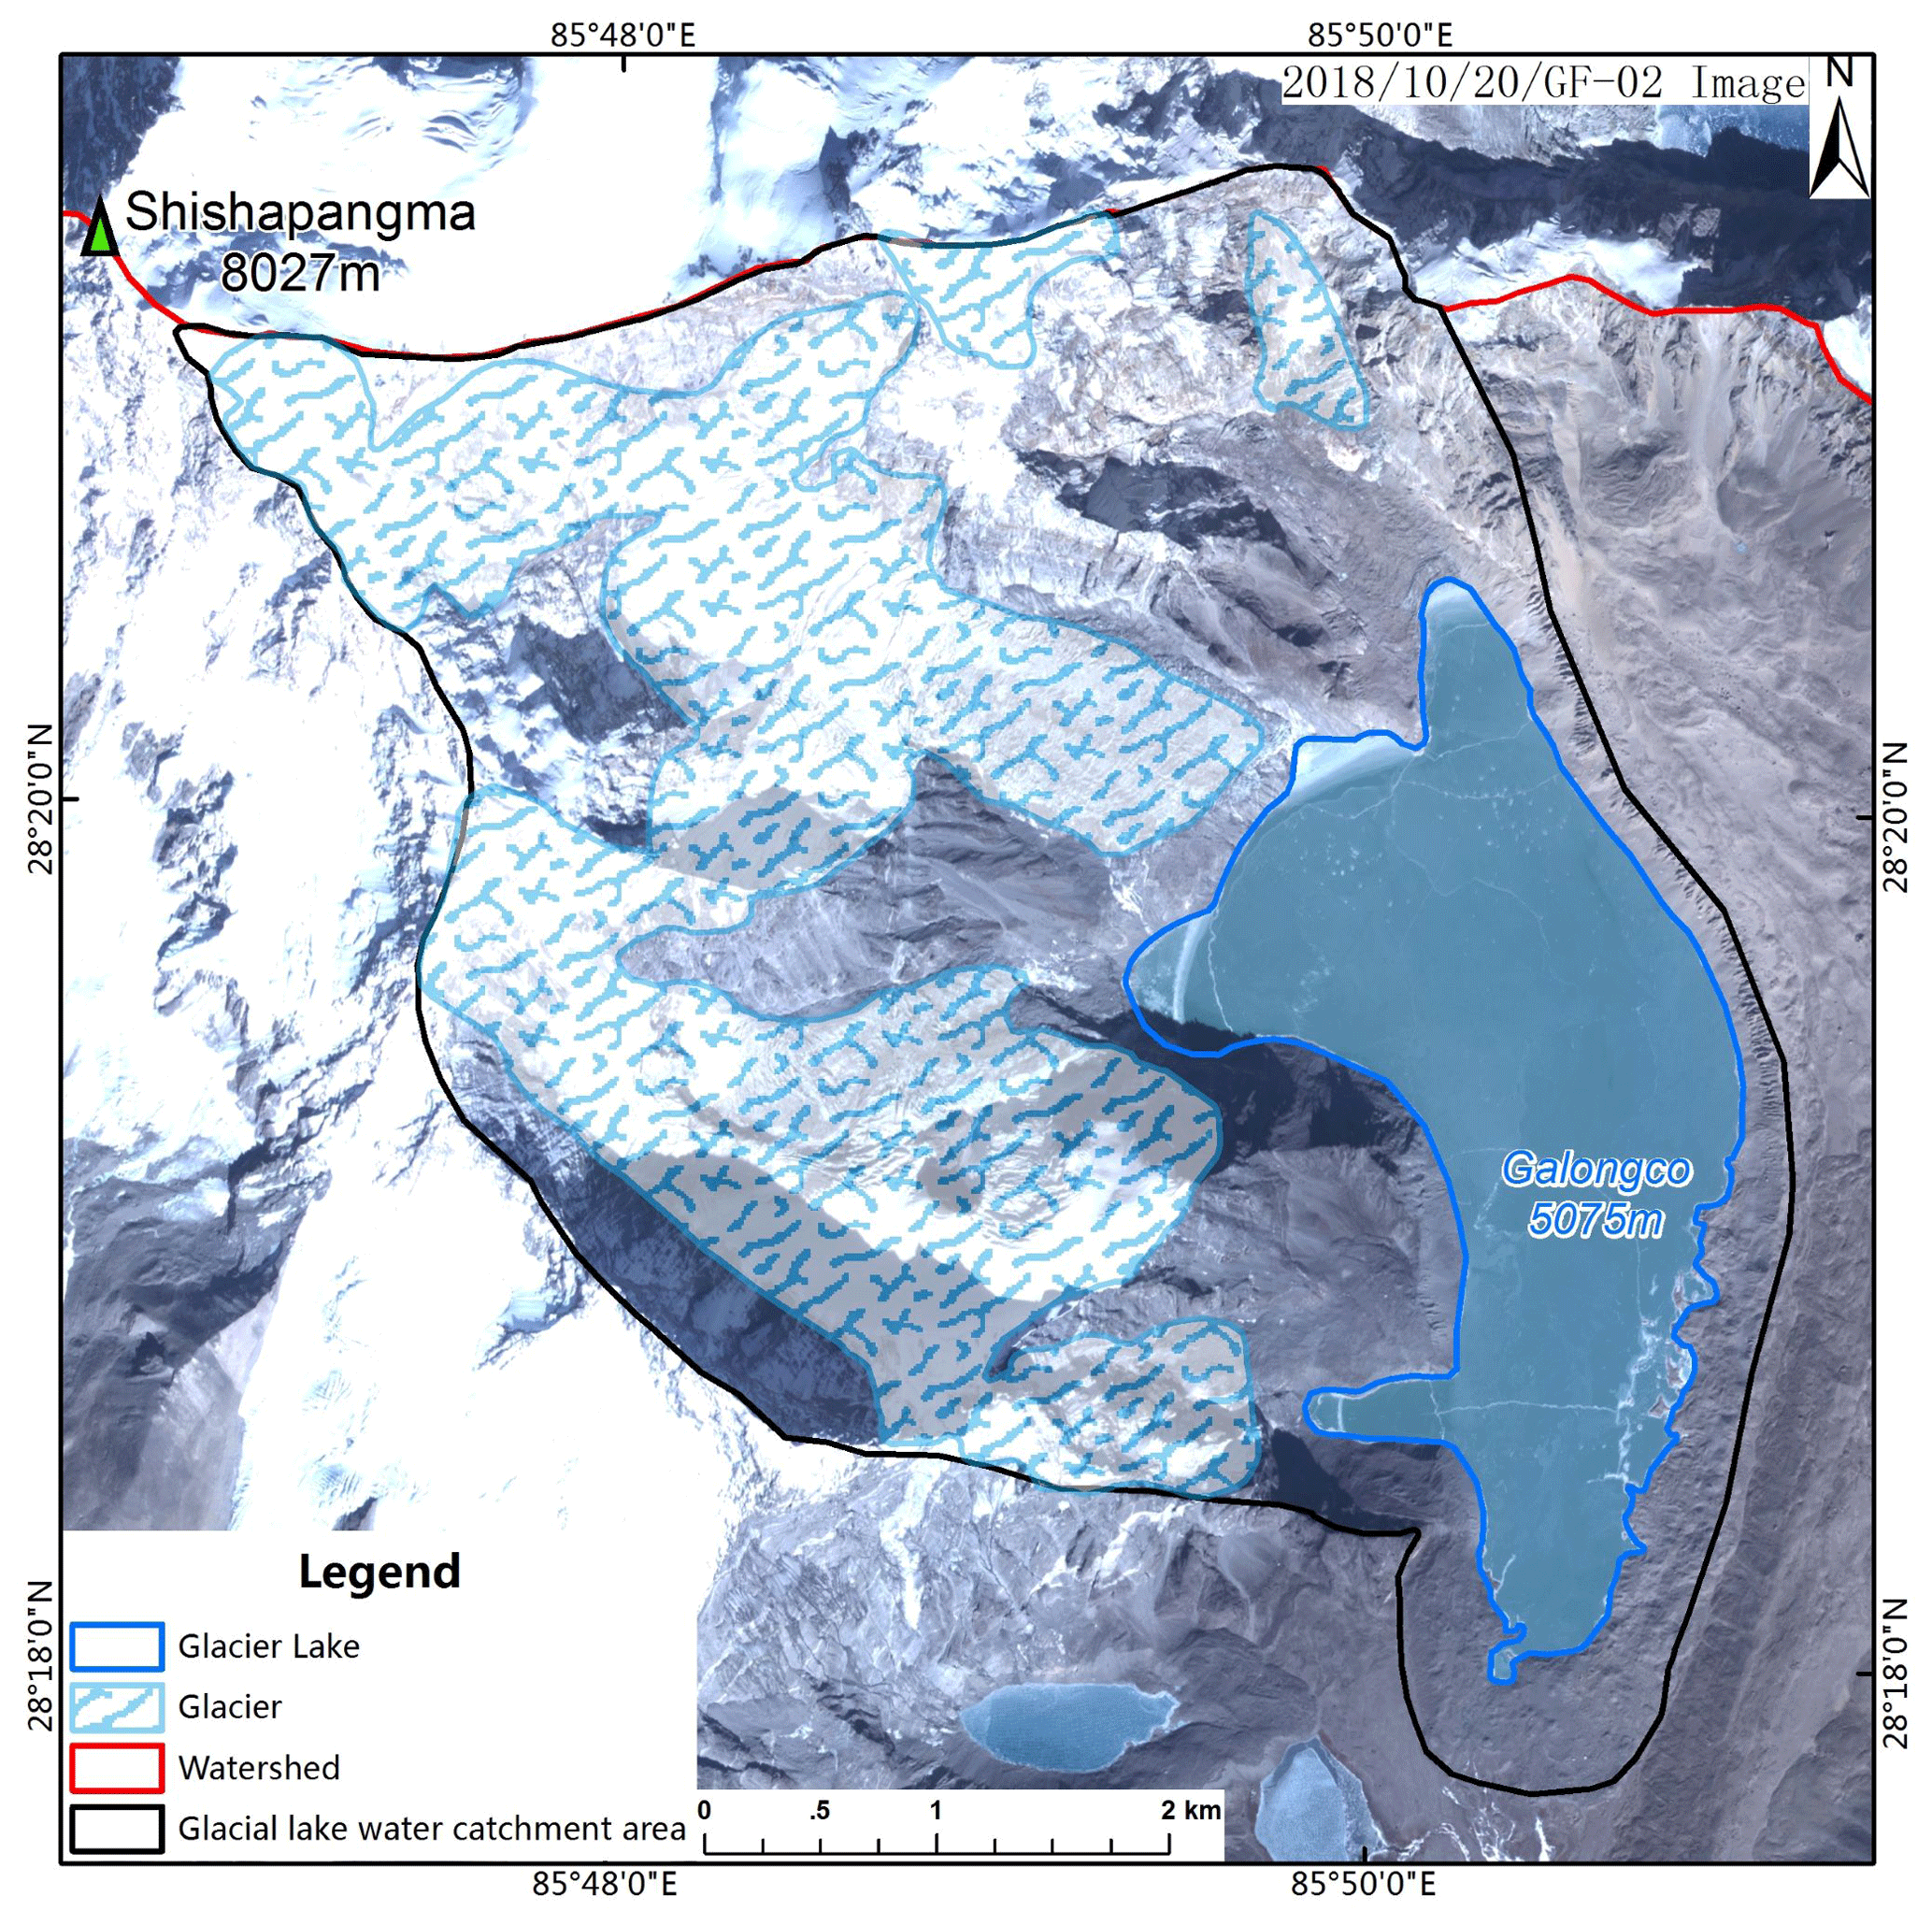
Figure 15The Galongco Lake and the connected glaciers in 2006. (The image is from the GF-02 images.)
- 1.
Geomorphologic background and related parameters
As mentioned above, Galongco Lake is located in a small tributary of the Chongduipu tributary, at an altitude of 5076 m, in an area 5.5 km2, and the drainage area to the lake, including slopes around the lake, is 22.33 km2. There are two glaciers directly connected to the lake in the northwestern and western parts of the upstream area, with a total area of 13.5 km2, according to the GF-2 satellite images in 2018.
In 2006, the lake area was 3.93 km2, and the glacier area was 143.7 km2 (Fig. 15). Based on the DEM, the angle of the draining slope is estimated to be 23.7∘ on average, and thus, the runoff coefficient is 0.56, according to Eq. (13).
Following the background of the lake and glaciers, the DDFs for glaciers and snow cover are 12.6 and 8.3, respectively, and the reduction coefficients for glaciers and snow cover are 0.61 and 0.56, respectively.
- 2.
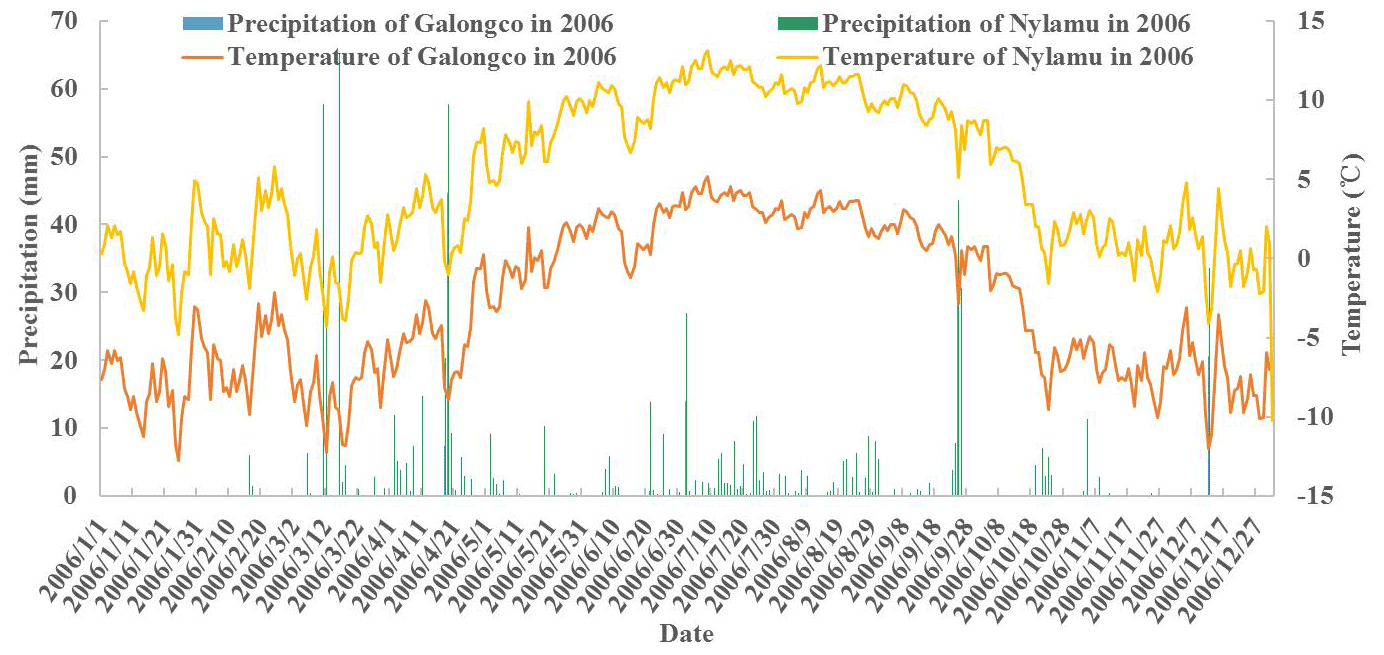
Weather conditions
The weather conditions are interpolated from the records in Nyalam; the annual temperature and precipitation in 2006 are shown in Fig. 16.
Following the information above, the rainfall and snowfall in 2006 were 1.5 and 1545 mm, respectively, and the cumulative temperature was 282.3 ∘C. Based on the DDM, the cumulative temperature for snow cover melt is 128.3 ∘C, and thus, the cumulative temperature for glacial melt is 153 ∘C.
- 3.
Infiltration
According to the samples of moraine materials in the lake tributary, the GSD parameter μ is 0.03, and DC is 11.2 mm, which yields a permeability coefficient K of 0.088 cm s−1. According to the Google Earth images, the infiltration area is approximately 8426 m2, and the hydraulic slope is 0.13, which gives a discharge of infiltration of 0.96 m3 s−1. Considering that only July and August have positive temperatures higher than 2 ∘C, infiltration only occurs in these months.
- 4.
Water supplies and losses
Based on the parameters described above and using Eqs. (7)–(10), we obtain the following water supplies and losses:
- i.
the water supply from rainfall (PR) is 0.175 × 10⁶ m3,
- ii.
the water supply from glacial melting (G) is 14.9 × 10⁶ m3,
- iii.
the water supply from snow melting (PS) is 1.90 × 10⁶ m3, and
- iv.
the water loss from infiltration (I) is 5.92 × 10⁶ m3.
- i.
In the same way, we can calculate the water balance for other years. Notably, for some years, no data are available for glaciers or lakes (e.g., only three sets of data are available between 1988 and 2004). For these situations, we use an extrapolation method. Considering that the changes in glaciers and glacial lakes have had steady, near-linear tendencies in recent years, we can assume that both glaciers and glacial lakes in the years between 1988 and 2004 vary linearly, with the average rate determined by the slope of the line linking the points of 1988 and 2004. Thus, we can infer the area of glaciers and glacial lakes in those years. Specifically, for Galongco, the variation rate of glaciers between 2004 and 2018 is −0.36 (R2 = 0.8956), and the variation rate of glacial lakes is 0.15 (R2 = 0.8779), which provides a baseline for extrapolation in recent years.
Table 11Water balance for Galongco Lake between 1988 and 2018.

Note: Tc – cumulative temperature; TcG – cumulative temperature for glacial melting; TcS – cumulative temperature for snow melting, which is Tc−TcG; MG –melt thickness of a glacier; WG – water supply from glaciers; Wsnow – water supply from snow cover; Wtotal –total quantity of water supplies.
Using the methods above, we obtain the water balance for Galongco between 1988 and 2018, as listed in Table 11.
Table 12Comparison between the calculated water quantity and the observed quantity.

Illustration: MV – measured volume; TV – theoretical volume; ER – error rate.
4.4.2 Water balance for five typical lakes
Similarly, we can perform balance calculations for other lakes, from which we have obtained the variation in water quantity for the lakes since 1988, using the parameters listed in Table 11. Table 12 displays the calculated water quantity and the measured quantity for the five typical lakes. One sees that the error between calculated and measured water volume of lakes is −19.7 %–−33.6 % on average. The maximal error occurs at Gangxico Lake, and the smallest error occurs at Galongco Lake (1.2 %).
It is noted that a great discrepancy occurs in the case of Jialongco Lake, the lowest among the five samples at an altitude of 4306 m, which experienced an outburst flood in 2002 and sudden rise during 2006 and 2008 due to dramatic changes in the connected glacier. As the WBE does not consider the glacial dynamics and dramatic changes in local conditions, the calculation cannot incorporate the sudden changes. This means that the WBE operation should be further improved to incorporate the water variations due to catastrophic processes.
However, the gross agreement between the calculation and observation does suggest that the WBE has provided a practical and functional framework for understanding the characteristics of changes in individual glacial lakes. Moreover, it provides a practical method for quantitatively assessing the growth of glacial lakes. In particular, the calculation reveals that the lakes in Poiqu have undergone different water supply balance proportions, which makes it possible to distinguish among the local conditions of the lakes.
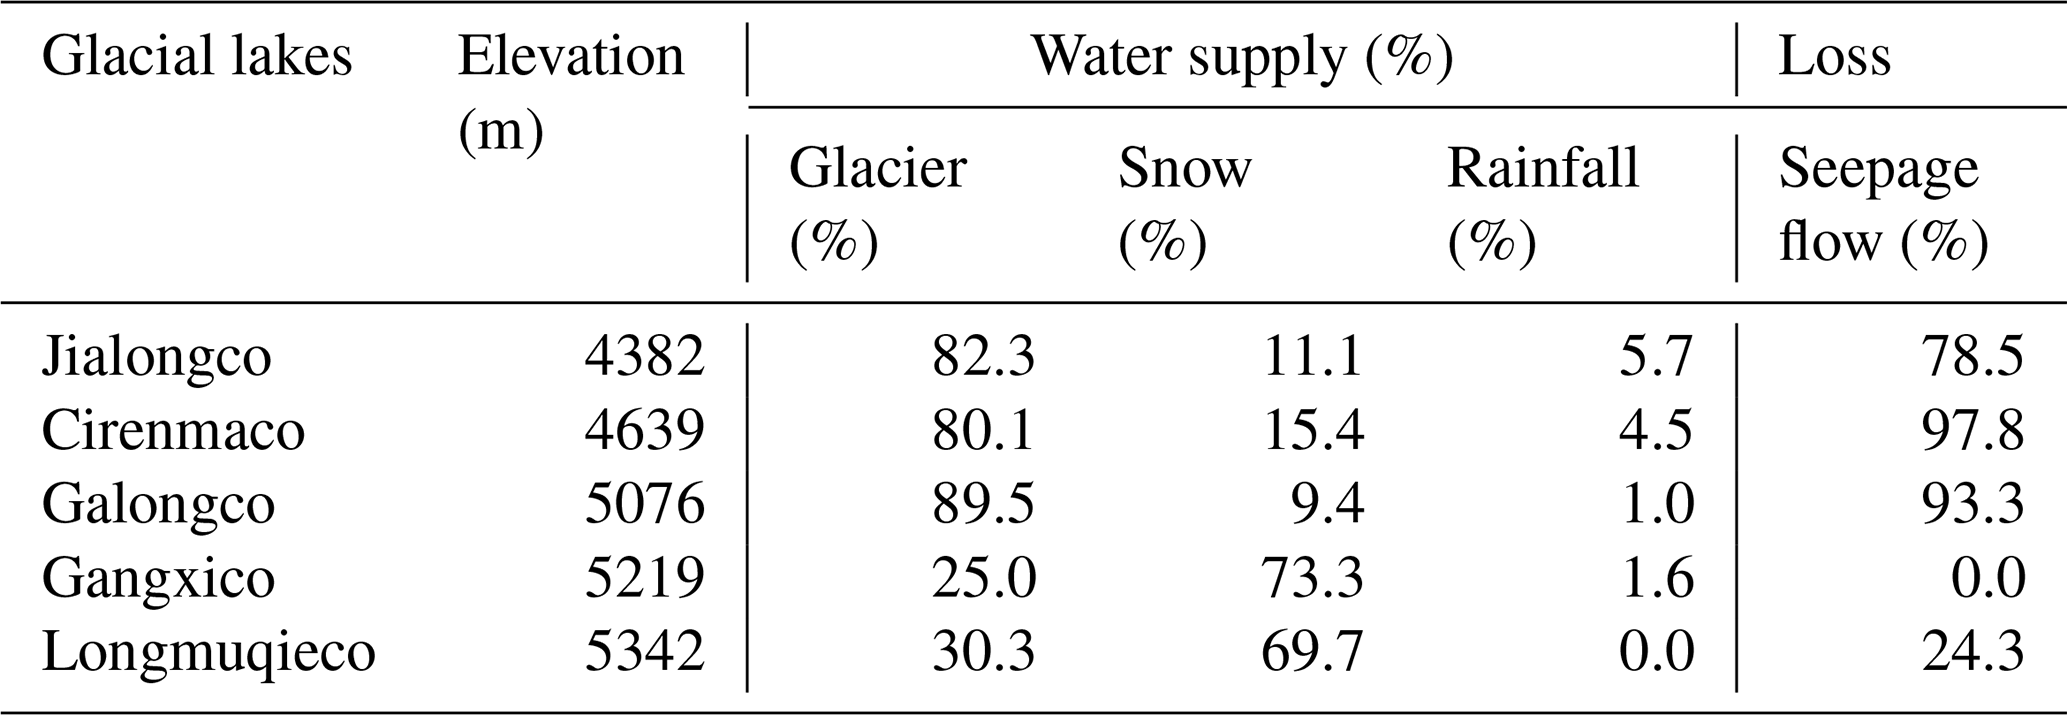
The WBE not only provides a method to account for the water supplies to glacial lakes but also reveals differences between lakes. Although glaciers are sensitive to temperature, the lake grows in various ways depending on local conditions, especially altitude and basin circumstances. Table 13 lists the average fraction of water supplies from glaciers melting, snow melting, and rainfall over the calculation period. It is obvious that the supply form of a glacial lake is affected by altitude. The lakes at relatively low elevations (< 5000 m) are mainly supplied by glaciers melting, and lakes at high elevations, especially at 5100–5300 m, are mainly supplied by snow melting.
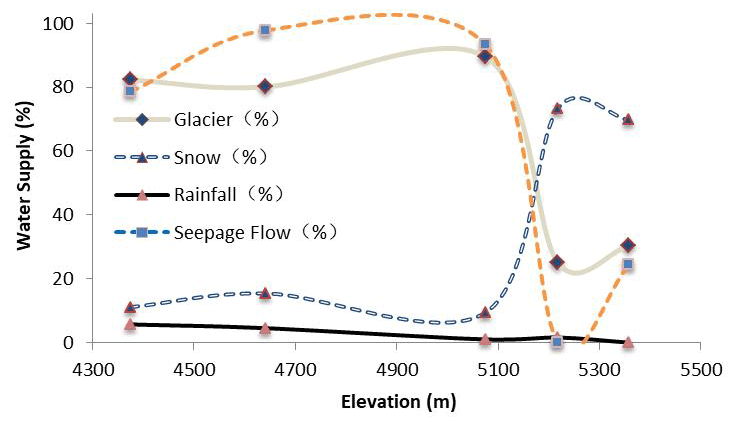
For all of these lakes, the water supplies from rainfall are much smaller, even below 5 %, and this can almost be ignored, considering the accuracy of the estimation. This clearly reflects the altitude effect on glaciers. At low altitudes, the cumulative annual temperature is positive and directly melts the glaciers. At high altitudes, glaciers are covered by snow, and the positive temperature mainly acts on snow cover. Indeed, several years have shown near-zero cumulative temperatures for Gangxico Lake and Longmuqieco Lake, which results in a small fraction of glacial ablation (Fig. 17).
Based on the present study, we can remark on some of the problems concerning changes in glaciers and glacial lakes under warming conditions.
-
The changes in glaciers and glacial lakes in Poiqu are at remarkably high levels compared with other regions in the Himalayas (Nie et al., 2017). This vividly illustrates the prediction that glacier area in highly mountainous Asia will decrease by half, at an accelerating rate, about 1 decade ahead of schedule (Farinotti et al., 2019). A detailed analysis proves that, although the glaciers are generally in their retreat phase, water supplies from glaciers are still dominant in the central Himalayas. However, it is also noted that the fluctuation in temperature and precipitation in local areas does not present a clear-cut tendency in parallel with the retreat of glaciers or growth of glacial lakes. Changes in individual glaciers and glacial lakes are dominated by local conditions but not global changes.
-
The mass balance for glaciers and ice caps is of great importance in Earth's hydrological cycle and response to climate change (Aizen and Aizen, 1997; Haeberli et al., 1999; Valentina Radić and Hock, 2013; Lambrecht and Mayer, 2009; Huss, 2011; Huss and Hock, 2018). The results of this study provide a detailed scenario of water balance for individual lakes through the operation of WBE for typical glacial lakes, revealing details in the water supplies from precipitation, glaciers, and snow cover and water losses from infiltration. The WBE provides the mechanism for lake growth and agrees well with the observations and image interpretations, and the calculation for individual lakes has made up for the deficiencies in previous studies, which only gave an overall view of lake expansion at the regional scale (e.g., Nie et al., 2017). In addition, the WBE operation has also discovered that glacial lakes under similar background conditions may vary in different ways, depending on local elements at small scales, which would be inevitably neglected in studies at large scales. The lake may remain at their greatest sizes (e.g., at the maximal area of extension) even if the glaciers undergo dramatic changes.
-
The balance equation provides a direct link between glacier and glacial lake changes and climate changes under local conditions, as each item of the water contribution in the WBE specifically depends on local weather and morphology. Furthermore, the WBE operation is crucial to gain a better understanding of water supplies for glacierized river basins. Near the study area originate many rivers, such as the rivers of Yarlung Zangbo (Brahmaputra), Indus, Ganges, Nujiang (Salween), and Lancangjiang (Mekong), but the quantification of water sources is usually highly uncertain because of a lack of understanding of the hydrological regimes and runoff calculations (Winiger et al., 2005; Bookhagen and Burbank, 2010; Immerzeel and Bierkens, 2012; Miller et al., 2012; Lutz et al., 2014; Hassan et al., 2017). The proposed WBE has revealed the variety of water supplies from glaciers, snow cover, and precipitation for individual glacial lakes; this calculation is expected to be applicable for estimating glaciohydrological processes in large glacierized rivers.
-
Admittedly, the WBE for glacial lakes is proposed here only at the annual scale, which makes it difficult to be accurate when considering individual lakes during a given period. This is mainly due to the lack of data and ignorance of specific water supply and loss processes. For example, runoff should be calculated for the tributary watershed using records for individual rainfall events, which strongly depend on the watershed conditions (i.e., conditions of slope, channel, vegetation, and soils or sediments, especially in the moraines for the lakes) and the rainfall pattern. However, in the study area, and even in the Himalayas, only annual (and usually incomplete) weather records are available at several points, and it is only possible to provide a gross estimate of the runoff simply by the production of rainfall and watershed area. Similarly, water quantities from other sources can only be accurately estimated in terms of order of magnitude.
On the other hand, the WBE does not consider the dynamical processes of glaciers (Copland et al., 2011; Dowdeswell et al., 1995), such as glacial surging, its hydrologic consequences, or the possible dramatic changes in morphology, such as the collapse of lakes or other surface processes (e.g., icefalls, landslides, or debris flows due to earthquakes or extreme weather events), which may bring dramatic changes that overwhelm the steady, gentle changes that occur over tens or even hundreds of years. Therefore, the model cannot explain the sudden changes in glaciers and glacial lakes, as in the case of Jialongco. In addition, the parameters involved for these items are highly uncertain in practice, and it is required that these items be scrutinized systematically and in detail improve the accuracy of the operation.
We have explored the evolution of glacial lakes in the Poiqu River basin in the central Himalayas based on multisource RS images and UAV photos. A total of 147 glacial lakes and related glaciers have been identified in the area, which are distributed between 4200 and ∼ 5800 m and concentrated between 5000 and ∼ 5800 m, with the area ranging from 0.0002 to 5.5 km2, with a total of 19.89 km2. In particular, we take five typical glacial lakes to trace the evolution in last 40 years and find that the glaciers have undergone increasing retreat, and the retreat area of main glaciers is 119.4 km2, at the rate of 2.91 km2 a−1. At the same time, we also find that the glacial lakes grew and expanded, and the expansion area of main glacial lakes is 7.25 km2, at the rate of 0.18 km2 a−1. It is proved that the Poiqu River basin has been an area of high levels of glacier and glacial lake changes in recent decades. Temperature is negatively and positively related to glaciers and glacial lakes, and precipitation has the opposite effect.
Moreover, we construct the lake basin topography using multiphase RS images and propose the water balance equation by incorporating water supplies from precipitation, glaciers, and water loss from infiltration and evaporation. As each item of the water contribution specifically depends on local weather and morphology, the balance equation provides a direct link between glacier and glacial lake changes and climate changes under local conditions.
The operation of the WBE for the five glacial lakes has shown that individual lakes vary in different ways and receive water supplies from glaciers, snow cover, and precipitation in different fractions. The WBE also reveals that water supplies depend on altitude. At low altitudes, temperature is more effective for glacier ablation, and lakes are mainly supplied by melted water from glaciers. At high altitudes, temperature acts more on snow cover, and melted snow becomes the major water supply to lakes. The difference between water supplies from glaciers and snow cover is as high as 50 %, according to the present cases. This implies that it is insufficient to apply weather or climate conditions to individual glacial lakes at a large scale to determine climate effects on glacial lake changes.
All presented data sets are freely available from the websites as follows. The Landsat image data are available from the USGS (https://earthexplorer.usgs.gov/; USGS, 2020). The GF-2 and ZY-3 image data are available from the China Centre for Resources Satellite Data and Application (http://www.cresda.com/CN/, last access: 9 October 2021). The ASTER GDEM image data are available from NASA (https://search.earthdata.nasa.gov/search; NASA, 2020). The SPOT image is available from Airbus (https://www.intelligence-airbusds.com/; Airbus, 2021). The meteorological data are available from the China Meteorological Data Service Centre (http://data.cma.cn/, last access: 2 October 2021).
The initial idea was proposed by PS, JL, and YL. The initial version of the paper was written by PS and JL, with a contribution from YL for the analysis of results. WL contributed to meteorological data collection and analysis. YW contributed to interpretation and drawing of the satellite images. CM and QL contributed to checking the calculation results of the WBE. All of the authors have been involved in interpreting the results, discussing the findings, and editing the paper.
The authors declare that they have no conflict of interest.
Publisher's note: Copernicus Publications remains neutral with regard to jurisdictional claims in published maps and institutional affiliations.
We thank the editor, Anas Ghadouani, and two additional anonymous referees for their constructive comments that greatly improved the original paper. We also thank Janina Schulz, for assisting us with the proofreading process. We gratefully acknowledge the support from the CPC Shigatse Municipal Party Committee, for building the two field meteorological stations.
This research has been supported by the National Natural Science Foundation of China (grant nos. 41877261 and U19A2049), the West Young Scholars Program of the Chinese Academy of Sciences and the CAS Key Technology Talent Program, the Strategic Priority Research Program of the Chinese Academy of Sciences (grant no. XDA23090202), the Construction of Prevention and Control Capacity System of Department of Natural Resources of Tibet Autonomous Region (grant no. 2020-0890-2), and the China Geological Survey projects (grant no. DD20190637).
This paper was edited by Anas Ghadouani and reviewed by two anonymous referees.
Airbus: https://www.intelligence-airbusds.com/, last access: 10 September 2021.
Aizen, V. and Aizen, E.: Hydrological cycles on the north and south peripheries of mountain–glacial basins of central Asia, Hydrol. Process., 11, 451–469, https://doi.org/10.1002/(SICI)1099-1085(199704)11:5<451::AID-HYP448>3.0.CO;2-M, 1997.
Bajracharya, B., Shrestha, A. B., and Rajbhandari, L.: Glacial lake outburst floods in the Sagarmatha region – Hazard assessment using GIS and hydrodynamic modeling, Mt. Res. Dev., 27, 336–344, https://doi.org/10.2307/25164154 https://doi.org/10.1659/mrd.0783, 2007.
Bhutiyani, M. R., Kale, V. S., and Pawar, N. J.: Climate change and the precipitation variations in the north-western Himalaya: 1866–2006, Int. J. Climatol., 30, 535–548, https://doi.org/10.1002/joc.1920, 2009.
Bolch, T., Buchroithner, M. F., Peters, J., Baessler, M., and Bajracharya, S.: Identification of glacier motion and potentially dangerous glacial lakes in the Mt. Everest region/Nepal using spaceborne imagery, Nat. Hazards Earth Syst. Sci., 8, 1329–1340, https://doi.org/10.5194/nhess-8-1329-2008, 2008.
Bookhagen, B. and Burbank, D. W.: Towards a complete Himalayan hydrological budget: Spatiotemporal distribution of snowmelt and rainfall and their impact on river discharge, J. Geophys. Res., 115, F03019, https://doi.org/10.1029/2009JF001426, 2010.
Braithwaite, R. J. and Olesen, O. B. (eds.): Calculation of glacier ablation from air temperature, West Greenland, Glac. Fluc. G., 219–233, https://doi.org/10.1007/978-94-015-7823-3_15, 1989.
Chen, X. Q., Cui, P., Li, Y., Yang, Z., and Qi, Y. Q.: Changes in glacial lakes and glaciers of post-1986 in the Poiqu River basin, Nyalam, Xizang (Tibet), Geomorphology, 88, 298–311, https://doi.org/10.1016/j.geomorph.2006.11.012, 2007.
Copland, L., Sylvestre, T., Bishop, M. P., Shroder, J. F., Seong, Y. B., Owen, L. A., Bush, A., and Kamp, U.: Expanded and Recently Increased Glacier Surging in the Karakoram, Arct. Antarct. Alp. Res., 43, 503–516, https://doi.org/10.1657/1938-4246-43.4.503, 2011.
Dowdeswell, J. A., Hodgkins, R., Nuttall, A.-M., Hagen, J. O., and Hamilton, G. S.: Mass balance change as a control on the frequency and occurrence of glacier surges in Svalbard, Norwegian High Arctic, Geophys. Res. Lett., 22, 2909–2912, https://doi.org/10.1029/95GL02821, 1995.
Farinotti, D., Huss, M., Fuerst, J. J., Landmann, J., Machguth, H., Maussion, F., and Pandit, A.: A consensus estimates for the ice thickness distribution of all glaciers on Earth, Nat. Geosci., 12, 168–173, https://doi.org/10.3929/ethz-b-000315707, 2019.
Gao, J. F., Yang, Z. H., Su, W. C., and Cao, Y.: Research Status and Prospect of Runoff Collection and Utilization in Karst Hillslope, Water Saving Irrigation, 104, 97–99, 2019 (in Chinese with English abstract).
Haeberli, W., Frauenfelder, R., Hoelzle, M., and Maisch, M.: On rates and acceleration trends of global glacier mass changes, Geogr. Ann. A., 81A, 585–591, https://doi.org/10.1111/1468-0459.00086, 1999.
Hassan, J., Kayastha, R. B., Shrestha, A., Bano, I., Ali, S. H., and Magsi, H. Z.: Predictions of future hydrological conditions and contribution of snow and ice melt in total discharge of Shigar River Basin in Central Karakoram, Pakistan, Sciences in Cold and Arid Regions, 9, 511–524, 2017.
Huss, M.: Present and future contribution of glacier storage change to runoff from macroscale drainage basins in Europe, Water Resour. Res., 47, W07511, https://doi.org/10.1029/2010WR010299, 2011.
Huss, M. and Hock, R.: Global-scale hydrological response to future glacier mass loss, Nat. Clim. Change, 8, 135–140, https://doi.org/10.1038/s41558-017-0049-x, 2018.
Immerzeel, W. W. and Bierkens, M. F. P.: Asia's water balance, Nat. Geosci., 5, 841–842, https://doi.org/10.1038/ngeo1643, 2012.
IPCC: Climate change 2013 – the physical science basis, in: Contribution of Working Group I to the Fifth Assessment Report of the Intergovernmental Panel on Climate Change, edited by: Stocker, T. F., Qin, D., Plattner, G.-K., Tignor, M., Allen, S. K., Boschung, J., Nauels, A., Xia, Y., Bex, V., and Midgley, P. M., Cambridge University Press, Cambridge, UK and New York, NY, USA, 2013.
Ji, Q., Dong, J., Liu, R., Xiao, Z. L., and Yang, T. B.: Glacier Changes in Response to Climate Change in the Himalayas in 1990–2015, Scientia Geographica Sinica, 40, 486–496, https://doi.org/10.13249/j.cnki.sgs.2020.03.017, 2020 (in Chinese with English abstract).
Kayastha, R. B., Ageta, Y., and Fujita, K.: Use of positive degree–day methods for calculating snow and ice melting and discharge in glacierized basins in the Langtang Valley, Central Nepal, in: Climate and Hydrology of Mountain Areas, edited by: de Jong, C., Collins, D., and Ranzi, R., John Wiley & Sons Ltd., 5–14, https://doi.org/10.1002/0470858249.ch2, 2005.
Komori, J.: Recent expansions of glacial lakes in the Bhutan Himalayas, Quatern. Int., 184, 177–186, https://doi.org/10.1016/j.quaint.2007.09.012, 2008.
Kraaijenbrink, P. D. A., Bierkens, M. F. P., Lutz, A. F., and Immerzeel, W. W.: Impact of a global temperature rise of 1.5 degrees Celsius on Asia's glaciers, Nature, 549, 257–260, https://doi.org/10.1038/nature23878, 2017.
Lambrecht, A. and Mayer, C.: Temporal variability of the non-steady contribution from glaciers to water discharge in western Austria, J. Hydrol., 376, 353–361, https://doi.org/10.1016/j.jhydrol.2009.07.045, 2009.
Li, Y., Zhou, X., Su, P., Kong, Y., and Liu, J.: A scaling distribution for grain composition of debris flow, Geomorphology, 192, 30–42, https://doi.org/10.1016/j.geomorph.2013.03.015, 2013.
Li, Y., Huang, C. M., Wang, B. L., Tian, X. F., and Liu, J. J.: A unified expression for grain size distribution of soils, Geoderma, 288, 105–119, https://doi.org/10.1016/j.geoderma.2016.11.011, 2017.
Liang, S. M. and Yu, Z. Y.: Global Distribution Fields of Runoff Depths Calculated by Empirical Runoff Coefficient, Arid Zone Research, 35, 1–11, https://doi.org/10.13866/j.azr.2018.01.01, 2018 (in Chinese with English abstract).
Liu, J. J., Cheng, Z. L., and Su, P. C.: The relationship between air temperature fluctuation and Glacial Lake Outburst Floods in Tibet, China, Quatern. Int., 321, 7–87, https://doi.org/10.1016/j.quaint.2013.11.023, 2014a.
Liu, W. G., Xiao, C. D., Liu, J. S., Wang, J., Wang, H., Liu, J. F., Liu, N., Zhang, T., and Lin, X.: Study of the degree-day factors on the Rongbuk Glacier in the Mt. Qomolangma, Central Himalayas, Journal of Glaciology and Geocryology, 36, 1101–1110, 2014b.
Liu, X. D. and Chen, B. D.: Climatic warming in the Tibetan Plateau during recent decades, Int. J. Climatol., 20, 1729–1742, https://doi.org/10.1002/1097-0088(20001130)20:14<1729::AID-JOC556>3.0.CO;2-Y, 2000.
Lu, M. M., Zhou, S. Q., and He, X.: A comparison of the formulas for estimation of the lake evaporation on the Tibetan Plateau: taking Lake Nam Co as an example, Journal of Glaciology and Geocryology, 39, 281–291, 2017.
Lutz, A. F., Immerzeel, W. W., Shrestha, A. B., and Bierkens, M. F. P.: Consistent increase in High Asia's runoff due to increasing glacier melt and precipitation, Nat. Clim. Change, 4, 587–592, https://doi.org/10.1038/nclimate2237, 2014.
Mergili, M., Müller, J. P., and Schneider, J. F.: Spatial-temporal development of high mountain lakes in the headwaters of the Amu Darya River (Central Asia), Glob. Planet. Change, 107, 13–24, https://doi.org/10.1016/j.gloplacha.2013.04.001, 2013.
Miller, J. D., Immerzeel, W. W., and Rees, G.: Climate Change Impacts on Glacier Hydrology and River Discharge in the Hindu Kush–Himalay as A Synthesis of the Scientific Basis, Mt. Res. Dev., 32, 461–467, https://doi.org/10.1659/MRD-JOURNAL-D-12-00027.1, 2012.
Mir, R. A., Jain, S. K., Saraf, A. K., and Goswami, A.: Detection of Changes in Glacier Mass Balance Using Satellite and Meteorological Data in Tirungkhad Basin Located in Western Himalaya, J. Indian Soc. Remote, 42, 91–105, https://doi.org/10.1007/s12524-013-0303-2, 2014.
Mir, R. A., Jain, S. K., Saraf, A. K., and Goswami, A.: Decline in snowfall in response to temperature in Satluj basin, western Himalaya, J. Earth Syst. Sci., 124, 365–382, https://doi.org/10.1007/s12040-015-0539-z, 2015a.
Mir, R. A., Jain, S. K., and Saraf, A. K.: Analysis of current trends in climatic parameters and its effect on discharge of Satluj River basin, western Himalaya, Nat. Hazards, 79, 587–619, https://doi.org/10.1007/s11069-015-1864-x, 2015b.
NASA: Earthdata Search, available at: https://search.earthdata.nasa.gov/search, last access: 12 October 2020.
Nie, Y., Liu, Q., and Liu, S.: Glacial Lake Expansion in the Central Himalayas by Landsat Images, 1990–2010, PLoSOne, 8, e83973, https://doi.org/10.1371/journal.pone.0083973, 2014.
Nie, Y., Sheng, Y. W., Liu, Q., Liu, L., Liu, S., Zhang, Y., and Song, C.: A regional-scale assessment of Himalayan glacial lake changes using satellite observations from 1990 to 2015, Remote Sens. Environ., 189, 1–13, https://doi.org/10.1016/j.rse.2016.11.008, 2017.
Nie, Y., Liu, Q., Wang, J. D., Zhang, Y. L., Sheng, Y. W., and Liu, S. Y.: An inventory of historical glacial lake outburst floods in the Himalayas based on remote sensing observations and geomorphological analysis, Geomorphology, 308, 91–106, https://doi.org/10.1016/j.geomorph.2018.02.002, 2018.
Pradhananga, N. S., Kayastha, R. B., Bhattarai, B. C., Adhikari, T. R., Pradhan, S. C., Devkota, L. P., Shrestha, A. B., and Mool, P. K.: Estimation of discharge from Langtang River basin, Rasuwa, Nepal, using a glacio-hydrological model, Ann. Glaciol., 55, 223–230, https://doi.org/10.3189/2014aog66a123, 2014.
Prakash, C. and Nagarajan, R.: Glacial Lake Inventory and Evolution in Northwestern Indian Himalaya, IEEE J.-STARS, 10, 5284–5294, https://doi.org/10.1109/JSTARS.2017.2767098, 2017.
Qin, J., Yang, K., Liang, S., and Guo, X.: The altitudinal dependence of recent rapid warming over the Tibetan Plateau, Climatic Change, 97, 321–327, https://doi.org/10.1007/s10584-009-9733-9, 2009.
Radić, V. and Hock, R.: Glaciers in the earth's hydrological cycle: assessments of glacier mass and runoff changes on global and regional scales, Surv. Geophys., 35, 813–837, https://doi.org/10.1007/s10712-013-9262-y, 2013.
Raj, K. B. G., Kumar, V. K., and Remya, S. N.: Remote sensing-based inventory of glacial lakes in Sikkim Himalaya: semi-automated approach using satellite data, Geomat. Nat. Haz. Risk, 4, 241–253, https://doi.org/10.1080/19475705.2012.707153, 2013.
Richardson, S. D. and Reynolds, J. M.: An overview of glacial hazards in the Himalayas, Quatern. Int., 65–66, 31–47, https://doi.org/10.1016/S1040-6182(99)00035-X, 2000.
Shangguan, D. H., Liu, S. Y., Ding, Y. J., Wu, L. Z., Deng, W., Guo, W. Q., Wang, Y., Xu, J., Yao, X. J., Guo, Z. L., and Zhu, W. W.: Glacier changes in the Koshi River basin, central Himalaya, from 1976 to 2009, derived from remote-sensing imagery, Ann. Glaciol., 55, 61–68, https://doi.org/10.3189/2014aog66a057, 2014.
Shrestha, A. B. and Aryal, R.: Climate change in Nepal and its impact on Himalayan glaciers, Reg. Environ. Change, 111, S65–S77, https://doi.org/10.1007/s10113-010-0174-9, 2011.
Singh, P., Kumar, N., and Arora, M.: Degree-day factors for snow and ice for Dokriani Glacier, Garhwal Himalayas, J. Hydrol., 235, 1–11, https://doi.org/10.1016/S0022-1694(00)00249-3, 2000.
Solomina, O. N., Bradley, R. S., Jomelli, V., Geirsdottir, A., Kaufman, D. S., Koch, J., McKay, N. P., Masiokas, M., Miller, G., Nesje, A., Nicolussi, K., Owen, L. A., Putnam, A. E., Wanner, H., Wiles, G., and Yang, B.: Glacier fluctuations during the past 2000 years, Quaternary Sci. Rev., 149, 61–90, https://doi.org/10.1016/j.quascirev.2016.04.008, 2016.
USGS: EarthExplorer, available at: https://earthexplorer.usgs.gov/, last access: 12 September 2020.
Wang, L. Q, Pan, G. D., Ding, J., and Yao, D. S.: Tectonic Map and Instructions for the Tibet Plateau and Adjacent Areas, Geological Publishing House, Beijing, China, 2013.
Wang, S. J. and Jiao, S. T.: Evolution and outburst risk analysis of moraine-dammed lakes in the central Chinese Himalaya, J. Earth Syst. Sci., 124, 567–576, https://doi.org/10.1007/s12040-015-0559-8, 2015.
Wang, S. J. and Zhang, T.: Spatially change detection of glacial lakes in the Koshi River Basin, the Central Himalaya, Environ. Earth Sci., 72, 4381–4391, https://doi.org/10.1007/s12665-014-3338-y, 2014.
Wang, W. C., Xiang, Y., Gao, Y., Lu, A. X., and Yao, T. D.: Rapid expansion of glacial lakes caused by climate and glacier retreat in the Central Himalayas, Hydrol. Process., 29, 859–874, https://doi.org/10.1002/hyp.10199, 2015.
Wang, W. C., Gao, Y., Anacona, P. I., Lei, Y. B., Xiang, Y., Zhang, G. Q., Li, S. H., and Lu, A. X.: Integrated hazard assessment of Cirenmaco glacial lake in Zhangzangbo valley, Central Himalayas, Geomorphology, 306, 292–305, https://doi.org/10.1016/j.geomorph.2015.08.013, 2018.
Wang, X., Liu, S. Y., Guo, W. Q., Yao, X. J., Jiang, Z. L., and Han, Y. S.: Using Remote Sensing Data to Quantify Changes in Glacial Lakes in the Chinese Himalaya, Mt. Res. Dev., 32, 203–212, https://doi.org/10.1659/MRD-JOURNAL-D-11-00044.1, 2012.
Wei, J. F., Liu, S. Y., Guo, W. Q., and Yao, X. J.: Surface-area changes of glaciers in the Tibetan Plateau interior area since the 1970s using recent Landsat images and historical maps, Ann. Glaciol., 55, 213–222, https://doi.org/10.3189/2014aog66a038, 2014.
Winiger, M., Gumpert, M., and Yamout, H.: Karakorum–Hindukush–western Himalaya: Assessing high-altitude water resources, Hydrol. Process., 19, 2329–2338, https://doi.org/10.1002/hyp.5887, 2005.
Xiang, Y., Gao, Y., and Yao, T. D.: Glacier change in the Poiqu River basin inferred from Landsat data from 1975 to 2010, Quatern. Int., 349, 392–401, https://doi.org/10.1016/j.quaint.2014.03.017, 2014.
Xiang, Y., Yao, T. D., Gao, Y., Zhang, G. Q., Wang, W. C., and Tian, L. D.: Retreat rates of debris-covered and debris-free glaciers in the Koshi River Basin, central Himalayas, from 1975 to 2010, Environ. Earth Sci., 77, 285, https://doi.org/10.1007/s12665-018-7457-8, 2018.
Xu, D. M. and Feng, Q. H.: Studies on catastrophes of glacial debris flow and glacial lake outburst flood in China, Journal of Glaciology and Geocryology, 10, 284–289, 1988 (in Chinese with English abstract).
Yao, T. D.: Glacial fluctuations and its impacts on lakes in the southern Tibetan Plateau, Chinese Sci. Bull., 55, 2071–2071, https://doi.org/10.1007/s11434-010-4327-5, 2010 (in Chinese with English abstract).
Yao, T. D., Thompson, L., Yang, W., Yu, W. S., Gao, Y., Guo, X. J., Yang, X. X., Duan, K. Q., Zhao, H. B., Xu, B. Q., Pu, J. C., Lu, A. X., Xiang, Y., Kattel, D. B., and Joswiak, D.: Different glacier status with atmospheric circulations in Tibetan Plateau and surroundings, Nat. Clim. Change, 2, 663–667, https://doi.org/10.1038/nclimate1580, 2012.
Zhang, G. Q., Yao, T. D., Xie, H. J., Wang, W. C., and Yang, W.: An inventory of glacial lakes in the Third Pole region and their changes in response to global warming, Glob. Planet. Change, 131, 148–157, https://doi.org/10.1016/j.gloplacha.2015.05.013, 2015.
Zhang, G. Q., Bolch, T., Allen, S., Linsbauer, A., Chen, W. F., and Wang, W. C.: Glacial lake evolution and glacier-lake interactions in the Poiqu River basin, central Himalaya, 1964–2017, J. Glaciol., 65, 347–365, https://doi.org/10.1017/jog.2019.13, 2019.
Zhang, Y., Liu, S. Y., and Ding.,Y. J.: Spatial Variation of Degree-day Factors on the Observed Glaciers in Western China, Acta Geographica Sinica, 61, 89–98, https://doi.org/10.3321/j.issn:0375-5444.2006.01.009, 2006.
Zheng, Y., Zhang, J. J., Wang, J. M., Wang, X. X., and Wang, M.: Rapid denudation of the Himalayan orogen in the Nyalam area, southern Tibet, since the Pliocene and implications for tectonics–climate coupling, Chin. Sci. Bull., 59, 874–885, https://doi.org/10.1007/s11434-014-0116-x, 2014.