the Creative Commons Attribution 4.0 License.
the Creative Commons Attribution 4.0 License.
 | 11 Oct 2021
Depth to water table correction for initial carbon-14 activities in groundwater mean residence time estimation
Cameron Wood
Ian Cartwright
Tanya Oliver
Carbon-14 (14C) is routinely used to determine mean residence times (MRTs) of groundwater. 14C-based MRT calculations typically assume that the unsaturated zone is in equilibrium with the atmosphere, controlling the input 14C activity. However, multiple studies have shown that unsaturated zone 14C activities are lower than atmospheric values. Despite the availability of unsaturated zone 14C data, no attempt has been made to generalise initial 14C activities with depth to the water table. We utilise measurements of unsaturated zone 14C activities from 13 studies to produce a 14C–depth relationship to estimate initial 14C activities. The technique only requires the depth to the water table at the time of sampling or an estimate of depth to water in the recharge zone to determine the input 14C activity, making it straightforward to apply. Applying this new relationship to two Australian datasets (113 14C measurements in groundwater) shows that MRT estimates were up to 9250 years younger when the 14C–depth correction was applied relative to conventional MRTs. These findings may have important implications for groundwater samples that suggest the mixing of young and old waters and the determination of the relative proportions of young and waters, whereby the estimated fraction of older water may be much younger than previously assumed. Owing to the simplicity of the application of the technique, this approach can be easily incorporated into existing correction schemes to assess the sensitivity of unsaturated zone 14C to MRTs derived from 14C data.
- Article
(1771 KB) - Full-text XML
-
Supplement
(192 KB) - BibTeX
- EndNote


Environmental tracers are widely used to estimate both groundwater residence times (e.g. Love et al., 1994; Plummer and Sprinkle, 2001; Cartwright and Morgenstern, 2012; Jurgens et al., 2012) and recharge rates (e.g. Leaney and Allison, 1986; Cartwright et al., 2007; Gillon et al., 2009; Wood et al., 2015) that are important to effectively manage groundwater resources. Groundwater tracers can be used to determine mean residence times (MRTs) from tens to hundreds of years (e.g. tritium or CFCs), thousands to tens of thousands of years (e.g. carbon-14) to millions of years (e.g. helium-4 or chlorine-36). In particular, carbon-14 (14C) is widely used as a groundwater tracer owing to the ubiquitous presence of dissolved inorganic carbon in groundwater. With a half-life of 5730 years, 14C can be used to determine residence times of the order of 1000 to 30 000 years, which encompasses the range of residence times in many regional aquifers (Clark and Fritz, 1997). The use of accelerator mass spectrometry since the 1990s has significantly reduced the volumes of water required and has allowed highly precise measurements of 14C activities (of the order of ±1 %), further facilitating the use of 14C as a groundwater tracer (Cartwright et al., 2020).
Although atmospheric 14C activities have varied over time (e.g. Clark and Fritz, 1997; Cartwright et al., 2017), most studies of regional groundwater assume that prior to the atmospheric bomb testing in the 1960s they were constant at 100 % modern carbon (pmC). This approach yields so-called conventional radiocarbon ages in years before present (BP) where AD 1950 = 0 years BP (Clark and Fritz, 1997; Plummer and Glynn, 2013; Cartwright et al., 2020). The subsequent input of 14C-free C from calcite dissolution within aquifers may lower 14C activities, and several schemes based on statistical corrections, major ion geochemistry, and stable and radioactive isotopes exist to correct for this (Ingerson and Pearson, 1964; Vogel, 1967; Tamers, 1967; Mook, 1972; Fontes and Garnier, 1979; Clark and Fritz, 1997; Coetsiers and Walraevens, 2009; Han and Plummer, 2016; McCallum et al., 2018). Locally geogenic CO2 and/or the oxidation of old organic matter may also lower 14C activities (e.g. Clark and Fritz, 1997; Cartwright et al., 2017, 2020).
Further complications in the use of 14C to estimate MRTs relate to the input function of 14C into the subsurface. 14C activities of CO2 in the unsaturated zone are typically assumed to be in equilibrium with the atmosphere at the time of recharge (e.g. Mazor, 2004). However, 14C activities of CO2 in the unsaturated zone (14Cuz) are commonly far lower than those of the atmosphere (e.g. Reardon et al., 1979; Haas et al., 1983; Thorstenson et al., 1983; Bacon and Keller, 1998; Carmi et al., 2009; Wood et al., 2014). For example, Carmi et al. (2009) note that 14Cuz activities were approximately 54 % of the atmospheric values in a coastal aquifer in Israel. Similar low 14Cuz activities that decrease with depth below the land surface have been recorded elsewhere (e.g. Yang et al., 1985; Walvoord et al., 2005; Wood et al., 2014). Despite the important role of the unsaturated zone in controlling input 14C activities, this issue is rarely discussed, and no attempt has been made to produce a generalised relationship that relates initial 14C activities to depth to the water table.
The aim of this study is to produce a general relationship between 14Cuz activity and the depth below surface to facilitate the estimation of input 14C activities to estimate MRTs. We produce a relationship using 14Cuz and sample depth data from 13 studies across North America, Europe, the Middle East, and Australia. We provide a demonstration of the newly presented relationship using datasets from the Limestone Coast and Ovens/Goulburn–Broken catchments in Australia to estimate MRTs. For the Ovens/Goulburn–Broken catchments dataset, we also present tritium data to provide supporting information for 14C-based calculations of MRTs. This work provides a simple-to-use approach to determine input 14C activities for groundwater MRT calculations that requires no additional measurement of groundwater chemistry. This approach can be incorporated into existing correction schemes to assess sensitivity of 14Cuz to MRTs derived from 14C data.
2.1 Unsaturated zone data collation
14Cuz activities were collated from the following sources: Kunkler (1969); Fritz et al. (1978); Reardon et al. (1979); Haas et al. (1983); Gillon et al. (2009); Thorstenson et al. (1983); Yang et al. (1985); Leaney and Allison (1986); Bacon and Keller (1998); Thorstenson et al. (1998); Walvoord et al. (2005); Carmi et al. (2009); Wood et al. (2014). A total of 181 14Cuz activities were collated from 14 sites across North America, Europe, the Middle East, and Australia (Fig. 1a). 14Cuz activities were typically presented in tabular format in the original studies. In cases where data were presented graphically, 14Cuz activities were obtained by digitising plotted results.
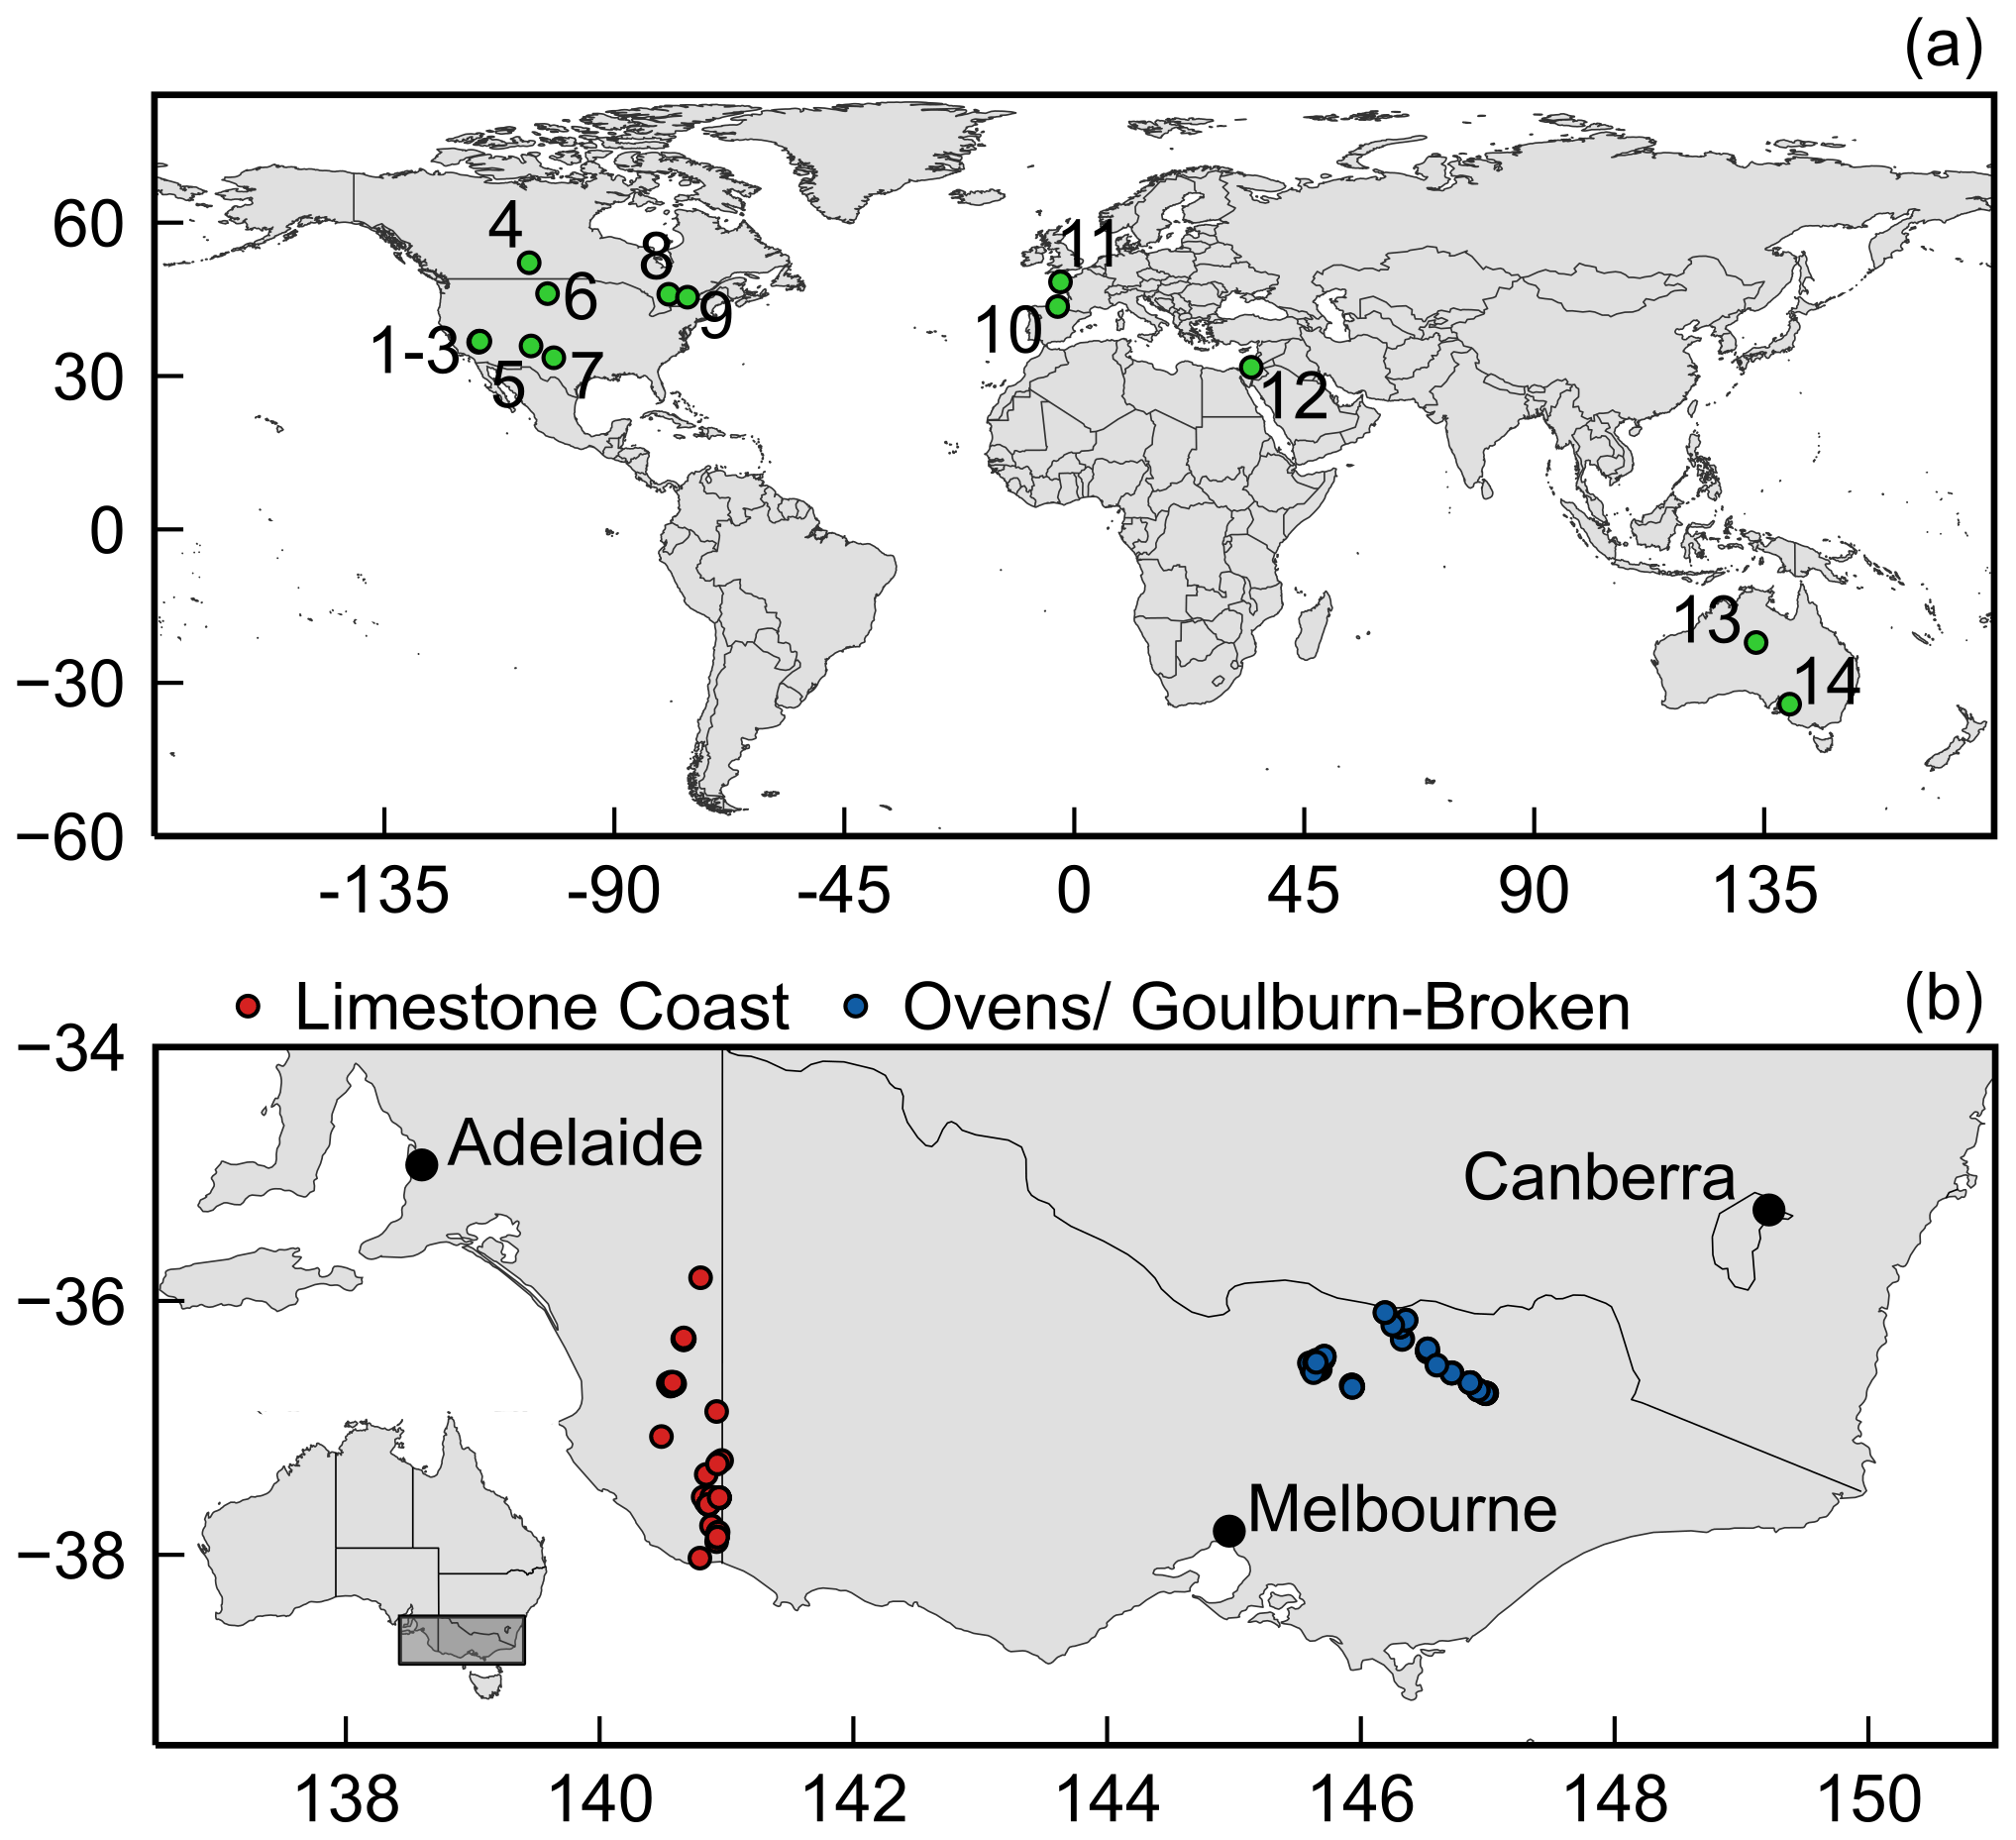
Figure 1Locations of 14C data used. (a) Locations of studies of unsaturated zone 14C (14Cuz), where 1 is Walvoord et al. (2005), 2 is Yang et al. (1985), 3 is Thorstenson et al. (1998), 4 is Bacon and Keller (1998), 5 is Kunkler (1969), 6 is Haas et al. (1983), 7 is Thorstenson et al. (1983), 8 is Reardon et al. (1979), 9 is Fritz et al. (1978), 10 and 11 are Gillon et al. (2009), 12 is Carmi et al. (2009), 13 is Wood et al. (2014), and 14 is Leaney and Allison (1986). (b) Locations of groundwater 14C (14Cgw) data. Red markers show locations of 14Cgw samples from the Limestone Coast region of South Australia. Blue markers show locations of 14Cgw samples from the Ovens/Goulburn–Broken catchments, Victoria.
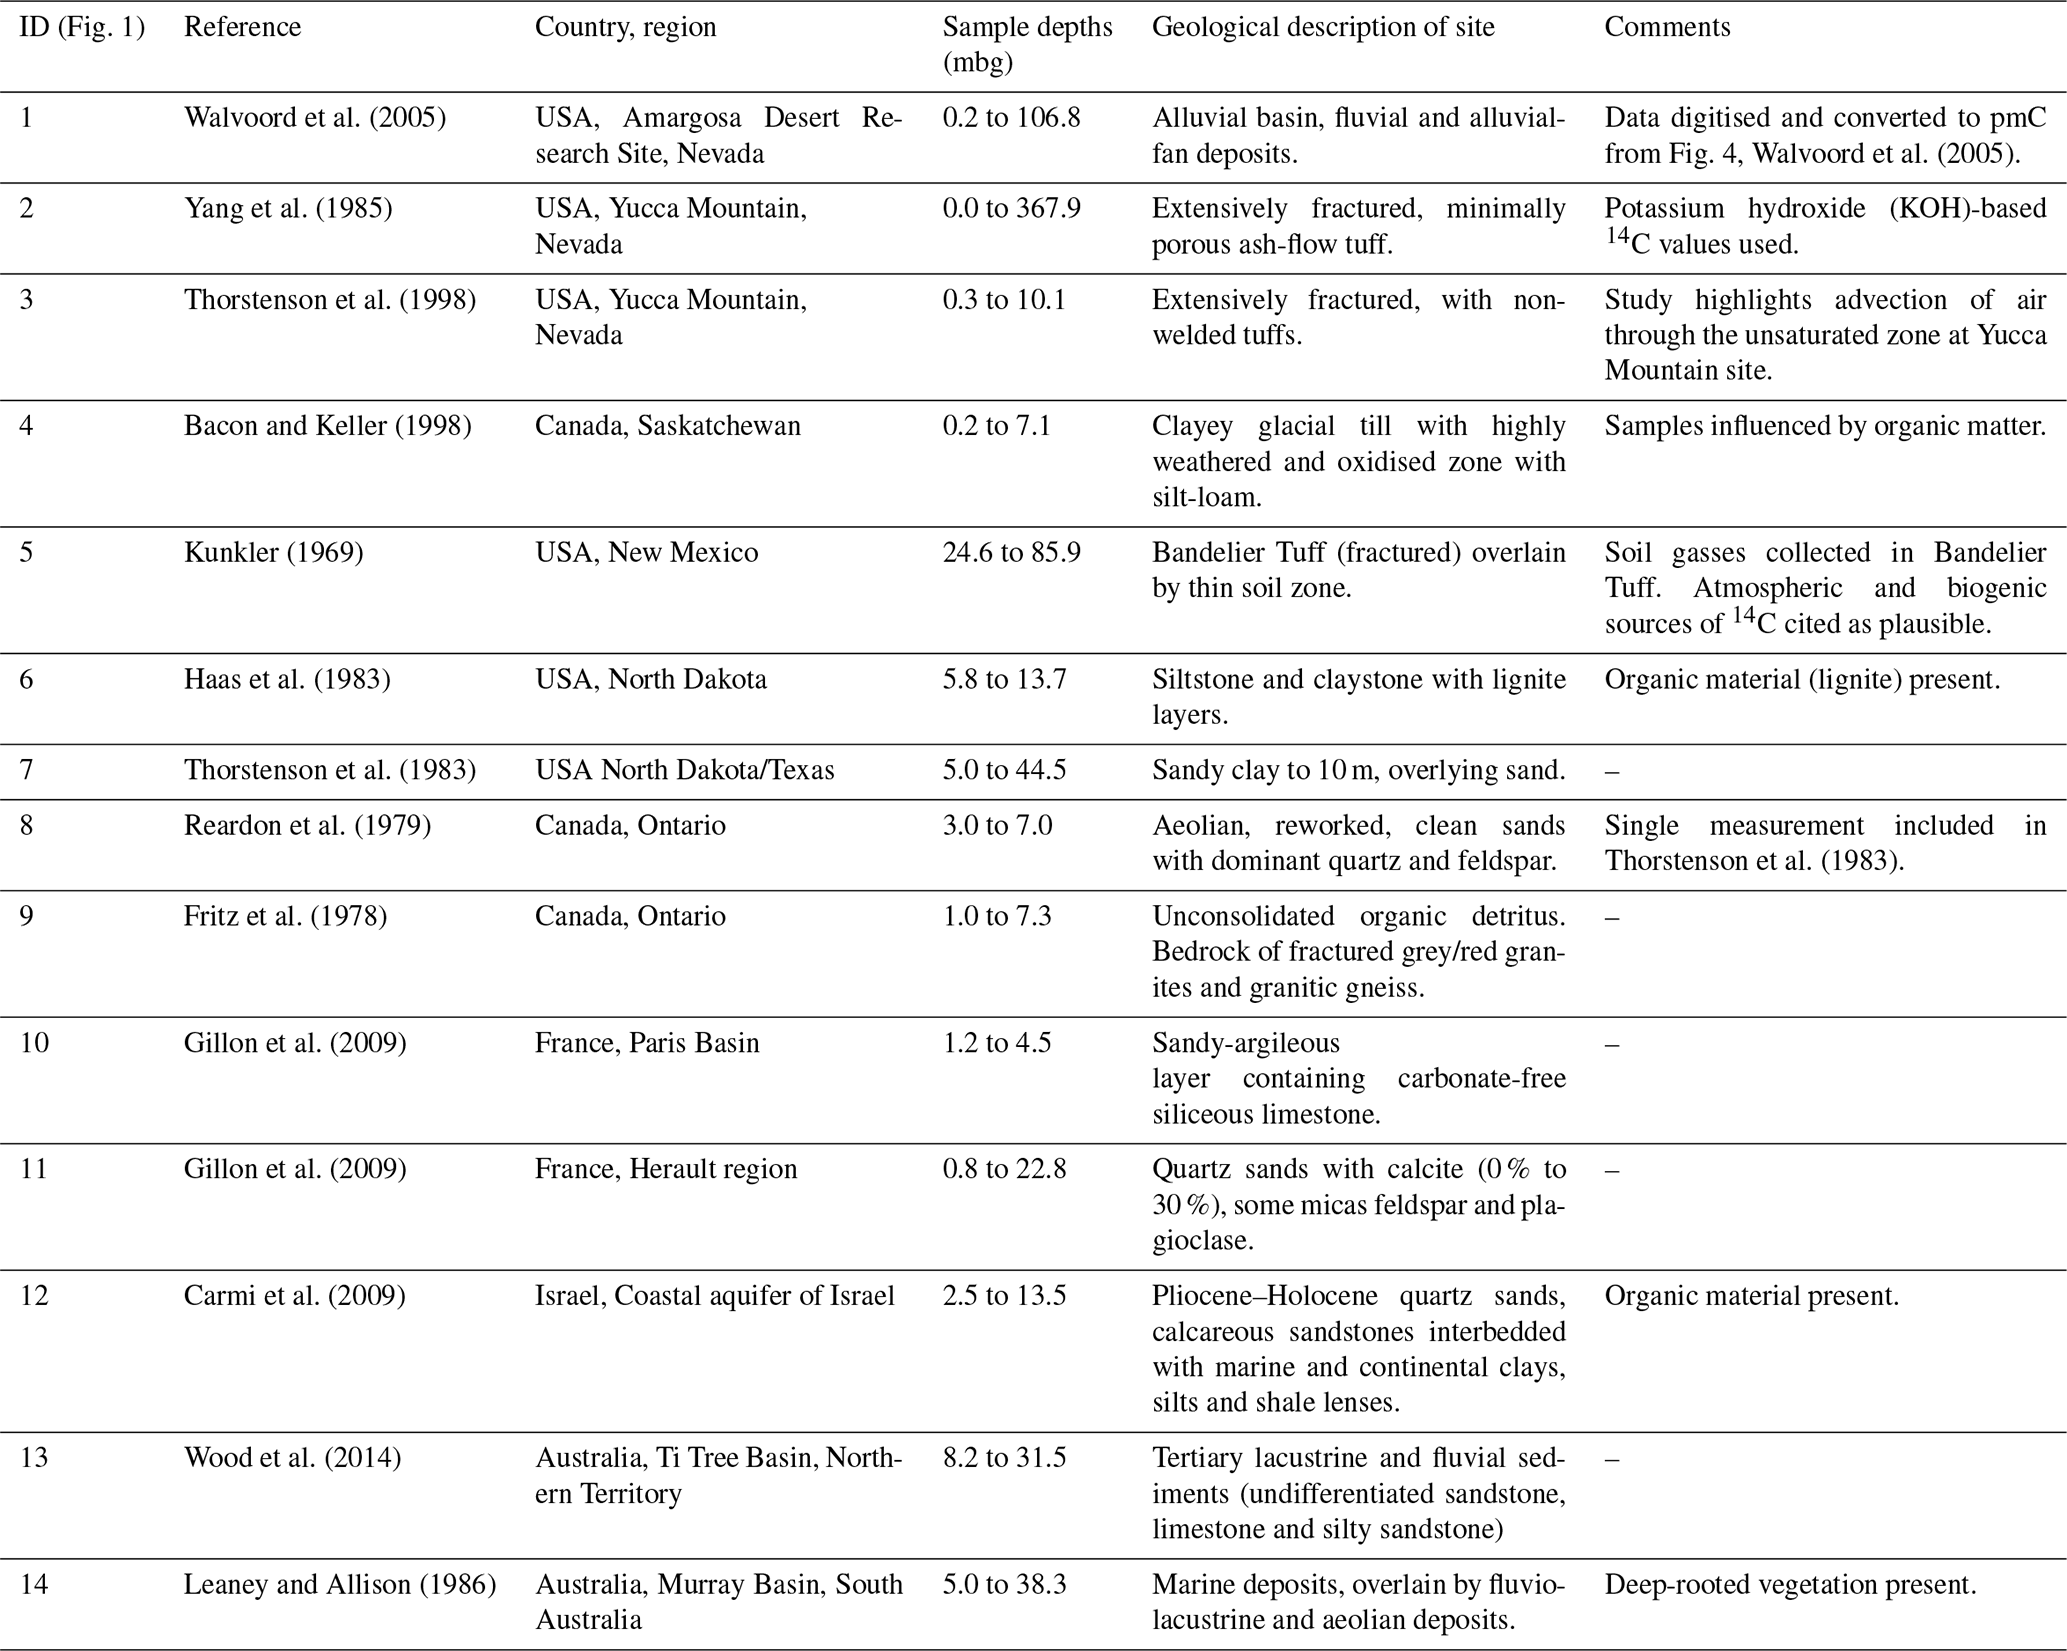
The 14Cuz study sites are predominantly located in North America (9 out of the 14 sites considered here), with 2 study sites from France (Gillon et al., 2009), 2 sites from Australia (Leaney and Allison, 1986; Wood et al., 2014) and 1 site in Israel (Carmi et al., 2009). A summary of the collated datasets is provided in Table 1. The complete 14Cuz dataset is available in Table S1 in the Supplement.
Table 1Summary of studies of 14Cuz. Sample depths are presented in metres below ground (mbg).
2.2 Saturated zone data collation
14C activities of groundwater samples (14Cgw) were collated from the Limestone Coast region in South Australia and the Ovens/Goulburn–Broken catchments in Victoria (Fig. 1b). Samples of 14Cgw for the Limestone Coast region were collated from Love et al. (1994), Dogramaci (1998), Brown et al. (2001), van den Akker (2006), Wood (2011), SKM (2012), Turnadge et al. (2013) and SA Water (2020). 14Cgw activities from the Ovens/Goulburn–Broken catchments are from Cartwright et al. (2007) and Cartwright and Morgenstern (2012). In total, 51 samples were collated from the Limestone Coast and 62 samples from the Ovens/Goulburn–Broken catchments (Fig. 1b). The Ovens/Goulburn–Broken catchments dataset also includes 3H activities, which are useful for understanding mixing between old and young groundwater (e.g. Jasechko et al., 2017).
Depth to water (DTW, presented in metres below ground level, mbg) values to accompany the measured 14Cgw activities were included in Cartwright et al. (2007) and Cartwright and Morgenstern (2012) for the Ovens/Goulburn–Broken catchments. For the Limestone Coast, DTW values were determined as follows: if detailed time series of DTW were available for the sampled well, the measurement recorded as close in time to the 14Cgw sampling was used. Where this was not possible, the average DTW for the sample year was used in the sample well or a nearby well. All 14Cgw and DTW data for the groundwater samples from the Limestone Coast and Ovens/Goulburn–Broken catchments are provided in Table S2 in the Supplement. It is likely that the DTW in the recharge zone is more relevant. One approach could have been to determine DTW from spatially mapped water levels (e.g. Wood et al., 2017). Nonetheless, the simple approach to estimate DTW from the sampled wells allows for a demonstration of the methods outlined here.
2.3 Data analysis
The unsaturated zone sample depth–14Cuz relationship was produced by fitting the 14Cuz and sample depth data (Table S1) using the curve_fit function in the scipy.optimize library and the nominal_values function from the uncertainties.unumpy libraries in Python. The curve fitting approach was used to determine the coefficients a and b in the equation 14Cuz=a exp(bz). This approach also was used to find the best fit to the data as well as to produce upper and lower bounds on the best fit relationship based on the standard deviation of the observed data.
Not all collated 14Cuz data were used to produce the 14C–depth relationships, with three principal reasons for the exclusion of data: (1) 14Cuz activities were influenced by the presence of high levels of organic material in the unsaturated zone; (2) 14Cuz activities were influenced by deep-rooted vegetation or (3) where modern atmospheric gases may have influenced the measured 14Cuz activities. Modern air can pollute samples either through the drilling process or through the advection of air through the unsaturated zone (e.g. Thorstenson et al., 1998). A description of whether or not data values were used in the fitting process and explanations for the omission of data values are provided in Table S1.
The compiled 14Cuz dataset (Table S1) includes the depth below the surface of the sample, the measured 14C, and the sample year. It is expected that the 14Cuz activities will be elevated where dissolved inorganic carbon influenced by the bomb peak activities has entered the subsurface. The actual input function of 14C will differ from atmospheric inputs, as the 14C is first cycled through vegetation, with significant delays between the uptake of 14C in trees and entering the unsaturated zone. For example, Fritz et al. (1978) measured 14Cuz values of 141±10 pmC in the unsaturated zone in 1975, after peak 14C activities of the order of 180 pmC in the atmosphere in the mid-1960s (Fig. S1, Hua et al., 2013). Owing to the abovementioned complexities, the sample date was not taken into account in the fitting process. Additionally, while many of the unsaturated zone studies also included δ13C measurements, these data were not utilised here as δ13C–depth profiles have been shown to be almost vertical with depth (e.g. Walvoord et al., 2005; Wood et al., 2017), containing little additional information.
14C-based MRTs (years) were determined from the groundwater 14C measurements using the simple radioactive decay equation (Clark and Fritz, 1997):
where 14Cgw is the measured 14C activity in groundwater (pmC), 14Ci is the initial 14C activity of the recharging water (pmC) and q is the proportion of dissolved inorganic carbon that originated from groundwater recharge. While this approach neglects the fact that (1) water follows variable flow paths, (2) undergoes dispersion within the aquifer and also (3) assumes a uniform atmospheric 14C activity, it serves to illustrate the effects of variable 14Cuz. It is also the approach that is used in the majority of 14C studies (e.g. Cartwright et al., 2020). Again, for simplicity, we initially do not account for the input of 14C-free C from the aquifer matrix (i.e. q=1); the impacts of the addition of 14C-free C are discussed in Sect. 3.3.
MRTs were calculated from the measured 14Cgw activities using Eq. (1), firstly assuming that 14Ci=100 pmC to produce conventional MRT estimates. Secondly, 14Ci values determined from the DTW at the time of sampling using the DTW–14C relationship derived in Sect. 3.1 were used to calculate the MRTs. MRTs were also estimated using the upper and lower bounds of the fitted relationship, producing upper and lower bounds on the MRT estimates based on the DTW corrections. The calculation of MRTs ignores the time taken for water to infiltrate through the unsaturated zone. The timescales of infiltration are expected to be of the order of a few weeks to a few years, which is short relative to the several thousand-year timeframes of 14C-based MRTs.
The lower limit of MRTs that can be estimated from 14C analyses is of the order of 1000–2000 years (Clark and Fritz, 1997; Cartwright et al., 2020). Here, MRTs of less than 1000 years are considered to be “young water”. For visualisation purposes, MRTs of < 500 years are presented as 500 years as precise 14C-based MRTs cannot be determined for these samples. We adopt the Jasechko et al. (2017) definition of “fossil water” as water with MRTs that exceed 12 000 years, which corresponds to the beginning of the Holocene.
3.1 Development of the depth–14C relationship
The 181 unsaturated zone 14C activities are shown in Fig. 2. Shallow 14Cuz data (< 20 mbg), particularly the shallow values with very low 14C activities (< 25 pmC), were excluded from the data-fitting process as the original articles suggest that these samples were influenced by oxidation of “old” (low 14C activity) organic matter in the unsaturated zone sediments (Fig. 2). Unsaturated zone studies with data that were excluded from the data-fitting process due to the presence of organic matter included Bacon and Keller (1998), Haas et al. (1983), and Carmi et al. (2009). Other 14C activities were influenced by deep-rooted vegetation (e.g. Leaney and Allison, 1986) and were also excluded from the data that were used in the fitting process. Finally, data from the Yucca Mountain sites were omitted from the fitting process. Thorstenson et al. (1998) proposed that advection of modern air through the unsaturated zone has produced elevated 14Cuz activities at the site. Thus, the relationships shown in Fig. 2 are representative of sedimentary basins and should generally not be applied where high organic matter or deep-rooted vegetation is present or where advection of modern air occurs in the unsaturated zone.
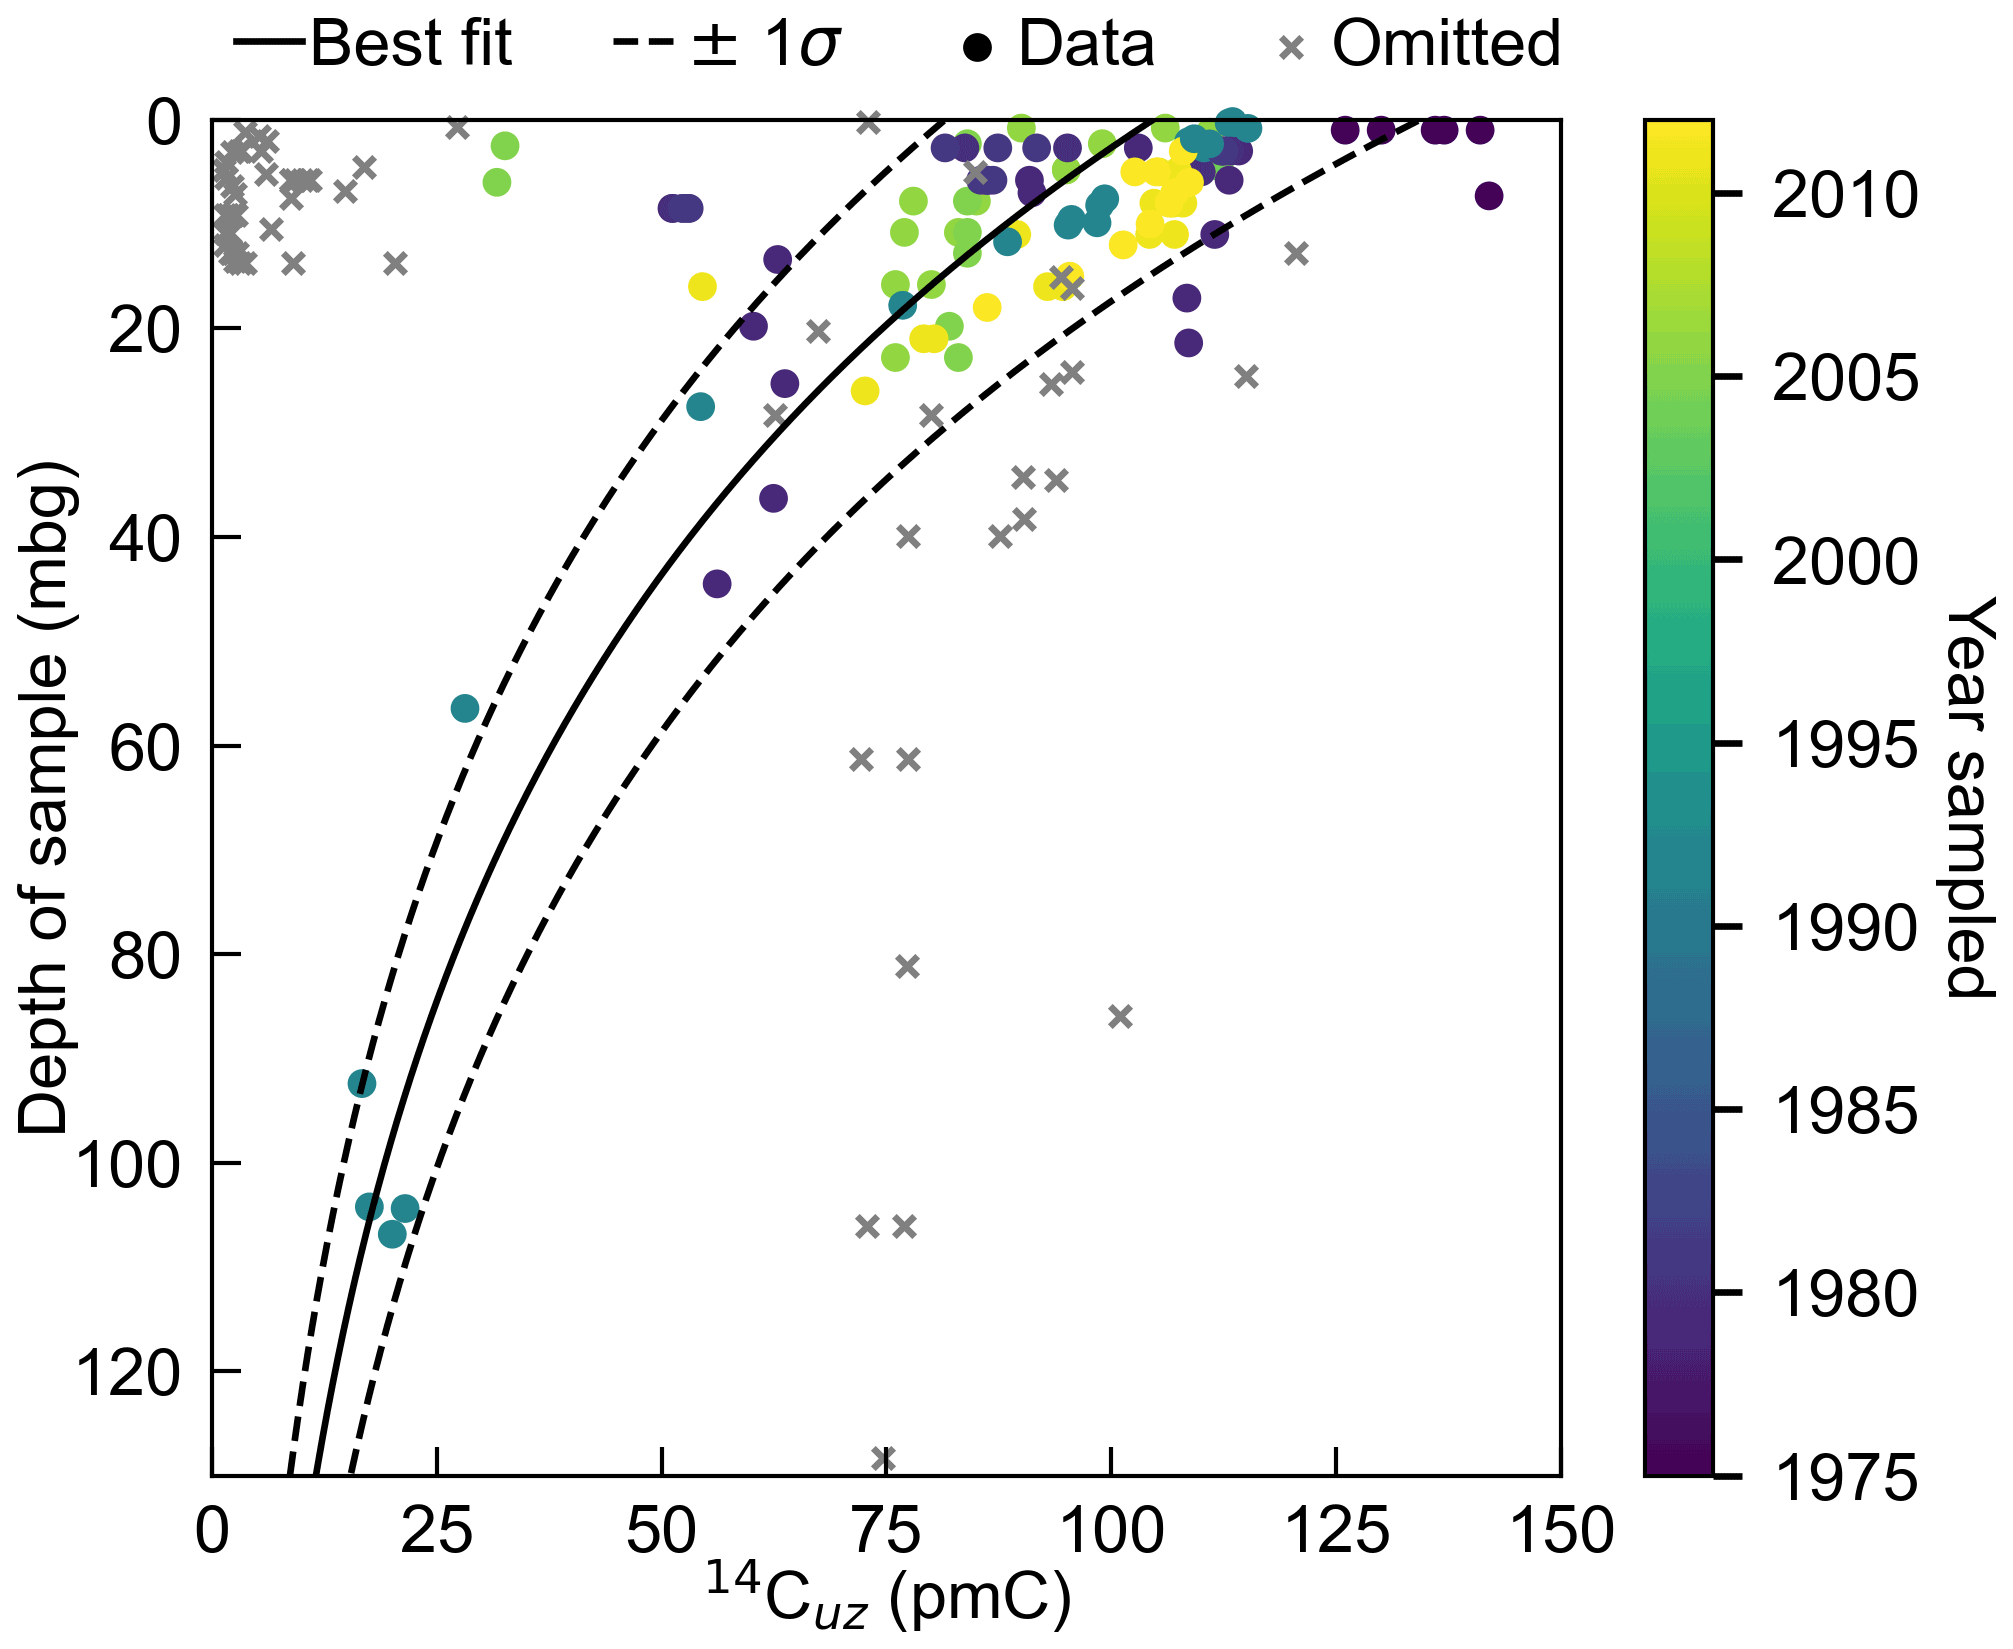
Figure 2Relationship between pmC in the unsaturated zone (14Cuz) and depth below the surface for sedimentary basins. Data points omitted from the fitting process (grey crosses) were omitted due to the presence of high organic matter, deep-rooted vegetation, or where gasses were influenced by the advection of modern air into the unsaturated zone.
The best fit relationship (R2= 0.64) presented in Fig. 2 (solid line) can be represented mathematically as
where z is the depth below ground (mbg). The value 104.634 in Eq. (2) represents the 14Ci at z= 0, which is reasonably consistent with present atmospheric 14C activities (e.g. Hua et al., 2013). The upper and lower bounds in Fig. 2 (dashed lines) were based on ±1 standard deviation (σ). The upper and lower bounds' relationships can be represented mathematically as
and
The selection of 1σ was used rather than the more commonly used 2σ (representing upper and lower 95 % confidence intervals) as the use of 2σ produced unrealistically high 14Cuz activities in the shallow zone (0–1 m). As with the application of other correction schemes, care should be taken in interpreting MRTs determined using Eqs. (2)–(4) to determine 14Ci values.
3.2 Application of the depth–14C relationship
Conventional MRTs determined assuming 14Ci= 100 pmC (Eq. 1) and those using the DTW correction (Eq. 2) for the Limestone Coast and Ovens/Goulburn–Broken catchments are presented in Fig. 3.
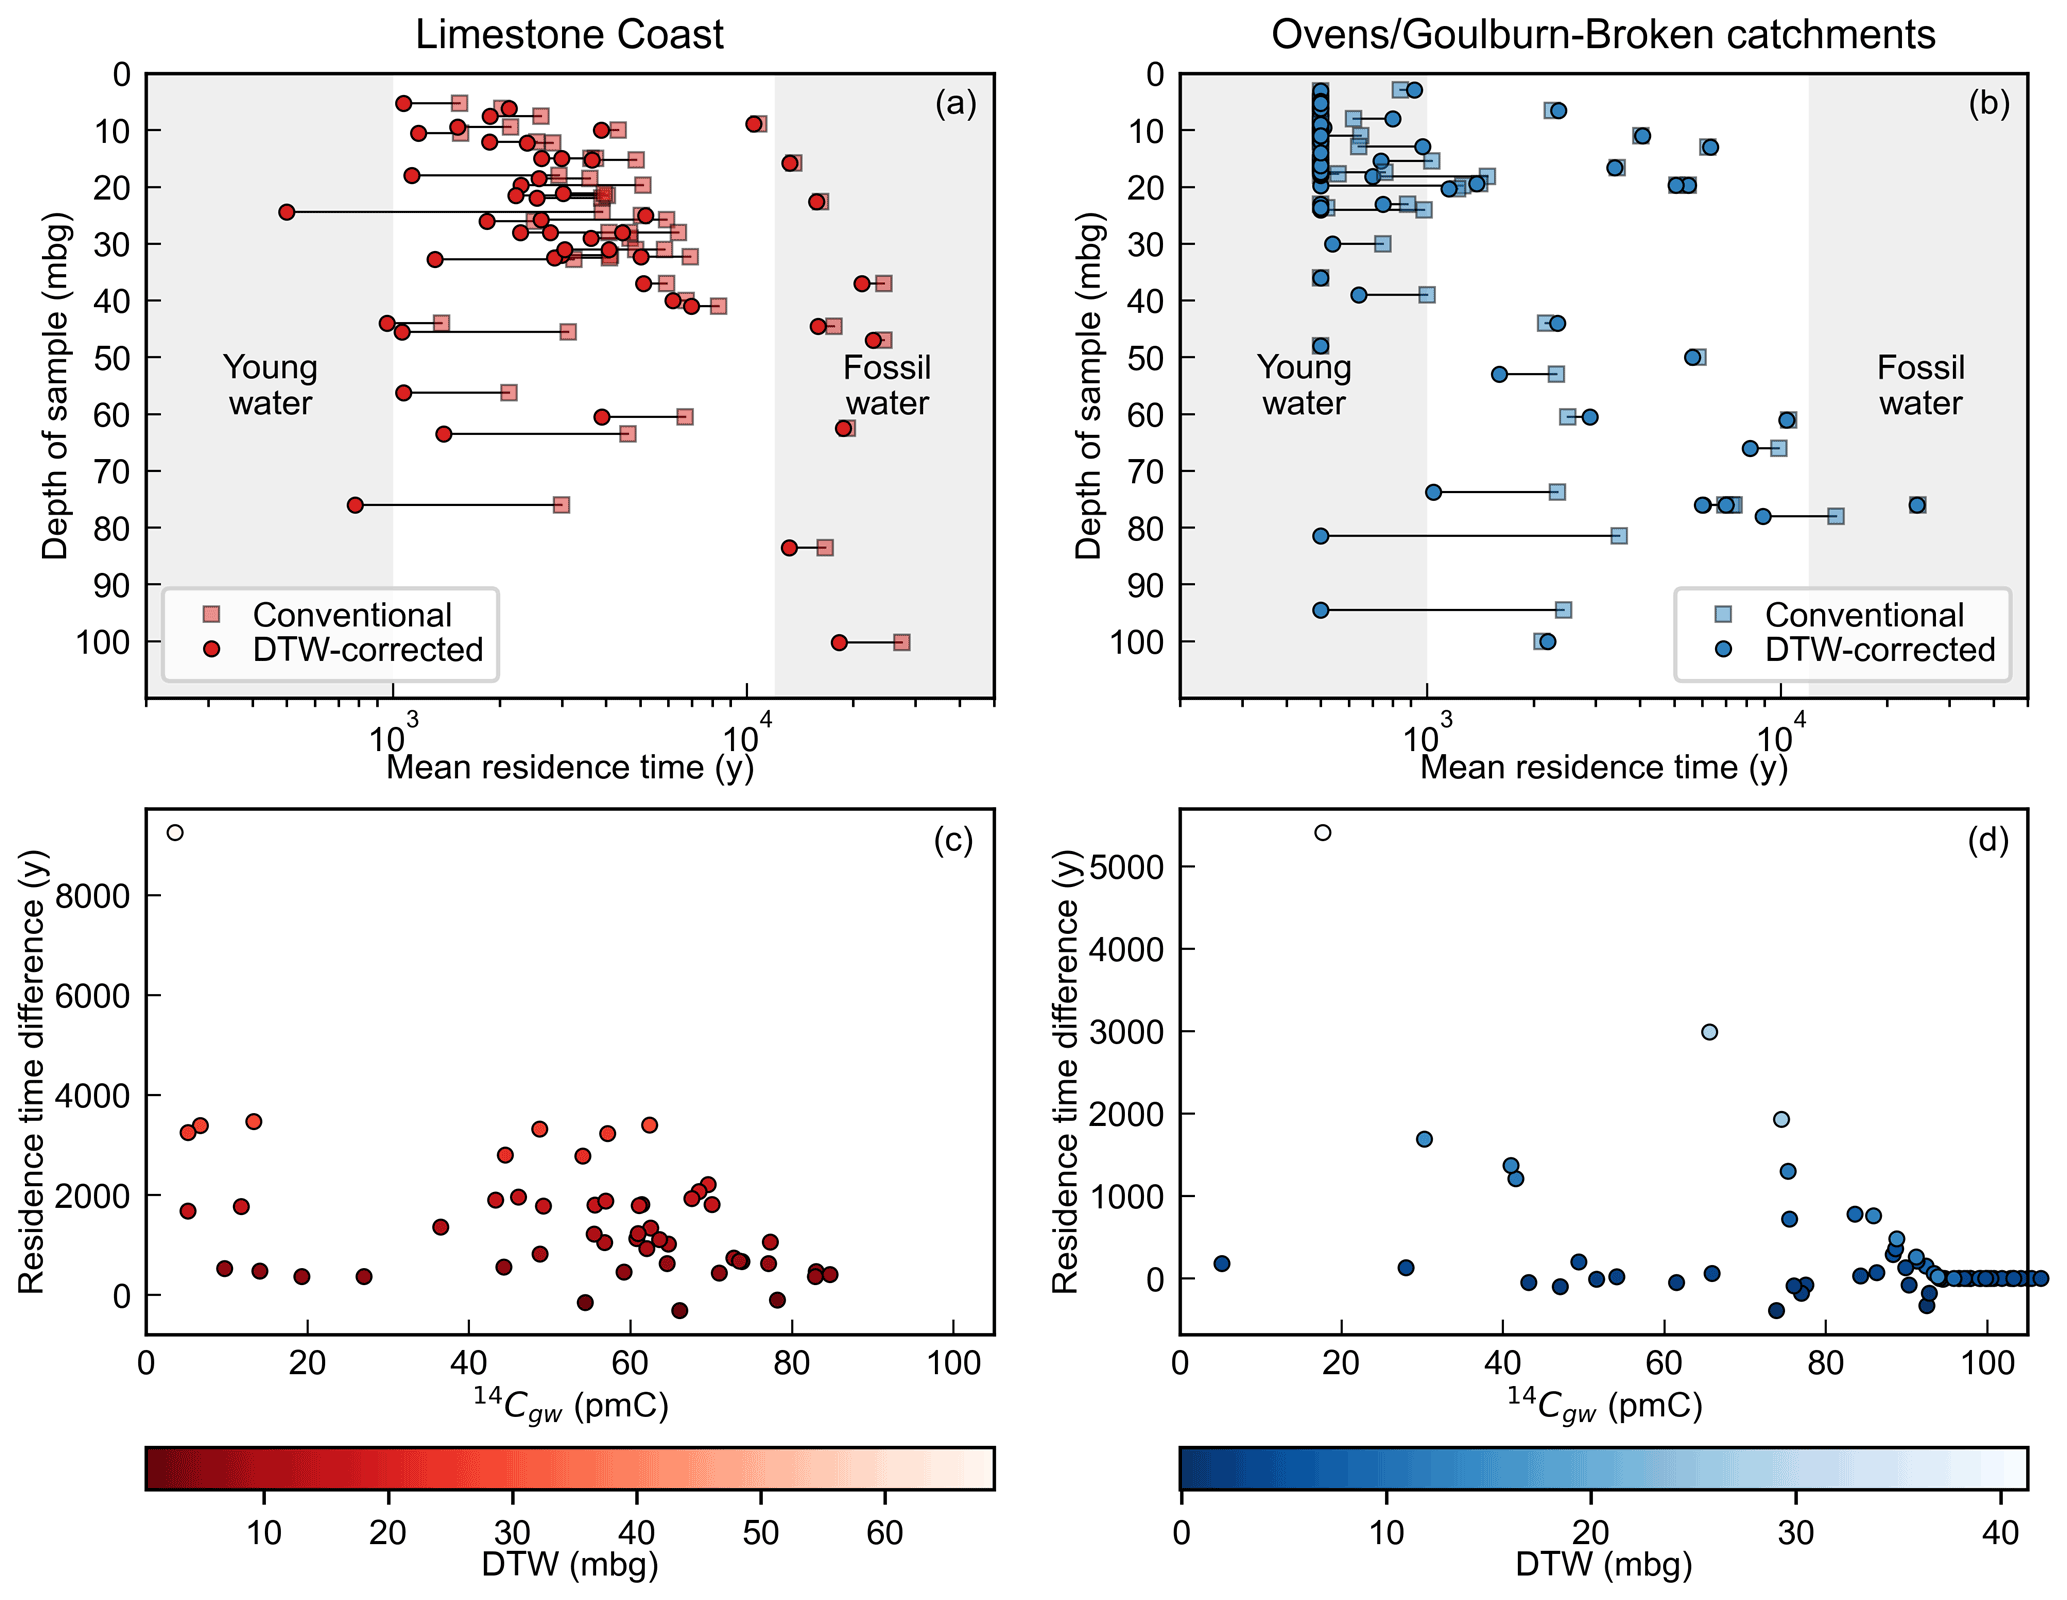
Figure 3Calculated MRTs for the Limestone Coast (left column, red colours) and the Ovens/Goulburn–Broken catchments (right column, blue colours). Panels (a) and (b) show the difference in calculated MRTs for the uncorrected (Eq. 1, where 14Ci= 100 pmC, square markers) and depth-corrected 14Ci values (circle markers). Panels (a) and (b) use definitions of young water of ≤ 1000 years (e.g. Cartwright et al., 2020) and fossil water of ≥ 12 000 years (Jasechko et al., 2017). Panels (c) and (d) show the difference in MRTs between the use of 100 pmC and the value calculated in Eq. (2) against the measured 14C activity in groundwater (14Cgw). Marker colours in (c) and (d) are based on the depth to the water table (mbg) when the sample was collected.
The application of Eq. (2) to determine 14Ci values generally produced younger MRTs than the conventional MRTs (Fig. 3a, b). Exceptions to this observation occurred in cases where the DTW-corrected 14Ci values exceeded 100 pmC (which, following Eq. 2, occurs when the DTW < 2.67 mbg), which occurred more frequently in the Ovens/Goulburn–Broken catchments (Fig. 3b). The application of Eq. (2) to determine 14Ci led to 3 young water samples (out of 51) for the Limestone Coast, where the uncorrected residence times were > 1000 years (Fig. 3a). The greatest difference between the DTW-corrected and conventional MRTs for the Limestone Coast data was 9250 years, which corresponded to the 14C measurement with the deepest DTW (68.8 mbg, Fig. 3c). On average, the MRTs were approximately 1500 years younger for the DTW-corrected MRTs relative to the conventional MRTs for the Limestone Coast data (Fig. 3a, c).
The MRTs from the Ovens/Goulburn–Broken catchments (Fig. 3b, d) were generally much younger than the Limestone Coast samples. For the Ovens/Goulburn–Broken catchments, the greatest difference between the DTW-corrected and conventional MRTs was 5410 years, with an average difference of approximately 300 years. As was the case with the Limestone Coast samples, the largest difference in estimated residence times was produced for the sample with the largest depth to water at the time of sampling (41.3 mbg). The average difference between the DTW-corrected and conventional MRTs was skewed for the Ovens/Goulburn–Broken catchments by the fact that many of the calculated MRTs were young (< 500 years) for both the conventional and DTW-corrected approaches. Five samples for the Ovens/Goulburn–Broken catchments were deemed to be young (< 1000 years) after the application of the DTW correction. Interestingly for the Ovens/Goulburn–Broken catchments, one sample originally categorised as fossil water (> 12 000 years) was no longer classified as fossil with the application of the DTW-correction approach.
The MRTs presented in Fig. 3 used 100 pmC as the 14Ci value and best fit correction scheme to determine 14Ci (Eq. 2). Figure 4 includes the use of Eqs. (2)–(4) to determine 14Ci values, thus providing lower and upper bounds on the estimated MRTs from the DTW-correction approach. Tabulated values of the MRTs presented in Fig. 4 are available in Table S3.
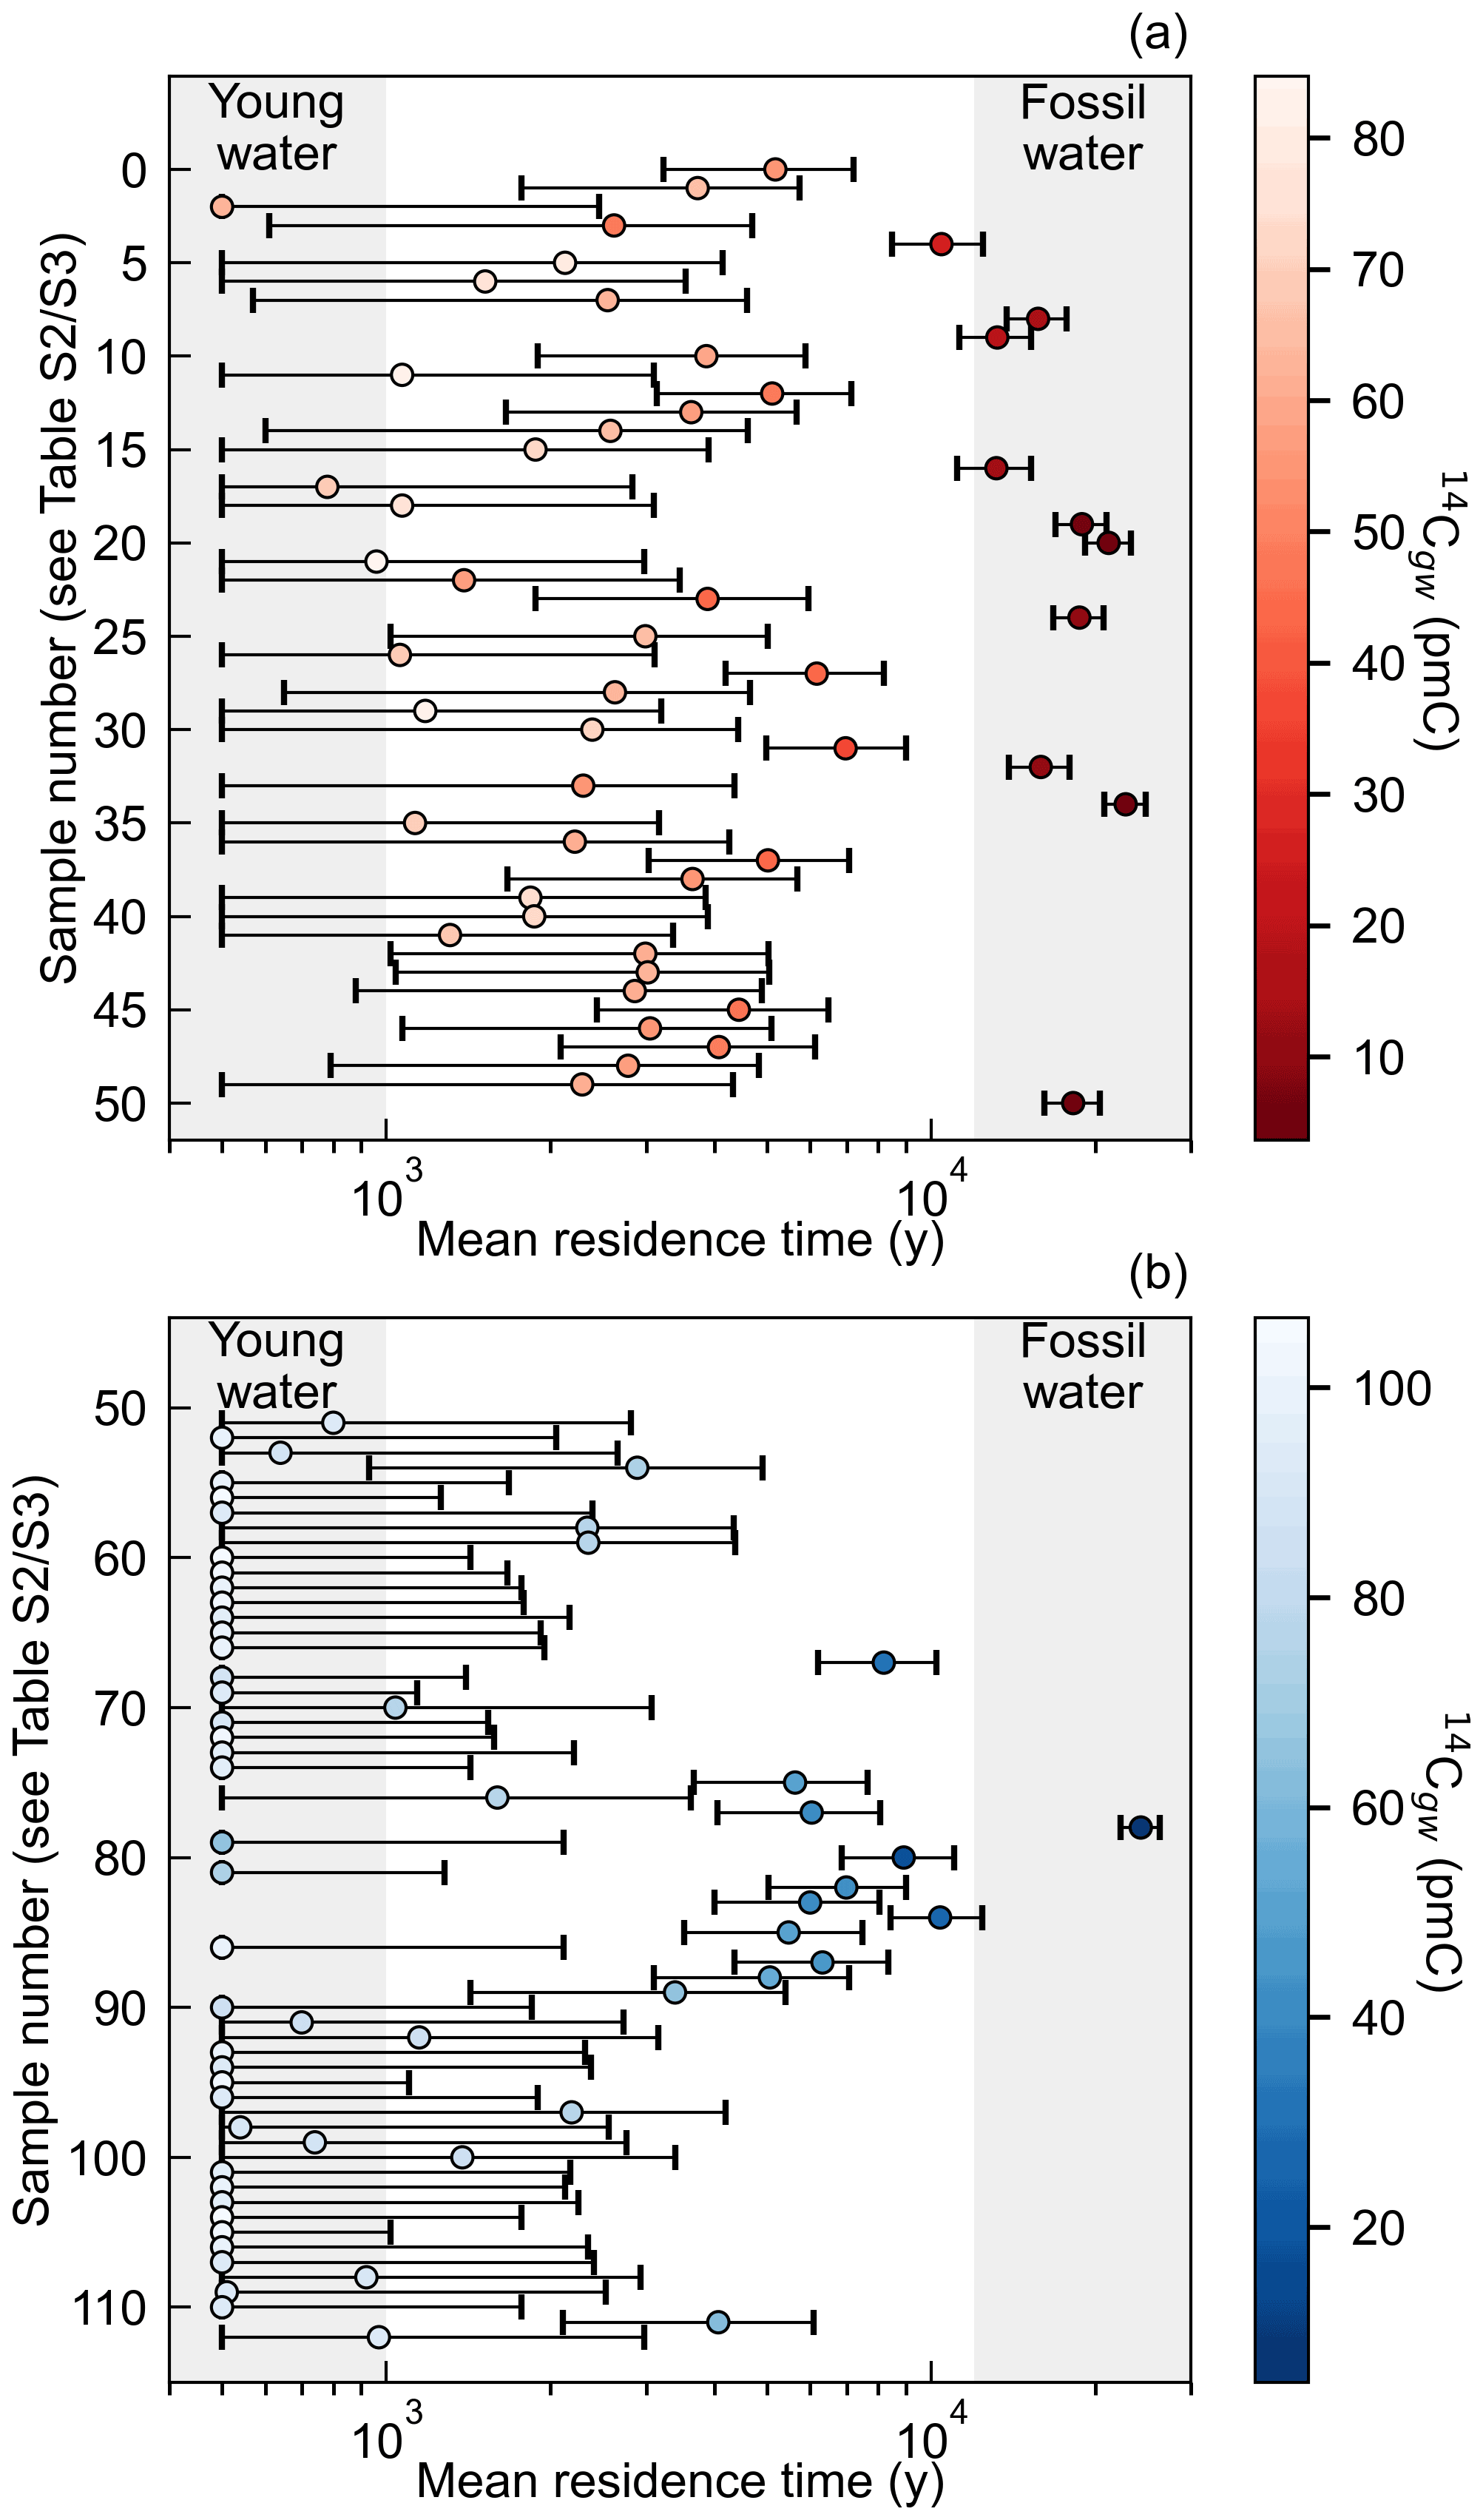
Figure 4Mean residence times determined using the best fit relationship (Eq. 2, circle markers), the upper limit (Eq. 3, upper whisker) and the lower limit (Eq. 4, lower whisker). For sample numbers (y axis); see Tables S2 and S3 in the Supplement. (a) MRTs from the Limestone Coast region and (b) MRTs from the Ovens/Goulburn–Broken catchments. In both panels, shading denotes the measured 14Cgw activities.
The application of Eqs. (3) and (4) to determine 14Ci increases the range in depth-corrected MRTs for both the Limestone Coast and Ovens/Goulburn–Broken catchments. For the Limestone Coast samples (Fig. 4a), two of the samples that were considered fossil water when 14Ci was calculated from the best fit equation (Eq. 2) were not considered fossil water if Eq. (4) (lower bound; see Fig. 2) was used. For the Limestone Coast data, samples were below the 500-year bounds placed on the minimum estimated MRT when Eq. (4) was used to determine 14Ci. The majority of MRT estimates for the Ovens/Goulburn–Broken catchments were young water when using Eq. (2) to determine 14Ci (Fig. 4b). Approximately 70 % of the samples from the Ovens/Goulburn–Broken catchments had estimated MRTs ranging between young water (500 years here) and ∼ 3000 years.
3.3 Comparisons between 14C-based residence time and tritium activities
The Ovens/Goulburn–Broken catchment 3H data (Table S2, Fig. 5) provide the opportunity to assess the 14C-based MRT estimates. Figure 5 shows the raw 14C and 3H activities. Combined 3H and 14Cgw data allow mixing to be identified (Le Gal La Salle et al., 2001; Favreau et al., 2002; Cartwright et al., 2007, 2017). The 3H peak produced by the atmospheric nuclear tests in the Southern Hemisphere was significantly lower than in the Northern Hemisphere, and 3H activities of groundwater recharged at that time are lower than those of modern rainfall (Morgenstern et al., 2010). Figure 5 shows 3H and 14Cgw activities in the Ovens and Goulburn–Broken groundwater (data from Table S2). Unsurprisingly, there is a general correlation between 14Cgw and 3H. The shaded fields (Fig. 5) show the predicted covariation of these isotopes for the case where no macroscopic mixing between old and young groundwater has occurred. This was constructed for a variety of flow geometries (i.e. using the exponential piston flow and dispersion models; see Cartwright et al., 2017), the 3H record of rainfall in Melbourne, and the Southern Hemisphere atmospheric 14Cgw record following Le Gal La Salle et al. (2001) and Cartwright et al. (2007, 2017). Samples lying outside these shaded regions most likely record the mixing between old and young groundwater. Closed system calcite dissolution lowers 14C activities (the lighter region in Fig. 5 is for 15 % calcite dissolution, i.e. q= 0.85). Samples lying to the right of the co-variance fields have relatively low 14C activities but measurable 3H and would generally be interpreted as mixtures of young recently recharged water and older water flowing through the aquifer. However, because an additional reduction of 14Ci may occur due to dilution of unsaturated zone 14CO2, some of these samples may not show mixing. Samples to the left are likely over-corrected, whereby 14Ci values are too high (e.g. Cartwright et al., 2013).
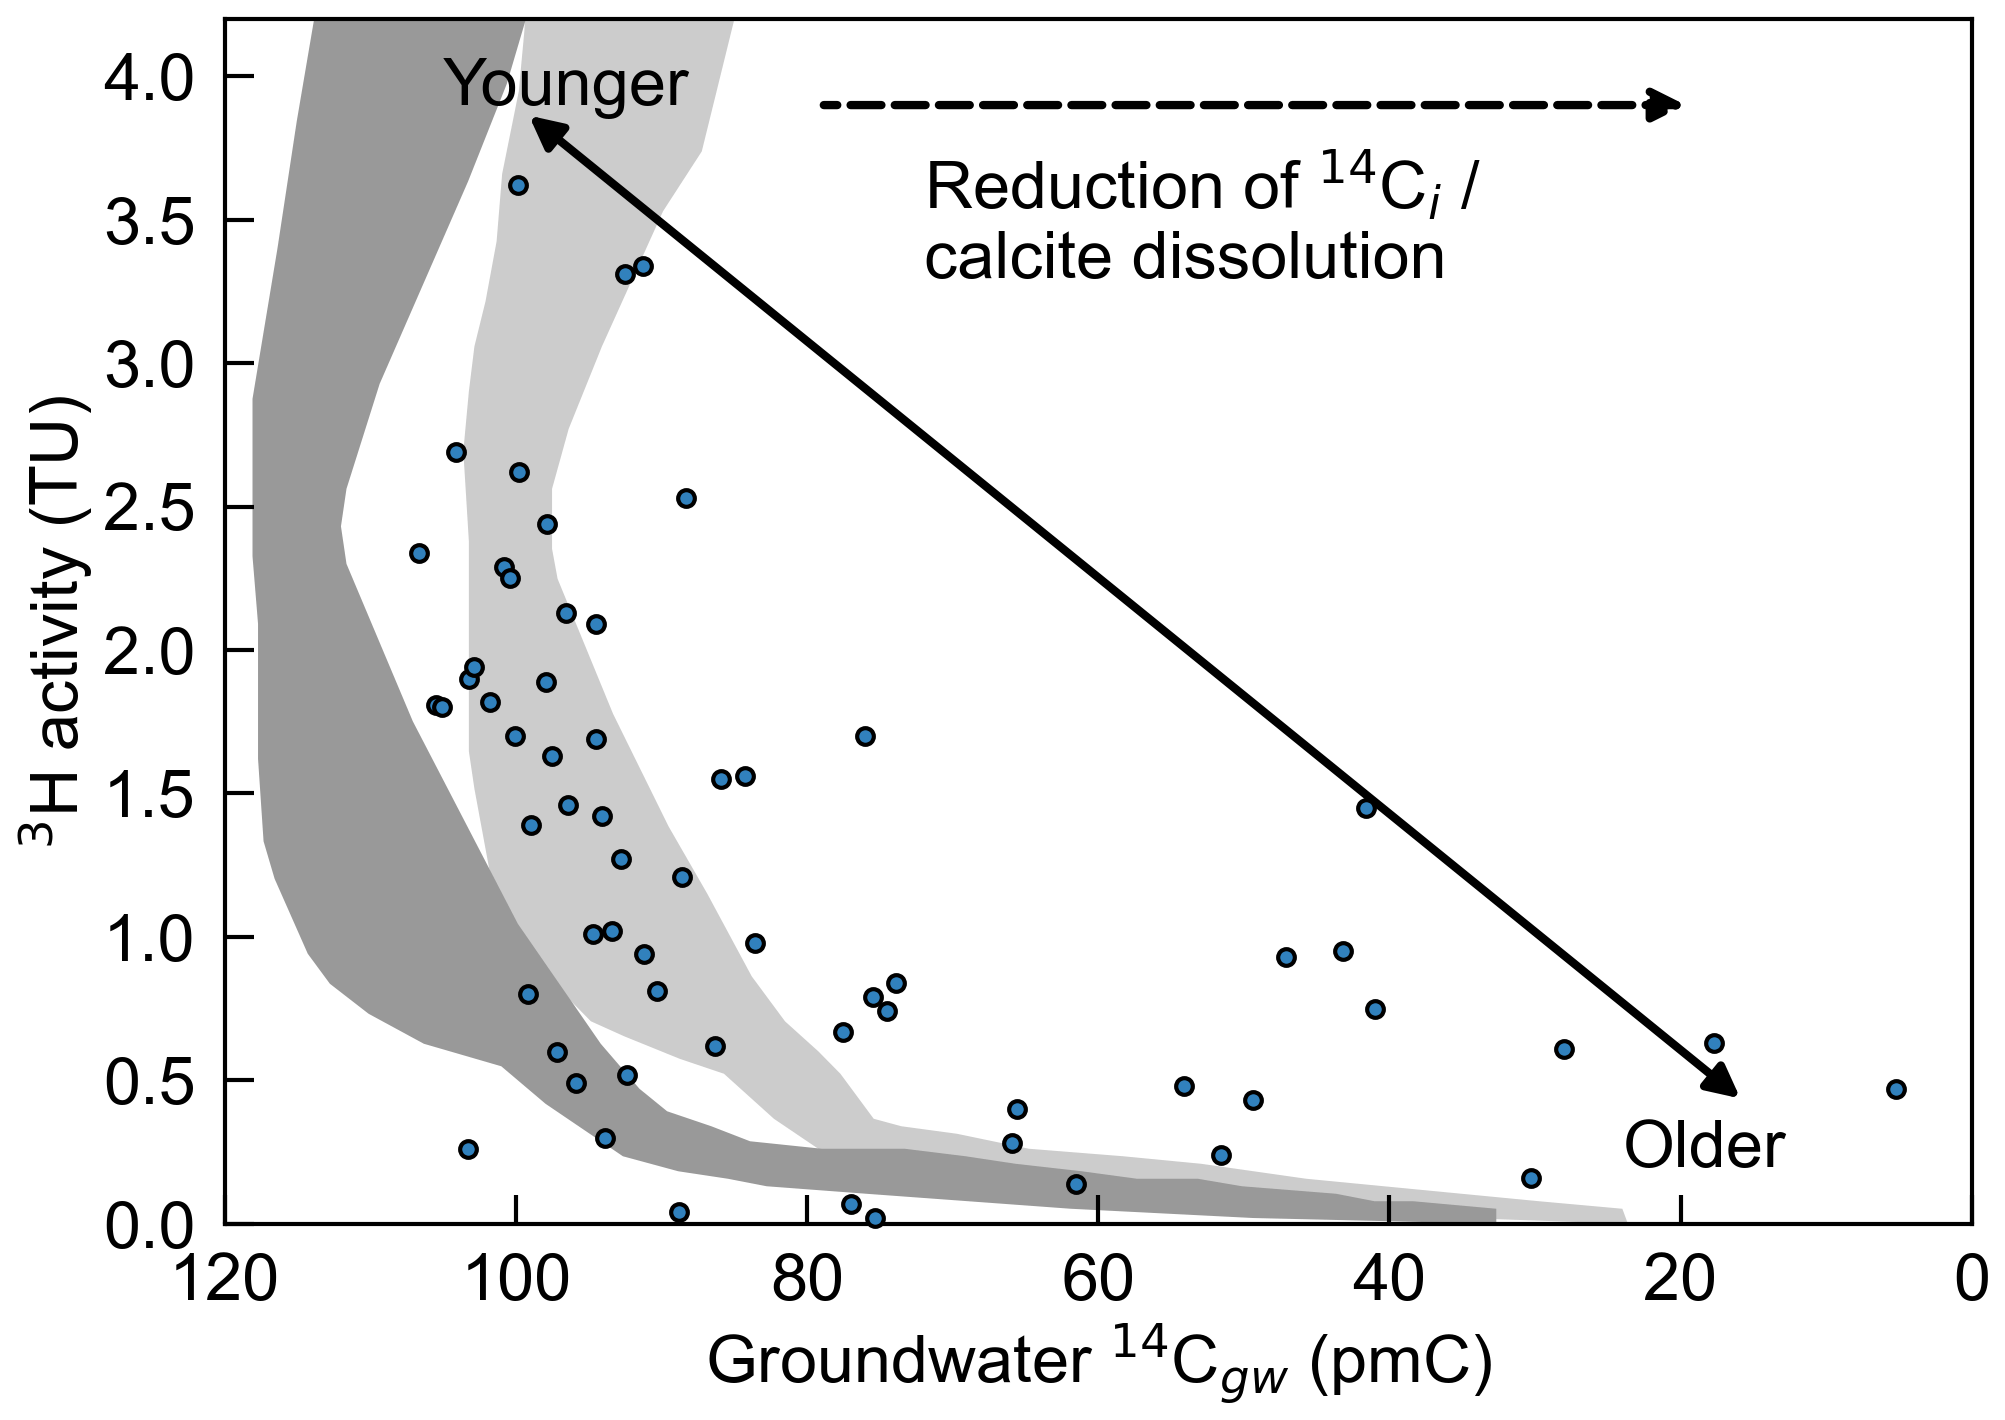
Figure 5Comparisons between measured 3H and 14Cgw activities and MRTs for the Ovens/Goulburn–Broken catchments (see Fig. 2). Note that the x axis (14Cgw) has been inverted. Grey shading denotes the predicted covariation of 3H and 14C for the case where no macroscopic mixing between old and young groundwater has occurred, dark grey for q= 1 and light grey for q= 0.85. Dark grey shaded region from Cartwright et al. (2017).
The DTW corrections (Eqs. 2–4) to estimate 14Ci values proposed here are strongly influenced at depth (> 60 m) by the omission of the 14Cuz data from the Yucca Mountain site (e.g. Kunkler, 1969; Yang et al., 1985). The Yucca Mountain data were excluded from the data-fitting process owing to complications induced by drilling at the site. Thorstenson et al. (1998) highlight that drilling in the 1980s provided conduits for modern atmospheric gases to enter the system, thus providing explanations for the elevated 14Cuz values at depths up to 400 m. The DTW corrections to estimate 14Ci presented here could be significantly revised, particularly at depths exceeding 60 m, through the inclusion of further 14Cuz data. The inclusion of the 14Cuz data from Kunkler (1969) and Yang et al. (1985) would lead to higher 14Ci values determined from Eq. (2) for depths exceeding 60 m (Eq. 2) and wider uncertainty bands (Eqs. 3, 4) over the same depth range. The exclusion of the (generally deep) Yucca Mountain data in the generation of the DTW-correction relationships had only a minor influence on the interpretations of MRTs in the Limestone Coast and Ovens/Goulburn–Broken catchments (Figs. 3, 4), owing to the depths to the water table at the time of sampling. This observation would hold even in the case where DTW values from the recharge zone rather than sampling wells were used. Of the 113 14Cgw samples used to estimate MRTs, only 2 samples had water tables that were 30 m or more below the land surface. The fact that Eqs. (2)–(4) rely on data from a single study for depths below ∼60 mbg (e.g. Walvoord et al., 2005) is a limitation for the application of the DTW-correction approach outlined here for sites with deep water tables.
The DTW-correction approach presented here is straightforward to apply as it requires only a measurement of the depth to the water table at the time of sampling and does not require additional data. The application of the DTW correction was illustrated here using conventional 14C ages, but it could be easily incorporated into the input function for lumped parameter models or numerical models. For example, Wood et al. (2017) used the relationship between DTW and 14Cuz for the Ti Tree Basin (central Australia) to generate spatially variable 14C inputs in a regional-scale solute transport model.
The example applications presented here used the DTW at the sampling well used to estimate the 14Ci values. These DTW values are likely greater than the DTW at the recharge zone, at the time of recharge, leading to minor over-corrections of 14Ci values from Eqs. (2) to (4). For example, for Well ID 7022-128 (Sample ID = 16, 14Cgw= 13.35 pmC, DTW = 27.47 m; see Table S3), the MRT using Eq. (2) was 13 180 years. If the DTW was assumed to be 5 m shallower (22.47 m), the MRT increased to 13 880 years (700 years, or ∼5 %). Given that Eqs. (2)–(4) are straightforward to implement, the impact of uncertainty on the DTW could be easily investigated. However, ignoring the role of the unsaturated zone completely can lead to significant over-estimation of MRTs (see Fig. 3). For example, the relationship presented in Fig. 6 shows the potential errors in MRT estimates from the assumption that 14Ci= 100 pmC, where 14Ci equals the value on the x axis. To relate the error in MRT estimates to the depth to the water table, the corresponding depths to the water table from Eq. (2) are presented on the secondary x axis. Figure 6 demonstrates that the assumption of 14Ci= 100 pmC for a 24 m-deep water table could lead to an over-estimation of MRTs of the order of 3000 years. Errors in estimated MRT can have major implications for recharge estimation. For example. Wood et al. (2015) highlighted that errors in MRTs caused by assumptions of initial 14C activities can lead to errors in recharge estimates that exceed an order of magnitude. Furthermore, ignoring the possibilities of low 14Cuz values complicates the assessment of mixing using joint 14C and 3H data.
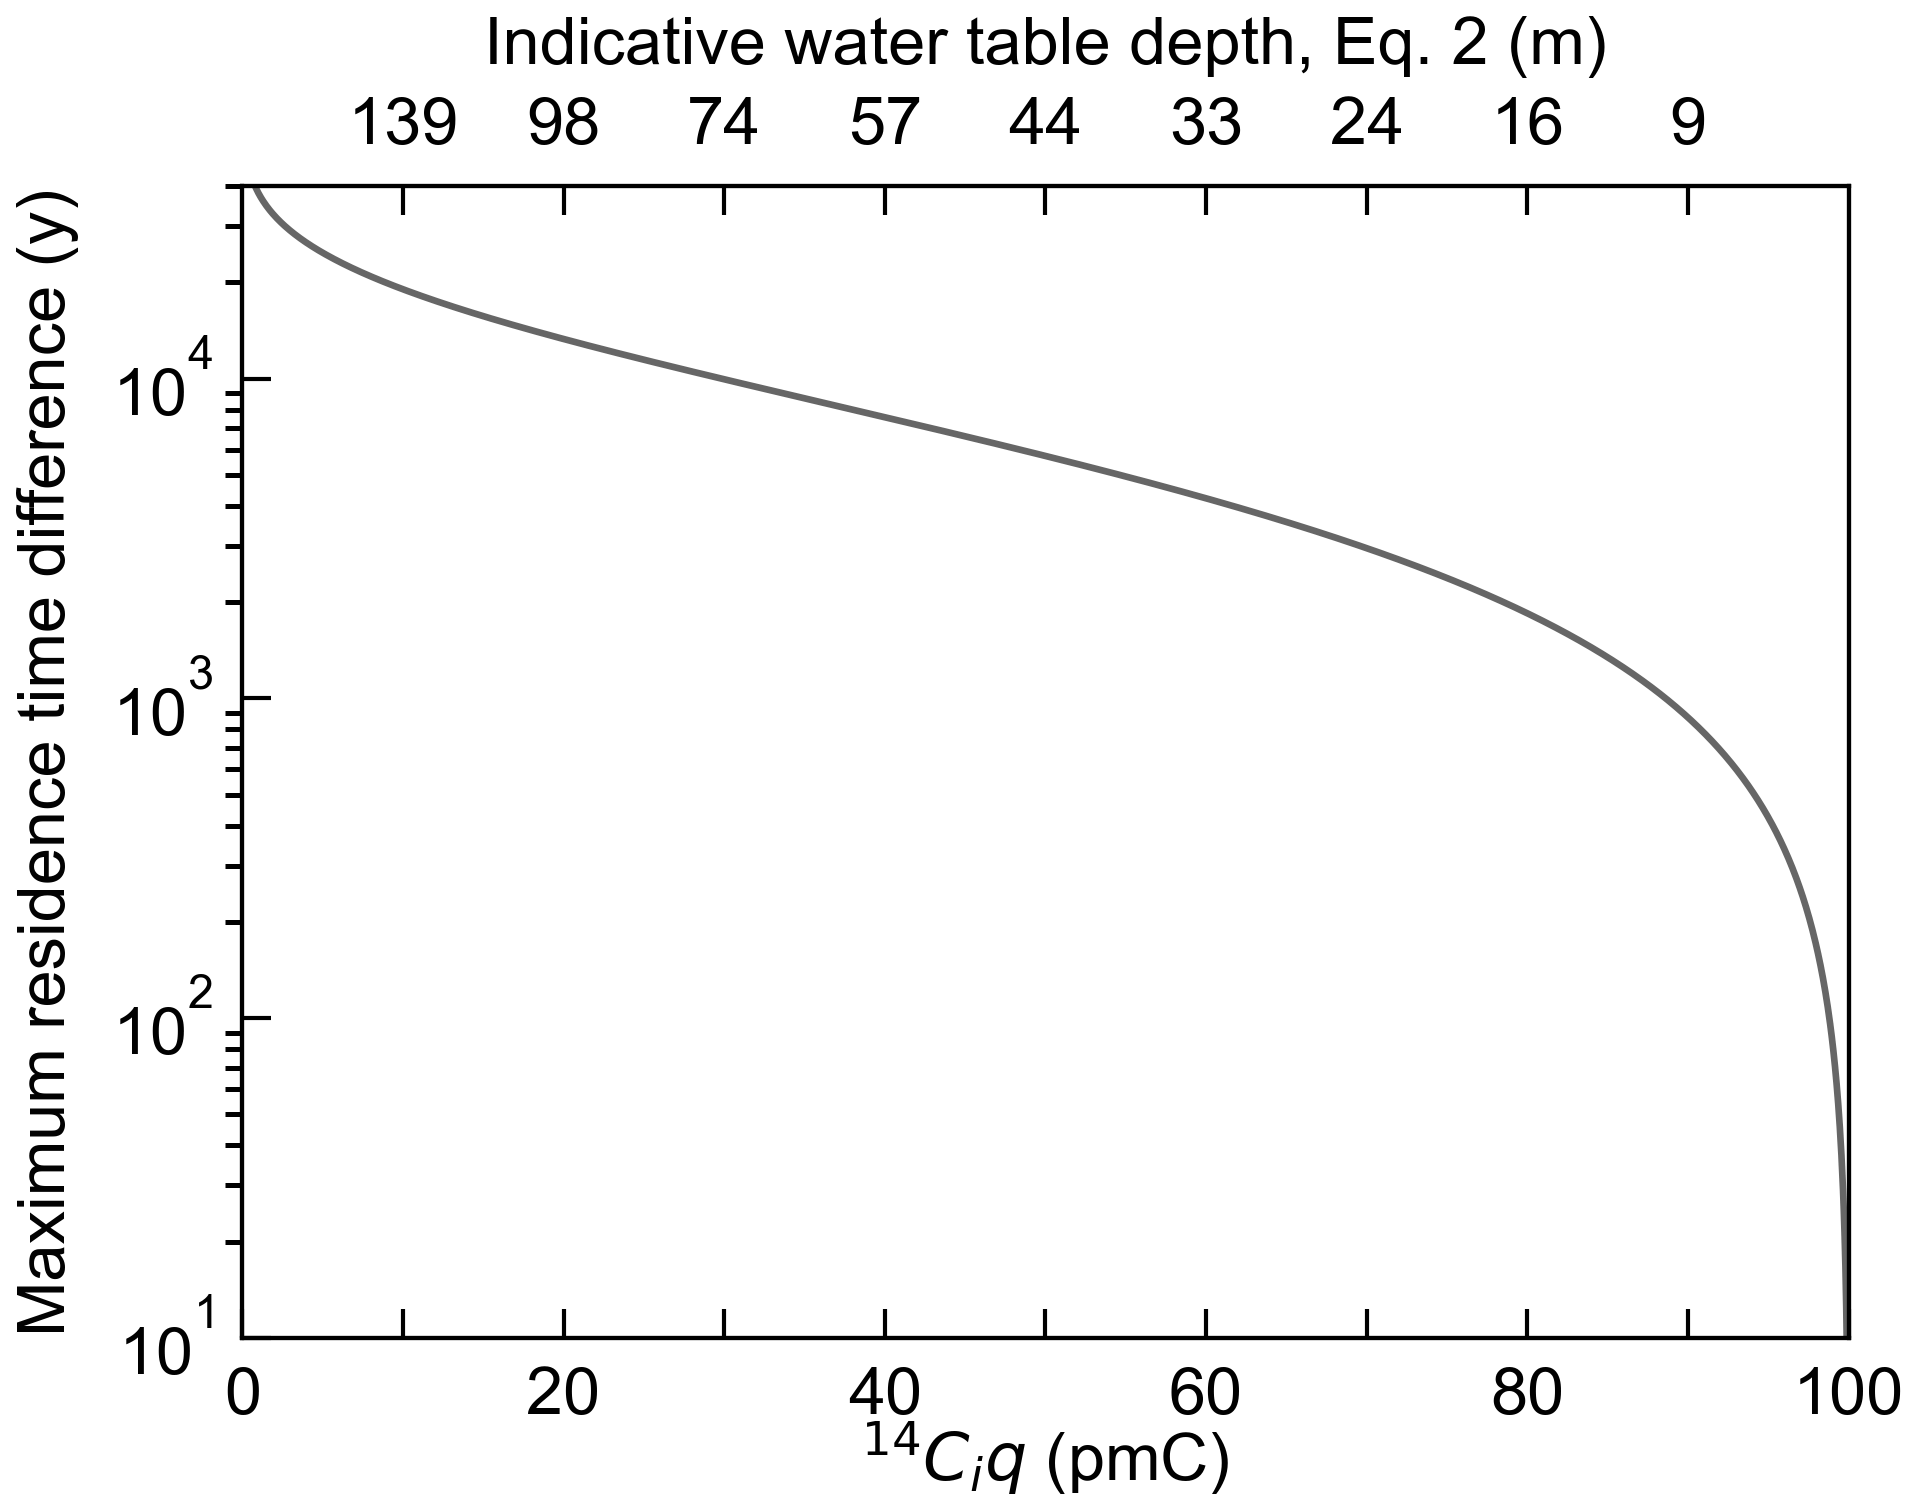
Figure 6Maximum difference in calculated MRT (y), where 14Ciq on the x axis is used, relative to the case where it is assumed to be 100 pmC. The secondary x axis shows indicative water depths that correspond to 14Ciq values shown on the lower x axis according to Eq. (2). The result assumes q= 1.
Due to advances in technology, particularly the development of accelerator mass spectrometry in the case of 14C, hydrogeologists can measure radioisotopes with higher throughput, lower detection limits, and higher precision than was the case 20 to 30 years ago. This has permitted more comprehensive studies to be carried out and led to a rapidly growing database of 14C measurements. The continuing realisation, however, that there are numerous processes aside from radioactive decay that affect 14C activities means that we are less certain in translating these data into useful parameters such as residence times. That some of these processes, such as those discussed here, occur in the unsaturated zone, prior to recharge, adds to the complexity as these are difficult to resolve using groundwater data alone. Previous studies have focused on the importance of calculating q in mean residence time estimates (e.g. Coetsiers nd Walraevens, 2009; Han and Plummer, 2016). Here, the importance of accounting for processes in the unsaturated zone is demonstrated.
The analysis of 14C–depth relationships in the unsaturated zone is currently hampered by a relatively small number of studies, especially at the depths exceeding 60 m. However, given that the impact on calculated mean residence times may exceed that caused by closed system calcite dissolution, further attention is warranted. Data from a wider range of environments would also help in assessing the variability of these relationships.
Python script to perform fitting shown in Fig. 2 can be obtained from the corresponding author.
Data used in the paper are included in the main document (Table 1) and the Supplement (Tables S1–S3). Citations of all external data sources are provided in Sect. 2.1 and 2.2.
The supplement related to this article is available online at: https://doi.org/10.5194/hess-25-5415-2021-supplement.
DJI was involved in project conceptualisation, data curation, the methodology, investigation, formal analysis, writing the original draft, visualisation and supervision. CW was involved in project conceptualisation, data curation, the methodology, writing, reviewing and editing, and supervision. IC was involved in the project methodology, formal analysis, writing, reviewing and editing. TO was involved in data curation, formal analysis, writing, reviewing and editing.
The contact author has declared that neither they nor their co-authors have any competing interests.
Publisher's note: Copernicus Publications remains neutral with regard to jurisdictional claims in published maps and institutional affiliations.
We would like to thank Marina Gillon and the anonymous reviewer who provided helpful comments on the original manuscript. Some of the data used in this paper were collected from field infrastructure supported by funding from the Australian Federal Government's National Collaborative Research Infrastructure Strategy (NCRIS).
This paper was edited by Markus Hrachowitz and reviewed by Marina Gillon and one anonymous referee.
Bacon, D. H. and Keller, C. K.: Carbon dioxide respiration in the deep vadose zone: implications for groundwater age dating, Water Resour. Res., 34, 3069–3077, https://doi.org/10.1029/98WR02045, 1998.
Brown, K., Love, A. J., and Harrington, G. A.: Vertical groundwater recharge to the Tertiary confined sand aquifer, South East, South Australia, Report, DWR 2001/002, Department for Water Resources, South Australia, Adelaide, 2001.
Carmi, I., Kronfeld, J., Yechieli, Y., Yakir, D., Boaretto, E., and Stiller, M.: Carbon isotopes in pore water of the unsaturated zone and their relevance for initial 14C activity in groundwater in the coastal aquifer of Israel, Chem. Geol. 268, 189–196, https://doi.org/10.1016/j.chemgeo.2009.08.010, 2009.
Cartwright, I. and Morgenstern, U.: Constraining groundwater recharge and the rate of geochemical processes using tritium and major ion geochemistry: Ovens catchment, southeast Australia, J. Hydrol., 475, 137–149, https://doi.org/10.1016/j.jhydrol.2012.09.037, 2012.
Cartwright, I., Weaver, T. R., Stone, D., and Reid, M.: Constraining modern and historical recharge from bore hydrographs, 3H, 14C, and chloride concentrations: Applications to dual-porosity aquifers in dryland salinity areas, Murray Basin, Australia, J. Hydrol., 332, 69–92, https://doi.org/10.1016/j.jhydrol.2006.06.034, 2007.
Cartwright, I., Fifield, L. K., and Morgenstern, U.: Using 3H and 14C to constrain the degree of closed-system dissolution of calcite in groundwater, Appl. Geochem., 32, 118–128, https://doi.org/10.1016/j.apgeochem.2012.10.023, 2013.
Cartwright, I., Cendon, D., Currell, M., and Meredith, K.: A review of radioactive isotopes and other residence time tracers in understanding groundwater recharge: Possibilities, challenges, and limitations, J. Hydrol., 555, 797–811, https://doi.org/10.1016/j.jhydrol.2017.10.053, 2017.
Cartwright, I., Currell, M. J., Cendón, D. I., and Meredith, K. T.: A review of the use of radiocarbon to estimate groundwater residence times in semi-arid and arid areas, J. Hydrol., 580, 124247, https://doi.org/10.1016/j.jhydrol.2019.124247, 2020.
Clark, I. D. and Fritz, P.: Environmental Isotopes in Hydrogeology, Lewis, New York, p. 328, 1997.
Coetsiers, M. and Walraevens, K.: A new correction model for 14C ages in aquifers with complex geochemistry – Application to the Neogene Aquifer, Belgium, Appl. Geochem., 24, 768–776, https://doi.org/10.1016/j.apgeochem.2009.01.003, 2009.
Dogramaci, S.: Isotopes of sulphur, oxygen, strontium and carbon in groundwater as tracers of mixing and geochemical processes, Murray Basin, Australia, PhD thesis, University of Adelaide, Adelaide, 1998.
Favreau, G., Leduc, C., Marlin, C., Dray, M., Taupin, J. D., Massault, M., Le Gal La Salle, C., and Babic, M.: Estimate of recharge of a rising water table in semiarid Niger from 3H and 14C modeling, Ground Water, 40, 144–151, https://doi.org/10.1111/j.1745-6584.2002.tb02499.x, 2002.
Fritz, P., Reardon, E. J., Barker, J., Brown, R. M., Cherry, J. A., Killey, R. W. D., and McNaughton, D.: The Carbon Isotope Geochemistry of a Small Groundwater System in Northeastern Ontario, Water Resour. Res., 14, 1059–1067, https://doi.org/10.1029/WR014i006p01059, 1978.
Fontes, J.-C. and Garnier, J.-M.: Determination of the initial 14C activity of the total dissolved carbon: A review of the existing models and a new approach, Water Resour. Res., 15, 399–413, https://doi.org/10.1029/WR015i002p00399, 1979.
Gillon, M., Barbecot, F., Gibert, E., Corcho Alvarado, J. A., Martin, C., and Massault, M.: Open to closed system transition traced through the TDIC isotopic signature at the aquifer recharge stage, implications for groundwater 14C dating, Geochim. Cosmochim. Ac., 73, 6488–6501, https://doi.org/10.1016/j.gca.2009.07.032, 2009.
Haas, H., Fisher, D. W., Thorstenson, D. C., and Weeks, E. P.: 13CO2 and 14CO2 measurements on soil atmosphere sampled in the sub-surface unsaturated zone in the Western Great Plains of the US, Radiocarbon, 25, 301–314, https://doi.org/10.1017/S0033822200005610, 1983.
Han, L. F. and Plummer, L. N.: A review of single-sample-based models and other approaches for radiocarbon dating of dissolved inorganic carbon in groundwater, Earth Sci. Rev., 152, 119–142, https://doi.org/10.1016/j.earscirev.2015.11.004, 2016.
Hua, Q., Barbetti, M., and Rakowski, A. Z.: Atmospheric radiocarbon for the period 1950–2010, Radiocarbon, 55, 2059–2072, https://doi.org/10.2458/azu_js_rc.v55i2.16177, 2013.
Ingerson, E. and Pearson, F. J.: Estimation of age and rate of motion of groundwater by the 14C method. Recent researches on the fields of atmosphere, hydrosphere and nuclear geochemistry, Sugawara Festival Volume, Maruzen Co., Tokyo, 263–283, 1964.
Jasechko, S, Perrone, D., Befus, K. M., Cardenas, M. B., Ferguson, G., Gleeson, T., Luijendijk, E., McDonnell, J., Taylor, R. G., Wada, Y., and Kirchner, J. W.: Global aquifers dominated by fossil groundwaters but wells vulnerable to modern contamination, Nat. Geosci., 10, 425–429, https://doi.org/10.1038/ngeo2943, 2017.
Jurgens, B. C., Böhlke, J. K., and Eberts, S. M.: TracerLPM (Version 1): An Excel® workbook for interpreting groundwater age distributions from environmental tracer data: U.S. Geological Survey Techniques and Methods Report 4-F3, 1–60, 2012.
Kunkler, J. L.: The sources of carbon dioxide in the zone of aeration of the Bandelier Tuff, near Los Alamos, New Mexico, US Geol. Survey Prof Paper 650-13, B185-B188, 1969.
Leaney, F. W. and Allison, G. B.: Carbon-14 and stable isotope data for an area in the Murray Basin: its use in estimating recharge, J. Hydrol., 88, 129–145, https://doi.org/10.1016/0022-1694(86)90201-5, 1986.
Le Gal La Salle, C., Marlin, C., Leduc, C., Taupin, J. D., Massault, M., and Favreau, G.: Renewal rate estimation of groundwater based on radioactive tracers (3H, 14C) in an unconfined aquifer in a semi-arid area, Iullemeden basin, Niger, J. Hydrol., 254, 145–156, https://doi.org/10.1016/S0022-1694(01)00491-7, 2001.
Love, A. J., Herczeg, A. L., Leaney, F. W., Stadter, M. F., Dighton, J. C., and Armstrong, D.: Groundwater residence time and palaeohydrology in the Otway Basin, South Australia: 2H, 18O and 14C data, J. Hydrol., 153, 157–187, https://doi.org/10.1016/0022-1694(94)90190-2, 1994.
Mazor, E.: Chemical and isotopic groundwater hydrology, 3rd edn., Marcel Dekker, New York, 2004.
McCallum, J. L., Dogramaci, S., Cook, P. G., Banks, E., Purtschert, R., Irvine, M., Simmons, C. T., and Burk, L.: Stochastic correction of carbon-14 activities: A Bayesian approach with argon-39 validation, J. Hydrol., 566, 396–405, https://doi.org/10.1016/j.jhydrol.2018.08.047, 2018.
Mook, W. G.: On the reconstruction of the initial 14C content of groundwater from the chemical and isotopic composition, in Proceedings of Eighth International Conference on Radiocarbon Dating, vol. 1, 342–352, Royal Society of New Zealand, Wellington, 1972.
Morgenstern, U., Stewart, M. K., and Stenger, R.: Dating of streamwater using tritium in a post nuclear bomb pulse world: continuous variation of mean transit time with streamflow, Hydrol. Earth Syst. Sci., 14, 2289–2301, https://doi.org/10.5194/hess-14-2289-2010, 2010.
Plummer, L. N. and Glynn, P. D.: Radiocarbon dating in groundwater systems, in: IAEA, Isotope methods for dating old groundwater. International Atomic Energy Agency, Vienna, 2013.
Plummer, L. N. and Sprinkle, C. L.: Radiocarbon dating of dissolved inorganic carbon in groundwater from confined parts of the Upper Floridan aquifer, Florida, USA, Hydrogeol. J., 9, 127–150, 2001.
Reardon, E. J., Allison, G. B., and Fritz, P.: Seasonal chemical and isotopic variations of soil CO2 at Trout Creek, Ontario, J. Hydrol., 43, 355–371, https://doi.org/10.1016/0022-1694(79)90181-1, 1979.
SA Water: Bool Lagoon investigation groundwater chemistry, electronic dataset, South Australian Water Corporation, South Australia, 2020.
Sinclair Knight Merz (SKM): SA-Vic border zone groundwater investigation. Interaction between the TLA and TCSA, SKM, Melbourne, Australia, 2012.
Tamers, M. A.: Surface-water infiltration and groundwater movement in arid zones of Venezuela, in Isotopes in Hydrology, International Atomic Energy Agency, Vienna, 339–351, 1967.
Thorstenson, D. C., Weeks, E. P., Haas, H., and Fisher, D. W.: Distribution of gaseous 12CO2, 13CO2, and 14CO2 in the sub-soil unsaturated zone of the Western US Great Plains, Radiocarbon, 25, 315–346, https://doi.org/10.1017/S0033822200005622, 1983.
Thorstenson, D. C., Weeks, E. P., Haas, H., Busenberg, E., Plummer, L. N., and Peters, C. A.: Chemistry of unsaturated zone gases sampled in open boreholes at the crest of Yucca mountain, Nevada: Data and basic concepts of chemical and physical processes in the mountain, Water Resour. Res., 34, 1507–1529, https://doi.org/10.1029/98WR00267, 1998.
Turnadge, C., Smith, S., and Harrington, G. A.: The influence of geological faults on groundwater flow, in: Framework for a regional water balance model for the South Australian Limestone Coast region, edited by: Harrington, N. and Lamontagne, S., Goyder Institute for Water Research, Adelaide, 2013.
van den Akker, J.: Padthaway Salt Accession Study, Volume 2, Results, Department of Water, Land and Biodiversity Conservation, Adelaide, 2006.
Vogel, J. C.: Investigation of groundwater flow with radiocarbon, in Isotopes in Hydrology, International Atomic Energy Agency, Vienna, 355–368, 1967.
Walvoord, M. A., Striegl, R. G., Prudic, D. E., and Stonestrom, D. A.: CO2 dynamics in the Armagosa Desert: fluxes and isotopic speciation in a deep unsaturated zone, Water Resour. Res., 41, W02006, https://doi.org/10.1029/2004WR003599, 2005.
Wood, C.: Measurement and evaluation of key groundwater discharge sites in the Lower South East of South Australia, Technical Report, Department for Water, Adelaide, 2011.
Wood, C., Cook, P. G., Harrington, G. A., Meredith, K., and Kipfer, R.: Factors affecting carbon-14 activity of unsaturated zone CO2 and implications for groundwater dating, J. Hydrol., 519, 465–475, https://doi.org/10.1016/j.jhydrol.2014.07.034, 2014.
Wood, C., Cook, P. G., and Harrington, G. A.: Vertical carbon-14 profiles for resolving spatial variability in recharge in arid environments, J. Hydrol., 520, 134–142, https://doi.org/10.1016/j.jhydrol.2014.11.044, 2015.
Wood, C., Cook, P. G., Harrington, G. A., and Knapton, A.: Constraining spatial variability in recharge and discharge in an arid environment through modeling carbon-14 with improved boundary conditions, Water Resour. Res., 142–157, https://doi.org/10.1002/2015WR018424, 2017.
Yang, C., Haas, H. H., Weeks, E. P., and Thorstenson, D. C.: Analysis of gaseous-phase stable and radioactive isotopes in the unsaturated zone, Yucca Mountain, Nevada. Conference on characterization and monitoring of the vadose zone; Denver, CO (USA), 19–21, 1985.