the Creative Commons Attribution 4.0 License.
the Creative Commons Attribution 4.0 License.
 | 22 Sep 2021
Low hydrological connectivity after summer drought inhibits DOC export in a forested headwater catchment
Katharina Blaurock
Burkhard Beudert
Benjamin S. Gilfedder
Jan H. Fleckenstein
Stefan Peiffer
Luisa Hopp
Understanding the controls on event-driven dissolved organic carbon (DOC) export is crucial as DOC is an important link between the terrestrial and the aquatic carbon cycles. We hypothesized that topography is a key driver of DOC export in headwater catchments because it influences hydrological connectivity, which can inhibit or facilitate DOC mobilization. To test this hypothesis, we studied the mechanisms controlling DOC mobilization and export in the Große Ohe catchment, a forested headwater in a mid-elevation mountainous region in southeastern Germany. Discharge and stream DOC concentrations were measured at an interval of 15 min using in situ UV-Vis (ultraviolet–visible) spectrometry from June 2018 until October 2020 at two topographically contrasting subcatchments of the same stream. At the upper location (888 m above sea level, a.s.l.), the stream drains steep hillslopes, whereas, at the lower location (771 m a.s.l.), it drains a larger area, including a flat and wide riparian zone. We focus on four events with contrasting antecedent wetness conditions and event size. During the events, in-stream DOC concentrations increased up to 19 mg L−1 in comparison to 2–3 mg L−1 during baseflow. The concentration–discharge relationships exhibited pronounced but almost exclusively counterclockwise hysteresis loops which were generally wider in the lower catchment than in the upper catchment due to a delayed DOC mobilization in the flat riparian zone. The riparian zone released considerable amounts of DOC, which led to a DOC load up to 7.4 kg h−1. The DOC load increased with the total catchment wetness. We found a disproportionally high contribution to the total DOC export of the upper catchment during events following a long dry period. We attribute this to the low hydrological connectivity in the lower catchment during drought, which inhibited DOC mobilization, especially at the beginning of the events. Our data show that not only event size but also antecedent wetness conditions strongly influence the hydrological connectivity during events, leading to a varying contribution to DOC export of subcatchments, depending on topography. As the frequency of prolonged drought periods is predicted to increase, the relative contribution of different subcatchments to DOC export may change in the future when hydrological connectivity will be reduced more often.
- Article
(2260 KB) - Full-text XML
- BibTeX
- EndNote


The hydrological and carbon cycles are tightly coupled, as terrestrial systems store and release carbon into aquatic systems, which act as a carrier for carbon through landscapes. Inland waters may influence the global carbon cycle more than previously thought (Battin et al., 2009). Dissolved organic carbon (DOC) export from streams is an important link between the terrestrial and the aquatic carbon cycle and a crucial component of the net ecosystem carbon balance (Kindler et al., 2011). The global DOC export reaching inland waters annually from the terrestrial environment is estimated at 5.1 Pg C, whereas a large part (3.9 Pg C) outgasses to the atmosphere in form of the greenhouse gases CO2 or CH4 (Drake et al., 2018). As DOC is converted to these greenhouse gases, it plays an important role in the context of climate change.
DOC concentrations in freshwater systems usually vary from 1 to 10 mg L−1 in streams and lakes but can reach up to 60 mg L−1 in swamps and bogs (Thurman, 1985). Since the beginning of the 1980s, an increase in DOC concentrations has been observed in a large number of streams, rivers and lakes of the Northern Hemisphere (Evans et al., 2005; Roulet and Moore, 2006; Monteith et al., 2007). Rising DOC concentrations indicate an increased leaching from soils and peatlands and have the potential to deplete the terrestrial carbon pools, which are of global importance for carbon storage (Batjes, 2014; Dixon et al., 1994; Kindler et al., 2011). Moreover, elevated DOC concentrations can cause problems for drinking water treatment via chlorination as DOC acts as a precursor of trihalomethanes, which have potentially carcinogenic and mutagenic properties (Alarcon-Herrera et al., 1994; Ledesma et al., 2012; Sadiq and Rodriguez, 2004). DOC can form complexes with organic pollutants (Hope et al., 1994) and toxic metals such as mercury (Ravichandran, 2004) or lead (Dörr and Münnich, 1991) and, thus, strongly influence drinking water quality. Several hypotheses have been proposed in order to explain the increase in DOC in many surface waters, including a decline in atmospheric sulfur deposition (Evans et al., 2006; Monteith et al., 2007; Ledesma et al., 2016; Hruška et al., 2009), a decline in nitrogen deposition (Musolff et al., 2016), temperature increase (Weyhenmeyer and Karlsson, 2009) and increased precipitation (Hongve et al., 2004). However, Roulet and Moore (2006) stress that it is difficult to isolate a single factor, as there are many different variables influencing DOC production and export, and Clark et al. (2010) highlight the difficulties resulting from the fact that drivers of rising DOC concentrations operate on varying temporal and spatial scales.
DOC export varies strongly between catchments. Annual exports between 1.2 and 56 946 kg C km−2 were found in a meta-analysis of 550 catchments worldwide (Alvarez-Cobelas et al., 2012). Besides external factors influencing runoff (e.g., precipitation) a multitude of internal landscape-based factors may influence DOC export, such as temperature controls on production (Moore et al., 2008; Wen et al., 2020) or chemical parameters, such as pH and ionic strength (Hruška et al., 2009; Monteith et al., 2007), as well as redox processes (Knorr, 2013). Of particular relevance for DOC mobilization may be land cover type and changes in land use (Seybold et al., 2019; Larson et al., 2014; Aitkenhead-Peterson et al., 2007), as mobilization processes depend on the DOC source area. Wetlands and the riparian zone are often particularly important DOC sources to streams and lakes as they are often characterized by large amounts of stored carbon, which can then be mobilized as DOC (Harrison et al., 2005; Creed et al., 2008; Ogawa et al., 2006; Zarnetske et al., 2018; Weiler and McDonnell, 2006; Ledesma et al., 2015; Musolff et al., 2018).
Many studies have shown that DOC concentrations usually increase with discharge (Q; Hobbie and Likens, 1973; McDowell and Fisher, 1976; Meyer and Tate, 1983; Easthouse et al., 1992). However, at the event scale, this concentration–discharge relationship is seldom linear, and hysteretic loops have been observed at many sites. Although it is difficult to merge the C–Q relationships to analyze annual hysteretic loops as their characteristics depend on specific event conditions (Fazekas et al., 2020), the direction and shape of specific hysteretic loops can be a useful indicator for the underlying mobilization mechanisms. Clockwise hysteretic loops are generally explained by (1) a DOC source close and well connected to the stream (Blaen et al., 2017; Hood et al., 2006; Vaughan et al., 2017), (2) flushing of DOC from upper soil horizons during the rising limb (Buffam et al., 2001; Jeong et al., 2012) or (3) a depletion of the DOC source during the course of an event (Bowes et al., 2009; House and Warwick, 1998; Jeong et al., 2012). Counterclockwise hysteretic loops usually indicate a delayed arrival of DOC at the stream, which can be caused by source areas being located further away from the stream (Hood et al., 2006; Vaughan et al., 2017), with the sources being connected via flow paths with slow transport velocities (Musolff et al., 2017) or by changes in the dominant flow paths and associated changes in the hydrological connectivity change of flow pathways (Brown et al., 1999; Hagedorn et al., 2000; Schwarze and Beudert, 2009; Strohmeier et al., 2013; Cerro et al., 2014; Ågren et al., 2008; Pacific et al., 2010).
Hydrological connectivity is generally regarded to be of paramount importance for biogeochemical fluxes through catchments. As it controls runoff response during events, it has a direct impact on solute export (Kiewiet et al., 2020; Detty and McGuire, 2010). Therefore, it influences nutrient dynamics across different temporal and spatial scales (Covino, 2017). Hydrological connectivity and, therefore, runoff and solute response are dependent on the antecedent wetness conditions in a catchment and the event characteristics itself (Penna et al., 2015; Detty and McGuire, 2010; McGuire and McDonnell, 2010) and appear to be controlled by catchment topography and morphology. Weiler and McDonnell (2006) showed that the hillslope shape influences the hysteresis pattern of DOC during storm events as mobilization processes differ with the geometrical properties of hillslopes. Catchment morphology appeared to strongly influence DOC transport and storage in streams, as the temperature sensitivity of respiration depends on geomorphic features (Jankowski and Schindler, 2019).
In this study, we investigated DOC mobilization during different rain events and antecedent wetness conditions at two different topographical positions of a headwater stream within the Bavarian Forest National Park (BFNP) using high-resolution in-stream DOC spectrometers. The setting in the BFNP allowed us to investigate DOC export mechanisms in a region with little anthropogenic influence, which is important against the backdrop of rising DOC concentrations in freshwater systems. There are few studies focusing on the influence of topography on the DOC mobilization mechanisms. Another aspect that is of increasing importance is the possible impact of climate change and, associated therewith, prolonged drought periods on DOC export. In particular, we compared two different subcatchments with regards to DOC–Q relationships and DOC export during four precipitation events in order to understand the influence of event size, antecedent wetness conditions and topography on DOC mobilization and export. We hypothesized that DOC mobilization processes and DOC export are controlled by the underlying hydrological processes, in particular connectivity, and are strongly affected by the antecedent wetness conditions and event size. We further hypothesized that different topographical positions (steep hillslopes vs. flat riparian zones) within the catchment promote different hydrological mobilization and transport processes, and therefore, DOC–Q relationships and DOC export will differ between the two subcatchments.
2.1 Study site
The Große Ohe catchment (19.2 km2) is part of the BFNP, which is located in southeastern Germany and shares a border with the Czech Republic. The BFNP covers an area of 243 km2. Measurements were conducted in the nested subcatchments of Hinterer Schachtenbach (HS; 3.5 km2) and Markungsgraben (MG; 1.1 km2), which are part of the Große Ohe catchment, an experimental forested catchment run by the BFNP (see Table 1).
Table 1Characteristics of the entire Hinterer Schachtenbach catchment and the studied subcatchments of Hinterer Schachtenbach (HS) and Markungsgraben (MG). The subcatchment of Kaltenbrunner Seige was not included in the monitoring. The colored squares represent the subcatchments shown in Fig. 1.
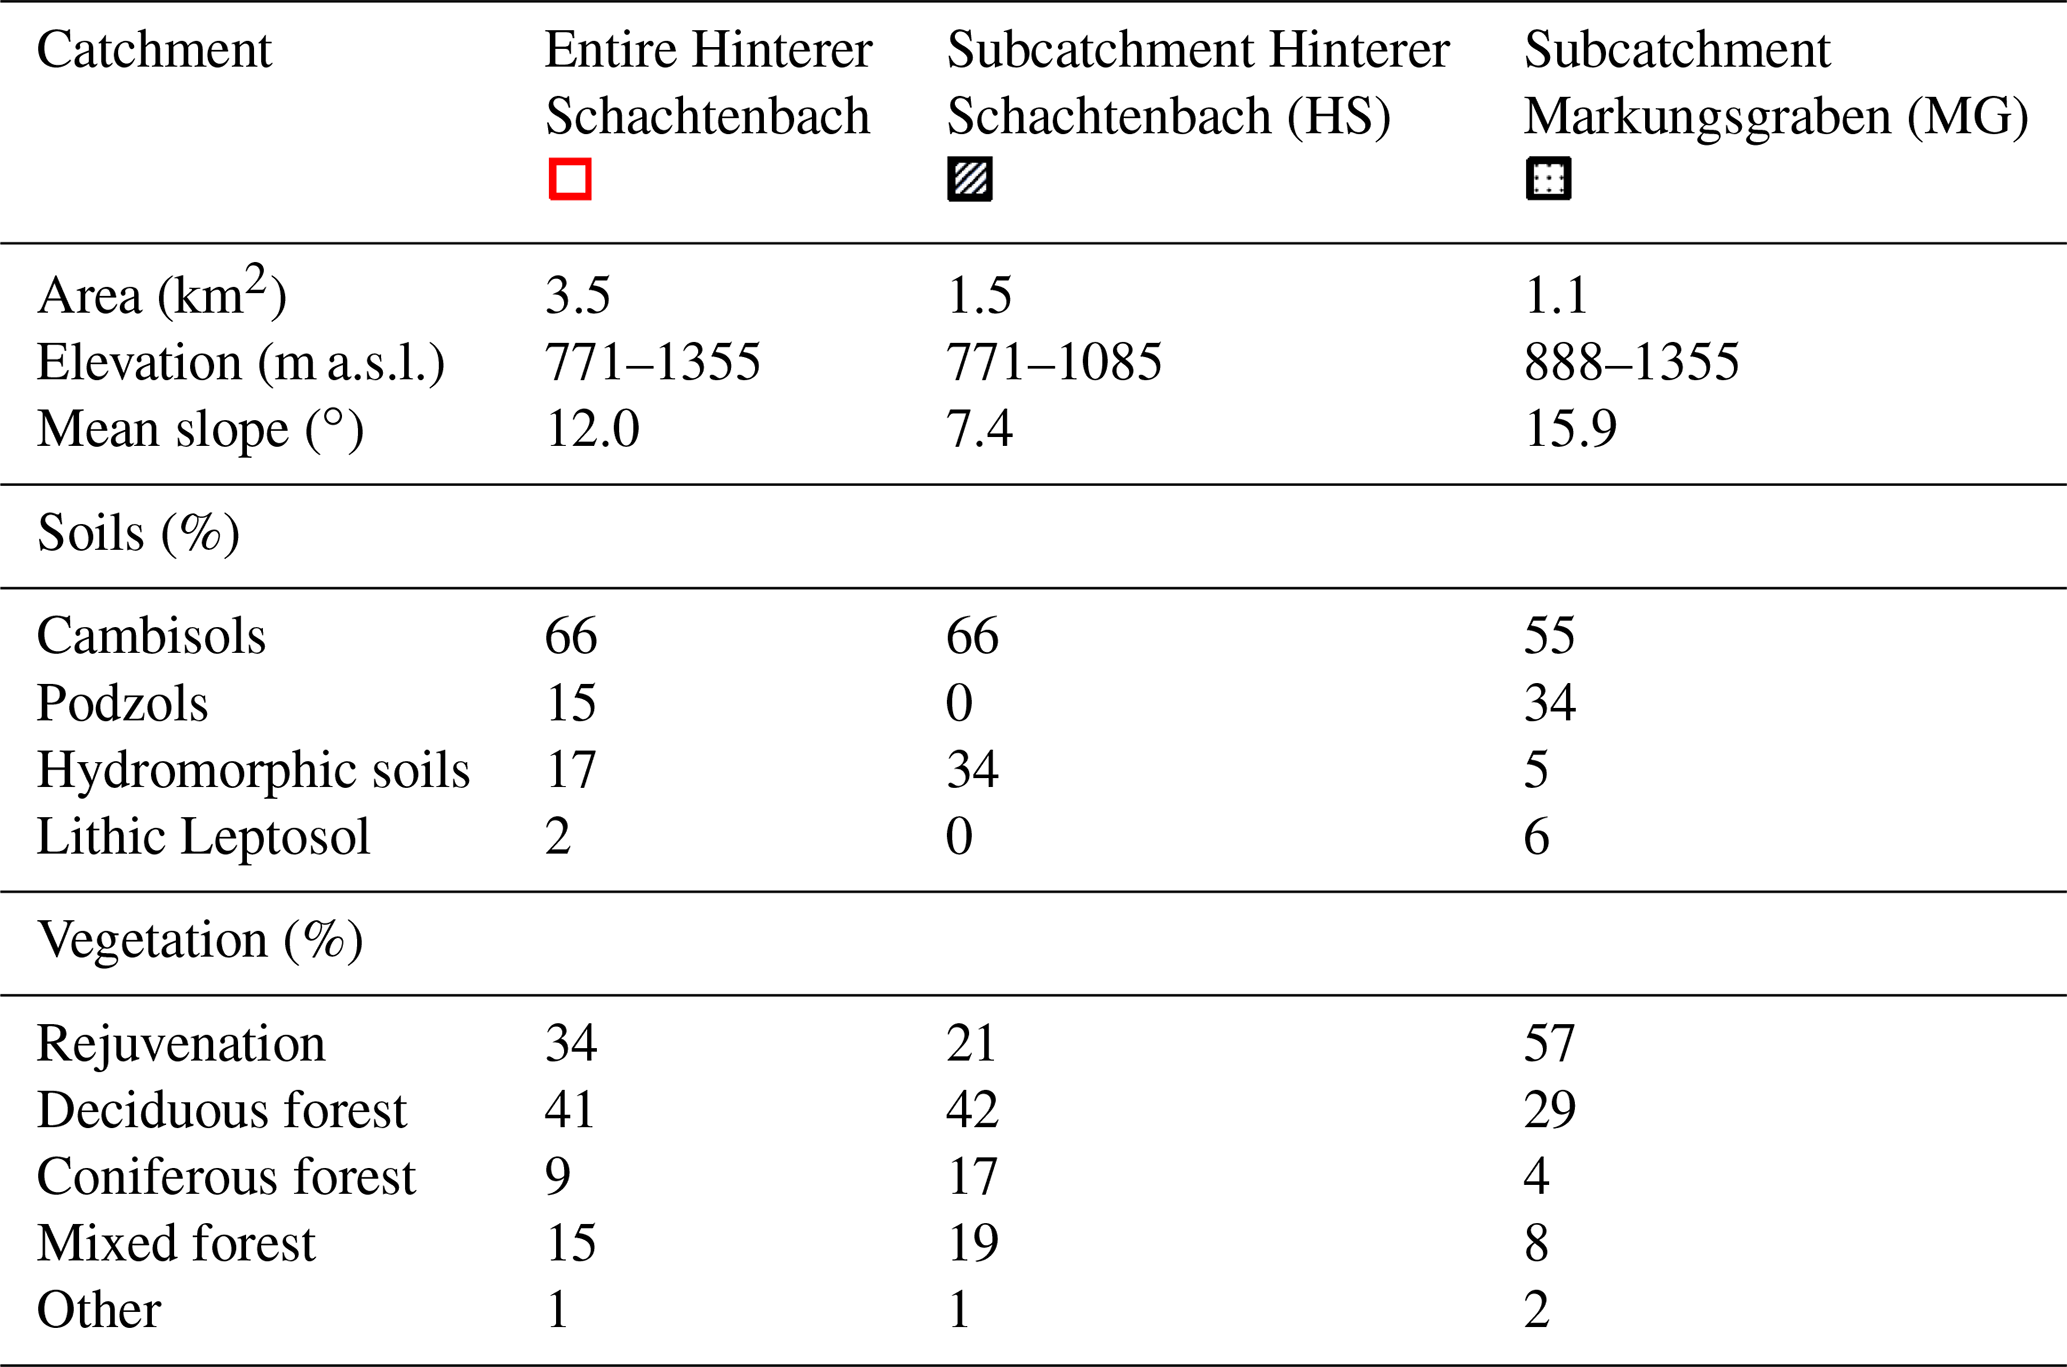
The Hinterer Schachtenbach catchment includes the subcatchments of Markungsgraben and Kaltenbrunner Seige (Fig. 1). The subcatchment of Kaltenbrunner Seige was not part of the monitoring presented here, but contributes to discharge and DOC export at the outlet of HS. Elevation in the Große Ohe catchment ranges from 770 to 1435 m above sea level (a.s.l.), with a mean slope of 7.7∘, whereas MG represents the upper part of the catchment with a steeper mean slope (15.9∘) than HS (7.4∘). The geology of the Große Ohe catchment is dominated by biotite granite and cordierite–sillimanite gneiss. The soils are mainly Cambisols, podzols and hydromorphic soils, whereby the proportion differs between the subcatchments. The mean annual precipitation (1990–2010) is 1379 mm in the subcatchment HS and 1600 mm in the subcatchment MG. Mean annual temperature is 6.2 ∘C. The entire catchment is almost exclusively covered by forest. However, large parts of the catchment are in a stage of rejuvenation due to bark beetle outbreaks in the mid-1990s and 2000s (Beudert et al., 2015). Dominant tree species in the forest are Norwegian spruce (Picea abies, 70 %) and European beech (Fagus sylvatica; Table 1).
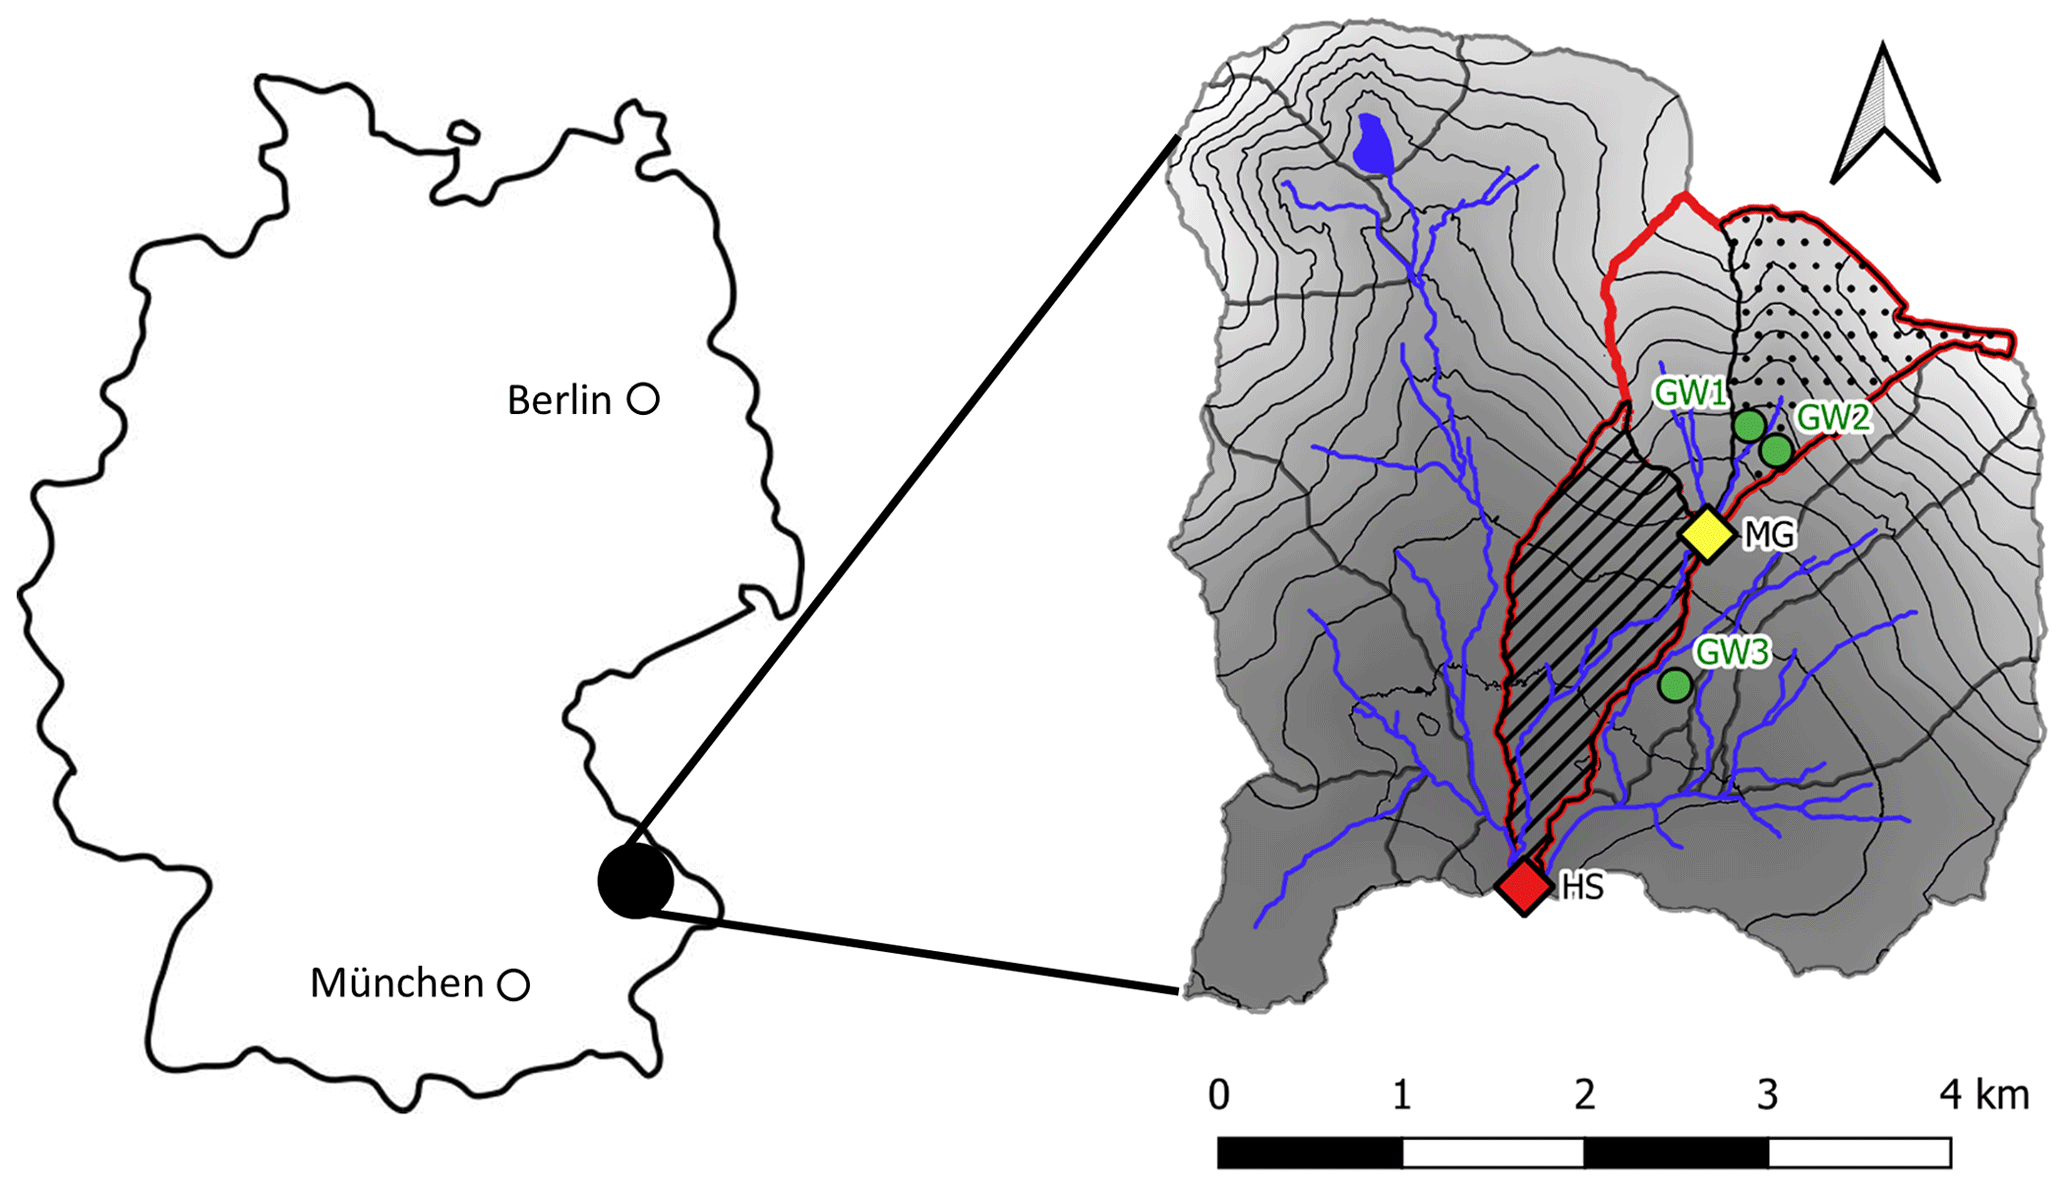
Figure 1The Große Ohe catchment is located in southeastern Germany (left-hand side). The high-frequency sampling sites were located at the outlet of Hinterer Schachtenbach (red diamond) and Markungsgraben (yellow diamond). The red outline shows the total area contributing to the outlet of Hinterer Schachtenbach, including the subcatchment Markungsgraben (dotted), Hinterer Schachtenbach (hatched) and Kaltenbrunner Seige (no pattern). The deep groundwater wells (green dots) were located in the subcatchment Markungsgraben and in the riparian zone of a neighboring subcatchment. Stream channels were identified using a 5 m resolution digital elevation model (DEM). Both the location of the stream channels and the DEM were provided by the Bavarian State Office for Environment.
2.2 Collection of field data
2.2.1 Location of the two high-frequency sampling points at different topographical positions
In total, two high-frequency sampling points with contrasting topographical positions were established for the period from June 2018 until October 2020 (Fig. 1), and HS is the measurement site located at the outlet of Hinterer Schachtenbach. It drains the Hinterer Schachtenbach subcatchment, which is referred to as the lower catchment and includes a large and flat riparian zone, as well as the upper subcatchments of Kaltenbrunner Seige, which was not monitored, and Markungsgraben. MG is the measurement site located at the outlet of Markungsgraben. This subcatchment drains steep hillslopes and is referred to as the upper catchment.
2.2.2 Climate and deep groundwater data
Precipitation and air temperature data were provided by the BFNP. Precipitation has been measured since 1978 at the station Taferlruck (48∘56.182′ N, 13∘24.819′ E), close to our sampling site at HS (Fig. 1; red diamond) and at the station Racheldiensthütte (48∘57.309′ N, 13∘25.544′ E), next to our sampling site at MG (Fig. 1; yellow diamond). In order to assess the general meteorological conditions during the sampling period 2018, 2019 and 2020, long-term mean values for the two stations for the period from 1990 to 2010 were calculated using daily measurements. As temperature data were not available for both stations during the same period, data measured at Waldhäuser (48∘55.771′ N, 13∘27.890′ E, 953 m a.s.l.; outside of the map section shown in Fig. 1), a station 3.8 km east of the catchment outlet, was used. Groundwater (GW)-level data were provided by the Bavarian State Office for the Environment for GW2 (964 m a.s.l.; 17.5 m depth). For the other two locations, GW1 (969 m a.s.l.; 16.5 m depth) and GW3 (819 m a.s.l.; 10.3 m depth), groundwater-level data were provided by the BFNP (Fig. 1). The groundwater wells are completed into granitic regolith.
2.2.3 Discharge measurements
Starting in June 2018, the water level was measured every 15 min at HS using a pressure transducer (Solinst Canada Ltd., Georgetown, ON, Canada; SEBA Hydrometrie GmbH & Co. KG, Kaufbeuren, Germany). Flow velocities were measured periodically at the same location with an electromagnetic current meter (FlowSens; SEBA Hydrometrie GmbH & Co. KG, Kaufbeuren Germany) and via tracer dilution (TQ-S; Sommer Messtechnik, Koblach, Austria). Corresponding discharge was calculated following Kreps (1975). For MG, the discharge data at a 15 min interval for the complete sampling period were taken from the database of the Bavarian State Office for Environment (2020).
2.2.4 High-frequency measurements of DOC concentration at different topographical positions
DOC concentrations were measured in situ at HS and MG using two UV-Vis (ultraviolet–visible) spectrophotometers (spectro::lyser; s::can GmbH, Vienna, Austria). The spectrometric devices recorded the absorption spectrum of stream water from 200 to 750 nm with a resolution of 2.5 nm every 15 min. DOC concentrations were quantified using the internal calibration based on the absorption values using the software ana::pro. In order to refine the internal calibration, the DOC concentrations measured by the UV-Vis spectrophotometers were calibrated using 52 (HS) and 21 (MG) grab stream samples taken over the course of the sampling period at various discharge conditions. Due to a technical failure, the device at MG had to be exchanged in 2020. Therefore, the data in 2020 were calibrated using 45 grab samples. Samples were filtered in the field using polyethersulfone membrane filters (0.45 µm) or polycarbonate track etched membrane (0.45 µm). All samples were stored until further analysis at 4 ∘C. DOC concentrations of the grab samples were analyzed in the laboratory by thermo-catalytic oxidation (TOC-L analyzer; Shimadzu, Kyoto, Japan). For further analysis, the calibrated values (R2 for HS = 0.98 for all events, R2 for MG = 0.77 for the events in 2018 and 2019 and R2 = 0.97 for the event in 2020) were used. As no drift of the DOC concentration could be identified in the measured signal, we decided against a correction for biofouling as done by Werner et al. (2019). However, the sensor optics were manually cleaned in the field every 2 weeks using cotton swabs. DOC concentrations were measured from June to November 2018, from April to November 2019 and from April to October 2020. In this study, we focus on the analysis of the four largest events for which complete data sets at both locations were available. The events were characterized by contrasting antecedent wetness conditions, as can be seen in Figs. 2 and 4, and took place in June 2018, October 2018, May 2019 and September 2020.
2.3 Analysis of event characteristics
The start of a runoff event was classified as the last time step measuring baseflow. The start of Q increase, and thus the end of baseflow, was defined as the first value higher than the sum of the average Q and the twofold standard deviation of the 3 h prior to the start of precipitation. The end of a runoff event was defined as the moment when Q returned to pre-event values. In October 2018, the observed event was quickly followed by a second event, which led to slightly overlapping hydrographs at HS. As Q was already within 0.003 m3 s−1 of pre-event baseflow, we did not simulate the end of the first hydrograph but rather used the incomplete hysteretic loop for load calculations. In September 2020, post-event baseflow was higher than pre-event baseflow and was defined as the first value lower than the 3 h average plus the twofold standard deviation prior to the start of the next event several days later.
For each event, DOC concentrations were plotted as a function of Q at a 15 min interval, and the hysteresis index (h), as proposed by Zuecco et al. (2016), was calculated. The index is based on the computation of definite integrals at fixed intervals of normalized Q and represents the difference between the integrals on the rising and falling curves computed for the same interval. A positive hysteresis index indicates a clockwise hysteresis, whereas a negative hysteresis index indicates an counterclockwise hysteresis. The larger the absolute value of h, the wider the hysteretic loop. Additionally, DOC fluxes were calculated by multiplying the 15 min discharge value with the corresponding 15 min DOC concentration. These were cumulated to a total DOC export per event and divided by the duration of the runoff events to obtain DOC load values. When comparing the contribution of different subcatchments to total Q and DOC export, we used the value 0.31, which is the ratio of the areas (Table 1) of the subcatchments (MG HS), as a benchmark.
In order to compare the specific characteristics of the precipitation events and the response of discharge and DOC concentrations in the stream, we used the following parameters. Ptot is the total amount of precipitation during the event. The antecedent precipitation (AP14) is the cumulative precipitation 14 d prior to the start of the event, following van Verseveld et al. (2009). The sum of Ptot and AP14 represents the total catchment wetness. The P–Q lag is defined as the time (in minutes) between the start of precipitation and the start of the first Q increase as a response to the precipitation. The Q lag time is the time in minutes from the first Q increase to the Q peak (Qmax). Runoff ratios were calculated as the ratio of cumulative area normalized discharge during the event to the amount of precipitation. DOC lag time is the time in minutes from Qmax to the DOC peak (DOCmax). We also introduce a new index called DOC90. It represents the period of time in minutes during which the DOC concentrations exceed 90 % of DOCmax during the event. It provides a measure for the formation of a plateau of the hysteretic loop before the decrease in DOC concentrations. The precipitation-specific DOC load is defined as the DOC load per catchment area per precipitation amount (kilograms per square kilometer per millimeter; hereafter kg km−2 mm−1). Due to the low sample size, no statistical analyses were performed.
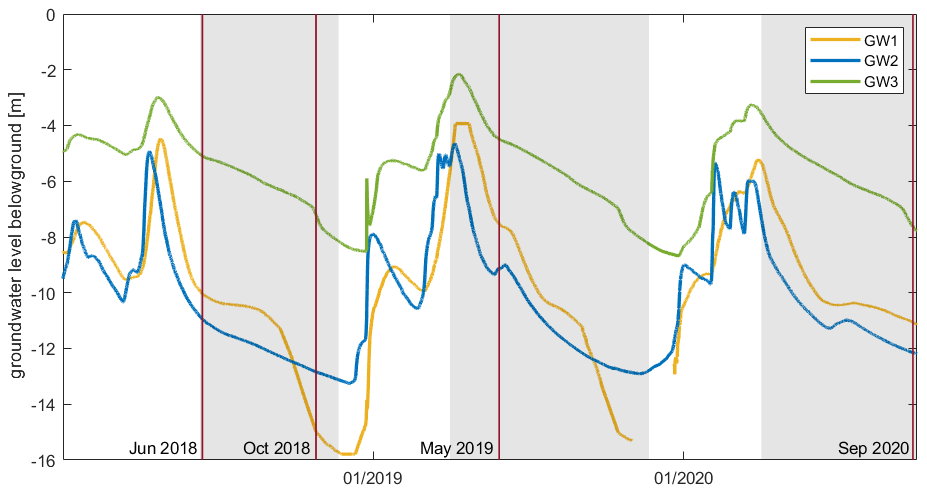
Figure 2Groundwater (GW) levels at GW1, GW2 and GW3 from 2018 to 2020. The shaded areas represent the three sampling periods and the red lines the selected events.
3.1 Hydrological preconditions and discharge response
The sampling periods in all 3 years were characterized overall by warmer temperatures and less precipitation when compared to the long-term mean monthly precipitation sums and monthly average temperatures. The annual precipitation at HS was 1126 mm in 2018, 1125 mm in 2019 and 1072 mm in 2020, which was considerably lower than the long-term average of 1379 mm (1990–2010). The annual precipitation at MG was 1274 mm in 2018, 1380 mm in 2019 and 1293 mm in 2020 compared to the long-term average of 1600 mm (1990–2010). The annual mean temperature was between 1.4 and 1.6 ∘C higher than the long-term average of 6.2 ∘C. In general, the two events in late spring/early summer (June 2018 and May 2019) were preceded by long periods of higher deep groundwater tables following winter precipitation and snowmelt (Fig. 2).
The two early fall events (October 2018 and September 2020) followed dry summers characterized by pronounced decline in the deep groundwater table. The three events analyzed in June 2018, May 2019 and October 2018 were of similar size but differed markedly in their antecedent wetness conditions (Table 2). In June 2018, several larger events occurred prior to the analyzed event, which led to a very high AP14 at both sites. The value at HS exceeded the value at MG due to a large local event in the beginning of June. In May 2019, a succession of several events led to an intermediate AP14, compared to the event in June 2018. The amount of precipitation was also slightly lower in May 2019 than during the June event in 2018. The October event followed a prolonged dry period,leading to the lowest AP14 value of the four events. The event in September 2020 was much larger than the other three events, with almost twice the amount of precipitation. The AP14, however, was very low and comparable to the October 2018 event. This offered the opportunity to evaluate the effect of event size, representing the total amount of precipitation during an event, using these two early fall events with similar AP14. In contrast, total catchment wetness values (AP14+Ptot) of the events in May 2019 and September 2020 were very similar, providing an additional opportunity to evaluate the relative importance of event size vs. antecedent wetness conditions. At HS, the highest Qmax value of the four events was found in June 2018. At MG, the highest Qmax value for the four studied events was measured for the October 2018 event (Fig. 3a), which was still not close to the mean high-flow discharge of MG of 0.869 m3 s−1. The baseflow of MG during the sampling period varied mostly between the lowest low-flow discharge (0.006 m3 s−1) and the mean low-flow discharge (0.013 m3 s−1). No comparison is possible for HS as discharge monitoring only started in June 2018. At HS, Qmax values varied as a function of total catchment wetness, whereas, at MG, Qmax was not significantly affected by total catchment wetness. At both sites, the runoff ratio was highest during the event following snowmelt in May 2019 and lowest during the event in October 2018 following the dry summer. The runoff ratios were higher at MG than at HS, with the exception of June 2018, which is the event with the highest total catchment wetness. MG generally showed a faster Q response than HS, which is represented by the shorter P–Q lag time. During the events in June 2018 and May 2019, the P–Q lag time was very similar at both locations. During the events in October 2018 and September 2020, following a dry summer, the P–Q lag time at HS was much longer than at MG. Q lag time at HS, however, was shorter than at MG during these events and longer during the events in June 2018 and May 2019.
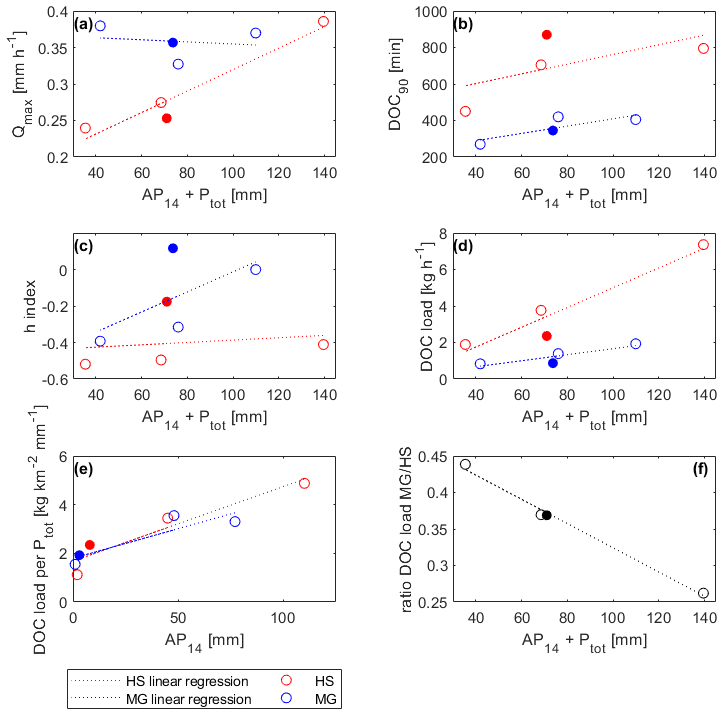
Figure 3(a–d) Event parameters as a function of the sum of AP14 and Ptot (total catchment wetness) at the upper site (HS) and the lower site (MG). The closed symbols indicate the September 2020 event with its much larger amount of precipitation. (e) Precipitation-specific DOC load (kg km−2 mm−1) as a function of AP14. (f) The ratio of the DOC load of MG HS as a function of total catchment wetness.
3.2 DOC dynamics and DOC-Q-hysteresis patterns
Our long-term measurements showed that DOC concentrations during baseflow were very similar at the two locations and usually varied between 2 and 3 mg L−1. In general, we observed rapidly rising DOC concentrations with rising discharge after precipitation events (Fig. 4). Peak DOC concentrations for the four studied events varied, for HS, between 10.2 and 18.6 mg L−1 and, for MG, between 8.5 and 16.9 mg L−1, without a clear relation (Table 2) to Ptot, AP14 or total catchment wetness. The increase in DOC concentration occurred faster at MG than at HS, which led to shorter DOC lag times at MG (Table 2). The longest DOC lag time was found in May 2019. However, the event with the shortest lag time was in September 2020 at MG, whereas, at HS, it was in June 2018. DOC concentrations at HS generally maintained their DOC90 concentrations during a longer time than at MG, and values were higher at HS during all events (Fig. 3b). This resulted in wider hysteretic loops at HS than at MG (larger absolute values of h), as the concentrations at MG decreased soon after reaching the DOC peak. The DOC–Q relationships during events showed almost exclusively counterclockwise hysteresis patterns at both sites (Fig. 5), resulting in negative hysteresis indices (h; see Table 2). Exceptions were the events in June 2018 and September 2020 at MG, where the hysteresis exhibited no clear loop form and an h value close to zero. With increasing total catchment wetness, the h value approached zero at MG (Fig. 3c). At both sites, the lowest absolute h value and, thus, the narrowest hysteretic loop was found in September 2020 during the largest event. The largest absolute h value and, thus, the widest hysteretic loop was found in October 2018 following the extreme dry period.
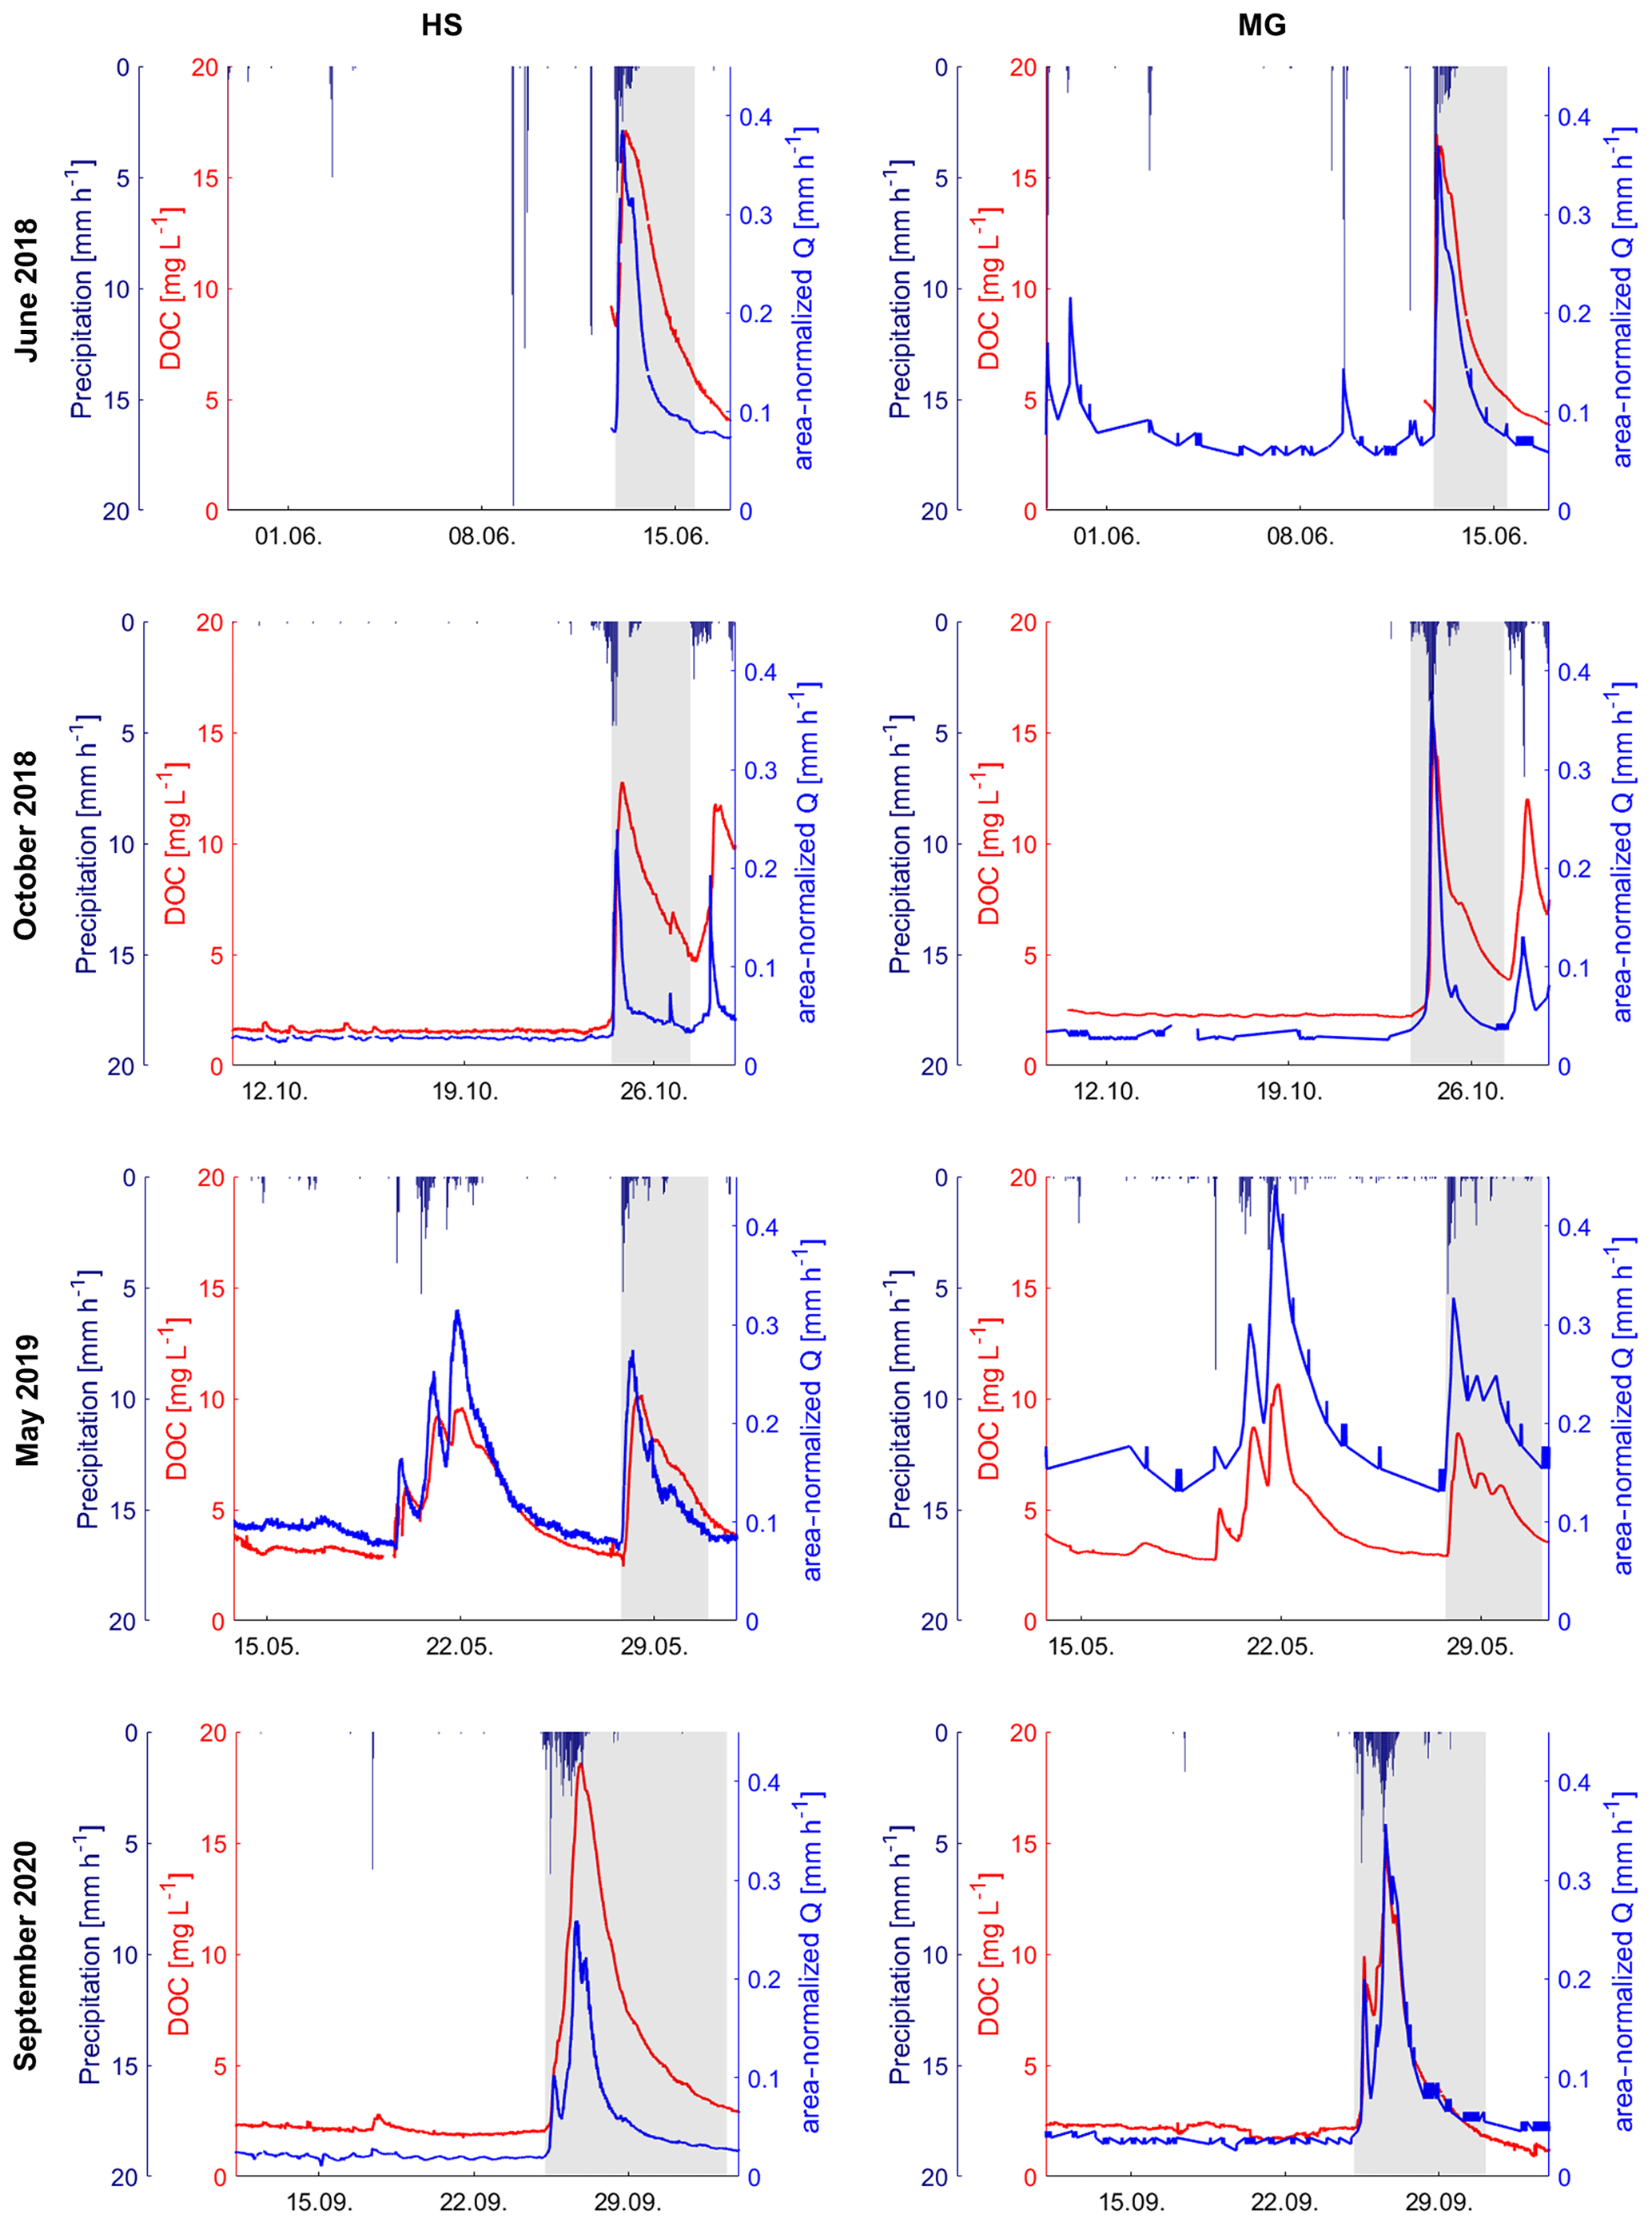
Figure 4DOC concentrations and area-normalized Q starting 14 d prior to the events in June 2018 (top row), October 2018 (second row), May 2019 (third row) and September 2020 (bottom row) at HS (left) and MG (right). The shaded areas highlight the events described in detail in Table 2.
Table 2Event characteristics of the four selected events at HS and MG, namely Ptot (total precipitation in millimeters during the event), AP14 (antecedent precipitation; cumulative precipitation in millimeters 14 d prior to event start), total catchment wetness (sum of Ptot and AP14 in millimeters), P–Q lag time (time in minutes from the start of precipitation to the start of Q increase), Q lag time (time in minutes from the start of Q increased to Qmax), Qmax (peak discharge in cubic meters per second; hereafter m3 s−1), runoff ratio, h (hysteresis index, following Zuecco et al., 2016; see Sect. 2.2), DOC lag time (time in minutes from Qmax to DOCmax), maximum DOC concentration (DOCmax in milligrams per liter; hereafter mg L−1), DOC90 (time in minutes during which the DOC concentrations exceed the 90 % of DOCmax), DOC load in kg h−1 (kilograms per hour; hereafter kg h−1) and precipitation-specific DOC load in kilograms per square kilometer per millimeter; hereafter kg km−2 mm−1.
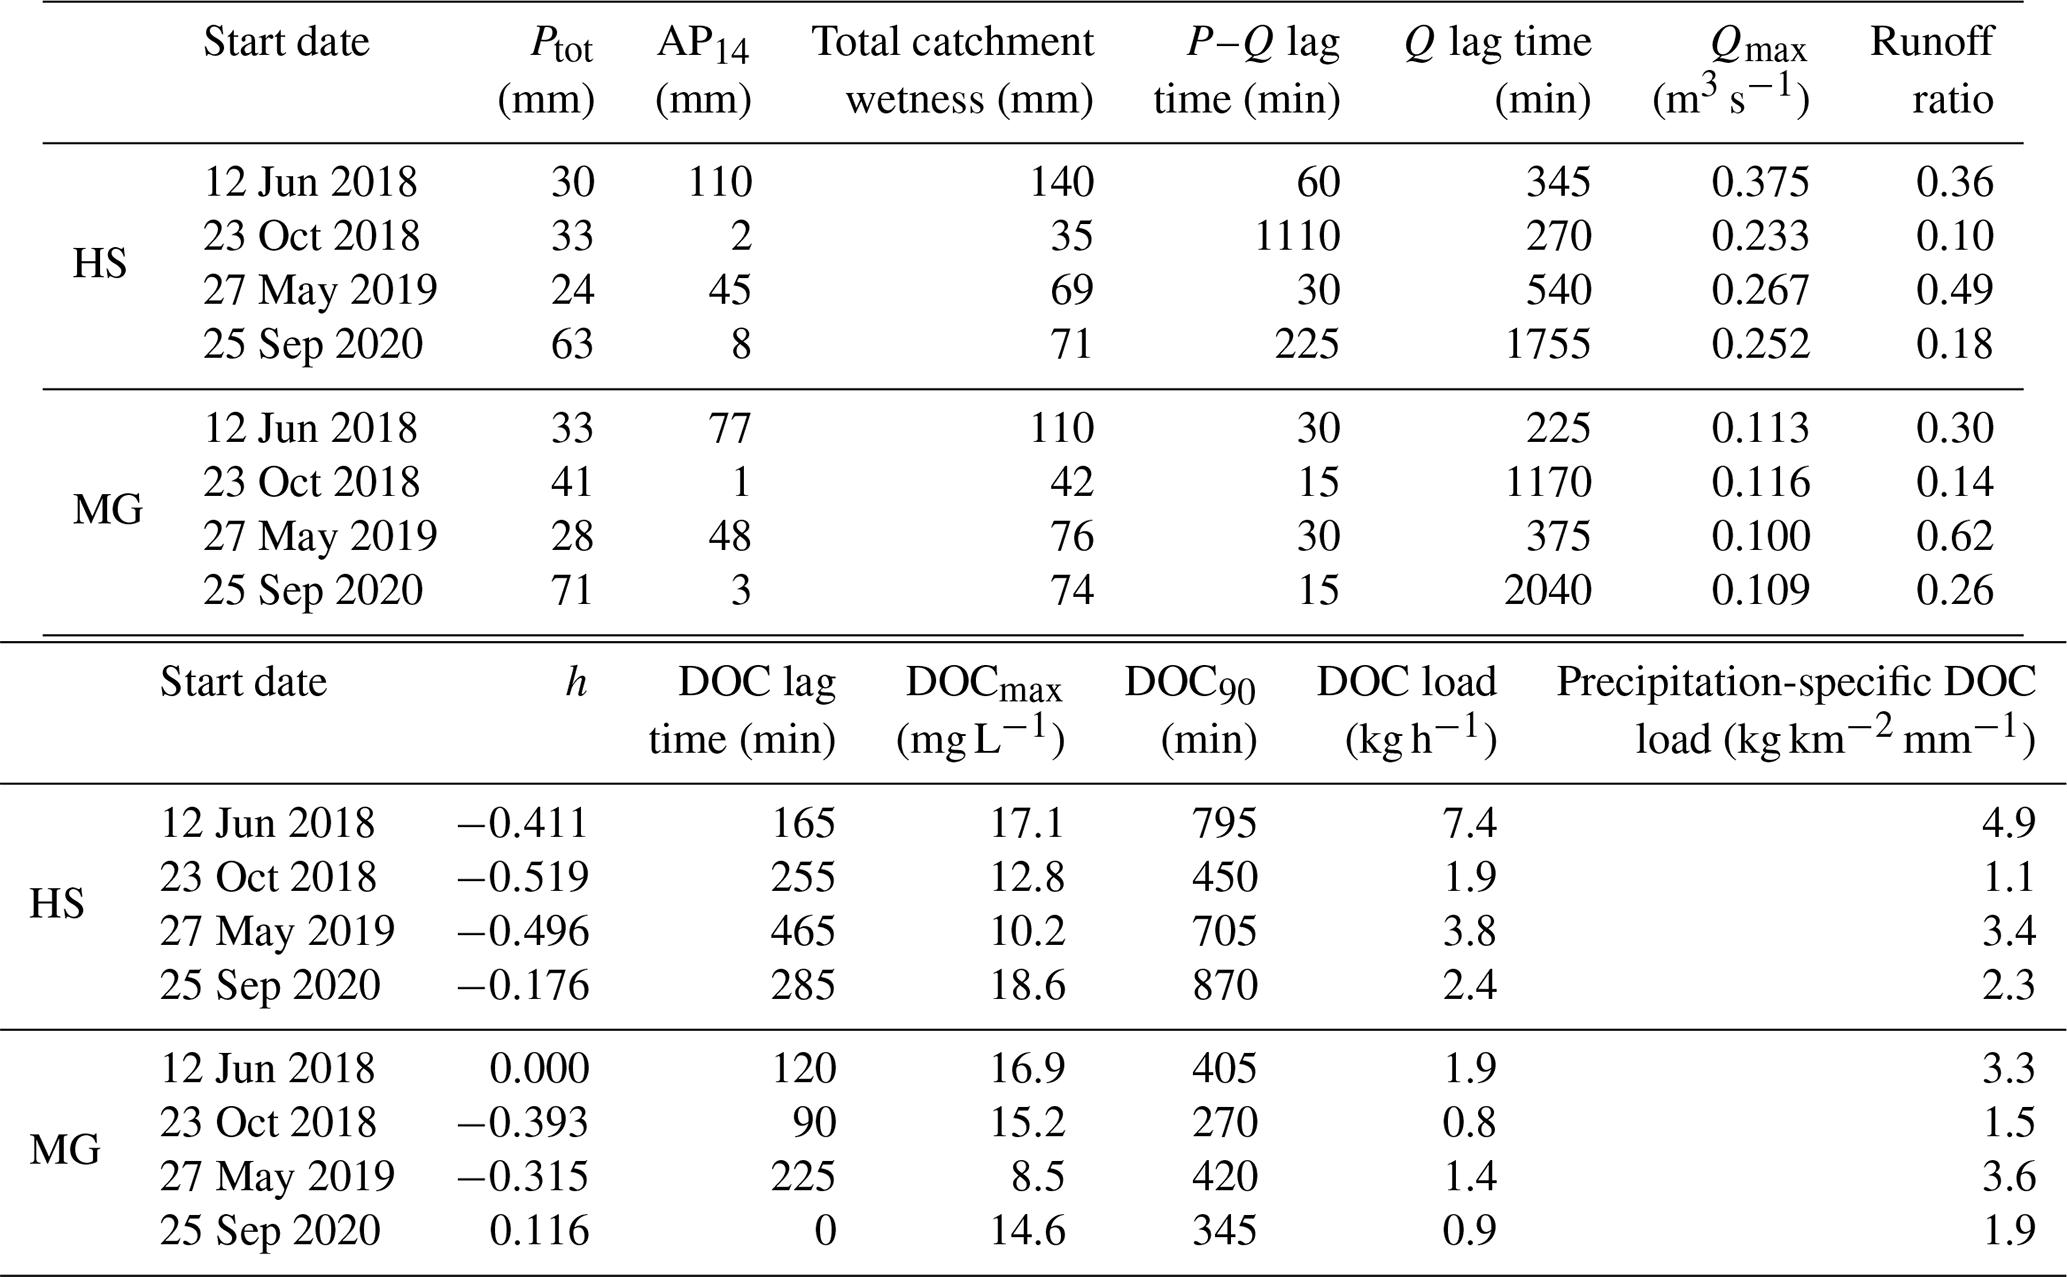

Figure 5DOC–Q hysteresis during the events in June 2018, October 2018, May 2019 and September 2020 (see gray areas in Fig. 4). The dots represent 15 min time steps, starting from dark blue to green.
3.3 DOC export from subcatchments during events with different antecedent wetness conditions
The DOC export was higher during all events at HS than at MG due to the larger catchment area. We observed the highest DOC load at both locations during the event in June 2018 with 7.4 kg h−1 at HS and 1.9 kg h−1 at MG (Table 2). At both locations, we observed the lowest DOC load during the event in October 2018, with 1.9 kg h−1 and 0.8 kg h−1, respectively. At both locations, the total DOC load increased with total catchment wetness (Fig. 3d), whereby the relationship at HS is more pronounced. And at both locations, the precipitation-specific DOC load increased clearly with the AP14 (Fig. 3e).
Assuming that the difference between the total DOC arriving at HS and the total DOC arriving at MG originated from the subcatchments of Kaltenbrunner Seige and HS, the relative contribution of MG to DOC export can be evaluated. The comparison of the ratio of cumulative water volumes and of cumulative DOC loads measured at MG and HS (Fig. 6) illustrated the varying relative contribution of the upper catchment. Although it is unlikely that the entire catchment area served as a DOC source area, we compared the contribution of the upper catchment to the expected ratio based on catchment area alone, which would be 0.31. However, only the events in June and May showed MG HS ratios close to this value for both cumulative Q and DOC. The events in October and September showed a considerably higher MG contribution for both Q and DOC, especially at the beginning of the events. Over time, the ratios approached the expected value of 0.31 as the contribution of MG decreased. In June and May, the Q and DOC ratios showed similar values, with Q being slightly higher than DOC. In contrast, during October and September, DOC ratios were higher than Q ratios most of the time. The MG contribution to the DOC load at HS was strongly negatively correlated to the total catchment wetness of the catchment (Fig. 3f).

Figure 6Ratio of cumulative Q (dashed lines) and DOC load (solid lines) at HS and MG during the four selected events. The red line indicates the expected ratio in terms of area (0.31). We included a 3 h lag of the arrival from MG at HS based on flow velocity measurements taken at high discharge.
4.1 Discharge response depends on topographical positions and antecedent wetness conditions
The sampling period was defined by prolonged dry conditions and few rain events. However, we were able to compare the reaction of the catchment at two contrasting locations to three similarly sized events and to one event that was unusually large for the observation period. The events were characterized by contrasting antecedent wetness conditions. Qmax at HS was clearly linked to the total catchment wetness prior to the event (Fig. 3a), which is in contrast to MG. This correlation suggests that precipitation events are not the only driver of Q generation, but that Q generation in the lower catchment depends highly on the antecedent wetness conditions. The Q lag times were longer at HS than at MG during the events with wet antecedent conditions and shorter during the events with dry antecedent conditions. What is even more pronounced is that P–Q lag times at HS exceeded the values at MG, especially after the prolonged dry periods, indicating a slower response to rainfall events at the lower catchment. To some extent, this observation can be attributed to the larger catchment area contributing to water fluxes at HS, resulting in longer flow pathways and a delayed Q response (Laurenson, 1964; Kirkby, 1976). We argue that topographic differences also play a key role in the response of discharge to rainfall events, especially under dry conditions. Steeper slopes in the upper catchment generate a faster delivery of water to the stream than at the lower catchment, which is characterized by a low gradient topography. Processes such as the transmissivity feedback (Bishop et al., 2004), which describes how a rising groundwater table together with increasing hydraulic conductivity in upper soil layers may lead to a delayed increase in discharge in the receiving stream (Frei et al., 2010), could be of importance in the extensive flat riparian zone of the lower catchment. Pictures taken with a time lapse camera (data not shown) indicated that here the shallow groundwater table can quickly rise into the upper soil layers. We suggest that hydrological connectivity between the wide riparian zone and the stream is the major control on delivering water to the stream. The hydrological connectivity is dependent both on topography and on the antecedent wetness conditions (Detty and McGuire, 2010; Penna et al., 2015; McGuire and McDonnell, 2010) as we will explain in the following.
As seen in Fig. 6, the upper catchment delivered relatively more water than the lower catchment after long dry periods. This proportion changed over time, with a larger fraction of discharge being contributed by the lower catchment. Zimmer and McGlynn (2018) made similar observations in an ephemeral-to-perennial basin with a humid subtropical climate and drew the conclusion that, in the headwaters, shallow flow paths can be rapidly activated, whereas, in the lowlands, slower moving groundwater is of importance. They also suggest that groundwater could be lost in the transition from upstream to downstream areas. Both of these mechanisms could play a role in the catchment studied here as well. The relationship between Qmax and total catchment wetness in our study suggests that the lower catchment is highly dependent on the establishment of hydrological connectivity for discharge generation, which is in contrast to the upper catchment. Rinderer et al. (2016) showed that the groundwater response during an event in a pre-Alpine catchment happens faster in flat areas than in steep areas. However, sites with low soil moisture showed a slower groundwater response time. This result is in line with our observation that the lower catchment is generally more important for runoff generation, with the exception of very dry conditions. The lower catchment with the low topography and large riparian zone has a larger water storage capacity in contrast to the upper catchment due to deeper soils. This effect is also reflected in the lower runoff ratios at HS than at MG, with the exception of the event with the wettest antecedent conditions (Table 2). After dry periods, the soils in the lower catchment need to be rewetted before flow pathways towards the stream become activated, whereas, in the steeper upper catchment, runoff generation is faster and, thus, contributes relatively more to the total flux, especially at the beginning of the event. Over time, the water contribution becomes balanced as flow paths in the lower catchment are connected to the stream. The correlation between the total catchment wetness and Qmax also shows that the antecedent conditions are pivotal for Q generation in the lower catchment as they strongly influence top and subsoil water stores. Even during the large event in September 2020, Qmax of HS was lower than during the events in May 2019 and June 2018, which were characterized by a smaller precipitation amount but much wetter antecedent conditions. Event size alone is, therefore, not a good predictor for peak discharge values.
4.2 The interplay of event size and antecedent wetness conditions as a controlling factor for DOC mobilization and export
As observed in previous studies, DOC concentrations did not vary strongly during baseflow but increased rapidly in response to increasing discharge following precipitation events. Concentrations were similar to values found in other temperate forested catchment in low mountain ranges (Musolff et al., 2018; Schwarze and Beudert, 2009). Larger events often lead to higher DOC concentrations in streams (McDowell and Likens, 1988; Kawasaki et al., 2005; Dawson et al., 2008). In some catchments, successive events can lead to the depletion of DOC sources (Bartsch et al., 2013; Butturini et al., 2006; Jeong et al., 2012; van Verseveld et al., 2009) and, consequently, to lower DOC concentrations. Our results showed that, after successive events, peak DOC concentrations did not decrease (Fig. 4, May 2019). We conclude, therefore, that DOC fluxes in the stream are limited by transport from the riparian zone in the Große Ohe catchment rather than being source limited, at least for the event frequency and magnitude observed during the study period. This is also the case for most of the >1000 catchments studied by Zarnetske et al. (2018), which varied in area, stream order and ecoregion type. Our data show that transport limitation is clearly linked to the antecedent wetness conditions, which strongly influence the hydrological connectivity of the catchment as it has been shown in other studies as well (Detty and McGuire, 2010; Penna et al., 2015).
In the following, we will focus on processes referring to the entire catchment, which could be observed at HS. AP14 and total catchment wetness and DOC load were positively related (Fig. 3d). The event in June 2018 with the highest AP14 and highest total catchment wetness led to the highest DOC concentrations and the highest DOC load. This becomes particularly clear in comparison with the slightly larger event in the following October. The strong relation between AP14 and the precipitation-specific DOC load confirms the importance of antecedent wetness conditions for DOC mobilization during events (Fig. 3e). The link between wet antecedent conditions, a higher connectivity and, subsequently, a higher DOC export was also observed by Zimmer and McGlynn (2018), as explained above. This observation is similar to Inamdar and Mitchell (2006), who suggested that, with increasing soil moisture, previously disconnected DOC source areas become active, leading to a strong increase in DOC export. We also observed a clear link between total catchment wetness and DOC90 (Fig. 3b). As DOC appears to be transport limited rather than source limited, the persistently high concentrations, in combination with a high discharge generation due to the existing connectivity, could then cause the pronounced DOC export during events following wet antecedent conditions.
We propose that the delayed DOC increase observable in the stream upon an increase in discharge, which is represented by the counterclockwise hysteresis loops (Fig. 5), reflects not only the larger catchment size but also the slow saturation of DOC-rich soil layers and the slow establishment of connectivity to the stream, similar to systems where the transmissivity feedback mechanisms are the dominant control on DOC fluxes (Bishop et al., 2004). In addition, connectivity with near-stream small pools could contribute to a delayed increase in DOC concentrations. We observed pools in the riparian zone that only contained water during very wet conditions. These pools then connected to a small tributary of the stream. Analyses of the pool water showed very high DOC concentrations that were between 30 and 50 mg L−1 (data not shown). The possibility that these pools contribute to DOC export when filled with water later during the event is also supported by the observation that topographic depressions can play a very important role in DOC accumulation and DOC transport to the stream (Ploum et al., 2020). In general, the riparian zone saturates over the course of a precipitation event (Ledesma et al., 2015; Tunaley et al., 2016). This process happens faster after wet antecedent conditions which lead to a larger hydrologically connected area of the riparian zone with longer flow paths in organic-rich layers on the way to the stream. These lateral subsurface flows through the upper soil horizon are an important process for DOC mobilization (Bartsch et al., 2013; Birkel et al., 2017). If the soils are wet prior to an event, connected flow paths can quickly be established, and DOC transport to the stream occurs faster than during dry conditions, which highlights that the DOC export is transport limited in this catchment. This could explain why the highest DOC exports were found during wet conditions, which is in contrast to other studies that have shown that DOC concentrations and export are especially high during events following longer dry periods due to stagnant pools in the stream (Inamdar and Mitchell, 2006; Granados et al., 2020) and an increased DOC production through oxidation of organic matter and accumulation after a dry and warm summer (Tunaley et al., 2016; Wen et al., 2020; Strohmeier et al., 2013). However, DOC export during the events in October 2018 and September 2020, following the dry summer, was relatively low due to the low discharge generation (see Sect. 4.1). This finding supports our hypothesis of transport limited DOC export and indicates that seasonal effects are of lower relevance for DOC mobilization than hydrological controls.
Hydrological connectivity is not solely influenced by the antecedent wetness conditions and storage capacities but also by the event size (Correa et al., 2019; McGuire and McDonnell, 2010), as large events lead to the expansion of saturated areas (Tetzlaff et al., 2014). Several studies have shown that event size also plays an important role in DOC mobilization as the largest DOC export of a catchment occurs during precipitation events. Large single events can contribute significantly to the annual DOC export in small catchments, whereby the event size is often more important than the event frequency (Raymond and Saiers, 2010; Raymond et al., 2016).
Comparing the two early fall events, which were characterized by equally dry antecedent conditions but different amounts of precipitation (October 2018 and September 2020), we see that the Q peak was similar at both events, although the September event had almost twice the amount of precipitation of October 2018. The lack of connectivity appeared to inhibit discharge generation in September 2020. Nevertheless, DOC export per hour was higher in September 2020, leading to a much higher total DOC export if the duration of this event is taken into account (Fig. 4). We, therefore, conclude that the event size does have an important effect on DOC export when the antecedent conditions are similar.
The two events in May 2019 and September 2020 had a similar value of total wetness (AP14 and Ptot) but differed markedly in Ptot and AP14. The setting in different seasons with contrasting antecedent wetness conditions and the difference in event size led to clear differences in some event characteristics. The September event, a large event after dry conditions, was characterized by higher DOC90 and higher DOCmax values. Higher DOC concentrations, thus, prevailed for a longer time, which could be due to a larger available DOC pool after the warm summer months (Strohmeier et al., 2013; Tunaley et al., 2016; Wen et al., 2020). The hysteretic loop was narrower in September, indicating a faster DOC mobilization due to the precipitation amount. However, as described above, missing connectivity likely inhibited DOC export, especially at the beginning of the event in September 2020, which could explain the lower DOC load than in May 2019.
Following these observations, we suggest a hierarchy of controlling factors with respect to their relevance for discharge and DOC release (Fig. 7). For Q generation, the antecedent wetness conditions are important, whereas the event size plays a minor role. For DOC export, however, the event size was of importance, as a larger event resulted in a markedly higher DOC mobilization, as observed in September 2020. During the event in June 2018, the small amount of precipitation was offset by a very high AP14, leading to a higher total DOC load than in September 2020 with less than half of the precipitation. Analyzing only the similarly sized events (June 2018, October 2018 and May 2019), total catchment wetness clearly controlled DOC export, thereby offsetting possible seasonal effects which would be expected to lead to a high DOC export during the fall events.
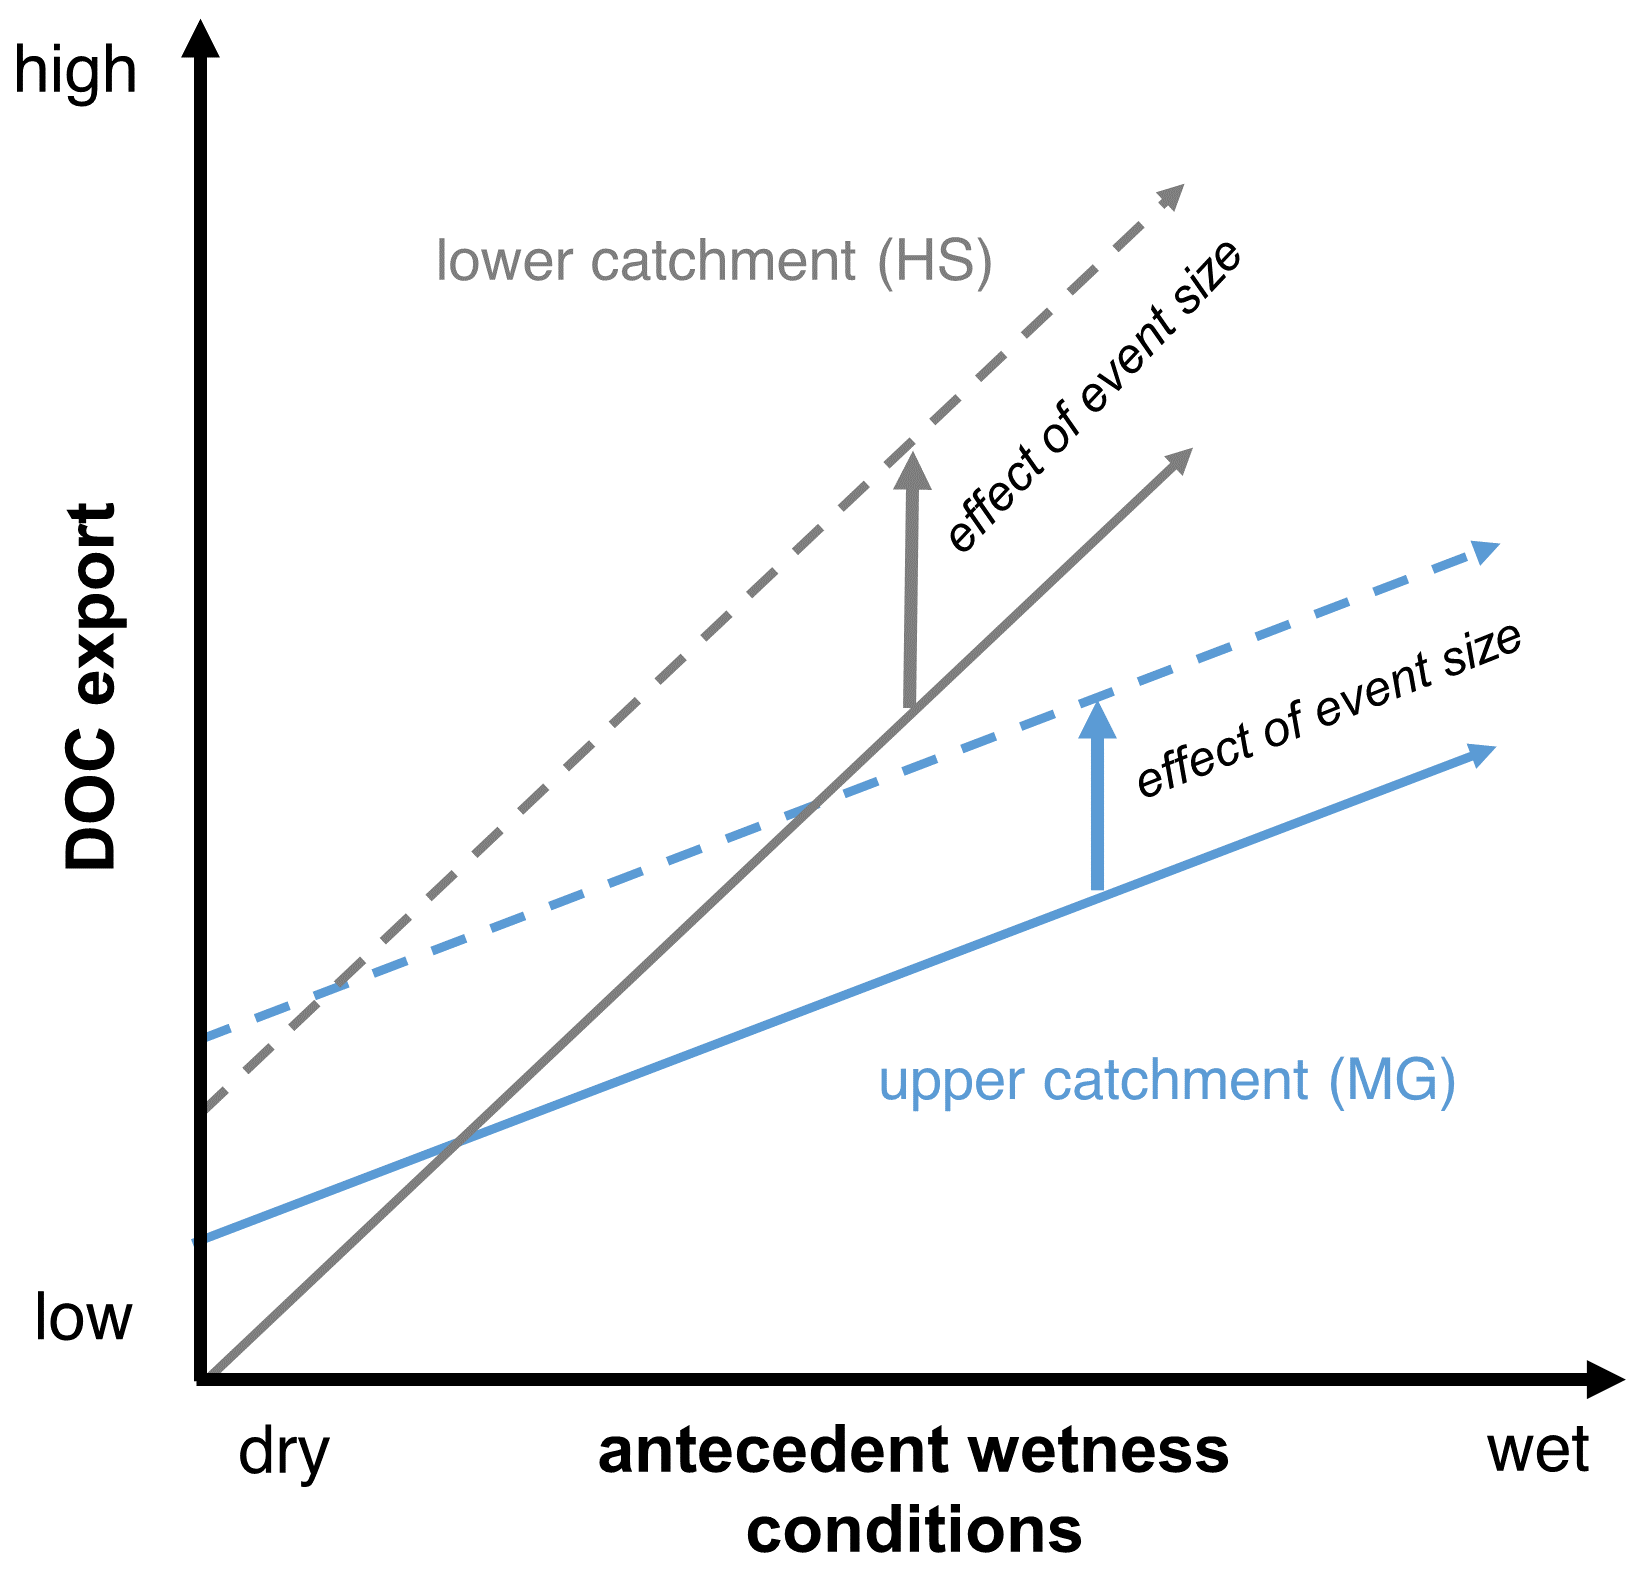
Figure 7Conceptual figure of the relation between event size, antecedent conditions and DOC export for the upper catchment MG (blue lines) and the lower catchment HS (gray lines). During similarly sized events (June 2018, October 2018 and May 2019), DOC export increased with the antecedent wetness in both subcatchments (solid lines), whereby the relation was more pronounced in the lower catchment. Therefore, the upper catchment contributed proportionally more to the total DOC export during events following dry antecedent conditions due to the low hydrological connectivity in the lower catchment. With increasing antecedent wetness, hydrological connectivity was established in the lower catchment, and its relative contribution to DOC export exceeded the contribution of the upper catchment. Larger events (September 2020) led to a larger DOC export at both subcatchments (dashed lines).
4.3 Clear differences in DOC mobilization and export between topographical positions
Antecedent wetness conditions are also linked to storage capacities and connectivity, which, in turn, are strongly correlated with topography. In contrast to HS, we could not see a correlation between Qmax and the total catchment wetness at MG, indicating different hydrological runoff processes which were less dependent on hydrological connectivity (Fig. 3a). At MG, DOC lag times were generally shorter and hysteretic loops narrower, indicating a faster DOC mobilization than at HS. As discussed in Sect. 4.1., we argue that the steeper slopes at MG facilitate a fast connectivity and transport of water and consequently DOC to the stream. In contrast to HS, we do see a relationship between the total catchment wetness and the h index (Fig. 3c). The events in June 2018 and September 2020 led to the only hysteretic loops that were not clearly counterclockwise. The very fast increase and decrease in DOC concentrations led to figure-eight-shaped, almost clockwise, loops at MG. In September 2020, the large event size led to a fast delivery of DOC to the stream. In June 2018, the wet antecedent wetness conditions facilitated a fast connection of close DOC sources to the stream with the start of the event. Correa et al. (2019) made a similar observation in a tropical alpine headwater catchment with counterclockwise hysteresis patterns of several rare Earth elements in the downstream catchment areas and clockwise hysteresis patterns in upstream parts of the catchment, which they attributed to faster-responding end members. Once reaching the maximum, DOC concentrations at MG generally started to decrease quite fast, whereas at HS they remained elevated over several hours, as seen in the DOC90 values.
Although Li et al. (2015) suggest that vegetation and the abundance of lakes and wetlands are more important for DOC export than topography alone, other studies have shown that topography can strongly influence DOC mobilization in some catchments. Both Musolff et al. (2018) and Ogawa et al. (2006) observed a correlation between the topographic wetness index, an indicator for potential soil wetness linking slope and upslope contributing area, and DOC concentrations. According to their studies, a flat area would therefore tend to export more DOC than a steep area due to a higher general wetness that favors the buildup of DOC in the soil and hydrological connectivity. Surprisingly, the calculation of DOC load revealed that the lower catchment did not always dominate export. The total DOC export per event was similar to the DOC export observed by van Verseveld et al. (2009). These authors observed export rates varying from below 50 kg km−2 per storm for events with slightly more than 40 mm precipitation to 440 kg km−2 for an event with 200 mm precipitation. Export rates at MG varied between 63 and 128 kg km−2 and at HS between 37 and 148 km−2. Taking into account the upstream catchment area of the sites, one would expect around 31 % of DOC arriving at HS coming from MG, based on the assumption that both sites have the same source strength and no DOC is lost from the stream. We use the value of 31 % for the purpose of comparison and do not intend to imply that the entire catchment area is a DOC source area. Figure 6 shows that the contribution of the upper catchment is much larger than 31 % under certain conditions and even exceeds the contribution of the lower catchment. This relative dominance of DOC originating from the upper catchment was most prominent in October 2018 and September 2020 after the dry summer and decreased with the total catchment wetness (Fig. 3f). During the large event in September 2020, the contribution of each catchment component changed over time. At the beginning of the event, considerably more DOC was mobilized from the upper catchment. Over time, however, the role of the upper catchment for DOC export decreased, and the contribution from the lower catchment increased. One aspect of a large contribution of DOC from the upper catchment might be higher precipitation than at the lower catchment, which could lead to increased DOC mobilization. The proportional amount of Q arriving from the upper catchment is higher than during the other events; however, the DOC proportion is even higher. Consequently, not all of the mobilized DOC from the upper catchment can be explained by the higher discharge induced by a higher precipitation.
These observations contrast with our expectations that the lower catchment would be more important for DOC export than the upper catchment. Although the upper catchment area has a high deadwood content that might lead to a large DOC pool (Schwarze and Beudert, 2009), the vegetation is currently dominated by mostly regenerating Norwegian spruce forests and by deciduous trees, whereas the lower catchment is partly covered by mature coniferous forest and riparian peatland. Previous studies have shown that soil layers beneath conifers are usually richer in DOC than beneath deciduous trees (Schwarze and Beudert, 2009; Borken et al., 2011), which could contribute to higher in-stream DOC concentrations. In addition, a higher DOC production would be expected in the lower catchment due to the elevation differences and, subsequently, different temperatures (Borken et al., 2011; Tunaley et al., 2016; Wen et al., 2020; Andersson et al., 2000). Another reason for a higher DOC export from the lower catchment would be the importance of large riparian zones for DOC mobilization (Ploum et al., 2020; Mei et al., 2014; Ledesma et al., 2015, 2018; Inamdar and Mitchell, 2007; Strohmeier et al., 2013; Musolff et al., 2018). The importance of the riparian zone for in-stream DOC concentrations is confirmed by DOC measurements performed in a low-elevation subcatchment next to HS with more than 40 % hydromorphic soils (Beudert et al., 2012) and with stream DOC concentrations being higher (6.3 mg L−1) at baseflow than in the lower catchment.
Nevertheless, the upper catchment contributes strongly to DOC export of the catchment, especially after dry antecedent conditions (Fig. 7). We suggest that the main reason for this reversed contribution to DOC export is rather a decreased DOC export from the lower catchment during events after dry conditions than an increased DOC export of the upper catchment during wet conditions. The variation in the DOC load between the events was much higher at HS than at MG, which indicates a high dependency on the hydrological preconditions. As explained above, connectivity seems to be important for the DOC mobilization, especially in the lower catchment where the missing connectivity in October and September seems to inhibit DOC mobilization more than in the upper catchment. A consequence of the reduced connectivity of the lower catchment could be that the riparian pools mentioned above are not connected and, thus, an important DOC source is not active. We suggest that the different topography also plays a role as flow paths in the lower catchment are not as easily connected as in the steep area. Due to the low-gradient terrain, saturated soils are necessary to transport water laterally through the DOC-rich soil layers towards the stream. In contrast, the steeper hills in the upper catchment facilitate a rapid transport to the stream independent of the rather dry soil layers, leading to a relatively high DOC export during the rain events. The change in contribution over the course of the large event in September 2020 confirms our reasoning that connectivity is the limiting factor of DOC mobilization in the lower catchment.
In this study, we showed that DOC mobilization and export depend on event size, antecedent wetness conditions and catchment topography. The amount of precipitation has a strong impact on the DOC export. However, if events are similar in size, the antecedent wetness conditions control DOC export. After wet antecedent conditions, we observed a larger DOC export than after dry conditions. Especially in the lower catchment, DOC was not mobilized at the beginning of an event as the soils in the riparian zone first needed to saturate. This led to a disproportionate contribution of the upper catchment to the total DOC export early in the events characterized by dry antecedent wetness conditions. In-stream mineralization processes will most likely not be relevant for a change in DOC concentrations as DOC in headwater catchments is usually transported conservatively during large precipitation events (Ejarque et al., 2017; Bernal et al., 2019). We cannot provide data on lateral exchange fluxes between stream and surrounding riparian area over the course of the stream, i.e., we cannot conclude if the DOC that is released at the upper catchment is still in the stream at the outlet of the lower catchment. Here, DOC quality characterization and the investigation of exchange fluxes would be helpful. DOC export is strongly dependent on antecedent moisture conditions. The dry antecedent conditions during the summer months offset possible seasonal effects linked to a higher biological activity as the drought inhibits the development of soil saturation and, thus, hydrological connectivity to streams. Different topographic positions react differently to precipitation inputs over the course of an event due to the influence of hydrological processes, which define the evolution of connectivity between DOC source zones and the streams, either facilitating or inhibiting DOC transport to the stream. As the frequency and intensity of droughts is likely to increase in the future due to climate change (Pachauri and Mayer, 2014), our study highlights that the relative contribution of different subcatchments to DOC export from mountainous catchments may change if DOC export is transport limited as it was the case in the catchment presented here. Especially the importance of riparian zones for DOC export might decrease as hydrological connectivity would be interrupted more often and, therefore, inhibit DOC mobilization. Longer drought periods could possibly reduce DOC export and slow down the current trend of rising DOC concentrations in freshwater systems.
Data supporting the findings of this study are available from the corresponding author upon reasonable request.
The study was conceptualized with contributions from all co-authors. KB collected the field data, with the support of BB, and analyzed the data. KB, LH, BSG, JHF, SP and BB discussed and interpreted the results. KB prepared the paper with contributions from all co-authors.
The authors declare that they have no conflict of interest.
Publisher's note: Copernicus Publications remains neutral with regard to jurisdictional claims in published maps and institutional affiliations.
This research has been funded by the Rudolf and Helene Glaser Foundation, as part of the project “Influence of natural factors on concentration, quality and impact of dissolved organic carbon in the Bavarian Forest National Park”. The authors would like to thank the Bavarian Forest National park (BFNP) administration, for providing physiographic and meteorological data, and the BFNP staff, for their helpful assistance with the installation and maintenance of the field equipment. The authors are also thankful for the personal and technical support obtained through the project “AquaKlif – Influence of multiple stressors on watercourses in climate change” of the Bavarian Climate Research Network BayKlif. The authors would also like to thank Ilja van Meerveld and Giulia Zuecco, for providing the MATLAB scripts for the calculation of the hysteresis index. This publication was funded by the University of Bayreuth in the funding programme Open Access Publishing.
This research has been supported by the Stifterverband (grant no. T0083\30771\2017\kg).
This paper was edited by Genevieve Ali and reviewed by two anonymous referees.
Ågren, A., Buffam, I., Berggren, M., Bishop, K., Jansson, M., and Laudon, H.: Dissolved organic carbon characteristics in boreal streams in a forest-wetland gradient during the transition between winter and summer, J. Geophys. Res., 113, G03003, https://doi.org/10.1029/2007JG000674, 2008.
Aitkenhead-Peterson, J. A., Smart, R. P., Aitkenhead, M. J., Cresser, M. S., and McDowell, W. H.: Spatial and temporal variation of dissolved organic carbon export from gauged and ungauged watersheds of Dee Valley, Scotland: Effect of land cover and C:N, Water Resour. Res., 43, W05442, https://doi.org/10.1029/2006WR004999, 2007.
Alarcon-Herrera, M. T., Bewtra, J. K., and Biswas, N.: Seasonal variations in humic substances and their reduction through water treatment processes, Can. J. Civ. Eng., 21, 173–179, https://doi.org/10.1139/l94-020, 1994.
Alvarez-Cobelas, M., Angeler, D. G., Sánchez-Carrillo, S., and Almendros, G.: A worldwide view of organic carbon export from catchments, Biogeochemistry, 107, 275–293, https://doi.org/10.1007/s10533-010-9553-z, 2012.
Andersson, S., Nilsson, S. I., and Saetre, P.: Leaching of dissolved organic carbon (DOC) and dissolved organic nitrogen (DON) in mor humus as affected by temperature and pH, Soil Biol. Biochem., 32, 1–10, 2000.
Bartsch, S., Peiffer, S., Shope, C. L., Arnhold, S., Jeong, J.-J., Park, J.-H., Eum, J., Kim, B., and Fleckenstein, J. H.: Monsoonal-type climate or land-use management: Understanding their role in the mobilization of nitrate and DOC in a mountainous catchment, J. Hydrol., 507, 149–162, https://doi.org/10.1016/j.jhydrol.2013.10.012, 2013.
Batjes, N. H.: Total carbon and nitrogen in the soils of the world, Eur. J. Soil Sci., 65, 4–21, 2014.
Battin, T. J., Luyssaert, S., Kaplan, L. A., Aufdenkampe, A. K., Richter, A., and Tranvik, L. J.: The boundless carbon cycle, Nat. Geosci., 2, 598–600, https://doi.org/10.1038/ngeo618, 2009.
Bavarian State Office for Environment: Aktuelle Messwerte Rachel-Diensthütte/Markungsgraben, available at: https://www.gkd.bayern.de/de/fluesse/abfluss/passau/rachel-diensthuette-17418004/messwerte, last access: 1 December 2020.
Bernal, S., Lupon, A., Wollheim, W. M., Sabater, F., Poblador, S., and Martí, E.: Supply, Demand, and In-Stream Retention of Dissolved Organic Carbon and Nitrate During Storms in Mediterranean Forested Headwater Streams, Front. Environ. Sci., 7, 60, https://doi.org/10.3389/fenvs.2019.00060, 2019.
Beudert, B., Spitzy, A., Klöcking, B., Zimmermann, L., Bässler, C., and Foullois, N.: DOC-Langzeitmonitoring im Einzugsgebiet der “Großen Ohe”, Wasserhaushalt und Stoffbilanzen im naturnahen Einzugsgebiet Große Ohe, National Park Administration Bavarian Forest, Grafenau, Germany, 2012.
Beudert, B., Bässler, C., Thorn, S., Noss, R., Schröder, B., Dieffenbach-Fries, H., Foullois, N., and Müller, J.: Bark Beetles Increase Biodiversity While Maintaining Drinking Water Quality, Conserv. Lett., 8, 272–281, https://doi.org/10.1111/conl.12153, 2015.
Birkel, C., Broder, T., and Biester, H.: Nonlinear and threshold-dominated runoff generation controls DOC export in a small peat catchment, J. Geophys. Res.-Biogeo., 122, 498–513, https://doi.org/10.1002/2016JG003621, 2017.
Bishop, K., Seibert, J., Köhler, S., and Laudon, H.: Resolving the Double Paradox of rapidly mobilized old water with highly variable responses in runoff chemistry, Hydrol. Process., 18, 185–189, https://doi.org/10.1002/hyp.5209, 2004.
Blaen, P. J., Khamis, K., Lloyd, C., Comer-Warner, S., Ciocca, F., Thomas, R. M., MacKenzie, A. R., and Krause, S.: High-frequency monitoring of catchment nutrient exports reveals highly variable storm event responses and dynamic source zone activation, J. Geophys. Res.-Biogeo., 122, 2265–2281, https://doi.org/10.1002/2017JG003904, 2017.
Borken, W., Ahrens, B., Schulz, C., and Zimmermann, L.: Site-to-site variability and temporal trends of DOC concentrations and fluxes in temperate forest soils, Global Change Biol., 17, 2428–2443, https://doi.org/10.1111/j.1365-2486.2011.02390.x, 2011.
Bowes, M. J., Smith, J. T., and Neal, C.: The value of high-resolution nutrient monitoring: A case study of the River Frome, Dorset, UK, J. Hydrol., 378, 82–96, https://doi.org/10.1016/j.jhydrol.2009.09.015, 2009.
Brown, V. A., McDonnell, J. J., Burns, D. A., and Kendall, C.: The role of event water, a rapid shallow flow component, and catchment size in summer stormflow, J. Hydrol., 217, 171–190, https://doi.org/10.1016/S0022-1694(98)00247-9, 1999.
Buffam, I., Galloway, J. N., Blum, L. K., and McGlathery, K. J.: A stormflow/baseflow comparison of dissolved organic matter concentrations and bioavailability in an Appalachian stream, Biogeochemistry, 53, 269–306, 2001.
Butturini, A., Gallart, F., Latron, J., Vazquez, E., and Sabater, F.: Cross-site Comparison of Variability of DOC and Nitrate c–q Hysteresis during the Autumn–winter Period in Three Mediterranean Headwater Streams: A Synthetic Approach, Biogeochemistry, 77, 327–349, https://doi.org/10.1007/s10533-005-0711-7, 2006.
Cerro, I., Sanchez-Perez, J. M., Ruiz-Romera, E., and Antigüedad, I.: Variability of particulate (SS, POC) and dissolved (DOC, NO) matter during storm events in the Alegria agricultural watershed, Hydrol. Process., 28, 2855–2867, https://doi.org/10.1002/hyp.9850, 2014.
Clark, J. M., Bottrell, S. H., Evans, C. D., Monteith, D. T., Bartlett, R., Rose, R., Newton, R. J., and Chapman, P. J.: The importance of the relationship between scale and process in understanding long-term DOC dynamics, Sci. Total Environ., 408, 2768–2775, https://doi.org/10.1016/j.scitotenv.2010.02.046, 2010.
Correa, A., Breuer, L., Crespo, P., Célleri, R., Feyen, J., Birkel, C., Silva, C., and Windhorst, D.: Spatially distributed hydro-chemical data with temporally high-resolution is needed to adequately assess the hydrological functioning of headwater catchments, Sci. Total Environ., 651, 1613–1626, https://doi.org/10.1016/j.scitotenv.2018.09.189, 2019.
Covino, T.: Hydrologic connectivity as a framework for understanding biogeochemical flux through watersheds and along fluvial networks, Geomorphology, 277, 133–144, https://doi.org/10.1016/j.geomorph.2016.09.030, 2017.
Creed, I. F., Beall, F. D., Clair, T. A., Dillon, P. J., and Hesslein, R. H.: Predicting export of dissolved organic carbon from forested catchments in glaciated landscapes with shallow soils, Global Biogeochem. Cycles, 22, GB4024, https://doi.org/10.1029/2008GB003294, 2008.
Dawson, J. J. C., Soulsby, C., Tetzlaff, D., Hrachowitz, M., Dunn, S. M., and Malcolm, I. A.: Influence of hydrology and seasonality on DOC exports from three contrasting upland catchments, Biogeochemistry, 90, 93–113, https://doi.org/10.1007/s10533-008-9234-3, 2008.
Detty, J. M. and McGuire, K. J.: Topographic controls on shallow groundwater dynamics: implications of hydrologic connectivity between hillslopes and riparian zones in a till mantled catchment, Hydrol. Process., 24, 2222–2236, https://doi.org/10.1002/hyp.7656, 2010.
Dixon, R. K., Brown, S., Houghton, R. A., Solomon, A. M., Trexler, M. C., and Wisniewski, J.: Carbon Pools and Flux of Global Forest Ecosystems, Science, 263, 185–190, 1994.
Dörr, H. and Münnich, K. O.: Lead and Cesium Transport in European Forest Soils, Water Air Soil Pollut., 57–58, 809–818, 1991.
Drake, T. W., Raymond, P. A., and Spencer, R. G. M.: Terrestrial carbon inputs to inland waters: A current synthesis of estimates and uncertainty, Limnol. Oceanogr., 3, 132–142, https://doi.org/10.1002/lol2.10055, 2018.
Easthouse, K. B., Mulder, J., Christophersen, N., and Seip, H. M.: Dissolved organic carbon fractions in soil and stream water during variable hydrological conditions at Birkenes, southern Norway, Water Resour. Res., 28, 1585–1596, 1992.
Ejarque, E., Freixa, A., Vazquez, E., Guarch, A., Amalfitano, S., Fazi, S., Romaní, A. M., and Butturini, A.: Quality and reactivity of dissolved organic matter in a Mediterranean river across hydrological and spatial gradients, Sci. Total Environ., 599–600, 1802–1812, https://doi.org/10.1016/j.scitotenv.2017.05.113, 2017.
Evans, C. D., Monteith, D. T., and Cooper, D. M.: Long-term increases in surface water dissolved organic carbon: observations, possible causes and environmental impacts, Environmental pollution (Barking, Essex 1987), 137, 55–71, https://doi.org/10.1016/j.envpol.2004.12.031, 2005.
Evans, C. D., Chapman, P. J., Clark, J. M., Montheith, D., and Cresser, M. S.: Alternative explanations for rising dissolved organic carbon export from organic soils, Global Change Biol., 12, 2044–2053, https://doi.org/10.1111/j.1365-2486.2006.01241.x, 2006.
Fazekas, H. M., Wymore, A. S., and McDowell, W. H.: Dissolved Organic Carbon and Nitrate Concentration-Discharge Behavior Across Scales: Land Use, Excursions, and Misclassification, Water Resour. Res., 56, e2019WR027028, https://doi.org/10.1029/2019WR027028, 2020.
Frei, S., Lischeid, G., and Fleckenstein, J. H.: Effects of micro-topography on surface–subsurface exchange and runoff generation in a virtual riparian wetland – A modeling study, Adv. Water Resour., 33, 1388–1401, https://doi.org/10.1016/j.advwatres.2010.07.006, 2010.
Granados, V., Gutiérrez-Cánovas, C., Arias-Real, R., Obrador, B., Harjung, A., and Butturini, A.: The interruption of longitudinal hydrological connectivity causes delayed responses in dissolved organic matter, Sci. Total Environ., 713, 136619, https://doi.org/10.1016/j.scitotenv.2020.136619, 2020.
Hagedorn, F., Schleppi, P., Waldner, P., and Flühler, H.: Export of dissolved organic carbon and nitrogen from Gleysol dominated catchments – the significance of water flow paths, Biogeochemistry, 50, 137–161, 2000.
Harrison, J. A., Caraco, N., and Seitzinger, S. P.: Global patterns and sources of dissolved organic matter export to the coastal zone: Results from a spatially explicit, global model, Global Biogeochem. Cycles, 19, GB4S04, https://doi.org/10.1029/2005GB002480, 2005.
Hobbie, J. E. and Likens, G. E.: Output of Phosphorus, Dissolved Organic Carbon, and Fine Particulate Carbon from Hubbard Brook Watersheds, Limnol. Oceanogr., 18, 734–742, 1973.
Hongve, D., Riise, G., and Kristiansen, J. F.: Increased colour and organic acid concentrations in Norwegian forest lakes and drinking water? a result of increased precipitation?, Aquat. Sci., 66, 231–238, https://doi.org/10.1007/s00027-004-0708-7, 2004.
Hood, E., Gooseff, M. N., and Johnson, S. L.: Changes in the character of stream water dissolved organic carbon during flushing in three small watersheds, Oregon, J. Geophys. Res., 111, 567, https://doi.org/10.1029/2005JG000082, 2006.
Hope, D., Billet, M. F., and Cresser, M. S.: A Review of the Export of Carbon in River Water: Fluxes and Processes, Environ. Pollut., 84, 301–324, 1994.
House, W. A. and Warwick, M. S.: Hysteresis of the solute concentration/discharge relationship in rivers during storms, Water Res., 32, 2279–2290, 1998.
Hruška, J., Krám, P., McDowell, W. H., and Oulehle, F.: Increased Dissolved Organic Carbon (DOC) in Central European Streams is Driven by Reductions in Ionic Strength Rather than Climate Change or Decreasing Acidity, Environ. Sci. Technol., 43, 4320–4326, https://doi.org/10.1021/es803645w, 2009.
Inamdar, S. P. and Mitchell, M. J.: Hydrologic and topographic controls on storm-event exports of dissolved organic carbon (DOC) and nitrate across catchment scales, Water Resour. Res., 42, 378, https://doi.org/10.1029/2005WR004212, 2006.
Inamdar, S. P. and Mitchell, M. J.: Contributions of riparian and hillslope waters to storm runoff across multiple catchments and storm events in a glaciated forested watershed, J. Hydrol., 341, 116–130, https://doi.org/10.1016/j.jhydrol.2007.05.007, 2007.
Jankowski, K. J. and Schindler, D. E.: Watershed geomorphology modifies the sensitivity of aquatic ecosystem metabolism to temperature, Sci. Rep.-UK, 9, 17619, https://doi.org/10.1038/s41598-019-53703-3, 2019.
Jeong, J.-J., Bartsch, S., Fleckenstein, J. H., Matzner, E., Tenhunen, J. D., Lee, S. D., Park, S. K., and Park, J.-H.: Differential storm responses of dissolved and particulate organic carbon in a mountainous headwater stream, investigated by high-frequency, in situ optical measurements, J. Geophys. Res., 117, G03013, https://doi.org/10.1029/2012JG001999, 2012.
Kawasaki, M., Ohte, N., and Katsuyama, M.: Biogeochemical and hydrological controls on carbon export from a forested catchment in central Japan, Ecol. Res., 20, 347–358, https://doi.org/10.1007/s11284-005-0050-0, 2005.
Kiewiet, L., van Meerveld, I., Stähli, M., and Seibert, J.: Do stream water solute concentrations reflect when connectivity occurs in a small, pre-Alpine headwater catchment?, Hydrol. Earth Syst. Sci., 24, 3381–3398, https://doi.org/10.5194/hess-24-3381-2020, 2020.
Kindler, R., Siemens, J., Kaiser, K., Walmsley David C., Bernhofer, C., Buchmann, N., Cellier, P., Eugster, W., Gleixner, G., Grünwald, T., Heim, A., Ibrom, A., Jones, S., Jones, M., Klumpp, K., Kutsch, W., Larsen, K. S., Lehuger, S., Loubet, B., McKenzie, R., Moors, E., Osborne, B., Pilegard, K., Rebmann, C., Saunders, M., Schmidt, M., Schrumpf, M., Seyfferth, J., Skiba, U., Soussana, J.-F., Sutton, M., Tefs, C., Vowinckel, B., Zeeman, M. J., and Kaupenjohann, M.: Dissolved carbon leaching from soil is a crucial component of the net ecosystem carbon balance, Global Change Biol., 17, 1167–1185, https://doi.org/10.1111/j.1365-2486.2010.02282.x, 2011.
Kirkby, M. J.: Tests of the random network model, and its application to basin hydrology, Earth Surf. Process., 1, 197–212, https://doi.org/10.1002/esp.3290010302, 1976.
Knorr, K.-H.: DOC-dynamics in a small headwater catchment as driven by redox fluctuations and hydrological flow paths – are DOC exports mediated by iron reduction/oxidation cycles?, Biogeosciences, 10, 891–904, https://doi.org/10.5194/bg-10-891-2013, 2013.
Kreps, H.: Praktische Arbeit in der Hydrographie, Central Hydrographical Bureau, Vienna, Austria, 1975.
Larson, J. H., Frost, P. C., Xenopoulos, M. A., Williams, C. J., Morales-Williams, A. M., Vallazza, J. M., Nelson, J. C., and Richardson, W. B.: Relationships Between Land Cover and Dissolved Organic Matter Change Along the River to Lake Transition, Ecosystems, 17, 1413–1425, https://doi.org/10.1007/s10021-014-9804-2, 2014.
Laurenson, E. M.: A catchment storage model for runoff routing, J. Hydrol., 2, 141–163, https://doi.org/10.1016/0022-1694(64)90025-3, 1964.
Ledesma, J. L. J., Köhler, S. J., and Futter, M. N.: Long-term dynamics of dissolved organic carbon: implications for drinking water supply, Sci. Total Environ., 432, 1–11, https://doi.org/10.1016/j.scitotenv.2012.05.071, 2012.
Ledesma, J. L. J., Grabs, T., Bishop, K. H., Schiff, S. L., and Köhler, S. J.: Potential for long-term transfer of dissolved organic carbon from riparian zones to streams in boreal catchments, Global Change Biol., 21, 2963–2979, https://doi.org/10.1111/gcb.12872, 2015.
Ledesma, J. L. J., Futter, M. N., Laudon, H., EVANS, C. D., and Köhler, S. J.: Boreal forest riparian zones regulate stream sulfate and dissolved organic carbon, Sci. Total Environ., 560–561, 110–122, https://doi.org/10.1016/j.scitotenv.2016.03.230, 2016.
Ledesma, J. L. J., Kothawala, D. N., Bastviken, P., Maehder, S., Grabs, T., and Futter, M. N.: Stream Dissolved Organic Matter Composition Reflects the Riparian Zone, Not Upslope Soils in Boreal Forest Headwaters, Water Resour. Res., 54, 3896–3912, https://doi.org/10.1029/2017WR021793, 2018.
Li, M., Giorgio, P. A., Parkes, A. H., and Prairie, Y. T.: The relative influence of topography and land cover on inorganic and organic carbon exports from catchments in southern Quebec, Canada, J. Geophys. Res.-Biogeo., 120, 2562–2578, https://doi.org/10.1002/2015JG003073, 2015.
McDowell, W. H. and Fisher, S. G.: Autumnal Processing of Dissolved Organic Matter in a Small Woodland Stream Ecosystem, Ecology, 57, 561–569, 1976.
McDowell, W. H. and Likens, G. E.: Origin, Composition, and Flux of Dissolved Organic Carbon in the Hubbard Brook Valley, Ecol. Monogr., 58, 177–195, https://doi.org/10.2307/2937024, 1988.
McGuire, K. J. and McDonnell, J. J.: Hydrological connectivity of hillslopes and streams: Characteristic time scales and nonlinearities, Water Resour. Res., 46, W10543, https://doi.org/10.1029/2010WR009341, 2010.
Mei, Y., Hornberger, G. M., Kaplan, L. A., Newbold, J. D., and Aufdenkampe, A. K.: The delivery of dissolved organic carbon from a forested hillslope to a headwater stream in southeastern Pennsylvania, USA, Water Resour. Res., 50, 5774–5796, https://doi.org/10.1002/2014WR015635, 2014.
Meyer, J. L. and Tate, C. M.: The effects of watershed disturbance on dissolved organic carbon dynamics of a stream, Ecology, 64, 33–44, 1983.
Monteith, D. T., Stoddard, J. L., EVANS, C. D., Wit, H. A. de, Forsius, M., Høgåsen, T., Wilander, A., Skjelkvåle, B. L., Jeffries, D. S., Vuorenmaa, J., Keller, B., Kopácek, J., and Vesely, J.: Dissolved organic carbon trends resulting from changes in atmospheric deposition chemistry, Nature, 450, 537–540, https://doi.org/10.1038/nature06316, 2007.
Moore, T. R., Paré, D., and Boutin, R.: Production of Dissolved Organic Carbon in Canadian Forest Soils, Ecosystems, 11, 740–751, https://doi.org/10.1007/s10021-008-9156-x, 2008.
Musolff, A., Selle, B., Büttner, O., Opitz, M., and Tittel, J.: Unexpected release of phosphate and organic carbon to streams linked to declining nitrogen depositions, Global Change Biol., 23, 1891–1901, https://doi.org/10.1111/gcb.13498, 2016.
Musolff, A., Fleckenstein, J. H., Rao, P. S. C., and Jawitz, J. W.: Emergent archetype patterns of coupled hydrologic and biogeochemical responses in catchments, Geophys. Res. Lett., 44, 4143–4151, https://doi.org/10.1002/2017GL072630, 2017.
Musolff, A., Fleckenstein, J. H., Opitz, M., Büttner, O., Kumar, R., and Tittel, J.: Spatio-temporal controls of dissolved organic carbon stream water concentrations, J. Hydrol., 566, 205–215, https://doi.org/10.1016/j.jhydrol.2018.09.011, 2018.
Ogawa, A., Shibata, H., Suzuki, K., Mitchell, M. J., and Ikegami, Y.: Relationship of topography to surface water chemistry with particular focus on nitrogen and organic carbon solutes within a forested watershed in Hokkaido, Japan, Hydrol. Process., 20, 251–265, https://doi.org/10.1002/hyp.5901, 2006.
Pachauri, R. K. and Mayer, L. (Eds.): Climate change 2014: Synthesis report, Intergovernmental Panel on Climate Change, Geneva, Switzerland, 151 pp., 2014.
Pacific, V. J., Jencso, K. G., and McGlynn, B. L.: Variable flushing mechanisms and landscape structure control stream DOC export during snowmelt in a set of nested catchments, Biogeochemistry, 99, 193–211, https://doi.org/10.1007/s10533-009-9401-1, 2010.
Penna, D., van Meerveld, H. J., Oliviero, O., Zuecco, G., Assendelft, R. S., Dalla Fontana, G., and Borga, M.: Seasonal changes in runoff generation in a small forested mountain catchment, Hydrol. Process., 29, 2027–2042, https://doi.org/10.1002/hyp.10347, 2015.
Ploum, S. W., Laudon, H., Peralta-Tapia, A., and Kuglerová, L.: Are dissolved organic carbon concentrations in riparian groundwater linked to hydrological pathways in the boreal forest?, Hydrol. Earth Syst. Sci., 24, 1709–1720, https://doi.org/10.5194/hess-24-1709-2020, 2020.
Ravichandran, M.: Interactions between mercury and dissolved organic matter – a review, Chemosphere, 55, 319–331, https://doi.org/10.1016/j.chemosphere.2003.11.011, 2004.
Raymond, P. A. and Saiers, J. E.: Event controlled DOC export from forested watersheds, Biogeochemistry, 100, 197–209, https://doi.org/10.1007/s10533-010-9416-7, 2010.
Raymond, P. A., Saiers, J. E., and Sobczak, W. V.: Hydrological and biogeochemical controls on watershed dissolved organic matter transport: pulse-shunt concept, Ecology, 97, 5–16, 2016.
Rinderer, M., van Meerveld, I., Stähli, M., and Seibert, J.: Is groundwater response timing in a pre-alpine catchment controlled more by topography or by rainfall?, Hydrol. Process., 30, 1036–1051, https://doi.org/10.1002/hyp.10634, 2016.
Roulet, N. and Moore, T. R.: Browning the waters, Nature, 283–284, 2006.
Sadiq, R. and Rodriguez, M. J.: Disinfection by-prodcuts (DBPs) in drinking water and predictive models for their occurrence: a review, Sci. Total Environ., 321, 21–46, https://doi.org/10.1016.j.scitotenv.2003.05.001, 2004.
Schwarze, R. and Beudert, B.: Analyse der Hochwassergenese und des Wasserhaushalts eines bewaldeten Einzugsgebietes unter dem Einfluss eines massiven Borkenkäferbefalls, Hydrologie und Wasserbewirtschaftung, 53, 236–249, 2009.
Seybold, E., Gold, A. J., Inamdar, S. P., Adair, C., Bowden, W. B., Vaughan, M. C. H., Pradhanang, S. M., Addy, K., Shanley, J. B., Vermilyea, A., Levia, D. F., Wemple, B. C., and Schroth, A. W.: Influence of land use and hydrologic variability on seasonal dissolved organic carbon and nitrate export: insights from a multi-year regional analysis for the northeastern USA, Biogeochemistry, 146, 31–49, https://doi.org/10.1007/s10533-019-00609-x, 2019.
Strohmeier, S., Knorr, K.-H., Reichert, M., Frei, S., Fleckenstein, J. H., Peiffer, S., and Matzner, E.: Concentrations and fluxes of dissolved organic carbon in runoff from a forested catchment: insights from high frequency measurements, Biogeosciences, 10, 905–916, https://doi.org/10.5194/bg-10-905-2013, 2013.
Tetzlaff, D., Birkel, C., Dick, J., Geris, J., and Soulsby, C.: Storage dynamics in hydropedological units control hillslope connectivity, runoff generation, and the evolution of catchment transit time distributions, Water Resour. Res., 50, 969–985, https://doi.org/10.1002/2013WR014147, 2014.
Thurman, E. M.: Organic Geochemistry of Natural Waters, Martinus Nijhoff/Dr W. Junk Publishers, Dordrecht, the Netherlands, 1985.
Tunaley, C., Tetzlaff, D., Lessels, J., and Soulsby, C.: Linking high-frequency DOC dynamics to the age of connected water sources, Water Resour. Res., 52, 5232–5247, https://doi.org/10.1002/2015WR018419, 2016.
van Verseveld, W. J., McDonnell, J. J., and Lajtha, K.: The role of hillslope hydrology in controlling nutrient loss, J. Hydrol., 367, 177–187, https://doi.org/10.1016/j.jhydrol.2008.11.002, 2009.
Vaughan, M. C. H., Bowden, W. B., Shanley, J. B., Vermilyea, A., Sleeper, R., Gold, A. J., Pradhanang, S. M., Inamdar, S. P., Levia, D. F., Andres, A. S., Birgand, F., and Schroth, A. W.: High-frequency dissolved organic carbon and nitrate measurements reveal differences in storm hysteresis and loading in relation to land cover and seasonality, Water Resour. Res., 53, 5345–5363, https://doi.org/10.1002/2017WR020491, 2017.
Weiler, M. and McDonnell, J. J.: Testing nutrient flushing hypotheses at the hillslope scale: A virtual experiment approach, J. Hydrol., 319, 339–356, https://doi.org/10.1016/j.jhydrol.2005.06.040, 2006.
Wen, H., Perdrial, J., Abbott, B. W., Bernal, S., Dupas, R., Godsey, S. E., Harpold, A., Rizzo, D., Underwood, K., Adler, T., Sterle, G., and Li, L.: Temperature controls production but hydrology regulates export of dissolved organic carbon at the catchment scale, Hydrol. Earth Syst. Sci., 24, 945–966, https://doi.org/10.5194/hess-24-945-2020, 2020.
Werner, B. J., Musolff, A., Lechtenfeld, O. J., de Rooij, G. H., Oosterwoud, M. R., and Fleckenstein, J. H.: High-frequency measurements explain quantity and quality of dissolved organic carbon mobilization in a headwater catchment, Biogeosciences, 16, 4497–4516, https://doi.org/10.5194/bg-16-4497-2019, 2019.
Weyhenmeyer, G. A. and Karlsson, J.: Nonlinear response of dissolved organic carbon concentrations in boreal lakes to increasing temperatures, Limnol. Oceanogr., 54, 2513–2519, https://doi.org/10.4319/lo.2009.54.6_part_2.2513, 2009.
Zarnetske, J. P., Bouda, M., Abbott, B. W., Saiers, J., and Raymond, P. A.: Generality of Hydrologic Transport Limitation of Watershed Organic Carbon Flux Across Ecoregions of the United States, Geophys. Res. Lett., 45, 11702–11711, https://doi.org/10.1029/2018GL080005, 2018.
Zimmer, M. A. and McGlynn, B. L.: Lateral, Vertical, and Longitudinal Source Area Connectivity Drive Runoff and Carbon Export Across Watershed Scales, Water Resour. Res., 54, 1576–1598, https://doi.org/10.1002/2017WR021718, 2018.
Zuecco, G., Penna, D., Borga, M., and van Meerveld, H. J.: A versatile index to characterize hysteresis between hydrological variables at the runoff event timescale, Hydrol. Process., 30, 1449–1466, https://doi.org/10.1002/hyp.10681, 2016.