the Creative Commons Attribution 4.0 License.
the Creative Commons Attribution 4.0 License.
 | 02 Sep 2021
Contribution of moisture sources to precipitation changes in the Three Gorges Reservoir Region
Chenghao Wang
Hui Peng
Shangbin Xiao
Denghua Yan
Precipitation changes in the Three Gorges Reservoir Region (TGRR) play a critical role in the operation and regulation of the Three Gorges Dam (TGD) and the protection of residents and properties. The potential impacts of the TGD on local and regional circulation patterns, especially the precipitation patterns, have received considerable attention since its construction. However, how the moisture transport affects precipitation changes in the TGRR spatially and temporally remains obscure. In this study, we investigate the long-term moisture sources of precipitation and their contributions to precipitation changes over the TGRR using an atmospheric moisture tracking model. Results suggest that although there is seasonal variation, the moisture contributing to the TGRR precipitation primarily originates from the areas southwest of the TGRR dominated by the Indian summer monsoon. In particular, the sources with the highest annual moisture contribution are the southwestern part of the Yangtze River basin and the southeastern tip of the Tibetan Plateau (TP). On average, 41 %, 56 %, and 3 % of the TGRR precipitation originates from ocean, land, and local recycling, respectively. In addition, the decreased precipitation over the TGRR during 1979–2015 is mainly attributed to the significantly decreased moisture contribution from the source regions southwest of the TGRR (especially around the southeastern tip of the TP). Compared to dry years, the higher precipitation in the TGRR during wet years is contributed by the extra moisture from the southwestern source regions that is delivered by the intensified southwesterly monsoon winds.
- Article
(8745 KB) - Full-text XML
- BibTeX
- EndNote


Dams and reservoirs are of particular importance to global human development via water supply, flood control, drought mitigation, and electricity generation. As the world's largest hydropower project to date, the Three Gorges Project has received considerable attention since the construction of the Three Gorges Dam (TGD) in 1993. In particular, extensive studies have evaluated the potential environmental impacts and the local and regional climate changes in the Three Gorges Reservoir Region (TGRR) induced by this project, especially the potential consequences of dramatic land use and land cover change (Morgan et al., 2012; Li et al., 2013; Xu et al., 2013). Located at the eastern edge of the Sichuan Basin between Chongqing municipality and Yichang city in Hubei province, the TGRR covers over 58 000 km2 of the Yangtze River basin (YRB), with the reservoir stretching about 660 km (Li et al., 2013; Fig. 1). The climate of this region is influenced by two major monsoon systems, the East Asian monsoon and Indian summer monsoon, and is characterized by wet summers and dry winters with over 75 % of the precipitation in June–September (Xu et al., 2004; Wei et al., 2012; Wang et al., 2018; Fremme and Sodemann, 2019). The rapid expansion of the water surface due to the reservoir impoundment can potentially alter the vertical profiles of temperature and humidity, as well as the exchange of heat and moisture in the lower atmosphere, leading to changes in precipitation and evaporation patterns (Miller et al., 2005; Hossain et al., 2009; Biemans et al., 2011; Yigzaw et al., 2013; Li et al., 2019b). The accelerating hydrological cycle and increasing frequencies of extreme events caused by global warming in recent decades (IPCC, 2014; Pihl et al., 2019) further amplify the uncertainties of precipitation in this region. A thorough investigation of long-term precipitation changes in the TGRR, in particular their driving mechanisms and the potential local and regional impacts of the dam construction, is therefore imperative.

Figure 1Topography of the Yangtze River basin (YRB; black line), with the cyan boundary denoting the Three Gorges Reservoir Region (TGRR).
Existing studies have shown spatial and temporal changes in precipitation characteristics in the TGRR during recent decades, primarily based on ground observations. For example, Xiao et al. (2010) found a dipole pattern of precipitation changes in the surrounding areas of the Three Gorges Reservoir (TGR) from 1960 to 2005, i.e., increased precipitation in the north but decreased in the south. Another study (1958–2007) revealed the interdecadal changes in the TGRR precipitation, with the wettest period being the early 1980s and a relatively dry period after the 1990s (Zhao et al., 2010). Zhao et al. (2010) also observed significant increases in precipitation intensity over the same 5 decades. On the other hand, the precipitation changes in the TGRR, as induced by the TGD, are mainly investigated through station measurements, satellite data sets, and numerical simulations. For instance, Lü et al. (2018) identified an increasing trend of extreme precipitation during 1959–2013 in the TGRR based on weather station data and the Tropical Rainfall Measuring Mission (TRMM) data set. With the hypothesis of relatively local impacts, they concluded that the TGD has no detectable influence on extreme precipitation in the TGRR. In contrast, Wu et al. (2006) showed enhanced precipitation over the northwestern TGRR but decreased precipitation in the vicinity of the TGD after the water level rose abruptly to 135 m in June 2003, based upon the TRMM data set, the Moderate Resolution Imaging Spectroradiometer (MODIS) land surface temperature, and high-resolution mesoscale simulations. This study also suggested that the climate effect of the TGD is on a regional scale (∼100 km) rather than on a local scale (∼10 km), as found in previous studies. In general, the long-term impact of the TGD on the TGRR precipitation is relatively weak, as suggested by both observational data and numerical simulations (Miller et al., 2005; Li et al., 2017; Lü et al., 2018), and is likely dominated by the interannual (natural) climate variability (Xiao et al., 2010; Li et al., 2017). However, considering the dynamic interplay between local impacts and regional/global climate change, detecting the underlying drivers of rainfall changes in the TGRR based solely on local or regional precipitation data can be very challenging. It is necessary to take into account moisture sources at different spatial scales and local and nonlocal moisture transports that lead to precipitation.
Atmospheric circulations play an essential role in the global and regional hydrological cycle, which transport the moisture evaporated from one location and precipitate it out elsewhere (Trenberth et al., 2011; Gimeno et al., 2012, 2020). In particular, the sources and transports of atmospheric moisture are regulated by climate and synoptic patterns, and their modification reflects the changes in land–atmosphere interactions, atmospheric circulation patterns, and, more broadly, the regional hydrological cycle (van der Ent et al., 2010; Gimeno et al., 2012). Previous studies have suggested that the major source regions of moisture for precipitation over the YRB are the South China Sea, the western Pacific, the Bay of Bengal, the Arabian Sea, South China, and mainland Southeast Asia (Wei et al., 2012; Chen et al., 2013; Wang et al., 2018; Fremme and Sodemann, 2019). A previous study based on a Lagrangian particle dispersion model demonstrated that the interannual variability in the summer precipitation over the YRB is closely related to the moisture supply from the Bay of Bengal and the Arabian Sea (Chen et al., 2013). However, Wei et al. (2012) pointed out that the oceanic contributions are mostly indirect due to the existence of continental recycling. This was later confirmed by Fremme and Sodemann (2019), who estimated the contribution of continental moisture sources to be 58.4 %. In addition, Xu et al. (2004) defined a triangular region as the key region of the moisture transport to the Meiyu rain belt in the YRB, which covers the Bay of Bengal, mainland Southeast Asia, the southeastern Tibetan Plateau (TP), and part of the South China Sea. Nevertheless, these studies have relatively short study periods and are mainly focused on the entire YRB or the mid–lower reaches, with a simplified boundary of the river basin (usually a rectangular box). A comprehensive study that resolves the long-term moisture sources of the precipitation and how these sources have contributed to precipitation changes in the TGRR is hitherto absent.
This study aims to fill these research gaps based on comprehensive analyses for the period 1979–2015. More specifically, the main objectives are as follows: (1) to numerically track the moisture sources of annual and seasonal precipitation over the TGRR, (2) to identify predominant sources that determine the interannual variability in precipitation in this region, and (3) to detect the differences in moisture sources and transport pathways during wet and dry years. On the one hand, this study relies on the long-term numerical moisture tracking, which more directly reveals the dynamics of source regions and transport pathways than existing station-based and model-based analyses of precipitation and dam construction in the TGRR. On the other hand, different from previous moisture tracking studies over much greater regions (e.g., the entire YRB), we focus exclusively on the TGRR, which largely reduces the potential signals and perturbations of surrounding land and water bodies. Results of this study are expected to shed new light on the determinants of hydrological changes over the TGRR under climate change and provide insights into the effective water resource management, policy formulation, and disaster (e.g., flood and landslide) prevention and mitigation in the TGRR.
2.1 Numerical atmospheric moisture tracking
In this study, we used an offline (a posteriori) Eulerian numerical atmospheric moisture tracking model, the Water Accounting Model-2layers (WAM-2layers; van der Ent et al., 2010; van der Ent, 2014), to simulate the moisture transport and the source regions of moisture for the TGRR precipitation. Previous tests have suggested that the moisture tracking and precipitation patterns simulated by WAM-2layers are nearly identical to those by a highly advanced online tracking model but with a significant improvement in the computational speed (van der Ent et al., 2013). In addition, different from some Lagrangian models such as the FLEXible PARTicle (FLEXPART) dispersion model and the Hybrid Single-Particle Lagrangian Integrated Trajectory (HYSPLIT) model (Stohl et al., 2005; Stein et al., 2016), WAM-2layers diagnoses precipitation and evaporation separately (van der Ent et al., 2010). The WAM-2layers has been extensively used for regional and global moisture tracking in existing studies (van der Ent and Savenije, 2013; Keys et al., 2014; Zemp et al., 2014; Duerinck et al., 2016; Zhao et al., 2016; van der Ent and Tuinenburg, 2017; Zhang et al., 2017; Li et al., 2019a).
The governing equation of WAM-2layers is the mass balance solved for the two well-chosen layers (top and bottom). For example, the bottom layer equation is as follows:
where the subscript g denotes the tagged atmospheric moisture (all possible phases of water; van der Ent, 2014), Sg,bottom is moisture storage in the bottom layer, t is time, u is the wind component in zonal (x) direction, v is the wind component in meridional (y) direction, Eg is the evaporation entering the bottom layer, Pg is the precipitation removed from the bottom layer, ξg is the residual term, and FV,g is the vertical moisture exchange between the two layers. Note that the evaporation only occurs in the bottom layer.
In the tracking process, we assume that the precipitation is immediately removed from the storage of each layer and is well mixed following van der Ent et al. (2010). The model assumes that the vertical exchange to be a closure term in the equation, but the balance cannot always be fully closed due to the existence of residual ξg. Therefore, the closure is defined by a ratio of residuals between the two layers, which is proportional to the moisture content in each layer, i.e., . The subscripts denote the two layers in the model. In this context, FV,g can be described as follows:
where Sg is the total atmospheric storage, and and are the residuals before vertical exchange is considered. Note that the use of two layers has been proved to adequately capture the division of the sheared wind systems in the atmosphere (van der Ent et al., 2013).
The accurate simulation of moisture transport for the TGRR precipitation requires sufficiently high resolutions (Goessling and Reick, 2013; van der Ent et al., 2013). To increase numerical stability and reduce computational cost, we used a spatial resolution of 1∘ × 1∘ with a time step of 0.25 h (temporal resolution) in all runs. A total of 17 vertical layers from the surface to the top of the atmosphere were chosen from the forcing reanalysis product. Following a global-scale trial test (van der Ent et al., 2013), the layer around 813 hPa (the eighth layer in our selected ERA-Interim data set) was set as the vertical separation between the bottom and top layers with a standard surface pressure. A 30 d period was used to spin-up the model in the tracking process, which ensures that the vast majority of the tagged moisture (∼95 %) falls back to the ground surface (van der Ent et al., 2010; Zhang et al., 2017). Based on our preliminary tests, we selected a tracking domain (20∘ S–60∘ N and 0–140∘ E) that covers nearly all potential source regions of the TGRR precipitation. Note that the spatial extent of all following maps is smaller than the tracking domain to show the details of moisture sources.
2.2 Data sources
The ERA-Interim reanalysis data set was initiated by the European Centre for Medium-Range Weather Forecasts (ECMWF) in 2006 (Dee et al., 2011). This global data set covers a period from 1979 with a spatial resolution of 0.75∘ × 0.75∘. The data set from 1979 to 2015 was used to drive the WAM-2layers. The forcing data of the WAM-2layers are 6 h specific humidity (17 vertical layers) and 6 h wind fields (17 vertical layers), 6 h surface pressure, 3 h precipitation, 3 h evaporation, 6 h total column moisture, and 6 h vertically integrated moisture fluxes. For comparison, we also used the Japanese 55-year Reanalysis data (JRA-55) developed by the Japan Meteorological Agency (Kobayashi et al., 2015) and the Modern-Era Retrospective analysis for Research and Applications version 2 data (MERRA-2) from the National Aeronautics and Space Administration (NASA; Gelaro et al., 2017) to track the moisture using the WAM-2layers. In these three sets of simulations (based on ERA-Interim, JRA-55, and MERRA-2), all variables were resampled to 0.25 h from their original temporal resolutions and were bilinearly interpolated to 1∘ × 1∘ grids for consistency.
There are two sources of precipitation data used in this study. The first one is a high-quality precipitation data set interpolated from 2400 meteorological stations over China (Zhao et al., 2014). This data set was initiated by the China Meteorological Administration (CMA). It uses a thin plate spline interpolation method, with a three-dimensional scheme, in which the digital elevation is also introduced. This data set is 0.5∘ × 0.5∘ gridded, with a coverage period from 1961 to present, and it can be downloaded directly from the China Meteorological Data Service Center (CMDC). For comparison, we also retrieved remotely sensed precipitation data from the TRMM Multi-satellite Precipitation Analysis (TMPA; Huffman et al., 2007). Note that the time span of the retrieved TMPA is 1998–2015.
The spatial distribution of linear trends in annual precipitation estimated from CMA observations over the entire YRB is shown in Fig. 2a. It is clear that, compared to other parts of the YRB, the TGRR is dominated by significant decreasing annual precipitation (p < 0.05, based on a two-sided t test) during 1979–2015. The decreasing trend over this region is further illustrated with the time series of annual precipitation in Fig. 2b. The linear trends estimated using ground observations (CMA), a reanalysis product (ERA-Interim), and satellite observation (TMPA) are, in general, consistent, with −4.08 mm per year (1979–2015; p < 0.05), −6.24 mm per year (1979–2015; p < 0.05), and −4.85 mm per year (1998–2015), respectively. Based on moisture tracking, we then investigate the potential mechanisms that drive the decreasing trend of the TGRR precipitation from the following three aspects: moisture sources (Sect. 3.1), the trends of their contributions to the TGRR precipitation (Sect. 3.2), and moisture contributions during wet and dry years (Sect. 3.3).

Figure 2Spatial and temporal change in annual precipitation at the Yangtze River basin (YRB) and the Three Gorges Reservoir Region (TGRR). (a) Spatial distribution of linear trends in annual precipitation over the YRB during 1979–2015, based on CMA observations, and (b) time series of the standardized annual precipitation (Z scores) over the TGRR based on CMA (1979–2015), ERA-Interim (1979–2015), and TMPA (1998–2015). Stippling in panel (a) indicates regions with statistically significant trends (p < 0.05). Dashed lines in panel (b) are linear regression fits to the data. The corresponding slopes are also shown, with an asterisk (*) indicating statistically significant trends (p < 0.05).
3.1 Moisture sources of annual and seasonal precipitation in the Three Gorges Reservoir Region
Figure 3 shows the contribution of the moisture (millimeters) from different source regions to the annual precipitation in the TGRR averaged during 1979–2015, overlain with the patterns of vertically integrated moisture fluxes. As simulated in WAM-2layers, moisture evaporated from the shaded source regions is carried by circulations and eventually contributes to the annual precipitation in the TGRR. Moisture sources with the highest contribution (> 30 mm per year) are mainly distributed in the regions southwest of the TGRR, primarily because relatively little precipitation is produced during the transport. Mainly, along the plentiful moisture transport pathway from the southwest, the major source regions include South China, the southeastern TP, mainland Southeast Asia, part of the South China Sea, the Bay of Bengal, part of the Indian subcontinent, and the Arabian Sea. Although oceans evaporate more water than the land, moisture from oceans is largely lost by precipitation in the transport over the land. As a result, the contribution of the oceanic moisture sources to the TGRR precipitation is relatively low (< 6 mm per year). Compared to that of southwestern source regions, the contribution of southeastern source regions (e.g., East China and the East China Sea) is more limited. This difference may largely result from the interaction between the Indian monsoon and the East Asian monsoon systems, while the Indian monsoon tends to dominate the moisture transport toward the TGRR at the annual scale.
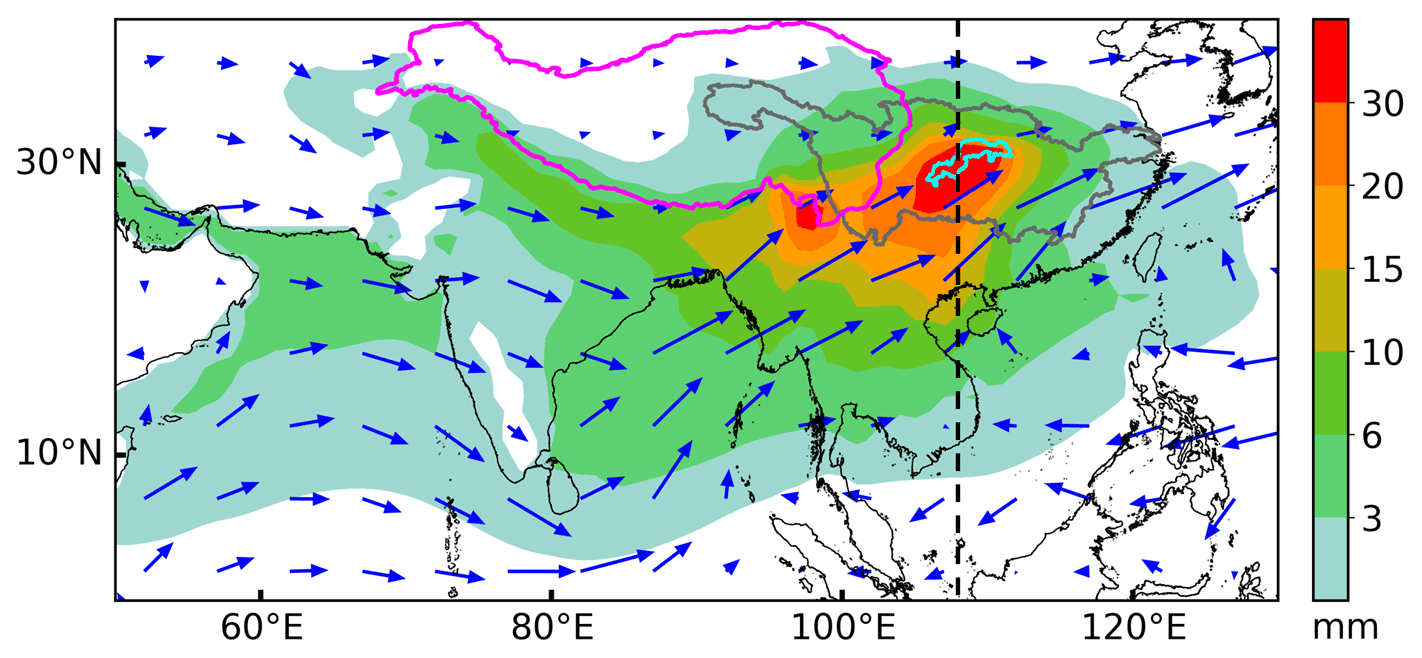
Figure 3Contribution of the moisture (millimeters) from different source regions to the annual precipitation in the Three Gorges Reservoir Region (TGRR), averaged over 1979–2015 and overlain with the patterns of vertically integrated moisture fluxes (blue arrows). The purple line denotes the boundary of the Tibetan Plateau (TP), and the gray line denotes the boundary of the Yangtze River basin (YRB). The dashed black line shows 108∘ E that divides the domain into the western part (WP) and the eastern part (EP).
The seasonal variations in moisture sources contributing to the TGRR precipitation are illustrated in Fig. 4. In spring (March, April, and May), the moisture is mainly from regions west of the TGRR. In particular, the southeastern tip of the TP is one of the regions with the largest moisture contributions. The source regions further stretch west along the southern edge of the TP and even cover part of the northern Arabian Sea. The dominant circulation system bringing moisture to the TGRR in spring is the southern branch of the middle latitude westerlies, which forms when westerlies hit the TP (a physical barrier). In summer (June, July, and August), when the Indian monsoon and East Asian monsoon start and the land gradually warms and wets, the major moisture source regions shift southwards, spanning across the entire Bay of Bengal and part of the Arabian Sea. In addition, the Indian summer monsoon (rather than the East Asian monsoon) dominates the transport of oceanic moisture to the TGRR, as suggested by the strong moisture fluxes in Fig. 4. In autumn (September, October, and November), the moisture delivered from the areas southwest of the TGRR is remarkably reduced with the withdrawal of the Indian monsoon, and the moisture contribution from oceans largely decreases when compared to summer. Meanwhile, the moisture from regions southeast of the TGRR slightly increases, owing to the weakened southwesterly wind. In winter (December, January, and February), the source regions largely shrink and only cover a small portion of the domain (mainly around the southeastern edge of the TP). This pattern is generally consistent with that in spring (dominated by westerlies), although with much weaker moisture fluxes and smaller source regions. In general, the seasonal variations in source regions for the TGRR precipitation are influenced by the interactions among the Indian monsoon system, East Asian monsoon system, and middle latitude westerlies, in which the regions southwest of the TGRR (as dominated by the Indian monsoon) play a leading role.
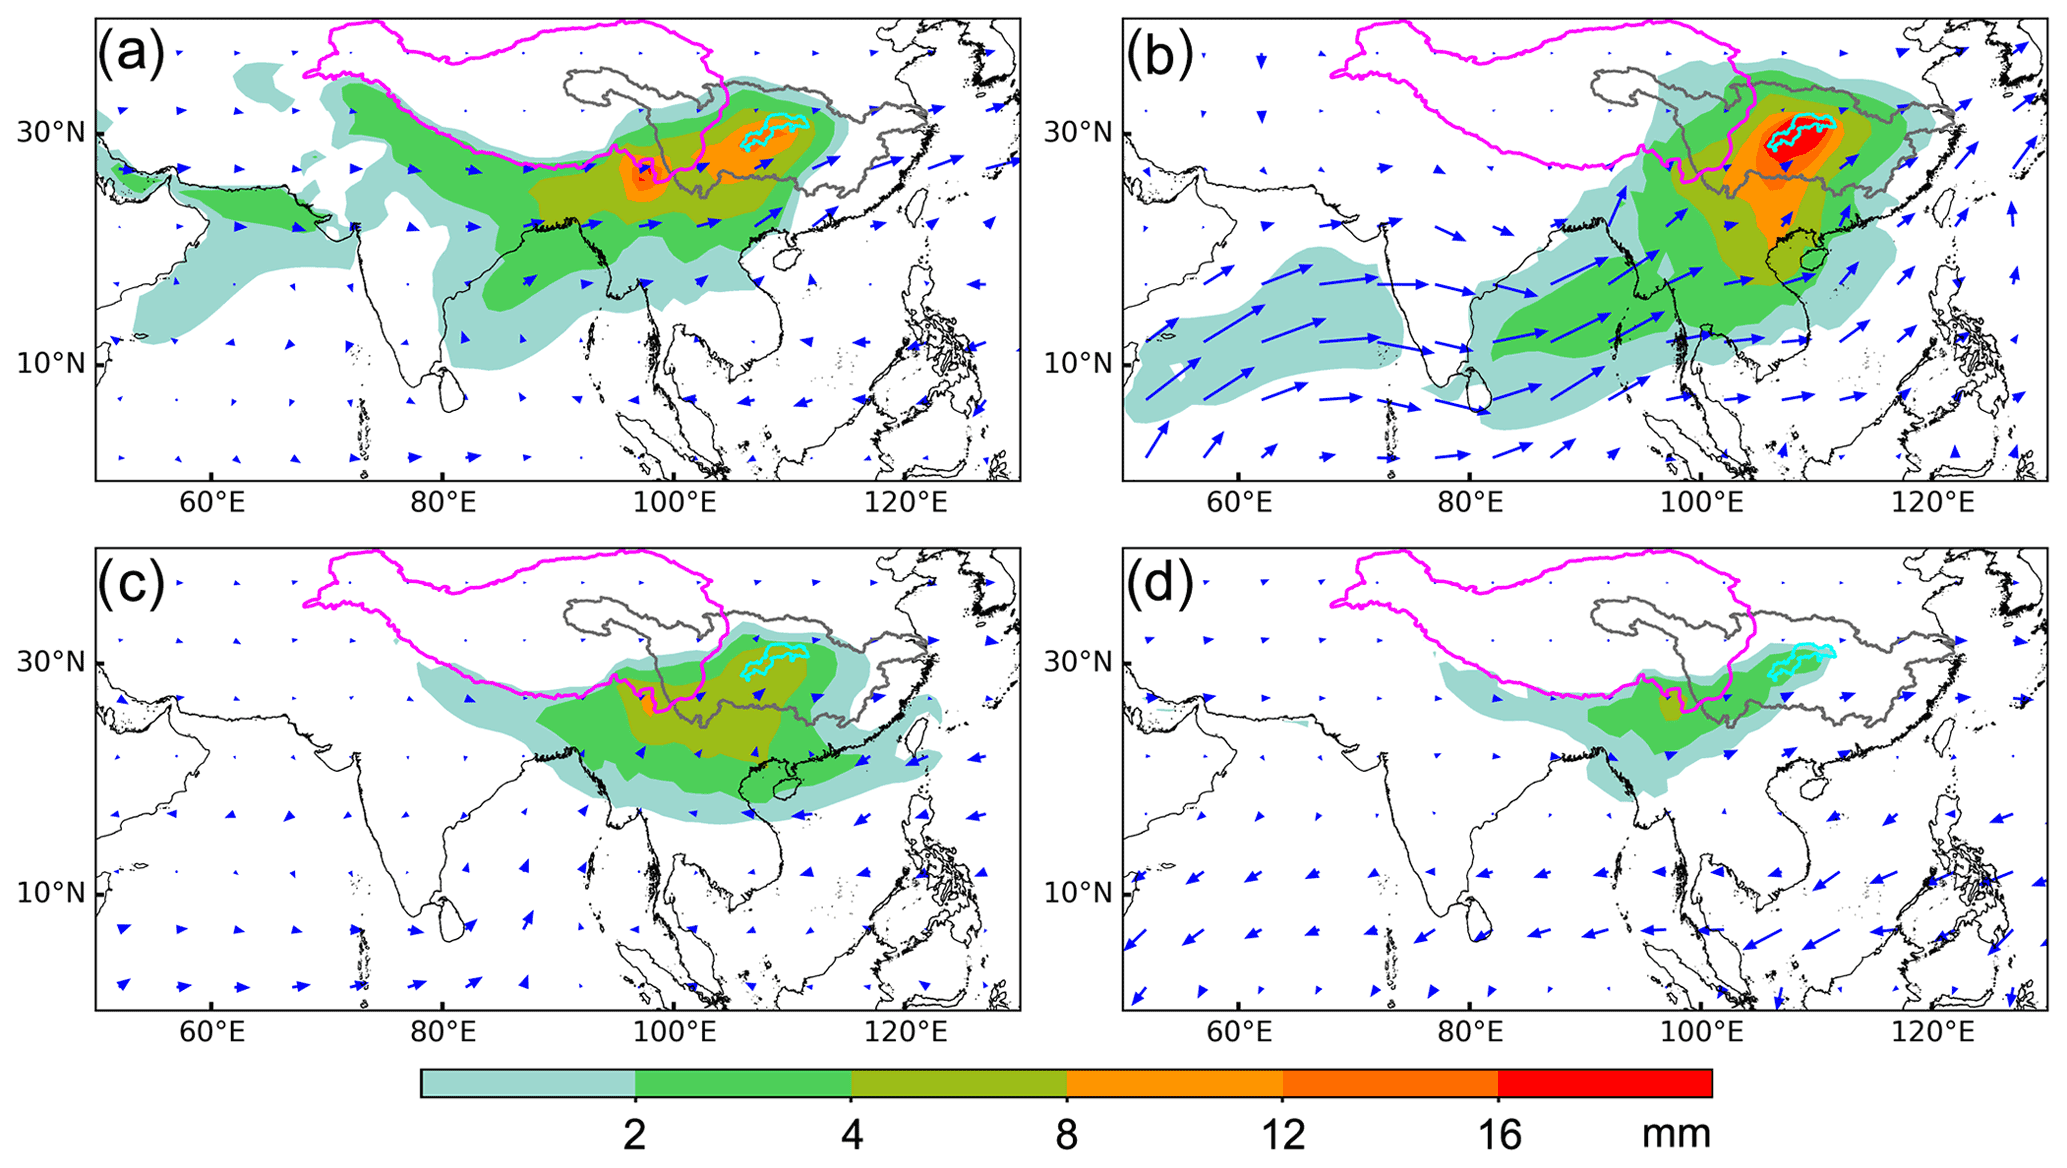
Figure 4Same as Fig. 3 but for seasonal precipitation. (a) Spring, (b) summer, (c) autumn, and (d) winter seasons averaged over 1979–2015.
We then split the domain into two parts using 108∘ E (roughly across the center of the TGRR; see the dashed line in Fig. 3), i.e., the western part (WP) and the eastern part (EP) to further quantify the moisture contribution of different regions. In general, such a division can roughly separate the contributions of two monsoon systems (Xu et al., 2004; Zhou and Yu, 2005; Wei et al., 2012; Li et al., 2019b). The WP mainly represents source regions controlled by the Indian monsoon (in summer and autumn) and the westerlies (in spring and winter), whereas the EP contains source regions influenced by the East Asian monsoon. The contribution of WP and EP to the monthly precipitation in the TGRR is shown in Fig. 5a. On average, about 80 % of the total moisture is from the WP (cf. ∼20 % from the EP). From December to May, the moisture transported to the TGRR is dominated by the westerlies, with relatively stable contributions from the two parts (89 % from the WP and 11 % from the EP). From May to September, with the onset of the Indian monsoon and the East Asian monsoon, the moisture from the WP gradually decreases as induced by the interaction of the two monsoon systems, and it reaches the annual minimum in September (61 %). It is noteworthy that the moisture contribution of WP dominates the TGRR precipitation all year round.
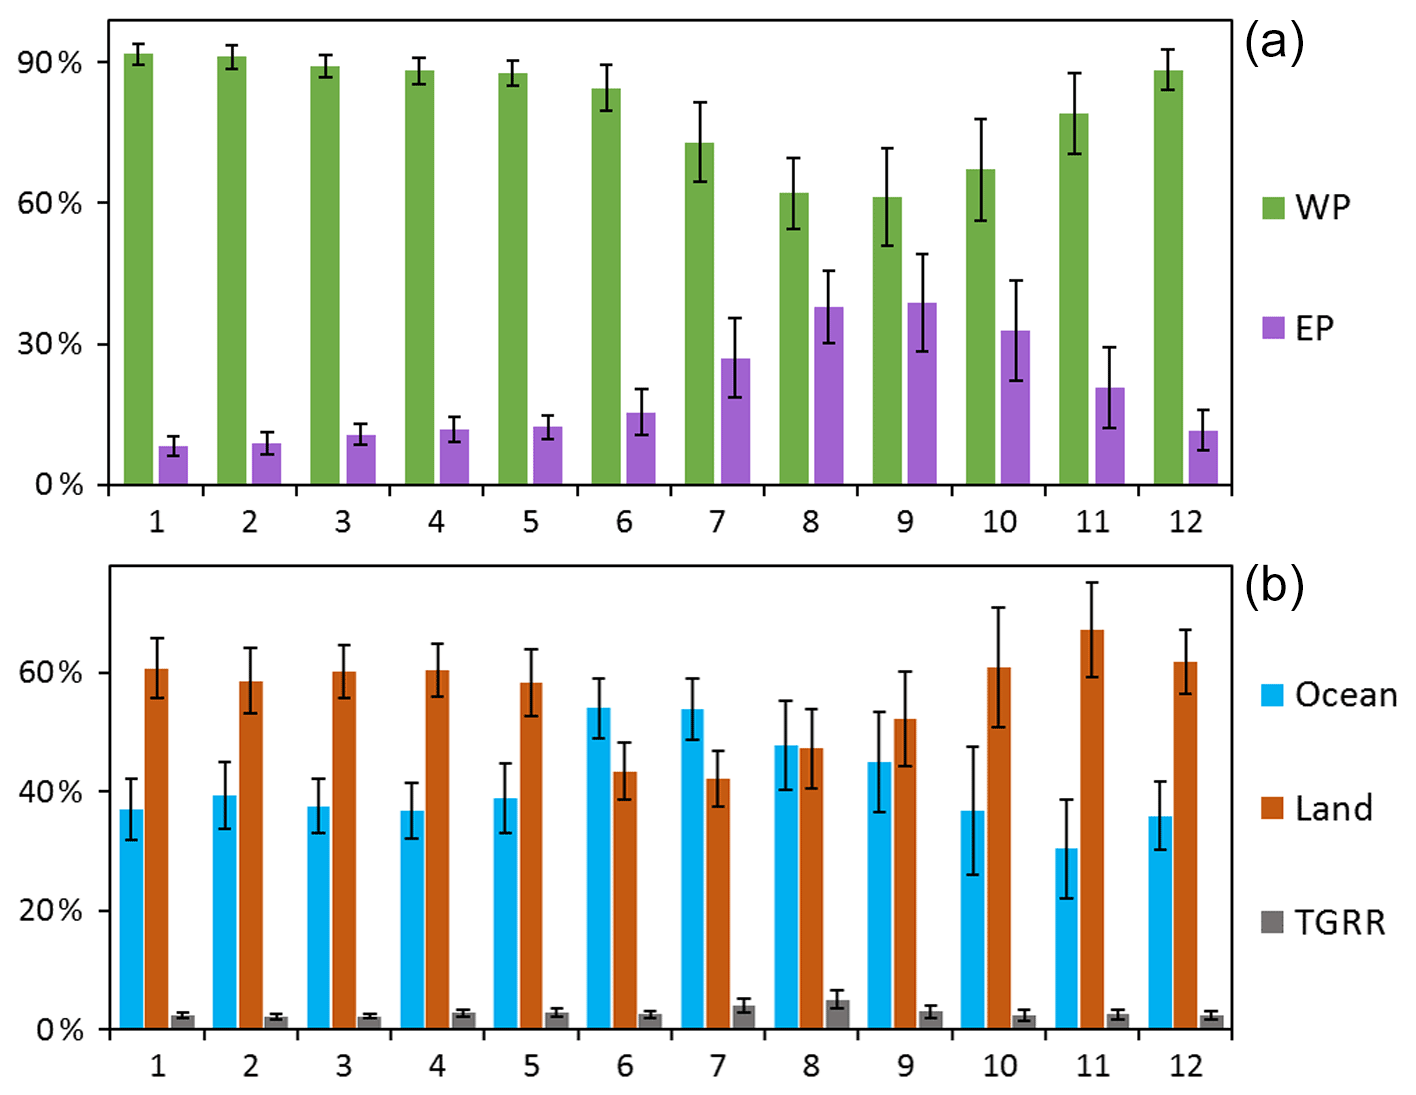
Figure 5Contribution of different sources (percent) to the monthly precipitation in the Three Gorges Reservoir Region (TGRR) averaged over 1979–2015. (a) The western part (WP) and the eastern part (EP) of the domain and (b) ocean, land, and TGRR (local recycling). Error bars represent 1 standard deviation of the interannual variations.
We then estimate the moisture contributions of the ocean (ocean sources), land (land sources, excluding the TGRR), and local recycling (TGRR sources) to the monthly precipitation in the TGRR (Fig. 5b). On average, 41 % of the moisture is from ocean sources, 56 % from land sources, and only 3 % from local recycling (recycling within the target region). Similar to the results for WP and EP, the contributions of ocean sources, land sources, and local recycling are stable from December to May (38 %, 60 %, and 2 %, respectively), during which the land sources are predominant. However, during the summer monsoon season, oceans become the dominant sources, with the moisture contribution reaching its maximum in June (54 %). Meanwhile, the contribution of land sources drops to its minimum (43 % in July). From July to November, the moisture contribution of ocean (land) sources gradually decreases (increases) as the monsoon systems recede. As a result, the terrestrial contribution reaches its maximum (67 %) in November (cf. oceanic contribution is 30 %). Different from that of land and ocean sources, the change in local recycling is dominated by the variations in the water surface, soil moisture, and local circulations within the target region. In particular, the contribution of local recycling peaks in August (5 %), even though the maximum monthly precipitation occurs in July. A similar phenomenon has been reported by Fremme and Sodemann (2019) in a relatively greater region (the entire YRB), mainly resulting from an interplay among multiple factors such as weakened winds, high soil moisture, dense vegetation cover, and high evaporation. Overall, land sources dominate the moisture contributing to the TGRR precipitation, except during the summer monsoon season.
3.2 Temporal trends of moisture sources of precipitation in the Three Gorges Reservoir Region
In this section, we investigate the impacts of spatiotemporal changes in moisture source contributions on the decreasing precipitation in the TGRR (see Fig. 2). Figure 6 shows the trends in the contribution of the moisture transported from different regions to the annual precipitation in the TGRR estimated with the simple linear regression model (stippling represents regions with statistically significant trends; p < 0.05). It is clear that the WP is dominated by decreasing (negative) trends of moisture contributions. The highest decreasing trends are observed in the southeastern tip of the TP (> 1.0 mm per decade; p < 0.05). In addition, the negative trends of moisture contribution are statistically significant (p < 0.05) along the southern slope of the TP, over the northwestern Bay of Bengal, and over (almost) the entire Arabian Sea. In general, source regions with decreased trends of moisture contribution are mainly dominated by the Indian monsoon and the southern branch of middle latitude westerlies. In contrast, regions with increasing (positive) trends of moisture contribution are relatively small in size, primarily scattered in the regions south and east of the TGRR. A strip with the greatest increasing trends (> 0.4 mm per decade) appears between 108 and 114∘ E. Nevertheless, the vast majority of these increasing trends are statistically insignificant (p > 0.05). It is interesting that the major source regions with positive and negative trends are separated by a north–south line, which is roughly in line with the 108∘ E used for WP and EP (see Fig. 3). This distinct division may reflect the interaction of different circulation systems that transport moisture to the TGRR in different seasons (Xu et al., 2004; Wei et al., 2012).
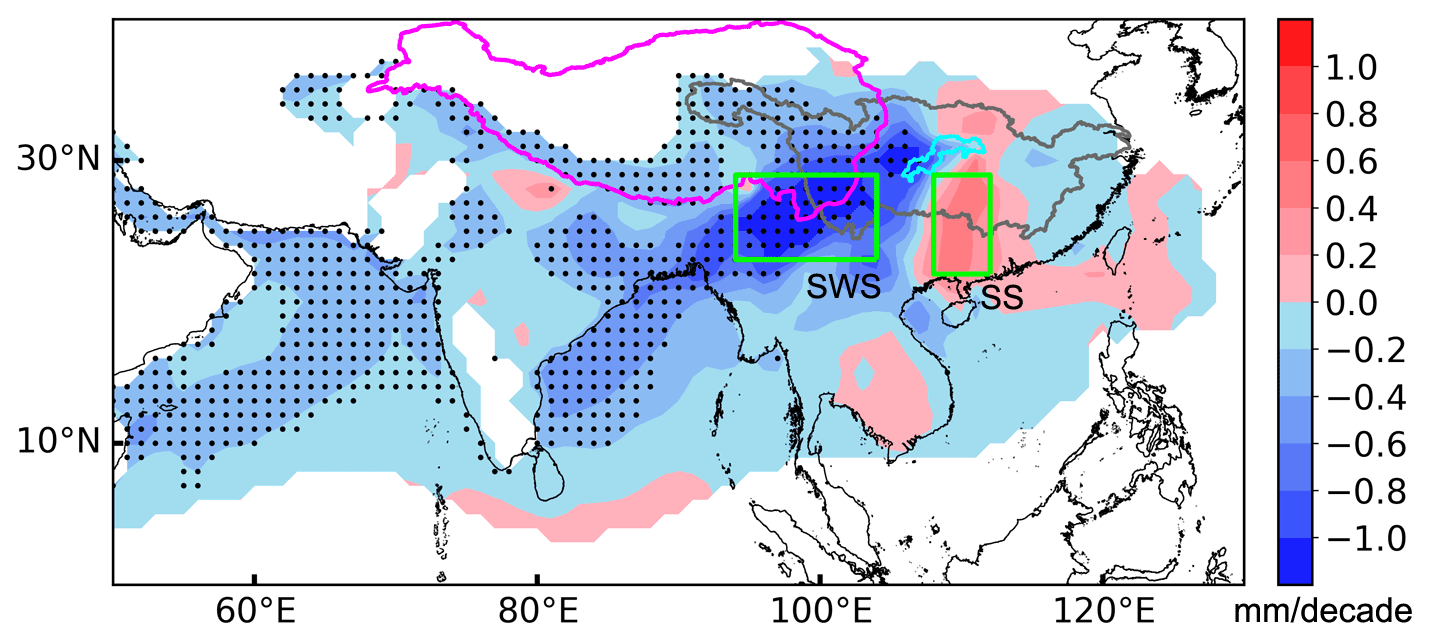
Figure 6Trends in the contribution of the moisture (millimeters per decade) from different source regions to the annual precipitation in the Three Gorges Reservoir Region (TGRR) averaged over 1979–2015. Stippling indicates regions with statistically significant trends (p < 0.05). Green boxes represent the southwestern source (SWS) and southern source (SS) regions.
We also analyze the seasonal variations in the moisture contribution from different source regions, with the results summarized in Fig. 7. In spring, source regions with significant decreasing trends of moisture contribution form a southwest–northeast band extending from the southeastern TP to the northern Bay of Bengal. The spatial distribution of the trends in moisture contribution during summer largely resembles that of the annual precipitation (Fig. 6). With the onset of the monsoon season, the source regions with negative trends shift southwards (cf. Fig. 4b), which cover nearly the entire WP land, the northwestern Bay of Bengal, and part of the Arabian Sea. Meanwhile, a strip with insignificant increasing trends of moisture contribution is observed to the east of 108∘ E. Among all source regions in autumn, the regions with significant negative trends are distributed around the southeastern tip of the TP, while those with increasing trends are seen in regions south and southeast of the TGRR. During winter, only source regions southwest of the TGRR show significant decreasing trends of moisture contribution, which is much weaker than in the other three seasons. The seasonal analyses reveal that although there are seasonal variations, the decreased precipitation in the TGRR during 1979–2015 is mainly attributable to the decreased contribution of moisture from regions southwest of the target region, especially around the southeastern tip of the TP.
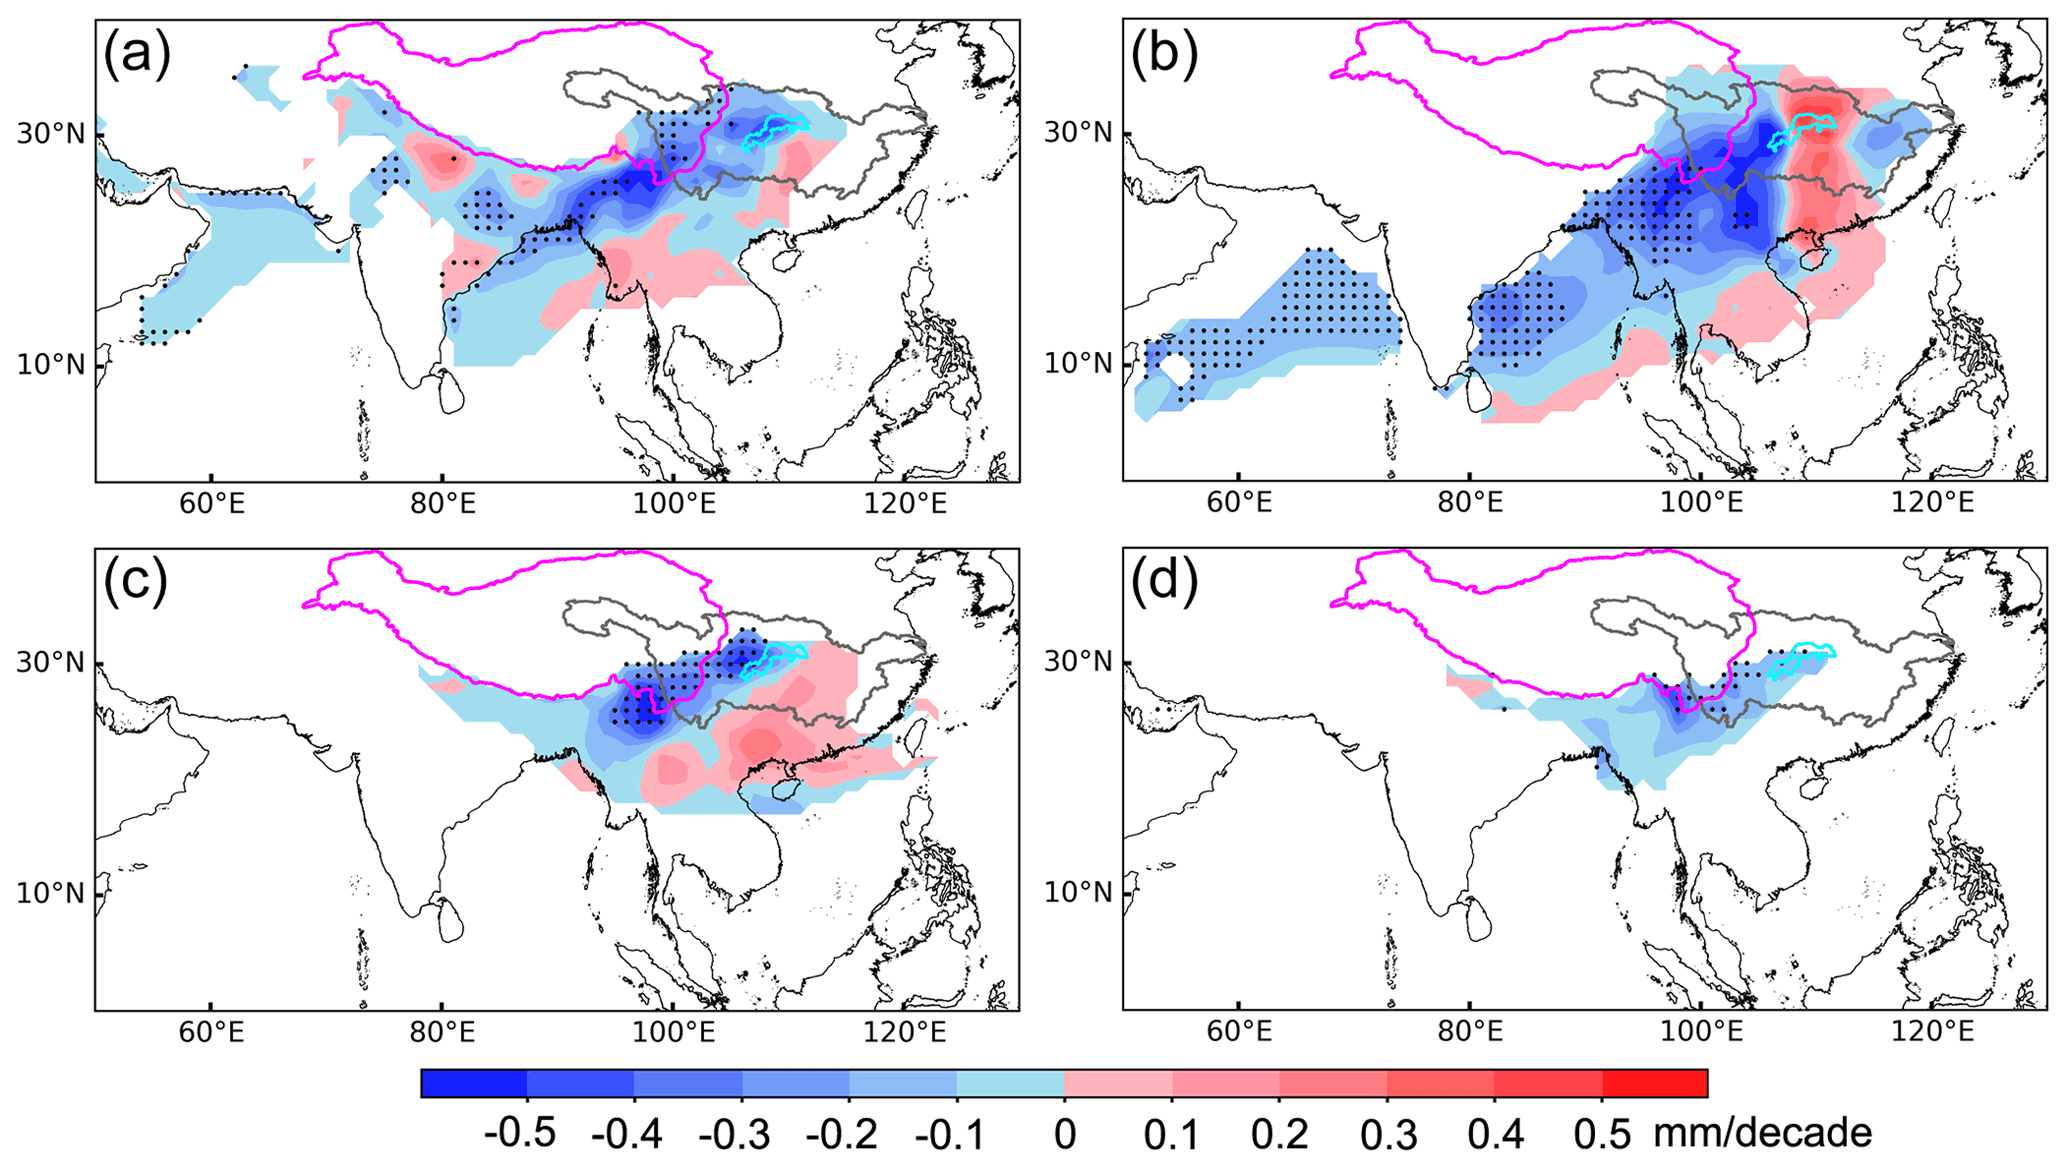
Figure 7Same as Fig. 6 but for seasonal precipitation. (a) Spring, (b) summer, (c) autumn, and (d) winter seasons averaged over 1979–2015.
We then define the following two key source regions based on the trends shown in Fig. 6: the southwestern source (SWS; 23 to 29∘ N and 94 to 104∘ E) and southern source (SS; 22 to 29∘ N and 108 to 112∘ E) regions. Figure 8 shows the interannual variations in the contributions of SWS, SS, WP, and EP to changes in TGRR annual precipitation (moisture averaged over the TGRR). For comparison purposes, the corresponding time series of local recycling (percent) and TGRR precipitation (millimeters) are included. Note that both key regions (SWS and SS) experienced substantial changes (with the strongest trends; see Fig. 6) in moisture contribution and are located along two major pathways that transport moisture to the YRB (from the northern Indian Ocean and from the northwestern Pacific Ocean; yellow arrows in Fig. 9) as identified in previous studies (Xu et al., 2004, 2019) and Fig. 3. Consistent with results in Fig. 6, the decreasing trends of annual moisture contribution from the WP (−60.33 mm per decade; p < 0.05) and SWS region (−9.16 mm per decade; p < 0.05) are much stronger than the insignificant weakening trend in the EP (−2.37 mm per decade; p > 0.05) and the increasing trend in the SS region (1.45 mm per decade; p > 0.05), which dominate the precipitation decrease in the target region. The contribution of local recycling shows an increasing trend (0.07 % per decade; p > 0.05), indicating that moisture contribution from external sources on the annual scale is decreasing over time. This enhanced local recycling is in line with the increasing trend of reference evapotranspiration as observed in Lv et al. (2016) in 1982–2013. Seasonally for the two key source regions (Table 1), decreasing moisture contribution from the SWS region is observed in all seasons, and the decreasing trend in summer is stronger than the other three seasons, indicating the potential weakening contribution influenced by the Indian monsoon. We also evaluate the linear relationship between annual TGRR precipitation and moisture contributions of different source areas using the Pearson correlation coefficient (r). The r values for moisture contributions of WP, EP, SWS, SS, and local recycling are 0.69 (p < 0.05), 0.34 (p < 0.05), 0.68 (p < 0.05), 0.28 (p > 0.05), and −0.61 (p < 0.05), respectively. This suggests that the fluctuation of annual precipitation in the TGRR is more consistent with the interannual variations in moisture contribution from WP and SWS regions than from EP and SS regions. Meanwhile, the high (low) annual precipitation in the TGRR is often accompanied by a low (high) contribution from the local recycling (r < 0).
Table 1Annual and seasonal trends of precipitation over the TGRR and moisture contribution from SWS, SS, and local recycling during 1979–2015.

Note: the asterisk (*) represents statistically significant trends (p < 0.05).
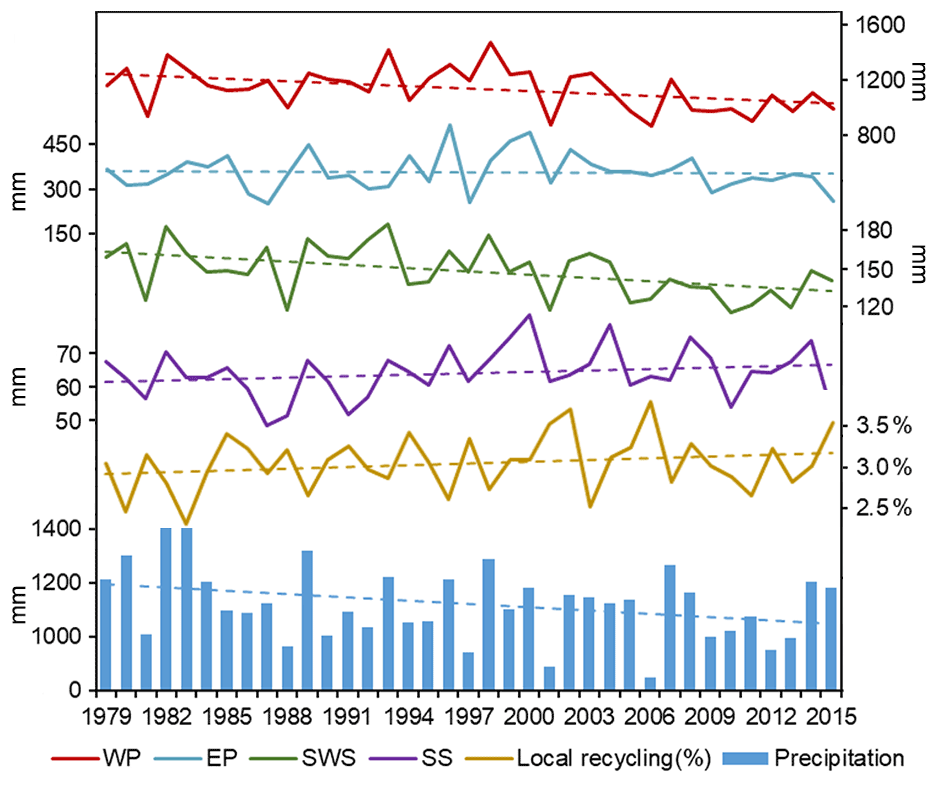
Figure 8Temporal change in moisture (millimeters) from the western part (WP), eastern part (EP), southwestern source (SWS), and southern source (SS) regions (see spatial extents in Figs. 3 and 6) and the local recycling (percent) to the annual precipitation (millimeters) in the Three Gorges Reservoir Region (TGRR). Dashed lines are linear regression fits to the data.
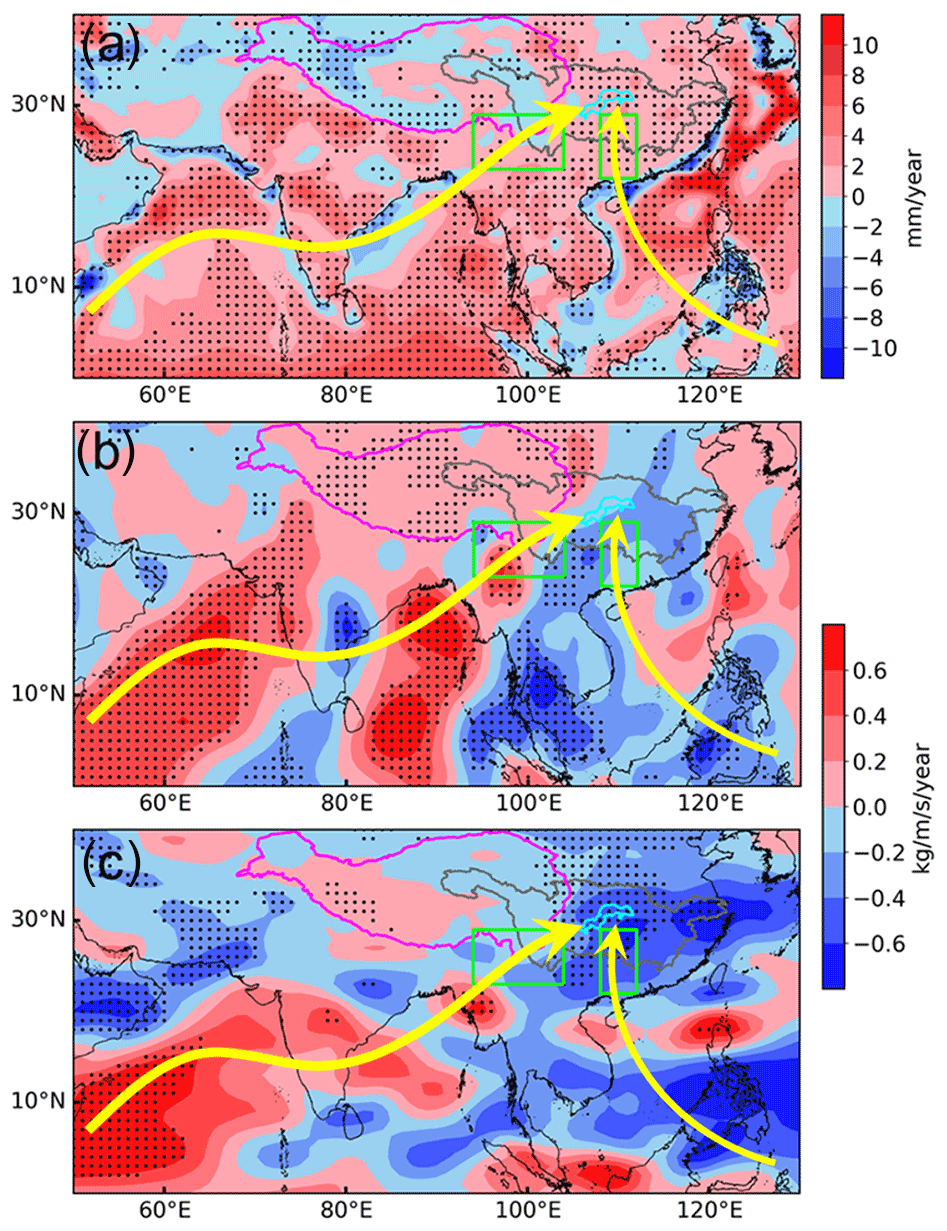
Figure 9Trends of (a) evaporation, (b) vertically integrated moisture flux in the meridional direction (positive northward), and (c) vertically integrated moisture flux in the zonal direction (positive eastward), based on ERA-Interim during 1979–2015. Arrows in yellow show two major pathways of moisture transport toward the target region.
The dominant role that the weakening contribution of WP (and the SWS region) plays in TGRR precipitation decrease is further illustrated by the changing evaporation and vertically integrated moisture flux, as shown in Fig. 9. The vast majority of all possible source regions experienced increased evaporation during the study period (especially SWS and SS), despite a small portion of the SWS region with statistically insignificant decreased evaporation (Fig. 9a). This mostly enhanced evaporation is therefore unlikely the major cause of decreased precipitation in the TGRR. We then turn to changes in vertically integrated moisture fluxes in the two major moisture transport pathways (yellow arrows in Fig. 9). For the southwest pathway (from the northern Indian Ocean), northward and eastward vertically integrated moisture fluxes, in general, enhance along the pathway before reaching the SWS region. However, the further transport of moisture toward the TGRR is largely dampened by the significantly decreased northward and eastward moisture fluxes over the eastern part of the SWS region, contributing to the precipitation decrease in the TGRR. In contrast, largely decreased eastward moisture flux over the northwestern Pacific Ocean and southern China indicates an increased westward moisture contribution to the target region in the southeast pathway (from the northwestern Pacific Ocean), although this enhancement is slightly offset by the insignificant decreased northward moisture flux along the pathway (especially over the SS region). It is noteworthy that the changing contributions observed here can be partly influenced by the moisture tracking model used in this study, but further analyses with different forcing data sets do confirm our findings (see Sect. 4.1).
3.3 Contribution of moisture sources during wet and dry years
The anomalies in moisture contributions during some years may suggest changes in the moisture transport during some extreme events, such as floods and droughts. In this section, we compare the contributions of moisture sources during wet and dry years. We select three wet years (1989, 1998, and 2007) and three dry years (1997, 2001, and 2006) as the representative years from the annual precipitation time series (based on CMA observations; Fig. 2b). The seasonal variations in the TGRR precipitation (millimeters) in the representative wet and dry years are shown in Fig. 10a. It is clear that the rainfall difference between these two types is mainly in April–September, with the largest difference in summer.
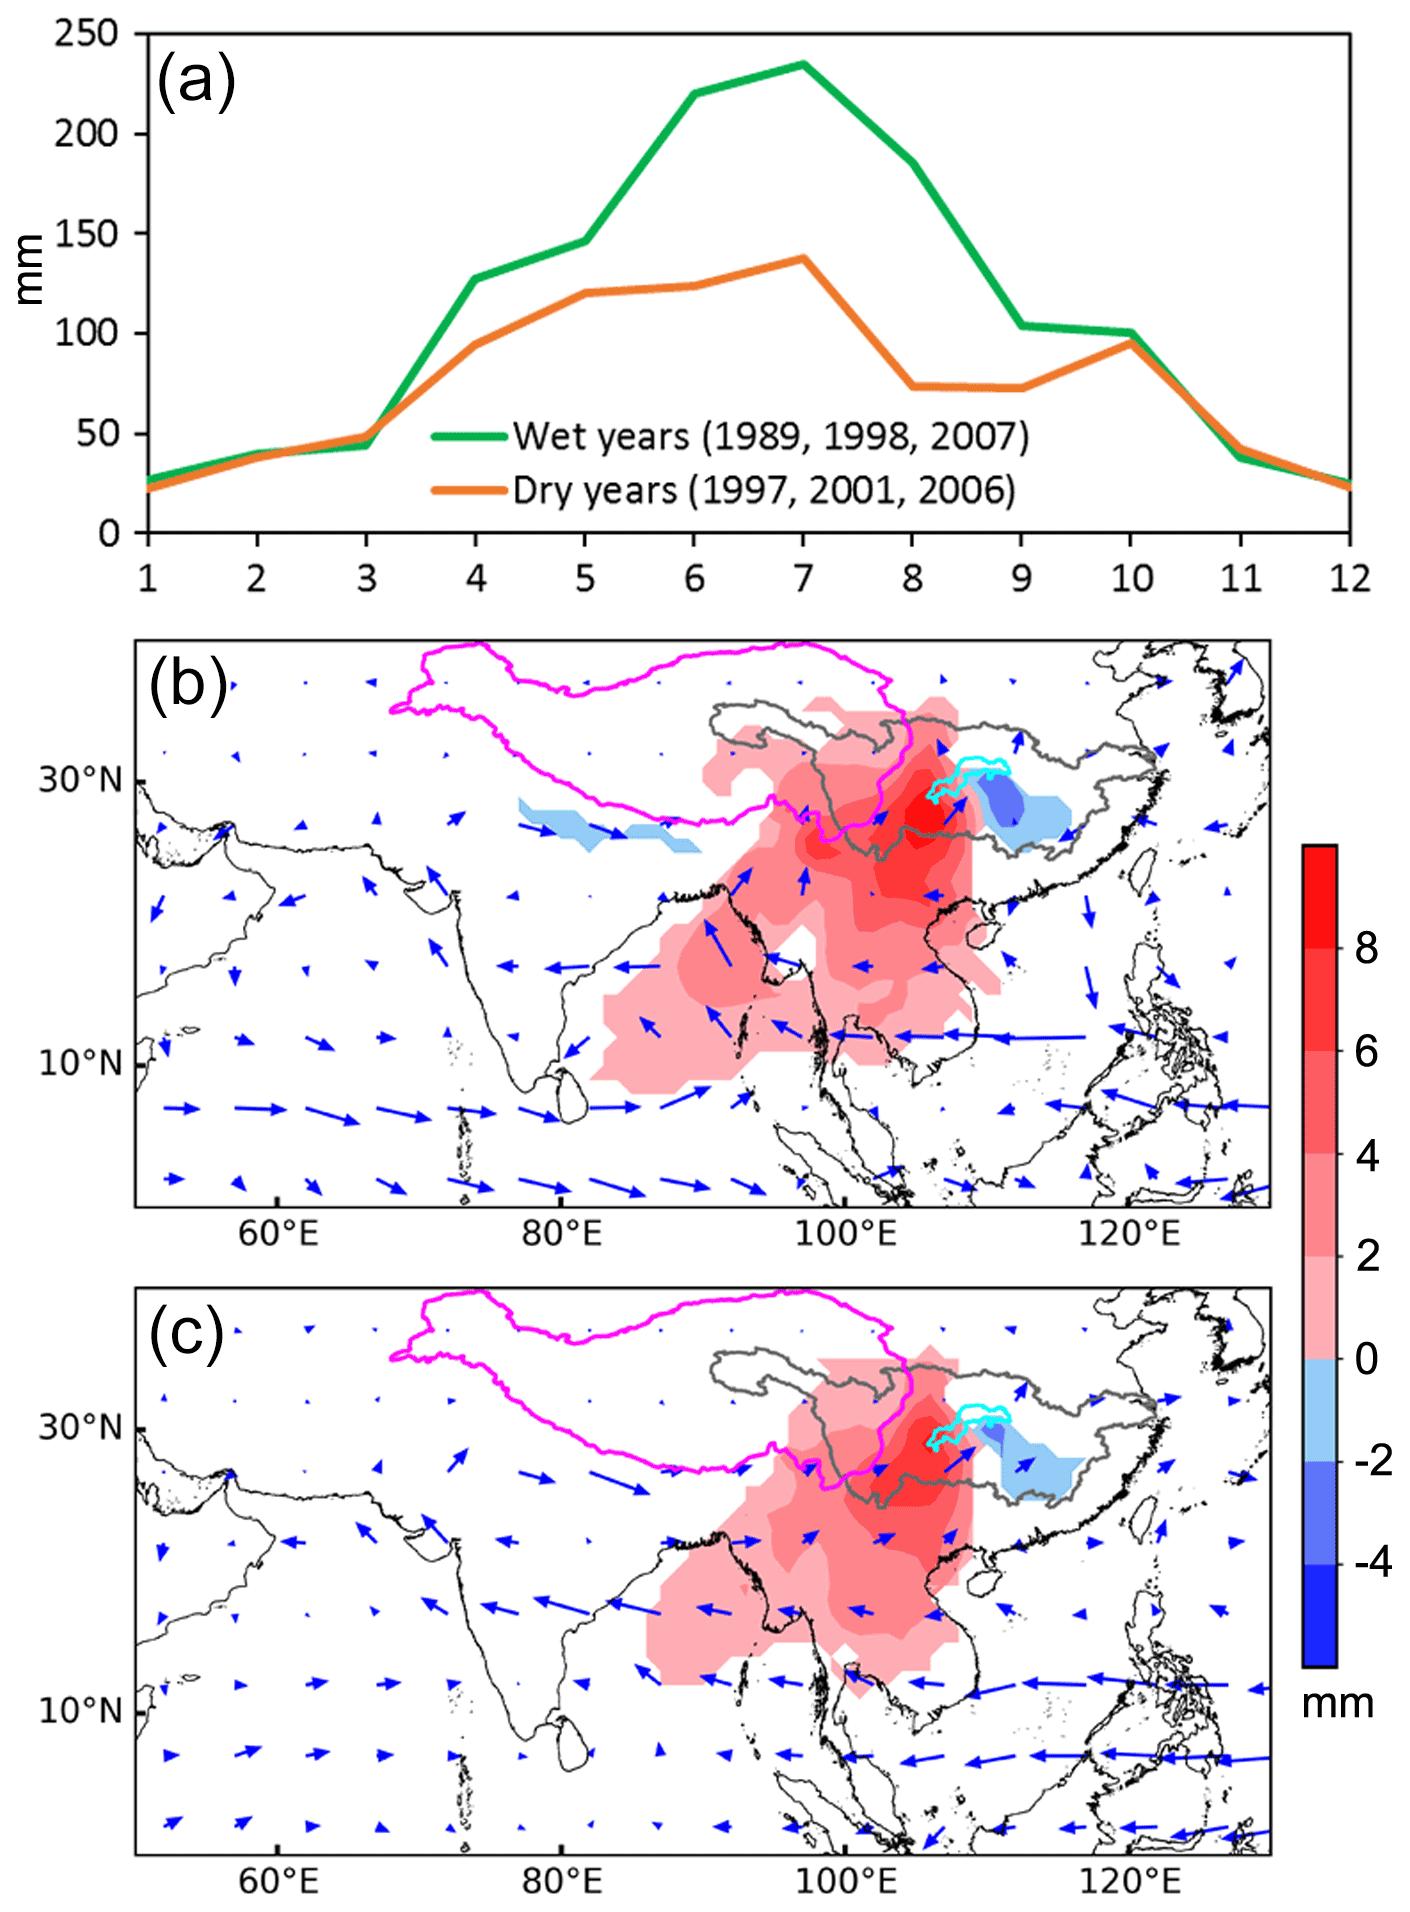
Figure 10Precipitation and contribution of moisture in wet and dry years. (a) Seasonal variation in the Three Gorges Reservoir Region (TGRR) precipitation (millimeters) in wet (1989, 1998, and 2007) and dry (1997, 2001, and 2006) years, and the difference in moisture (millimeters) contributing to (b) annual and (c) summer precipitation in the TGRR between wet and dry years (wet – dry), overlain with the difference in vertically integrated moisture fluxes (blue arrows; wet – dry).
The differences in moisture contribution and vertically integrated moisture fluxes between the representative wet and dry years (wet – dry) are shown in Fig. 10b. On average, the extra moisture during wet years (positive signals in Fig. 10b) is mainly from the regions southwest of the TGRR, although some weak negative signals are seen in part of the adjacent regions southeast of the target region. Note that this dipole pattern is also consistent with the trends of moisture contribution in Fig. 6. On the other hand, intensified moisture transports from both the northern Indian Ocean and the northwestern Pacific Ocean to the eastern Bay of Bengal (along ∼10∘ N) are observed during wet years. The oceanic moisture converges over the Bay of Bengal and is then delivered to the target region by the southwesterly monsoon winds, forming a “vortex” pattern with its center around the southwestern China. The patterns of the differences in summer moisture contribution between wet and dry years (Fig. 10c) are very similar to their annual counterparts (Fig. 10b). However, the change in summer moisture fluxes during wet and dry years is different from that of the annual mean. During summer, we only observe intensified moisture transport from the northwestern Pacific Ocean to the eastern Bay of Bengal in wet years, while the transport from the northern Indian Ocean shows marginal changes. The intensified low-latitude westward moisture fluxes during summer in wet years are in line with a previous numerical simulation focusing on flooding years over the entire YRB (Xu et al., 2008). Generally, compared to dry years, more moisture from regions southwest of the TGRR contributes to the higher TGRR precipitation in wet years, with significantly intensified moisture transport from the low-latitude oceans.
4.1 Uncertainties of moisture contribution with different reanalysis data sets
It is noteworthy that the accuracy of WAM-2layers can be affected by the resolution and reliability of the forcing data, as WAM-2layers is essentially a mass balance model that treats the globe as grids of columns (van der Ent et al., 2010; Li et al., 2019a). The long-term trend in WAM-2layers simulations is also inevitably inherited from the forcing data. Existing studies on the moisture transport over the YRB are often based on a single reanalysis product (Xu et al., 2004; Wei et al., 2012; Chen et al., 2013; Wang et al., 2018; Fremme and Sodemann, 2019). However, uncertainties in these data sets have been observed at both regional and global scales when estimating climate and hydrological changes (Trenberth et al., 2011; Lorenz et al., 2014; Bosilovich et al., 2017). To better understand the uncertainties induced by reanalysis data sets (as forcing), we performed similar moisture tracking simulations based on JRA-55 and MERRA-2 (see Sect. 2.2).
The spatial contributions of moisture to the annual precipitation in the TGRR, when using JRA-55 (1979–2015) and MERRA-2 (1980–2015) as the forcing data sets, are shown in Fig. 11a and b. The moisture from the regions southwest of the TGRR estimated using MERRA-2 is considerably higher than that using ERA-Interim and JRA-55, which may result from the relatively larger difference between evaporation and precipitation over these regions in MERRA-2 (Bosilovich et al., 2017). Nevertheless, simulations based on three forcing data sets (ERA-Interim, JRA-55, and MERRA-2) exhibit highly consistent spatial distributions of moisture source regions and transport pathways, suggesting the robustness of the major findings in Sect. 3.
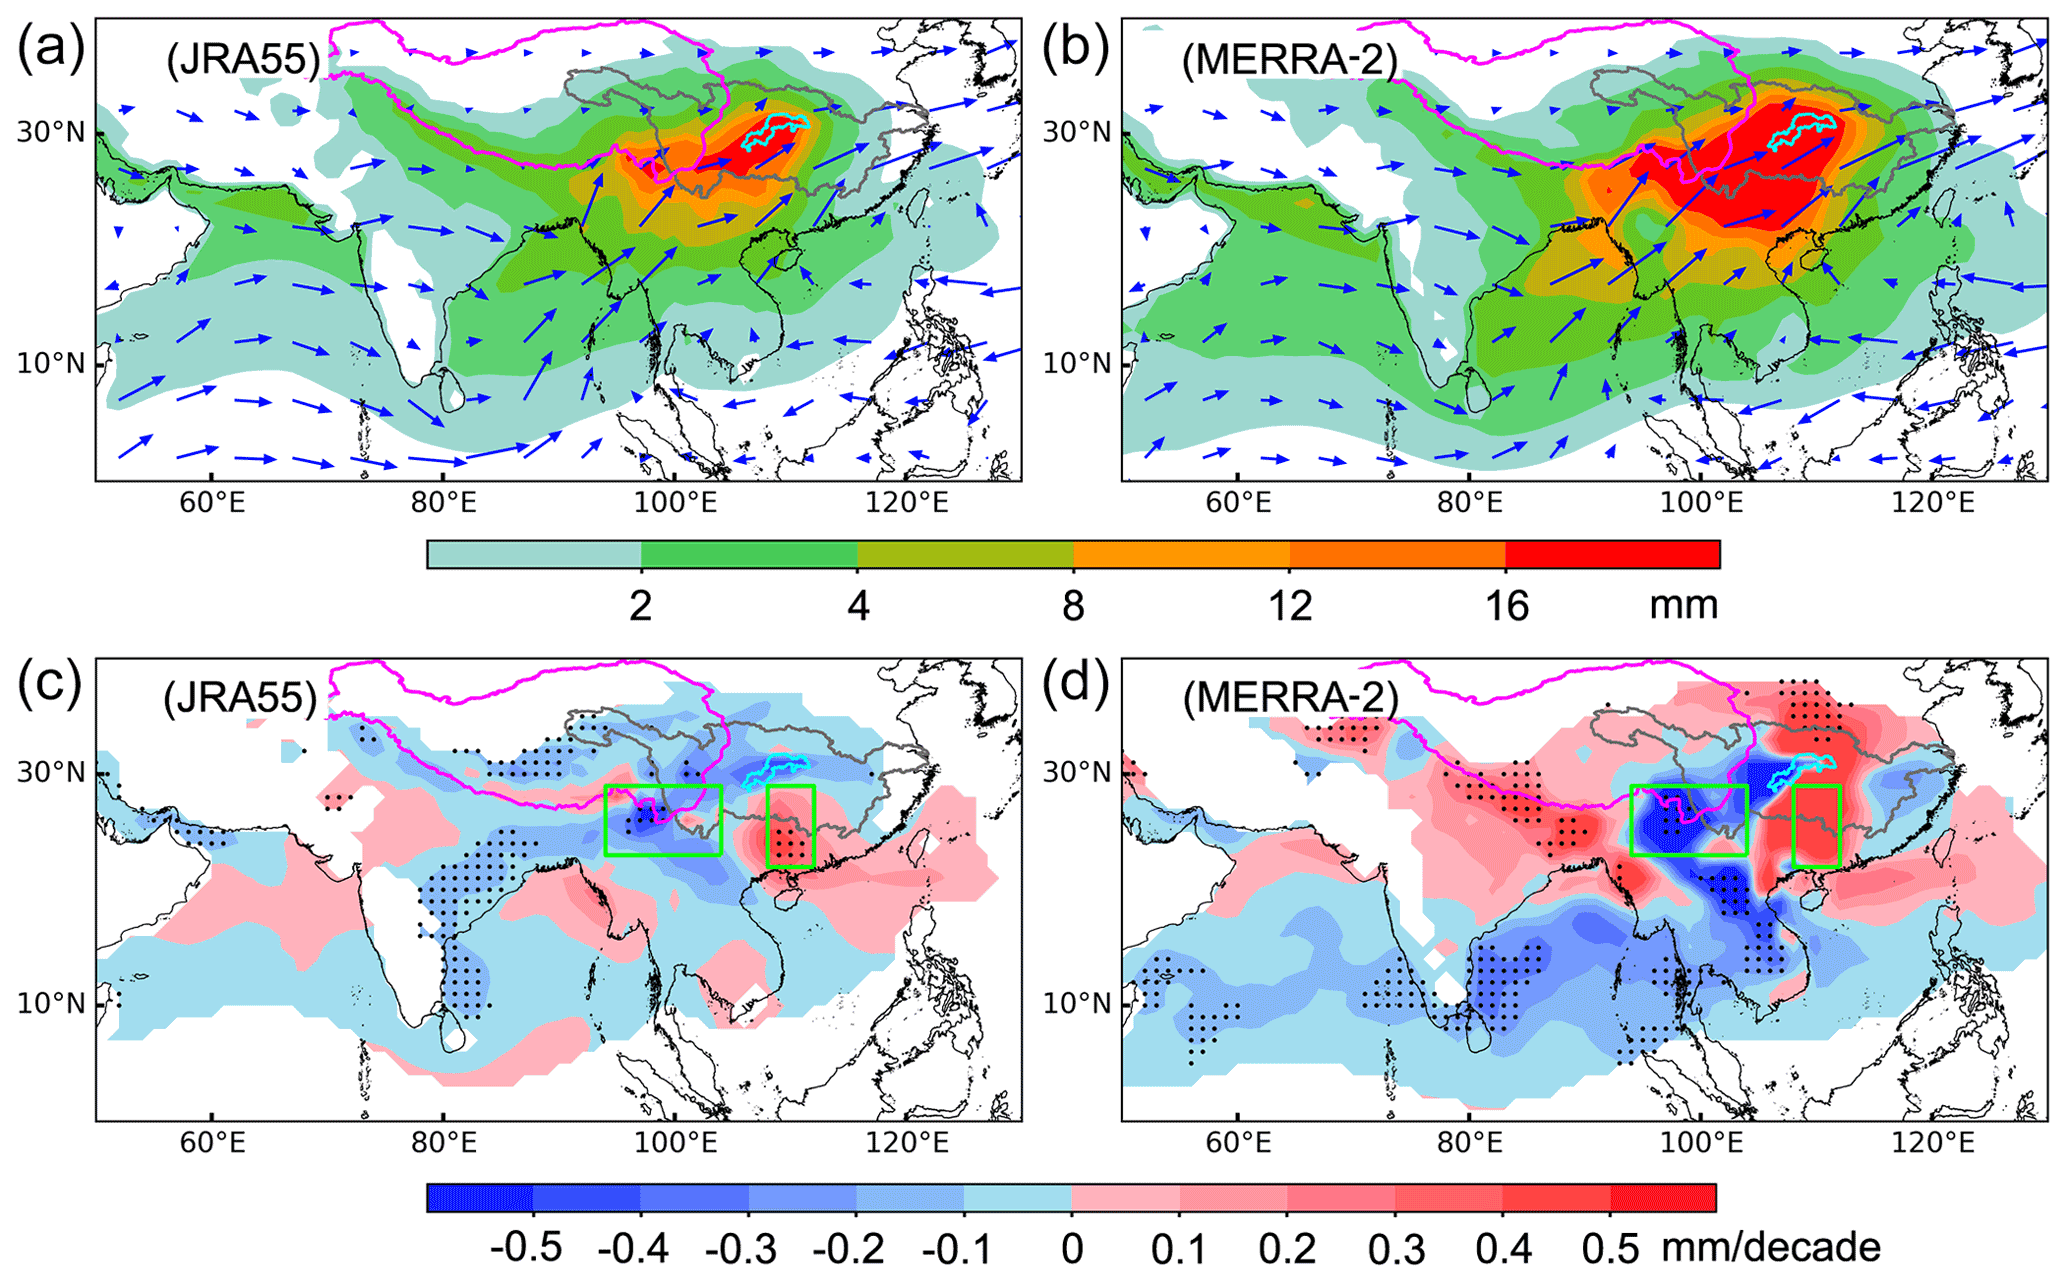
Figure 11(a, b) Contributions of the moisture (millimeters) from different source regions to the annual precipitation in TGRR, and panels (c) and (d) show their trends (millimeters per decade) when using two reanalysis data sets as forcing. (a, c) JRA-55 (1979–2015). (b, d) MERRA-2 (1980–2015). Blue arrows in panels (a) and (b) are vertically integrated moisture fluxes. Stippling in panels (c) and (d) indicates regions with statistically significant trends (p < 0.05).
The trends in the contribution when using JRA-55 and MERRA-2 are shown in Fig. 11c and d. Compared to the results shown in Fig. 6, the spatial distribution of the moisture contribution using JRA-55 shows general agreement with that using ERA-Interim, although with relatively weaker decreasing trends of moisture contribution over the SWS region. In addition, the significant negative trends over the Arabian Sea observed in Fig. 6 are absent in Fig. 11c. In contrast, the trends estimated using MERRA-2 (Fig. 11d) show relatively large discrepancies when compared to that using ERA-Interim, especially the significant increasing trends over the southwestern edge of the TP and the regions north of the TGRR. The discrepancies in contributions and trends are due primarily to the inherent differences in the assimilation system, input data, and model physics of different reanalysis data sets. Nevertheless, clear dipole patterns of positive and negative signals in SWS and SS regions emerge in all three sets of simulations (Figs. 6, 11c, and 11d). Overall, the three forcing data sets generally show good agreement when identifying the spatial characteristics of major source regions (especially SWS and SS) and the variations in the contributions to the TGRR precipitation. Such consistency further demonstrates the capacity and accuracy of ERA-Interim-based moisture tracking in detecting source regions and their contributions to the precipitation in the target region.
4.2 Potential impacts of the Three Gorges Reservoir on the moisture from local recycling
The operation of the TGR since its first impoundment in 2003 results in a dramatic expansion of the water surface in the TGRR. Although most existing work has suggested that the long-term impact of the TGR on local climates (e.g., precipitation and extreme droughts and floods) is insignificant (Xiao et al., 2010; Xu et al., 2013; Lü et al., 2018), some studies did find that the fast expansion of the water surface tends to decrease the surface temperature, increase the regional humidity, enhance the descending motion of air, and alter the regional atmospheric circulation under some special synoptic conditions (Miller et al., 2005; Li et al., 2019b; Zeng et al., 2019). On the other hand, local recycling is a diagnostic measure that depicts the surface hydrology and regional climate in a target region. For example, it plays an important role in sustaining precipitation in the later part of the monsoon season in the YRB (Fremme and Sodemann, 2019). Here we focus on the change in local recycling before and after the first impoundment of the TGR (in 2003) and investigate the potential impacts of this water conservation project.
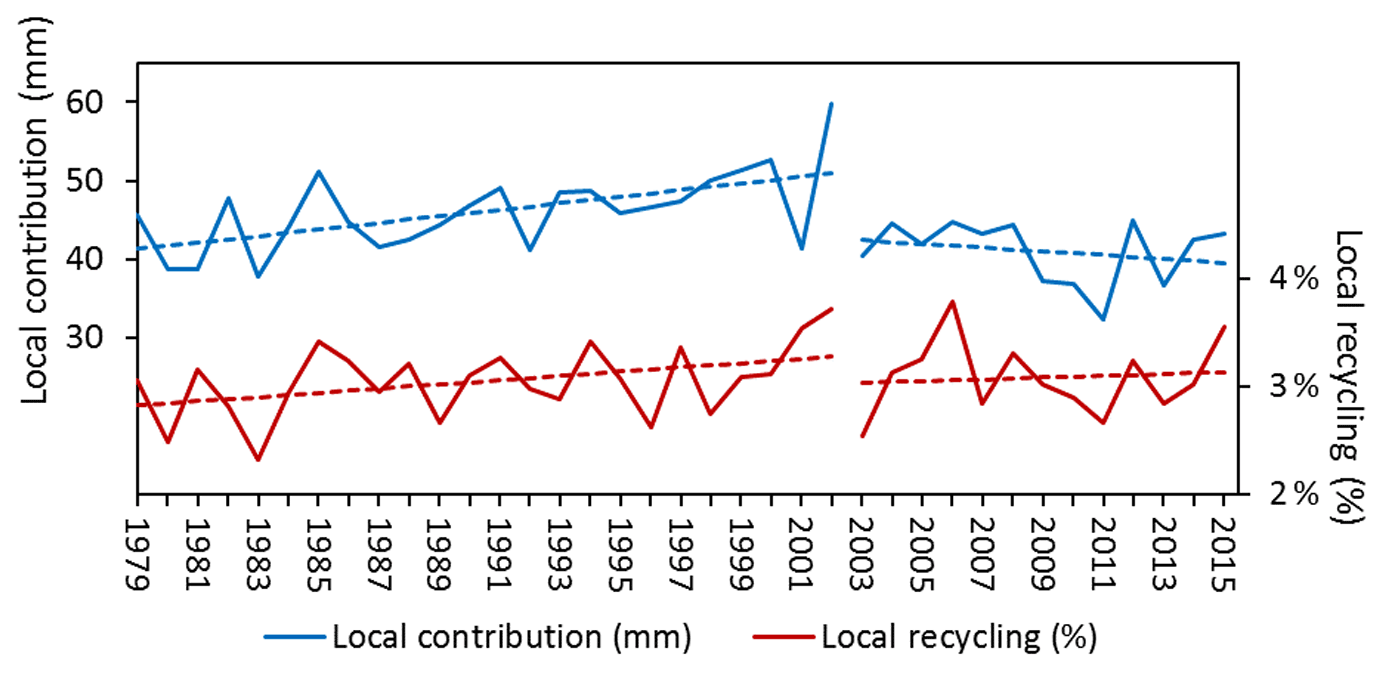
Figure 12Temporal change in moisture from the TGRR (local recycling; percent) and its contribution (local contribution; millimeters) to the annual precipitation in the Three Gorges Reservoir Region (TGRR) before and after the first impoundment of the Three Gorges Reservoir (TGR) in 2003. Dashed lines are linear regression fits to the data.
Figure 12 shows the temporal change in moisture from the TGRR (local recycling; percent) and its contribution (local contribution; millimeters) to the annual precipitation in the TGRR before and after 2003. Both local recycling and local contribution show significant increasing trends before 2003 (0.2 % per decade and 4.2 mm per decade, respectively; p < 0.05). This is followed by a sudden drop in both variables right after the first impoundment of the TGR in 2003. The weakened local recycling may result from the enhanced sinking air and moisture divergence in the lower atmosphere with surface cooling (Miller et al., 2005). In contrast, no significant trends are found in these two variables during 2003–2015, partly because of the limited temporal coverage. Nevertheless, it is still unclear whether the abrupt change in the local recycling is dominated by the oscillation of the large-scale circulations or the impoundment of the TGR, and the mechanisms of this sudden drop require further investigation.
Moisture transport plays an essential role in the local precipitation seasonality and its long-term changes. In this study, we investigated the long-term (1979–2015) moisture sources that contribute to annual and seasonal precipitation changes over the TGRR based on numerical simulations. We examined in detail the variations in major source regions and the interactions between different circulation systems. The contribution of moisture to the TGRR precipitation in representative wet and dry years was further evaluated. In addition, we assessed the possible uncertainties induced by different forcing data. Potential impacts of the TGR were also studies based on the time series of local recycling. The main conclusions are as follows:
-
The source regions southwest of the TGRR (including the southeastern tip of the TP) play a dominant role in providing moisture to the annual and seasonal precipitation in the TGRR. In cold seasons (spring and winter), source regions mainly stretch westwards along the southern branch of the westerlies. Source regions are significantly greater in summer than in the other three seasons, with the Indian monsoon bringing moisture even from the Arabian Sea. In autumn, most source regions are mainly distributed over the land due to the gradual withdrawal of the monsoon systems.
-
On average, the WP (west of 108∘ E) and EP (east of 108∘ E) of the domain contribute 80 % and 20 % of the TGRR precipitation, respectively. The contributions of ocean sources, land sources (excludes the TGRR), and local recycling are 41 %, 56 %, and 3 %, respectively.
-
The decreased annual precipitation in the TGRR during 1979–2015 is mainly due to the decreased contribution of the moisture from source regions southwest of the TGRR, especially around the southeastern tip of the TP, which is influenced by the decreased northward and eastward moisture fluxes over the eastern part of the SWS region. A dipole pattern of the increasing and decreasing trends is found between the SS and SWS regions, suggesting the interactions of different atmospheric circulation systems that transport moisture to the target region.
-
The extra moisture during wet years is primarily from the regions southwest of the TGRR. Compared to dry years, intensified moisture fluxes are observed from the low-latitude oceans during wet years; the moisture converges over the Bay of Bengal and is eventually delivered to the target region by the southwesterly monsoon winds.
The findings of this study reveal the major source regions of the TGRR precipitation and their spatial and temporal dynamics, providing solid evidence for the response of the regional hydrological cycle to climate change and the construction of the TGD. This study also has much broader implications beyond the TGRR. On the one hand, atmospheric moisture tracking can help clarify the debate on the potential hydrological and environmental impacts of dam construction and large reservoirs (such as the TGR). On the other hand, the changes in source regions and their contributions in different seasons and years (dry and wet) suggest potential blind spots in some existing regional water resource management and disaster prevention practices. For example, the change in moisture sources induced by land use policies in nearby states, provinces, or countries may directly influence the precipitation over the target region. It is necessary to take into account the impact of long-distance moisture transport in regional water resource planning and decision-making processes.
The global atmospheric reanalysis product, ERA-Interim, can be downloaded from the official website of the European Centre for Medium-Range Weather Forecasts (ECMWF): https://apps.ecmwf.int/datasets/data/interim-full-daily/ (ECMWF, 2021). The MERRA-2 data set is available from https://disc.gsfc.nasa.gov/datasets?project=MERRA-2 (NASA Goddard Earth Sciences Data and Information Services Center, 2021a), which is managed by the National Aeronautics and Space Administration (NASA) Goddard Earth Sciences Data and Information Services Center (GES DISC). The JRA-55 product was developed by the Japan Meteorological Agency and can be downloaded from https://rda.ucar.edu/datasets/ds628.0/ (Japan Meteorological Agency, 2021). The interpolated precipitation data set from the China Meteorological Administration was retrieved from the official website of the China Meteorological Data Service Center (CMDC; http://data.cma.cn/site/showSubject/id/46.html, China Meteorological Data Service Center, 2021). The TMPA data set is also managed by NASA's GES DISC and is available from https://disc.gsfc.nasa.gov/datasets/TRMM_3B43_7/summary?keywords=TMPA (NASA Goddard Earth Sciences Data and Information Services Center, 2021b).
YL, CW, HP, SX, and DY conceptualized the study. YL carried out numerical simulations, conducted formal analysis, prepared figures, and wrote the initial draft. CW contributed to the visualization of results. All authors reviewed and edited the paper.
The authors declare that they have no conflict of interest.
Publisher’s note: Copernicus Publications remains neutral with regard to jurisdictional claims in published maps and institutional affiliations.
This article is part of the special issue “Analysis of atmospheric water vapour observations and their uncertainties for climate applications (ACP/AMT/ESSD/HESS inter-journal SI)”. It is not associated with a conference.
This work has been supported by the National Key Research and Development Project (grant no. 2016YFA0601503) and the National Science Fund for Distinguished Young Scholars (grant no. 51725905).
This work has been supported by the National Key Research and Development Project (grant no. 2016YFA0601503) and the National Science Fund for Distinguished Young Scholars (grant no. 51725905).
This paper was edited by Shraddhanand Shukla and reviewed by two anonymous referees.
Biemans, H., Haddeland, I., Kabat, P., Ludwig, F., Hutjes, R. W. A., Heinke, J., von Bloh, W., and Gerten, D.: Impact of reservoirs on river discharge and irrigation water supply during the 20th century, Water Resour. Res., 47, W03509, https://doi.org/10.1029/2009WR008929, 2011.
Bosilovich, M. G., Robertson, F. R., Takacs, L., Molod, A., and Mocko, D.: Atmospheric water balance and variability in the MERRA-2 reanalysis, J. Climate, 30, 1177–1196, https://doi.org/10.1175/JCLI-D-16-0338.1, 2017.
Chen, B., Xu, X. D., and Zhao, T.: Main moisture sources affecting lower Yangtze River Basin in boreal summers during 2004–2009, Int. J. Climatol., 33, 1035–1046, https://doi.org/10.1002/joc.3495, 2013.
China Meteorological Data Service Center: China Monthly Surface Precipitation 0.5∘ × 0.5∘ Gridded Data Set (V2.0), available at: http://data.cma.cn/site/showSubject/id/46.html, last access: 26 August 2021.
Dee, D.P., Uppala, S. M., Simmons, A. J., Berrisford, P., Poli, P., Kobayashi, S., Andrae, U., Balmaseda, M. A., Balsamo, G., Bauer, P., Bechtold, P., Beljaars, A. C. M., van de Berg, L., Bidlot, J., Bormann, N., Delsol, C., Dragani, R., Fuentes, M., Geer, A. J., Haimberger, L., Healy, S. B., Hersbach, H., Hólm, E. V., Isaksen, L., Kållberg, P., Köhler, M., Matricardi, M., McNally, A. P., Monge-Sanz, B. M., Morcrette, J.-J., Park, B.-K., Peubey, C., de Rosnay, P., Tavolato, C., Thépaut, J.-N., and Vitart, F.: The ERA-Interim reanalysis: Configuration and performance of the data assimilation system, Q. J. Roy. Meteor. Soc., 137, 553–597, https://doi.org/10.1002/qj.828, 2011.
Duerinck, H. M., van der Ent, R. J., van de Giesen, N., Schoups, G., Babovic, V., and Yeh, P. J.-F.: Observed soil moisture–precipitation feedback in Illinois: A systematic analysis over different scales, J. Hydrometeorol., 17, 1645–1660, https://doi.org/10.1175/JHM-D-15-0032.1, 2016.
European Centre for Medium-Range Weather Forecast (ECMWF): The ERA-Interim reanalysis dataset, available at: https://apps.ecmwf.int/datasets/data/interim-full-daily/, last access: 26 August 2021.
Fremme, A. and Sodemann, H.: The role of land and ocean evaporation on the variability of precipitation in the Yangtze River valley, Hydrol. Earth Syst. Sci., 23, 2525–2540, https://doi.org/10.5194/hess-23-2525-2019, 2019.
Gelaro, R., McCarty, W., Suárez, M. J., Todling, R., Molod, A., Takacs, L., Randles, C. A., Darmenov, A., Bosilovich, M. G., Reichle, R., Wargan, K., Coy, L., Cullather, R., Draper, C., Akella, S., Buchard, V., Conaty, A., da Silva, A. M., Gu, W., Kim, G.-K., Koster, R., Lucchesi, R., Merkova, D., Nielsen, J. E., Partyka, G., Pawson, S., Putman, W., Rienecker, M., Schubert, S. D., Sienkiewicz, M., and Zhao, B.: The modern-era retrospective analysis for research and applications, version 2 (MERRA-2), J. Climate, 30, 5419–5454, https://doi.org/10.1175/JCLI-D-16-0758.1, 2017.
Gimeno, L., Stohl, A., Trigo, R. M., Dominguez, F., Yoshimura, K., Yu, L., Drumond, A., Durán-Quesada, A. M., and Nieto, R.: Oceanic and terrestrial sources of continental precipitation, Rev. Geophys., 50, RG4003, https://doi.org/10.1029/2012RG000389, 2012.
Gimeno, L., Vazquez, M., Eiras-Barca, J., Sorí, R., Stojanovic, M., Algarra, I., Nieto, R., Ramos, A. M., Durán-Quesada, A. M., and Dominguez, F.: Recent progress on the sources of continental precipitation as revealed by moisture transport analysis, Earth-Sci. Rev., 201, 103070, https://doi.org/10.1016/j.earscirev.2019.103070, 2020.
Goessling, H. F. and Reick, C. H.: On the “well-mixed” assumption and numerical 2-D tracing of atmospheric moisture, Atmos. Chem. Phys., 13, 5567–5585, https://doi.org/10.5194/acp-13-5567-2013, 2013.
Hossain, F., Jeyachandran, I., and Pielke, R.: Have large dams altered extreme precipitation patterns?, EOS T. AGU, 90, 453–454, https://doi.org/10.1029/2009EO480001, 2009.
Huffman, G. J., Bolvin, D. T., Nelkin, E. J., Wolff, D. B., Adler, R. F., Gu, G., Hong, Y., Bowman, K. P., and Stocker, E. F.: The TRMM Multisatellite Precipitation Analysis (TMPA): Quasi-global, multiyear, combined-sensor precipitation estimates at fine scales, J. Hydrometeorol., 8, 38–55, https://doi.org/10.1175/JHM560.1, 2007.
IPCC: Climate Change 2014: Synthesis Report, Contribution of Working Groups I, II and III to the Fifth Assessment Report of the Intergovernmental Panel on Climate Change, edited by: Core Writing Team, Pachauri, R. K., and Meyer, L. A., IPCC, Geneva, Switzerland, 151 pp., 2014.
Japan Meteorological Agency: JRA-55: Japanese 55-year Reanalysis, Daily 3-Hourly and 6-Hourly Data, Archived at the National Center for Atmospheric Research, Computational and Information Systems Laboratory, available at: https://rda.ucar.edu/datasets/ds628.0/, last access: 26 August 2021.
Keys, P. W., Barnes, E. A., van der Ent, R. J., and Gordon, L. J.: Variability of moisture recycling using a precipitationshed framework, Hydrol. Earth Syst. Sci., 18, 3937–3950, https://doi.org/10.5194/hess-18-3937-2014, 2014.
Kobayashi, S., Ota, Y., Harada, Y., Ebita, A., Moriya, M., Onoda, H., Onogi, K., Kamahori, H., Kobayashi, C., Endo, H., Miyaoka, K., and Takahashi, K.: The JRA-55 reanalysis: General specifications and basic characteristics, J. Meteorol. Soc. Jpn., 93, 5–48, https://doi.org/10.2151/jmsj.2015-001, 2015.
Li, K., Zhu, C., Wu, L., and Huang, L.: Problems caused by the Three Gorges Dam construction in the Yangtze River basin: a review, Environ. Rev., 21, 127–135, https://doi.org/10.1139/er-2012-0051, 2013.
Li, Y., Zhou, W., Chen, X., Fang, D., and Zhang, Q.: Influences of the Three Gorges Dam in China on precipitation over surrounding regions, J. Meteorol. Res., 31, 767–773, https://doi.org/10.1007/s13351-017-6177-4, 2017.
Li, Y., Su, F., Chen, D., and Tang, Q.: Atmospheric water transport to the endorheic Tibetan Plateau and its effect on the hydrological status in the region, J. Geophys. Res.-Atmos., 124, 12864–12881, https://doi.org/10.1029/2019jd031297, 2019a.
Li, Y., Wu, L., Chen, X., and Zhou, W.: Impacts of Three Gorges Dam on regional circulation: A numerical simulation, J. Geophys. Res.-Atmos., 124, 7813–7824, https://doi.org/10.1029/2018jd029970, 2019b.
Lorenz, C., Kunstmann, H., Devaraju, B., Tourian, M. J., Sneeuw, N., and Riegger, J.: Large-scale runoff from landmasses: a global assessment of the closure of the hydrological and atmospheric water balances, J. Hydrometeorol., 15, 2111–2139, https://doi.org/10.1175/JHM-D-13-0157.1, 2014.
Lü, M., Jiang, Y., Chen, X., Chen, J., Wu, S., and Liu, J.: Spatiotemporal variations of extreme precipitation under a changing climate in the Three Gorges Reservoir area (TGRA), Atmosphere, 9, 24, https://doi.org/10.3390/atmos9010024, 2018.
Lv, M.-q., Chen, J.-L., Mirza, Z. A., Chen, C.-D., Wen, Z.-F., Jiang, Y., Ma, M.-h., and Wu, S.-J.: Spatial distribution and temporal variation of reference evapotranspiration in the Three Gorges Reservoir area during 1960–2013, Int. J. Climatol., 36, 4497–4511, https://doi.org/10.1002/joc.4646, 2016.
Miller, N. L., Jin, J., and Tsang, C.-F.: Local climate sensitivity of the Three Gorges Dam, Geophys. Res. Lett., 32, L16704, https://doi.org/10.1029/2005gl022821, 2005.
Morgan, T. K. K. B., Sardelic, D. N., and Waretini, A. F.: The Three Gorges Project: How sustainable?, J. Hydrol., 460–461, 1–12, https://doi.org/10.1016/j.jhydrol.2012.05.008, 2012.
NASA Goddard Earth Sciences Data and Information Services Center (GES DISC): Modern-Era Retrospective analysis for Research and Applications, Version 2, available at: https://disc.gsfc.nasa.gov/datasets?project=MERRA-2, last access: 26 August 2021a.
NASA Goddard Earth Sciences Data and Information Services Center (GES DISC): Tropical Rainfall Measuring Mission (TRMM) (TMPA/3B43) Rainfall Estimate L3 1 month 0.25 degree × 0.25 degree V7, available at: https://disc.gsfc.nasa.gov/datasets/TRMM_3B43_7/summary?keywords=TMPA, last access: 26 August 2021b.
Pihl, E., Martin, M. A., Blome, T., Hebden, S., Jarzebski, M. P., Lambino, R. A., Köhler, C., Canadell, J. G., Ebi, K. L., Edenhofer, O., Gaffney, O., Rockström, J., Roy, J., Srivastava, L., Payne, D. R., Adler, C., Watts, S., Jacobsson, L., and Sonntag, S.: 10 New Insights in Climate Science 2019, Future Earth & The Earth League, Stockholm, Sweden, 38 pp., available at: https://futureearth.org/publications/science-insights/10-new-insights-in-climate-science-2019/ (last access: 17 September 2020), 2019.
Stein, A. F., Draxler, R. R., Rolph, G. D., Stunder, B. J. B., Cohen, M. D., and Ngan, F.: NOAA's HYSPLIT atmospheric transport and dispersion modeling system, B. Am. Meteorol. Soc., 96, 2059–2078, https://doi.org/10.1175/BAMS-D-14-00110.1, 2016.
Stohl, A., Forster, C., Frank, A., Seibert, P., and Wotawa, G.: Technical note: The Lagrangian particle dispersion model FLEXPART version 6.2, Atmos. Chem. Phys., 5, 2461–2474, https://doi.org/10.5194/acp-5-2461-2005, 2005.
Trenberth, K. E., Fasullo, J. T., and Mackaro, J.: Atmospheric moisture transports from ocean to land and global energy flows in reanalyses, J. Climate, 24, 4907–4924, https://doi.org/10.1175/2011JCLI4171.1, 2011.
van der Ent, R. J.: A new view on the hydrological cycle over continents, Ph.D. thesis, Delft University of Technology, Netherlands, 96 pp., https://doi.org/10.4233/uuid:0ab824ee-6956-4cc3-b530-3245ab4f32be, 2014.
van der Ent, R. J. and Savenije, H. H. G.: Oceanic sources of continental precipitation and the correlation with sea surface temperature, Water Resour. Res., 49, 3993–4004, https://doi.org/10.1002/wrcr.20296, 2013.
van der Ent, R. J. and Tuinenburg, O. A.: The residence time of water in the atmosphere revisited, Hydrol. Earth Syst. Sci., 21, 779–790, https://doi.org/10.5194/hess-21-779-2017, 2017.
van der Ent, R. J., Savenije, H. H., Schaefli, B., and Steele-Dunne, S. C.: Origin and fate of atmospheric moisture over continents, Water Resour. Res., 46, W09525, https://doi.org/10.1029/2010WR009127, 2010.
van der Ent, R. J., Tuinenburg, O. A., Knoche, H.-R., Kunstmann, H., and Savenije, H. H. G.: Should we use a simple or complex model for moisture recycling and atmospheric moisture tracking?, Hydrol. Earth Syst. Sci., 17, 4869–4884, https://doi.org/10.5194/hess-17-4869-2013, 2013.
Wang, N., Zeng, X.-M., Guo, W.-D., Chen, C., You, W., Zheng, Y., and Zhu, J.: Quantitative diagnosis of moisture sources and transport pathways for summer precipitation over the mid-lower Yangtze River Basin, J. Hydrol., 559, 252–265, https://doi.org/10.1016/j.jhydrol.2018.02.003, 2018.
Wei, J., Dirmeyer, P. A., Bosilovich, M. G., and Wu, R.: Water vapor sources for Yangtze River Valley rainfall: Climatology, variability, and implications for rainfall forecasting, J. Geophys. Res., 117, D05126, https://doi.org/10.1029/2011JD016902, 2012.
Wu, L., Zhang, Q., and Jiang, Z.: Three Gorges Dam affects regional precipitation, Geophys. Res. Lett., 33, L13806, https://doi.org/10.1029/2006gl026780, 2006.
Xiao, C., Yu, R., and Fu, Y.: Precipitation characteristics in the Three Gorges Dam vicinity, Int. J. Climatol., 30, 2021–2024, https://doi.org/10.1002/joc.1963, 2010.
Xu, X., Chen, L., Wang, X., Miao, Q., and Tao, S.: Moisture transport source/sink structure of the Meiyu rain belt along the Yangtze River valley, Chinese Sci. Bull., 49, 181–188, https://doi.org/10.1360/03wd0047, 2004.
Xu, X., Tan, Y., and Yang, G.: Environmental impact assessments of the Three Gorges Project in China: Issues and interventions, Earth-Sci. Rev., 124, 115–125, https://doi.org/10.1016/j.earscirev.2013.05.007, 2013.
Xu, X., Dong, L., Zhao, Y., and Wang, Y.: Effect of the Asian Water Tower over the Qinghai-Tibet Plateau and the characteristics of atmospheric water circulation, Chinese Sci. Bull., 64, 2830–2841, https://doi.org/10.1360/TB-2019-0203, 2019.
Xu, X. D., Shi, X. Y., Wang, Y. Q., Peng, S. Q., and Shi, X. H.: Data analysis and numerical simulation of moisture source and transport associated with summer precipitation in the Yangtze River Valley over China, Meteorol. Atmos. Phys., 100, 217–231, https://doi.org/10.1007/s00703-008-0305-8, 2008.
Yigzaw, W., Hossain, F., and Kalyanapu, A.: Impact of artificial reservoir size and land use/land cover patterns on probable maximum precipitation and flood: case of Folsom Dam on the American River, J. Hydrol. Eng., 18, 1180–1190, https://doi.org/10.1061/(ASCE)HE.1943-5584.0000722, 2013.
Zemp, D. C., Schleussner, C.-F., Barbosa, H. M. J., van der Ent, R. J., Donges, J. F., Heinke, J., Sampaio, G., and Rammig, A.: On the importance of cascading moisture recycling in South America, Atmos. Chem. Phys., 14, 13337–13359, https://doi.org/10.5194/acp-14-13337-2014, 2014.
Zeng, Y., Zhou, Z., Yan, Z., Teng, M., and Huang, C.: Climate change and its attribution in Three Gorges Reservoir Area, China, Sustainability, 11, 7206, https://doi.org/10.3390/su11247206, 2019.
Zhang, C., Tang, Q., and Chen, D.: Recent changes in the moisture source of precipitation over the Tibetan Plateau, J. Climate, 30, 1807–1819, https://doi.org/10.1175/JCLI-D-15-0842.1, 2017.
Zhao, F., Hang, D., and Xinyi, Z.: Rainfall regime in Three Gorges area in China and the control factors, Int. J. Climatol., 30, 1396–1406, https://doi.org/10.1002/joc.1978, 2010.
Zhao, T., Zhao, J., Hu, H., and Ni, G.: Source of atmospheric moisture and precipitation over China's major river basins, Front. Earth Sci., 10, 159–170, https://doi.org/10.1007/s11707-015-0497-4, 2016.
Zhao, Y., Zhu, J., and Xu, Y.: Establishment and assessment of the grid precipitation datasets in China for recent 50 years, J. Meteorol. Sci, 34, 414–420, https://doi.org/10.3969/2013jms.0008, 2014.
Zhou, T.-J. and Yu, R.-C.: Atmospheric water vapor transport associated with typical anomalous summer rainfall patterns in China, J. Geophys. Res., 110, D08104, https://doi.org/10.1029/2004JD005413, 2005.