the Creative Commons Attribution 4.0 License.
the Creative Commons Attribution 4.0 License.
 | 19 Aug 2021
Spatiotemporal changes in flow hydraulic characteristics and soil loss during gully headcut erosion under controlled conditions
Mingming Guo
Zhuoxin Chen
Wenlong Wang
Tianchao Wang
Qianhua Shi
Hongliang Kang
Man Zhao
Lanqian Feng
The spatiotemporal changes in flow hydraulics and energy consumption and their associated soil erosion remain unclear during gully headcut retreat. A simulated scouring experiment was conducted on five headcut plots consisting of upstream area (UA), gully headwall (GH), and gully bed (GB) to elucidate the spatiotemporal changes in flow hydraulic, energy consumption, and soil loss during headcut erosion. The flow velocity at the brink of a headcut increased as a power function of time, whereas the jet velocity entry to the plunge pool and jet shear stress either logarithmically or linearly decreased over time. The jet properties were significantly affected by upstream flow discharge. The Reynolds number, runoff shear stress, and stream power of UA and GB increased as logarithmic or power functions of time, but the Froude number decreased logarithmically over time. The Reynolds number, shear stress, and stream power decreased by 56.0 %, 63.8 %, and 55.9 %, respectively, but the Froude number increased by 7.9 % when flow dropped from UA to GB. The accumulated energy consumption of UA, GH, and GB positions linearly increased with time. In total, 91.12 %–99.90 % of total flow energy was consumed during headcut erosion, of which the gully head accounted for 77.7 % of total energy dissipation, followed by UA (18.3 %), and GB (4.0 %). The soil loss rate of the “UA-GH-GB” system initially rose and then gradually declined and levelled off. The soil loss of UA and GH decreased logarithmically over time, whereas the GB was mainly characterized by sediment deposition. The proportion of soil loss at UA and GH is 11.5 % and 88.5 %, respectively, of which the proportion of deposited sediment on GB reached 3.8 %. The change in soil loss of UA, GH, and GB was significantly affected by flow hydraulic and jet properties. The critical energy consumption initiating soil erosion of UA, GH, and GB is 1.62, 5.79, and 1.64 J s−1, respectively. These results are helpful for deepening the understanding of gully erosion process and hydrodynamic mechanisms and can also provide a scientific basis for the construction of gully erosion model and the design of gully erosion prevention measures.
- Article
(10334 KB) - Full-text XML
- BibTeX
- EndNote


Gully erosion is a typical soil erosion process whereby concentrated runoff from an upstream drainage area recurs in a channel and erodes soil from the area through which runoff passes to considerable depth (Poesen et al., 2003; Zhu, 2012). Gully erosion is recognized as the main sediment source in some hilly and gully-dominated watersheds (Poesen et al., 2003; Valentin et al., 2005; Dotterweich et al., 2012). Poesen et al. (2003) reported that soil loss amount caused by gully erosion accounts for 10 %–94 % of total soil loss amount based on the collected data from published articles. Moreover, gully erosion can severely damage infrastructure, enhance the terrain fragmentation, and cause ecosystem instability, land degradation, and compromise food safety (Vanmaercke et al., 2016; B. J. Zhang et al., 2018; Hosseinalizadeh et al., 2019; Arabameri et al., 2020; Bogale et al., 2020; Belayneh et al., 2020; Wen et al., 2020).
As the primary process of the gully erosion, the gully headcut retreat often significantly influences and determines gully erosion (Oostwoud-Wijdenes et al., 2000; Vandekerckhove et al., 2003; Guo et al., 2019). A headcut is defined as a vertical or near-vertical drop or discontinuity on the bed of a gully occurring where flow is concentrated at a knickpoint (Hanson et al., 2001; Bennett et al., 2000). Many studies have demonstrated that the gully erosion is the result of the combined actions of plunge pool erosion by jet flow, upstream runoff incision, headwall erosion by on-wall flow, mass failure of gully head, and wall collapse (Vanmaercke et al., 2016; Addisie et al., 2017; Guo et al., 2019). Once a headcut is formed in the upstream area, the gully will develop rapidly and not stop moving forward until a critical topographic condition is formed (, where S and A are the slope gradient and drainage area upstream a gully headcut, respectively; Kirkby et al., 2003). Moreover, the different landform units (upstream area, UA; gully head, GH; gully bed, GB) of a gully system exhibited completely different erosion processes and hydrodynamic mechanisms during gully headcut erosion (Zhang et al., 2018; Guo et al., 2019; Shi et al., 2020a). The combination and interaction of erosion processes of the three landform units determined the gully headcut erosion process (Vanmaercke et al., 2016). Therefore, clarifying the soil erosion process and characteristics of the three landform units is critical to systematically and clearly reveal the mechanism of gully headcut erosion.
Previous studies suggested that gully headcut erosion is affected by various factors including topography, land use change, vegetation, soil properties, and climate (Vanwalleghem et al., 2003; Ionita, 2006; Rodzik et al., 2009; Rieke-Zapp and Nichols, 2011; Torri and Poesen, 2014; Ionita et al., 2015; Vannoppen et al., 2015; Guo et al., 2019, 2020a). In terms of topography, most studies focused on how the threshold relationship () initiates gully erosion (e.g., Torri and Poesen, 2014). Several experimental studies demonstrated that the upstream slope gradient and headcut height have significant effects on headcut erosion (e.g., Bennett, 1999; Zhang et al., 2018). Land use change is recognized as having the strongest effect on processes related to gully erosion (Poesen et al., 2003; Chaplot et al., 2005; Descroix et al., 2008), and it also significantly affects the activation of gully headcut erosion (e.g., Torri and Poesen, 2014). In this aspect, the vegetation coverage is a parameter that is often used to clarify its effect on gully erosion (e.g., De Baets et al., 2007; Martínez-Casasnovas et al., 2009); however, in fact, the vegetation effect mainly depends on the root characteristics and its distribution at gully head (e.g., Vannoppen et al., 2015; Guo et al., 2019). Nevertheless, at present, most studies on gully erosion focus on the changes in gully morphology between different periods at a watershed or regional scale (Vanmaercke et al., 2016), which is why the previous studies fail to address the effects of root systems on gully headcut retreat. Guo et al. (2019) concluded that the grass (Agropyron cristatum) could reduce soil loss and headcut retreat distance by 45.6 %–68.5 % and 66.9 %–85.4 %, respectively, compared with bare land, and the roots of 0–0.5 mm in diameter showed the greatest controlling influence on headcut erosion. In terms of soil properties, lots of studies have proved the significant effect of soil properties on gully headcut erosion (e.g., Nazari Samani et al., 2010), which is mainly related to the change in soil erodibility induced by soil properties including soil texture, soil vertical joints, soluble mineral content, soil lithology, and physicochemical properties (Sanchis et al., 2008; Vanmaercke et al., 2016; Guo et al., 2020a). Rainfall, the main climate factor, is closely related to runoff generation and, thus, is expected to affect headcut erosion. Many studies have reported that the initiation of gully headcut is correlated with rainfall characteristics (e.g., summation of rainfall from 24 h rains equal to or greater than 0.5 in (25.4 mm); Beer and Johnson, 1963; Vandekerckhove et al., 2003; Rieke-Zapp and Nichols, 2011). However, the great difference in the threshold value relating to rainfall factors was found among different areas of the world due to fully different erosion environments. For example, in northeastern China, gully erosion is the result of soil thawing, rainfall runoff, and snowmelt runoff (Li et al., 2016; J. Z. Xu et al., 2019). Furthermore, at present, most of the studies on gully erosion were conducted to quantify the change in gully erosion (retreat rate, area, and volume) at different spatial and temporal scales by using remote sensing interpretation, real-time monitoring, and meta-analysis based on the literature data (e.g., Vanmaercke et al., 2016). However, the influencing mechanism of these factors on gully headcut erosion is still unclear and needs to be revealed in future studies.
Evidently, the concentrated flow upstream the gully head mainly depended on the drainage area upstream of the gully heads, and rainfall characteristics are the main and original driving force triggering headcut erosion. The runoff firstly eroded the upstream area and was then separated into two types of flow (on-wall flow and jet flow) at the brinkpoint of the gully headcut (Guo et al., 2021a). Consequently, the on-wall flow persistently eroded headwall soil, and the jet flow violently impacted gully bed soil and formed a plunge pool (Su et al., 2015; Guo et al., 2019). Subsequently, the two types of flow merged again and eroded the gully bed together (Zhang et al., 2018; Shi et al., 2020a). The runoff hydraulic or jet flow properties at different landform units (UA, GH, and GB) are significantly different, which is an important reason for the difference in erosion processes among different landform units. However, the spatiotemporal change in runoff and jet properties during headcut erosion is still unclear and, thus, needs to be clarified. Furthermore, at present, some experimental studies on headcut erosion of rill, ephemeral gully, gully, and bank gully were conducted to investigate the runoff properties, energy consumption, sediment transport process, morphology evolution, and empirical model (Bennett and Casalí, 2001; Wells et al., 2009a, b; Su et al., 2014; Xu et al., 2017a; Guo et al., 2019; Shi et al., 2020a). However, relatively little knowledge was obtained to systemically reveal the hydrodynamic mechanism of gully headcut erosion. Therefore, elucidating the spatiotemporal changes in the runoff hydraulic and soil loss and hydrodynamic mechanism of UA, GH, and GB is of great importance to systematically reveal the hydrodynamic mechanism of gully headcut erosion.
Given the abovementioned issues, a series of simulated gully headcut erosion experiments subjected to inflow scouring are conducted to (1) investigate the spatiotemporal change in runoff hydraulic and jet flow properties during headcut erosion, (2) quantify the dynamic change in energy consumption and soil loss and their spatial distribution, and (3) reveal the erosion hydrodynamic mechanism of UA, GH, and GB.
2.1 Study area
This experiment was carried out at the Xifeng Soil and Water Conservation Experimental Station that is located in the Nanxiaohegou watershed, city of Qingyang, Gansu province, China. The study area belongs to a semi-arid continental climate with a mean annual temperature of 9.3 ∘C. The mean annual precipitation is 546.8 mm (1954–2014), of which precipitation from May to September accounts for 76.9 % of the total precipitation (Xia et al., 2017; Guo et al., 2019). The elevation ranges from 1050 to 1423 m. The main landforms include gentle loess tableland, steep hillslopes, and gully channels, and their areas account for 57.0 %, 15.7 %, and 27.3 %, respectively. The loess tableland is characterized by low slope (1–5∘), gentle and flat terrain and fertile soil. The main soil type is loessic soil with silt loam texture. Most of the hillslopes have been constructed as slope terraces. The main gully channel is usually U-shaped, and the branch gully is more actively developed and easily eroded as it is V-shaped by runoff from loess tableland (X. M. Xu et al., 2019). The flat loess tableland can accumulate 67.4 % of total runoff and cause serious gully erosion that can contribute 86.3 % of the total soil erosion (Guo et al., 2019). The original plant species have been seriously destroyed. Since the 1970s, the “Three Protection Belts” system, the “Four Eco-Economical Belts” system, and the “Grain for Green” project (Zhao, 1994; Fu et al., 2011) have been implemented to control soil erosion. The main land use on loess tableland has always been farmland and orchards, while the land use on hillslope was sloping farmland and orchards before 1999, which have since been changed into forested and grassy land due to the Grain for Green project. The current mean annual soil erosion rate has been reduced to 4350 Mg km−2 yr−1 in the study watershed (Guo et al., 2019). The plants are primarily artificially planted arbors and herbaceous vegetation and shrubs (Guo et al., 2021b).
2.2 Experimental design
2.2.1 Gully head experimental plot construction
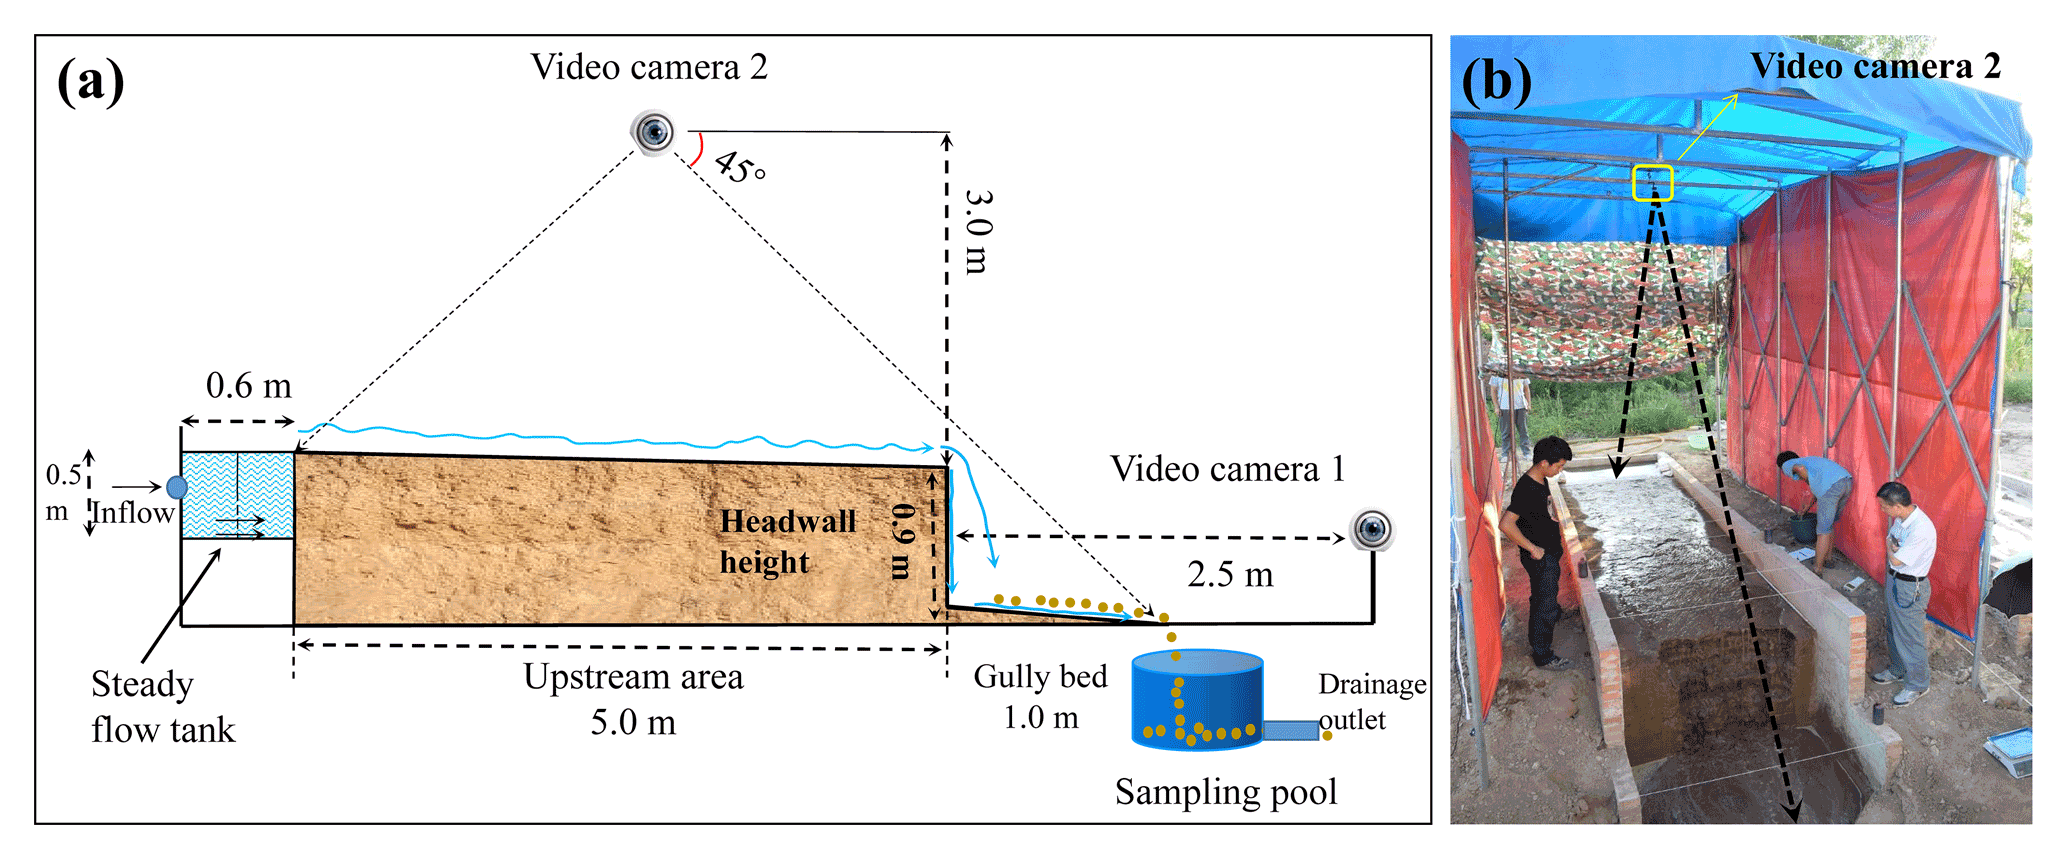
A total of five gully head plots for headcut erosion experiments were constructed at the experimental station in April 2018. Figure 1 shows the basic information of the gully head plot consisting of three landform units (upstream area, headwall, and gully bed). The plot width and slope gradient of the upstream area and gully bed are uniformly designed as 1.5 m and 3∘, respectively. The upstream area length, the height of the vertical headwall, and the length of the gully bed are 5.0 m, 0.9 m, and 1.0 m, respectively (Fig. 1a). The plot boundary was constructed in strict accordance with designed plot dimension using cement and bricks (Fig. 1b). After the construction of the plot boundary, the soil was sieved through a 2 cm sieve to remove roots and debris and ensure uniform soil. The sieved soil was filled into the plot every 10 cm in a thick layer according to the investigated soil bulk density of gully heads. The soil surface of each layer was harrowed to increase the cohesion between two soil layers (Guo et al., 2019). In general, the filling upstream area length was 5.5 m – larger than the precise upstream area length (5.0 m). After the establishment of gully head plots, the five plots were carefully managed for about 4 months (August 2018) to allow the soil to return to its nearly natural state. During the 4-month conservation process, the naturally growing weeds were weeded out in time. Moreover, a flow-steady tank of 0.6, 1.5, and 0.5 m in length, width, and height was installed at the top of the upstream area, and a circular sampling pool of 0.6 m in diameter was set at the bottom of the gully bed to collect runoff and sediment (Fig. 1a). According to the pre-experimental results, the length of upstream area can meet the needs of headcut migration under designed flow discharge (3.0–7.2 m3 h−1) and gully head height (0.9 m), and the length of the gully bed also can satisfy the development of plunge pool by jet flow and stabilize the flow of gully bed.
2.2.2 Inflow discharge design
The concentrated runoff generated from upstream area is the main force driving gully headcut erosion. Jiao et al. (1999) concluded that the more serious soil erosion is generally caused by the A-type rainstorm with the rainfall duration of 25 to 178 min compared to other types of rainstorms in the Loess Plateau. Thus, an extreme case of rainfall duration (180 min) was considered in this study, and the recurrence period of A-type rainstorms was designated as 30 years. Previous studies indicated that the rainstorm distribution on the Loess Plateau showed a non-significant change in past decades (Li et al., 2010; Sun et al., 2016; Wen et al., 2017). Zhang et al. (1983) proposed a statistical equation (Eq. 1) for calculating the average rainfall intensity by analyzing 1710 typical rainstorm events in the Loess Plateau. Then, the inflow discharge was calculated by Eq. (2) that involves the runoff coefficient, storm intensity, and drainage area upstream of the gully head and ranged from 3.12 to 9.68 m3 h−1. Before the study, we first conducted some preliminary experiments under some flow discharges, meanwhile considering the pre-experiment effect; finally, we selected the five inflow discharge levels (3.0, 3.6, 4.8, 6.0, and 7.2 m3 h−1).
where RI is the average rainfall intensity during t minutes (millimeters per minute – mm min−1), N is the recurrence period of rainstorm (year), and t is the rainfall duration (minutes).
where A is the upstream area (square kilometers – km2) and has a wide range of 0.15–8.7 km2 according to an early investigation of the research team (Che, 2012). W is the width of the upstream area (kilometers), w is the plot width (meters), and α is the runoff coefficient of bare land and is identified as 0.167 by analyzing the runoff and rainfall data of standard runoff plots (Li et al., 2006).
2.3 Experimental procedure
The scouring experiment was conducted in August 2018. Before the formal experiment, the upstream area length was firstly adjusted to designed length of 5.0 m (Fig. 2a). Then, a self-made tent (length × width × height is 6.0 m × 3.0 m × 3.5 m) with waterproof canvas enclosed the plot to resist the effects of natural rainfall and sunshine on experimental the progress and photo shoot for 3D reconstruction (Fig. 1b). In addition, the experimental process was recorded by two Logitech C930e video cameras with a resolution of 2.0 MP (megapixels). Camera 1 was installed 2.5 m in front of plot headwall (Fig. 1a), and camera 2 was installed 3.0 m above the plot center (Fig. 1a).
Before the experiment, a watering can was used to spray each experimental plot until surface runoff was generated, and then the plot was covered for 24 h to ensure adequate water infiltration, which can assure us that the soil moisture of the five plots was approximately the same. The inlet pipeline was placed in a steady flow tank when the inflow discharge was adjusted to the designed value. A water thermometer was placed into the steady flow tank to monitor the change in water temperature during experiments. The runoff and sediment samples at the plot outlet were collected at 2 min intervals to represent the temporal change in the runoff and sediment of UA-GH-GB system, and the sampling time was recorded using a stopwatch (Fig. 2b). The runoff and sediment samples were oven-dried at 105 ∘C for 24 h and weighed to calculate the soil loss rate of the UA-GH-GB system. Besides, the timing of the collapse event was recorded during a headcut erosion. The upstream area was divided into four runoff observation sections, and the runoff width (w), depth (d), and velocity (V) of each section were measured by a calibrated scale of 1 mm accuracy and the color tracer method (Fig. 2b, c). The runoff velocity (VJ) before runoff arrived at the brink of headcut was measured 5–8 times by the flow velocity measuring instrument (LS300-A). The instrument was firstly placed perpendicular to the flow section but does not touch the underlying surface. When the flow passes through the turbine, the flow velocity can be measured by the rotating velocity of the turbine with the accuracy of 0.01 m s−1 and a measuring error of <1.5 %, and the runoff width at the headcut brinkpoint was measured (Fig. 2d). The runoff width and velocity of gully bed were also measured using the same method with the upstream area (Fig. 2e). The abovementioned measurements of runoff characteristics and sediment samples were taken at 2 min intervals. The whole experimental process was recorded by two video cameras and imported onto computers (Fig. 2f). In addition to the above runoff parameters, the runoff depth (db) at the brink of headcut, the plunge pool depth (DH), and the vertical distance (h) from the brinkpoint of the headcut to the water surface of the plunge pool were also measured 3–5 times by a steel ruler with 1 mm accuracy during each of the 2 min intervals (Fig. 3).
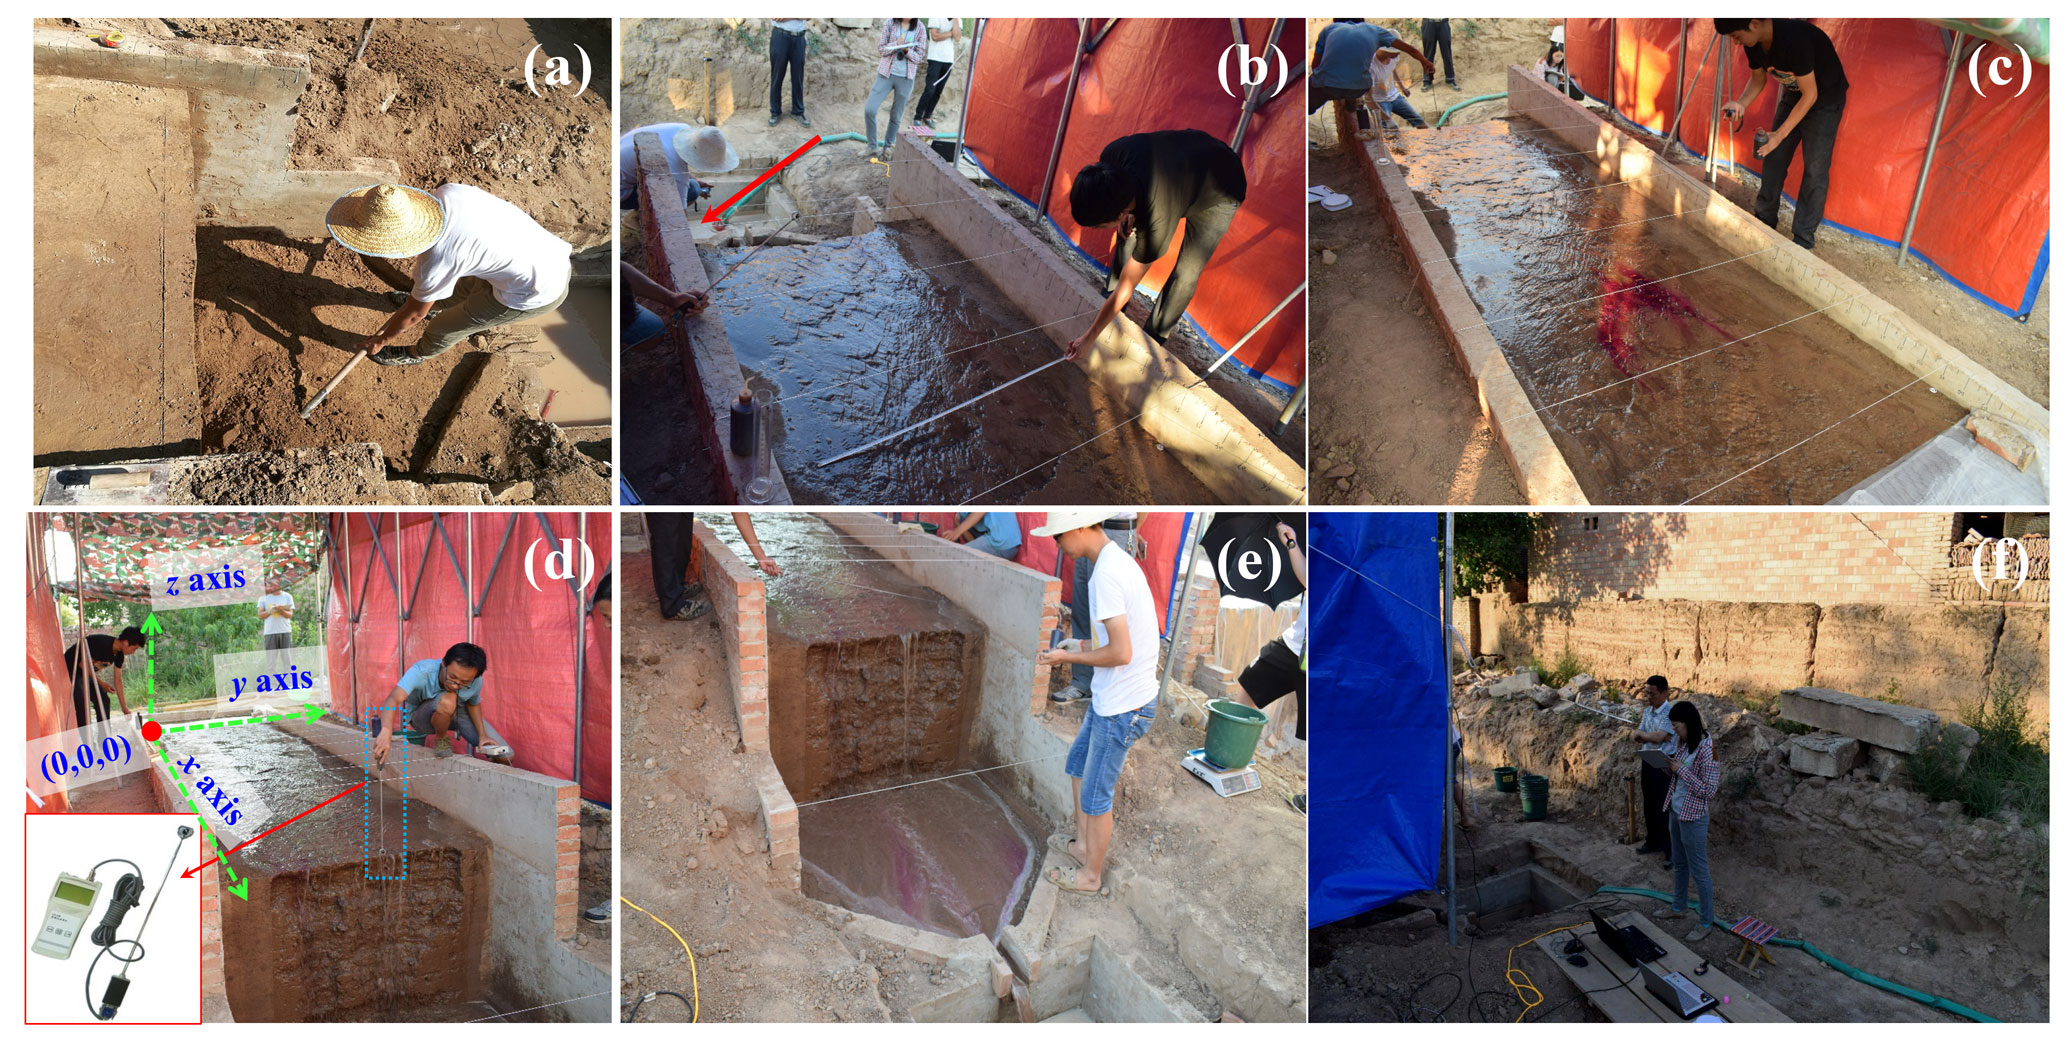
Figure 2Plot construction (a). Runoff width measurement of loess tableland and runoff and sediment sampling of outlet (b). Runoff velocity measurement of loess tableland (c). Jet velocity measurement of the gully head (d). Runoff velocity and width measurement of the gully bed (e). Experimental process recoding (f).

To obtain the dynamic change in the morphology of the erosional landform during the gully headcut erosion, the experimental duration (180 min) was divided into six stages (30–60–90–120–150–180 min). A photo-based three-dimensional (3D) reconstruction method was employed to obtain the digital elevation model (DEM) data of each plot prior to the experiment and after each 30 min test. A total of 14 target points were placed around the plot for identifying the 3D coordinates before the photos were taken. The eroded photography was recorded by a Nikon D5300 camera with a focal length of 50 mm. The following aspects were required during the photo shoot: (1) obvious water on the soil surface and direct sunshine should be avoided, (2) a minimum overlap of 60 % between subsequent photographs was required, and (3) some complex eroded photographic should be taken in detail. In this study, the upper left corner of the plot was set as the original coordinates (0, 0, 0), and the direction of the three-dimensional coordinate was determined as shown in Fig. 3d. These collected photos were imported into Agisoft PhotoScan software (Agisoft LLC, Russia, professional version 1.1.6), and then these control points and their coordinates were identified and entered into the software. The root mean square errors for the altitudes (z axis) of the target points are 0.0037, 0.0045, 0.0024, 0.0052, and 0.0030 m on average, respectively, for the experiments of the five inflow discharges, which can satisfy the study requirement (millimeter level). The DEM could be exported and was used to extract the morphological parameters and soil loss volume of three landform units at six stages (Frankl et al., 2015).
2.4 Parameter calculation, data analysis, and figure plotting
2.4.1 Hydraulic parameters of upstream area and gully bed
The five parameters, including runoff velocity (V; meters per second; hereafter m s−1), Reynolds number (Re), Froude number (Fr), shear stress (τ; Pa), and stream power (ω; watts per square meter; hereafter W m−2) were used to characterize the changes in hydraulic properties at upstream area and gully bed positions. Several parameters, except for V, are calculated as follows:
where R (meters) and υ (square meters per second – m2 s−1) are the hydraulic radius and the water kinematic viscosity coefficient, respectively; w (meters), d (meters), and T (degrees) are the runoff width, depth, and water temperature, respectively; ρw (kilograms per cubic meter – kg m−3) is the water density and J (meters per meter – m m−1) is the hydraulic gradient.
2.4.2 Jet properties of the gully head
Based on the measured runoff velocity (VJ; m s−1) before the runoff arrived at the headcut brinkpoint, the runoff depth (db; meters) at the headcut brinkpoint, the plunge pool depth (DH; meters), and the vertical distance (h; meters; Fig. 3a) are the three parameters, including the runoff velocity at the headcut brinkpoint (Vb), jet-flow velocity entry to plunge pool (Ve), and jet-flow shear stress (τj) that were calculated to clarify the change in jet properties (Rouse, 1950; Hager, 1983; Stein et al., 1993; Flores-Cervantes et al., 2006; Zhang et al., 2016). The three parameters were calculated as follows:
2.4.3 Energy consumption of the upstream area, gully head, and gully bed
In this study, the energy consumption of three landform units (UA, GH, and GB) were calculated according to the measured runoff characteristic parameters. The bottom of GB was treated as the zero potential surface to quantify the energy consumption. Therefore, the total runoff energy (ET; joules per second; hereafter J s−1), the runoff energy at the brink of headcut (EL, J s−1), the runoff energy when runoff leaves the plunge pool (EH, J s−1), and the runoff energy at the bottom of gully bed (EB, J s−1) were calculated as follows. The calculation was consistent with the theory of minimum rate of energy dissipation expressed by Yang (1971a, b).
where the Ll (meters) and Lg (meters) are the projection length of UA and GB, respectively, during gully head migration. Lm (meters) is the gully head retreat distance, and Hh (meters) is the initial gully headcut height. VP (m s−1) and VB (m s−1) are the runoff velocity and runoff leaving the plunge pool and GB, respectively.
Therefore, the total runoff energy consumption (ΔET; J s−1), the runoff energy consumption of UA (ΔEL; J s−1), the runoff energy consumption of GH (ΔEH; J s−1), and the runoff energy consumption of GB (ΔEB; J s−1) could be calculated as follows.
2.4.4 Statistical analysis
The curve regression analysis method was employed to determine the quantitative relations between hydraulic characteristics, jet properties, runoff energy consumption, and soil erosion rate and inflow discharge. The fitted equations between the soil loss rate of three landform units and hydraulic characteristics, jet properties, and energy consumption were also quantified by the curve regression. The soil erosion volume of the upstream area, gully head, and gully bed were derived from the DEM of different stages through ArcGIS 10.0 software. The data analysis was executed by using SPSS software (version 6.0), and figure plotting was carried out with Origin 8.5 and PowerPoint 2016 software.
3.1 Spatiotemporal changes in jet properties and runoff hydraulic
3.1.1 Jet properties of gully head
Figure 4 shows the temporal change in the three jet property parameters of the gully head (GH) under different inflow discharge conditions. Overall, the flow velocity at the headcut brinkpoint (Vb) increased obviously in the first 30 min, and then it showed a gradually stable tendency with some degree of fluctuation (Fig. 4a), and the fluctuation degree was enhanced by the increased inflow discharge. For example, the Vb increased sharply from 0.66 to 0.88 m s−1 during 100–124 min under 6.0 m3 h−1 inflow discharge due to the headwall failure near the headcut enhancing the runoff turbulence. Regression analysis revealed the significant power relationships (; R2= 0.139–0.704; P < 0.01) between Vb and time (t; Table 1). Furthermore, except for the 3.6 m3 h−1 condition, the a value increased as the inflow discharge increased, but the b value showed a weak variation (0.08–0.10), indicating that the flow drainage from the gully head can improve the initial Vb but not change its change trend over time. The mean Vb exhibited a significantly exponential relationship with inflow discharge (Fig. 4b; P < 0.05). Contrary to the Vb, the jet velocity entry to plunge pool (Ve) and the jet shear stress (τj) experienced a gradually decreased trend with time (Fig. 4c, e). Notably, the Ve and τj suddenly decreased at 120 min and lasted nearly 40 min under 3.0 m3 h−1 inflow discharge, which was mainly attributed to the developed second headcut shortening the jet flow height. The temporal change in Ve could be described by logarithmic functions under 3.0–4.8 m3 h−1 inflow discharges and expressed by linear functions under the other inflow discharges, whereas the decrease in the τj with time could be presented by logarithmic functions under all inflow discharge conditions (Table 1). Furthermore, both means of Ve and τj could be expressed by a positive S function of inflow discharge (Fig. 4d, f).
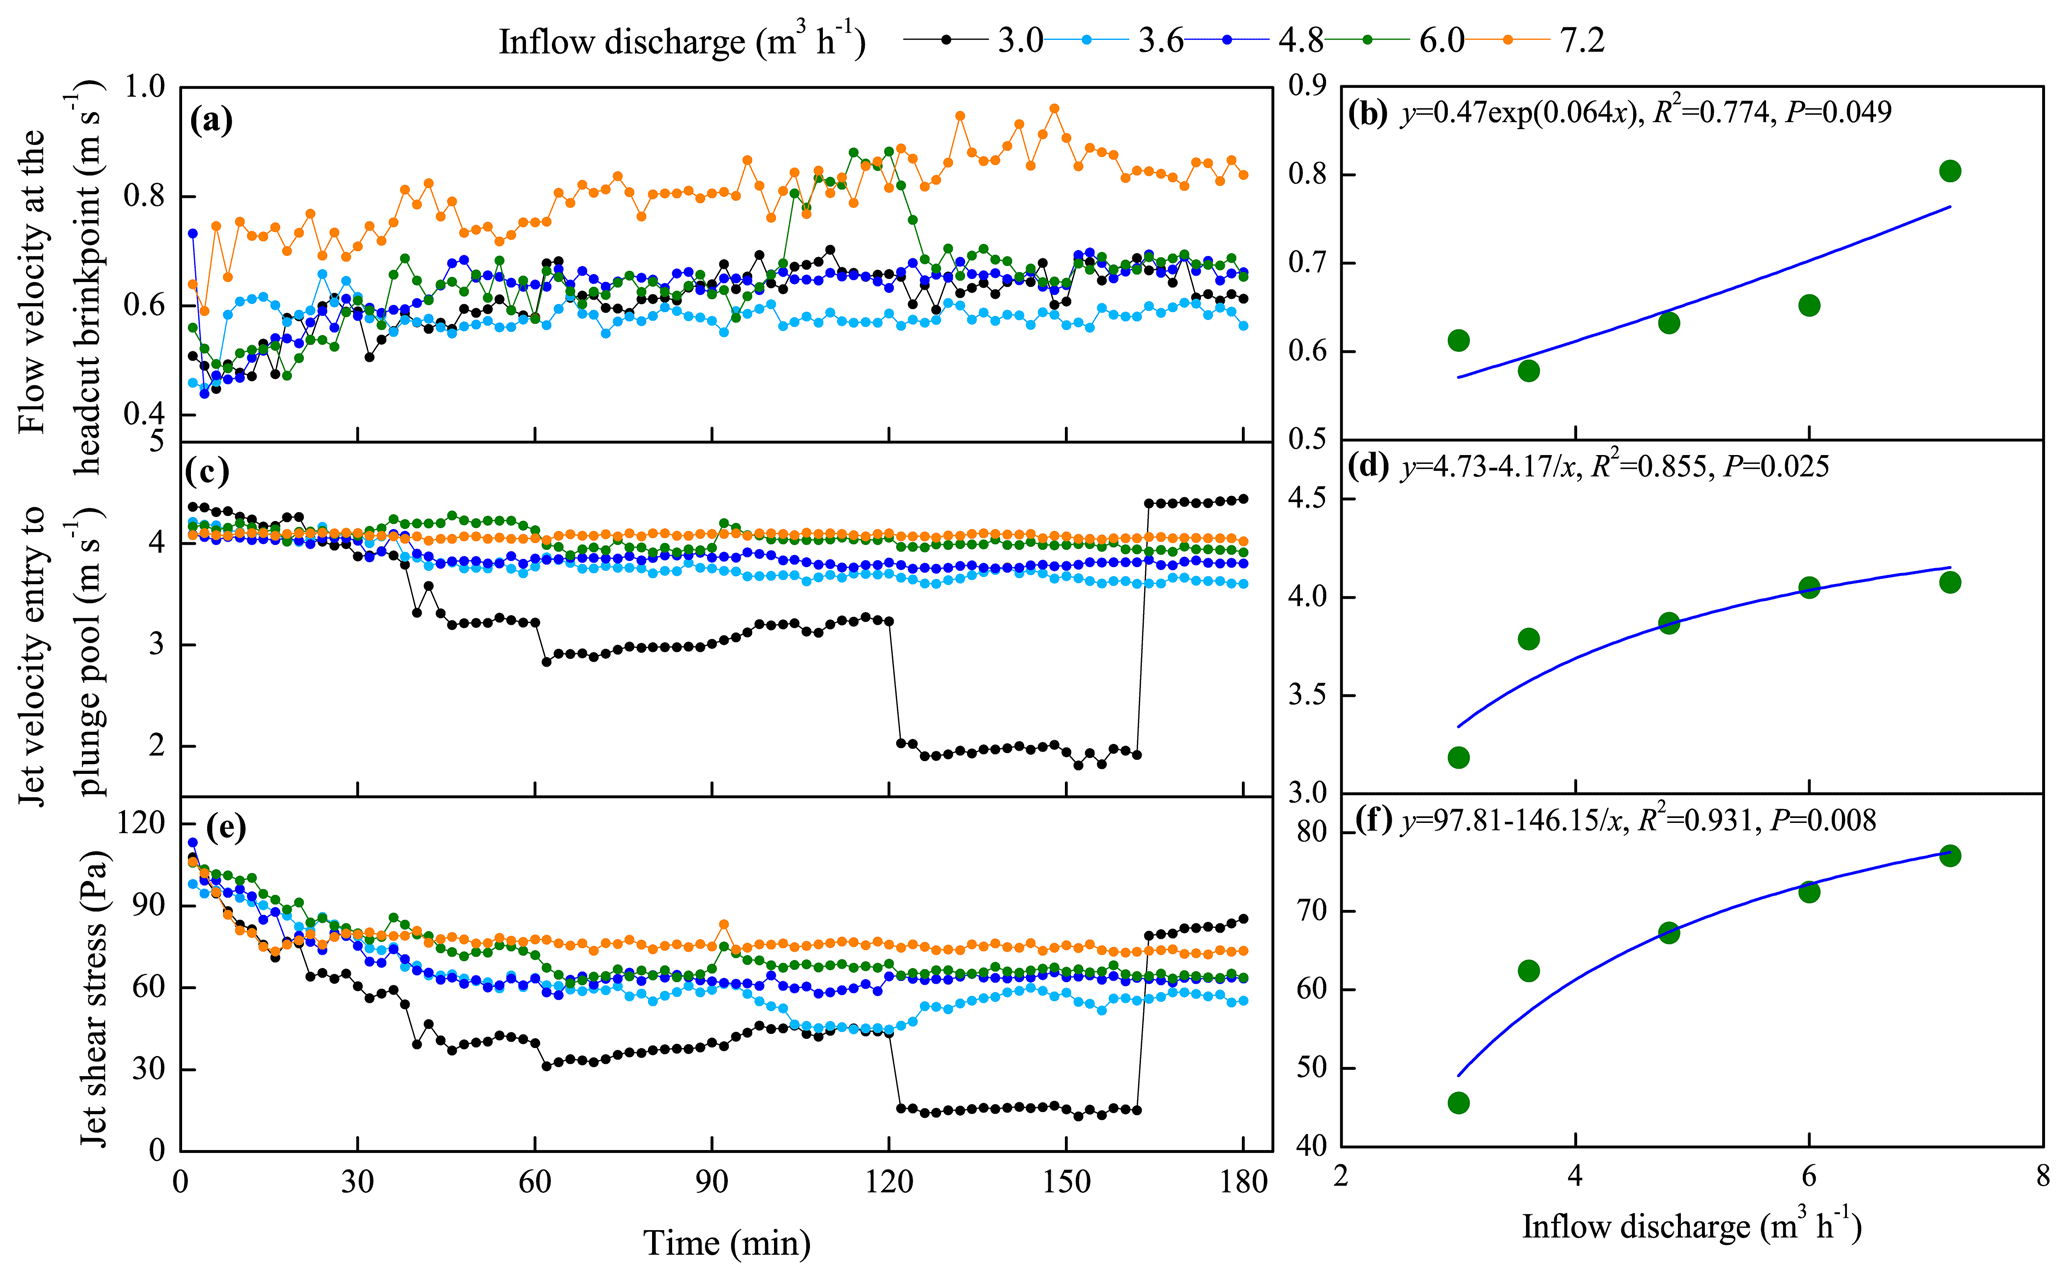
Figure 4Temporal changes in jet properties of headcut and their relationships with inflow discharge.
Table 1The relationships between jet properties of gully headcut and time.
Note: Vb, Ve, and τj are runoff velocity at the headcut brinkpoint, runoff velocity entry to plunge pool, and the jet shear stress, respectively. The sample number is 90 for the fitted equations, and all fitted equations are at 0.01 significant level.
3.1.2 Runoff regime of upstream area and gully bed
The temporal changes in the runoff Reynolds number (Re) and Froude number (Fr) of the upstream area (UA) and gully bed (GB) and their relationships with inflow discharge are provided in Fig. 5. The Re of UA and GB showed a similar trend over time; that is, the Re firstly increased in the first 40 min and then gradually stabilized (Fig. 5a). In addition, the Re of UA was larger than that of GB at any time under same inflow discharge, indicating that the runoff turbulence became weaker after the runoff of the UA passed the gully head. The temporal variation in the Re of UA could be described by logarithmic and power functions, but for the GB, the relationship was mainly dominated by the power function (Table 2). On average, the Re of GB was 50.5 %–65.9 % less than that of UA, and the Re of UA and GB both increased with the increase in inflow discharge as a power function (Fig. 5b). However, as illustrated in Fig. 5c, the Fr experienced a completely opposite trend to Re. The Fr of UA decreased in the first 60 min and then gradually stabilized, but the Fr of GB experienced a relatively weak fluctuating variation over time. For most cases, the change in Fr of UA and GB over time could be expressed by logarithmic functions (Table 2). On average, the Fr of UA was 2.39–3.04 times that of GB for same inflow discharge, and the positive power function could describe the relationship between Fr and inflow discharge (Fig. 5d).
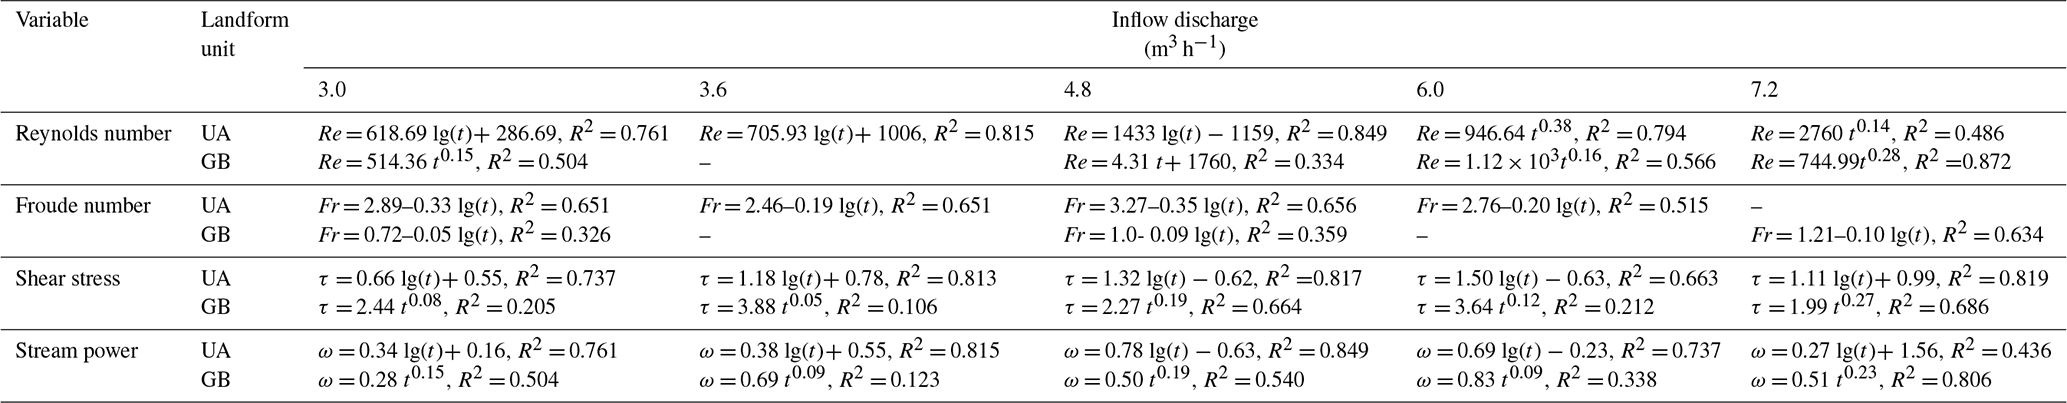
Furthermore, the knowledge of open channel hydraulics is adopted to investigate the difference in the runoff regime between UA and GB. The specific definition is that the flow is laminar when Re is less than 500, the flow is turbulent when Re is larger than 2000, and the flow is transitional when Re ranges from 500 to 2000 and Fr = 1 is the critical value for distinguishing the subcritical and supercritical flow. The six flow regime zones were divided by three boundary lines (Re = 500, Re = 2000, and Fr = 1) according to the logarithmic relationship between the flow velocity and hydraulic radius (Fig. 6; Xu et al., 2017b; Guo et al., 2020b). As shown, the runoff regimes of UA and GB were located in five entirely different zones. The flow of UA was in the supercritical transition flow regime in the first 26 min and then gradually transformed to supercritical turbulent flow regime under 3.0–6.0 m3 h−1 inflow discharge, but the flow was always in the supercritical turbulent regime zone under 7.2 m3 h−1 inflow discharge. Moreover, the higher inflow discharge would enhance the flow turbulent degree. The flow of GB belonged to subcritical laminar flow category in the initial 6 min, and then transformed to a subcritical transition and a subcritical turbulent flow regime when the inflow discharge was 3.0 and 3.6 m3 h−1. The flow was in the subcritical turbulent flow regime for most of the experimental duration when the inflow discharge was 4.8–7.2 m3 h−1. The difference in flow regime between UA and GB also indicated that the presence of a gully head can greatly reduce flow turbulence.
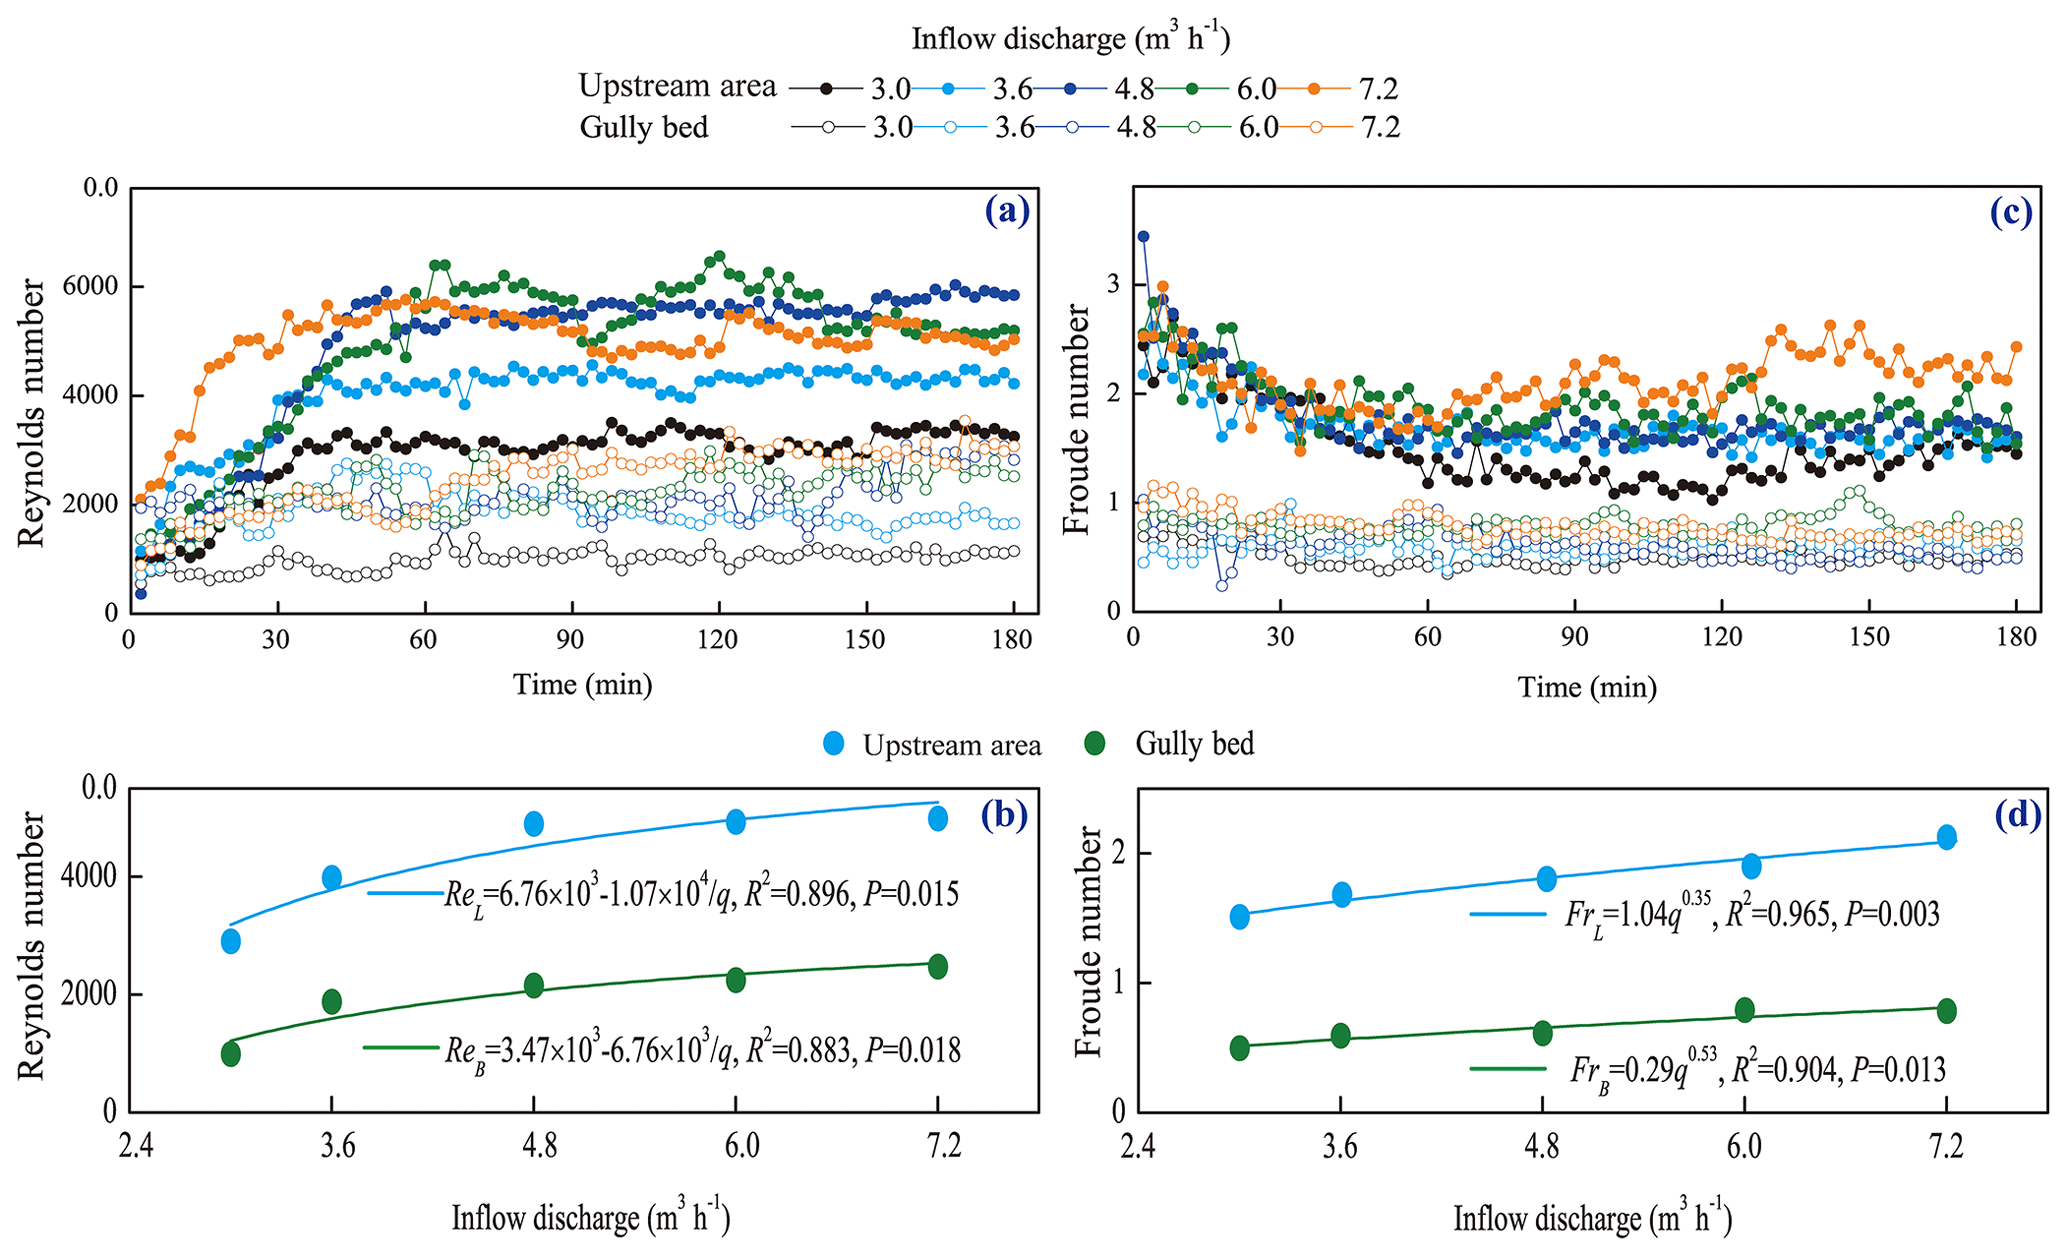
Figure 5Temporal changes in the runoff regime of the upstream area and gully bed and their relationships with inflow discharge.
Table 2Relationships between runoff hydraulic parameters and time.
Note: UA and GB refer to upstream area and gully bed. Re, Fr, τ, and ω are the Reynolds number, Froude number, shear stress, and stream power, respectively. The sample number is 90 for the fitted equations, and the fitted equations are at 0.01 significance level.
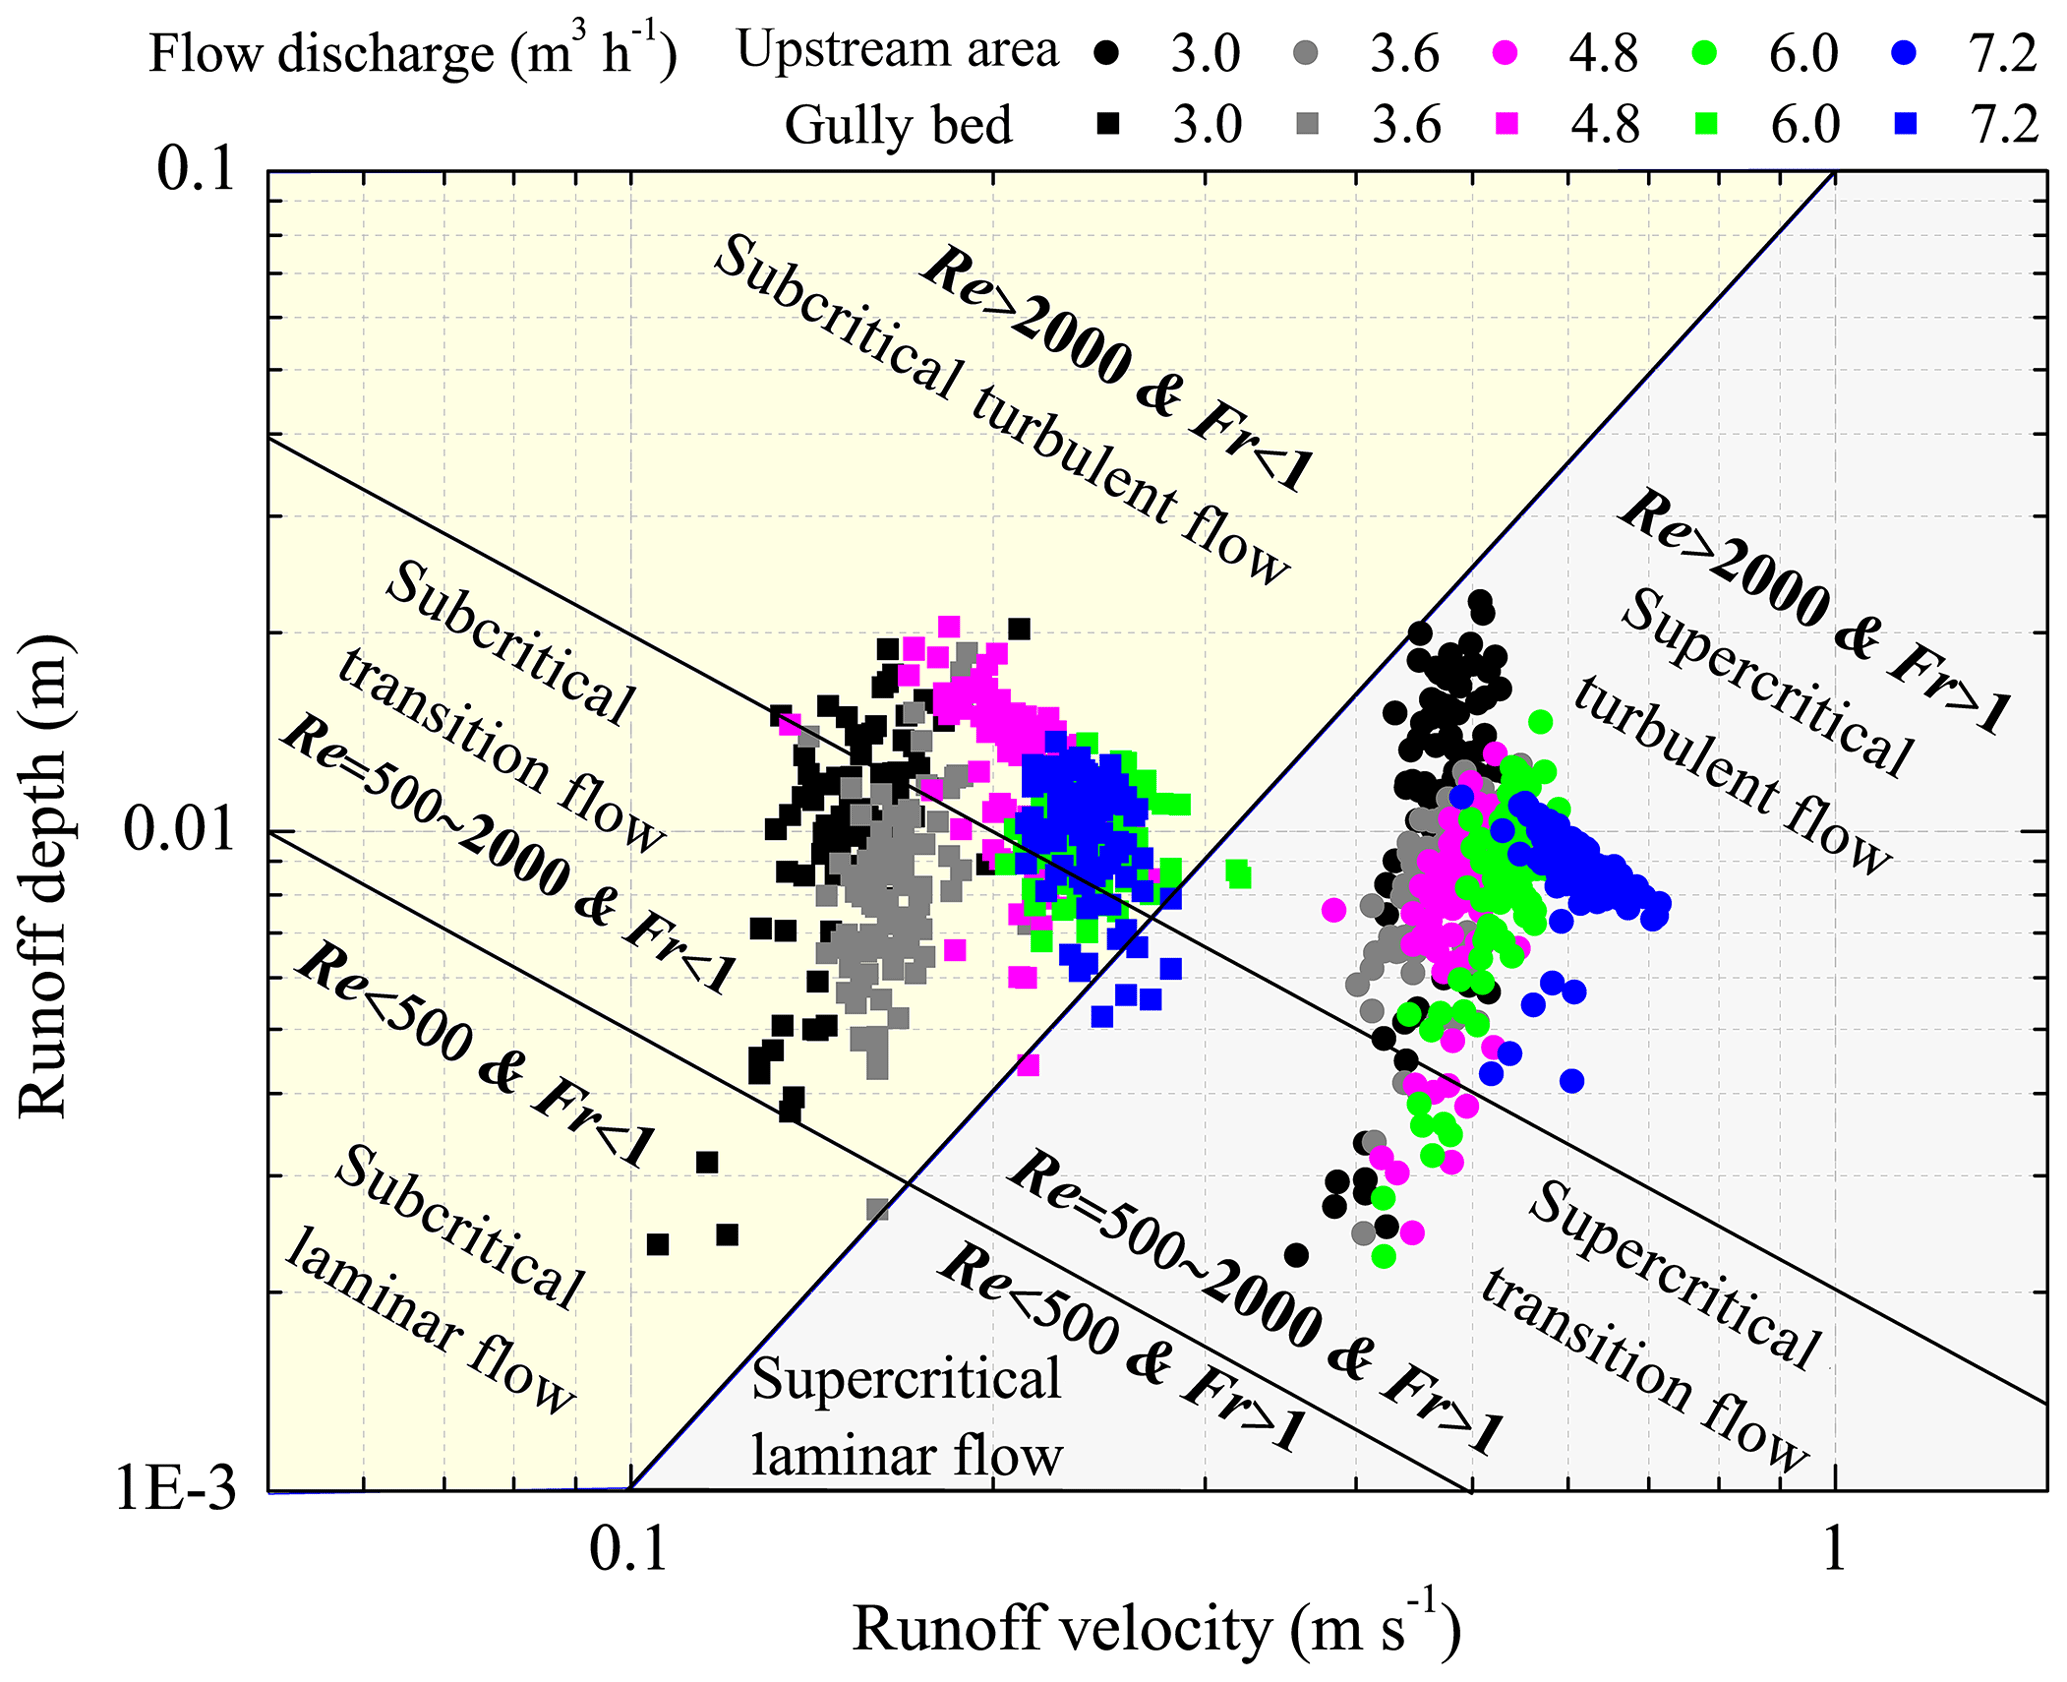
Figure 6Runoff regime zones of upstream area and gully bed under different inflow discharge conditions.
3.1.3 Runoff shear stress and stream power of upstream area and gully bed
Figure 7 shows the temporal changes in the runoff shear stress (τ) and the stream power (ω) of the upstream area (UA) and gully bed (GB) and their relationships with inflow discharge. Overall, the τ of UA and GB exhibited a gradually increased trend in the first 60 min; thereafter, a relatively steady state was obtained, but the larger inflow discharge perturbed the steady situation (Fig. 7a). Furthermore, the temporal change in τ of UA could be expressed by logarithmic functions, but the τ of GB showed a significant power function with experimental time (Table 2). On average, the τ of GB was 2.8 %–15.7 % larger than the UA. The averaged τ of UA and GB increased with inflow discharge as a power function (), and the GB had a faster increased speed (b value) than UA (Fig. 7b), signifying that the difference in τ between UA and GB would be widened as the inflow discharge increased. Similarly, the ω of UA and GB also exhibited a trend of gradual increase and stabilization (Fig. 7c). Different from the temporal change in τ, the ω of GB was always less than that of UA at any time for the five inflow discharges. Likewise, the variation in ω of UA and GB over time exhibited a significant logarithmic and power function, respectively. On average, the ω of GB was 49.2 %–65.9 % less than UA, and the positive increase in ω of UA and GB with the inflow discharge could be expressed by a power function (Fig. 7d).
Figure 7Temporal changes in runoff shear stress and stream power of upstream area and gully bed and their relationships with inflow discharge.
3.2 Spatiotemporal change in energy consumption
Figure 8 illustrates the temporal change in the accumulated energy consumption of the upstream area (UA), gully head (GH), and gully bed (GB). The accumulated energy consumption of the three landform units continued to increase linearly with time (R2= 0.990–0.999; P < 0.01), and the accumulated energy consumption in GH was always the highest at any time, followed by UA and GB under five inflow discharges. Moreover, the energy consumption rate (the slope value of the fitted equation) in the three landform units is basically constant, indicating that the spatiotemporal change in energy consumption maintained a relatively steady state during gully headcut erosion. Moreover, the energy consumption rate of GH was the highest, followed by UA and GB, and the energy consumption rate in the three landform units also increased with the increase of inflow discharge.
The variations in the total energy consumption of UA, GH, and GB and their proportions with inflow discharge are shown in Fig. 9. As illustrated in Fig. 9a, the total energy consumption of both the UA-GH-GB system and the three landform units increased with the increase in inflow discharge. When inflow discharge increased from 3.0 to 7.2 m3 h−1, the total energy consumption of the system, and UA, GH, and GB, increased by 3.6 %–105.3 %, 3.4 %–62.0 %, 3.5 %–108.2 %, and 9.0 %–327.5 %, respectively. Regression analysis revealed that the energy consumption of the system and the three landform units increased with inflow discharge as an exponential function (; a= 1.14–55.41; b= 0.13–0.36; R2= 0.954–0.992; P < 0.05). Furthermore, in view of the proportion of energy consumption, the energy consumption of UA accounted for 15.6 %–19.8 % of the total energy consumption and linearly decreased as inflow discharge increased (R2= 0.933; P < 0.05), whereas the proportion in GB (2.8 %–5.8 %) linearly increased as inflow discharge increased (R2= 0.983; P < 0.05). However, the proportion of energy consumption (77.3 %–78.6 %) in GH showed a weak change with inflow discharge (Fig. 9b), signifying that most of the runoff energy (77.5 %, on average) was consumed in the gully head position during headcut migration. Furthermore, we found that the total energy consumption (129.89–266.60 kJ) under different flow discharge conditions accounted for the 91.12 %–99.90 % of total flow energy (Fig. 9c, d), which also indicated that only 0.10 %–8.88 % of total flow energy remained at the outlet of the UA-GH-GB system. These results fully implied that most of the flow energy (> 91.12 %) upstream from the gully heads would be consumed during gully erosion, of which the gully headcut erosion (including plunge pool erosion) is the main process consuming flow energy.
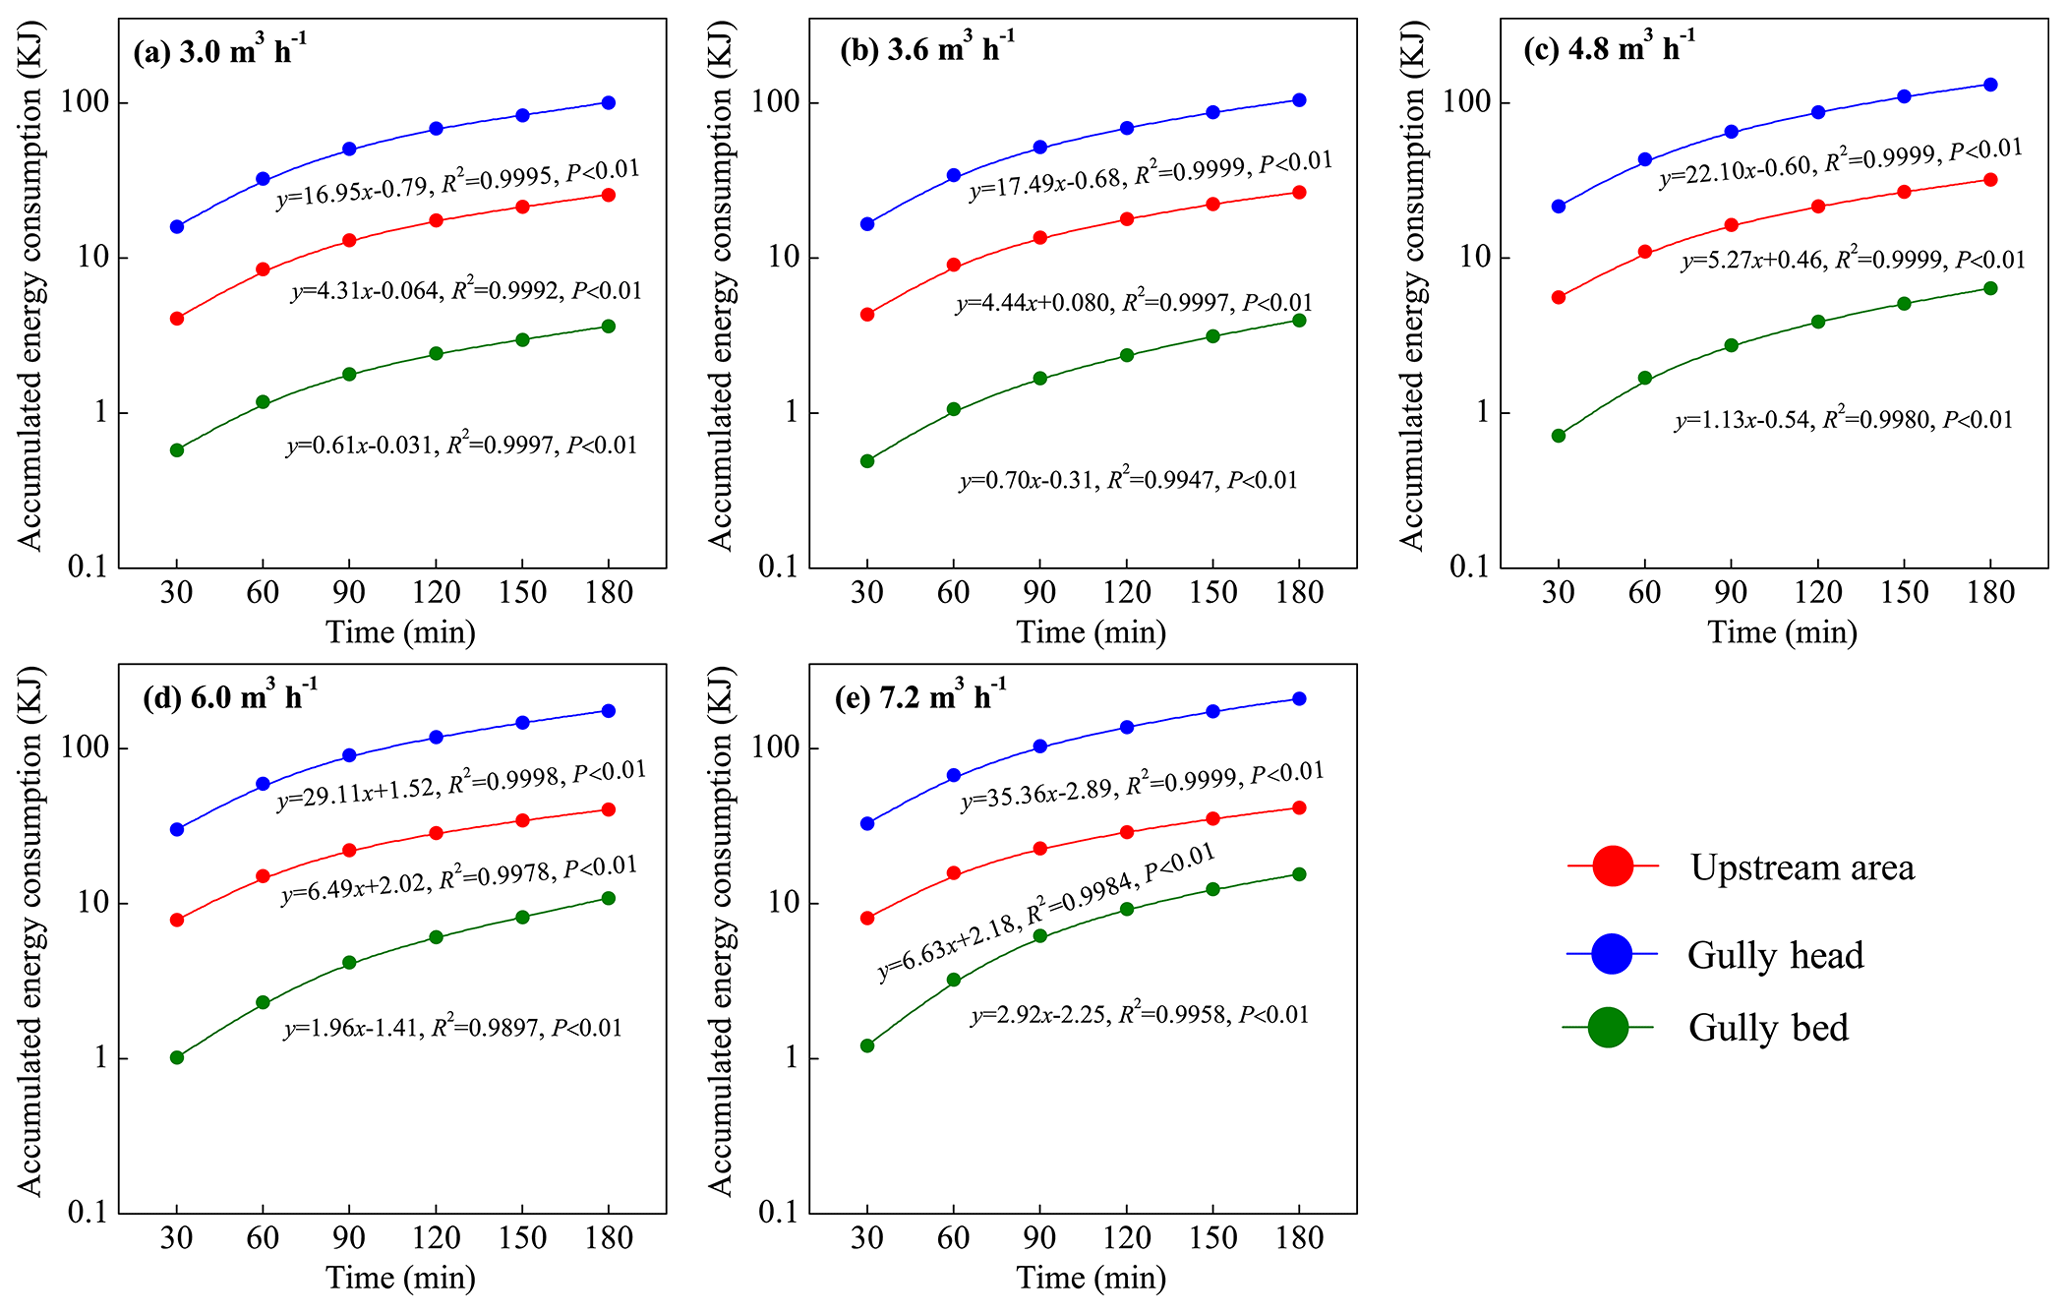
Figure 8Temporal changes in runoff energy consumption of the upstream area, gully head, and gully bed under different inflow discharge conditions.
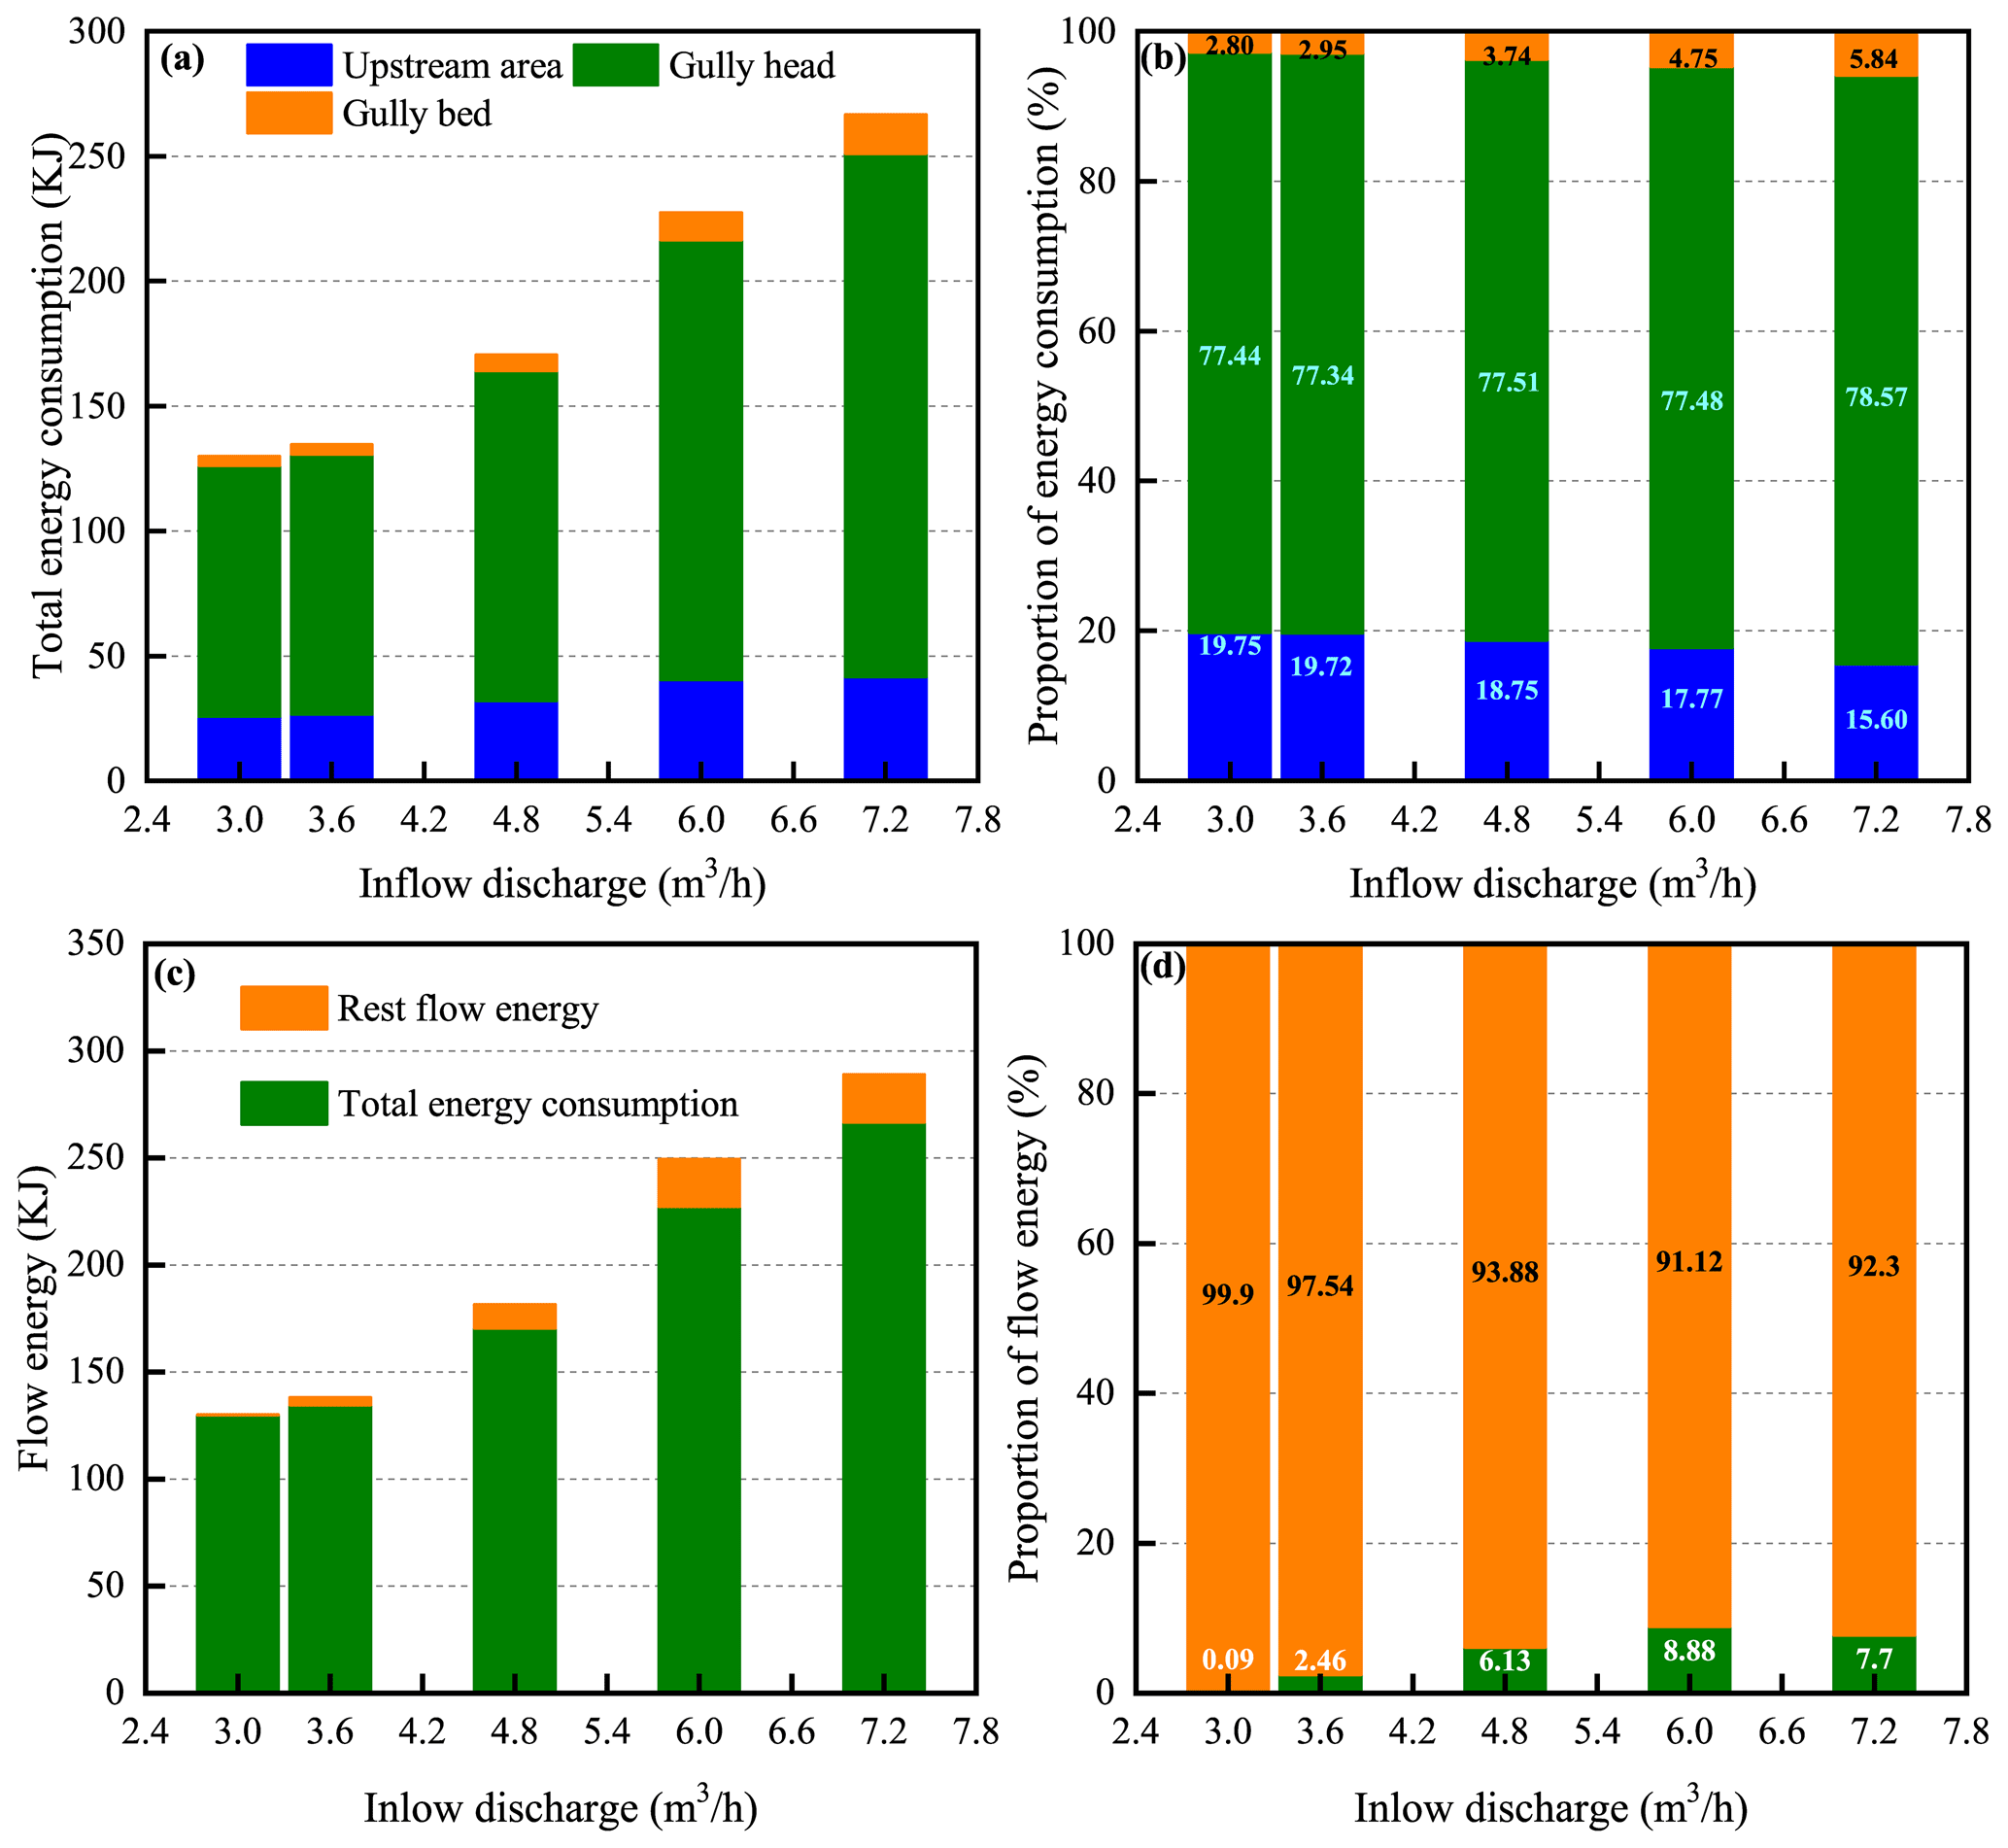
Figure 9Total energy consumption (a) and their proportions (b) of upstream area, gully head, and gully bed, and the total energy consumption and rest flow energy (c) and their proportions (d) under different inflow discharge conditions.
3.3 Spatiotemporal change of soil loss
3.3.1 Soil loss process
Figure 10a shows that the soil loss rate of the upstream area–gully head–gully bed (UA-GH-GB) system rose to a peak in first 20 min, then gradually descended and levelled off. Especially for the 6.0 and 7.2 m3 h−1, the soil loss rate showed a severe fluctuation trend in the first 30 min. The peak soil loss rate increased from 75.4 to 306.9 g s−1 with increasing inflow discharge. The soil loss of UA and GH experienced a similar change process. The soil loss rate was the highest in the early stage of the experiment, and gradually decreased with time, and became stable after 120 min (Fig. 10b, c). Furthermore, the temporal variation in soil loss of UA and GH could be well expressed by a logarithmic function (, P < 0.05; Table 3), and the a value (representing initial soil loss rate) and b value (reflecting the reduction rate of soil loss rate with time) increased with increasing inflow discharge, indicating that a larger inflow discharge can improve initial soil loss of UA and GH and also expedite the decrease in soil loss rate.
However, the GB presented a completely different soil loss process from UA and GH (Fig. 10d). The GB was always characterized by sediment deposition during the whole experiment for the 3.0–4.8 m3 h−1 inflow discharges. The sediment deposition rate gradually decreased with time and presented a significant S function over time (; R2= 0.918–0.982; P < 0.01; Table 3). When the inflow discharge was larger than 4.8 m3 h−1, the sediment generated from UA and GH was deposited firstly in the GB and then gradually transported, and the temporal change in deposited sediment on GB in accordance with logarithmic functions (R2= 0.936 and 0.906, P < 0.01; Table 3). Furthermore, two critical time points (135 and 111 min) can be derived from the two fitted logarithmic equations, which distinguished sediment deposition from sediment transport, signifying that the runoff began to transport the deposited sediment on the GB after 135 and 111 min for 6.0 and 7.2 m3 h−1 inflow discharges.
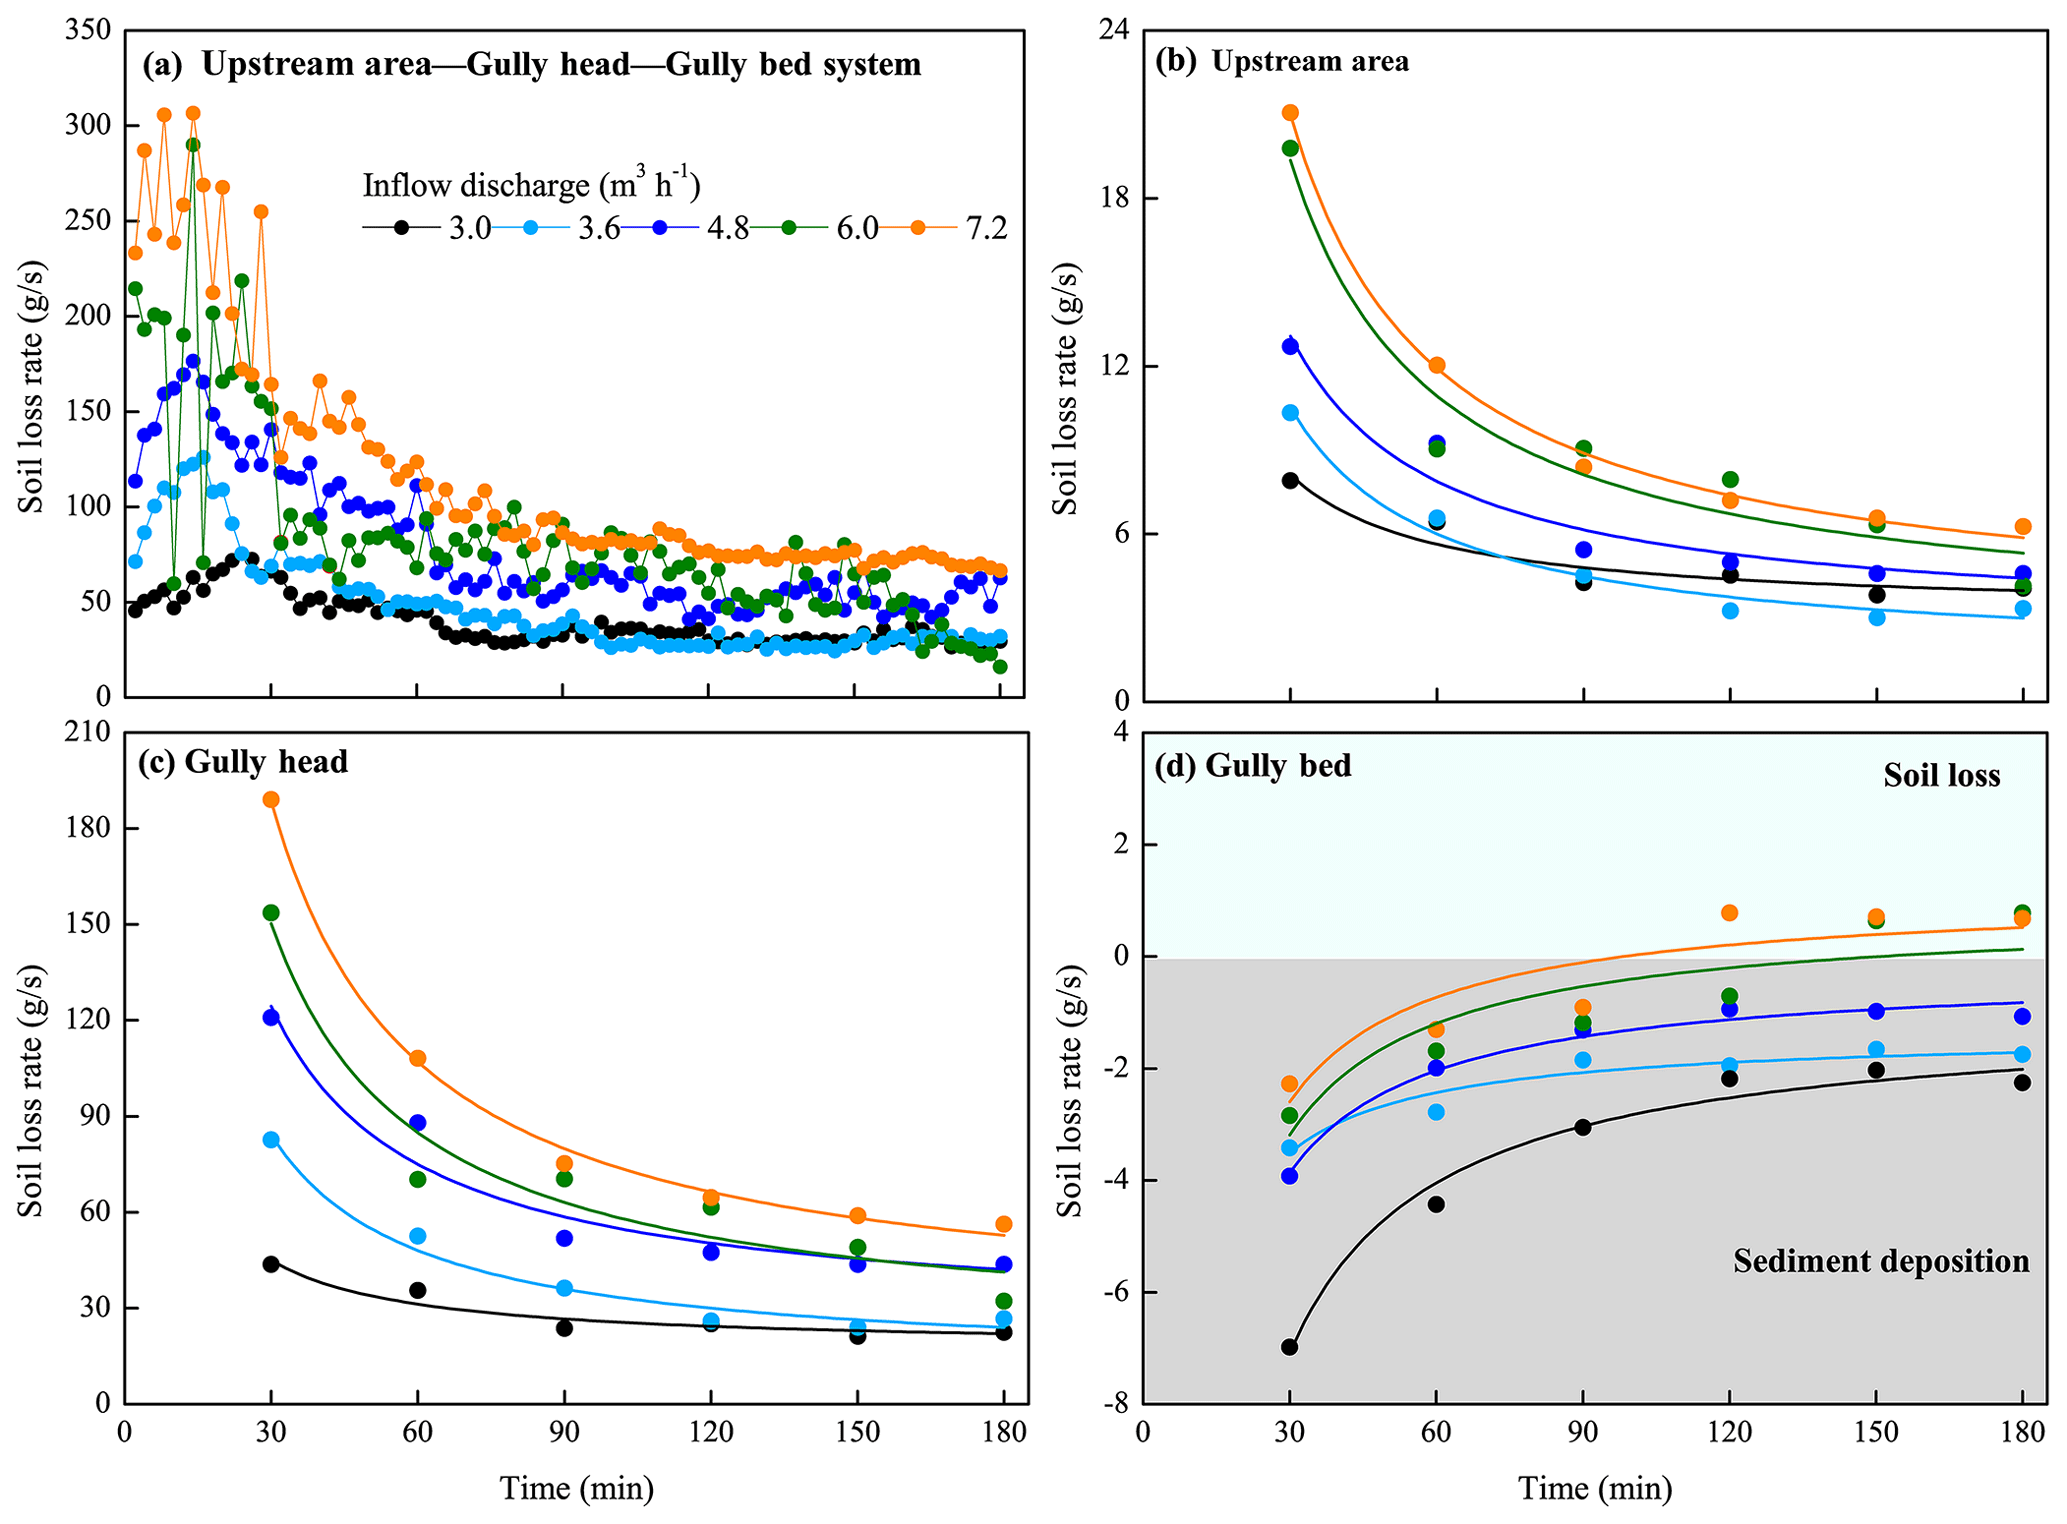
Figure 10Temporal variation in soil loss rate of the upstream area–gully head–gully bed system (a), upstream area (b), gully head (c), and gully bed (d).
Table 3Relationships between soil loss rate of three landform units and time.

Note: SL, SH, and SB are the soil loss rate of upstream area, gully head, and gully bed, respectively. The sample number is 6.0 for the fitting equations. The asterisks, * and , indicate that the fitted equation is at a significant level of 0.05 and 0.01, respectively.
3.3.2 Spatial distribution of soil loss
The variation in the soil loss amount and proportion of the three landform units (UA, GH, and GB) with inflow discharge is shown in Fig. 11. As illustrated in Fig. 11a, for the experiments of five inflow discharges, the soil loss was dominant in the UA and GH, but the GB was dominated by sediment deposition due to the weaker sediment transport capacity of runoff on GB than sediment deliverability of UA and GH. Furthermore, the soil loss amount of UA and GH ranged from 55.9 to 110.7 kg and from 310.0 to 994.8 kg, respectively, and increased linearly with increasing inflow discharge (R2= 0.966 and 0.969; P < 0.05). The sediment deposition amount of GB ranged from 4.2 to 37.7 kg and decreased with inflow discharge as a logarithmic function (R2= 0.961; P < 0.05). In terms of the proportion of soil loss (Fig. 11b), the proportion of UA and GH reached the maximum (15.3 %) and minimum (84.7 %), respectively, under 3.0 m3 h−1 inflow discharge, whereas the proportion exhibited a little change (UA – 9.5 %–11.4 %; GH – 88.6 %–90.5 %) when the inflow discharge is 7.2 m3 h−1. Remarkably, the proportion of deposited sediment amount on GB to total soil loss amount ranged from 0.4 % to 10.3 % and decreased exponentially with inflow discharge (R2= 0.992; P < 0.001).
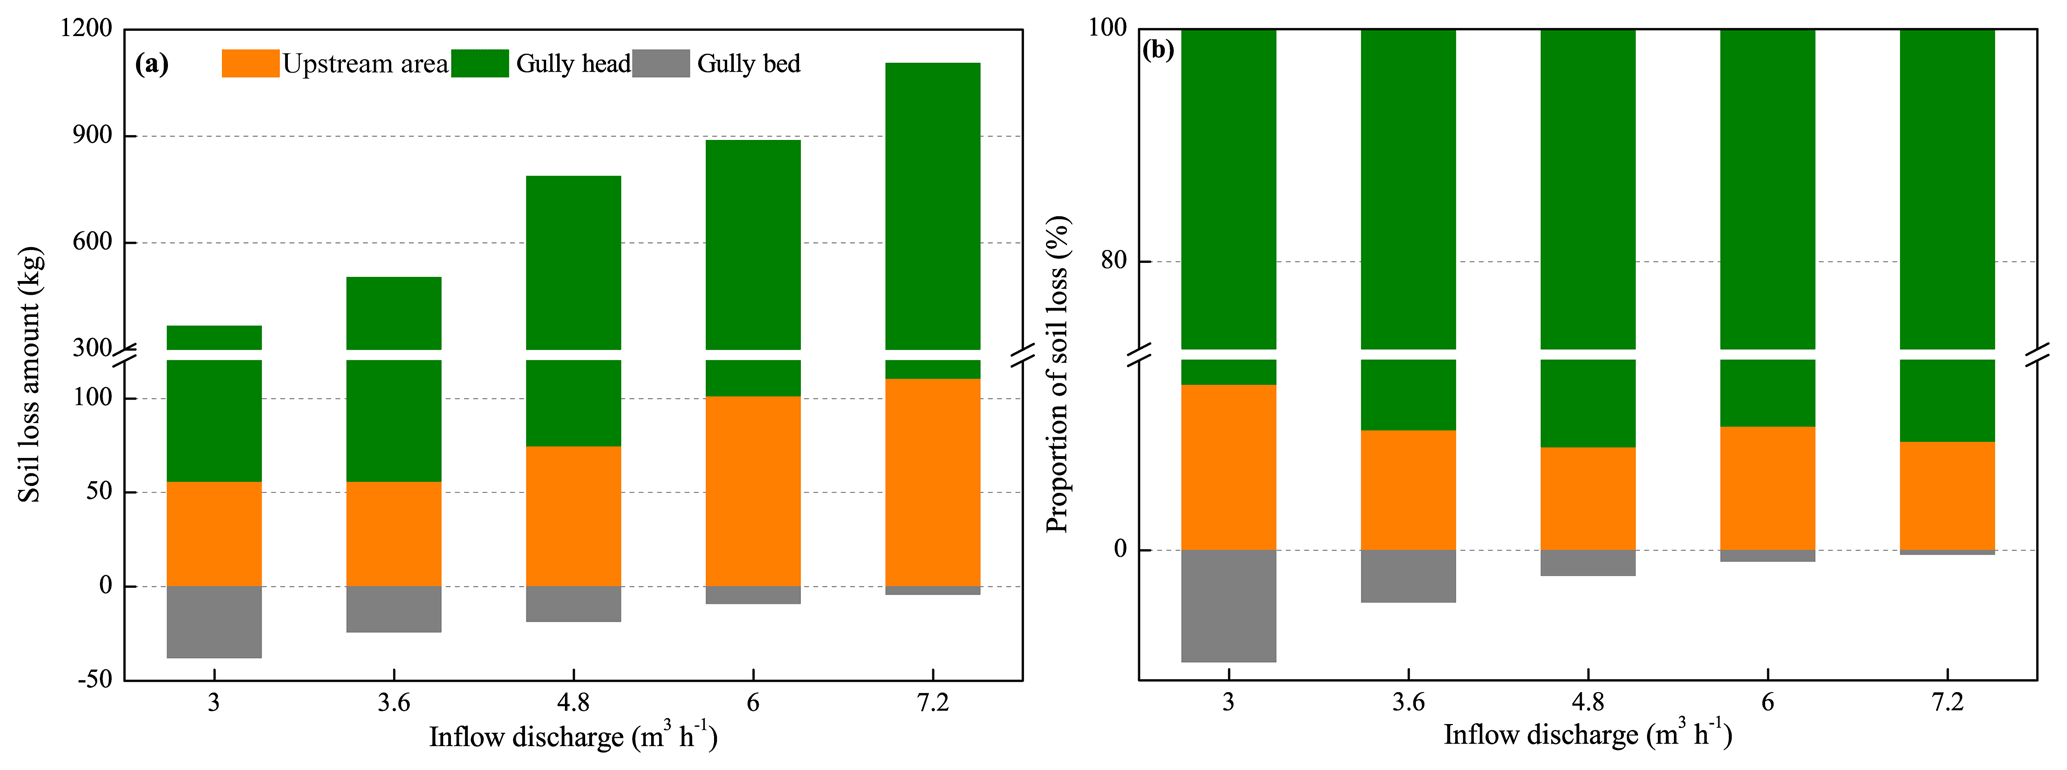
Figure 11Variation in soil loss amount (a) and proportion (b) of upstream area, gully head, and gully bed with inflow discharge.
3.4 Spatial change in hydrodynamic mechanism of soil loss
3.4.1 Relationships between soil loss and hydraulic parameters
Figure 12 indicates the significant difference in the relationships between soil loss rate and hydraulic parameters among the three landform units (Fig. 12). For the upstream area (UA), the soil loss rate could be described as a series of exponential functions of runoff velocity, Reynolds number, Froude number, runoff shear stress, and stream power, of which the runoff shear stress and stream power had a closer correlation with soil loss (Fig. 12a–e; R2= 0.830–0.945). Furthermore, the increased speed of the soil loss rate obviously increased with the increasing hydraulic parameters (except for runoff velocity), indicating that soil loss of UA showed a stronger sensitive response to increasing hydraulic properties. However, the soil loss rate of the gully bed (GB) linearly increased with the abovementioned five parameters (Fig. 12f–j; R2= 0.918–0.994), which suggested that the decreased rate of sediment deposition of GB is basically constant with the increasing hydraulic properties. Further analysis showed that the critical runoff velocity, Reynolds number, Froude number, runoff shear stress, and stream power for triggering the transformation of sediment deposition to soil erosion on GB, and the critical values are 0.26 m s−1, 2845, 0.85, and 6.94 Pa, and 0.40 W m−2, respectively. For the gully head (GH) position, the soil loss was significantly affected by jet velocity entry to the plunge pool and jet shear stress (Fig. 12l and m; R2= 0.862 and 0.939), while the relationship between soil loss and flow velocity at the headcut brinkpoint was not significant (Fig. 12k; P= 0.065).
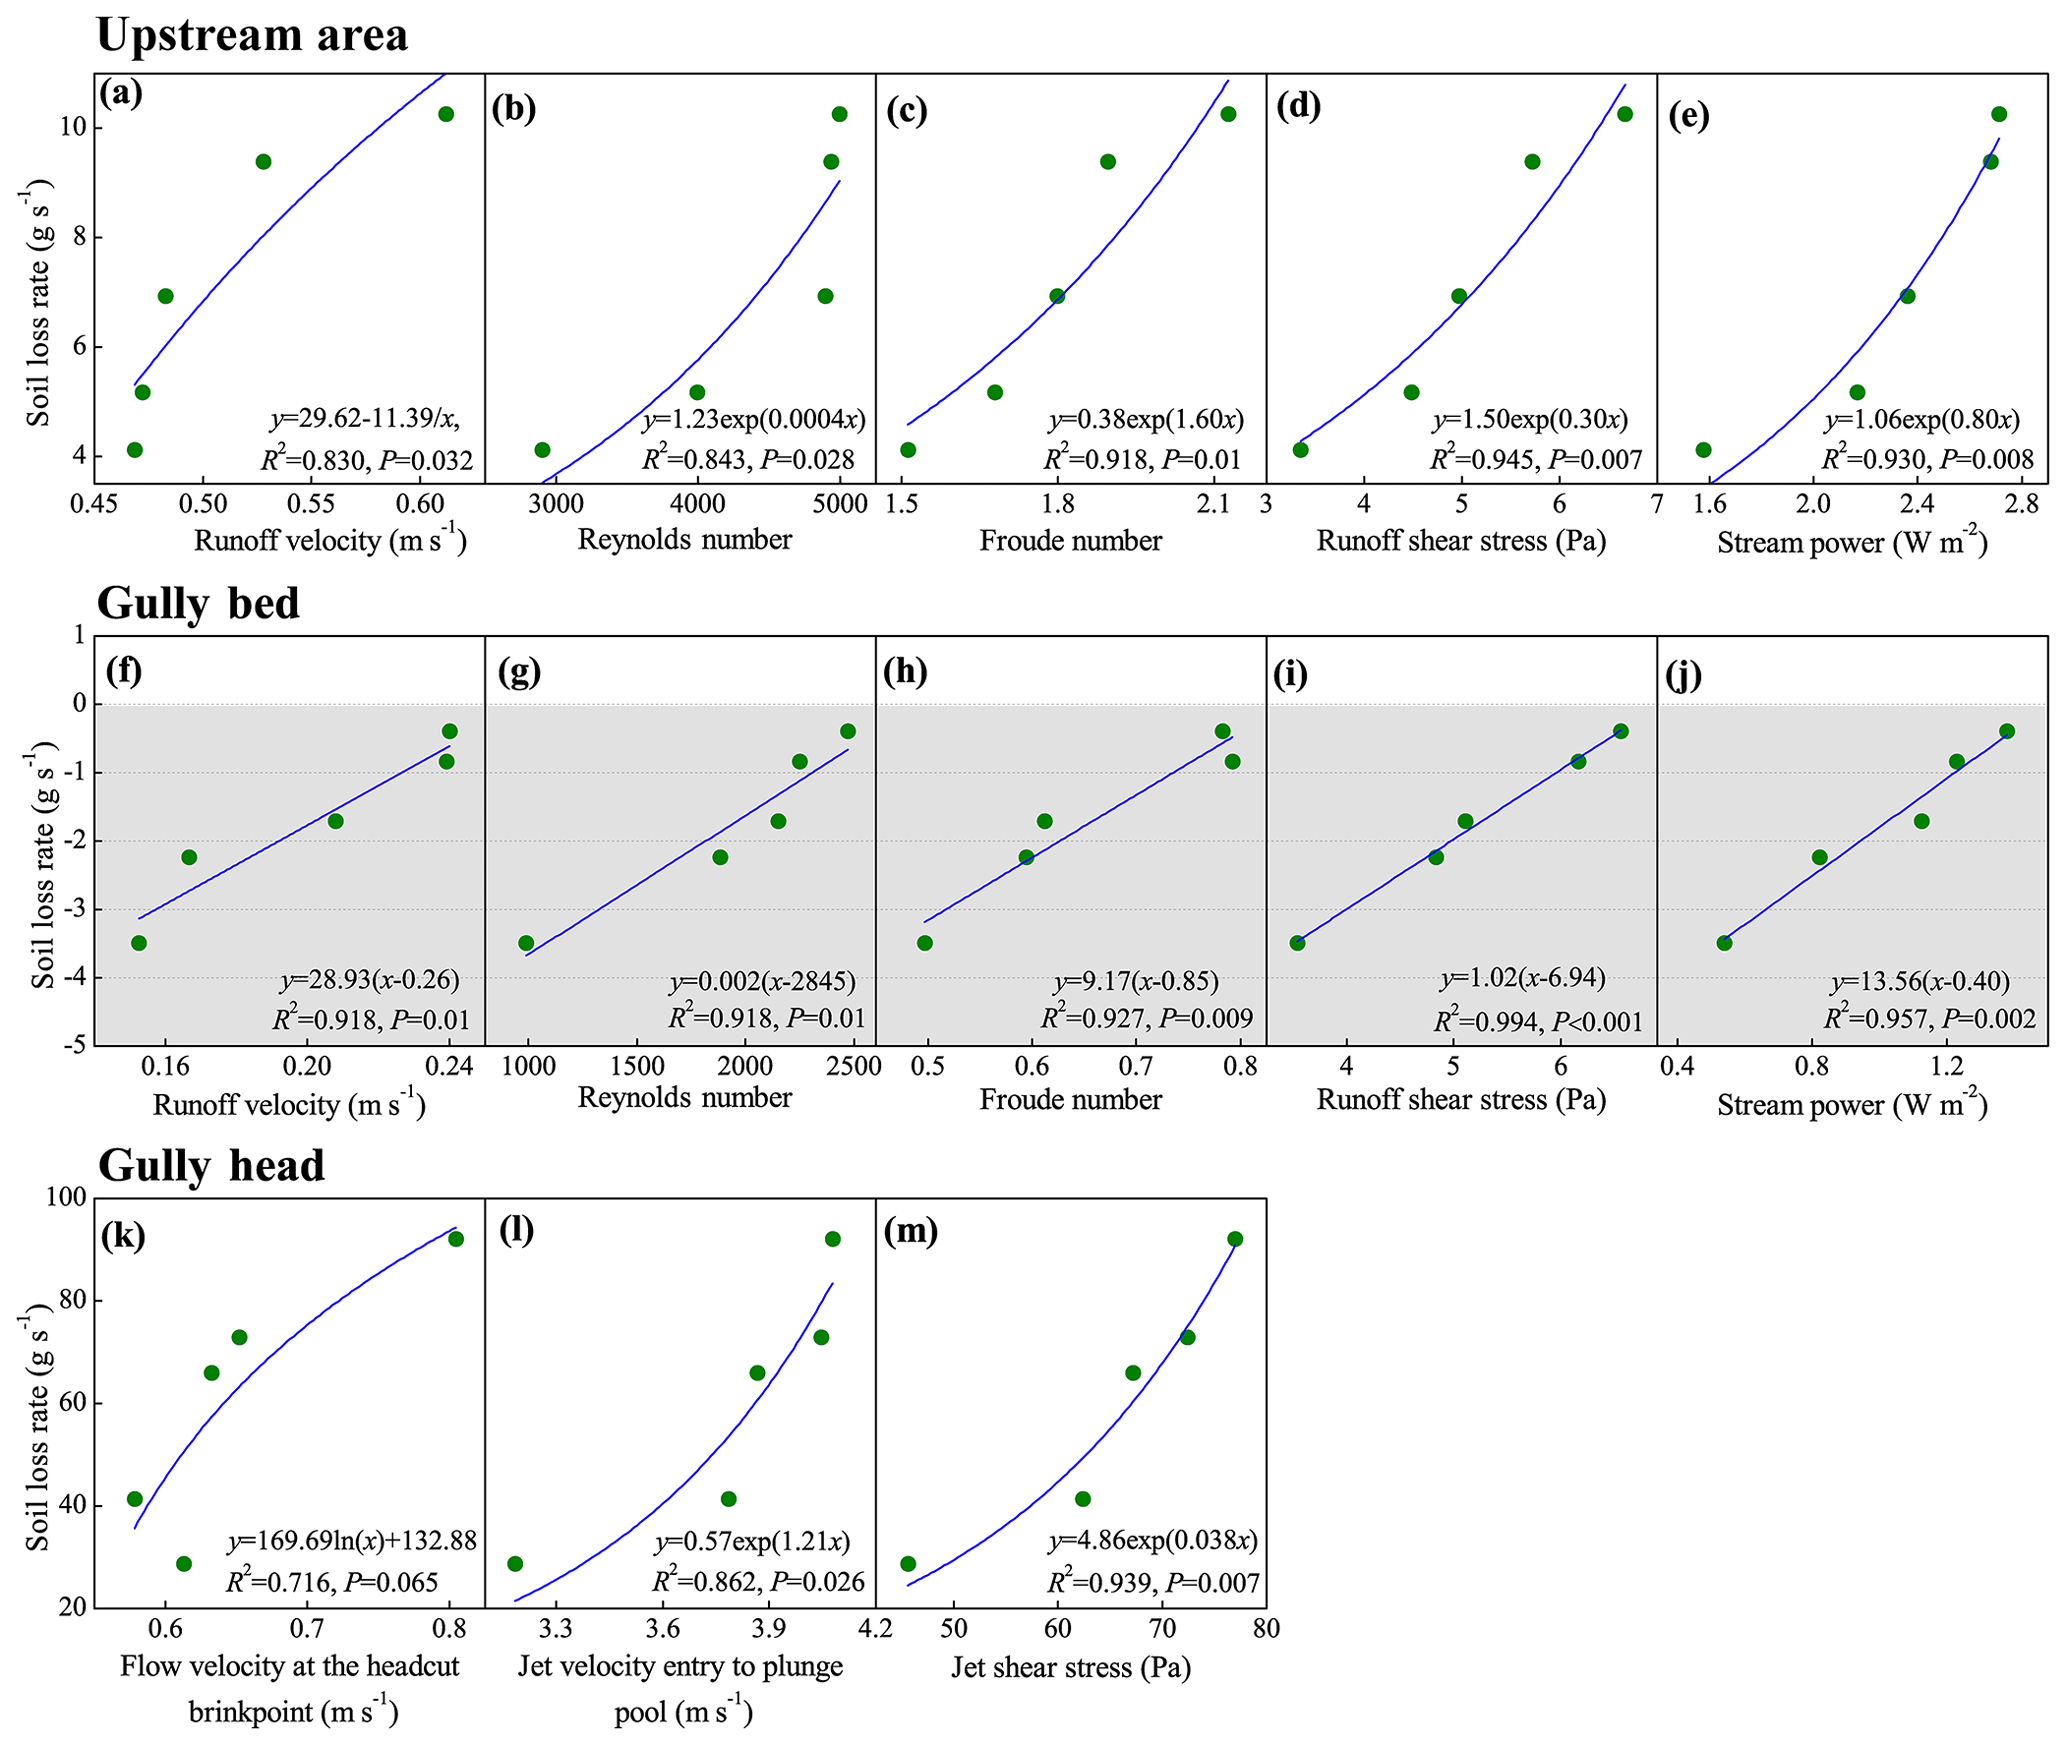
Figure 12Relationships between soil loss rate of upstream area, gully bed, and gully head and runoff hydraulic and jet properties.
3.4.2 Response of soil loss to energy consumption
The synchronous change in soil loss of the UA-GH-GB system and total energy consumption can be divided into two stages (Fig. 13). In the initial adjustment stage (0–40 min), the topsoil layer of UA had the relatively higher erodibility and was the main resource of soil loss, which caused the relatively lower flow velocity at the brinkpoint of the gully head. Therefore, most of the flow discharge was transformed to on-wall flow, so most of the flow energy was consumed at the headwall. So, in this stage, the UA and gully headwall are the main positions of soil loss, and most of the flow energy was also consumed in the two positions. With the gradual adjustment of the upstream area morphology, the gully erosion process entered into the relatively stable stage (40–180 min). In this stage, the flow velocity at the headcut obviously increased and showed a slight change (Fig. 4a); thus, the headwall erosion and plunge pool erosion also experienced a relatively stable process. As a result, the soil loss and flow energy consumption exhibited a similar change process. Occasionally, the occurrence of several gully head and bank collapse events altered the synchronous change process of soil loss and energy consumption.
As illustrated in Fig. 14, on average, the soil loss rate of the UA-GH-GB system and the three individual landform units was positively and significantly related to the energy consumption (P < 0.05), and a logarithmic function was found to fit the relationship between soil loss rate and energy consumption best (R2= 0.889–0.987). The critical energy consumption initiating the system is 7.53 J s−1 (Fig. 14a). Furthermore, there is critical energy consumption to initiate the soil erosion of the upstream area (UA) and gully head (GH) based on the fitted logarithmic functions (Fig. 14b, c). The critical energy consumption for GH (5.79 J s−1) is 2.57 times greater than that (1.62 J s−1) of the UA. Similarly, for the gully bed (Fig. 14d), the minimum energy consumption (1.64 J s−1) is needed to trigger the transformation of sediment deposition to soil loss. We found that the sum of critical energy consumption initiating three landform units (9.05 J s−1) was larger than the critical value initiating the system, which was mainly attributed to the mass failure of the gully head and bank inputting additional potential energy into the flow.
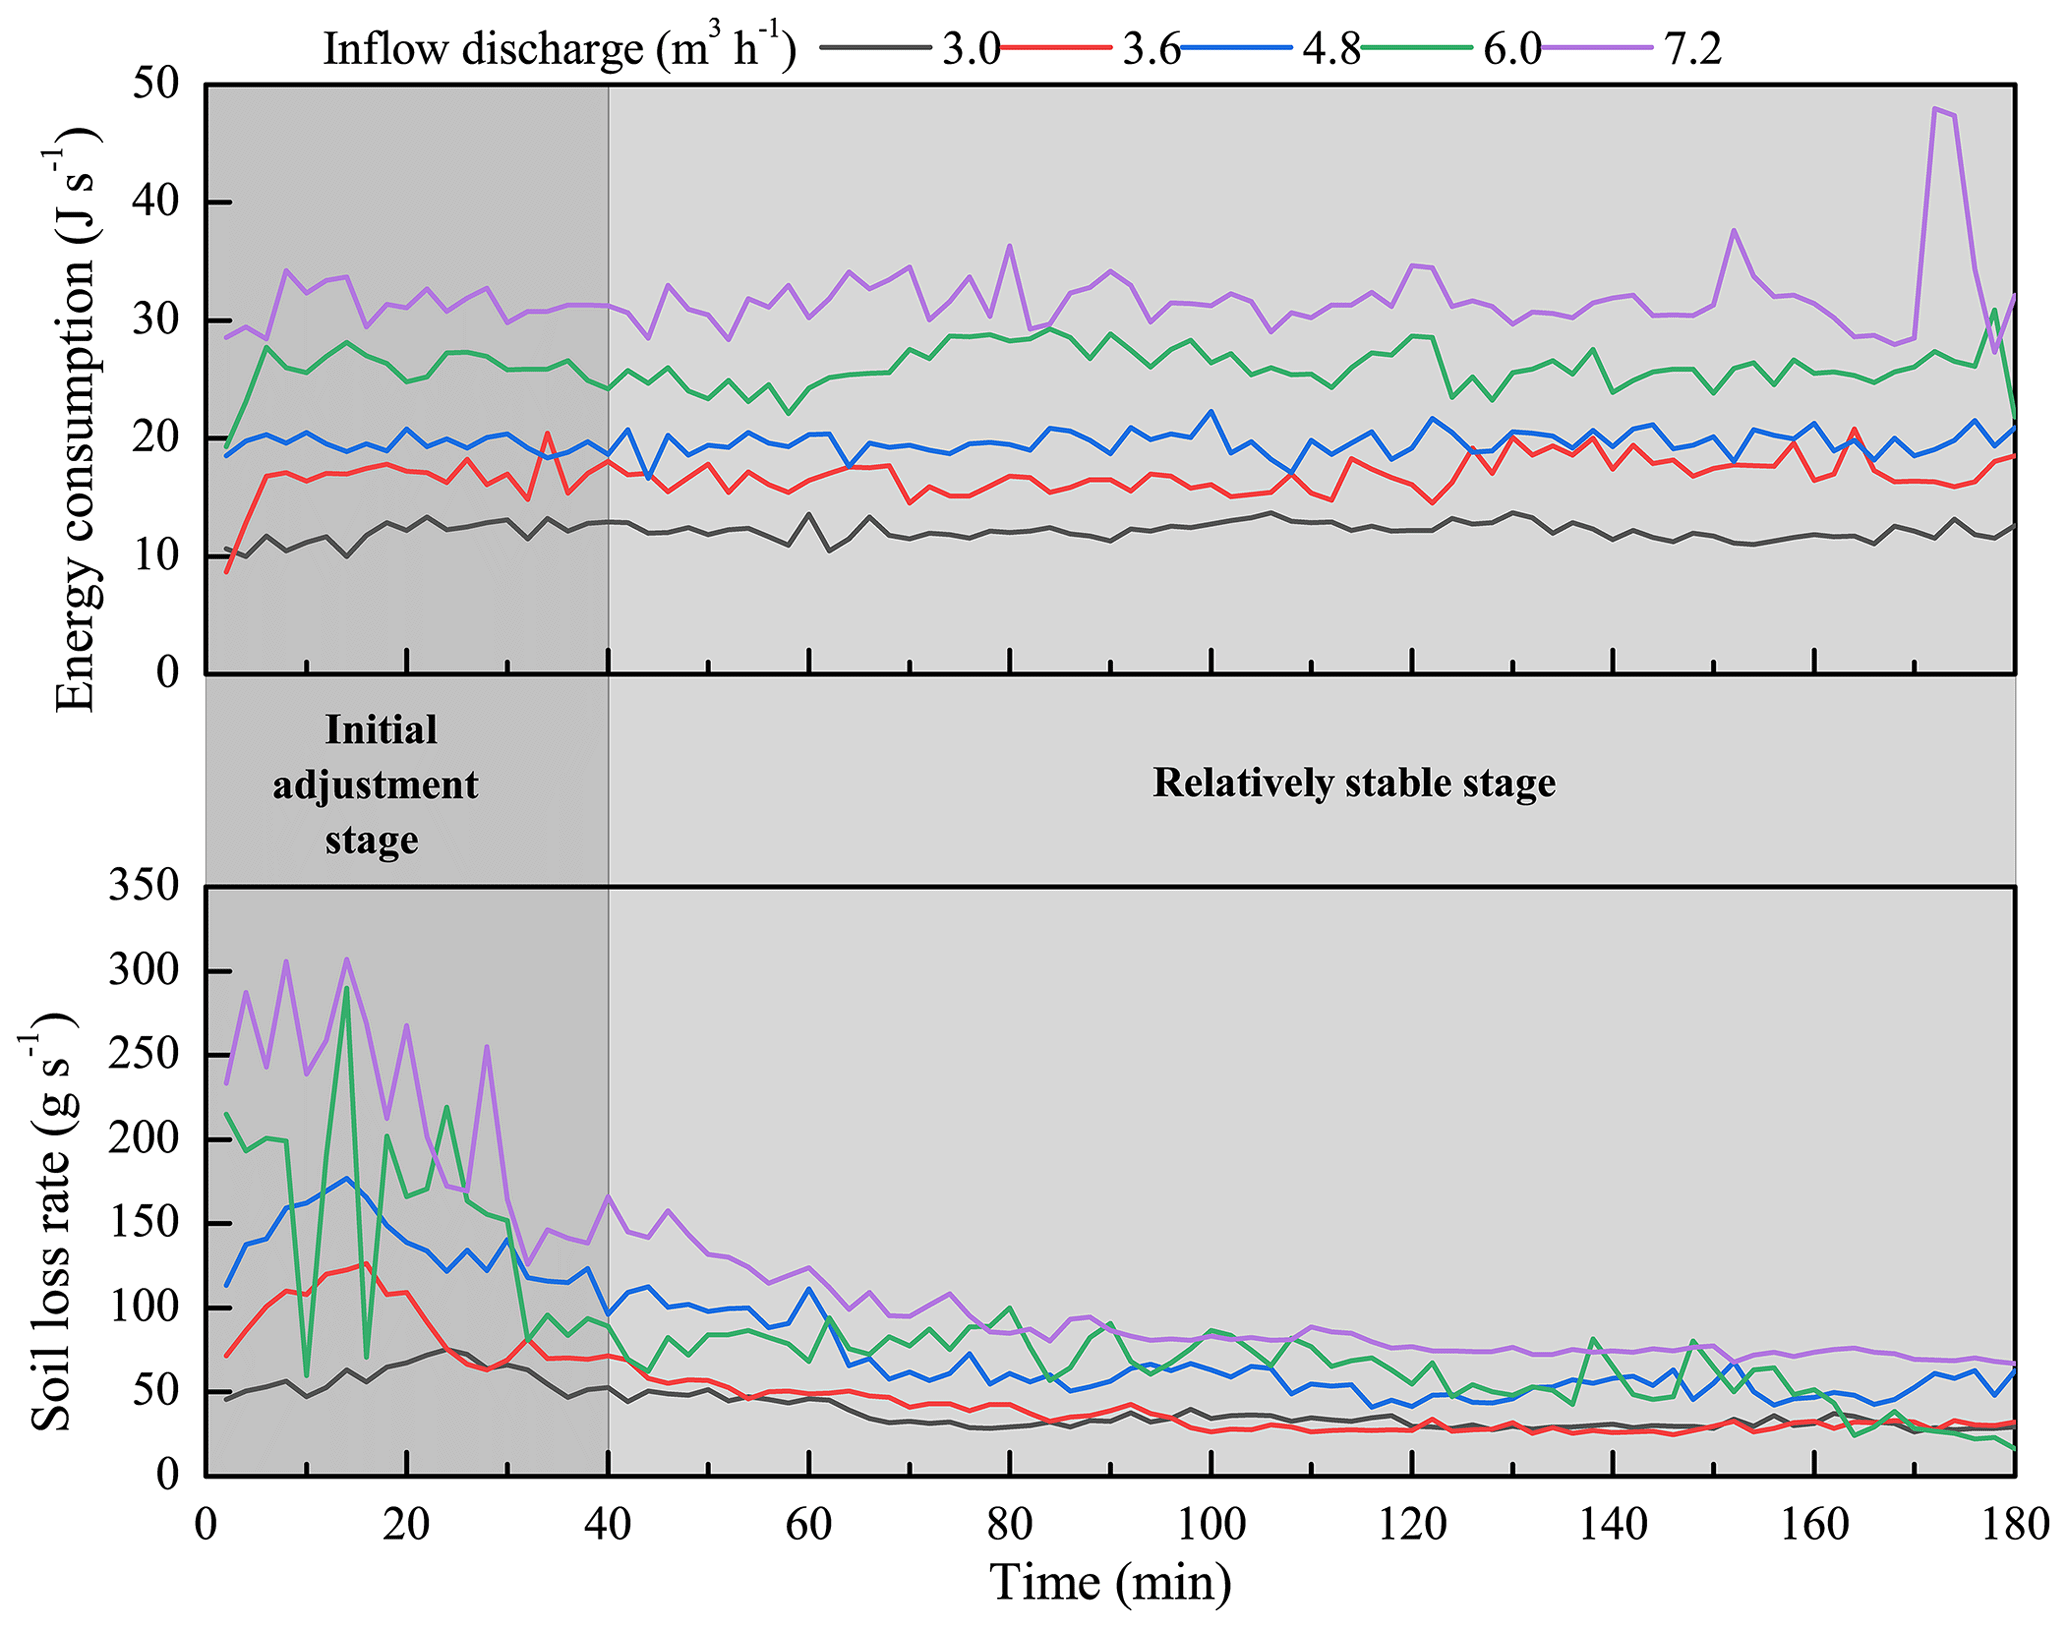
Figure 13Synchronous change in soil loss rate of the upstream area–gully head–gully bed system and total energy dissipation during headcut erosion.
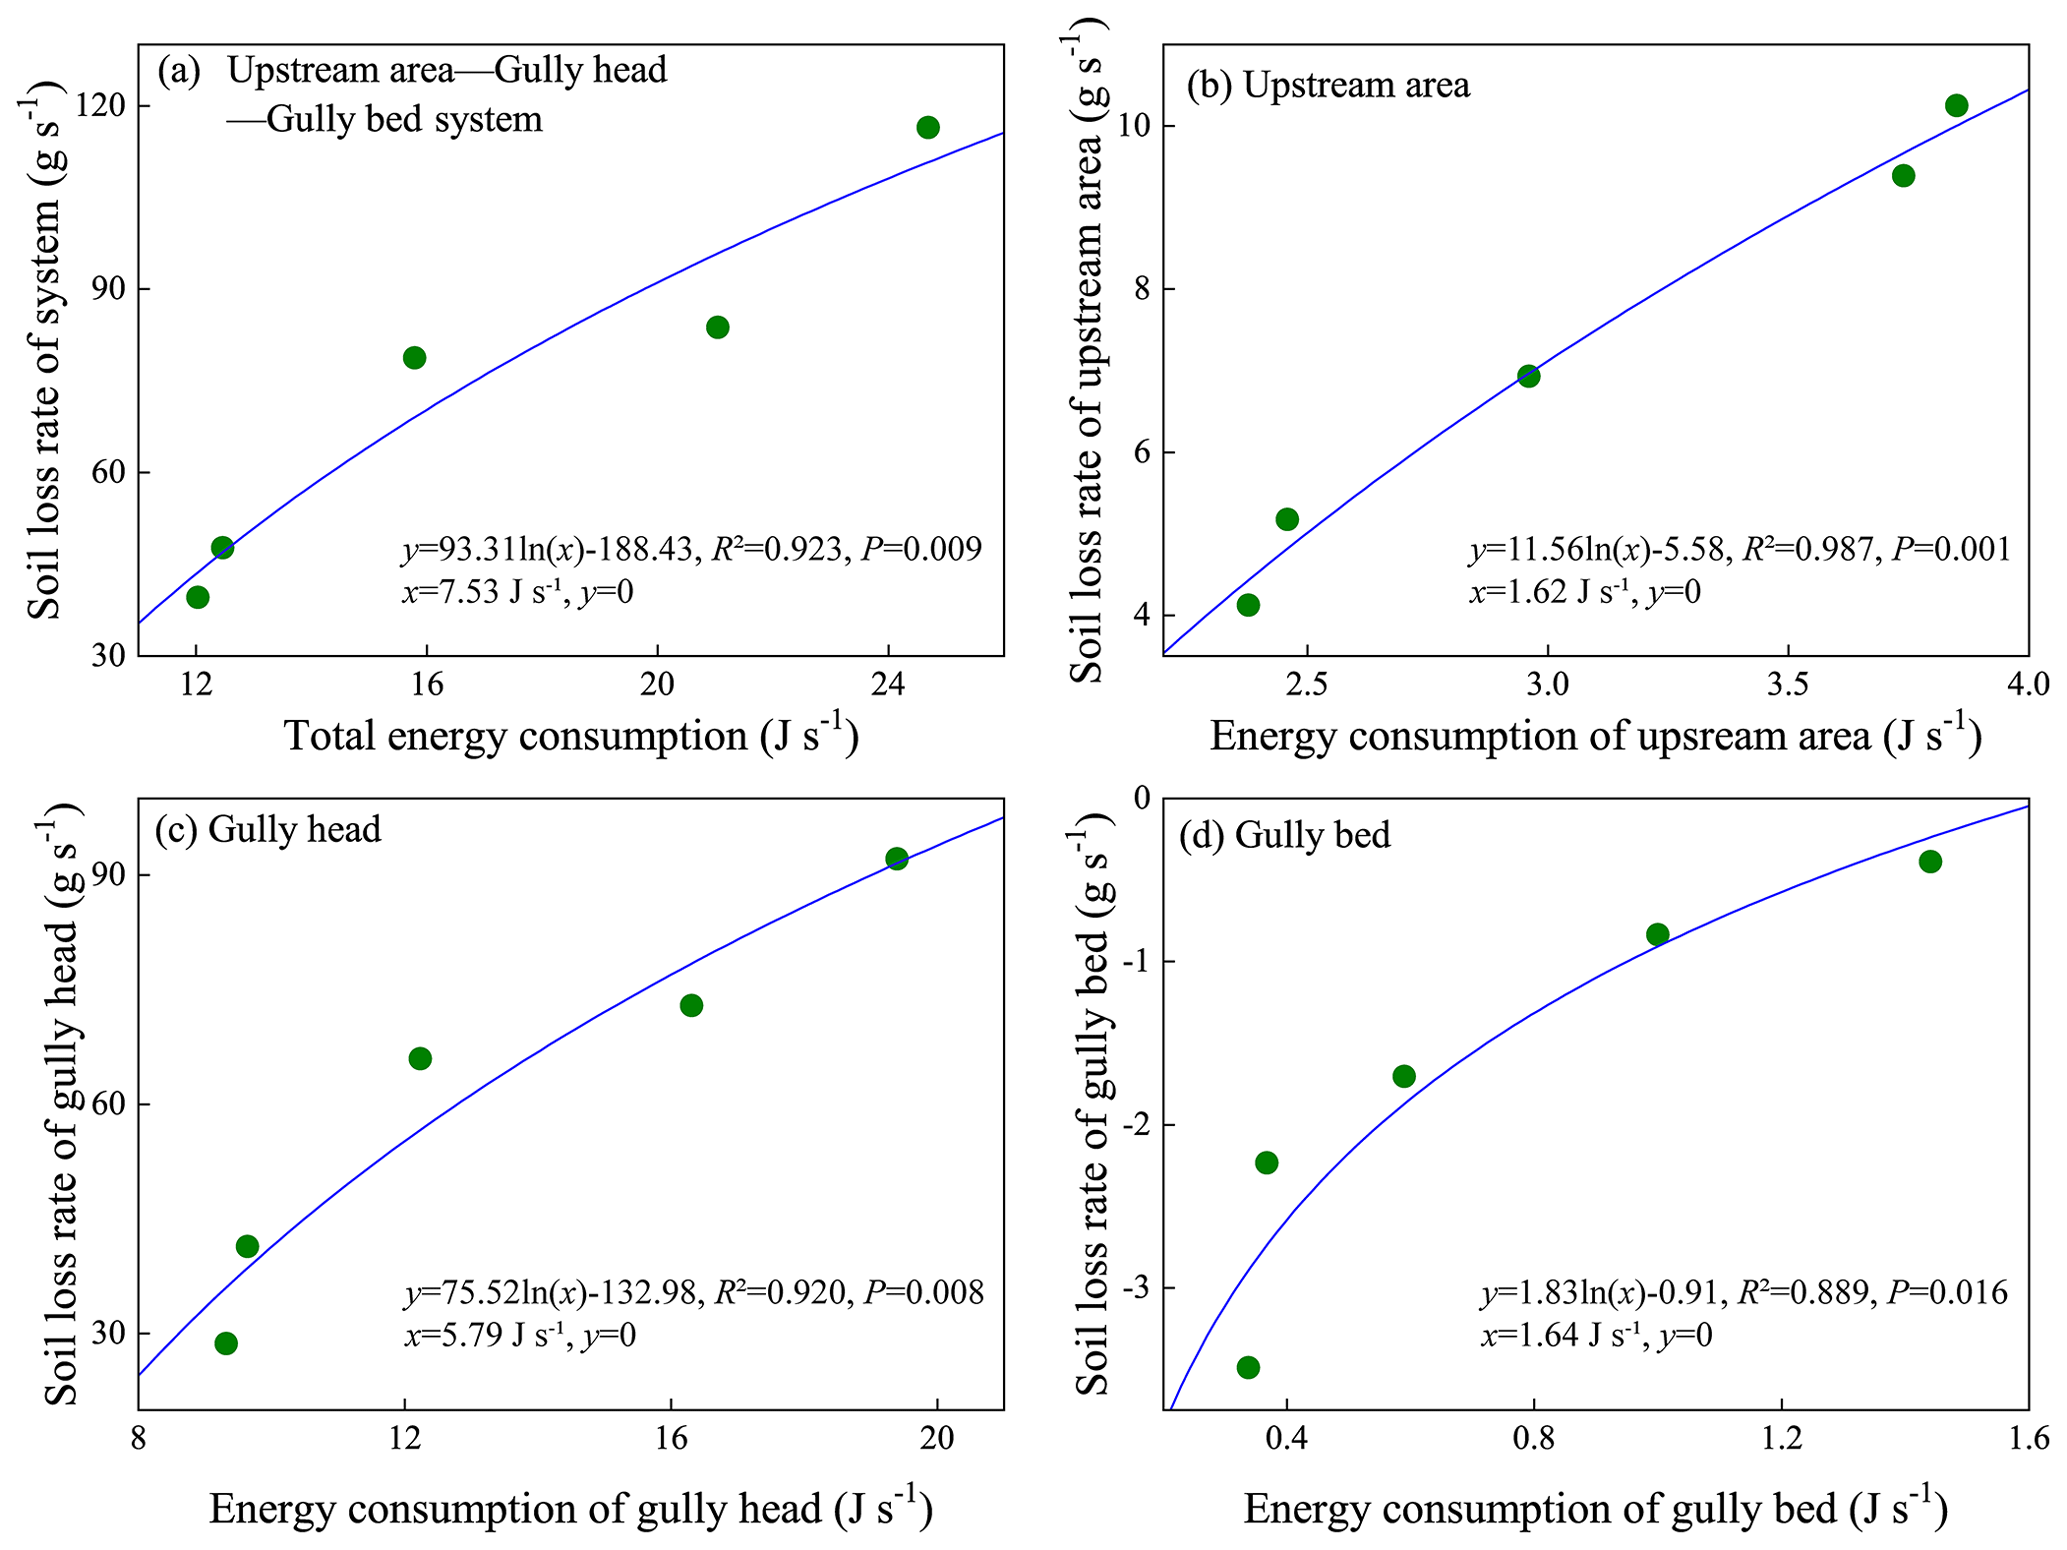
Figure 14Relationships between the soil loss rate and energy consumption of the upstream area–gully head–gully bed system (a), upstream area (b), gully head (c), and gully bed (d).
4.1 Spatiotemporal changes in hydraulic properties
This study showed that the runoff velocity at the headcut brinkpoint (Vb) firstly raised and then gradually stabilized with the experimental duration (Fig. 4a), which closely corresponded to the gradually decreasing runoff width on the upstream area over time (Shi et al., 2020a). However, this result was inconsistent with Zhang et al. (2016, 2018) and Shi et al. (2020b), who reported that the Vb decreased over time, which was mainly due to the gradually increasing roughness and resistance of the underlying surface over time, reducing the runoff velocity in their studies (Battany and Grismer, 2015; Su et al., 2015). The further analysis of the power function between Vb and time (Vb= a⋅tb; Table 1) showed that the a value increased but the b value showed a weak variation with the inflow as discharge increased, indicating that upstream flow discharge can improve initial Vb but not affect its change trend over time. Therefore, we can extrapolate the erosion process and the rule of upstream area from this simulation test to the actual ground situation. By contrast, the jet velocity entry to the plunge pool (Ve) and jet shear stress (τj) experienced a gradually decreasing process (Fig. 4c, e), which was mainly attributed to the fact that the development of several additional headcut steps caused more energy consumption in plunge pools, and the lower potential energy at the headcut brinkpoint was due to the shortened jet flow height (Guo et al., 2019; Jiang et al., 2020). This result, however, differed from the finding of Zhang et al. (2016), who stated that the Ve and τj remained stable as the experiments progressed, which was mainly attributed to the weak change of jet flow height induced by slow headcut retreat. This comparison means that the jet flow properties were strongly determined by the headcut retreat process.
For the runoff hydraulic of upstream area (UA) and gully bed (GB), the Reynolds number Re of UA and GB initially increased and gradually stabilized, but the Froude number Fr showed an opposite trend. This phenomenon was in agreement with previous studies (e.g., Su et al., 2015; Zhang et al., 2016). Besides, the Re and Fr of UA were larger than that of GB by 50.5 %–65.9 % and 1.39–2.04 times, respectively, under same inflow discharge upstream gully head, indicating that the runoff turbulence became weaker after the runoff of UA passed the gully head and experienced plunge pool erosion (Shi et al., 2020a). More evidently, the runoff on UA was in the supercritical transition and supercritical turbulent flow regime (Re > 500, Fr > 1), whereas the runoff on GB belonged to subcritical transition and subcritical turbulent flow regime (Re > 500, Fr < 1). However, Su et al. (2015) found that the steady state Re of gully bed was higher than that of the upstream area, which was mainly attributed to the difference in slope gradient. In their study, the larger gully bed slope gradient compared to the upstream area would accelerate the runoff velocity and, thus, enhance flow turbulence (Bennett, 1999; Pan et al., 2016). Furthermore, compared to UA, the τ and ω of GB increased and decreased by 2.8 %–15.7 % and 49.2 %–65.9 %, respectively. The increased shear stress was caused by the decrease in flow velocity on the gully bed, and the drastically decreased stream power can reflect the energy consumption of flow for transporting sediment on the gully bed. This result was different from some previous experimental studies on the gully and bank gully under different conditions. Previous studies have proven that lots of factors including plunge pool size, slope gradient, initial step height, and soil texture influenced the hydraulic properties from the upstream area to gully bed (Bennett and Casalí, 2001; Wells et al., 2009a, b).
4.2 Spatiotemporal change in runoff energy consumption and soil erosion
Our study revealed that the accumulated runoff energy consumption of the upstream area (UA), gully headcut (GH), and gully bed (GB) linearly increased over time (Fig. 8), indicating that the spatiotemporal change in energy consumption maintained a relatively steady state during gully headcut erosion. However, the flow energy consumption of the bank gully in three landform units logarithmically increased over time (Su et al., 2015). This difference further manifested that the runoff energy consumption of different landform units depends on gully type, to some extent, and soil texture, slope, and headwall height (Wells et al., 2009a). Besides, under these flow discharge conditions, the proportion of energy consumption to the total flow energy ranged from 91.12 % to 99.90 %, indicating that almost all of the flow energy was consumed during headcut erosion. Furthermore, the proportion of energy consumption in UA, GH, and GB was 15.6 %–19.8 %, 77.3 %–78.6 %, and 2.8 %–5.8 %, respectively (Fig. 9), which was also indirectly supported by the study of Su et al. (2015), who suggested that the runoff energy consumption per unit soil loss from upstream area, headcut, and gully bed is 17.4 %, 70.5 %, and 12.0 %, respectively. This further signified that the gully head consumed most of the runoff energy (77.5 %, on average) during headcut migration. The flow energy must be consumed to surmount the soil resistance as headcut migrates, and the consumed energy was mainly focused on the headwall and plunge pool development (Alonso et al., 2002).
In terms of soil loss, our study indicated that the soil loss rate of the UA-GH-GB system initially increased to the peak value and then gradually declined and stabilized (Fig. 10), which was consistent with the results of many studies on rill and gully headcut erosion under different conditions (slope, initial step height, flow discharge, soil type, and soil stratification; Bennett, 1999; Bennett and Casalí, 2001; Gordon et al., 2007; Wells et al., 2009a; Shi et al., 2020a). Both the scour depth and sediment production increased in the initial period of underlying surface adjustment, while, once the plunge pool development was maintained, the sediment yield decreased and gradually stabilized (Bennett et al., 2000). In addition, the significant difference in the soil loss process was found among the three landform units. The soil loss of UA and GH decreased logarithmically over time, which was similar with several studies (e.g., Su et al., 2015; Shi et al., 2020b). Nevertheless, the GB was always characterized by the sediment deposition for the inflow discharge of < 4.8 m3 h−1, whereas the sediment was deposited firstly and then gradually transported as the inflow discharge increased to 6.0 and 7.2 m3 h−1. Similar phenomena were also found in some previous studies on rill headcut erosion (Bennett, 1999; Bennett and Casalí, 2001; Gordon et al., 2007; Wells et al., 2009a). This further indicated that the soil loss/deposition process of the gully system was significantly influenced by three landform units and especially by most of the flow energy (77.5 %) being consumed at gully heads, due to jet flow erosion strongly weakening the sediment transport capacity of flow on the gully bed and, thus, changing the soil loss/deposition process of gully system. However, Su et al. (2014, 2015) revealed a larger soil loss volume or soil loss rate in the gully bed than in the upstream area and headwall during the bank gully headcut erosion. This difference between our study and Su et al. (2014, 2015) is primarily caused by the difference in slope gradient. The gully bed slope (20∘) of the bank gully was larger than that (3∘) of our study, indicating that the runoff on the gully bed of the bank gully had stronger sediment transport capacity (Zhang et al., 2009; Ali et al., 2013; Wu et al., 2016, 2018). Besides, some previous research also proved that the soil type, surface roughness, slope length, and groundwater/surface runoff were the main factors influencing soil loss by gully erosion (Amare et al., 2021; Li et al., 2021). In view of the proportion of soil loss, the proportion of UA and GH was 9.5 %–11.4 % and 88.6 %–90.5 %, respectively, of which the proportion of deposited sediment on GB to the sediment yield from UA and GH can reach up to 0.4 %–10.3 %. This result fully demonstrated that the gully head is the main source of the sediment production during gully headcut erosion (Oostwoud-Wijdenes and Bryan, 1994; Zhao, 1994; Su et al., 2014) and also manifested the necessity and importance of gully headcut erosion controlling in gully-dominated regions (Amare et al., 2019).
4.3 Hydrodynamic characteristics of headcut erosion
The significantly different relationships between soil loss and jet or hydraulic characteristics were found among UA, GH, and GB. The soil loss rate of UA exponentially increased with five hydraulic parameters (runoff velocity, Reynolds number, Froude number, runoff shear stress, and stream power), indicating that soil loss of UA showed a stronger sensitive response to increasing hydraulic properties. This could be attributed to the frequent bank collapse on UA accelerating soil loss (Wells et al., 2013; Qin et al., 2018). However, the sediment deposition rate of GB linearly decreased with the five hydraulic parameters, signifying that sediment deposition on GB decreased at a stable state with the increase in hydraulic parameters. Therefore, the sediment deposition rate would reach zero when the five hydraulic parameters increased to the critical values, implying that the transformation of sediment deposition to sediment transport on GB would be triggered. Furthermore, the shear stress is the optimal parameter describing the soil loss process of UA and GB, which differed from some studies on hillslope/gully erosion hydrodynamic characteristics (Zhang et al., 2009; Shen et al., 2018; Ma et al., 2020; Sidorchuk, 2020). Most studies have verified that stream power is the superior hydrodynamic parameter describing the soil detachment process. This comparison also fully illustrated the great difference in hydrodynamic characteristics between hillslope erosion and headcut erosion. In this study, the soil loss of gully head (including plunge pool erosion) was significantly affected by jet properties. It is confirmed that the plunge pool erosion by jet flow becomes a crucial process controlling gully head migration and sediment production (Oostwoud-Wijdenes et al., 2000). Consequently, the plunge pool erosion theory is usually employed to build several headcut retreat models (Alonso et al., 2002; Campo-Bescós et al., 2013). Although the correlation between the soil loss of gully head and flow velocity at headcut breakpoint is weak, the larger flow velocity resulting from increased inflow discharge would improve the shear stress of jet flow impinging the gully bed, and thus, the gully headcut would suffered stronger incisional erosion of the plunge pool. However, in fact, the soil loss of the gully head was also affected by on-wall flow erosion (Chen et al., 2013; Guo et al., 2021a); thus, more studies should be conducted to clarify the effect of on-wall flow properties on headwall erosion.
From the energy consumption perspective, the soil loss rate of the three landform units significantly and logarithmically increased with the energy consumption, and the similar change trend was also found in the study of Su et al. (2015). This finding suggests that energy consumption could be considered as being the available parameter for estimating the soil loss of the gully headcut erosion (Shi et al., 2020b). Furthermore, we found the critical energy consumption initiating the soil erosion of UA, GH, and GB are 1.62, 5.79 and 1.64 J s−1, respectively, indicating the soil loss of the gully head (including the plunge pool) needs more flow energy consumption (Zhang et al., 2018; Shi et al., 2020a, b). This phenomenon can be attributed to the fact that the more runoff energy was consumed at the gully headwall and plunge pool erosion than UA and GB and, thus, resulted in more severe soil loss during headcut erosion. In addition, we found that the critical energy consumption activating the soil loss of UA-GH-GB system was lower than the sum of the critical energy consumption initiating soil loss and sediment transport of three landform units (9.05 J s−1). This result was closely related to mass failures, such as gully head and gully bank collapse, and can contribute the additional energy into the flow. So, the role of gravitational erosion in controlling the gully erosion process should be clarified in future studies.
Gully erosion has been studied for nearly a century, but its process and dynamic mechanism are still difficult to clearly understand and reveal. Given this, our study attempted to clarify the spatiotemporal changes in flow hydraulic characteristics, energy consumption, and soil loss and expound the response of soil loss to runoff properties and energy consumption during headcut erosion through a series of simulation experiments under controlled conditions. These results could be extended to wider conditions, such as gully scale and flow discharge determined by rainfall and drainage area, which can promote the understanding of the process and mechanism of gully erosion under real ground conditions, as well as the modeling and prediction of gully erosion. Especially the variation and proportion of energy consumption along UA-GH-GB in the process of gully erosion and its influence on sediment yield were clearly elucidated in this study, which has an important guiding significance for gully erosion control practice and restoration efforts. We can design some engineering and/or vegetation measures at gully heads to pre-consume the most flow energy, and the energy dissipation structures could be designed and installed at the position where the plunge pool develops. Also, the appropriate size of these measures can also be determined to ensure that the flow energy of different landform units is lower than the corresponding critical energy consumption.
However, there are some potential limitations in our study. First, considering the complex effects of lots of factors on gully erosion, the flow discharge upstream gully heads was designed as the core factor affecting gully erosion in our study, and the five levels of flow discharge were generated according to the rainfall, landform, and gully morphology. But it is not really the same as the actual ground situations, e.g., the flow discharge upstream gully heads would not be constant during a rainfall event. Second, it has not been confirmed how well our experimental results are in line with the actual ground results. Therefore, further studies need to verify the experimental results with the actual situations, so that the study results can be practiced and applied under actual rainfall conditions. Third, in the future research, gully erosion experiments under different control measures should be carried out to identify suitable gully erosion prevention measures. Although the imperfection noted earlier represents a limitation of our study, we still clearly demonstrated the spatiotemporal change in hydraulic properties and soil loss during headcut erosion and quantify the response relationships of soil loss of different landform units to energy consumption, which is of great significance for deepening the understanding of the gully process and hydrodynamic mechanism. Also, our results can provide valuable ideas and a scientific basis for the construction of gully erosion models and the design of gully erosion prevention measures.
This study investigated the spatiotemporal changes in flow hydraulics, energy consumption, and soil loss during headcut erosion based on a series of scouring experiments of gully headcut erosion. The temporal changes in the jet properties of gully head (GH) were significantly affected by upstream inflow discharge. The upstream area (UA) and gully bed (GB) had similar temporal changes in the Reynolds number, Froude number, shear stress, and stream power. The flow was supercritical on UA but subcritical on GB, and the turbulent degree was enhanced by the increasing inflow discharge. The presence of the gully headwall significantly decreased flow, Reynolds number, shear stress, and stream power but slightly enhanced the Froude number. The accumulated energy consumption at UA, GH, and GB linearly increased with time. Overall, more than 91 % of total flow energy was consumed during the headcut erosion, of which the GH accounted for 77.5 % of the total runoff energy dissipation. The soil loss of UA and GH decreased logarithmically over time, whereas the GB was mainly characterized by sediment deposition over time. The GH and UA contributed 88.5 % and 11.5 % of total soil loss, respectively, of which 3.8 % soil loss was deposited on GB. The soil loss process of the UA and GH and the sediment deposition process of GB were significantly affected by flow hydraulic and jet properties. Our results revealed that the critical runoff energy consumption to initiate soil erosion of UA, GH, and GB is 1.62, 5.79, and 1.64 J s−1, respectively. The runoff energy consumption should be considered as a non-negligible parameter to predict gully headcut erosion.
The data that support the findings of this study are available from the first author (guomingming@iga.ac.cn) and corresponding author (nwafu_wwl@163.com or wlwang@nwsuaf.edu.cn) upon request.
MG and WW designed the experiments. MG, ZC, TW, QS, MZ, and LF carried out the experiments. ZC produced and processed the digital elevation model of erosion landform. MG and WW wrote and prepared the paper, with contributions from all co-authors.
The authors declare that they have no conflict of interest.
Publisher's note: Copernicus Publications remains neutral with regard to jurisdictional claims in published maps and institutional affiliations.
This work was supported by the National Natural Science Foundation of China (grant nos. 42077079 and 41571275), the China Postdoctoral Science Foundation (grant nos. 2020M681062 and 2021T140663), and the National Key Research and Development Program of China (grant no. 2016YFC0501604).
This research has been supported by the National Natural Science Foundation of China (grant nos. 42077079 and 41571275), the China Postdoctoral Science Foundation (grants nos. 2020M681062 and 2021T140663), and the National Key Research and Development Program of China (grant no. 2016YFC0501604).
This paper was edited by Thom Bogaard and reviewed by Artemi Cerdà and one anonymous referee.
Addisie, M. B., Ayele, G. K., Gessess, A. A., Tilahun, S. A., Zegeye, A. D., Moges, M. M., Schmitter, P., Langendoen, E. J., and Steenhuis, T. S.: Gully head retreat in the sub-humid Ethiopian Highlands: The Ene-Chilala catchment, Land Degrad. Dev., 28, 1579–1588, https://doi.org/10.1002/ldr.2688, 2017.
Ali, M., Seeger, M., Sterk, G., and Moore, D.: A unit stream power based sediment transport function for overland flow, Catena, 101, 197–204, https://doi.org/10.1016/j.catena.2012.09.006, 2013.
Alonso, C. V., Bennett, S. J., and Stein, O. R.: Predicting head cut erosion and migration in concentrated flows typical of upland areas, Water Resour. Res., 38, 39-1–39-15, https://doi.org/10.1029/2001WR001173, 2002.
Amare, S., Keesstra, S., van der Ploeg, M., Langendoen, E., Steenhuis, T., and Tilahun, S.: Causes and controlling factors of Valley bottom Gullies, Land, 8, 141, https://doi.org/10.3390/land8090141, 2019.
Amare, S., Langendoen, E., Keesstra, S., Ploeg, M. V. D., Gelagay, H., Lemma, H., and van der Zee, S. E.: Susceptibility to Gully Erosion: Applying Random Forest (RF) and Frequency Ratio (FR) Approaches to a Small Catchment in Ethiopia, Water, 13, 216, https://doi.org/10.3390/w13020216, 2021.
Arabameri, A., Chen, W., Lombardo, L., Blaschke, T., and Tien Bui, D.: Hybrid computational intelligence models for improvement gully erosion assessment, Remote Sensing, 12, 140, https://doi.org/10.3390/rs12010140, 2020.
Battany, M. C. and Grismer, M. E.: Rainfall runoff and erosion in Napa Valley vineyards: effects of slope, cover and surface roughness, Hydrol. Process., 14, 1289–1304, https://doi.org/10.1002/(SICI)1099-1085(200005)14:7<1289::AID-HYP43>3.0.CO;2-R, 2015.
Beer, C. E. and Johnson, H. P.: Factors in gully growth in the deep loess area of western Iowa, T. ASAE, 6, 237–240, https://doi.org/10.13031/2013.40877, 1963.
Belayneh, M., Yirgu, T., and Tsegaye, D.: Current extent, temporal trends, and rates of gully erosion in the Gumara watershed, northwestern Ethiopia, Global Ecology and Conservation, 24, e01255, https://doi.org/10.1016/j.gecco.2020.e01255, 2020.
Bennett, S. J.: Effect of slope on the growth and migration of headcuts in rills, Geomorphology, 30, 273–290, https://doi.org/10.1016/S0169-555X(99)00035-5, 1999.
Bennett, S. J. and Casalí, J.: Effect of initial step height on headcut development in upland concentrated flows, Water Resour. Res., 37, 1475–1484, https://doi.org/10.1029/2000WR900373, 2001.
Bennett, S. J., Alonso, C. V., Prasad, S. N., and Romkens, M. J.: Experiments on headcut growth and migration in concentrated flows typical of upland areas, Water Resour. Res., 36, 1911–1922, https://doi.org/10.1029/2000WR900067, 2000.
Bogale, A. G., Aynalem, D. W., Adem, A. A., Mekuria, W., and Tilahun, S.: Spatial and temporal variability of soil loss in gully erosion in upper Blue Nile basin, Ethiopia, Appl. Water Sci., 10, 106, https://doi.org/10.1007/s13201-020-01193-4, 2020.
Campo-Bescós, M. A., Flores-Cervantes, J. H., Bras, R. L., Casalí, J., and Giráldez, J. V.: Evaluation of a gully headcut retreat model using multitemporal aerial photographs and digital elevation models, J. Geophys. Res.-Earth, 118, 2159–2173, https://doi.org/10.1002/jgrf.20147, 2013.
Chaplot, V., Giboire, G., Marchand, P., and Valentin, C.: Dynamic modelling for linear erosion initiation and development under climate and land-use changes in northern Laos, Catena, 63, 318–328, https://doi.org/10.1016/j.catena.2005.06.008, 2005.
Che, X. L.: Study of distribution characteristic and evolution of headward erosion on Dongzhi tableland of the loess gully region, Yangling: Northwest A&F University, Yangling, 66–67, 2012 (in Chinese).
Chen, A., Zhang, D., Peng, H., Fan, J., Xiong, D., and Liu, G.: Experimental study on the development of collapse of overhanging layers of gully in Yuanmou Valley, China, Catena, 109, 177–185, https://doi.org/10.1016/j.catena.2013.04.002, 2013.
De Baets, S., Poesen, J., Knapen, A., and Galindo, P.: Impact of root architecture on the erosion-reducing potential of roots during concentrated flow, Earth Surf. Proc. Land., 32, 1323–1345, https://doi.org/10.1002/esp.1470, 2007.
Descroix, L., González Barrios, J. L., Viramontes, D., Poulenard, J., Anaya, E., Esteves, M., and Estrada, J.: Gully and sheet erosion on subtropical mountain slopes: their respective roles and the scale effect, Catena, 72, 325–339, https://doi.org/10.1016/j.catena.2007.07.003, 2008.
Dotterweich, M., Rodzik, J., Zglobicki, W., Schmitt, A., Schmidtchen, G., and Bork, H. R.: High resolution gully erosion and sedimentation processes, and land use changes since the Bronze Age and future trajectories in the Kazimierz Dolny area (Nałęczów Plateau, SE-Poland), Catena, 95, 50–62, https://doi.org/10.1016/j.catena.2012.03.001, 2012.
Flores-Cervantes, J., Istanbulluoglu, E., and Bras, R.: Development of gullies on the landscape: A model of headcut retreat resuUAing from plunge pool erosion, J. Geophys. Res., 111, 1–14, https://doi.org/10.1029/2004JF000226, 2006.
Frankl, A., Stal, C., Abraha, A., Nyssen, J., Rieke-Zapp, D., DeWulf, A., and Poesen, J.: Detailed recording of gully morphology in 3D through image-based modelling, Catena, 127, 92–101, https://doi.org/10.1016/j.catena.2014.12.016, 2015.
Fu, B. J., Liu, Y., Lv, Y. H., He, C. S., Zeng, Y., and Wu, B. F.: Assessing the soil erosion control service of ecosystems change in the Loess Plateau of China, Ecol. Complex., 8, 284–293, https://doi.org/10.1016/j.ecocom.2011.07.003, 2011.
Gordon, L. M., Bennett, S. J., Wells, R. R., and Alonso, C. V.: Effect of soil stratification on the development and migration of headcuts in upland concentrated flows, Water Resour. Res., 43, W07412, https://doi.org/10.1029/2006WR005659, 2007.
Guo, M., Wang, W., Shi, Q., Chen, T., Kang, H., and Li, J.: An experimental study on the effects of grass root density on gully headcut erosion in the gully region of China's Loess Plateau, Land Degrad. Dev., 30, 2107–2125, https://doi.org/10.1002/ldr.3404, 2019.
Guo, M. M., Wang, W., Wang, T., Wang, W., and Kang, H.: Impacts of different vegetation restoration options on gully head soil resistance and soil erosion in loess tablelands, Earth Surf. Proc. Land., 45, 1038–1050, https://doi.org/10.1002/esp.4798, 2020a.
Guo, M. M., Wang, W. L., Li, J. M., Bai, Y., Kang, H. L., and Yang, B.: Runoff characteristics and soil erosion dynamic processes on four typical engineered landforms of coalfields: An in-situ simulated rainfall experimental study, Geomorphology, 349, 106896, https://doi.org/10.1016/j.geomorph.2019.106896, 2020b.
Guo, M. M., Lou, Y. B., Chen, Z. X., Wang, W. L., Feng, L. Q., and Zhang, X. Y.: The proportion of jet flow and on-wall flow and its effects on soil loss and plunge pool morphology during gully headcut erosion, J. Hydrol., 598, 126220, https://doi.org/10.1016/j.jhydrol.2021.126220, 2021a.
Guo, M. M., Chen, Z. X., Wang, W. L., Wang, T. C., Wang, W. X., and Cui, Z. Q.: Revegetation induced change in soil erodibility as influenced by slope situation on the Loess Plateau, Sci. Total Environ., 772, 145540, https://doi.org/10.1016/j.scitotenv.2021.145540, 2021b.
Hager, W. H.: Hydraulics of plane free overfall, J. Hydraul. Eng., 109, 1683–1697, https://doi.org/10.1061/(ASCE)0733-9429(1983)109:12(1683), 1983.
Hanson, G. J., Robinson, K. M., and Cook, K. R.: Prediction of headcut migration using a deterministic approach, T. ASAE, 44, 525–531, https://doi.org/10.13031/2013.6112, 2001.
Hosseinalizadeh, M., Kariminejad, N., Chen, W., Pourghasemi, H. R., Alinejad, M., Behbahani, A. M., and Tiefenbacher, J. P.: Gully headcut susceptibility modeling using functional trees, naïve Bayes tree, and random forest models, Geoderma, 342, 1–11, https://doi.org/10.1016/j.geoderma.2019.01.050, 2019.
Ionita, I.: Gully development in the Moldavian Plateau of Romania, Catena, 68, 133–140, https://doi.org/10.1016/j.catena.2006.04.008, 2006.
Ionita, I., Niacsu, L., Petrovici, G., and Blebea-Apostu, A. M.: Gully development in eastern Romania: a case study from Falciu Hills, Nat. Hazards, 79, 113–138, https://doi.org/10.1007/s11069-015-1732-8, 2015.
Jiang, Y., Shi, H., Wen, Z., Guo, M., Zhao, J., Cao, X., Fan, Y., and Zheng, C.: The dynamic process of slope rill erosion analyzed with a digital close range photogrammetry observation system under laboratory conditions, Geomorphology, 350, 106893, https://doi.org/10.1016/j.geomorph.2019.106893, 2020.
Jiao, J. Y., Wang, W. Z., and Hao, X. P.: Precipitation and erosion characteristics of rainstorm in different pattern on Loess Plateau, Journal of Arid Land Resources and Environment, 13, 34–42, 1999 (in Chinese).
Kirkby, M. J., Bull, L. J., Poesen, J., Nachtergaele, J., and Vandekerckhove, L.: Observed and modelled distributions of channel and gully heads – with examples from SE Spain and Belgium, Catena, 50, 415–434, https://doi.org/10.1016/S0341-8162(02)00128-5, 2003.
Li, H., Cruse, R. M., Liu, X. B., and Zhang, X. Y.: Effects of topography and land use change on gully development in typical Mollisol region of Northeast China, Chinese Geogr. Sci., 26, 779–788, https://doi.org/10.1007/s11769-016-0837-7, 2016.
Li, M., Song, X. Y., Shen, B., Li, H. Y., and Meng, C. X.: Influence of vegetation change on producing runoff and sediment in gully region of Loess Plateau, Journal of Northwest Sci-Tech University of AgricuUAure and Forestry (Natural Science Edition), 34, 117–120, 2006 (in Chinese).
Li, Y., Mo, Y. Q., Are, K. S., Huang, Z., Guo, H., Tang, C., Abegunrin, T. P., Qin, Z. H, Kang, Z. W., and Wang, X.: Sugarcane planting patterns control ephemeral gully erosion and associated nutrient losses: Evidence from hillslope observation, Agr. Ecosyst. Environ., 309, 107289, https://doi.org/10.1016/j.agee.2020.107289, 2021.
Li, Z., Zheng, F. L., Liu, W. Z., and Flanagan, D. C.: Spatial distribution and temporal trends of extreme temperature and precipitation events on the Loess Plateau of China during 1961–2007, Quatern. Int., 226, 92–100, https://doi.org/10.1016/j.quaint.2010.03.003, 2010.
Ma, Q., Zhang, K., Cao, Z., Wei, M., and Yang, Z.: Soil detachment by overland flow on steep cropland in the subtropical region of China, Hydrol. Process., 34, 1810–1820, https://doi.org/10.1002/hyp.13694, 2020.
Martínez-Casasnovas, J. A., Concepción Ramos, M., and García-Hernández, D.: Effects of land-use changes in vegetation cover and sidewall erosion in a gully head of the Penedès region (northeast Spain), Earth Surf. Proc. Land., 34, 1927–1937, https://doi.org/10.1002/esp.1870, 2009.
Nazari Samani, A., Ahmadi, H., Mohammadi, A., Ghoddousi, J., Salajegheh, A., Boggs, G., and Pishyar, R.: Factors Controlling Gully Advancement and Models Evaluation (Hableh Rood Basin, Iran), Water Resour. Manag., 24, 1532–1549, https://doi.org/10.1007/s11269-009-9512-4, 2010.
Oostwoud-Wijdenes, D. and Bryan, R. B.: The significance of gully headcuts as a source of sediment on low-angle slopes at Baringo, Kenya, and initial control measures, Adv. Geoecol., 27, 205–231, 1994.
Oostwoud-Wijdenes, D., Poesen, J., Vandekerckhove, L., and Ghesquiere, M.: Spatial distribution of gully head activity and sediment supply along an ephemeral channel in a Mediterranean environment, Catena, 39, 147–167, https://doi.org/10.1016/S0341-8162(99)00092-2, 2000.
Pan, C., Ma, L., Wainwright, J., and Shangguan, Z.: Overland flow resistances on varying slope gradients and partitioning on grassed slopes under simulated rainfall, Water Resour. Res., 52, 2490–2512, https://doi.org/10.1002/2015WR018035, 2016.
Poesen, J., Nachtergaele, J., Verstraeten, G., and Valentin, C.: Gully erosion and environmental change: Importance and research needs, Catena, 50, 91–133, https://doi.org/10.1016/S0341-8162(02)00143-1, 2003.
Qin, C., Zheng, F. L., Wells, R. R., Xu, X. M., Wang, B., and Zhong, K. Y.: A laboratory study of channel sidewall expansion in upland concentrated flows, Soil Till. Res., 178, 22–31, https://doi.org/10.1016/j.still.2017.12.008, 2018.
Rieke-Zapp, D. H. and Nichols, M. H.: Headcut retreat in a semiarid watershed in the southwestern United States since 1935, Catena, 87, 1–10, https://doi.org/10.1016/j.catena.2011.04.002, 2011.
Rodzik, J., Furtak, T., and Zglobicki, W.: The impact of snowmelt and heavy rainfall runoff on erosion rates in a gully system, Lublin Upland, Poland, Earth Surf. Proc. Land., 34, 1938–1950, https://doi.org/10.1002/esp.1882, 2009.
Rouse, H.: Engineering hydraulics, Wiley, Hoboken, NJ, 1950.
Sanchis, M. P., Torri, D., Borselli, L., and Poesen, J.: Climate effects on soil erodibility, Earth Surf. Proc. Land., 33, 1082–1097, https://doi.org/10.1002/esp.1604, 2008.
Shen, N., Wang, Z., Zhang, Q., Chen, H., and Wu, B.: Modelling soil detachment capacity by rill flow with hydraulic variables on a simulated steep loessial hillslope, Hydrol. Res., 50, 85–98, https://doi.org/10.2166/nh.2018.037, 2018.
Shi, Q. H., Wang, W. L., Guo, M. M., Chen, Z. X., Feng, L. Q., Zhao, M., and Xiao, H.: The impact of flow discharge on the hydraulic characteristics of headcut erosion processes in the gully region of the Loess Plateau, Hydrol. Process., 34, 718–729, https://doi.org/10.1002/hyp.13620, 2020a.
Shi, Q. H., Wang, W., Zhu, B., and Guo, M.: Experimental study of hydraulic characteristics on headcut erosion and erosional response in the tableland and gully regions of China, Soil Sci. Soc. Am. J., 84, 700–716, https://doi.org/10.1002/saj2.20068, 2020b.
Sidorchuk, A.: The potential of gully erosion on the Yamal peninsula, West Siberia, Sustainability, 12, 260, https://doi.org/10.3390/su12010260, 2020.
Stein, O., Julien, P., and Alonso, C.: Mechanics of jet scour downstream of a headcut, J. Hydraul. Res., 31, 723–738, https://doi.org/10.1080/00221689309498814, 1993.
Su, Z. A., Xiong, D. H., Dong, Y. F., Li, J. J., Yang, D., Zhang, J. H., and He, G. X.: Simulated headward erosion of bank gullies in the Dry-hot Valley Region of southwest China, Geomorphology, 204, 532–541, https://doi.org/10.1016/j.geomorph.2013.08.033, 2014.
Su, Z. A., Xiong, D. H., Dong, Y. F., Zhang, B. J., Zhang, S., Zheng, X. Y., Yang, D., Zhang, J. H., Fan, J. R., and Fang, H. D: Hydraulic properties of concentrated flow of a bank gully in the dry-hot valley region of southwest China, Earth Surface Processes and Landforms, 40, 1351–1363. https://doi.org/10.1002/esp.3724, 2015.
Sun, W. Y., Mu, X. M., Song, X. Y., Wu, D., Cheng, A. F., and Qiu, B.: Changes in extreme temperature and precipitation events in the Loess Plateau (China) during 1960–2013 under global warming, Atmos. Res., 168, 33–48, https://doi.org/10.1016/j.atmosres.2015.09.001, 2016.
Torri, D. and Poesen, J.: A review of topographic threshold conditions for gully head development in different environments, Earth-Sci. Rev., 130, 73–85, https://doi.org/10.1016/j.earscirev.2013.12.006, 2014.
Valentin, C., Poesen, J., and Li, Y.: Gully erosion: Impacts, factors and control, Catena, 63, 132–153, https://doi.org/10.1016/j.catena.2005.06.001, 2005.
Vandekerckhove, L., Poesen, J., and Govers, G.: Medium-term gully headcut retreat rates in southeast spain determined from aerial photographs and ground measurements, Catena, 50, 329–352, https://doi.org/10.1016/S0341-8162(02)00132-7, 2003.
Vandekerckhove, L., Poesen, J., Wijdenes, D. O., Nachtergaele, J., Kosmas, C., Roxo, M. J., and Figueiredo, T. D.: Thresholds for gully initiation and sedimentation in Mediterranean Europe, Earth Surf. Proc. Land., 25, 1201–1220, https://doi.org/10.1002/1096-9837(200010)25:11<1201::AID-ESP131>3.0.CO;2-L, 2015.
Vanmaercke, M., Poesen, J., Mele, B. V., Demuzere, M., Bruynseels, A., Golosov, V., Bezerra, J. F. R., Bolysov, S., Dvinskih, A., Frankl, A., Fuseina, Y., Guerra, A. J. T., Haregeweyn, N., Ionita, I., Imwangana, F. M., Moeyersons, J., Moshe, I., Samani, A. N., Niacsu, L., Nyssen, J., Otsuki, Y., Radoane, M., Rysin, I., Ryzhov, Y. V., and Yermolaev, O.: How fast do gully headcuts retreat?, Earth-Sci. Rev., 154, 336–355, https://doi.org/10.1016/j.earscirev.2016.01.009, 2016.
Vannoppen, W., Vanmaercke, M., De Baets, S., and Poesen, J.: A review of the mechanical effects of plant roots on concentrated flow erosion rates, Earth-Sci. Rev., 150, 666–678, https://doi.org/10.1016/j.earscirev.2015.08.011, 2015.
Vanwalleghem, T., Van Den Eeckhaut, M., Poesen, J., Deckers, J., Nachtergaele, J., Van Oost, K., and Slenters, C.: Characteristics and controlling factors of old gullies under forest in a temperate humid climate: a case study from the Meerdaal Forest (Central Belgium), Geomorphology, 56, 15–29, https://doi.org/10.1016/S0169-555X(03)00043-6, 2003.
Wells, R. R., Alonso, C. V., and Bennett, S. J.: Morphodynamics of Headcut Development and Soil Erosion in Upland Concentrated Flows, Soil Sci. Soc. Am. J., 73, 521–530, https://doi.org/10.2136/sssaj2008.0007, 2009a.
Wells, R. R., Bennett, S. J., and Alonso, C. V.: Effect of soil texture, tailwater height, and pore-water pressure on the morphodynamics of migrating headcuts in upland concentrated flows, Earth Surf. Proc. Land., 34, 1867–1877, https://doi.org/10.1002/esp.1871, 2009b.
Wells, R. R., Momm, H. G., Rigby, J. R., Bennett, S. J., Bingner, R. L., and Dabney, S. M.: An empirical investigation of gully widening rates in upland concentrated flows, Catena, 101, 114–121, https://doi.org/10.1016/j.catena.2012.10.004, 2013.
Wen, X., Wu, X., and Gao, M.: Spatiotemporal variability of temperature and precipitation in Gansu province (northwest China) during 1951–2015, Atmos. Res., 197, 132–149, https://doi.org/10.1016/j.atmosres.2017.07.001, 2017.
Wen, Y., Kasielke, T., Li, H., Zhang, B., and Zepp, H.: May agricultural terraces induce gully erosion? a case study from the black soil region of northeast China, Sci. Total Environ., 750, 141715, https://doi.org/10.1016/j.scitotenv.2020.141715, 2020.
Wu, B., Wang, Z., Shen, N., and Wang, S.: Modelling sediment transport capacity of rill flow for loess sediments on steep slopes, Catena, 147, 453–462, https://doi.org/10.1016/j.catena.2016.07.030, 2016.
Wu, B., Wang, Z. L., Zhang, Q. W., Shen, N., Liu, J. E., and Wang, S.: Evaluation of shear stress and unit stream power to determine the sediment transport capacity of loess materials on different slopes, J. Soil Sediment., 18, 116–127, https://doi.org/10.1007/s11368-017-1758-5, 2018.
Xia, L., Song, X. Y., Fu, N., Li, H. Y., and Li, Y. L.: Impacts of land use change and climate variation on green water in the Loess Plateau Gully Region – A case study of Nanxiaohegou basin, J. Hydraul. Eng., 48, 678–688, 2017 (in Chinese).
Xu, J. Z., Li, H., Liu, X. B., Hu, W., Yang, Q. N., Hao, Y. F., Zhen, H. C., and Zhang, X. Y.: Gully Erosion Induced by SnowmeUA in Northeast China: A Case Study, Sustainability, 11, 2088, https://doi.org/10.3390/su11072088, 2019.
Xu, X. M., Zheng, F. L., Wilson, G. V., and Wu, M.: Upslope inflow, hillslope gradient and rainfall intensity impacts on ephemeral gully erosion, Land Degrad. Dev., 28, 2623–2635 https://doi.org/10.1002/ldr.2825, 2017a.
Xu, X. M., Zheng, F. L., Qin, C., Wu, H. Y., and Wilson, G. V.: Impact of cornstalk buffer strip on hillslope soil erosion and its hydrodynamic understanding, Catena, 149, 417–425, https://doi.org/10.1016/j.catena.2016.10.016, 2017b.
Xu, X. M., Wang, H. B., Zhao, J. Y., and Liu, X. J.: Dynamic variation of soil erosion of Nanxiaohegou small watershed during 2004–2016, Soil and Water Conservation in China, 443, 59–61, 2019 (in Chinese).
Yang, C. T.: Potential energy and stream morphology, Water Resour. Res., 7, 311–223, https://doi.org/10.1029/WR007i002p00311, 1971a.
Yang, C. T.: On river meanders, J. Hydrol., 13, 231–253, https://doi.org/10.1016/0022-1694(71)90226-5, 1971b.
Zhang, B. J., Xiong, D. H., Su, Z. A., Yang, D., Dong, Y. F., Xiao, L., Zhang, S., and Shi, L. T.: Effects of initial step height on the headcut erosion of bank gullies: a case study using a 3D photo-reconstruction method in the Dry-hot Valley region of southwest China, Phys. Geogr., 37, 409–429, https://doi.org/10.1080/02723646.2016.1219939, 2016.
Zhang, B. J., Xiong, D. H., Zhang G. H., Zhang, S., Wu, H., Yang, D., Xiao, L., Dong, Y. F., Su, Z. A., and Lu, X. N.: Impacts of headcut height on flow energy, sediment yield and surface landform during bank gully erosion processes in the Yuanmou Dry-hot Valley region, southwest China, Earth Surf. Proc. Land., 43, 2271–2282, https://doi.org/10.1002/esp.4388, 2018.
Zhang, G. H., Liu, Y. M., Han, Y. F., and Zhang, X. C.: Sediment transport and soil detachment on steep slopes: I. transport capacity estimation, Soil Sci. Soc. Am. J., 73, 1291–1297, https://doi.org/10.2136/sssaj2008.0145, 2009.
Zhang, H. X.: The characteristics of hard rain and its distribution over the Loess Plateau, Acta Geographica Sinica, 38, 416–425, 1983 (in Chinese).
Zhang, X., Fan, J., Liu, Q., and Xiong, D.: The contribution of gully erosion to total sediment production in a small watershed in Southwest China, Phys. Geogr., 39, 1–18, https://doi.org/10.1080/02723646.2017.1356114, 2018.
Zhao, A. C.: Analysis of control models of typical small watershed in gully area of Loess Plateau, the east part of Gansu Province, Res. Soil Water Conserv., 1, 45–49, 1994 (in Chinese).
Zhu, T. X.: Gully and tunnel erosion in the hilly Loess Plateau region, China, Geomorphology, 153, 144–155, https://doi.org/10.1016/j.geomorph.2012.02.019, 2012.