the Creative Commons Attribution 4.0 License.
the Creative Commons Attribution 4.0 License.
 | 18 Jun 2021
Attribution of growing season evapotranspiration variability considering snowmelt and vegetation changes in the arid alpine basins
Tingting Ning
Qi Feng
Zongxing Li
Yanyan Qin
Previous studies have successfully applied variance decomposition frameworks based on the Budyko equations to determine the relative contribution of variability in precipitation, potential evapotranspiration (E0), and total water storage changes (ΔS) to evapotranspiration variance () on different timescales; however, the effects of snowmelt (Qm) and vegetation (M) changes have not been incorporated into this framework in snow-dependent basins. Taking the arid alpine basins in the Qilian Mountains in northwest China as the study area, we extended the Budyko framework to decompose the growing season into the temporal variance and covariance of rainfall (R), E0, ΔS,Qm, and M. The results indicate that the incorporation of Qm could improve the performance of the Budyko framework on a monthly scale; was primarily controlled by the R variance with a mean contribution of 63 %, followed by the coupled R and M (24.3 %) and then the coupled R and E0 (14.1 %). The effects of M variance or Qm variance cannot be ignored because they contribute 4.3 % and 1.8 % of , respectively. By contrast, the interaction of some coupled factors adversely affected , and the out-of-phase seasonality between R and Qm had the largest effect (−7.6 %). Our methodology and these findings are helpful for quantitatively assessing and understanding hydrological responses to climate and vegetation changes in snow-dependent regions on a finer timescale.
- Article
(3989 KB) - Full-text XML
-
Supplement
(1386 KB) - BibTeX
- EndNote


Actual evapotranspiration (ET) drives energy and water exchanges among the hydrosphere, atmosphere, and biosphere (Wang et al., 2007). The temporal variability in ET is thus the combined effect of multiple factors interacting across the soil–vegetation–atmosphere interface (Katul et al., 2012; Xu and Singh, 2005). Investigating the mechanism behind ET variability is also fundamental for understanding hydrological processes. The basin-scale ET variability has been widely investigated with the Budyko framework (Budyko, 1961, 1974); however, most studies are conducted on long-term or inter-annual scales and cannot interpret the short-term ET variability (e.g. monthly scales).
Short-term ET and runoff (Qr) variance have been investigated recently for their dominant driving factors (Feng et al., 2020; Liu et al., 2019; Wu et al., 2017; Ye et al., 2016; Zeng and Cai, 2015, 2016; Zhang et al., 2016a); to this end, an overall framework was presented by Zeng and Cai (2015) and Liu et al. (2019). Zeng and Cai (2015) decomposed the intra-annual ET variance into the variance and covariance of precipitation (P), potential evapotranspiration (E0), and water storage change (ΔS) under the Budyko framework based on the work of Koster and Suarez (1999). Subsequently, Liu et al. (2019) proposed a new framework to identify the driving factors of global Qr variance by considering the temporal variance of P, E0, ΔS, and other factors such as the climate seasonality, land cover, and human impact. Although the proposed framework performs well for the ET variance decomposition, further research is necessary for considering additional driving factors and for studying regions with unique hydrological processes.
The impact of vegetation change should first be fully considered when studying the variability of ET. Vegetation change significantly affects the hydrological cycle through rainfall interception, evapotranspiration, and infiltration (Rodriguez-Iturbe, 2000; Zhang et al., 2016b). Higher vegetation coverage increases ET and reduces the ratio of Qr to P (Feng et al., 2016). However, most of the existing studies on ET variance decomposition either ignored the effects of vegetation change or did not quantify its contributions. Vegetation change is closely related to the Budyko controlling parameters, and several empirical relationships have been successfully developed on long-term and inter-annual scales (Li et al., 2013; Liu et al., 2018; Ning et al., 2020; Xu et al., 2013; Yang et al., 2009). However, the relationship between vegetation and its controlling parameters on a finer timescale has received less attention. As such, it is important to quantitatively investigate the contribution of vegetation change to ET variability on a finer timescale.
Second, the short-term water balance equation was the foundation of decomposing ET or Qr variance. Its general form can be expressed as
where P, including liquid (rainfall) and solid (snowfall) precipitation, is the total water source of the hydrological cycle. But this equation is unsuitable for regions where the land surface hydrology is highly dependent on the winter mountain snowpack and spring snowmelt runoff. It has been reported that annual Qr originating from snowmelt accounts for 20 %–70 % of the total runoff, including the western United States (Huning and AghaKouchak, 2018), coastal areas of Europe (Barnett et al., 2005), western China (Li et al., 2019b), northwest India (Maurya et al., 2018), south of the Hindu Kush (Ragettli et al., 2015), and high-mountain Asia (Qin et al., 2020). In these regions, the mountain snowpack serves as a natural reservoir that stores cold-season P to meet the warm-season water demand (Qin et al., 2020; Stewart, 2009). Thus, the water balance equation should be modified to consider the impacts of snowmelt on runoff on a short-term timescale:
where R is the rainfall and Qm is the snowmelt runoff. Many observations and modelling experiments have found that due to global warming, increasing temperatures would induce earlier runoff in the spring or winter and reduce the flows in summer and autumn (Barnett et al., 2005; Godsey et al., 2014; Stewart et al., 2005; Zhang et al., 2015). Therefore, the role of snowmelt change on ET variability in snow-dependent basins on a finer timescale should be studied.
The overall objective of this study was to decompose the ET variance into the temporal variability of multiple factors considering vegetation and snowmelt change. The six cold alpine basins in the Qilian Mountains of northwest China were taken as an example study area. Specifically, we aimed to: (1) determine the dominant driving factor controlling the ET variance, (2) investigate the roles of vegetation and snowmelt change in the variance, and (3) understand the interactions among the controlling factors in ET variance. The proposed method will help quantify the hydrological response to changes in snowmelt and vegetation in snowmelt-dependent regions, and our results will prove to be insightful for water resource management in other similar regions worldwide.
2.1 Study area
Six sub-basins located in the upper reaches of the Heihe, Shiyang, and Shule rivers in the Qilian Mountains were chosen as the study area (Fig. 1). They are important inland rivers in the dry region of northwest China. The runoff generated from the upper reaches contributes to nearly 70 % of the water resources of the entire basin and thus plays an important role in supporting agriculture, industry development, and ecosystem maintenance in the middle and downstream rivers (Cong et al., 2017; Wang et al., 2010a). Snowmelt and in-mountain-generated rainfall make up the water supply system for the upper basins (Matin and Bourque, 2015), and the annual average P exceeds 450 mm in this region. At higher altitudes, as much as 600–700 mm of P can be observed (Yang et al., 2017). Nearly 70 % of the total rainfall concentrates between June and September, while only 19 % of the total rainfall occurs from March to June. Snowmelt runoff is an important water source (Li et al., 2012, 2018, 2016); in the spring, 70 % of the runoff is supplied by snowmelt water (Wang and Li, 2001). Characterised by a continental alpine semi-humid climate, alpine desert glaciers, alpine meadows, forests, and upland meadows are the predominant vegetation distribution patterns (Deng et al., 2013). Furthermore, this region has experienced substantial vegetation changes and resultant hydrological changes in recent decades (Bourque and Mir, 2012; Du et al., 2019; Ma et al., 2008).
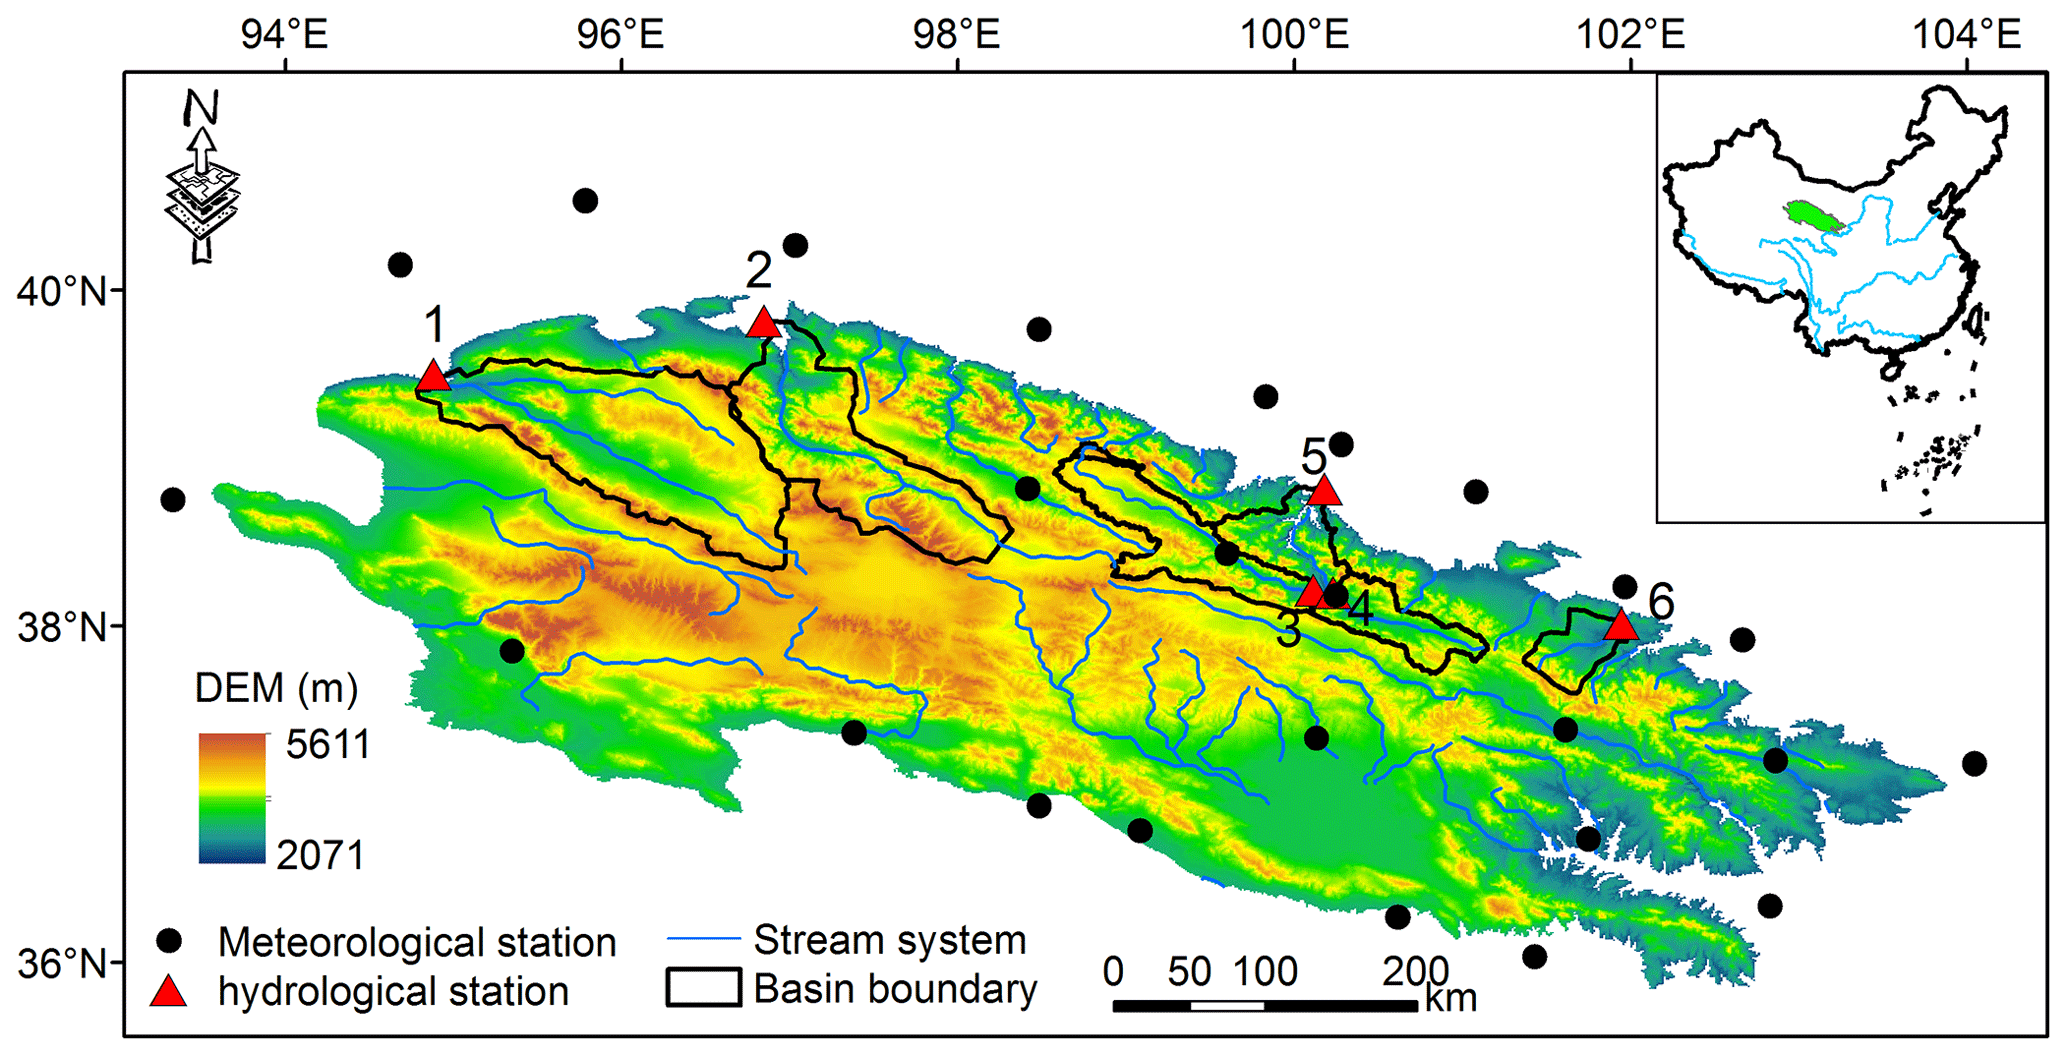
Figure 1The six basins in China's northern Qilian Mountains. The Digital elevation data, at 30 m resolution, were provided by the Geospatial Data Cloud site, Computer Network Information Center, Chinese Academy of Sciences.
2.2 Data
Daily climate data were collected for 25 stations distributed in and around the Qilian Mountains from the China Meteorological Administration. They comprised rainfall, air temperature, sunshine hours, and relative humidity and were used to calculate the monthly E0 using the Priestley and Taylor (1972) equation.
The monthly runoff at the Dangchengwan, Changmabu, Zhamashike, Qilian, Yingluoxia, and Shagousi hydrological stations were obtained for 2001–2014 from the Bureau of Hydrology and Water Resources, Gansu Province. The sum of the monthly soil moisture and plant canopy surface water with a resolution of from the Global Land Data Assimilation System (GLDAS) Noah model was used to estimate the total water storage. The monthly ΔS was calculated as the water storage difference between two neighbouring months. Eight-day composites of the MODIS MOD10A2 Version 6 snow cover product from the MODIS TERRA satellite were used to produce the monthly snow cover area (SCA) of each basin. The SCA data were used to drive the snowmelt runoff model.
A monthly normalised difference vegetation index (NDVI) at a spatial resolution of 1 km from the MODIS MOD13A3.006 product was used to assess the vegetation coverage (M), which can be calculated from the method of Yang et al. (2009):
where NDVImax and NDVImin are the NDVI values of dense forest (0.80) and bare soil (0.05).
ET from the “ground truth of land surface evapotranspiration at regional scale in the Heihe River Basin (2012–2016) ETmap Version 1.0” (hereafter “ETmap”) dataset, was used to validate the reliability of our estimated ET. This dataset was published by National Tibetan Plateau Data Center. It was upscaled from 36 eddy covariance flux tower sites (65 site years) to the regional scale with five machine learning algorithms and then applied to estimate ET for each grid cell (1 km × 1 km) across the Heihe River Basin each day from May to September over the period 2012–2016. It has been evaluated to have high accuracy (Xu et al., 2018). Basins 3, 4, and 5 in our study belong to the headwater sub-basins of Heihe River, and our monthly ET from May to September during 2012–2014 was thus compared with ETmap.
3.1 The Budyko framework at monthly scales
Probing the ET variability in the growing season can provide basic scientific reference points for agricultural activities and water resource planning and management (Li et al., 2015; Wagle and Kakani, 2014). Thus, we focus on the growing season ET variability on a monthly scale in this study.
Among the mathematical forms of the Budyko framework, this study employed the function proposed by Choudhury (1999) and Yang et al. (2008) to assess the basin water balance for good performance (Zhou et al., 2015):
where n is the controlling parameter of the Choudhury–Yang equation. Pe is the total available water supply for ET. In previous studies, Pe included P and ΔS () on a finer timescale (Liu et al., 2019; Zeng and Cai, 2015; Zhang et al., 2016a), but snowmelt runoff should also be considered in the snow-dependent basins. Thus, Pe can be defined as
Equation (4) can thus be redefined as follows:
where i indicates each month of the growing season (April to September). After estimating the monthly ET of the growing season using Eq (2), the values of n for each month can be obtained via Eq. (6).
3.2 Estimating the equivalent of snowmelt runoff
With the developed relationship between snowmelt and air temperature (Hock, 2003), the degree-day model simplifies the complex processes and performs well, so it is widely used in snowmelt estimation (Griessinger et al., 2016; Rice et al., 2011; Semadeni-Davies, 1997; Wang et al., 2010a). This study estimated the monthly Qm using the degree-day model following the Wang et al. (2015) procedure. Specifically, the water equivalent of snowmelt (W, mm) during the period m can be calculated as
where DDF denotes the degree-day factor (mm/day ⋅ ∘C) and T+ is the sum of the positive air temperatures of each month. After obtaining W, the monthly Qm of each elevation zone can be expressed as
where SCAiis the snow cover area of each elevation zone.
According to Gao et al. (2011), the DDF values of Basins 1–6 were set to 3.4, 3.4, 4.0, 4.0, 4.0, and 1.7 mm/day ⋅ ∘C, respectively. The six basins were divided into seven elevation zones with elevation differences of 500 m. The sum of Qm in each elevation zone could be considered as the total Qm of each basin. Previous studies have found that the major snow melting period is from March to July in this area (Wang and Li, 2005; Wu et al., 2015); furthermore, the MODIS snow product also showed that the SCA decreased significantly at the end of July. Thus, the snowmelt runoff from April to July for the growing season was estimated in this study.
3.3 Relationship between the Budyko controlling parameter and vegetation change
The relationships between the monthly parameters n and M for each basin in the growing season for 2001–2014 are presented in Fig. 2. It can be seen that parameter n was significantly positively related to M in all six basins (p<0.05), which means that ET increased with increasing vegetation conditions under the given climate conditions.
In Eq. (6), when n→0, ET→0, which means M should have the following limiting conditions: if ET→0, T→0 (transpiration), and thus M→0. Considering the relationship shown in Fig. 2 and the above limiting conditions, the general form of parameter n can be expressed by power function followed previous studies (Liu et al., 2018; Ning et al., 2017; Yang et al., 2007):
where a and b are constants, and their specific values for each basin are fitted in Fig. 2.
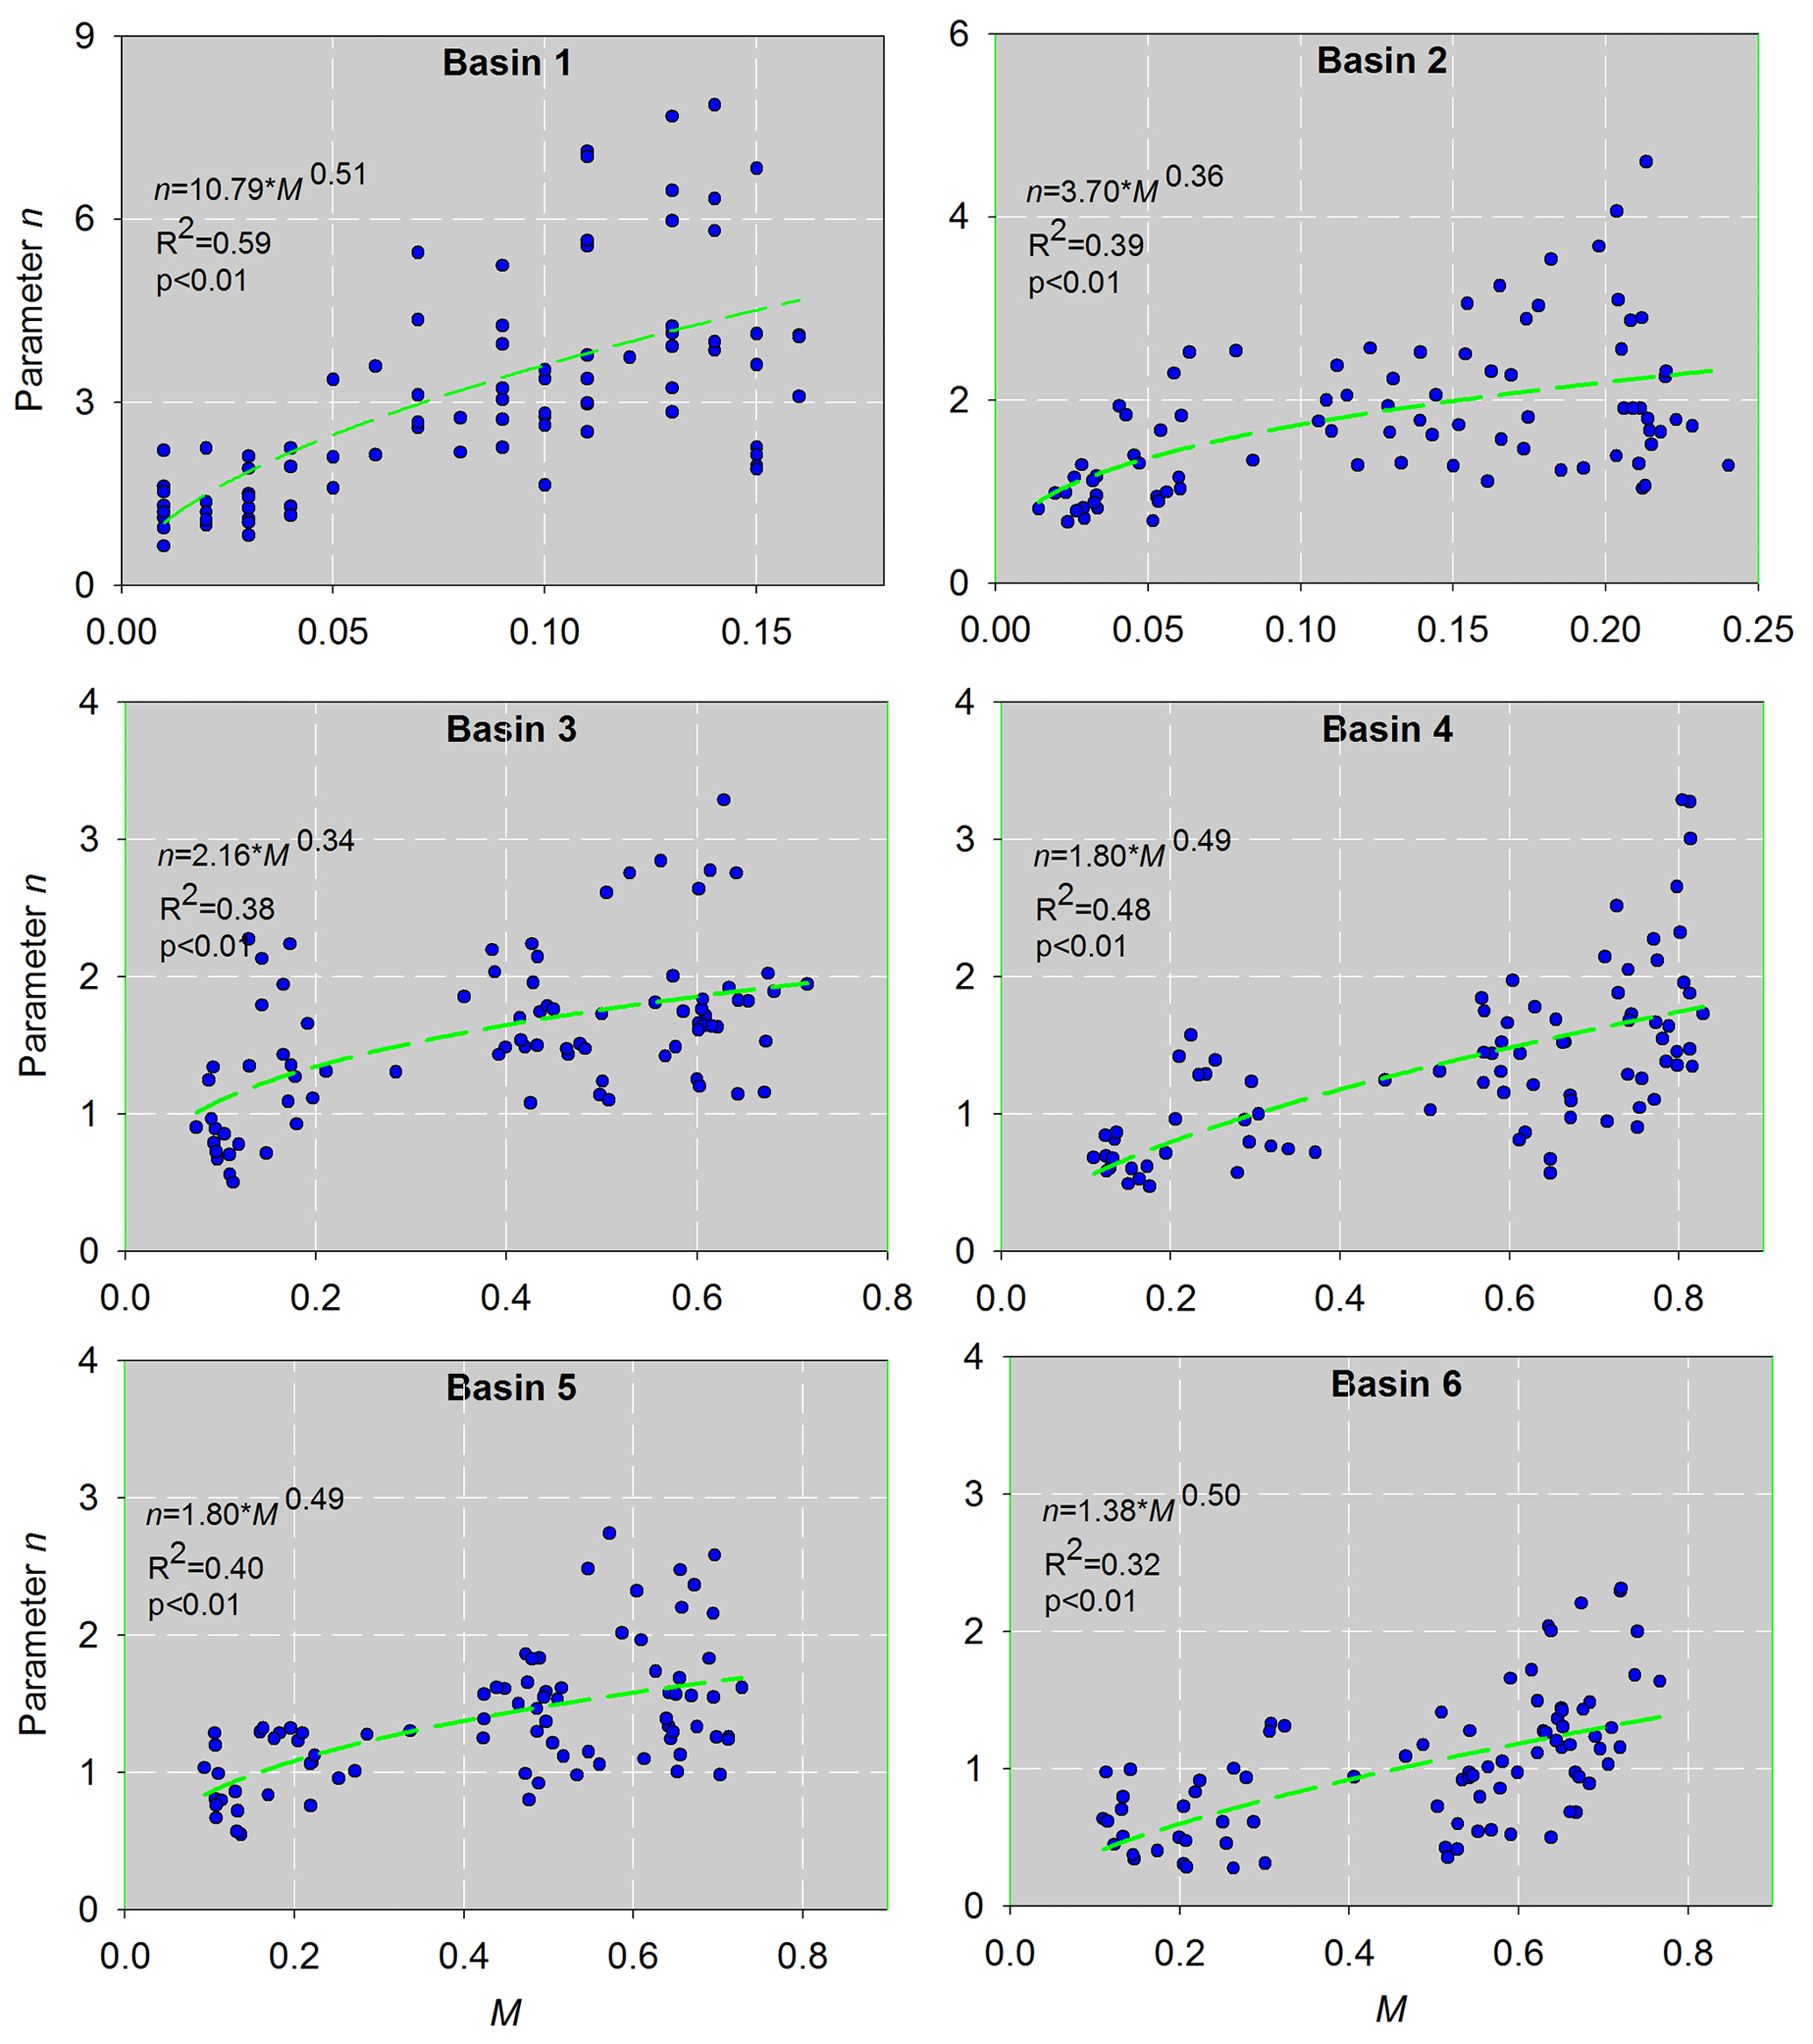
Figure 2Relationships between the parameter n and the vegetation coverage for each basin on a monthly scale.
3.4 ET variance decomposition
Liu et al. (2019) proposed a framework to identify the driving factors behind the temporal variance of Qr by combining the unbiased sample variance of Qr with the total differentiation of Qr changes. Here, we extended this method by considering the effects of changes in snowmelt runoff and vegetation coverage on ET variance.
By combining Eq. (6) with (9), Eq. (6) can be simplified as ET≈f(Ri, Qmi, ΔSi, E0i, Mi). Thus, the total differentiation of ET changes can be expressed as
where τ is the error. , , , , and are the partial differential coefficients of ET to R, Qm, ΔS,E0 and M, respectively, which can be calculated as
The first-order approximation of ET changes in Eq. (10) can be expressed as
where ; ; ; ; .
In this study, the temporal variance of ET reflects the fluctuation of monthly ET in the growing season for years, which can be quantified by the unbiased sample variance ():
where is the long-term monthly mean of ET. N is the sample size and equals 84 in this study (6 months/year ×14 years=84 months). i is used to index time series of month from 1 to N. indicates how far a set of monthly ET in growing season is spread out from their average value. The larger the , the larger the fluctuation of ET, and vice versa.
Combining Eq. (12) with (13), can be decomposed as the contribution from different variance and covariance sources:
Expanding Eq. (14), can be further rewritten as
where σ represents the standard deviation, and cov represents the covariance. Eq. (15) can be further simplified as
where F is the individual contributions of each factor; each two factors linked by an underscore represents the interaction effects between them.
By separating out Eq. (16), the relative contribution of each factor (C(X)) to can be calculated as
where X represents the 15 components in Eq. (16).
4.1 The effects of monthly storage change and snowmelt runoff in the Budyko framework
The Budyko framework is usually used for analyses of long-term average catchment water balance; however, it was employed for the interpretation of the monthly variability of the water balance in this study. Thus, it's necessary to validate the feasibility of Budyko equation for monthly variability. Furthermore, the impact of ΔS on the representation of Budyko framework on a finer timescale has been assessed by several studies (Chen et al., 2013; Du et al., 2016; Liu et al., 2019; Zeng and Cai, 2015). However, the impact of Qm and its combined effects with ΔS in snowmelt-dependent basins are mostly ignored. Therefore, we present the water balance in the monthly scale of six basins in the Budyko's framework with three different computations of aridity index () or ET ratio (ET Pe) in Fig. 3. In Fig. 3a, when R is considered as water supply, i.e. Pe=R. The points of monthly ET ratio and aridity index in April and May were well below Budyko curves in six basins; the monthly ET ratio was even negative in several years, which means the local rains are not the only sources of ET in this area, especially in spring. In Fig. 3b, with . Compared with Fig. 3a, the outliers in April and May were improved to a certain extent but negative points still existed, suggesting that except for R, ΔS also play a significant role in maintaining spring ET, but the variability of ET cannot be completely explained by these two variables. In Fig. 3c, with . Compared to the points in Fig. 3a, b, all points focused on Budyko's curves more closely in each basin when . From this comparison, it can be concluded that the Budyko framework is applicable to the monthly scale in snowmelt-dependent basins if the water supply is described accurately by considering ΔS and Qm.
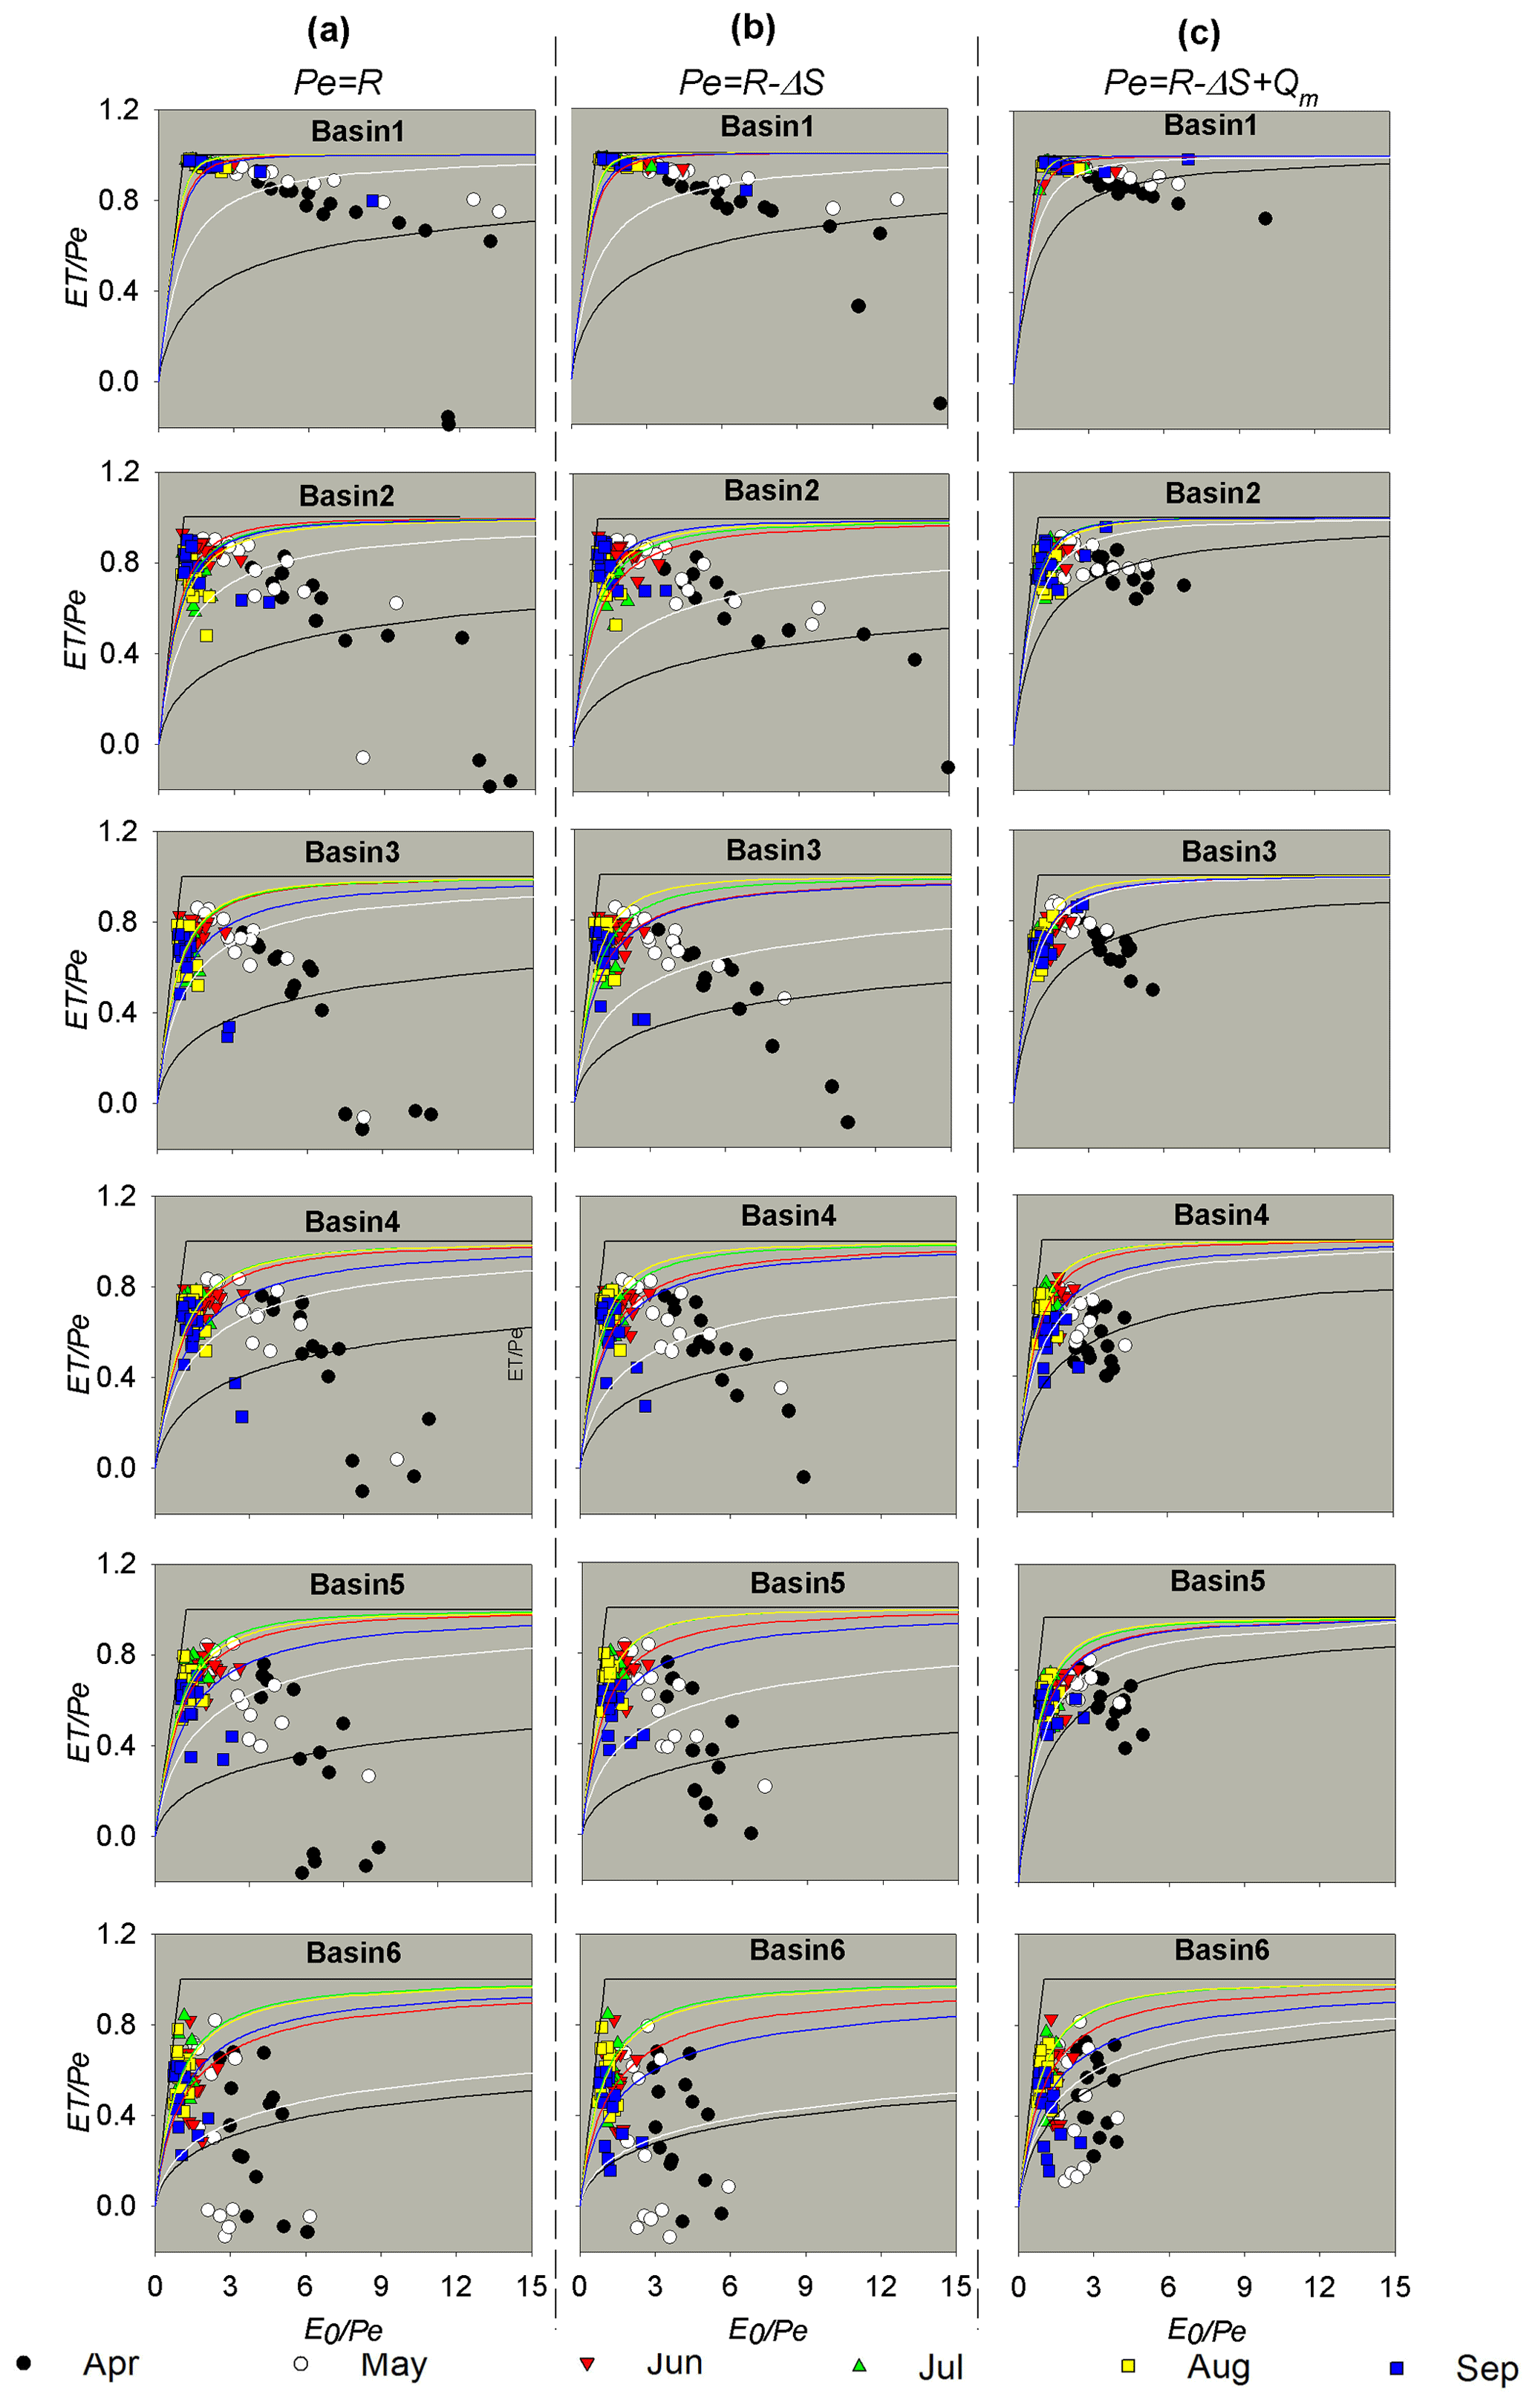
Figure 3Plots for the aridity index vs. evapotranspiration index scaled by the available water supply for monthly series in the growing season. The total water availability is (a) R, (b) R−ΔS, and (c) . The n value for each Budyko curve is fitted by long-term averaged monthly data.
4.2 Variations in the growing season water balance
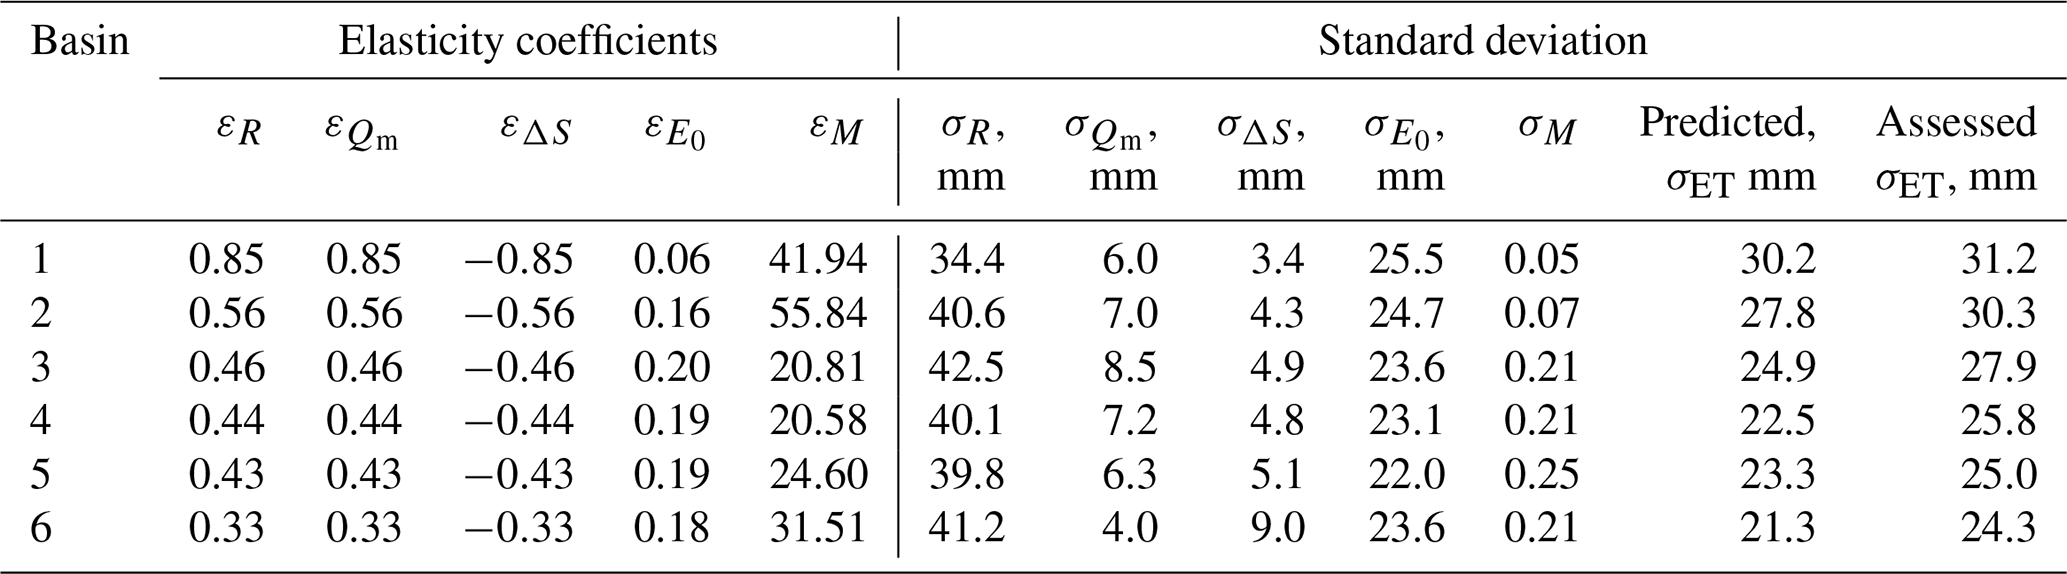
The mean and standard deviation (σ) for each item in the growing season water balance in the six basins are summarised in Tables 1 and 2. The proportion of ΔS in the water balance was small, with a mean value of 1.2 mm; however, its intra-annual fluctuation was relatively large, with a σΔS of 5.3 mm, and σΔS was even as high as 9.0 mm in Basin 6. Compared to ΔS, Qm represented a larger proportion of the water balance with a mean of 8.5±6.5 mm, indicating its important role in the basin water supply. For this region, the water supply of ET was not only R but also included Qm and ΔS. Consequently, the mean monthly ET generally approached R (55.8±27.4 mm) or higher values in Basin 1.
Table 1Averaged monthly hydrometeorological characteristics and vegetation coverage in the growing season (2001–2014).
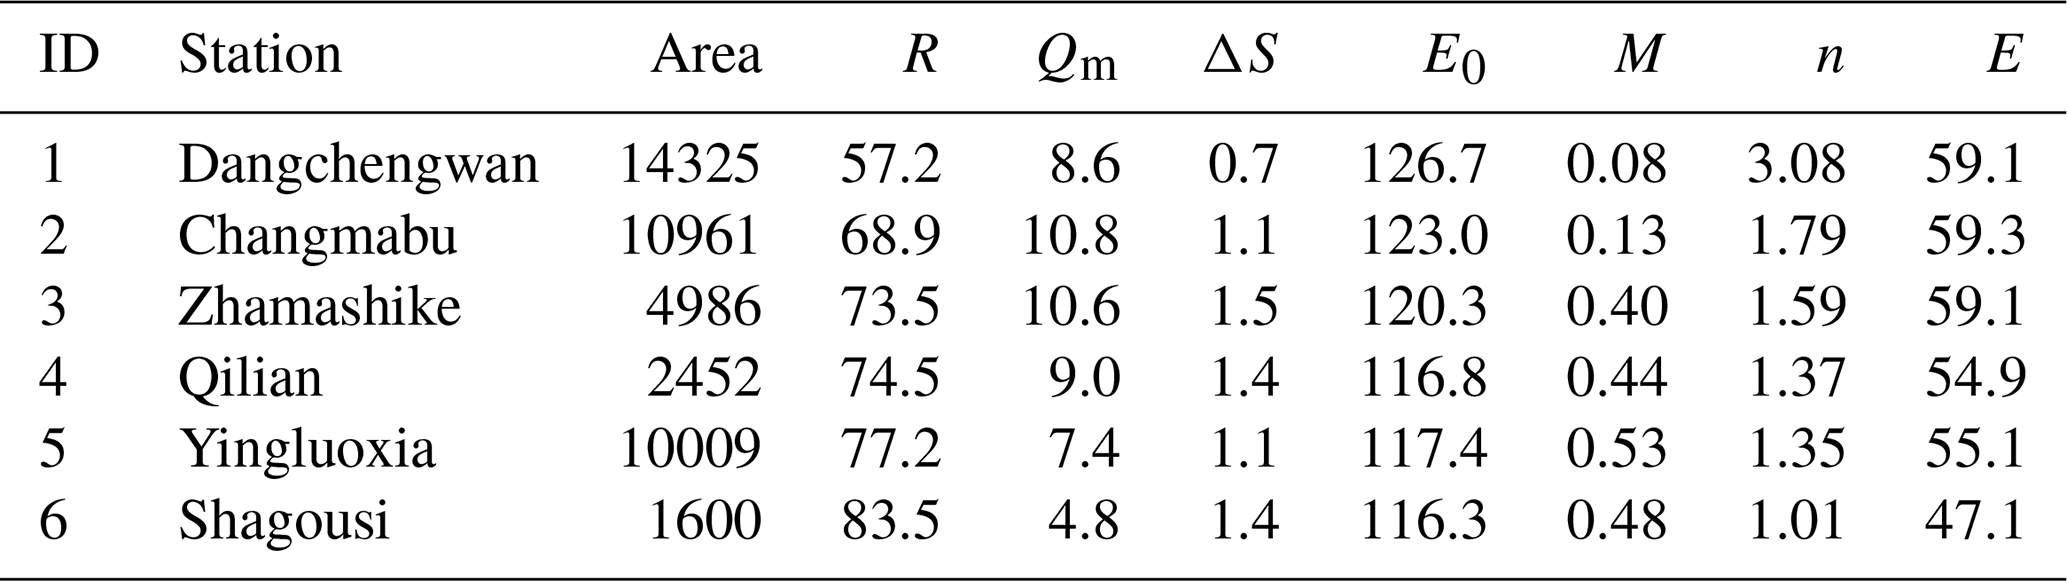
Table 2The elasticity coefficients of ET for five variables and the standard deviation of each variable for the six basins.
The change patterns of the monthly R, ΔS, Qm, and ET during the growing season are presented in Figs. 4 and S1–S3 in the Supplement. R exhibited a regular unimodal trend, with a maximum value occurring in July. The maximum Qm appeared in May, which is a result that is in agreement with previous studies in this region (Wang and Qin, 2017; Zhang et al., 2016c). The peak of ΔS lagged that of Qm for 1 month in Basins 1–4 and 3 months in Basins 5–6, indicating a recharge of soil water by snowmelt. Yang et al. (2015) also detected the time differences between ΔS and Qm and found that ΔS had a time lag of 3–4 months more than did Qm in the Tarim River Basin, another arid alpine basin in northwestern China with hydroclimatic conditions similar to those of the study region. Further, the abundant R in July should contribute to more available water for ΔS; however, the ΔS in July was relatively small. This can be partially explained by the higher water consumption, i.e. the ET in July. In a manner similar to the change pattern of R, ET exhibited a unimodal trend, suggesting the crucial role of R.
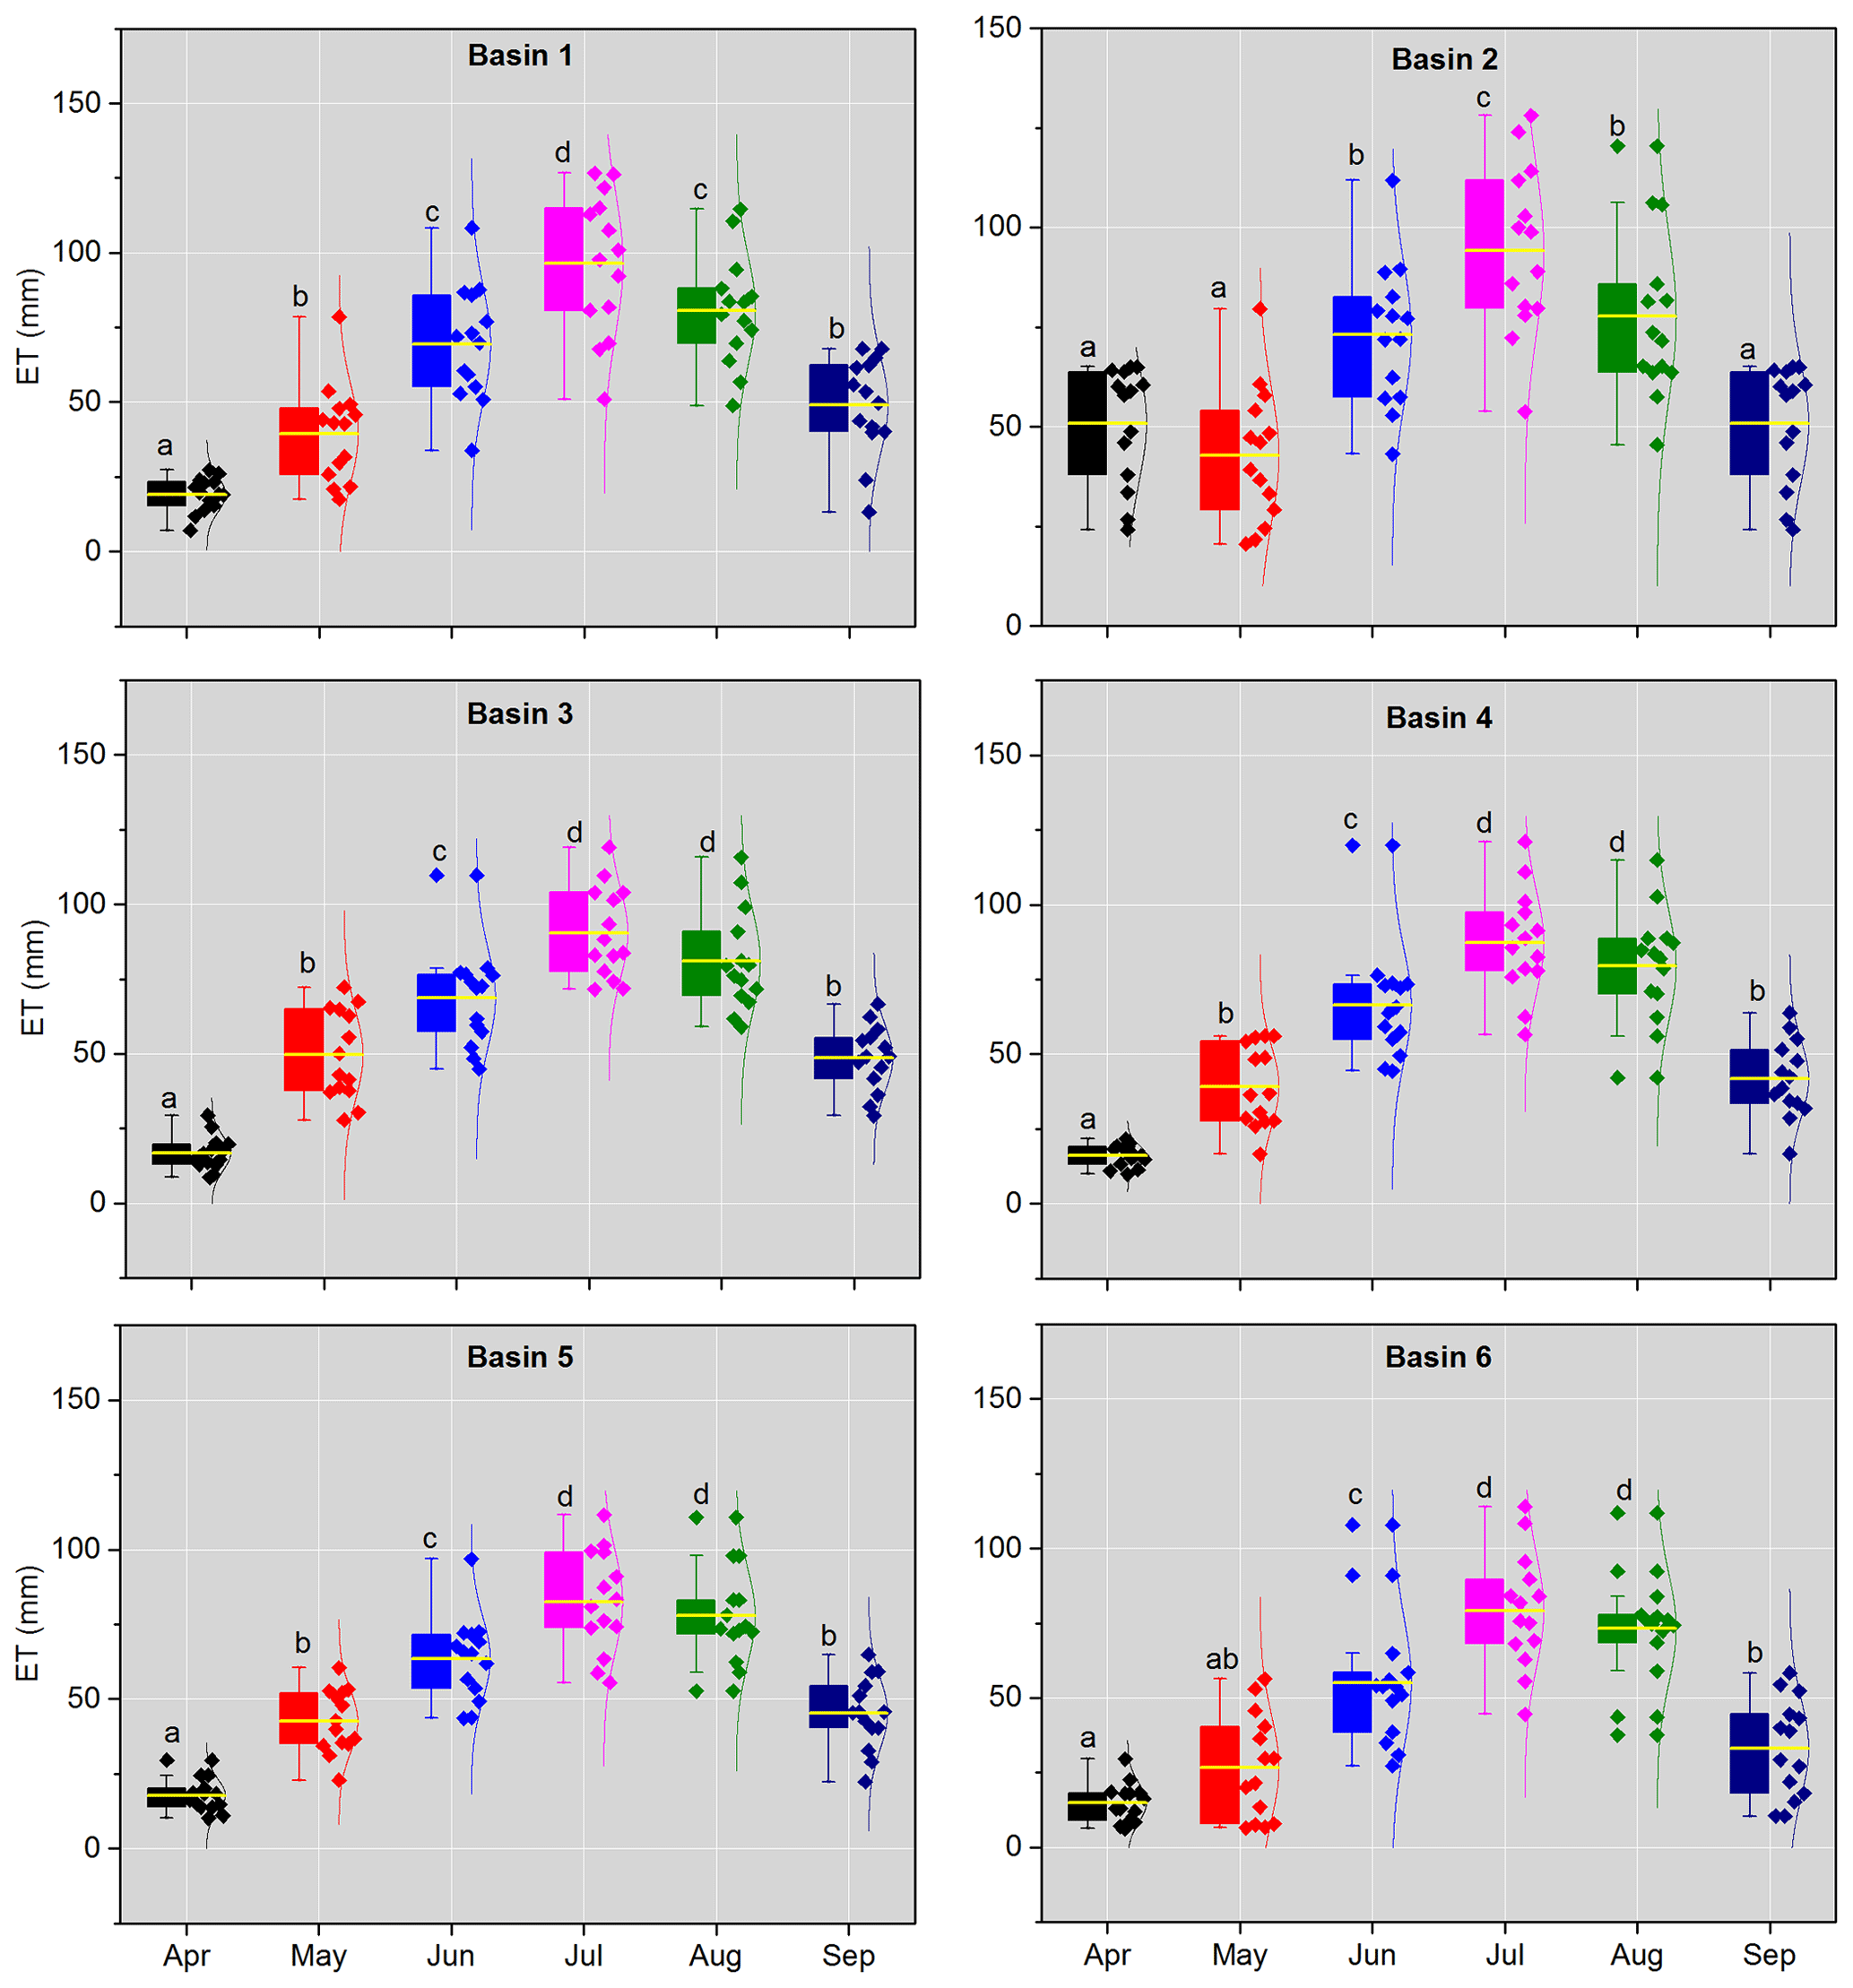
Figure 4Variations in the monthly ET for each basin during 2001–2014. A distribution curve is shown to the right side of each box plot, and the data points are represented by diamonds. Different letters indicate significant differences at p<0.05.
4.3 Controlling factors of the ET variance
The contributions of R, E0,Qm, ΔS,and M to for each basin are shown in Fig. 5. The results showed that the variance of these five factors could explain , with the total contribution rates ranging from 56.5 % (Basin 6) to 98.6 % (Basin 1). With the decreasing ϕ from Basin 1 to Basin 6, C(R) showed an increasing trend, ranging from 40.6 % to 94.2 %; conversely, C(E0) exhibited a decreasing trend, ranging from 0.2 % to 4.1 %. This result indicated that R played a key role in in this region. Similarly, Zhang et al. (2016a) found that C(P) increased rapidly with increasing ϕ, whereas C(E0) decreased rapidly based on 282 basins in China. Our results are also consistent with previous conclusions that changes in ET or Qr are dominated by changes in water conditions rather than by energy conditions in dry regions (Berghuijs et al., 2017; Yang et al., 2006; Zeng and Cai, 2016; Zhang et al., 2016a).
The M variance had the second largest contribution to with a mean C(M) value of 4.3 % for the six basins. Specifically, C(M) showed an increasing trend from 0.5 % to 9.5 % with the decreasing ϕ, implying that the contribution of vegetation change to ET variance was larger in relatively humid basin. It can be explained that transpiration is more sensitive to vegetation change and thus the higher vegetation coverage could increase the proportion of transpiration to ET in humid regions (Niu et al., 2019; Zhang et al., 2020). The Budyko hypothesis stated that a change in ET is controlled by a change in available energy when water supply is not a limiting factor under humid conditions (Budyko, 1974; Yang et al., 2006). The increasing M results in the reallocation of available energy between the canopy and soil. Specifically, more energy is consumed by the canopy and thus increases transpiration. Further, previous studies have found that ET differs greatly among species, because of the difference in canopy roughness, the timing of physiological functioning, water holding capacity of the soil, and rooting depth of the vegetation (Baldocchi et al., 2004; Bruemmer et al., 2012). Generally, forests had larger ET than grasslands (Ma et al., 2020; Zha et al., 2010). The fraction of forest area is relatively high and thus lead to the higher contributions to ET for the whole basin in the humid region. For example, Wei et al. (2018) showed that the global average variation in the annual Qr due to the vegetation cover change was 30.7±22.5 % in forest-dominated regions on long-term scales, which was higher than our results because of their higher forest cover.
The contribution of the Qm variance ranked third with a mean value of 1.8 %. Similar as C(R), C(Qm) showed a downward trend with the decreasing ϕ, ranging from 2.9 % to 0.4 %. The larger C(Qm) can be explained by the larger variance in Qm in Basins 2–4 (σ values in Table 2). However, the Qm in Basin 1 was only 8.6 mm, and C(Qm) was the largest in all six sub-basins (2.9 %). It can be explained that the contribution of each variable to was not only the product of the partial differential coefficients, but also relied on its variance value according to Eq. (14). Specifically, the partial differential coefficients of 0.1 for a variable means that a 10 % change in that variable may result in a change in ET by 1 %, which can only reflect the theoretical contribution of each variable. By multiplying the variance value, the actual contribution of each variable could be obtained. The value was the largest in Basin 1 and thus led to the largest C(Qm). In addition, shifts in the snowmelt period can also partially explain the positive contribution of the Qm variance. Like many snow-dominated regions of the world (Barnett et al., 2005), climate warming shifted the timing of snowmelt earlier in the spring in the Qilian Mountains (Li et al., 2012). Earlier snowmelt due to a warmer atmosphere resulted in increased soil moisture and a greater proportion of Qm to ET (Barnhart et al., 2016; Bosson et al., 2012).
Previous studies have considered that most precipitation changes are transferred to water storage (Wang and Hejazi, 2011); thus, ΔS has distinct impacts on the intra-annual ET or Qr variance in arid regions (Ye et al., 2016; Zeng and Cai, 2016; Zhang et al., 2016a). However, the study region under investigation has a small C(ΔS) with a mean value of 1.02 %, which is likely to be caused by the vegetation conditions and timescale. First, the six basins have higher vegetation coverage compared to other arid basins; consequently, plant transpiration and rainfall interception consume most of the water supply and reduce the transformation of rainfall to water storage. This is consistent with previous studies that showed that the fractional contribution of transpiration to ET would increase with increasing woody cover (Villegas et al., 2010; Wang et al., 2010b). Second, the large contribution of ΔS to the intra-annual ET or Qr variance in arid regions is mostly detected at monthly scales. The smaller ΔS in the non-growing season will increase the annual value of σΔS. However, this study focused on the growing season with a smaller σΔS, which consequently led to a lower C(ΔS).
4.4 Interaction effects between controlling factors on the ET variance
The interaction effect of two factors on the ET variance was represented by their covariance coefficients using Eqs. (15) and (16) (Fig. 5). Among the 10 groups of interaction effects, the coupled R and M had the largest contribution to the ET variance, with a mean value of 24.3 %. The positive covariance of R and M indicated that M changes in-phase with R (i.e. R occurred in the growing season), thus increasing the ET variance. C(R_M) showed an increasing trend from 9.9 % to 34.6 % with decreasing ϕ. With different water conditions, the types and proportions of the main ecosystems varied across basins. In particular, the forest cover showed an increasing trend with decreasing ϕ, which partially explained the spatial variations in C(R_M). Previous studies concluded that the differences in physiological and phenological characteristics of ecosystem types are likely to modulate the response of the ecosystem ET to climate variability (Bruemmer et al., 2012; Falge et al., 2002; Li et al., 2019a). For example, Yuan et al. (2010) found that at the beginning of the growing season a significantly higher ET was observed in evergreen needleleaf forests; however, during the middle term of the growing season (June–August), the ET was largest in deciduous broadleaf forests in a typical Alaskan basin.
As an indicator of climate seasonality, the covariance of R and E0 indicates matching conditions between the water and energy supplies, such as the phase difference between the storm season and warm season. A positive cov(R, E0) suggests an in-phase R change with E0 and consequently increases the ET variance. In this study, following C(R_M), the coupled R and E0 had a large impact on the ET variance with a mean contribution of 14.1 %. With a typical temperate continental climate, the study area has in-phase water and energy conditions; however, its ET is limited by the water supply in spite of the abundant energy supply (Yang et al., 2006). The vegetation receives the largest water supply in the growing season and can vary its biomass seasonally in order to adapt to the R seasonality (Potter et al., 2005; Ye et al., 2016). Consequently, the impact of climate variability on ET variance was mainly reflected by the R seasonality in the study area.
In comparison, the interacting effects between R and Qm, M and Qm, R and ΔS, and Qm and E0 contributed negatively to the ET variance. Among them, the effect of the coupled R and Qm was largest with a C(R_Qm) of −7.6 %. This may suggest that Qm changes were out of phase with R. Specifically, the major snow melting period was from March to May, when snowmelt water accounts for ∼70 % of the water supply; however, ∼65 % of the annual R occurred in the summer (June–August) (Li et al., 2019a). Overall, Qm sustains the ET in the spring, but R supports the ET in the summer.
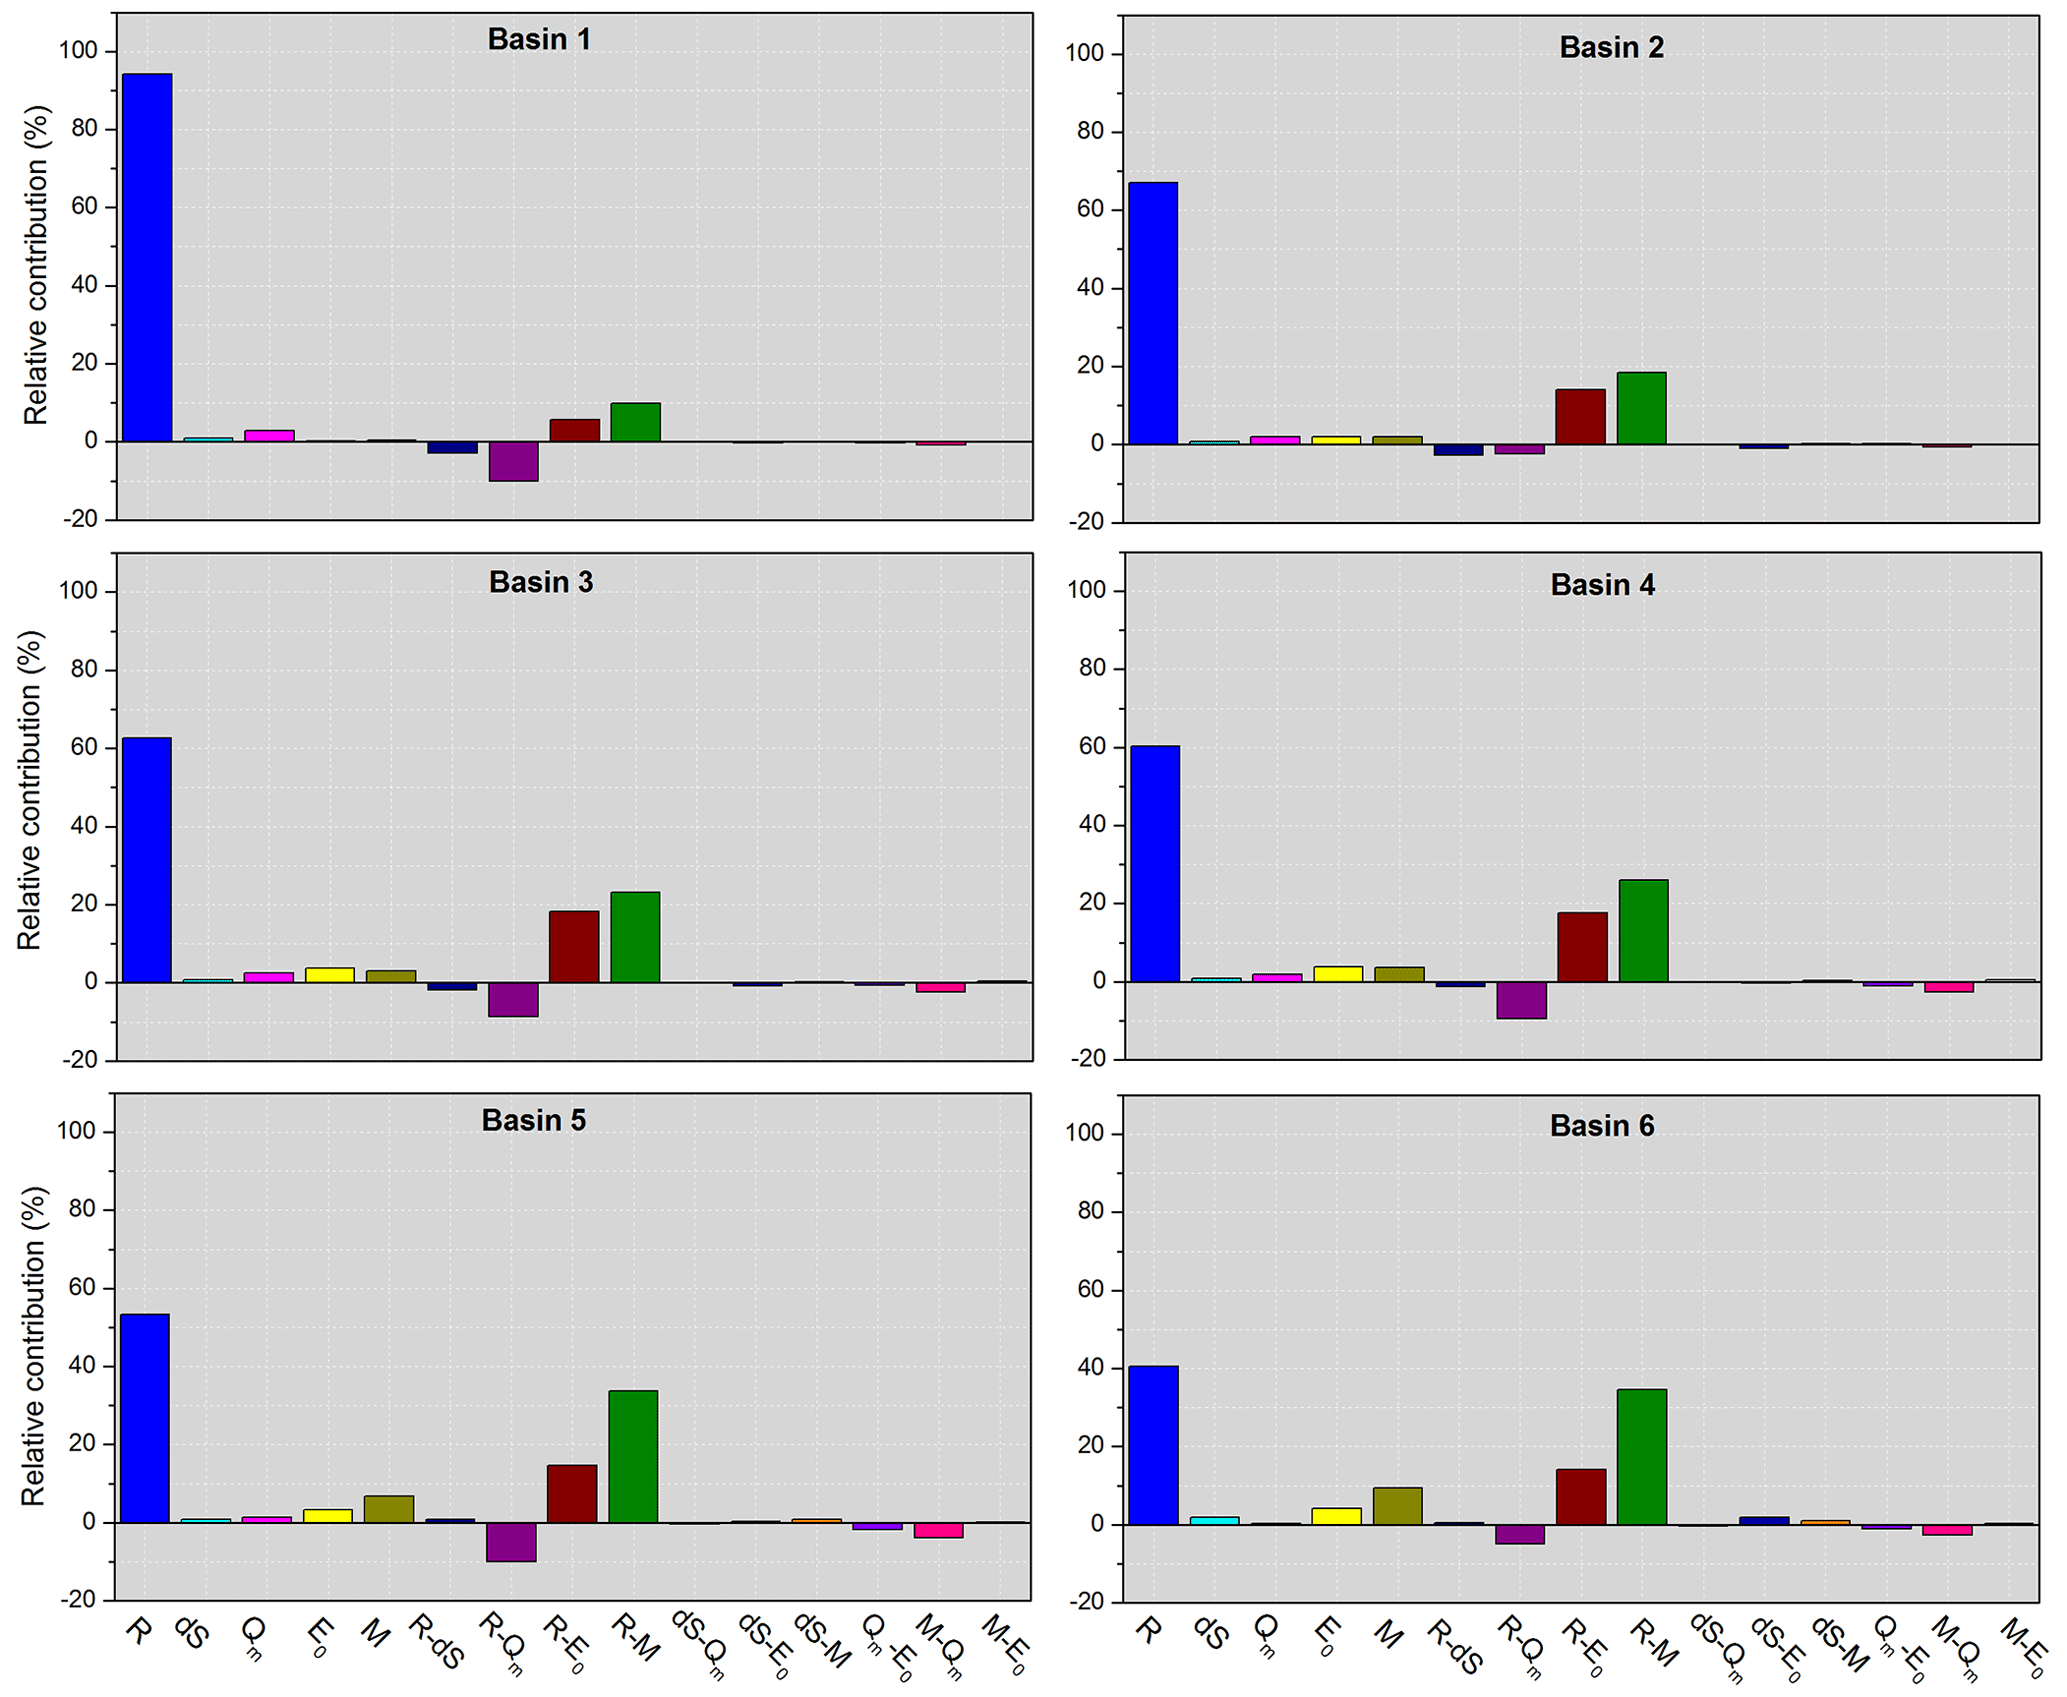
Figure 5Contribution to the ET variance in the growing season from each component in Eq. (15).
4.5 Uncertainties
Uncertainties from different sources may result in errors for this study. First, this study estimated ΔS and Qm with the GLDAS Noah land surface model and the degree-day model, respectively. Although the GLDAS_ΔS has been widely used in hydrological studies, it ignores the change in deep groundwater (Nie et al., 2016; Syed et al., 2008; Zhang et al., 2016a), which may lead to errors in ET estimation based on water balance equation. But previous studies showed that the groundwater change in our study area is relatively small and can thus be ignored. For example, Du et al. (2016) used the abcd model to quantitatively determine monthly variations of water balance for the sub-basins of Heihe River (including Basins 3–5 in our study) and found that the soil water storage change have obvious effects on the monthly water balance, whilst the impact of monthly groundwater storage change is negligible. Furthermore, it has been found that any change in climate conditions and underlying basin characteristics will affect the contributions of heat balance components and cause temporal variations of DDF (Kuusisto, 1980; Ohmura, 2001). But previous studies indicated that there is no significant seasonal change in DDF in western China (Zhang et al., 2006); as such, it is acceptable to estimate snowmelt runoff using fixed DDF values in this study. In comparison, the contribution of snow meltwater to runoff (Fs) was 12.9 % in Basin 2 during 1971-2015 using the Spatial Processes in Hydrology model (Li et al., 2019), while Fs was 25 % in Basin 3 from 2001 to 2012 based on geomorphology-based ecohydrological model (Li et al., 2018), <10 % in Basin 6 during 1961–2006 using the snowmelt runoff model (SRM) model (Gao et al., 2011). Our results indicated that the Fs in Basins 2, 3, and 6 were 14.8 %, 24.5 %, and 6.7 %, respectively, which were close to those from different models. Finally, the uncertainties of ΔS and Qm may lead to errors in ET estimation by the water balance equation. To validate the reliability of our estimated ET, the comparison with ETmap from May to September during 2012–2014 was conducted (Fig. S4 in the Supplement). The results showed that our estimated ET fitted well with ETmap and basically fell around the 1:1 line, indicating ET estimated using water balance equation by considering the items of ΔS and Qm is acceptable. However, it cannot be ignored that our estimated ET was generally lower than ETmap. The error of rainfall spatial interpolation may explain the underestimation of ET. Most meteorological stations are located at low elevations or in river valleys, but some stations are distributed in high elevations in the Qilian Mountains (Fig. 1). It has been found that rainfall in mountainous regions is generally larger than that in plain regions (Qiang et al., 2015). Even if the topography effect was considered for interpolation, it still resulted in bias in areal rainfall. The best method to improve the quality of spatial rainfall estimation is to increase the density of the monitoring network. However, this process is limited by harsh environment and funds (Buytaert et al., 2006). The error of rainfall will be transferred to contribution quantification of ET variance by underestimating the rainfall contribution while overestimating the Qm and ΔS contribution.
Second, previous studies concluded that three main factors could be responsible for the variability of n, including underlying physical conditions (such as soil and topography characteristics) (Milly, 1994; Yang et al., 2009), climate seasonality (such as the temporal variability of rainfall and mismatch between water and energy) (Ning et al., 2017; Potter et al., 2005), and vegetation dynamics (Donohue et al., 2007; Zhang et al., 2001). On the short timescale, the changes in soil and topography are negligible and its impact on the variability of n can be ignored. Consequently, the factors that should be considered are climate seasonality and vegetation dynamics. When parameterising n, this study considered M but ignored climate seasonality since the covariance item between R and E0, i.e. ε1ε4cov(R, E0) in Eq. (15), can represent climate seasonality. In addition, human influence represented by parameter n on the water balance cannot be ignored, which requires further investigation.
Recently, several studies have applied a variance decomposition framework based on the Budyko equation to elucidate the dominant driving factors of the ET variance at annual and intra-annual scales by decomposing the intra-annual ET variance into the variance and covariance of P, E0, and ΔS. Vegetation changes can greatly affect the ET variability but their effects on the ET variance on finer timescales was not quantified by this decomposed method. Further, in snow-dependent regions, the snowpack stores precipitation in winter and releases water in spring; thus, Qm plays an important role in the hydrological cycle. Therefore, it is also necessary to consider the role of the Qm changes on the ET variability.
In this study, six arid alpine basins in the Qilian Mountains of northwest China were chosen as examples. The monthly Qm during 2001–2014 was estimated using the degree-day model, and the growing season ET was calculated using the water balance equation (). The controlling parameter n of the Choudhury–Yang equation was found to be closely correlated with M, as estimated by NDVI data. Thus, by combining the Choudhury–Yang equation with the semi-empirical formula between n and M, the growing season is decomposed into the temporal variance and covariance of R, E0, ΔS,Qm, and M. The main results showed that considering Qm and ΔS in the water balance equation can improve the performance of the Budyko framework in snow-dependent basins on a monthly scale; was primarily enhanced by the R variance, followed by the coupled R and M and then the coupled R and E0. The enhancing effects of the variance in M and Qm cannot be ignored; however, the interactions between R and Qm, M and Qm, R and ΔS, and Qm and E0 dampened . As a simple and effective method, our extended ET variance decomposition method has the potential to be widely used to assess the hydrological responses to changes in the climate and vegetation in snow-dependent regions at finer timescales.
The Digital elevation data are available at http://www.gscloud.cn/sources/accessdata/310?pid=302 (Geospatial Data Cloud, 2021). Meteorological data are available at http://data.cma.cn/data/detail/dataCode/SURF_CLI_CHN_MUL_DAY_CES_V3.0.html (China Meteorological Data Service Center, 2012). The runoff records were obtained from the Bureau of Hydrology and Water Resources, Gansu Province. The GLDAS data are available at https://disc.gsfc.nasa.gov/datasets/GLDAS_NOAH025_M_2.0/summary (NASA, 2019). MODIS MOD10A2 Version 6 snow cover products are available at https://nsidc.org/data/mod10a2 (NASA, 2021a). MODIS MOD13A3.006 products are available at https://lpdaac.usgs.gov/products/mod13a3v006/ (NASA, 2021b). The dataset of “ground truth of land surface evapotranspiration at regional scale in the Heihe River Basin (2012–2016) ETmap Version 1.0” are available at http://data.tpdc.ac.cn/zh-hans/data (National Tibetan Plateau Data Center, 2019).
The supplement related to this article is available online at: https://doi.org/10.5194/hess-25-3455-2021-supplement.
TN was responsible for methodology, writing of the original draft, software and visualisation. ZL was responsible for writing the review and editing. QF was responsible for conceptualisation and supervision. ZL and YQ were responsible for data curation and resources.
The authors declare that they have no conflicts of interest.
This research has been supported by the National Natural Science Foundation of China (grant no. 41807160), Opening Research Foundation of Key Laboratory of Land Surface Process and Climate Change in Cold and Arid Regions, Chinese Academy of Sciences (grant no. LPCC 2020003), Forestry and Grassland Science and Technology Innovation Program of Gansu Province (grant no. GYCX[2020]01), Think Tank Platform Construction Program of Gansu Association for Science and Technology (grant no. GSAST-ZKPT[2020]01), the National Key R&D Program of China (grant no. SQ2019YFC050024-01), and the CAS “Light of West China” Program (grant no. Y929651001).
This paper was edited by Markus Hrachowitz and reviewed by two anonymous referees.
Baldocchi, D. D., Xu, L. K., and Kiang, N.: How plant functional-type, weather, seasonal drought, and soil physical properties alter water and energy fluxes of an oak-grass savanna and an annual grassland, Agr. Forest Meteorol., 123, 13–39, https://doi.org/10.1016/j.agrformet.2003.11.006, 2004.
Barnett, T. P., Adam, J. C., and Lettenmaier, D. P.: Potential impacts of a warming climate on water availability in snow-dominated regions, Nature, 438, 303–309, https://doi.org/10.1038/nature04141, 2005.
Barnhart, T. B., Molotch, N. P., Livneh, B., Harpold, A. A., Knowles, J. F., and Schneider, D.: Snowmelt rate dictates streamflow, Geophys. Res. Lett., 43, 8006–8016, https://doi.org/10.1002/2016gl069690, 2016.
Berghuijs, W. R., Larsen, J. R., Van Emmerik, T. H. M., and Woods, R. A.: A Global Assessment of Runoff Sensitivity to Changes in Precipitation, Potential Evaporation, and Other Factors, Water Resour. Res., 53, 8475–8486, https://doi.org/10.1002/2017WR021593, 2017.
Bosson, E., Sabel, U., Gustafsson, L.-G., Sassner, M., and Destouni, G.: Influences of shifts in climate, landscape, and permafrost on terrestrial hydrology, J. Geophys. Res.-Atmos., 117, D05120, https://doi.org/10.1029/2011jd016429, 2012.
Bourque, C. P. A. and Mir, M. A.: Seasonal snow cover in the Qilian Mountains of Northwest China: Its dependence on oasis seasonal evolution and lowland production of water vapour, J. Hydrol., 454, 141–151, https://doi.org/10.1016/j.jhydrol.2012.06.008, 2012.
Bruemmer, C., Black, T. A., Jassal, R. S., Grant, N. J., Spittlehouse, D. L., Chen, B., Nesic, Z., Amiro, B. D., Arain, M. A., Barr, A. G., Bourque, C. P. A., Coursolle, C., Dunn, A. L., Flanagan, L. B., Humphreys, E. R., Lafleur, P. M., Margolis, H. A., McCaughey, J. H., and Wofsy, S. C.: How climate and vegetation type influence evapotranspiration and water use efficiency in Canadian forest, peatland and grassland ecosystems, Agr. Forest Meteorol., 153, 14–30, https://doi.org/10.1016/j.agrformet.2011.04.008, 2012.
Budyko, M. I.: Climate and life, Academic, New York, USA, 1974.
Budyko, M. I. and Zubenok, L. I.: Determination of evaporation from the land surface, Izv. Akad. Nauk SSR, Ser. Geogr., 6, 3–17, 1961 (in Russian).
Buytaert, W., Celleri, R., Willems, P., Bièvre, B. D., and Wyseure, G.: Spatial and temporal rainfall variability in mountainous areas: A case study from the south Ecuadorian Andes, J. Hydrol., 329, 413–421, https://doi.org/10.1016/j.jhydrol.2006.02.031, 2006.
Chen, X., Alimohammadi, N., and Wang, D.: Modeling interannual variability of seasonal evaporation and storage change based on the extended Budyko framework, Water Resour. Res., 49, 6067–6078, https://doi.org/10.1002/wrcr.20493, 2013.
China Meteorological Data Service Center: Meteorological data, available at: http://data.cma.cn/data/detail/dataCode/SURF_CLI_CHN_MUL_DAY_CES_V3.0.html (last access: 10 June 2021), 2012.
Choudhury, B. J.: Evaluation of an empirical equation for annual evaporation using field observations and results from a biophysical model, J. Hydrol., 216, 99–110, https://doi.org/10.1016/s0022-1694(98)00293-5, 1999.
Cong, Z., Shahid, M., Zhang, D., Lei, H., and Yang, D.: Attribution of runoff change in the alpine basin: a case study of the Heihe Upstream Basin, China, Hydrolog. Sci. J., 62, 1013–1028, https://doi.org/10.1080/02626667.2017.1283043, 2017.
Deng, S., Yang, T., Zeng, B., Zhu, X., and Xu, H.: Vegetation cover variation in the Qilian Mountains and its response to climate change in 2000–2011, J. Mt. Sci.-Engl., 10, 1050–1062, https://doi.org/10.1007/s11629-013-2558-z, 2013.
Donohue, R. J., Roderick, M. L., and McVicar, T. R.: On the importance of including vegetation dynamics in Budyko's hydrological model, Hydrol. Earth Syst. Sci., 11, 983–995, https://doi.org/10.5194/hess-11-983-2007, 2007.
Du, C., Sun, F., Yu, J., Liu, X., and Chen, Y.: New interpretation of the role of water balance in an extended Budyko hypothesis in arid regions, Hydrol. Earth Syst. Sci., 20, 393–409, https://doi.org/10.5194/hess-20-393-2016, 2016.
Du, J., He, Z., Piatek, K. B., Chen, L., Lin, P., and Zhu, X.: Interacting effects of temperature and precipitation on climatic sensitivity of spring vegetation green-up in arid mountains of China, Agr. Forest Meteorol., 269, 71–77, https://doi.org/10.1016/j.agrformet.2019.02.008, 2019.
Falge, E., Baldocchi, D., Tenhunen, J., Aubinet, M., Bakwin, P., Berbigier, P., Bernhofer, C., Burba, G., Clement, R., Davis, K. J., Elbers, J. A., Goldstein, A. H., Grelle, A., Granier, A., Guomundsson, J., Hollinger, D., Kowalski, A. S., Katul, G., Law, B. E., Malhi, Y., Meyers, T., Monson, R. K., Munger, J. W., Oechel, W., Paw, K. T., Pilegaard, K., Rannik, U., Rebmann, C., Suyker, A., Valentini, R., Wilson, K., and Wofsy, S.: Seasonality of ecosystem respiration and gross primary production as derived from FLUXNET measurements, Agr. Forest Meteorol., 113, 53–74, https://doi.org/10.1016/S0168-1923(02)00102-8, 2002.
Feng, S., Liu, J., Zhang, Q., Zhang, Y., Singh, V. P., Gu, X., and Sun, P.: A global quantitation of factors affecting evapotranspiration variability, J. Hydrol., 584, 124688, https://doi.org/10.1016/j.jhydrol.2020.124688, 2020.
Feng, X., Fu, B., Piao, S., Wang, S., and Ciais, P.: Revegetation in China's Loess Plateau is approaching sustainable water resource limits, Nat. Clim. Change, 6, 1019–1022, https://doi.org/10.1038/nclimate3092, 2016.
Gao, X., Zhang, S., Ye, B., and Gao, H.: Recent changes of glacier runoff in the Hexi Inland river basin, Advances in Water Science, 22, 344–350, 2011 (in Chinese).
Geospatial Data Cloud: The Digital elevation data, available at: http://www.gscloud.cn/sources/accessdata/310?pid=302, last access: 10 June 2021.
Godsey, S. E., Kirchner, J. W., and Tague, C. L.: Effects of changes in winter snowpacks on summer low flows: case studies in the Sierra Nevada, California, USA, Hydrol. Process., 28, 5048–5064, https://doi.org/10.1111/j.1365-2486.2010.02273.x, 2014.
Griessinger, N., Seibert, J., Magnusson, J., and Jonas, T.: Assessing the benefit of snow data assimilation for runoff modeling in Alpine catchments, Hydrol. Earth Syst. Sci., 20, 3895–3905, https://doi.org/10.5194/hess-20-3895-2016, 2016.
Hock, R.: Temperature index melt modelling in mountain areas, J. Hydrol., 282, 104–115, https://doi.org/10.1016/s0022-1694(03)00257-9, 2003.
Huning, L. S. and AghaKouchak, A.: Mountain snowpack response to different levels of warming, P. Natl. Acad. Sci. USA, 115, 10932–10937, https://doi.org/10.1073/pnas.1805953115, 2018.
Katul, G. G., Oren, R., Manzoni, S., Higgins, C., and Parlange, M. B.: Evapotranspiration: a process driving mass transport and energy exchange in the soil-plant-atmosphere-cliamte system, Rev. Geophys., 50, RG3002, https://doi.org/10.1029/2011RG000366, 2012.
Koster, R. D. and Suarez, M. J.: A simple framework for examining the interannual variability of land surface moisture fluxes, J. Climate, 12, 1911–1917, https://doi.org/10.1175/1520-0442(1999)012<1911:asffet>2.0.co;2, 1999.
Kuusisto, E.: On the values and variability of degree-day melting factor in Finland, Nord. Hydrol., 11, 235–242, https://doi.org/10.1016/0022-1694(80)90029-3, 1980.
Li, B., Chen, Y., Chen, Z., and Li, W.: The Effect of Climate Change during Snowmelt Period on Streamflow in the Mountainous Areas of Northwest China, Acta Geographica Sinica, 67, 1461–1470, 2012 (in Chinese).
Li, D., Pan, M., Cong, Z., Zhang, L., and Wood, E.: Vegetation control on water and energy balance within the Budyko framework, Water Resour. Res., 49, 969–976, https://doi.org/10.1002/wrcr.20107, 2013.
Li, H., Zhao, Q., Wu, J., Ding, Y., Qin, J., Wei, H., and Zeng, D.: Quantitative simulation of the runoff components and its variation characteristics in the upstream of the Shule River, J. Glaciol. Geocryol., 41, 907–917, 2019 (in Chinese).
Li, L. L., Li, J., Chen, H. M., and Yu, R. C.: Diurnal Variations of Summer Precipitation over the Qilian Mountains in Northwest China, J. Meteorol. Res.-Prc., 33, 18–30, https://doi.org/10.1007/s13351-019-8103-4, 2019a.
Li, S., Zhang, L., Kang, S., Tong, L., Du, T., Hao, X., and Zhao, P.: Comparison of several surface resistance models for estimating crop evapotranspiration over the entire growing season in arid regions, Agr. Forest Meteorol., 208, 1–15, https://doi.org/10.1016/j.agrformet.2015.04.002, 2015.
Li, X., Cheng, G., Ge, Y., Li, H., Han, F., Hu, X., Tian, W., Tian, Y., Pan, X., Nian, Y., Zhang, Y., Ran, Y., Zheng, Y., Gao, B., Yang, D., Zheng, C., Wang, X., Liu, S., and Cai, X.: Hydrological Cycle in the Heihe River Basin and Its Implication for Water Resource Management in Endorheic Basins, J. Geophys. Res.-Atmos., 123, 890–914, https://doi.org/10.1002/2017jd027889, 2018.
Li, Z., Feng, Q., Wang, Q. J., Yong, S., Cheng, A., and Li, J.: Contribution from frozen soil meltwater to runoff in an in-land river basin under water scarcity by isotopic tracing in northwestern China, Global Planet. Change, 136, 41–51, https://doi.org/10.1016/j.gloplacha.2015.12.002, 2016.
Li, Z., Feng, Q., Li, Z., Yuan, R., Gui, J., and Lv, Y.: Climate background, fact and hydrological effect of multiphase water transformation in cold regions of the Western China: A review, Earth-Sci. Rev., 190, 33–57, https://doi.org/10.1016/j.earscirev.2018.12.004, 2019b.
Liu, J., Zhang, Q., Singh, V. P., Song, C., Zhang, Y., Sun, P., and Gu, X.: Hydrological effects of climate variability and vegetation dynamics on annual fluvial water balance in global large river basins, Hydrol. Earth Syst. Sci., 22, 4047–4060, https://doi.org/10.5194/hess-22-4047-2018, 2018.
Liu, J., Zhang, Q., Feng, S., Gu, X., Singh, V. P., and Sun, P.: Global Attribution of Runoff Variance Across Multiple Timescales, J. Geophys. Res.-Atmos., 124, 13962–13974, https://doi.org/10.1029/2019jd030539, 2019.
Ma, S., Eichelmann, E., Wolf, S., Rey-Sanchez, C., and Baldocchi, D. D.: Transpiration and evaporation in a Californian oak-grass savanna: Field measurements and partitioning model results, Agr. Forest Meteorol., 295, 108204, https://doi.org/10.1016/j.agrformet.2020.108204, 2020.
Ma, Z., Kang, S., Zhang, L., Tong, L., and Su, X.: Analysis of impacts of climate variability and human activity on streamflow for a river basin in arid region of northwest China, J. Hydrol., 352, 239–249, https://doi.org/10.1016/j.jhydrol.2007.12.022, 2008.
Matin, M. A. and Bourque, C. P. A.: Mountain-river runoff components and their role in the seasonal development of desert-oases in northwest China, J. Arid Environ., 122, 1–15, https://doi.org/10.1016/j.jaridenv.2015.05.011, 2015.
Maurya, A. S., Rai, S. P., Joshi, N., Dutt, K. S., and Rai, N.: Snowmelt runoff and groundwater discharge in Himalayan rivers: a case study of the Satluj River, NW India, Environ. Earth Sci., 77, 694, https://doi.org/10.1007/s12665-018-7849-9, 2018.
Milly, P. C. D.: Climate,soil-water storage, and the average annual water-balance, Water Resour. Res., 30, 2143–2156, https://doi.org/10.1029/94wr00586, 1994.
NASA: GLDAS data, available at https://disc.gsfc.nasa.gov/datasets/GLDAS_NOAH025_M_2.0/summary (last access: 10 June 2021), 2019.
NASA: MODIS MOD10A2 Version 6 snow cover products, available at: https://nsidc.org/data/mod10a2, last access: 10 June 2021a.
NASA: MODIS MOD13A3.006 products, available at: https://lpdaac.usgs.gov/products/mod13a3v006/, last access: 10 June 2021b.
National Tibetan Plateau Data Center: Ground truth of land surface evapotranspiration at regional scale in the Heihe River Basin (2012–2016) ETmap Version 1.0, available at: http://data.tpdc.ac.cn/zh-hans/data (last access: 10 June 2021), 2019.
Nie, N., Zhang, W. C., Zhang, Z. J., Guo, H. D., and Ishwaran, N.: Reconstructed Terrestrial Water Storage Change (Delta TWS) from 1948 to 2012 over the Amazon Basin with the Latest GRACE and GLDAS Products, Water Resour. Manag., 30, 279–294, https://doi.org/10.1007/s11269-015-1161-1, 2016.
Ning, T., Li, Z., and Liu, W.: Vegetation dynamics and climate seasonality jointly control the interannual catchment water balance in the Loess Plateau under the Budyko framework, Hydrol. Earth Syst. Sci., 21, 1515–1526, https://doi.org/10.5194/hess-21-1515-2017, 2017.
Ning, T., Li, Z., Feng, Q., Chen, W., and Li, Z.: Effects of forest cover change on catchment evapotranspiration variation in China, Hydrol. Process., 34, 2219–2228, https://doi.org/10.1002/hyp.13719, 2020.
Niu, Z., He, H., Zhu, G., Ren, X., Zhang, L., Zhang, K., Yu, G., Ge, R., Li, P., Zeng, N., and Zhu, X.: An increasing trend in the ratio of transpiration to total terrestrial evapotranspiration in China from 1982 to 2015 caused by greening and warming, Agr. Forest Meteorol., 279, 107701, https://doi.org/10.1016/j.agrformet.2019.107701, 2019.
Ohmura, A.: Physical basis for the temperature-based melt-index method, J. Appl. Meteorol., 40, 753–761, https://doi.org/10.1175/1520-0450(2001)040<0753:pbfttb>2.0.co;2, 2001.
Potter, N. J., Zhang, L., Milly, P. C. D., McMahon, T. A., and Jakeman, A. J.: Effects of rainfall seasonality and soil moisture capacity on mean annual water balance for Australian catchments, Water Resour. Res., 41, W06007, https://doi.org/10.1029/2004wr003697, 2005.
Priestley, C. and Taylor, R.: On the assessment of surface heat flux and evaporation using large-scale parameters, Mon. Weather Rev., 100, 81–92, 1972.
Qiang, F., Zhang, M. J., Wang, S., Liu, Y., Ren, Z., and Zhu, X.: Changes of areal precipitation based on gridded dataset in Qilian Mountains during 1961–2012, Acta Geographica Sinica, 70, 1125–1136, 2015 (in Chinese).
Qin, Y., Abatzoglou, J. T., Siebert, S., Huning, L. S., AghaKouchak, A., Mankin, J. S., Hong, C., Tong, D., Davis, S. J., and Mueller, N. D.: Agricultural risks from changing snowmelt, Nat. Clim. Change, 10, 459–465, https://doi.org/10.1038/s41558-020-0746-8, 2020.
Ragettli, S., Pellicciotti, F., Immerzeel, W. W., Miles, E. S., Petersen, L., Heynen, M., Shea, J. M., Stumm, D., Joshi, S., and Shrestha, A.: Unraveling the hydrology of a Himalayan catchment through integration of high resolution in situ data and remote sensing with an advanced simulation model, Adv. Water Resour., 78, 94–111, https://doi.org/10.1016/j.advwatres.2015.01.013, 2015.
Rice, R., Bales, R. C., Painter, T. H., and Dozier, J.: Snow water equivalent along elevation gradients in the Merced and Tuolumne River basins of the Sierra Nevada, Water Resour. Res., 47, W08515, https://doi.org/10.1029/2010wr009278, 2011.
Rodriguez-Iturbe, I.: Ecohydrology: A hydrologic perspective of climate-soil-vegetation dynamics, Water Resour. Res., 36, 3–9, https://doi.org/10.1029/1999wr900210, 2000.
Semadeni-Davies, A.: Monthly snowmelt modelling for large-scale climate change studies using the degree day approach, Ecol. Model., 101, 303–323, https://doi.org/10.1016/s0304-3800(97)00054-9, 1997.
Stewart, I. T.: Changes in snowpack and snowmelt runoff for key mountain regions, Hydrol. Process., 23, 78–94, https://doi.org/10.1002/hyp.7128, 2009.
Stewart, I. T., Cayan, D. R., and Dettinger, M. D.: Changes toward earlier streamflow timing across western North America, J. Climate, 18, 1136–1155, https://doi.org/10.1175/jcli3321.1, 2005.
Syed, T. H., Famiglietti, J. S., Rodell, M., Chen, J., and Wilson, C. R.: Analysis of terrestrial water storage changes from GRACE and GLDAS, Water Resour. Res., 44, W02433, https://doi.org/10.1029/2006WR005779, 2008.
Villegas, J. C., Breshears, D. D., Zou, C. B., and Law, D. J.: Ecohydrological controls of soil evaporation in deciduous drylands: How the hierarchical effects of litter, patch and vegetation mosaic cover interact with phenology and season, J. Arid Environ., 74, 595–602, https://doi.org/10.1016/j.jaridenv.2009.09.028, 2010.
Wagle, P. and Kakani, V. G.: Growing season variability in evapotranspiration, ecosystem water use efficiency, and energy partitioning in switchgrass, Ecohydrology, 7, 64–72, https://doi.org/10.1002/eco.1322, 2014.
Wang, D. and Hejazi, M.: Quantifying the relative contribution of the climate and direct human impacts on mean annual streamflow in the contiguous United States, Water Resour. Res., 47, W00J12, https://doi.org/10.1029/2010wr010283, 2011.
Wang, J. and Li, S.: The influence of climate change on snowmelt runoff variation in arid alpine regions of China, Science in China Ser. D Earth Sciences, 35, 664–670, 2005 (in Chinese).
Wang, J. and Li, W.: Establishing snowmelt runoff simulating model using remote sensing data and GIS in the west of China, Int. J. Remote Sens., 22, 3267–3274, https://doi.org/10.1080/01431160010030082, 2001.
Wang, J., Li, H., and Hao, X.: Responses of snowmelt runoff to climatic change in an inland river basin, Northwestern China, over the past 50 years, Hydrol. Earth Syst. Sci., 14, 1979–1987, https://doi.org/10.5194/hess-14-1979-2010, 2010a.
Wang, K., Wang, P., Li, Z., Cribb, M., and Sparrow, M.: A simple method to estimate actual evapotranspiration from a combination of net radiation, vegetation index, and temperature, J. Geophys. Res.-Atmos., 112, D15107, https://doi.org/10.1029/2006jd008351, 2007.
Wang, L., Caylor, K. K., Villegas, J. C., Barron-Gafford, G. A., Breshears, D. D., and Huxman, T. E.: Partitioning evapotranspiration across gradients of woody plant cover: Assessment of a stable isotope technique, Geophys. Res. Lett., 37, L09401, https://doi.org/10.1029/2010GL043228, 2010b.
Wang, R., Yao, Z., Liu, Z., Wu, S., Jiang, L., and Wang, L.: Snow cover variability and snowmelt in a high-altitude ungauged catchment, Hydrol. Process., 29, 3665–3676, https://doi.org/10.1002/hyp.10472, 2015.
Wang, Y. J. and Qin, D. H.: Influence of climate change and human activity on water resources in arid region of Northwest China: An overview, Advances in Climate Change Research, 8, 268–278, https://doi.org/10.1016/j.accre.2017.08.004, 2017.
Wei, X., Li, Q., Zhang, M., Giles-Hansen, K., Liu, W., Fan, H., Wang, Y., Zhou, G., Piao, S., and Liu, S.: Vegetation cover-another dominant factor in determining global water resources in forested regions, Global Change Biol., 24, 786–795, https://doi.org/10.1111/gcb.13983, 2018.
Wu, C., Hu, B. X., Huang, G., and Zhang, H.: Effects of climate and terrestrial storage on temporal variability of actual evapotranspiration, J. Hydrol., 549, 388–403, https://doi.org/10.1016/j.jhydrol.2017.04.012, 2017.
Wu, F., Zhan, J., Wang, Z., and Zhang, Q.: Streamflow variation due to glacier melting and climate change in upstream Heihe River Basin, Northwest China, Phys. Chem. Earth, 79–82, 11–19, https://doi.org/10.1016/j.pce.2014.08.002, 2015.
Xu, C. Y. and Singh, V. P.: Evaluation of three complementary relationship evapotranspiration models by water balance approach to estimate actual regional evapotranspiration in different climatic regions, J. Hydrol., 308, 105–121, https://doi.org/10.1016/j.jhydrol.2004.10.024, 2005.
Xu, T., Guo, Z., Liu, S., He, X., Meng, Y., Xu, Z., Xia, Y., Xiao, J., Zhang, Y., and Ma, Y.: Evaluating Different Machine Learning Methods for Upscaling Evapotranspiration from Flux Towers to the Regional Scale, J. Geophys. Res.-Atmos., 123, 8674–8690, https://doi.org/10.1029/2018JD028447, 2018.
Xu, X., Liu, W., Scanlon, B. R., Zhang, L., and Pan, M.: Local and global factors controlling water-energy balances within the Budyko framework, Geophys. Res. Lett., 40, 6123–6129, https://doi.org/10.1002/2013gl058324, 2013.
Yang, D., Shao, W., Yeh, P. J. F., Yang, H., Kanae, S., and Oki, T.: Impact of vegetation coverage on regional water balance in the nonhumid regions of China, Water Resour. Res., 45, W00A14, https://doi.org/10.1029/2008wr006948, 2009.
Yang, D. W., Sun, F. B., Liu, Z. T., Cong, Z. T., and Lei, Z. D.: Interpreting the complementary relationship in non-humid environments based on the Budyko and Penman hypotheses, Geophys. Res. Lett., 33, L18402, https://doi.org/10.1029/2006wr005224, 2006.
Yang, H. B., Yang, D. W., Lei, Z. D., and Sun, F. B.: New analytical derivation of the mean annual water-energy balance equation, Water Resour. Res., 44, W03410, https://doi.org/10.1029/2007wr006135, 2008.
Yang, L., Feng, Q., Yin, Z., Wen, X., Si, J., Li, C., and Deo, R. C.: Identifying separate impacts of climate and land use/cover change on hydrological processes in upper stream of Heihe River, Northwest China, Hydrol. Process., 31, 1100–1112, https://doi.org/10.1002/hyp.11098, 2017.
Yang, T., Wang, C., Chen, Y., Chen, X., and Yu, Z.: Climate change and water storage variability over an arid endorheic region, J. Hydrol., 529, 330–339, https://doi.org/10.1016/j.jhydrol.2015.07.051, 2015.
Ye, S., Li, H. Y., Li, S., Leung, L. R., Demissie, Y., Ran, Q., and Blöschl, G.: Vegetation regulation on streamflow intra-annual variability through adaption to climate variations, Geophys. Res. Lett., 42, 10307–10315, https://doi.org/10.1002/2015gl066396, 2016.
Yuan, W., Liu, S., Liu, H., Randerson, J. T., Yu, G., and Tieszen, L. L.: Impacts of precipitation seasonality and ecosystem types on evapotranspiration in the Yukon River Basin, Alaska, Water Resour. Res., 46, W02514, https://doi.org/10.1029/2009wr008119, 2010.
Zeng, R. and Cai, X.: Assessing the temporal variance of evapotranspiration considering climate and catchment storage factors, Adv. Water Resour., 79, 51–60, https://doi.org/10.1016/j.advwatres.2015.02.008, 2015.
Zeng, R. and Cai, X.: Climatic and terrestrial storage control on evapotranspiration temporal variability: Analysis of river basins around the world, Geophys. Res. Lett., 43, 185–195, https://doi.org/10.1002/2015gl066470, 2016.
Zha, T., Barr, A. G., van der Kamp, G., Black, T. A., McCaughey, J. H., and Flanagan, L. B.: Interannual variation of evapotranspiration from forest and grassland ecosystems in western canada in relation to drought, Agr. Forest Meteorol., 150, 1476–1484, https://doi.org/10.1016/j.agrformet.2010.08.003, 2010.
Zhang, D., Cong, Z., Ni, G., Yang, D., and Hu, S.: Effects of snow ratio on annual runoff within the Budyko framework, Hydrol. Earth Syst. Sci., 19, 1977–1992, https://doi.org/10.5194/hess-19-1977-2015, 2015.
Zhang, D., Liu, X., Zhang, Q., Liang, K., and Liu, C.: Investigation of factors affecting intra-annual variability of evapotranspiration and streamflow under different climate conditions, J. Hydrol., 543, 759–769, https://doi.org/10.1016/j.jhydrol.2016.10.047, 2016a.
Zhang, D., Liu, X., Zhang, L., Zhang, Q., Gan, R., and Li, X.: Attribution of Evapotranspiration Changes in Humid Regions of China from 1982 to 2016, J. Geophys. Res.-Atmos., 125, e2020JD032404, https://doi.org/10.1029/2020jd032404, 2020.
Zhang, L., Dawes, W. R., and Walker, G. R.: Response of mean annual evapotranspiration to vegetation changes at catchment scale, Water Resour. Res., 37, 701–708, https://doi.org/10.1029/2000wr900325, 2001.
Zhang, J., Liu, S., and Ding, Y.: Spatial variation of degree-day factors on the observed glaciers in Western China, Acta Geographica Sinica, 61, 89–98, 2006 (in Chinese).
Zhang, S., Yang, H., Yang, D., and Jayawardena, A. W.: Quantifying the effect of vegetation change on the regional water balance within the Budyko framework, Geophys. Res. Lett., 43, 1140–1148, https://doi.org/10.1002/2015gl066952, 2016b.
Zhang, Y., Luo, Y., Sun, L., Liu, S., Chen, X., and Wang, X.: Using glacier area ratio to quantify effects of melt water on runoff, J. Hydrol., 538, 269–277, https://doi.org/10.1016/j.jhydrol.2016.04.026, 2016c.
Zhou, S., Yu, B., Huang, Y., and Wang, G.: The complementary relationship and generation of the Budyko functions, Geophys. Res. Lett., 42, 1781–1790, https://doi.org/10.1002/2015gl063511, 2015.