the Creative Commons Attribution 4.0 License.
the Creative Commons Attribution 4.0 License.
 | 15 Jun 2021
Hydrological response to warm and dry weather: do glaciers compensate?
Marit Van Tiel
Anne F. Van Loon
Jan Seibert
Kerstin Stahl
Warm and dry summer days can lead to low streamflow due to a lack of rainfall and increased evaporation. In glacierized catchments, however, such periods can lead to a very different hydrological response as glaciers can supply an increased amount of meltwater, thereby compensating for the rainfall deficits. Here, we analyzed glacier-fed streamflow responses to warm and dry (WD) periods in long-term streamflow observations (>50 years). WD events during summer (June–September) were analyzed for catchments with varying glacier cover in western Canada, southwestern Norway, and the European Alps. WD events were defined by days with temperatures above a daily varying threshold, based on the 80th percentile of the respective long-term temperature data for that day in the year, and daily precipitation sums below a fixed threshold (<2 mm d−1) for a minimum duration of 7 d. Streamflow responses to these WD events were expressed as level of compensation (C) and were calculated as the event streamflow relative to the long-term streamflow regime. C≥100 % indicates that increased melt and other catchment storages could compensate, or even overcompensate, the rainfall deficit and increased evaporation. Results showed a wide range of compensation levels, both between catchments and between different WD events in a particular catchment. C was, in general, higher than 100 % for catchments with a relative glacier cover higher than 5 %–15 %, depending on region and month. June was the month with highest compensation levels, but this was likely more influenced by snowmelt than by glacier melt. For WD events in September, C was still higher than 100 % in many catchments, which likely indicates the importance of glacier melt as a streamflow contributor in late summer. There was a considerable range in C of different WD events for groups of catchments with similar glacier cover. This could be partly explained by antecedent conditions, such as the amount of snow fallen in the previous winter and the streamflow conditions 30 d before the WD event. Some decreasing trends in C were evident, especially for catchments in western Canada and the European Alps. Overall, our results suggest that glaciers do not compensate straightforwardly, and the range in compensation levels is large. The different streamflow components – glacier, snow and rain – and their variations are important for the buffering capacity and the compensating effect of glaciers in these high mountain water systems.
- Article
(3906 KB) - Full-text XML
-
Supplement
(338 KB) - BibTeX
- EndNote


Dry periods and heat waves negatively affect water availability (e.g., Stahl et al., 2016; Teuling, 2018; van Loon, 2015; Zappa and Kan, 2007). Dry periods or meteorological droughts (i.e., relatively dry periods) alter the water input of hydrological systems, while heat waves or relatively warm periods increase evapotranspiration amounts if enough water is available (e.g., Mastrotheodoros et al., 2020; Teuling et al., 2013). In water balance terms, this means that during such combined dry and warm periods, streamflow decreases, and soil and groundwater storages are depleted. The summer of 2003 in Europe was an example of such a dry and hot period (Fink et al., 2004), which caused numerous negative effects, e.g., low water levels limiting transportation, reduced agricultural production, problems with water supply, and forest fires (COGECA, 2003; Jonkeren et al., 2007; Rouault et al., 2006; Stahl et al., 2016). However, in some glacierized catchments in, for example, Switzerland and Austria, streamflow was above the long-term average during this extreme summer (Koboltschnig et al., 2009; Koboltschnig and Schöner, 2011; Zappa and Kan, 2007). In high mountain regions, snow and ice storages provide an additional source of water, especially during warm and dry periods, because of temperature-driven instead of only precipitation-driven water supply.
Several studies have shown that the hydrological response of glacierized catchments in drought years stands out when analyzing a regional sample of catchments (e.g., Bakke et al., 2020; Zappa and Kan, 2007). While groundwater and snow are also known to act as a buffer against meteorological droughts, these storages can also be depleted themselves and can be considered to be in a state of drought (e.g., Cooper et al., 2016; Hellwig and Stahl, 2018; Livneh and Badger, 2020; Van Loon and Van Lanen, 2012), which is sometimes referred to as “groundwater drought” (Bloomfield and Marchant, 2013; Peters et al., 2005) and “snow drought” (Huning and AghaKouchak, 2020). The buffer capacities of these three types of catchment storage (groundwater, snow, and glaciers) differ. Groundwater has a delayed response to meteorological droughts and therefore, at the time of the event, can provide baseflow. Still, it does not provide extra water during warm and dry periods (compared to normal conditions). In contrast, snow and glacier ice will provide more meltwater when temperatures are high. Therefore, not only do snow and glaciers act as a buffer, but their meltwater could also compensate the otherwise emerging streamflow deficit. For seasonal snow, however, there is a limited amount to melt, namely the snow that has accumulated in winter. Hence, groundwater only has a limited buffering capacity because in terms of runoff, it only provides baseflow. Snow, in contrast, has a higher buffering capacity in terms of additional runoff but is temporally limited because if the snow has melted, there is no direct buffer anymore. Glaciers are theoretically a favorable buffer during warm and dry periods because they generate extra melt when temperatures are higher than normal, and they do not get depleted on an annual timescale. To distinguish these different buffer characteristics, we refer to compensation processes when describing the active role of glacier melt adding additional water and buffering when describing the general function of catchment storages providing water when precipitation input is low. Such a distinction is important to quantify the effect of glacier melt during dry periods.
The buffering effect of glaciers has been analyzed at different spatial and temporal scales. In general, studies indicate that glaciers provide an important source of water during warmer and drier periods throughout the year and during drought years specifically (e.g., Ayala et al., 2020; Jost et al., 2012; Kaser et al., 2010; Anderson and Radić, 2020). During extreme drought years, runoff from melting glaciers was estimated to contribute 55 %–100 % to summer runoff in the Maipo river basin in Chile (7.8 % glacierized) (Ayala et al., 2020), and during the 2003 European drought and heat wave event, streamflow in glacierized catchments in the Alps was up to 40 %–60 % higher than normal during August, depending on glacier cover fraction of the catchment and catchment elevation (Zappa and Kan, 2007; Koboltschnig and Schöner, 2011). For the whole High Mountain Asia region, Pritchard (2019) also found high relative monthly glacier melt contributions to streamflow in drought years but mainly attributed this to a decrease in precipitation amounts. Often, these conclusions are drawn from modeling exercises that allow separating the glacier melt contribution from other streamflow contributions such as snowmelt, rainfall runoff, and groundwater. However, modeling these glacierized hydrological systems is a challenge because of the many intertwined hydrological processes (Finger et al., 2011; Konz and Seibert, 2010; van Tiel et al., 2020b). Hence, models may only give a rough estimation of the different streamflow contributions and may not adequately simulate the hydrological processes during extreme warm and dry periods.
Other studies focused on the dampening effect of glaciers on the overall interannual streamflow variability (Fountain and Tangborn, 1985; Rothlisberger and Lang, 1987). During warm and dry years, glaciers can provide more meltwater to streamflow, and during cold and wet years they generate less meltwater so that altogether the interannual streamflow variability is relatively low. Pohl et al. (2017) found for the Pamir region that during years with strong negative anomalies of runoff and snowmelt in the non-glacierized areas, glacier melt was high. And contrastingly, during a year with high precipitation amounts and low temperatures, glacier melt showed negative anomalies. Whether the amount of runoff from glaciers has a dampening effect on the interannual streamflow variability or not is assumed to depend on the catchment's relative glacier cover (e.g., Chen and Ohmura, 1990; Fountain and Tangborn, 1985; Pohl et al., 2017). Studies found optimum relative glacier covers (dampening the most) between 10 % and 40 % glacier cover (e.g., van Tiel et al., 2020a). However, besides relative glacier cover, other climate and catchment characteristics, such as precipitation distribution and catchment storage capacities, also appear to influence the streamflow sensitivity to climatic anomalies (Pohl et al., 2017; van Tiel et al., 2020a).
Glacier melt can thus be important to maintain streamflow during dry (and warm) periods. However, due to climate change and warming, mountain glaciers around the globe have been retreating and will further do so in the future (e.g., Radić et al., 2014; Zemp et al., 2015), affecting not only total downstream runoff but also compensation effects during dry periods. The negative glacier mass balances that have been prevalent in recent years for all glaciers worldwide (e.g., Andreassen et al., 2005; Fischer et al., 2015; Zemp et al., 2015) provided an additional source of water in the summer in addition to the seasonally delayed contribution. However, additional meltwater from shrinking glaciers will not be sustained forever (e.g., Pritchard, 2019; Huss and Hock, 2018; Jansson et al., 2003). Several studies have shown that some glacierized mountain regions already show declining streamflow trends, while for other regions the moment of change from increasing to decreasing trends (peak water) is projected in the future (Chesnokova et al., 2020; Huss and Hock, 2018; Moore et al., 2020; Stahl and Moore, 2006). The question that remains open is whether we can also (already) observe a decrease in glacier compensation capacity during specific warm and dry periods.
While most previous studies have looked at (a) relatively dry (drought) year(s) or summer(s) to analyze the glacier buffer effect, we focus here on the hydrological response to specific warm and dry events, i.e., short periods that are characterized by days with no to very low rain amounts and days with relatively high temperatures. This short timescale isolates the glacier compensation effect on streamflow and minimizes confounding other hydrological processes that might affect more aggregated signals. The chosen timescale enables the investigation of the compensation effect in different months during the summer and the analysis of multiple periods to detect possible trends. Moreover, this timescale is pivotal for water management because it will give insights into the streamflow response to extreme weeks (dry and warm) when downstream water availability can be low, water demand high, and measures might be needed. In this study, we analyzed observed hydrological responses to warm and dry (WD) events for catchments with varying glacier cover in southwestern Norway, western Canada, Switzerland, and Austria in the period 1945–2016. The aims of the study were (1) to investigate how often and when such warm and dry events (WD) occur, (2) to analyze the general streamflow responses to these periods in different months, (3) to evaluate differences in levels of compensation between catchments and regions, and (4) to investigate differences in compensation levels between different WD events for individual catchments. Overall, we aim to explain under which conditions glaciers compensate for the lack of rainfall runoff and increased evaporation during warm and dry periods.
2.1 Streamflow, meteorological, and glaciological data
Daily streamflow (Q), precipitation (P), and temperature (T) data were obtained for 50 glacierized catchments in southwestern Norway (9), western Canada (17), and the European Alps (24) (Table S1 in the Supplement). These catchments were selected based on the length of available data time series (long records), a minimum number of data gaps, and relative glacier cover (gc) (including catchments with low to high relative glacier cover). A few of these catchments are nested (meaning part of the meteorological conditions and streamflow responses are similar). Areal-averaged precipitation and temperature data were derived from gridded data products (interpolation from observations): SeNorge2 for Norway (Lussana et al., 2016, 2018) (1 km × 1 km), PNWNAmet for Canada (Werner et al., 2019) (∘ resolution, ∼7 km × 7 km), RhiresD and TabsD for Switzerland (MeteoSwiss, 2017, 2019) (2 km × 2 km), and SPARTACUS for Austria (Hiebl and Frei, 2016, 2018) (1 km × 1 km). Streamflow data were obtained from NVE (Norway), FOEN (Switzerland), eHYD (https://ehyd.gv.at/, last access: November 2019) (Austria), and the National Water Data Archive HYDAT (Canada).
The length of the available time series for the different catchments varied between 50 and 68 years. P and T data were available for 1957–2015 for Norway, 1945–2012 for Canada, and 1961–2016 for the European Alps. For Norway and Switzerland, streamflow data were used until 2016 and for Austria until 2015. For Canada, streamflow records ended between 2012–2017, but the selection of dry events was limited to 2012 because of the P and T data. The starting year of the overlapping time series of P, T, and Q for all catchments varied between 1945 and 1965. Few data gaps present in the streamflow data coincided mostly with the winter months.
Glacier cover data for the catchments were obtained from the Austrian glacier inventory (Buckel and Otto, 2018); the Swiss glacier inventory (2010) (Fischer et al., 2014); the NVE Landsat outlines for Norway (1999–2006) (Andreassen et al., 2012); and the Randolph Glacier Inventory (RGI version 6) for Canada, representing glacier cover around 2005 (Pfeffer et al., 2014). These shapefiles were used to calculate the percentage of each catchment that is glacier-covered.
2.2 Catchment characteristics
The Norwegian study catchments are located in the southern part of Norway, close to the Atlantic Ocean (Fig. 1a). The catchment with the highest gc of all the sample catchments is situated in Norway: the Nigardsbrevatn catchment, with a gc of 71.7 %. In general, the Norwegian catchments have the lowest mean elevations (Fig. 1d) and are located at higher latitudes than the Canadian catchments. Catchment sizes range from 65 km2 to almost 800 km2.
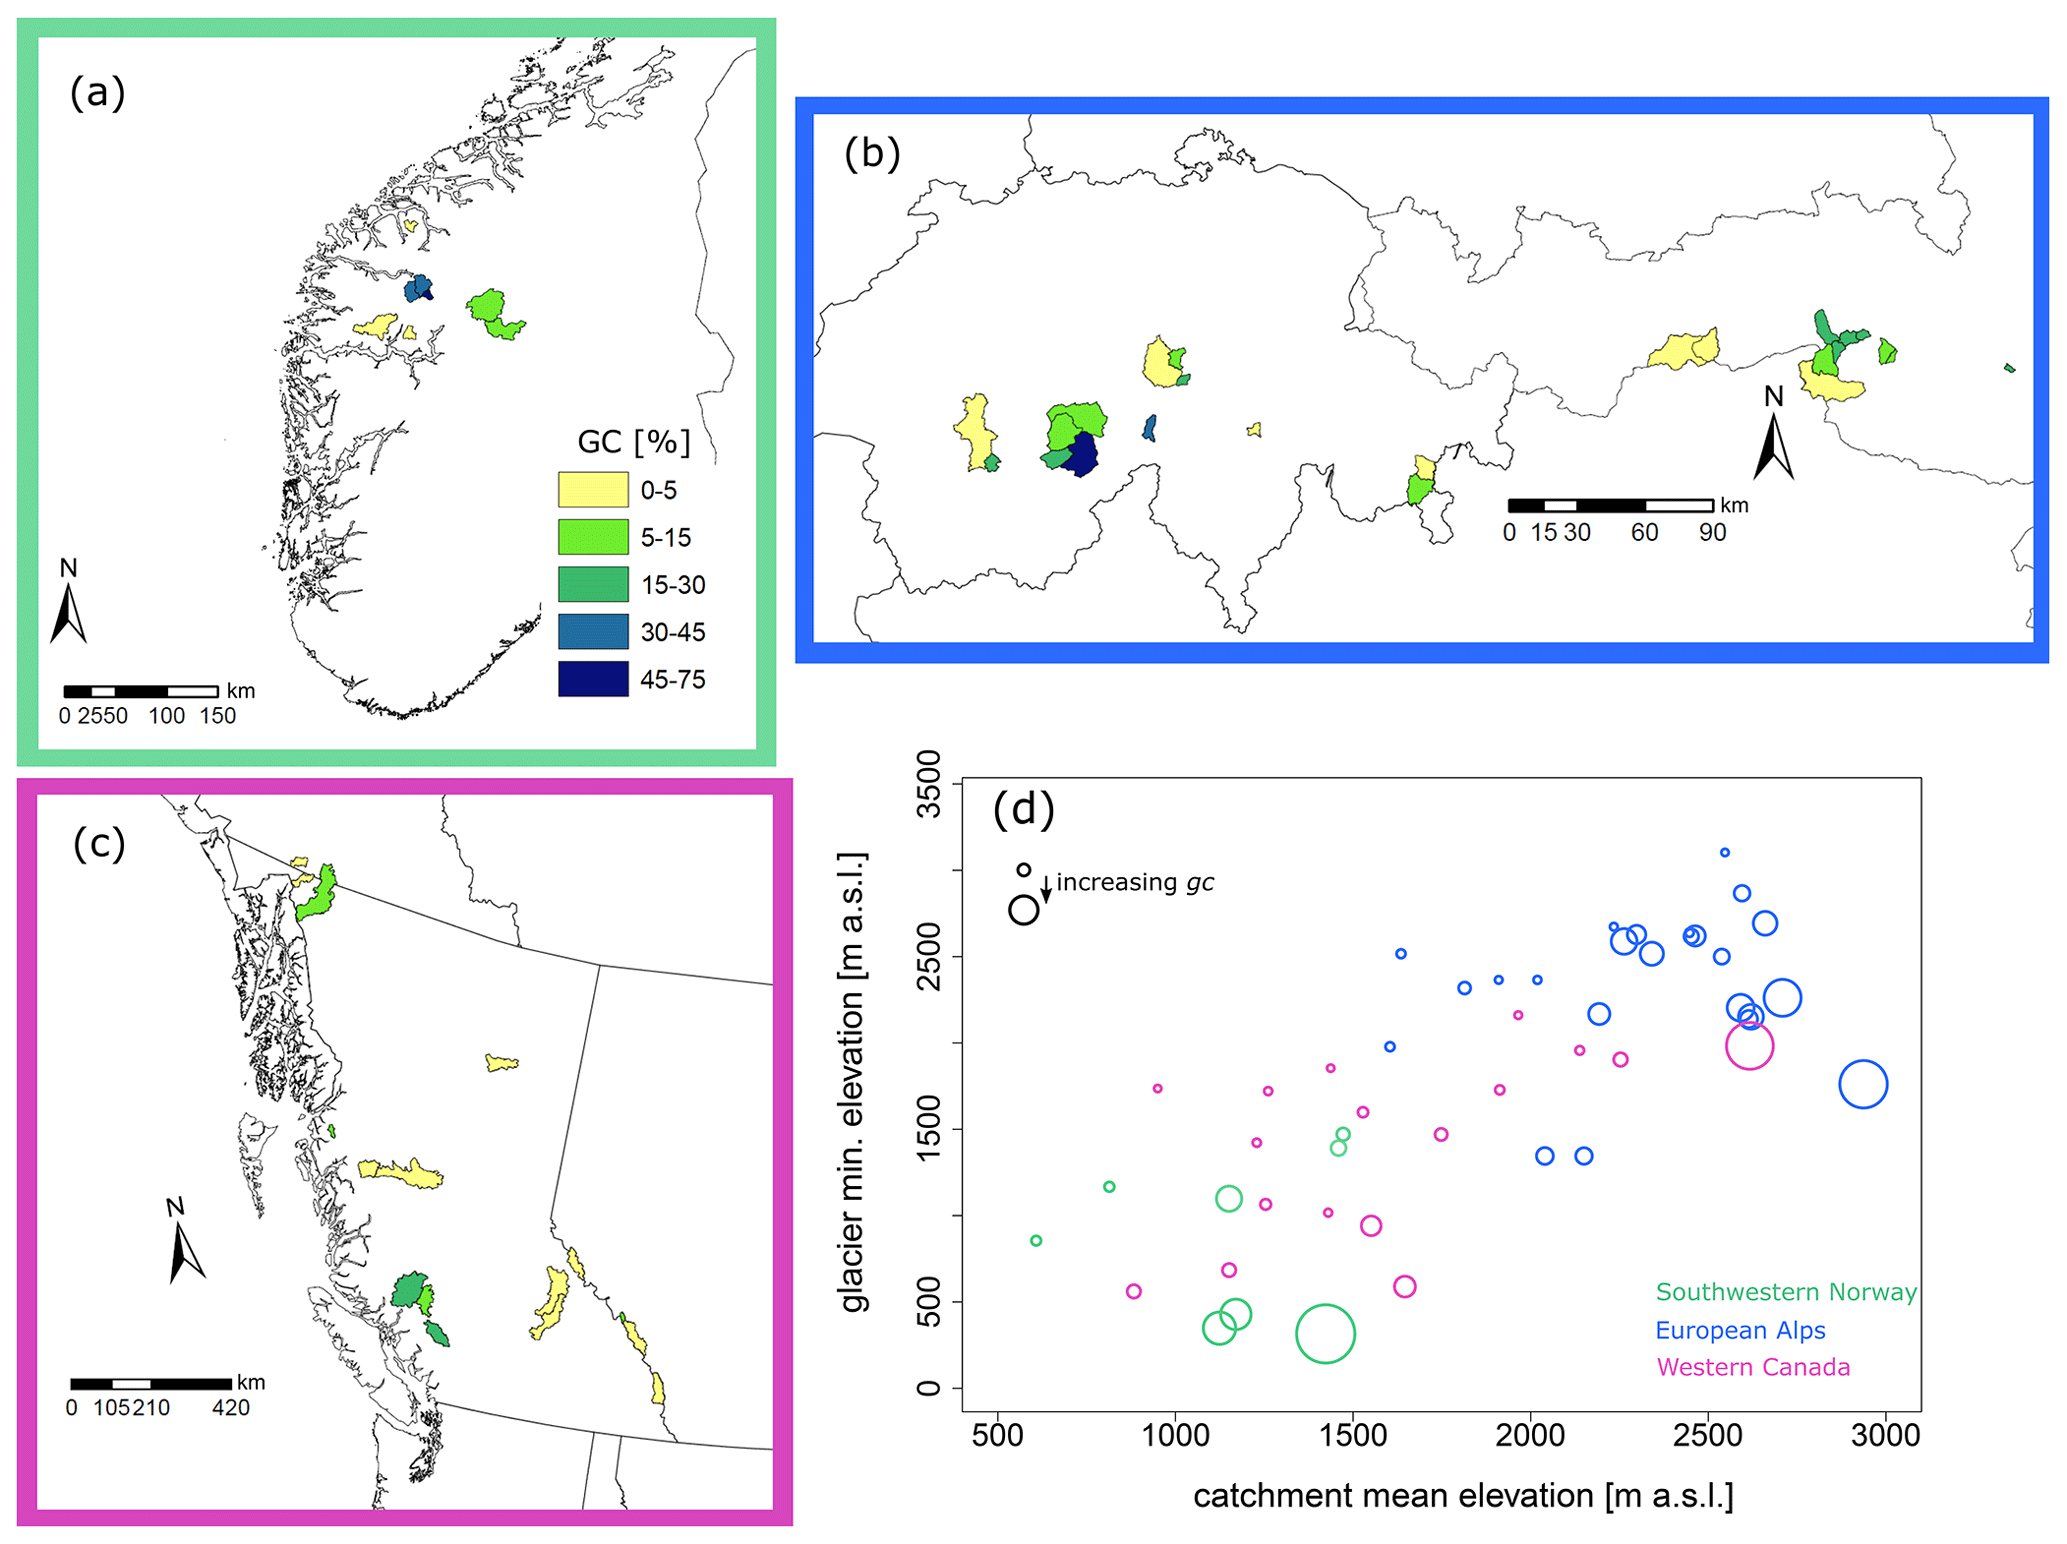
Figure 1Location of the glacierized catchments in (a) southwestern Norway, (b) the European Alps, and (c) western Canada and catchment elevation characteristics (d). Size of the circles in (d) scale with relative glacier cover, ranging between 0.02 %–71.7 %.
The Canadian catchments are located along the west coast and in the western interior part of Canada. Most of the catchments are situated in the province of British Columbia, a few in Alberta and one in the Yukon Territory (Fig. 1c). The catchment with the highest gc is the Sunwapta River in the Rocky Mountains, with 55.5 % glacier cover. This catchment is hardly visible on the map in Fig. 1 because it is also the smallest catchment (29.3 km2). Overall, the catchments in Canada are much larger than the catchments in the Alps and Norway, with the other catchments ranging from 250 to 6860 km2 in size. The Canadian catchments span a broad range of mean catchment elevations and glacier elevations (Fig. 1d).
The catchments in Switzerland and Austria are distributed over the Alps from west to east (Fig. 1b). The Massa catchment in Switzerland has the highest gc, 56.5 %. Catchments in the European Alps are generally situated at higher elevations, and also the minimum glacier elevation is the highest compared to the other regions (Fig. 1d). Catchment areas range from 9 to 380 km2.
2.3 Hydroclimatology
The selected glacierized catchments are located in different regions, different mountain ranges, different latitudes, different elevations, and different proximities to the ocean. They also have different gc and catchment sizes. Altogether this results in a large variation in precipitation seasonalities and amounts (Fig. 2) and streamflow regimes (Fig. S1 in the Supplement) among the studied glacierized catchments, possibly influencing the catchment responses to WD events.
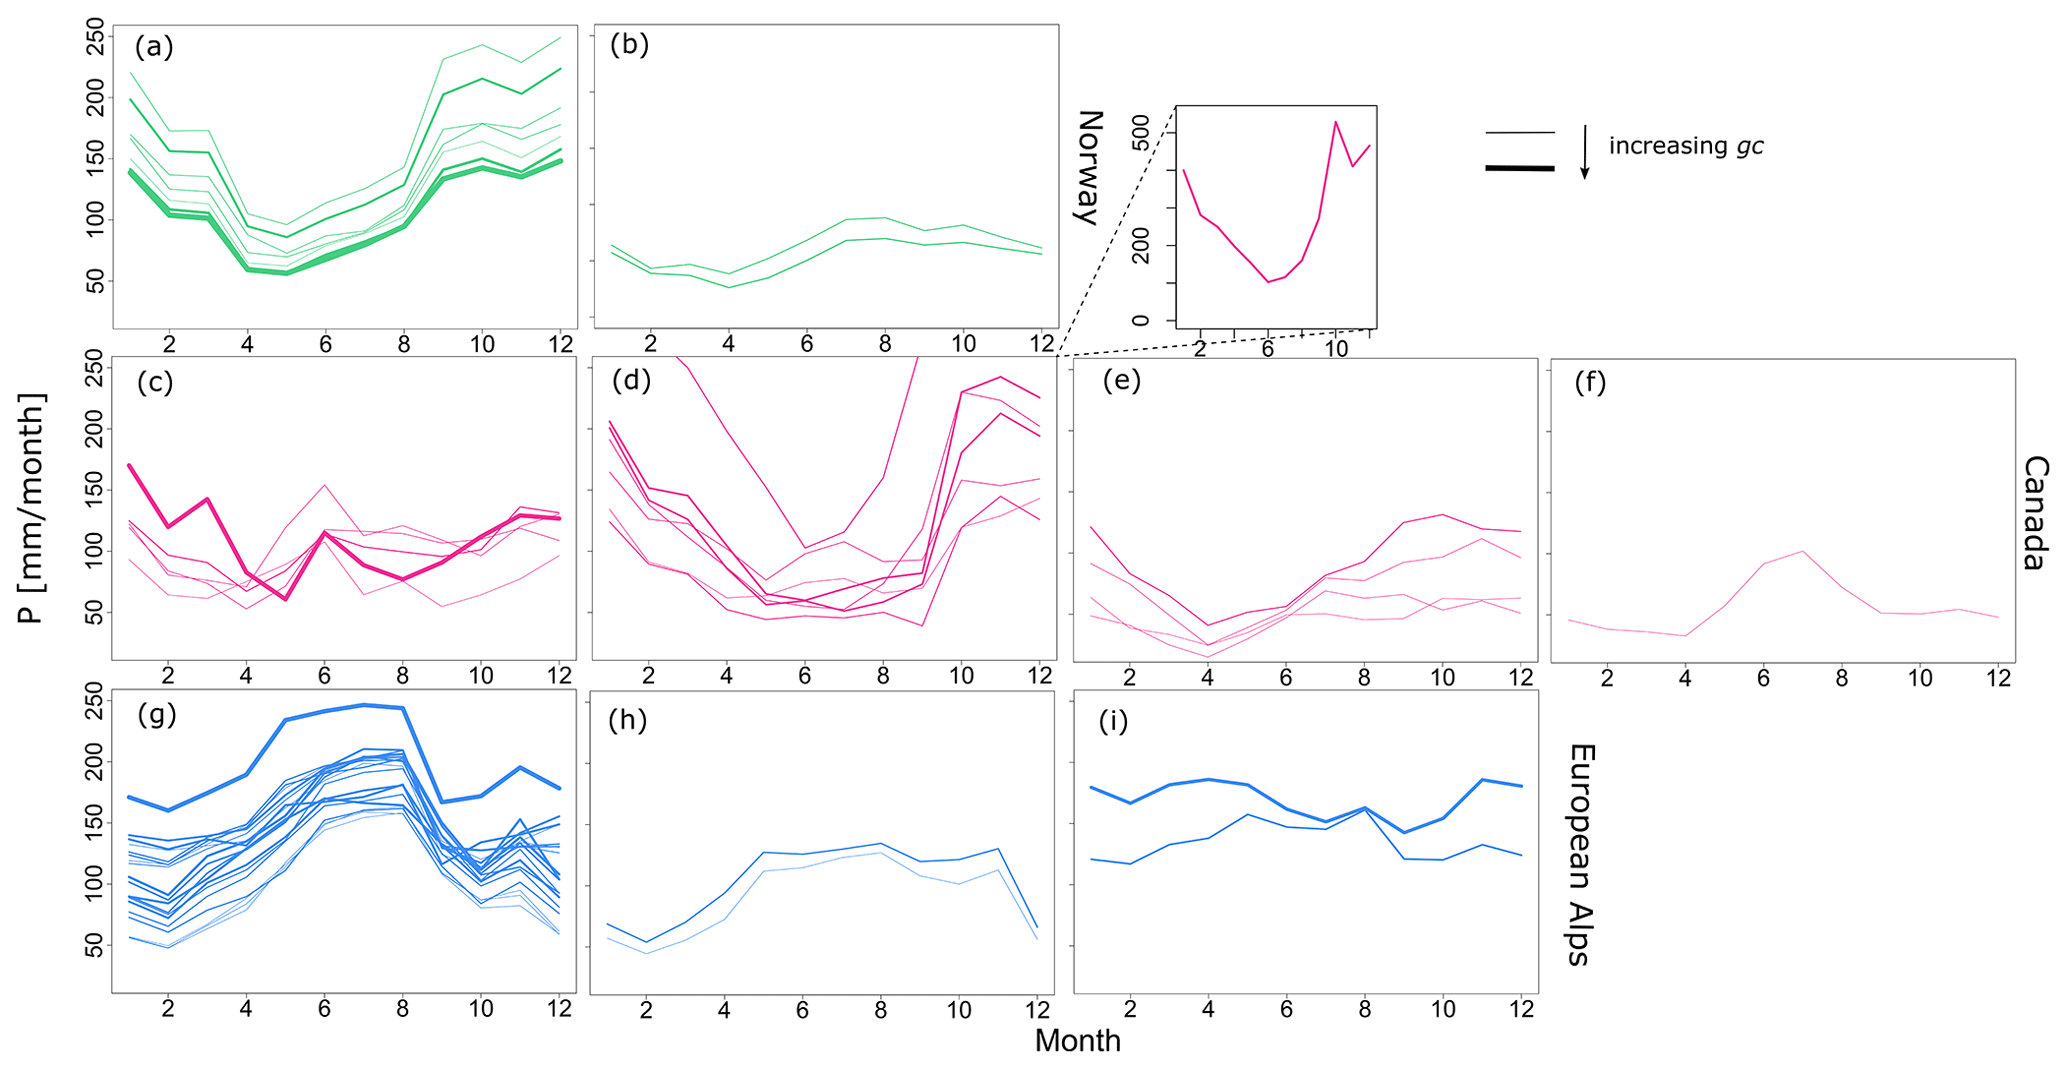
Figure 2Precipitation seasonality of the glacierized catchments in southwestern Norway (a, b), western Canada (c–f) and the European Alps (g–i). The graph connected to (d) shows a different y-axis scale for one catchment that had large monthly precipitation amounts. The precipitation distribution over the year of the different catchments was grouped into several precipitation regimes per region: two in southwestern Norway, four in western Canada, and three in the European Alps.
Total precipitation as well as its distribution over the year varies within and across the three regions (Fig. 2). In Norway, most catchments show high precipitation amounts in winter and lower amounts in spring and summer (Fig. 2a). The SeNorge2 precipitation product for Norway is known to underestimate precipitation in mountainous regions due to sparse observations (Lussana et al., 2018), so total monthly amounts are likely higher than plotted here. However, the distribution over the year and the differences between the Norwegian catchments are assumed to not be influenced by that. Norway has a strong west–east gradient in climate continentality (e.g., Engelhardt et al., 2014). The two catchments located most inland receive much less precipitation and have less monthly variation in precipitation amounts over the year (Fig. 2b).
The Canadian catchments show the largest variation in precipitation regimes. Four precipitation types were classified: (1) a mixture of precipitation regimes that show low variations in precipitation amounts over the year but mostly a small peak around June (Fig. 2c), (2) a regime where precipitation is lower in summer and high in winter (Fig. 2d), (3) a regime with the lowest precipitation in April and highest precipitation in winter but less intra-annual variation as in regime 2 (Fig. 2e), (4) high precipitation in summer (Fig. 2f). Catchments with type 1 precipitation are located in Alberta, on the eastern side of the Rocky Mountains. Type 2 catchments are located in the southern part of British Columbia and along the coast. The catchment that receives much more winter precipitation than the other catchments is the small Exchamsiks River catchment in the Coast Mountains. The three most northern catchments, together with the Nautley River catchment (which has the lowest elevation of the Canadian catchments), have precipitation type 3. The one catchment that is located in the northern Rocky Mountains has precipitation type 4.
In the European Alps, most catchments have somewhat higher precipitation amounts from May until August. In September, the rainfall amounts are relatively low (Fig. 2g). Two catchments with a more even distribution of precipitation amounts over the year are located in central Switzerland (Fig. 2i). Two catchments that show higher precipitation amounts from May until November but generally have lower amounts compared to the other catchments are located in the drier southeastern part of Switzerland (Fig. 2h).
Temperature regimes were more similar across the catchments (not shown), with temperatures well below zero in winter and above zero in summer. On average, the Norwegian catchments have the shortest, whereas the Canadian catchments have the most extended season with above-zero temperatures. The Canadian catchments in general also have a more considerable difference between winter and summer temperatures. The time of year when monthly mean temperatures reach above-zero values is later for most of the catchments in the European Alps and in Norway than for the Canadian catchments.
3.1 Selection of events
WD periods were selected based on a daily precipitation and temperature threshold. Days were defined as dry when the 7 d moving average precipitation sum did not exceed 2 mm d−1. We used an absolute definition of dry and not a relative definition (as is common when studying meteorological droughts) to focus on processes in the catchment that happen when there is no (or very little) rain input and thus hardly any rainfall runoff generation. We did not use a precipitation threshold of zero because, due to the gridded interpolated datasets, even if only a tiny part of the catchment receives a little amount of rain, the catchment average precipitation does not equal zero.
The temperature threshold was based on a 7 d moving positive degree day sum (DD7), from which the 80th percentile was calculated with a 30 d moving window (similar to seasonally moving drought thresholds; e.g., van Loon, 2015). In contrast to the fixed precipitation threshold, the temperature threshold is a relative threshold, varying for each catchment and for each day of the year to capture anomalies from the normal seasonal cycle. This means that a defined warm event in June is not necessarily comparable in absolute temperatures or degree day sums with a warm event in July. The temperature thresholds were based on temperature data for the period 1961–2010 for all regions.
Table 1Definitions of the different dry days. If 7 or more of these dry days follow each other up, it was classified as an event.
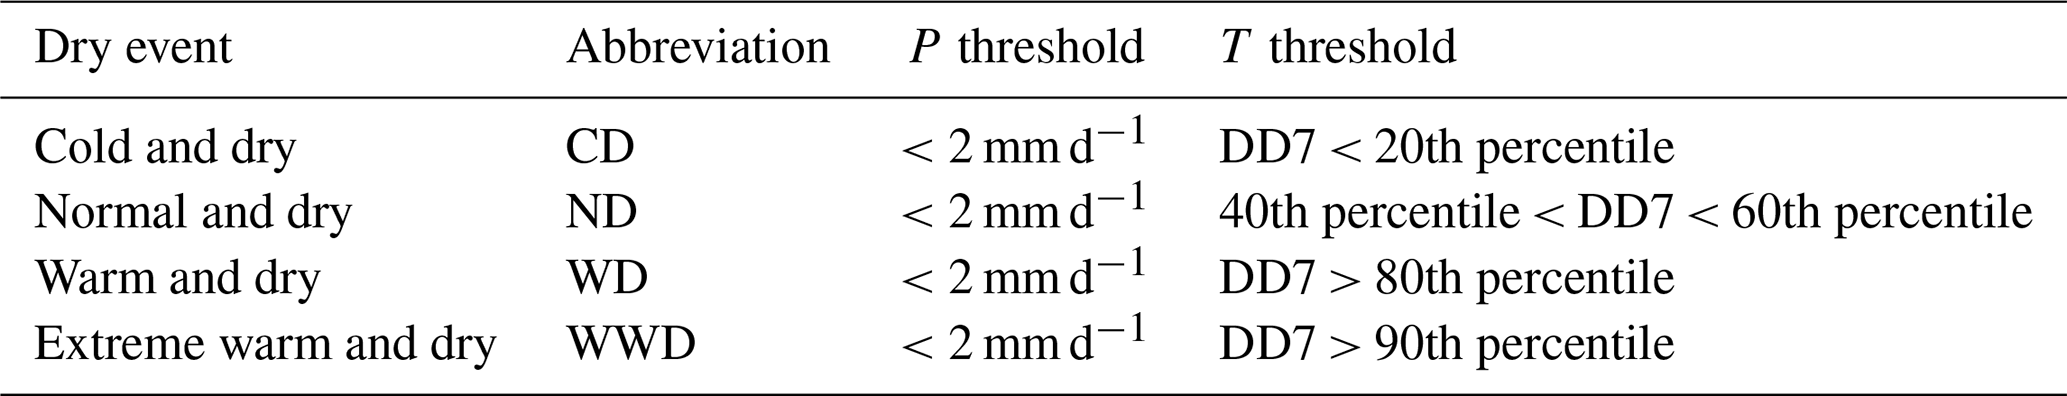
Days were selected when both the 7 d moving average daily precipitation was below the precipitation threshold and the DD7 was above the temperature threshold. When these days were consecutive or when there were 1 or 2 d in between not meeting the conditions, but the (daily) precipitation during these days was smaller than 5 mm d−1, these days were counted as one event. Events were selected that had a minimum duration of 7 d and had the mid-date of the event from June to September (see Fig. S2 for an example).
To investigate the role of temperature during dry periods in general, not only warm and dry (WD) events were selected but also dry and relatively cold (CD), dry and normal temperature (ND), and dry and extreme warm events (WWD) by varying the temperature threshold percentile (Table 1). WWD events are part of WD events but are in general shorter in duration.
3.2 Streamflow response and level of compensation
Once the WD (or other dry event) periods were selected based on the P and T data, the corresponding streamflow data were analyzed. For the sake of simplicity, we selected the streamflow event to start and end on the same dates as the meteorologically dry events, aware that this assumption is only an approximation. Due to the use of 7 d smoothing for streamflow and precipitation, precipitation events before the dry events may only have a limited effect on the 7 d mean streamflow signal during the dry events. Since the events last at least 7 d, we assume that within these 7 d there is a clear response to the WD event. For each of the selected events a compensation metric C was derived (Eq. 1).
in which C is the level of compensation [%]; Q [mm d−1] is the 7 d smoothed daily streamflow during the event; Qn [mm d−1] is the long-term daily streamflow regime as a benchmark; and i and j are the start and end dates (or DOY for Qn) of the event, respectively. Qn is based on the whole time series but starting with the start of the respective P and T data (1961 for the European Alps, 1957 for southwestern Norway, and 1945 for western Canada; if the streamflow time series start later, then that period was selected to calculate the regime). The long-term daily averages were then smoothed with a 7 d moving average, like the P, T, and Q data, to obtain Qn. C values above 100 % indicate overcompensation of the rainfall deficit by excess melt because streamflow was higher than the long-term average. Values below 100 % indicate a low level of compensation; i.e., streamflow during the event was below normal conditions, and the melt of snow and ice could not completely compensate for the lack of rainfall and increased evaporation. Resulting C values of the events were grouped according to month and region.
The streamflow trend during the event was also analyzed, i.e., whether streamflow was increasing or decreasing during the WD event. The latter was done by a linear regression model relating streamflow to time. The slope of the regression model was used as a proxy for the general trend of streamflow behavior during the event. When there is no precipitation input for the catchment, streamflow usually recedes, but melt input from snowpack or glacier could cause an increase in streamflow.
3.3 Controls and drivers of variability in the level of compensation
To investigate which factors control the variability in C (1) on the catchment scale and (2) on the event-to-event scale, several characteristics of each catchment and of each WD event were extracted (Table 2).
Table 2Catchment and event characteristics that were used to explain the variability in the level of compensation (C).
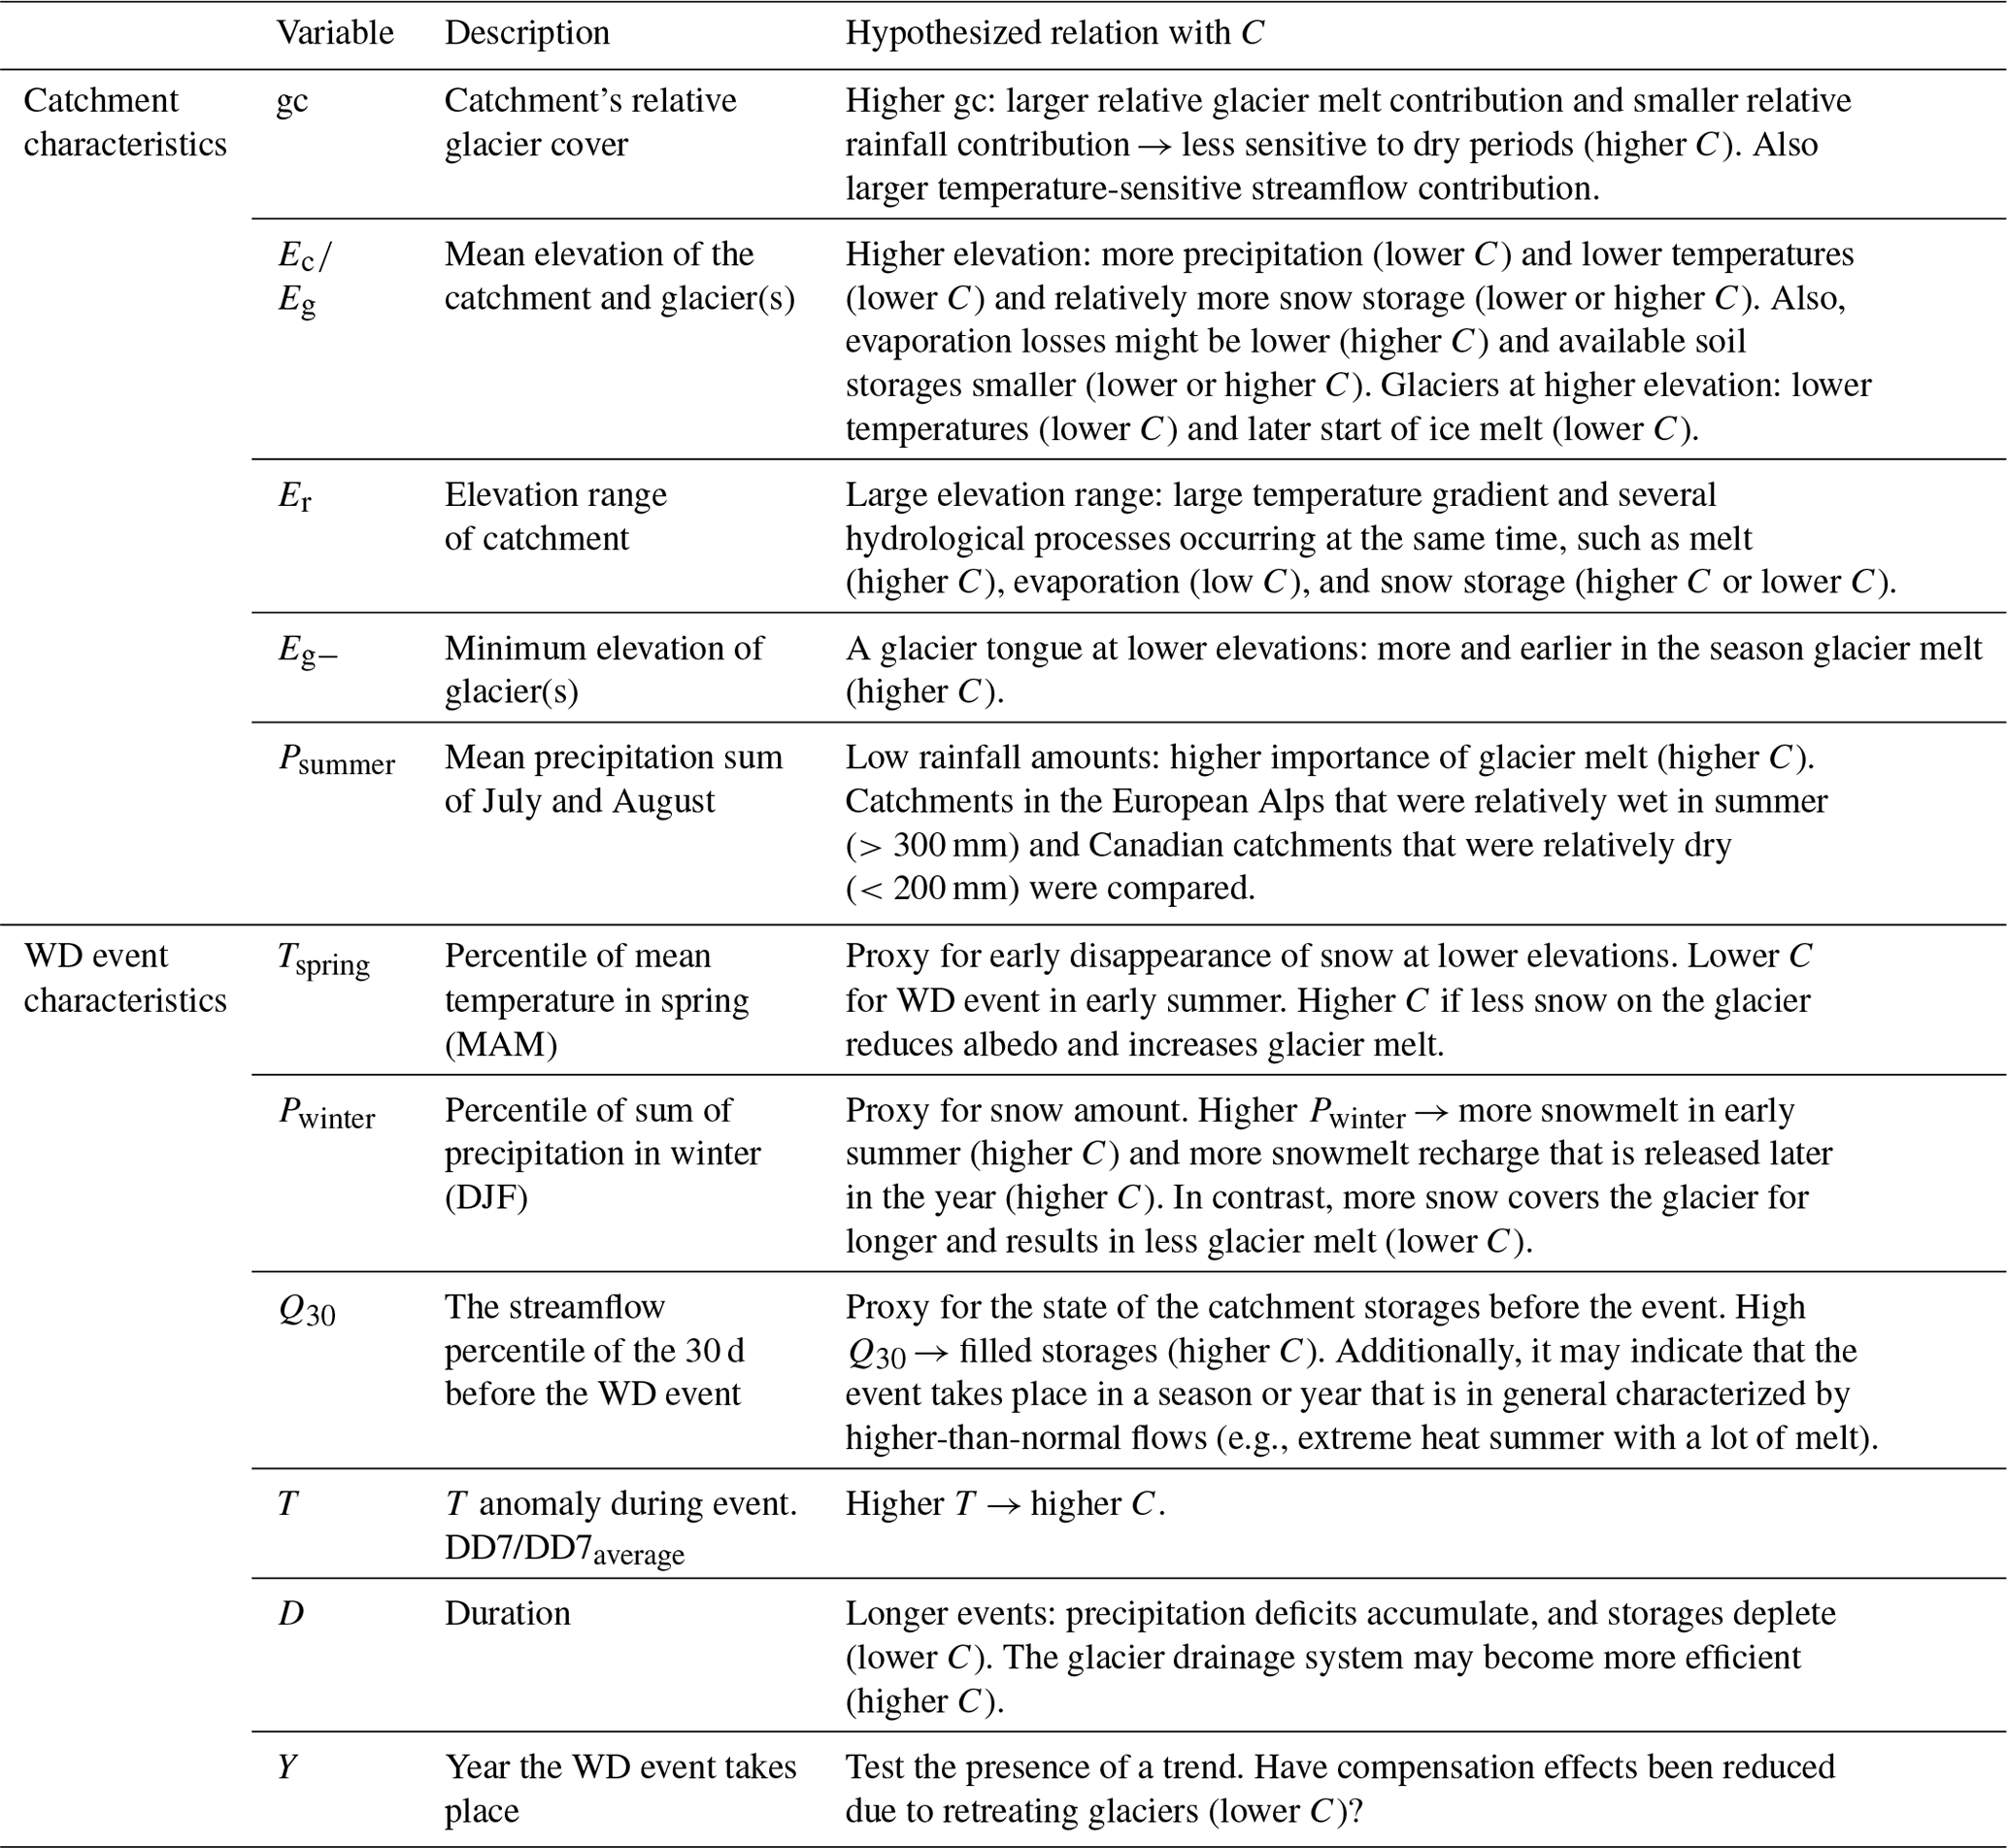
The catchment characteristics were used in a linear model to analyze which control explains most of the variability in C across the different catchments for each month and region. The relative importance of the catchment controls was assessed by the proportion of variance explained by each predictor by averaging the added explained variance over all possible orderings (calculated with the R package Relaimpo; Grömping, 2006). The same method was applied to analyze the importance of different event drivers (e.g., antecedent streamflow conditions and winter precipitation). For this analysis, catchments were grouped by relative glacier cover, and for each month, each region, and each relative glacier cover group a regression model was set up. The grouping was done based on the glacier cover distribution of the catchments and on the literature, finding that at a glacier cover of around 10 % streamflow sensitivities to precipitation and temperature variations change (van Tiel et al., 2020a). A minimum of 10 events in each group was required to set up a regression model.
To assess time trends in C, Spearman rank correlation coefficients were calculated. A coefficient was calculated if there were at least eight or more events for the respective catchment in the respective month.
Table 3Number and duration of WD events. The numbers in parentheses indicate the range of numbers or durations for the individual catchments.

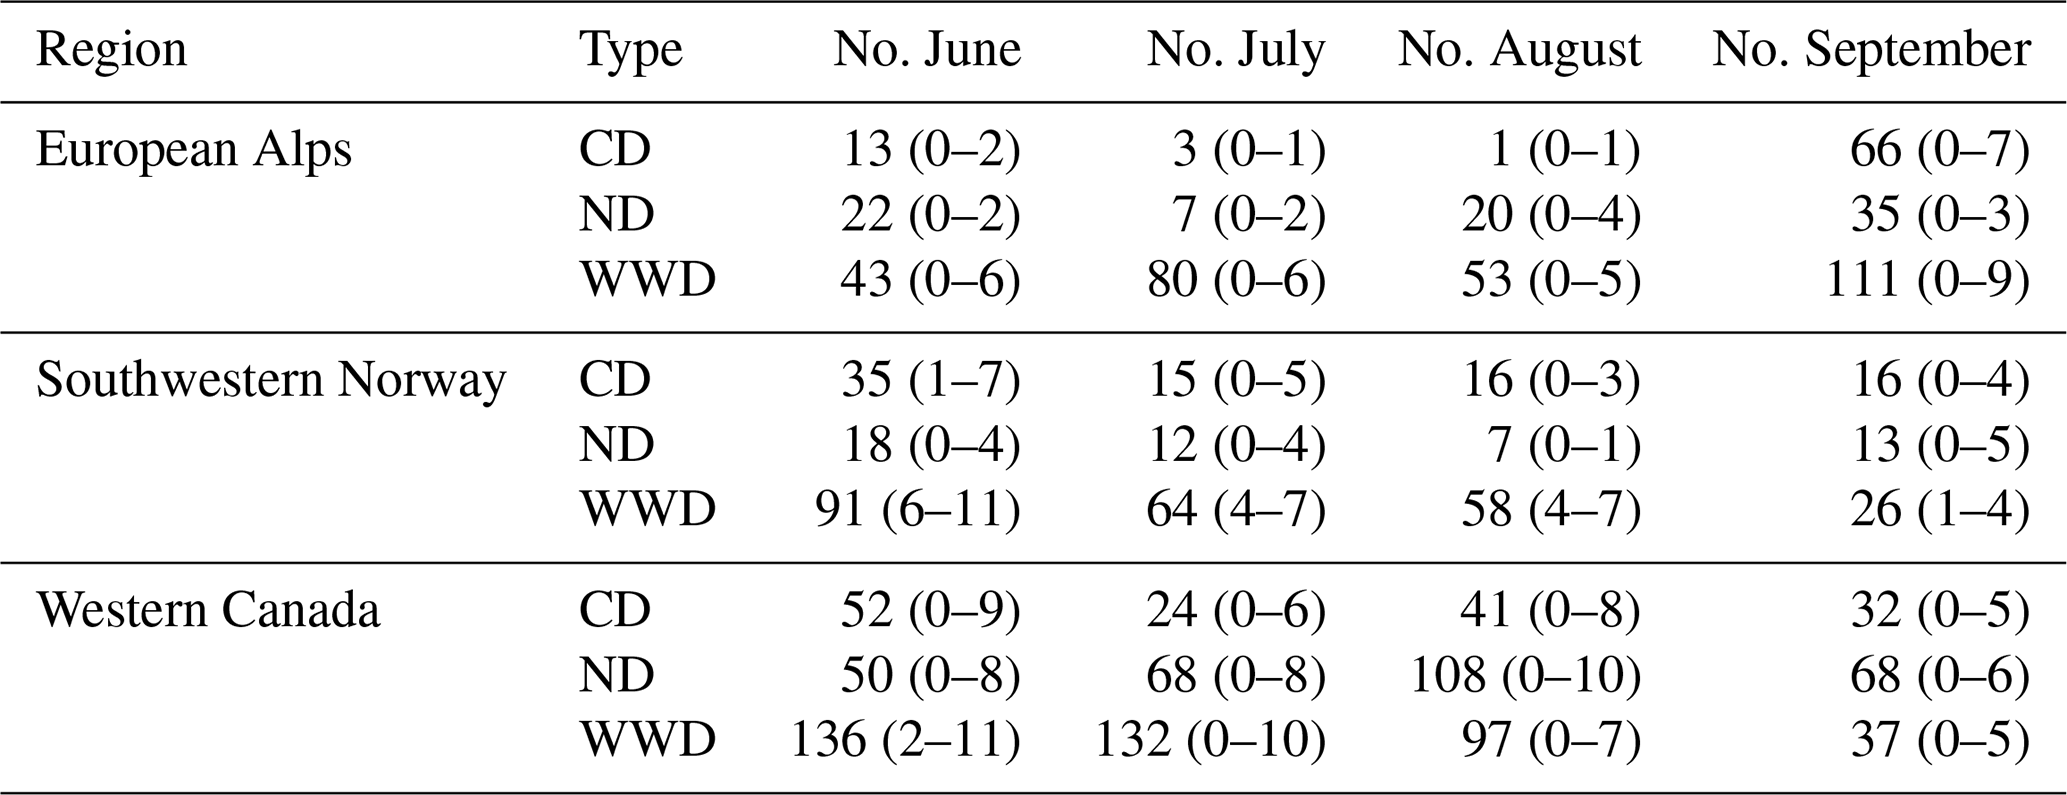
Table 4Number of CD, ND, and WWD events. The numbers in between parentheses indicate the range of number of events for the individual catchments.
4.1 Occurrences of events
WD events occurred in all summer months (June until September) and in all regions (Table 3). Catchments in the European Alps had most of the events in July and September, while in southwestern Norway and western Canada there were more events in June and July. The number of events differed per catchment, with some catchments having more than double or 3 times the number of events compared to the catchment with the lowest number of events. In western Canada, one catchment in particular had very few events (located in the northern part of the Rocky Mountains), hence the low numbers in the table for western Canada. The numbers are not comparable between the regions and catchments because of a different length of the time series and different numbers of catchments per region.
Most of the WD events in the European Alps occurred in 1982 (34 events in total in all catchments) and 1983 (38 events). For the Norwegian catchments, most events occurred in 2002 (28 events) and in 2006 (34 events). In western Canada, the years with many events are earlier in the observed time series, namely 1967 (36 events) and 1990 (37 events).
The mean duration of the events was highest in southwestern Norway, then western Canada, and then the Alps. The longest event occurred in a Canadian catchment and lasted 40 d. Most of the events had a relatively short duration, between 7 and 10 d. For the Alps, the mean duration was longest in September (11.4 d) and shortest in June (9.0 d). In southwestern Norway, the events were on average longest in June (12.1 d) and shortest in July (9.0 d). In western Canada there was less difference between the mean durations in the different months; in September the average duration was 10.1 d, and in June and July, it was 10.7 d on average.
Analyzing the effect of temperature by selecting other dry events shows that WD conditions occurred more often than ND or CD conditions (Table 4). The WWD events partly include the WD events and occurred more often than the ND and CD events. In the Alps all different dry events mostly occurred in September. In southwestern Norway, most events occurred in June. In western Canada, WWD events occurred mainly in June and July, ND events in August, and CD events in June.
Table 5Variance in C explained by catchment characteristics in a linear regression model; n indicates the number of WD events that were used for the regression.

4.2 Glacier compensation during WD events in different catchments
In general, C showed a wide range of values for the different WD events. Streamflow can show an increasing or decreasing trend during the event or both. The selected catchments and years in Fig. 3 were chosen as examples to illustrate the range of streamflow responses in different months and in catchments with varying relative glacier cover. The September event in the European Alps in Fig. 3 showed that streamflow was above normal for the two catchments with >23.2 % gc and close to normal for the catchment with 13.5 % gc. Streamflow was more below normal (C<100 %) for the catchment with 2.5 % gc compared to the catchment with only 0.5 % glacier cover, possibly indicating that other factors than gc play a role, too. For southwestern Norway, the events in July showed different trends, with increasing Q during the event for the three catchments with the highest gc in the example and decreasing Q for the two catchments with lower gc (Fig. 3). C was larger than 100 % only for the two most highly glacierized catchments in this example. In western Canada, the example in Fig. 3 shows for an event in August that streamflow is mostly above Qn in all catchments with different gc. Overall the examples also show that sometimes events are embedded in a longer positive or negative anomaly of streamflow compared to the long-term daily streamflow regime (western Canada catchment 2 % gc and southwestern Norway catchment 3.5 % gc).
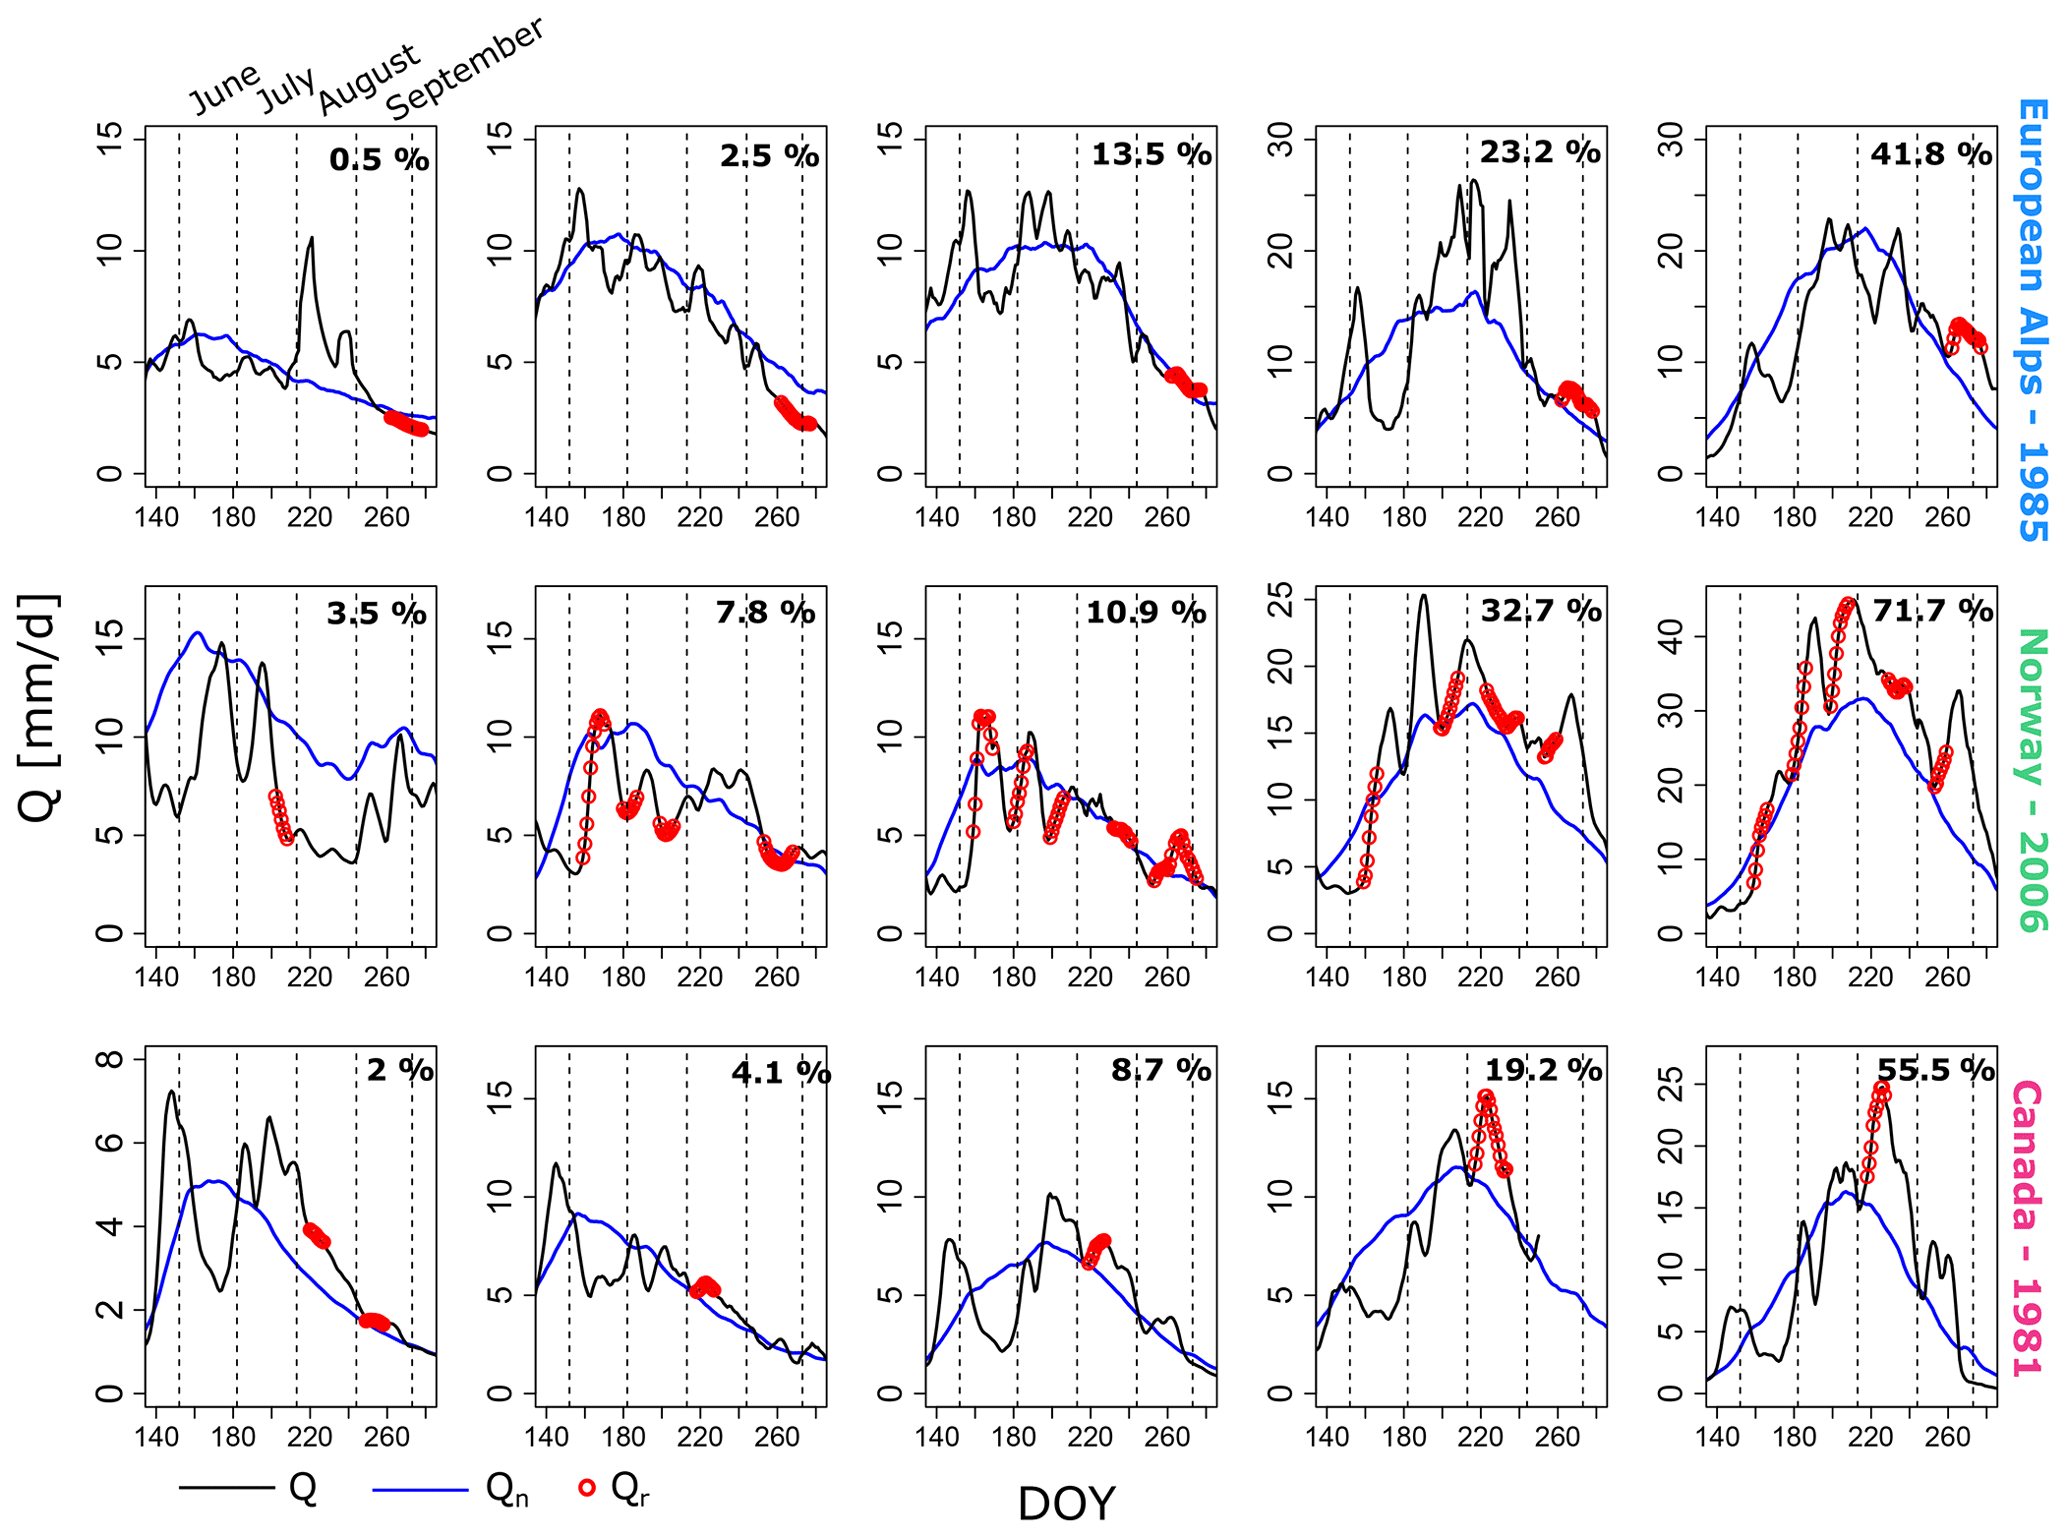
Figure 3Examples of streamflow responses (Qr in red) to WD events in different catchments and in different months. Each row represents one region and one specific year. The columns are different catchments, which are sorted from low to high relative glacier cover (left to right). Relative glacier cover of the catchments is indicated in the top right corner. The black line shows the 7 d smoothed streamflow in the summer of the respective year, and the blue line shows the long-term daily regime. Note the different y axis for some of the plots.
Regressing C for a particular month and region against the catchment characteristics as independent variables showed that gc was the most important variable to explain C in all summer months in the European Alps, in August and September for the Canadian catchments, and in August for the Norwegian catchments (Table 5). Mean catchment elevation was often the second most important variable. For September in Norway, C was best explained by a combination of mean elevation of the catchment and the glacier. However, these catchment characteristics could often only explain part of the variance in C in each month and region (i.e., often less than 40 % explained). All variables but minimum glacier elevation (Eg−) showed a positive relation with C.
The higher gc, the higher the streamflow was above Qn during an event (Fig. 4). The spread in C was, however, large. Catchments in the European Alps covered almost the complete range of gc and showed a strong relation between gc and mean catchment C for all months. On average, the streamflow there was below the normal regime for catchments with gc < 10 %. In southwestern Norway, some of the catchments showed a relatively low C in September. The highly glacierized catchments showed a range of C that varies from below 100 % to above 100 %, while for highly glacierized catchments in the European Alps and western Canada mostly all of the compensation levels were above 100 % (overcompensating). In western Canada, even the glacierized catchments with very low glacier cover showed on average C values that were above 100 %. The variability in streamflow responses was smallest in August in all regions and larger in June and September. C was on average highest in June for all regions.
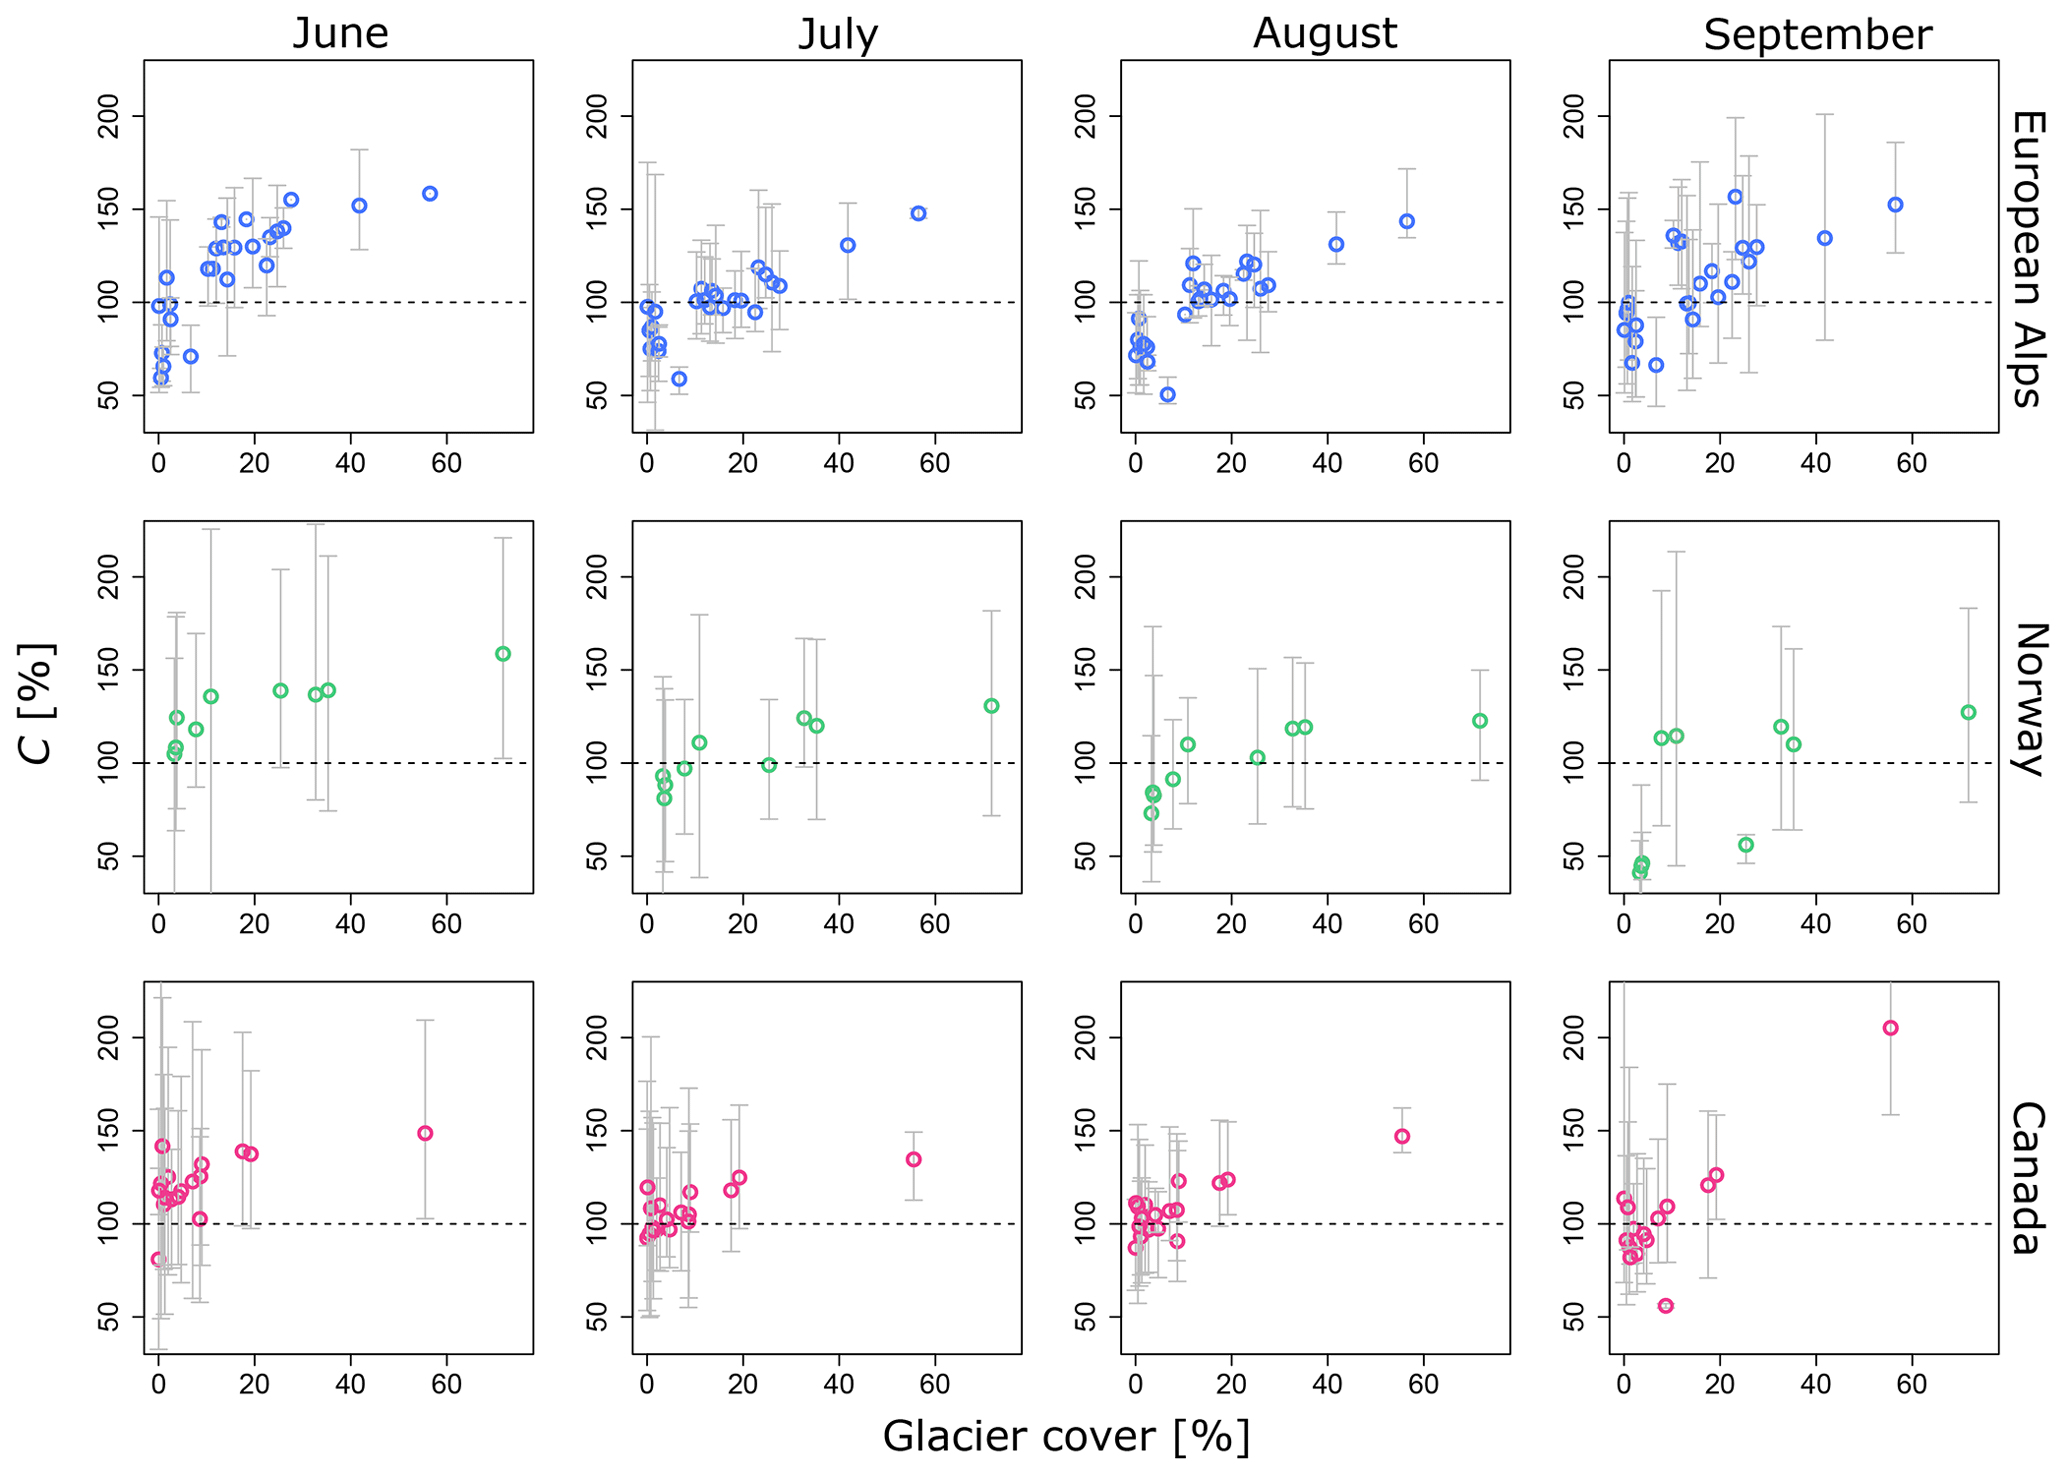
Figure 4Level of compensation (C) during WD events for the different regions (rows) and the different months (columns) against gc of the different catchments. The colored circles indicate the mean streamflow response, and the gray bars show the range of C, i.e., the minimum and maximum C.
The direction of the trends showed substantial streamflow increases during the events in June and July, especially for the highly glacierized catchments (Fig. 5). In August and September, the increased melt during the event compensated for the general tendency of decreasing streamflow in these times of the year, resulting in a slope around zero instead of negative slopes. For the few highly glacierized catchments in all the three regions, the mean trends were even slightly increasing in August and September.
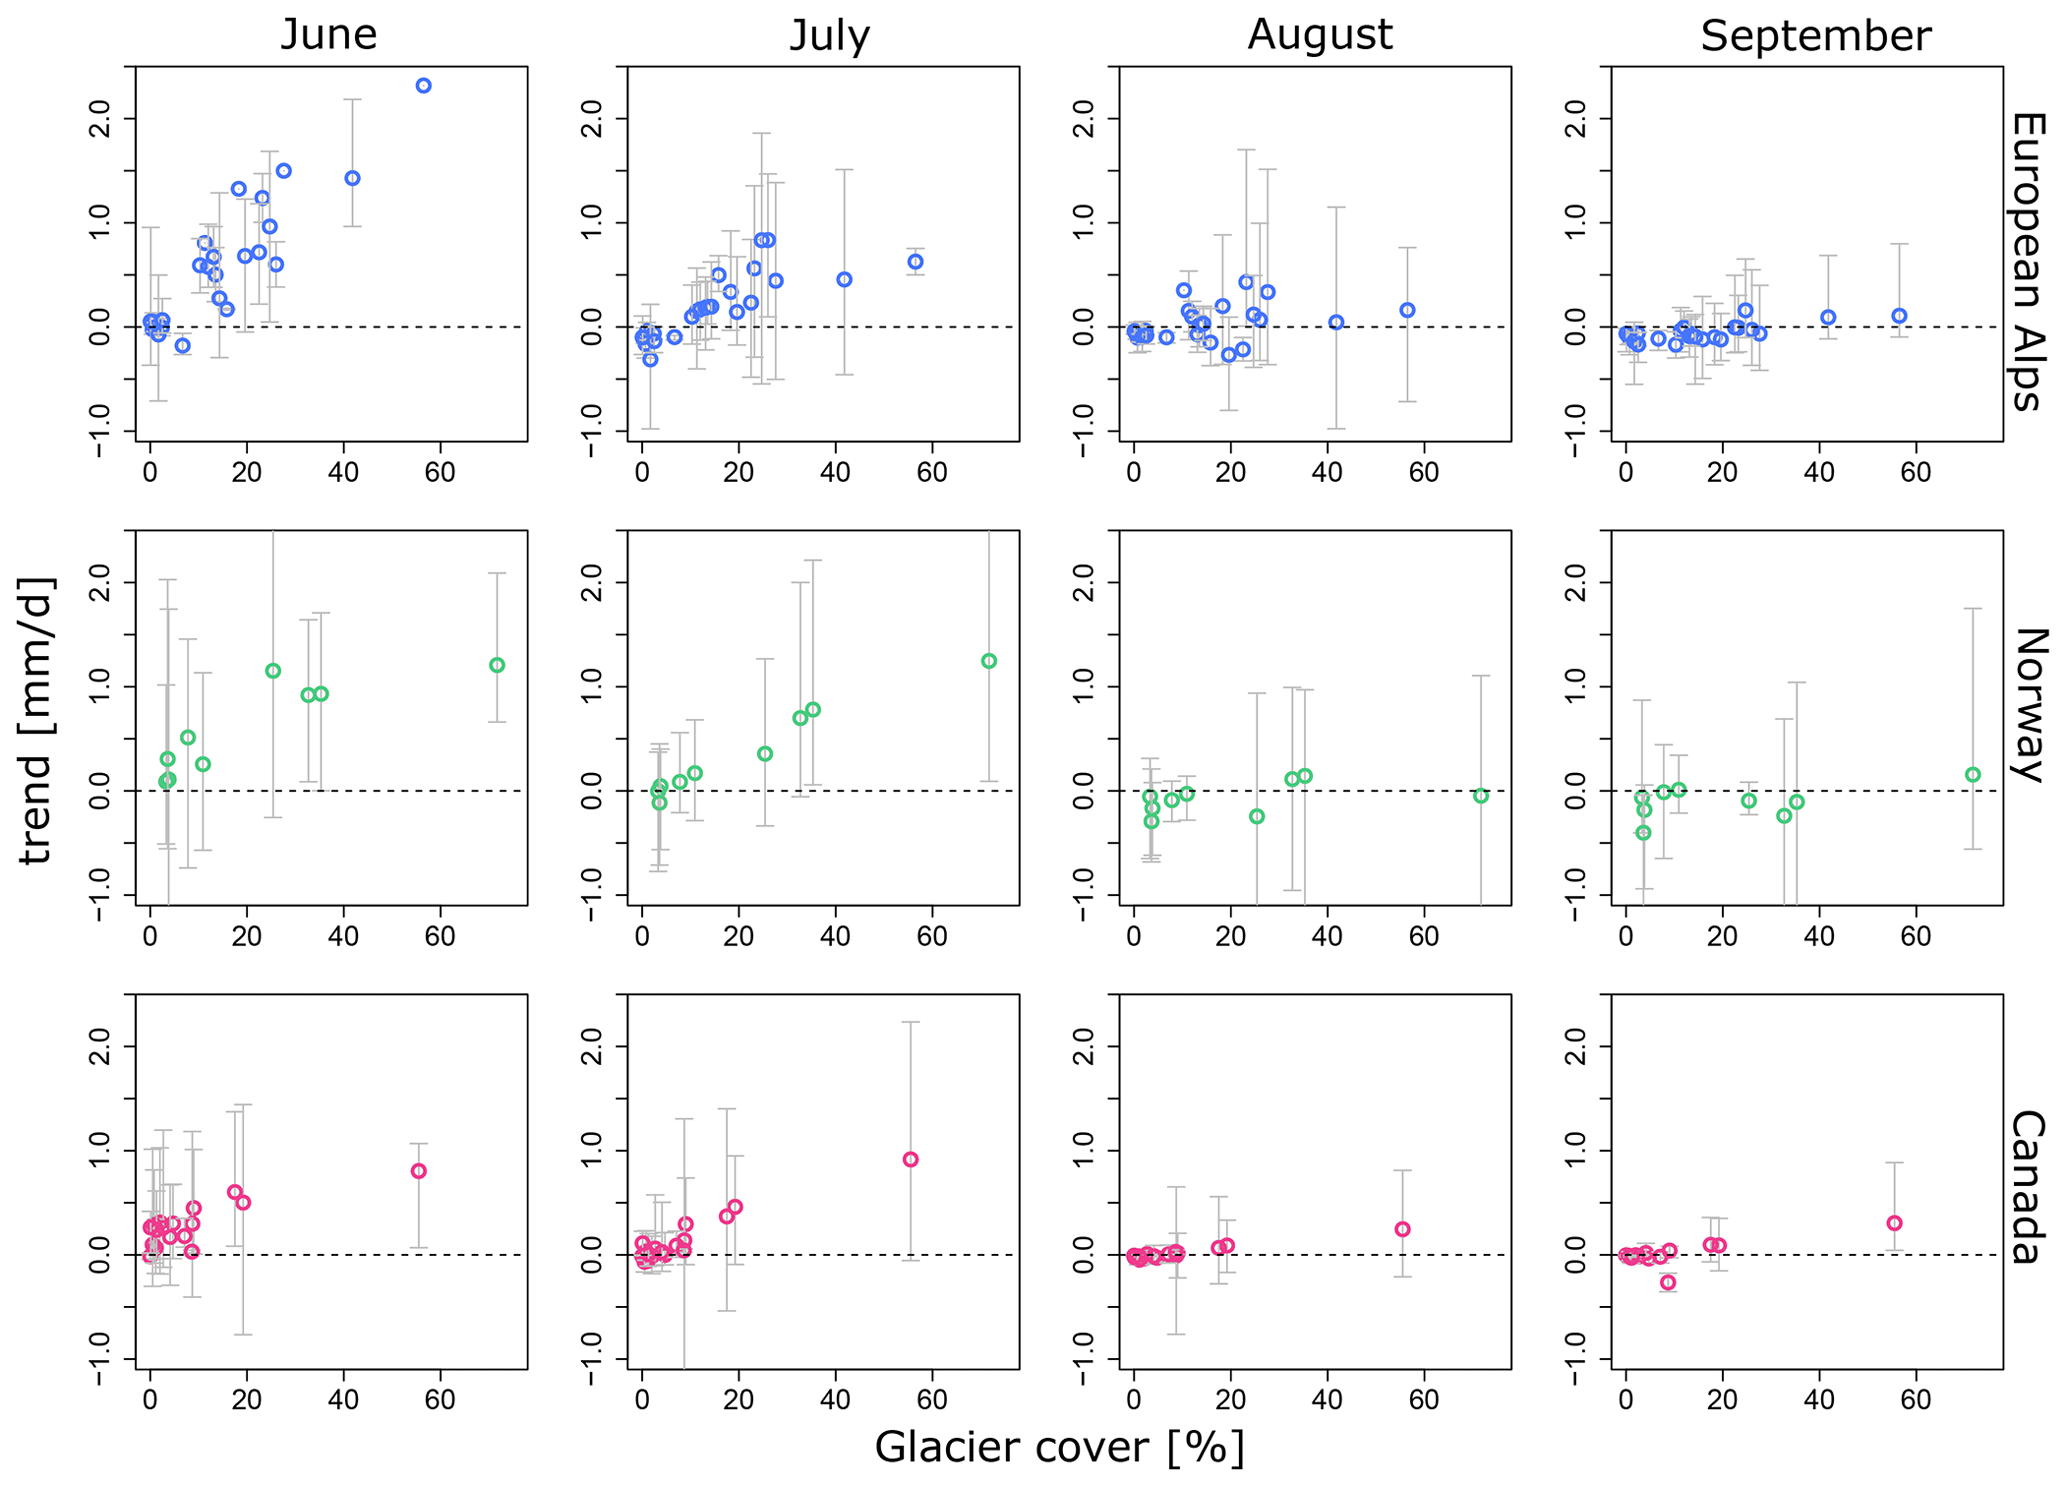
Figure 5Trend of Q during the WD events in different regions (rows) and months (columns). The colored circles indicate the mean trend during the events per catchment, and the gray bars represent the whole range.
4.3 Glacier compensation during other dry periods
The streamflow responses to WWD and WD events were opposite to those of CD events (Fig. 6), although the number of CD events is low and therefore cannot be compared with WD responses in all months. During CD events, C was below 100 % for most of the catchments, except for some Canadian catchments with a low glacier cover. The WWD events resulted in higher C compared to C during WD events from July to September but not in June. For the catchments with a low glacier cover (<10 %) the WWD event compensation levels were below the normal streamflow regime, mostly in Norway and the European Alps. The ND C values were below 100 % or close to 100 %, indicating the effect of a rainfall deficit without the aid of excess melt due to high temperatures. Due to the limited number of events or even absence of certain event types, the month in which the C of the various dry events differs most clearly, i.e., when excess melt can make the most difference, could not be determined.
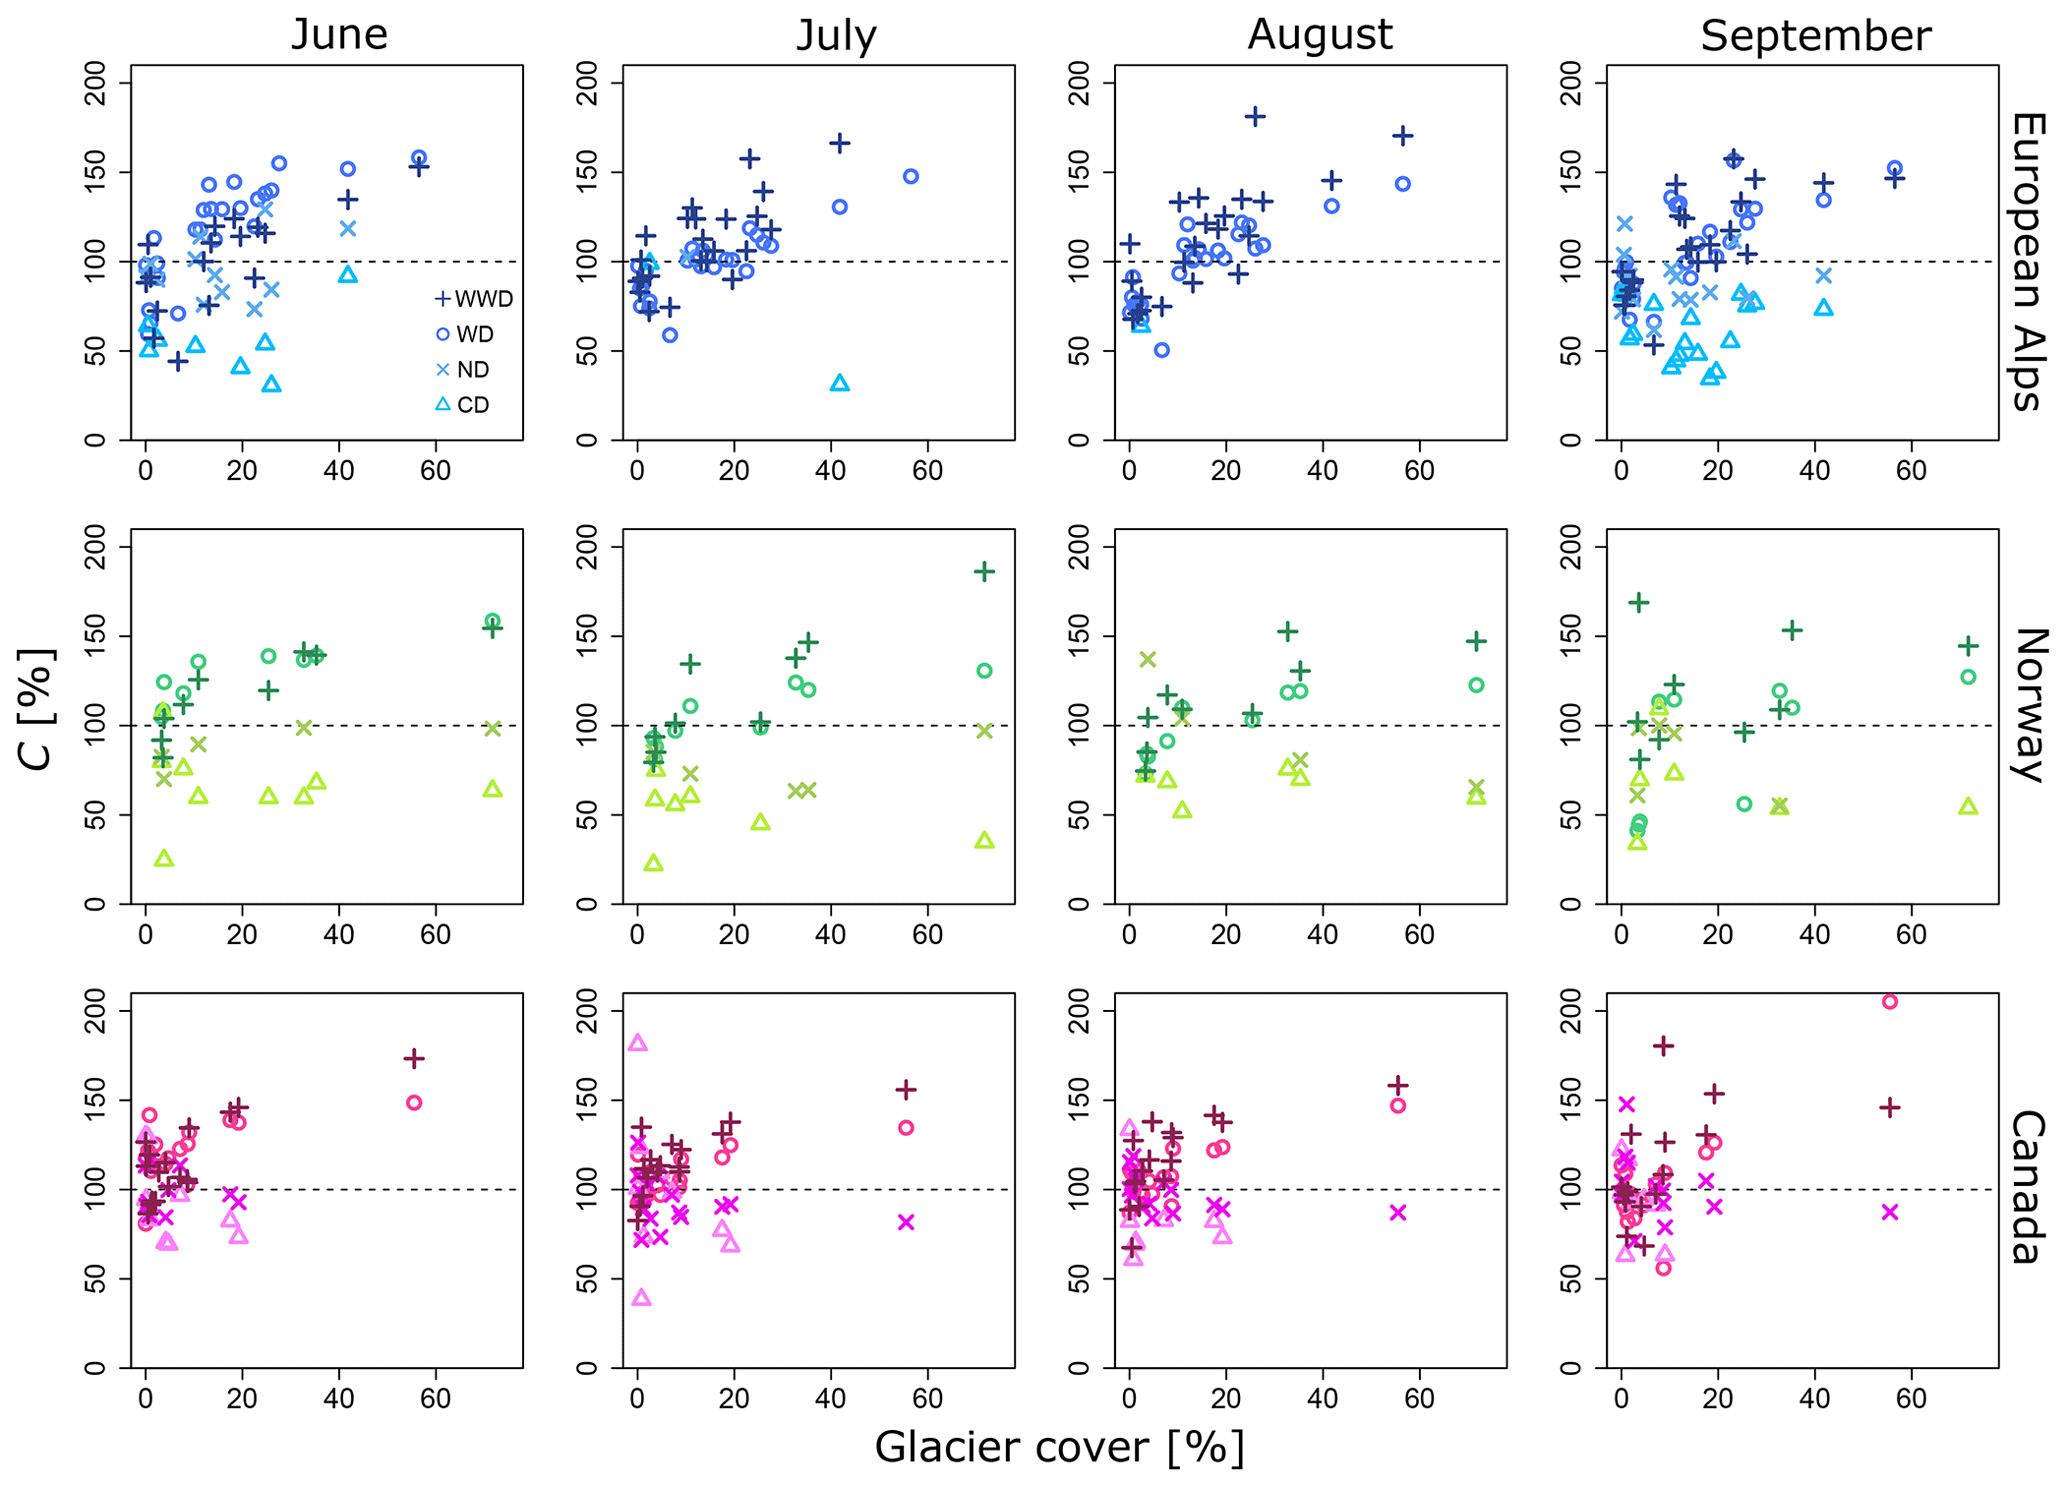
Figure 6Mean catchment level of compensation (C) during WWD, WD, ND, and CD events in different regions (rows) and months (columns). If all types of dry periods occurred in the time series of a particular catchment, one catchment shows four symbols in a vertical line.
Different average summer rainfall amounts could be another control of the catchment response to dry periods. Catchments in the Alps have relatively high rain amounts in summer, while some of the Canadian catchments have low rain amounts in summer. Comparing these two sets of catchments showed that the Canadian catchments have higher C compared to catchments in the Alps during WD events (Fig. 7). Less rainfall in general might indicate that during dry events, the relative rainfall deficit is smaller, and the relative glacier melt contribution is larger. However, other variables vary as well; e.g., the Canadian catchments have a lower glacier and catchment mean elevation compared to the ones in the Alps.
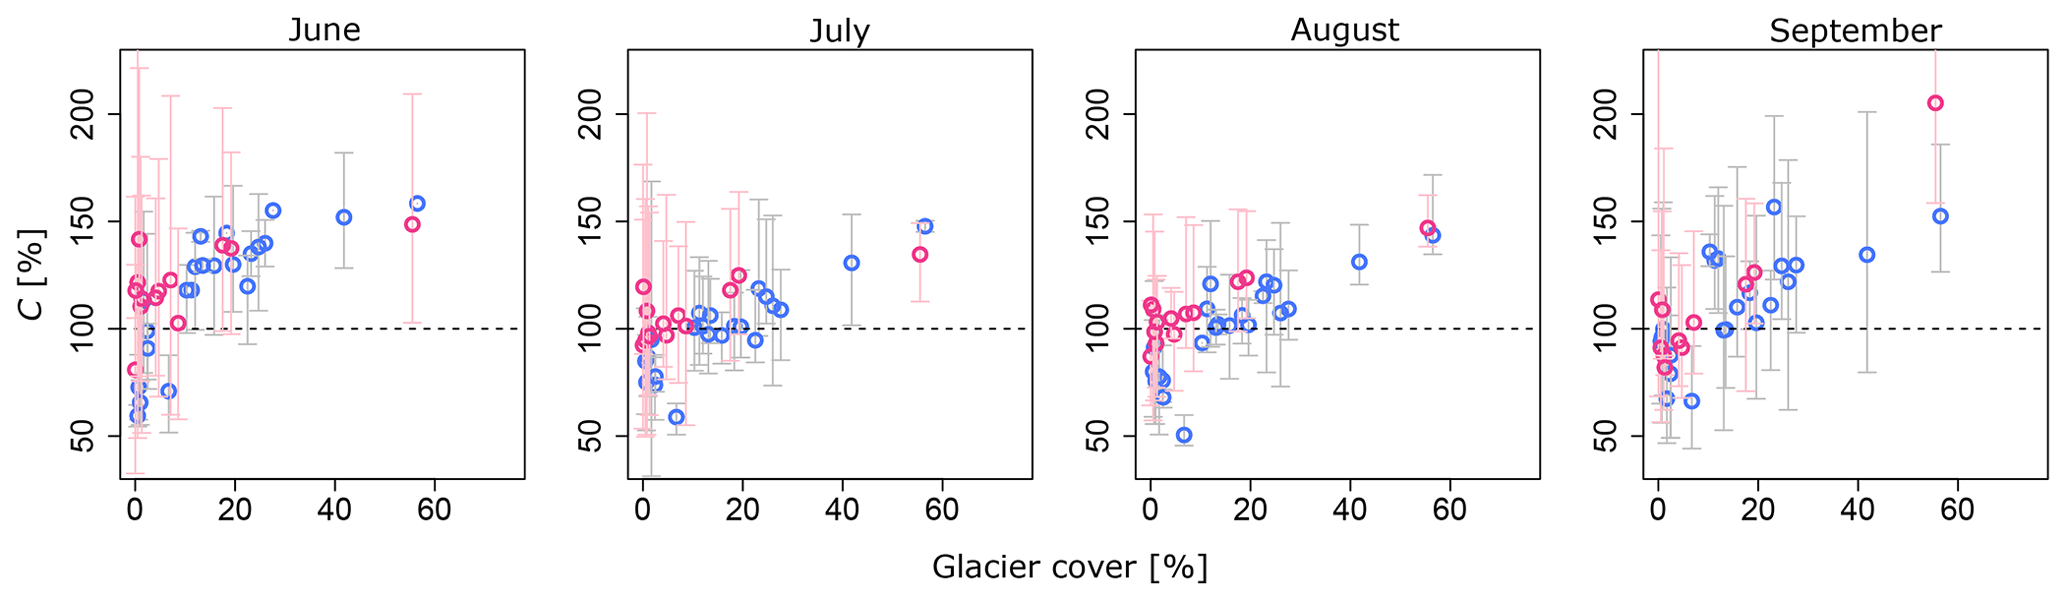
Figure 7Level of compensation (C) during WD events compared among catchments with low average summer rain amounts (July and August) (western Canada; pink) and high average summer rain amounts (European Alps; blue). The colored circles indicate the mean level of compensation, and the pink and gray bars represent the whole range of compensation levels.
4.4 Drivers of event-to-event variability in compensation levels
Besides differences among catchments, there were also differences in C among the selected WD events in individual catchments. The gray bars in Fig. 4 show this sometimes large variability in catchment C. To explain this variability, the relation between C and several event characteristics was therefore tested for groups of catchments with similar glacier cover.
Together, these variables could explain up to 80 % of the variance in C, but more often they explained around 40 %–60 % of the variance (Fig. 8). Taking all the C values for the different summer months together considerably lowered the explained variance, especially for the Norwegian catchments, suggesting that the variables can have a different effect or represent different processes in the different months. The two variables that were used as a proxy for snowpack and snowmelt, Pwinter and Tspring, appeared to be most important in Norway, especially in June and July. In August and September, the most important variable switched to temperature in the Norwegian catchments. In the Alps, Pwinter, Tspring, and antecedent streamflow conditions (Q30) were important. In August and September, the snow variables were still important for the more highly glacierized catchments. In western Canada, Q30 was the most important variable in all months and for most glacier cover classes. Most of the variables had a positive relation with C: the higher the anomaly in the predictor, the higher C is, except for Tspring and sometimes duration, which had a negative relation. Higher temperatures in Tspring would result in lower C.
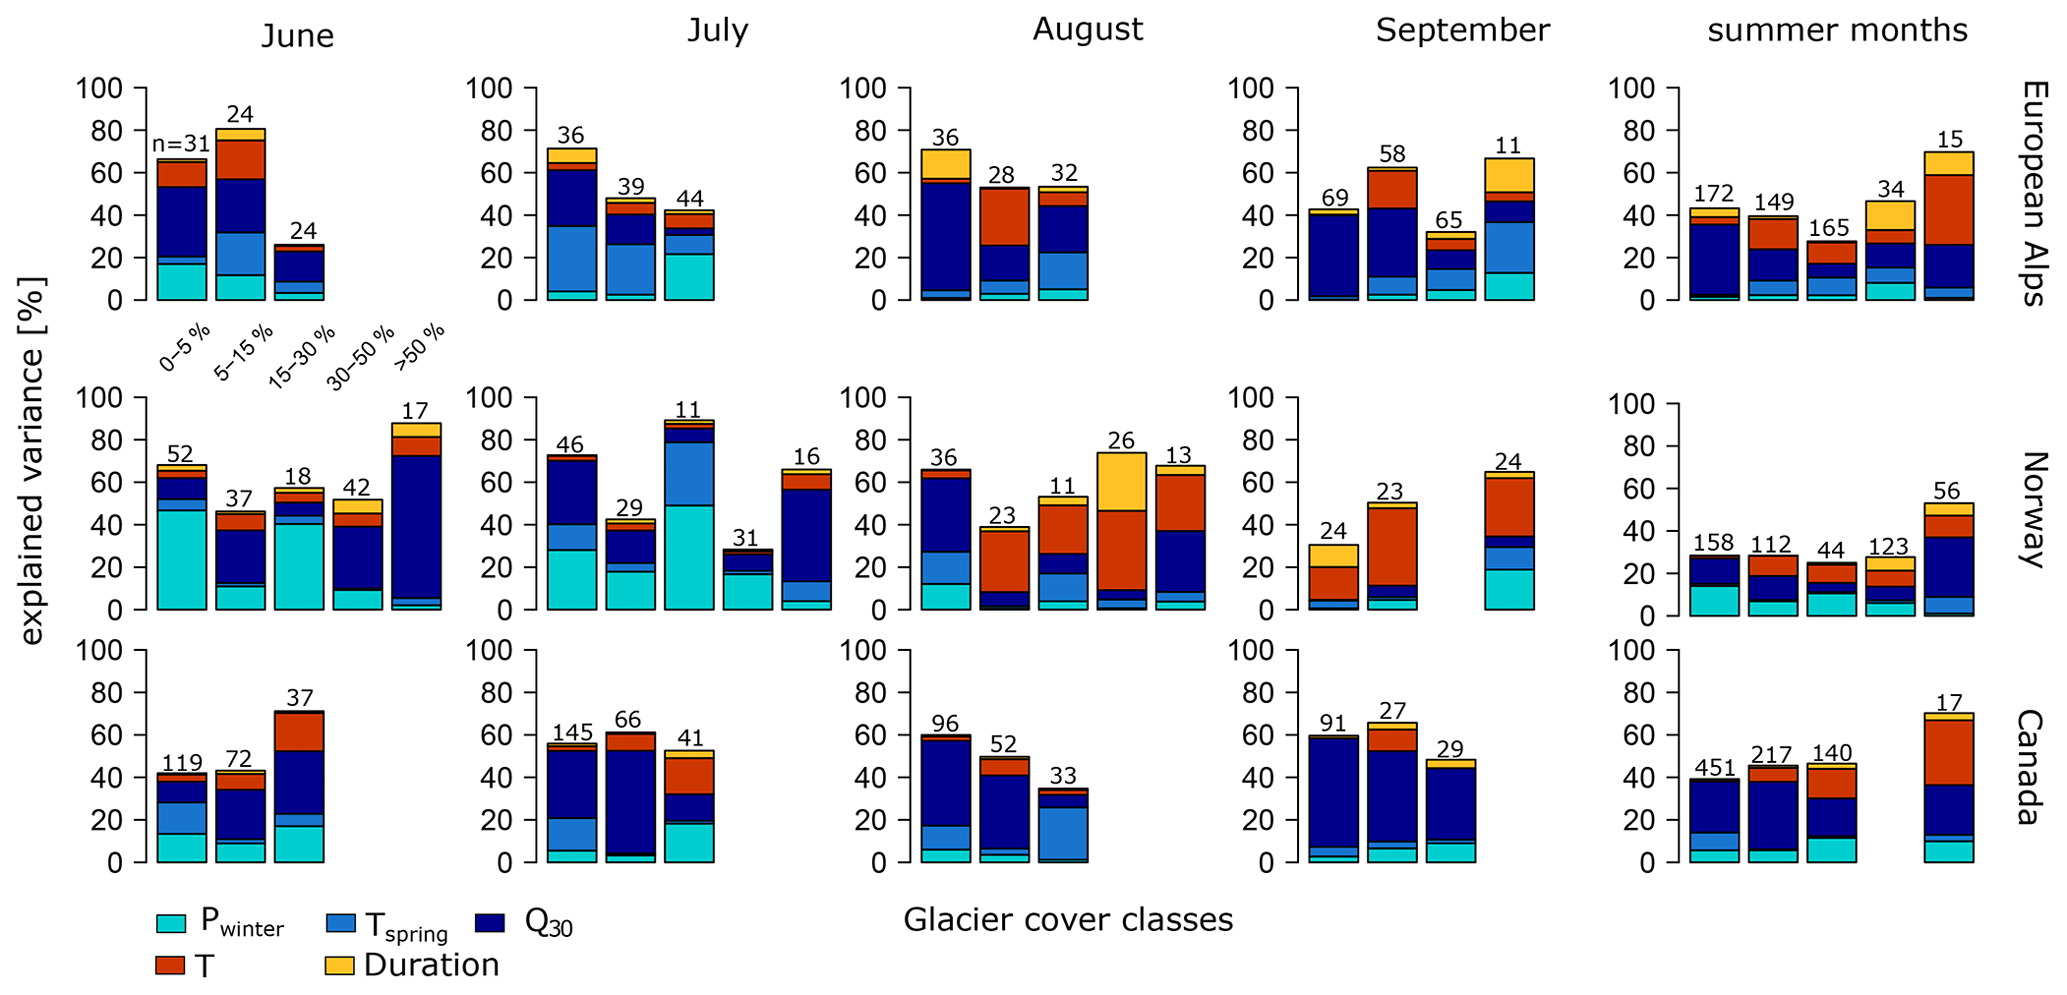
Figure 8Explained variance in C during WD events for groups of catchments with similar glacier cover. The glacier cover classes are indicated on the top left bar plot. No bar is present if there were less than 10 events for a gc class and month. The number above the bars indicates the number of events used in the regression model.

Figure 9Time trends of C for each catchment calculated as Spearman rank correlation coefficients (rs) between C and year of the WD event. Norwegian catchments are indicated in green, catchments in the European Alps in blue, and Canadian catchments in pink. Circles indicate significant trends (α=0.05).
Changes in glacier compensation effects over time due to glacier retreat and changes in glacier melt contribution might explain differences in C between different WD events. For all the catchments with enough events to calculate a trend over time, only very few showed significant trends (Fig. 9). Most significant trends were found in June (western Canada) and September (European Alps), which were all negative. Norwegian catchments showed mostly positive trends, except in September.
5.1 Quantifying the buffering capacity and compensation effect of glaciers
The presence of glaciers in headwater catchments indicates that streamflow of these catchments can potentially have an opposite response to warm and dry events compared to non-glacierized catchments. In general, glacier melt (and snowmelt) can be seen as an additional source of water in summer, besides rainfall. Thus, during warm and dry events, glaciers always alleviate the (negative) hydrological response, and they buffer against the negative impact of these meteorological conditions. In this perspective, the benchmark to compare the streamflow response with is a situation without glaciers. Often, studies use this perspective to describe the buffering capacity of glaciers (e.g., Frenierre and Mark, 2014; Pritchard, 2019). However, quantifying or differentiating the buffering capacity, in this case, is not possible as it is either buffering (glaciers present) or not (no glaciers anymore). Therefore, we investigated in more detail the level of streamflow compensation to quantify the (active) buffering role or compensation effect of glaciers. For this, we used a benchmark that includes the long-term average glacier melt contribution (daily streamflow regime benchmark) (Sect. 3.2). We asked if the excess (more than normal) glacier melt during a WD event can compensate for the reduced streamflow because of a lack of rainfall and potentially increased evaporation. The level of compensation (C) metric that we used can provide information on the water availability situation and distinguishes the buffering role of glaciers in different catchments and during different events. Such a metric that quantifies the buffering role and compensation effects of glaciers is highly needed to compare different studies and different situations and to analyze changes over time. The latter might present some additional challenge because in these rapidly changing systems the daily streamflow regime benchmark can change significantly over long periods (e.g., Van Tiel et al., 2018).
We thus looked at relative streamflow amounts instead of absolute amounts of streamflow and glacier melt contributions. This relative anomaly-based approach regarding temperature and streamflow allowed us to select events in different months. An absolute temperature threshold would only result in events in high summer. From a catchment and water management perspective, it is essential to understand how glaciers can buffer WD events in the summer shoulder seasons (June, September), thus when meteorological conditions are exceptional compared to the normal condition.
5.2 Glacier cover as important control of compensation
Relative glacier cover was hypothesized to be an important control of the event compensation levels as it relates to the fraction of streamflow from glacier melt and thus determines the part of streamflow that is sensitive to temperature anomalies (Fig. 10). In general, the results confirmed this hypothesis, especially for catchments in the European Alps (Fig. 4). These findings correspond with the findings of Zappa and Kan (2007). They found for the extreme summer of 2003 close-to-normal conditions for glacierized catchments in the Swiss Alps with 10 %–25 % glacier cover and close to 160 % streamflow for a catchment with more than 60 % glacier cover. Our event responses for the same most highly glacierized catchment are of the same magnitude (150 %), suggesting that compensation levels for WD events and longer-term drought responses may be similar. Koboltschnig and Schöner (2011) also found that above a glacier cover of around 10 %, August 2003 streamflow was higher than average August streamflow for glacierized catchments in the Drau, Salzach, and Inn basins in Austria. Bakke et al. (2020) looked at another drought event (2018) and suggested that in Norway, catchments with glacier cover above 30 % showed above-normal streamflow conditions during August and September, but they did not specifically quantify how much. Overall, relative glacier cover is thus a first-order variable that determines the relative streamflow response. This means that in downstream areas, where the relative glacier cover reduces (less than 5 %), most of such events may not be compensated by excess glacier melt. However, there are exceptions for some catchments in Canada with a low relative glacier cover and for some events in all of the catchments with a low glacier cover because the ranges in compensation levels can be large (Fig. 4); i.e., some events in catchments with a low glacier cover can still result in C levels above 100 %.
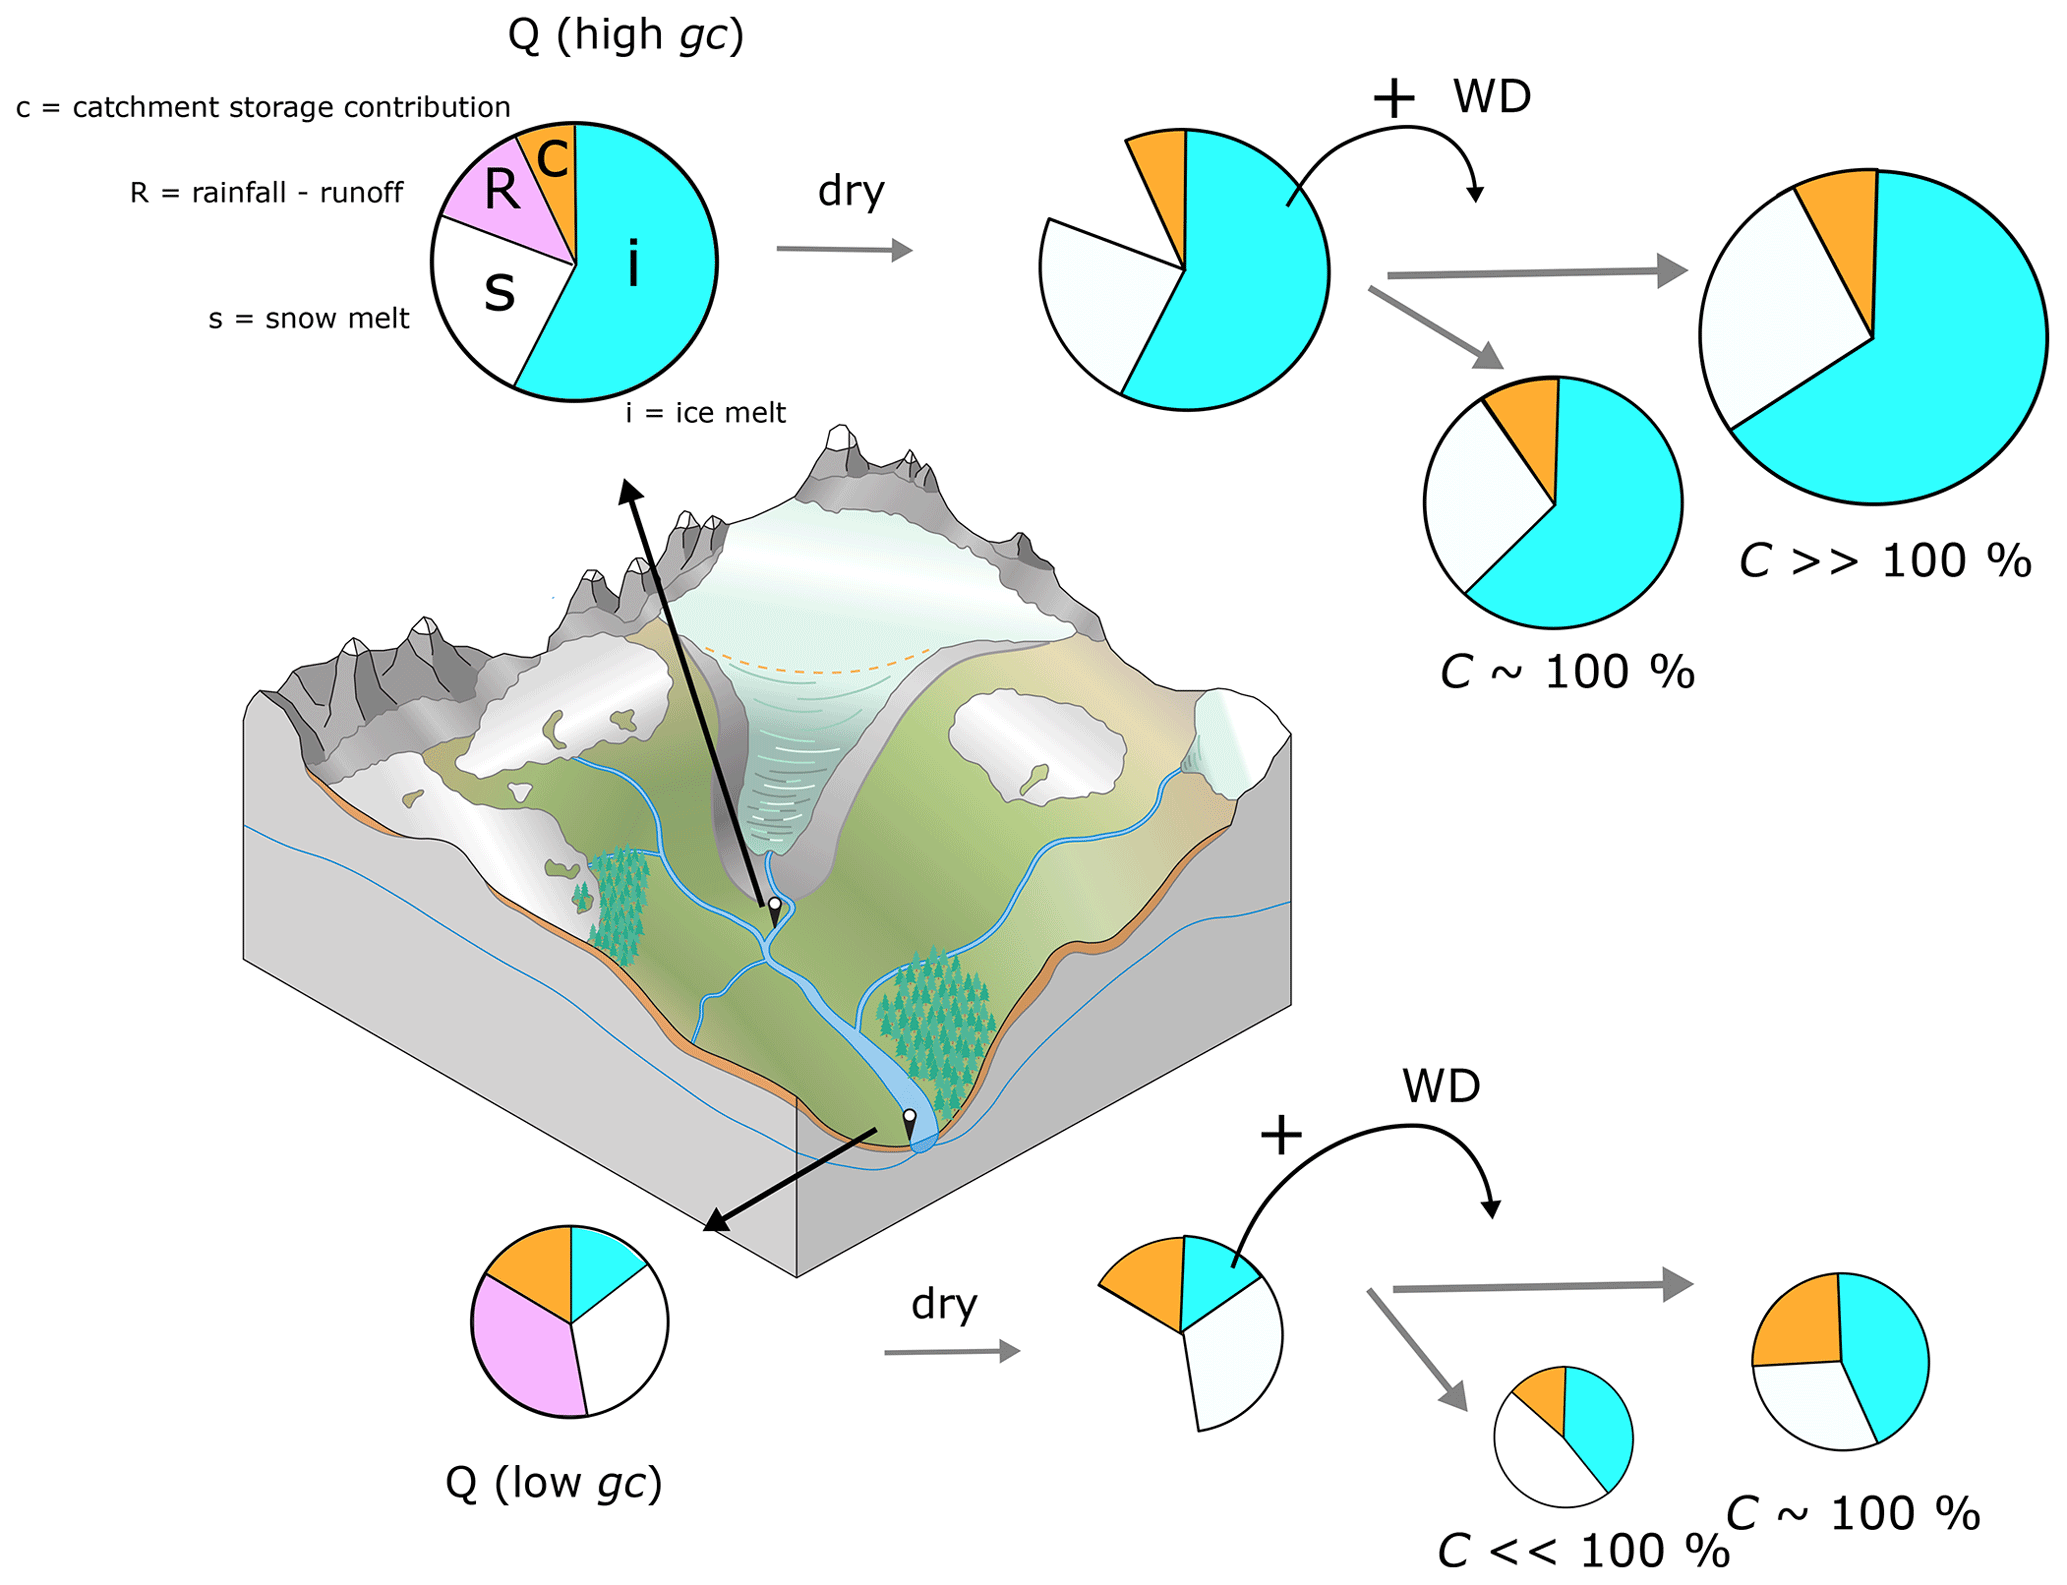
Figure 10Conceptual overview of the different streamflow contributions in a glacierized catchment during summer and how they influence the response to warm and dry events (WD). The sketch in the middle shows a glacierized catchment, and the circles above and below represent the streamflow contributions for a for a catchment with a high (above) and low (below) relative glacier cover. Size of the circles scale with absolute specific streamflow amounts. The colors in the circles indicate the relative contributions of ice melt, snowmelt, rain, and other catchment storages. During a dry event, the rainfall runoff contribution is lacking, and depending on the relative contribution of the other streamflow components (snowmelt, glacier melt, and catchment storage) and their anomalies, glacier melt can compensate (C=100 %) or overcompensate (C>100 %).
5.3 Drivers of event-to-event variability in compensation levels
A most notable finding was the large event-to-event variability in compensation levels. While some variation was expected, because of varying event characteristics (duration, temperature, timing within the month, small precipitation amounts), compensation level differences larger than 50 %, often spanning below- and above-normal conditions, were not necessarily expected. These wide ranges hamper a clear conclusion on the question of which situation glaciers compensate in because it depends not only on catchment characteristics but also on the specific situation in which the event takes place. Understanding this variability, why sometimes the glacier is compensating and sometimes not, is crucial for water management purposes. The range in event responses was in general largest for the Norwegian catchments (Fig. 4). In August, the range was relatively small in all regions, possibly indicating that in this month, other streamflow contributions than glacier melt are less important and thus cause less variability (Figs. 8 and 10). In other studies, August is also often described as the month with the highest relative glacier melt contributions (e.g., Stahl and Moore, 2006; Moore et al., 2020). June and September may show high event-to-event variability because of varying snow conditions in June and variations in end-of-season conditions in September (prolongation of August melt conditions or early recession to baseflow conditions). For September events, the variability may thus also be related to the timing of the event within the month.
We found that antecedent conditions such as snow and streamflow before the event can be relevant for the streamflow event response (Fig. 8). Jenicek et al. (2016) showed that maximum snow water equivalent in winter (SWE) is influencing minimum streamflow in July, especially in catchments above 2000 m a.s.l. and during drier years. From May to September, the relation in their study became less clear. In our catchments, July is not a low-flow period. Still, it appears that winter precipitation has a positive effect, and spring temperature has a negative effect on June and July warm and dry event responses. We did not find the positive relation between high spring temperatures and earlier disappearance of snow on the glacier and therefore higher glacier melt amounts (and higher C) because the regression coefficient for Tspring was mostly negative. However, this missing effect could relate to spring temperature anomalies not being a good proxy for snow cover on the glacier.
Prior streamflow has previously been used as an index for carry-over storage (storage from the previous time period that is released in the current time period) in glacierized catchments in Canada to explain summer streamflow variation empirically (Stahl and Moore, 2006; Moyer et al., 2016). Our study confirms that streamflow before the event is particularly important for catchments in Canada, which are in general larger and may therefore have larger (subsurface) storages. For one of the highly glacierized catchments in Norway, the large part of the variance explained by the antecedent streamflow conditions is likely related to the presence of a lake in this catchment (Nigardsbrevatn). High antecedent streamflow conditions could reflect filled-catchment subsurface storages, recharged by snowmelt, glacier melt, and rainfall, or it could mean that warm and dry extreme events (often) occur in summers that are overall exceptionally warm, causing increased glacier melt contributions. Since the events are distributed over several years, it may not be likely that warm summers are the only explanation of the effect of antecedent conditions on event responses. Studies on groundwater storage in high mountain catchments only emerged recently and mostly focus on non-glacierized alpine systems (Arnoux et al., 2020b; Cochand et al., 2019; Staudinger et al., 2017). Storage contributions to streamflow are also often related to winter or summer low-flow periods so that little is known about storage contributions to streamflow in summer in glacierized catchments. However, these studies conclude that, contradictory to what has long been thought, there is quite some potential for groundwater storage, especially in quaternary deposits (Arnoux et al., 2020b, a), and there may be some potential for fast and slowly responding storages (Hayashi, 2020; Kobierska et al., 2015). Also, in glacierized catchments there is potential for some groundwater contributions to streamflow in the melt season (Mackay et al., 2020; Somers et al., 2019; Somers and McKenzie, 2020).
Analyzing this unique dataset of long-term streamflow records allowed us to investigate changes in streamflow responses to WD events over time. Only very few significant trends in C over time were found, mainly in June and September (Fig. 9). In June, when streamflow is dominated by snowmelt, shifts in the regime towards earlier snowmelt may reduce snowmelt amounts (Déry et al., 2009; Ul Islam et al., 2019). For North America, studies also found a decrease in snow amount (e.g., Dyer and Mote, 2006). In Norway, trends in compensation levels tend to be positive and agree with increased melt contributions in recent years (Engelhardt et al., 2014). Positive trends in Norway may also be attributed to increasing trends in snow at higher elevations (Skaugen et al., 2012). In September, negative trends could relate to a reduction in glacier melt contribution because glaciers have retreated to higher elevations where temperatures in September may not always allow melt. However, glaciers have not only retreated in our analyzed period, there were also periods of glacier advances in Norway around 1990 (e.g., Andreassen et al., 2005) and around 1980 for the European Alps (e.g., Huss et al., 2015). These glacier fluctuations may have resulted in less clear trends of C over time. Several studies showed declining streamflow trends in August for Canadian glacierized catchments (Moore et al., 2020; Moyer et al., 2016; Stahl and Moore, 2006). The mainly decreasing trends in C with time and at the same time increasing occurrence of warm and dry events (Manning et al., 2019; Ridder et al., 2020) suggest that further research is strongly needed to understand how the compensation effect will change in the future and how fast.
5.4 The role of temperature during warm and dry events
The analysis of dry events that were not warm confirmed the importance of high temperatures for a streamflow compensation effect (Fig. 6). Without additional melt or even less-than-normal melt contributions, streamflow responses to dry periods are on average below normal conditions (ND and CD event responses). This agrees with the findings of Van Loon et al. (2015), who related streamflow deficits in glacierized catchments to negative temperature anomalies. Compensation levels for ND events may show the relative rainfall deficits (100 % − C [%]) as melt is assumed to be normal (Fig. 10), but a more detailed look into the rainfall amounts and dynamics of each catchment would be needed to confirm that. From July until September, higher temperatures are favorable to compensate for dry events. However, higher temperatures further downstream may favor high evaporation rates, enhancing the streamflow deficit (Mastrotheodoros et al., 2020). Also, increasing high temperatures or relatively extremely high temperatures occurring more often will not be sustained with higher melt contributions when glaciers have considerably retreated. Koboltschnig et al. (2007) found for example that if the extreme summer of 2003 had happened in 1979 (only changing the glacier outline in the model), the ice melt contribution would have been 400 mm higher (catchment scale). In June, WWD compensation levels were not higher than WD event responses in the Alps and southwestern Norway. This may relate to the shorter durations of WWD events and the overall high event responses in June (likely due to the enhanced contribution from snowmelt compared to the late summer season) so that longer events may have a higher positive anomaly.
5.5 Appraisal of an intercontinental multi-catchment analysis
To our knowledge, this is the first study that uses a large set of long-term streamflow observations of glacierized catchments in different regions to carry out an analysis of the compensation effect of glaciers. While this has several advantages, such as analyzing a large sample, it also brought forward some challenges and limitations.
The comparison of different glacierized mountain regions revealed differences in compensation levels between the three regions that can be related to either the analyzed sample or regional differences in climate and catchment characteristics. Southwestern Norway is located at a higher latitude and experiences a strong maritime climate. The melt season may therefore be shorter, but the glaciers are located at lower elevations than in the Alps and western Canada. Also, the results point towards higher importance of snowmelt contribution to streamflow in Norway compared to the other two regions during WD events. In general, the compensation levels are lower than in the other two regions, but with high variability, and may relate to the usual high precipitation amounts (Lussana et al., 2018) and thus high relative deficits. In western Canada, catchments are in general much larger, and there are some sub-regional differences in climate, with catchments located close to the west coast, in the eastern part of British Columbia and western part of Alberta, and in the northwestern part of Canada. Coastal catchments are therefore more comparable to Norwegian catchments, while the inland catchments may be comparable to catchments in the European Alps. Still, there are quite some differences in minimum glacier elevation between western Canada and the European Alps, suggesting differences in climatic conditions (Fig. 1). Testing the effect of dry summer conditions by comparing Canadian and European Alps catchments showed some effect, i.e., higher level of compensation in drier catchments. However, the relative glacier covers of the Canadian and Alps catchments are more complementary than comparable in this sample of catchments, hampering clear conclusions. Therefore, a more detailed comparison with absolute streamflow amounts and testing of event-scale and monthly scale responses would be needed to confirm these findings.
The analyzed sample includes many glacierized catchments. Still, the relative glacier covers are not evenly distributed, which may have caused some bias in the interpretation of regional differences. Most catchments have a relatively low glacier cover (<15 %), especially in western Canada. While catchments with a low glacier cover are interesting because they have a more direct practical implication for downstream water users, more highly glacierized catchments are useful to better isolate the glacier melt response to warm and dry events. The skewed distribution of glacier covers in the Canadian catchment sample hindered clear conclusions on the effect of reduced summer precipitation when comparing them with catchments from the European Alps as there were only few Canadian catchments with a glacier cover between 10 %–50 %. In all regions the most highly glacierized catchment showed a clear distinct response (Fig. 4). Still, as for the catchments with low glacier cover, also here there might be a high spatial variability, likely depending more on glacier characteristics and climate variability but possibly also on non-glacierized catchment characteristics such as lakes, groundwater, and other catchment storages. However, data from undisturbed highly glacierized catchments are scarce and often not available for extended periods. Zooming in to certain recent events and including more highly glacierized catchments may advance our understanding over the whole range of glacierized catchment responses.
5.6 Methodological challenges
Streamflow responses to warm and dry events (and other dry events) were selected to analyze the role of glacier melt in compensating rainfall deficits in the summer months. The streamflow signal, however, likely contained more contributions than only direct melt, e.g., from catchment storages, as we also showed in the analysis of the drivers of the event variability. A (high) rainfall event just before the WD event may potentially still influence the streamflow response during the event which is then not related to increased snowmelt or glacier melt. Yet, to exclude this effect, detailed knowledge is needed to know the delay between rainfall and streamflow for each catchment (e.g., Stoelzle et al., 2020). Moreover, the effect may depend on the intensity of the rainfall event before the WD event. Shifting the analyzed response window relative to the WD event itself to exclude the effect of rainfall runoff processes just before the event and to include the possible delay of glacier meltwater reaching the outlet is not an option because of conditions after the event that can influence the streamflow response as well. Shortening the analyzed time frame of streamflow responses to WD events may be an option, e.g., excluding the first 2 d. However, the choice of the number of days to exclude may be arbitrary and vary for each catchment. Moreover, the results showed that WD events are rather limited, and shortening the analyzed time frame may result in loss of important information.
Ideally, the glacier melt component itself would be known to assess its compensation effects instead of analyzing the streamflow signal. We used catchment mean temperature from a gridded product and its anomalies to select abnormal melt events. This does not, however, necessarily relate to absolute glacier melt amounts. A glacier located at lower elevations (thus with higher temperatures) may experience higher melt rates, and the same applies to a glacier where the snowline has shifted to higher elevations. Also, at high elevations in the catchment, temperatures may in some cases not reach melting conditions so that the temperature anomaly does not affect the melt rate. Across regions, temperatures and elevations might be less comparable as latitude and proximity to the ocean play a role as well. Nevertheless, this study aimed to show how excess melt compensates for rainfall deficits. Comparing the streamflow responses during WD events with the normal streamflow behavior during the summer months implicitly considers absolute melt differences between catchments and focuses instead on how much more (relatively) melt is generated.
Summer glacier mass balance observations could be used to obtain information on the amount of glacier melt. For the event scale, however, these observations have too coarse of a temporal resolution. Measurements of glacier mass balances with higher temporal resolution would significantly advance our understanding of the glacier buffering role on timescales that matter for water management. Near-real-time observations of mass balances may provide some opportunities for that (Landmann et al., 2020). Other data that will be necessary to analyze the different events in more detail are snow data. Snow cover and snow water equivalent (SWE) data may help to estimate the amount of melt that comes from snow instead of glacier ice, to estimate the snow-free glacier area, and to estimate the disappearance date of seasonal snowpack. These variables may be better predictors for the inter-event variability than the proxies that were used here (Pwinter and Tspring).
Part of the limitations mentioned here could theoretically be solved by using glacio-hydrological models that estimate the different contributions to streamflow and calculate snow amounts (e.g., Engelhardt et al., 2014; Jobst et al., 2018; Stahl et al., 2017). Nonetheless, we need to be careful using such models because there is quite a risk of internal model compensation (e.g., lack of precipitation or snowmelt due to input or model process uncertainties could be compensated for by extra glacier melt), and on the event scale, this may result in wrong conclusions (van Tiel et al., 2020b). Also, modeling one or a few catchments will not provide the insights that we have shown here that there is a dependence on relative glacier cover but that there are regional differences and that catchment and climate characteristics play a role, too. Thus, the way forward would be to include more detailed observations to extend the empirical analyses and rigorously test models against the observations that we have on the event scale to use these models for attribution of drivers of the event compensation levels.
This study provides a unique analysis of the event-scale compensation effect of glaciers to extremely warm and dry periods in the summer months by analyzing long-term streamflow records of 50 glacierized catchments in southwestern Norway, the European Alps, and western Canada. Warm and dry events occur mostly in September in the European Alps, in June in Norway, and in July in western Canada. A wide range of compensation levels was found, ranging on average between 50 %–200 % of normal streamflow during the period of the events. The compensation effect of glaciers depends on several variables, which may all trace back to the streamflow composition. Above-normal (>100 %) average event streamflow responses were highest in June. Snow cover in the non-glacierized part of the catchments in June might have enlarged the area that is sensitive to the relatively high temperatures. The higher the degree of glacierization, the higher the relative streamflow amounts during an event. This signal was most apparent for catchments in the European Alps and western Canada. The glacierization levels where the average compensation level switches from below- (no full compensation) to above-normal streamflow (compensation or overcompensation) were found to be lower for catchments in western Canada (∼5 % gc) compared to the European Alps (10 %–15 % gc), possibly related to differences in precipitation amounts in summer (dry in western Canada, wet in the European Alps). Besides the variability in compensation levels related to timing in the summer, the degree of glacierization, and regional differences in climate and catchment characteristics, the event compensation levels for individual catchments and months also showed a large range, with compensation levels below and above normal conditions. Antecedent conditions that relate to precipitation in winter and streamflow anomalies during the 30 d before the event can explain part of this variability, suggesting that catchment storages, in the form of snow, water stored in the glacier, groundwater, and lakes, are important too for the effect of excess melt on the relative streamflow response.
Understanding the different mechanisms behind the event responses and glacier compensation effect is necessary as dry periods occur in different parts of the year in different regions, and the responses are thus driven by different processes. These insights will also be crucial to estimate these systems' sensitivities in a changing climate with increasing temperatures and changing precipitation patterns and increased risk of combined warm and dry events. Furthermore, the event-scale observations in the different summer months also have implications for our understanding of longer-term droughts and heat waves and how they will affect the development of hydrological drought in high mountain catchments over the summer.
Streamflow data from Austria are openly available from the eHYD database at https://ehyd.gv.at/ (last access: 9 November 2019) (Bundesministerium für Landwirtschaft, Regionen und Tourismus, 2019). Swiss streamflow data were provided by the Swiss Federal Office for the Environment (FOEN) and are available there on request. Canadian streamflow data are openly available via the HYDAT database (https://collaboration.cmc.ec.gc.ca/cmc/hydrometrics, last access: 10 September 2019) (Water Survey of Canada, 2019). Streamflow data for Norway were provided by the Norwegian Water Resources and Energy Directorate (NVE) and are available there on request. Climate data were made available by the Zentralanstalt für Meteorologie und Geodynamik (ZAMG) and MeteoSwiss for Austria and Switzerland, respectively, and are available on request from these institutions. For Norway (seNorge2) and Canada (PNWAmet), climate data are available according to the given references in the text. Glacier outline data are available according to the given references.
The supplement related to this article is available online at: https://doi.org/10.5194/hess-25-3245-2021-supplement.
MVT and KS conceived and designed the study. MVT performed the analyses and wrote the original manuscript. KS and AFVL provided feedback on the analyses. All authors reviewed and edited the final article.
The authors declare that they have no conflict of interest.
This research has been supported by the Deutsche Forschungsgemeinschaft (grant no. STA632/4-1).
This open-access publication was funded by the University of Freiburg.
This paper was edited by Bettina Schaefli and reviewed by Mauro Fischer and one anonymous referee.
Anderson, S. and Radić, V.: Identification of local water resource vulnerability to rapid deglaciation in Alberta, Nat. Clim. Change, 10, 933–938, https://doi.org/10.1038/s41558-020-0863-4, 2020. a
Andreassen, L. M., Elvehøy, H., Kjøllmoen, B., Engeset, R. V., and Haakensen, N.: Glacier mass-balance and length variation in Norway, Ann. Glaciol., 42, 317–325, https://doi.org/10.3189/172756405781812826, 2005. a, b
Andreassen, L. M., Winsvold, S. H., Paul, F., and Hausberg, J. E.: Inventory of Norwegian Glaciers, in: vol. 38, Norwegian Water Resources and Energy Directorate, Oslo, ISBN 9788241008269, 2012. a
Arnoux, M., Brunner, P., Schaefli, B., Mott, R., Cochand, F., and Hunkeler, D.: Low-flow behavior of alpine catchments with varying quaternary cover under current and future climatic conditions, J. Hydrol., 592, 125591, https://doi.org/10.1016/j.jhydrol.2020.125591, 2020a. a
Arnoux, M., Halloran, L. J., Berdat, E., and Hunkeler, D.: Characterizing seasonal groundwater storage in alpine catchments using time-lapse gravimetry, water stable isotopes and water balance methods, Hydrol. Process., 34, 4319–4333, https://doi.org/10.1002/hyp.13884, 2020b. a, b
Ayala, Á., Farías-Barahona, D., Huss, M., Pellicciotti, F., McPhee, J., and Farinotti, D.: Glacier runoff variations since 1955 in the Maipo River Basin, semiarid Andes of central Chile, The Cryosphere, 14, 2005–2027, https://doi.org/10.5194/tc-14-2005-2020, 2020. a, b
Bakke, S. J., Ionita, M., and Tallaksen, L. M.: The 2018 northern European hydrological drought and its drivers in a historical perspective, Hydrol. Earth Syst. Sci., 24, 5621–5653, https://doi.org/10.5194/hess-24-5621-2020, 2020. a, b
Bloomfield, J. P. and Marchant, B. P.: Analysis of groundwater drought building on the standardised precipitation index approach, Hydrol. Earth Syst. Sci., 17, 4769–4787, https://doi.org/10.5194/hess-17-4769-2013, 2013. a
Buckel, J. and Otto, J.-C.: The Austrian Glacier Inventory GI 4 (2015) in ArcGis (shapefile) format, PANGEA, https://doi.org/10.1594/PANGAEA.887415, 2018. a
Bundesministerium für Landwirtschaft, Regionen und Tourismus: eHYD, available at: https://ehyd.gv.at/, last access: 9 November 2019. a
Chen, J. and Ohmura, A.: On the influence of Alpine glaciers on runoff, in: Hydrology in mountainous regions. I – Hydrological measurements; the Water Cycle, IAHS Press, Wallingford, 117–126, 1990. a
Chesnokova, A., Baraër, M., Laperrière-Robillard, T., and Huh, K.: Linking Mountain Glacier Retreat and Hydrological Changes in Southwestern Yukon, Water Resour. Res., 56, 1–26, https://doi.org/10.1029/2019WR025706, 2020. a
Cochand, M., Christe, P., Ornstein, P., and Hunkeler, D.: Groundwater Storage in High Alpine Catchments and Its Contribution to Streamflow, Water Resour. Res., 55, 2613–2630, https://doi.org/10.1029/2018WR022989, 2019. a
COGECA: Assessment of the impact of the heat wave and drought of the summer 2003 on agriculture and forestry, Committee of Agricultural Organisations in the European Union and General Committee for Agricultural Cooperation in the European Union, Brussels, Belgium, 2003. a
Cooper, M. G., Nolin, A. W., and Safeeq, M.: Testing the recent snow drought as an analog for climate warming sensitivity of Cascades snowpacks, Environ. Res. Lett., 11, 084009, https://doi.org/10.1088/1748-9326/11/8/084009, 2016. a
Déry, S. J., Stahl, K., Moore, R. D., Whitfield, P. H., Menounos, B., and Burford, J. E.: Detection of runoff timing changes in pluvial, nival, and glacial rivers of western Canada, Water Resour. Res., 45, 1–11, https://doi.org/10.1029/2008WR006975, 2009. a
Dyer, J. L. and Mote, T. L.: Spatial variability and trends in observed snow depth over North America, Geophys. Res. Lett., 33, 1–6, https://doi.org/10.1029/2006GL027258, 2006. a
Engelhardt, M., Schuler, T. V., and Andreassen, L. M.: Contribution of snow and glacier melt to discharge for highly glacierised catchments in Norway, Hydrol. Earth Syst. Sci., 18, 511–523, https://doi.org/10.5194/hess-18-511-2014, 2014. a, b, c
Finger, D., Pellicciotti, F., Konz, M., Rimkus, S., and Burlando, P.: The value of glacier mass balance, satellite snow cover images, and hourly discharge for improving the performance of a physically based distributed hydrological model, Water Resour. Res., 47, 1–14, https://doi.org/10.1029/2010WR009824, 2011. a
Fink, A. H., Brücher, T., Krüger, A., Leckebusch, G. C., Pinto, J. G., and Ulbrich, U.: The 2003 European summer heatwaves and drought – synoptic diagnosis and impacts, Weather, 59, 209–216, https://doi.org/10.1256/wea.73.04, 2004. a
Fischer, M., Huss, M., Barboux, C., and Hoelzle, M.: The new Swiss Glacier Inventory SGI2010: Relevance of using high-resolution source data in areas dominated by very small glaciers, Arct. Antarct. Alp. Res., 46, 933–945, https://doi.org/10.1657/1938-4246-46.4.933, 2014. a
Fischer, M., Huss, M., and Hoelzle, M.: Surface elevation and mass changes of all Swiss glaciers 1980–2010, The Cryosphere, 9, 525–540, https://doi.org/10.5194/tc-9-525-2015, 2015. a
Fountain, A. G. and Tangborn, W. V.: The Effect of Glaciers on Streamflow Variations, Water Resour. Res., 21, 579–586, 1985. a, b
Frenierre, J. L. and Mark, B. G.: A review of methods for estimating the contribution of glacial meltwater to total watershed discharge, Prog. Phys. Geogr., 38, 173–200, https://doi.org/10.1177/0309133313516161, 2014. a
Grömping, U.: Relative importance for linear regression in R: The package relaimpo, J. Stat. Softw., 17, 1–27, https://doi.org/10.18637/jss.v017.i01, 2006. a
Hayashi, M.: Alpine Hydrogeology: The Critical Role of Groundwater in Sourcing the Headwaters of the World, Groundwater, 58, 498–510, https://doi.org/10.1111/gwat.12965, 2020. a
Hellwig, J. and Stahl, K.: An assessment of trends and potential future changes in groundwater-baseflow drought based on catchment response times, Hydrol. Earth Syst. Sci., 22, 6209–6224, https://doi.org/10.5194/hess-22-6209-2018, 2018. a
Hiebl, J. and Frei, C.: Daily temperature grids for Austria since 1961 – concept, creation and applicability, Theor. Appl. Climatol., 124, 161–178, https://doi.org/10.1007/s00704-015-1411-4, 2016. a
Hiebl, J. and Frei, C.: Daily precipitation grids for Austria since 1961 – development and evaluation of a spatial dataset for hydroclimatic monitoring and modelling, Theor. Appl. Climatol., 132, 327–345, https://doi.org/10.1007/s00704-017-2093-x, 2018. a
Huning, L. S. and AghaKouchak, A.: Global snow drought hot spots and characteristics, P. Natl. Acad. Sci. USA, 117, 19753–19759, https://doi.org/10.1073/PNAS.1915921117, 2020. a
Huss, M. and Hock, R.: Global-scale hydrological response to future glacier mass loss, Nat. Clim. Change, 8, 135–140, https://doi.org/10.1038/s41558-017-0049-x, 2018. a, b
Huss, M., Dhulst, L., and Bauder, A.: New long-term mass-balance series for the Swiss Alps, J. Glaciol., 61, 551–562, https://doi.org/10.3189/2015JoG15J015, 2015. a
Jansson, P., Hock, R., and Schneider, T.: The concept of glacier storage: A review, J. Hydrol., 282, 116–129, https://doi.org/10.1016/S0022-1694(03)00258-0, 2003. a
Jenicek, M., Seibert, J., Zappa, M., Staudinger, M., and Jonas, T.: Importance of maximum snow accumulation for summer low flows in humid catchments, Hydrol. Earth Syst. Sci., 20, 859–874, https://doi.org/10.5194/hess-20-859-2016, 2016. a
Jobst, A. M., Kingston, D. G., Cullen, N. J., and Schmid, J.: Intercomparison of different uncertainty sources in hydrological climate change projections for an alpine catchment (upper Clutha River, New Zealand), Hydrol. Earth Syst. Sci., 22, 3125–3142, https://doi.org/10.5194/hess-22-3125-2018, 2018. a
Jonkeren, O., Rietveld, P., and van Ommeren, J.: Welfare effects of low water levels on the river Rhine through the Inland Waterway Transport Sector, J. Trans. Econ. Policy, 41, 387–411, 2007. a
Jost, G., Moore, R. D., Menounos, B., and Wheate, R.: Quantifying the contribution of glacier runoff to streamflow in the upper Columbia River Basin, Canada, Hydrol. Earth Syst. Sci., 16, 849–860, https://doi.org/10.5194/hess-16-849-2012, 2012. a
Kaser, G., Großhauser, M., and Marzeion, B.: Contribution potential of glaciers to water availability in different climate regimes, P. Natl. Acad. Sci. USA, 107, 20223–20227, https://doi.org/10.1073/pnas.1008162107, 2010. a
Kobierska, F., Jonas, T., Kirchner, J. W., and Bernasconi, S. M.: Linking baseflow separation and groundwater storage dynamics in an alpine basin (Dammagletscher, Switzerland), Hydrol. Earth Syst. Sci., 19, 3681–3693, https://doi.org/10.5194/hess-19-3681-2015, 2015. a
Koboltschnig, G. R. and Schöner, W.: The relevance of glacier melt in the water cycle of the Alps: The example of Austria, Hydrol. Earth Syst. Sci., 15, 2039–2048, https://doi.org/10.5194/hess-15-2039-2011, 2011. a, b, c
Koboltschnig, G. R., Schöner, W., Zappa, M., and Holzmann, H.: Contribution of glacier melt to stream runoff: If the climatically extreme summer of 2003 had happened in 1979 …, Ann. Glaciol., 46, 303–308, https://doi.org/10.3189/172756407782871260, 2007. a
Koboltschnig, G. R., Schöner, W., Holzmann, H., and Zappa, M.: Glaciermelt of a small basin contributing to runoff under the extreme climate conditions in the summer of 2003, Hydrol. Process., 23, 1010–1018, https://doi.org/10.1002/hyp.7203, 2009. a
Konz, M. and Seibert, J.: On the value of glacier mass balances for hydrological model calibration, J. Hydrol., 385, 238–246, https://doi.org/10.1016/j.jhydrol.2010.02.025, 2010. a
Landmann, J. M., Künsch, H. R., Huss, M., Ogier, C., Kalisch, M., and Farinotti, D.: Assimilating near real-time mass balance observations into a model ensemble using a particle filter, The Cryosphere Discuss. [preprint], https://doi.org/10.5194/tc-2020-281, in review, 2020. a
Livneh, B. and Badger, A. M.: Drought less predictable under declining future snowpack, Nat. Clim. Change, 10, 452–458, https://doi.org/10.1038/s41558-020-0754-8, 2020. a
Lussana, C., Tveito, O. E., and Uboldi, F.: seNorge v2.0, Temperature An observational gridded dataset of temperature for Norway, MET report, Norwegian Meterological Institute, Oslo, 2016. a
Lussana, C., Saloranta, T., Skaugen, T., Magnusson, J., Einar Tveito, O., and Andersen, J.: SeNorge2 daily precipitation, an observational gridded dataset over Norway from 1957 to the present day, Earth Syst. Sci. Data, 10, 235–249, https://doi.org/10.5194/essd-10-235-2018, 2018. a, b, c
Mackay, J. D., Barrand, N. E., Hannah, D. M., Krause, S., Jackson, C. R., Everest, J., MacDonald, A. M., and Ó Dochartaigh, B. É.: Proglacial groundwater storage dynamics under climate change and glacier retreat, Hydrol. Process., 34, 5456–5473, https://doi.org/10.1002/hyp.13961, 2020. a
Manning, C., Widmann, M., Bevacqua, E., Van Loon, A. F., Maraun, D., and Vrac, M.: Increased probability of compound long-duration dry and hot events in Europe during summer (1950–2013), Environ. Res. Lett., 14, 094006, https://doi.org/10.1088/1748-9326/ab23bf, 2019. a
Mastrotheodoros, T., Pappas, C., Molnar, P., Burlando, P., Manoli, G., Parajka, J., Rigon, R., Széles, B., Bottazzi, M., Hadjidoukas, P., and Fatichi, S.: More green and less blue water in the Alps during warmer summers, Nat. Clim. Change, 10, 155–161, https://doi.org/10.1038/s41558-019-0676-5, 2020. a, b
MeteoSwiss: Documentation of MeteoSwiss Grid-Data Products Daily Mean, Minimum and Maximum Temperature: TabsD, TminD, TmaxD, Zurich, 1–4, 2017. a
MeteoSwiss: Documentation of MeteoSwiss Grid-Data Products Daily Precipitation (final analysis): RhiresD, 1–4, available at: https://www.meteoswiss.admin.ch/content/dam/meteoswiss/de/service-und-publikationen/produkt/raeumliche-daten-niederschlag/doc/ProdDoc_RhiresD.pdf (last access: 11 June 2021), 2019. a
Moore, R. D., Pelto, B., Menounos, B., and Hutchinson, D.: Detecting the Effects of Sustained Glacier Wastage on Streamflow in Variably Glacierized Catchments, Front. Earth Sci., 8, 136, https://doi.org/10.3389/feart.2020.00136, 2020. a, b, c
Moyer, A. N., Moore, R. D., and Koppes, M. N.: Streamflow response to the rapid retreat of a lake-calving glacier, Hydrol. Process., 30, 3650–3665, https://doi.org/10.1002/hyp.10890, 2016. a, b
Peters, E., Van Lanen, H. A., Torfs, P. J., and Bier, G.: Drought in groundwater – Drought distribution and performance indicators, J. Hydrol., 306, 302–317, https://doi.org/10.1016/j.jhydrol.2004.09.014, 2005. a
Pfeffer, W. T., Arendt, A. A., Bliss, A., Bolch, T., Cogley, J. G., Gardner, A. S., Hagen, J. O., Hock, R., Kaser, G., Kienholz, C., Miles, E. S., Moholdt, G., Mölg, N., Paul, F., Radić, V., Rastner, P., Raup, B. H., Rich, J., Sharp, M. J., Andreassen, L. M., Bajracharya, S., Barrand, N. E., Beedle, M. J., Berthier, E., Bhambri, R., Brown, I., Burgess, D. O., Burgess, E. W., Cawkwell, F., Chinn, T., Copland, L., Cullen, N. J., Davies, B., De Angelis, H., Fountain, A. G., Frey, H., Giffen, B. A., Glasser, N. F., Gurney, S. D., Hagg, W., Hall, D. K., Haritashya, U. K., Hartmann, G., Herreid, S., Howat, I., Jiskoot, H., Khromova, T. E., Klein, A., Kohler, J., König, M., Kriegel, D., Kutuzov, S., Lavrentiev, I., Le Bris, R., Li, X., Manley, W. F., Mayer, C., Menounos, B., Mercer, A., Mool, P., Negrete, A., Nosenko, G., Nuth, C., Osmonov, A., Pettersson, R., Racoviteanu, A., Ranzi, R., Sarikaya, M. A., Schneider, C., Sigurdsson, O., Sirguey, P., Stokes, C. R., Wheate, R., Wolken, G. J., Wu, L. Z., and Wyatt, F. R.: The randolph glacier inventory: A globally complete inventory of glaciers, J. Glaciol., 60, 537–552, https://doi.org/10.3189/2014JoG13J176, 2014. a
Pohl, E., Gloaguen, R., Andermann, C., and Knoche, M.: Glacier melt buffers river runoff in the Pamir Mountains, Water Resour. Res., 53, 2467–2489, https://doi.org/10.1002/2016WR019431, 2017. a, b, c
Pritchard, H. D.: Asia's shrinking glaciers protect large populations from drought stress, Nature, 569, 649–654, https://doi.org/10.1038/s41586-019-1240-1, 2019. a, b, c
Radić, V., Bliss, A., Beedlow, A. C., Hock, R., Miles, E., and Cogley, J. G.: Regional and global projections of twenty-first century glacier mass changes in response to climate scenarios from global climate models, Clim. Dynam., 42, 37–58, https://doi.org/10.1007/s00382-013-1719-7, 2014. a
Ridder, N. N., Pitman, A. J., Westra, S., Ukkola, A., Hong, X. D., Bador, M., Hirsch, A. L., Evans, J. P., Di Luca, A., and Zscheischler, J.: Global hotspots for the occurrence of compound events, Nat. Commun., 11, 1–10, https://doi.org/10.1038/s41467-020-19639-3, 2020. a
Rothlisberger, H. and Lang, H.: Glacial hydrology, in: Glacio-fluvial sediment transfer: An Alpine perspective, in: chap. Glacial Hy, John Wiley and Sons. Ltd, Chichester, UK, 207–2084, 1987. a
Rouault, G., Candau, J. N., Lieutier, F., Nageleisen, L. M., Martin, J. C., and Warzée, N.: Effects of drought and heat on forest insect populations in relation to the 2003 drought in Western Europe, Ann. Forest Sci., 63, 613–624, https://doi.org/10.1051/forest:2006044, 2006. a
Skaugen, T., Stranden, H. B., and Saloranta, T.: Trends in snow water equivalent in Norway (1931–2009), Hydrol. Res., 43, 489–499, https://doi.org/10.2166/nh.2012.109, 2012. a
Somers, L. D. and McKenzie, J. M.: A review of groundwater in high mountain environments, WIREs Water, 7, e1475, https://doi.org/10.1002/wat2.1475, 2020. a
Somers, L. D., McKenzie, J. M., Mark, B. G., Lagos, P., Ng, G. H. C., Wickert, A. D., Yarleque, C., Baraër, M., and Silva, Y.: Groundwater Buffers Decreasing Glacier Melt in an Andean Watershed – But Not Forever, Geophys. Res. Lett., 46, 13016–13026, https://doi.org/10.1029/2019GL084730, 2019. a
Stahl, K. and Moore, R. D.: Influence of watershed glacier coverage on summer streamflow in British Columbia, Canada, Water Resour. Res., 42, 2–6, https://doi.org/10.1029/2006WR005022, 2006. a, b, c, d
Stahl, K., Kohn, I., Blauhut, V., Urquijo, J., De Stefano, L., Acácio, V., Dias, S., Stagge, J. H., Tallaksen, L. M., Kampragou, E., Van Loon, A. F., Barker, L. J., Melsen, L. A., Bifulco, C., Musolino, D., De Carli, A., Massarutto, A., Assimacopoulos, D., and Van Lanen, H. A.: Impacts of European drought events: Insights from an international database of text-based reports, Nat. Hazards Earth Syst. Sci., 16, 801–819, https://doi.org/10.5194/nhess-16-801-2016, 2016. a, b
Stahl, K., Weiler, M., Kohn, I., Freudiger, D., Seibert, J., Vis, M., and Gerlinger, K.: The snow and glacier melt components of streamflow of the river Rhine and its tributaries considering the influence of climate change, p. 146, available at: https://www.chr-khr.org/en/publications (last access: 11 June 2021), 2017. a
Staudinger, M., Stoelzle, M., Seeger, S., Seibert, J., Weiler, M., and Stahl, K.: Catchment water storage variation with elevation, Hydrol. Process., 31, 2000–2015, https://doi.org/10.1002/hyp.11158, 2017. a
Stoelzle, M., Schuetz, T., Weiler, M., Stahl, K., and Tallaksen, L. M.: Beyond binary baseflow separation: a delayed-flow index for multiple streamflow contributions, Hydrol. Earth Syst. Sci., 24, 849–867, https://doi.org/10.5194/hess-24-849-2020, 2020. a
Teuling, A. J.: A hot future for European droughts, Nat. Clim. Change, 8, 364–365, https://doi.org/10.1038/s41558-018-0154-5, 2018. a
Teuling, A. J., Van Loon, A. F., Seneviratne, S. I., Lehner, I., Aubinet, M., Heinesch, B., Bernhofer, C., Grünwald, T., Prasse, H., and Spank, U.: Evapotranspiration amplifies European summer drought, Geophys. Res. Lett., 40, 2071–2075, https://doi.org/10.1002/grl.50495, 2013. a
Ul Islam, S., Curry, C. L., Déry, S. J., and Zwiers, F. W.: Quantifying projected changes in runoff variability and flow regimes of the Fraser River Basin, British Columbia, Hydrol. Earth Syst. Sci., 23, 811–828, https://doi.org/10.5194/hess-23-811-2019, 2019. a
van Loon, A. F.: Hydrological drought explained, Wiley Interdisciplin. Rev.: Water, 2, 359–392, https://doi.org/10.1002/wat2.1085, 2015. a, b
Van Loon, A. F. and Van Lanen, H. A.: A process-based typology of hydrological drought, Hydrol. Earth Syst. Sci., 16, 1915–1946, https://doi.org/10.5194/hess-16-1915-2012, 2012. a
Van Loon, A. F., Ploum, S. W., Parajka, J., Fleig, A. K., Garnier, E., Laaha, G., and Van Lanen, H. A. J.: Hydrological drought types in cold climates: quantitative analysis of causing factors and qualitative survey of impacts, Hydrol. Earth Syst. Sci., 19, 1993–2016, https://doi.org/10.5194/hess-19-1993-2015, 2015. a
Van Tiel, M., Teuling, A. J., Wanders, N., Vis, M. J., Stahl, K., and Van Loon, A. F.: The role of glacier changes and threshold definition in the characterisation of future streamflow droughts in glacierised catchments, Hydrol. Earth Syst. Sci., 22, 463–485, https://doi.org/10.5194/hess-22-463-2018, 2018. a
van Tiel, M., Kohn, I., Van Loon, A. F., and Stahl, K.: The compensating effect of glaciers: Characterizing the relation between interannual streamflow variability and glacier cover, Hydrol. Process., 34, 553–568, https://doi.org/10.1002/hyp.13603, 2020a. a, b, c
van Tiel, M., Stahl, K., Freudiger, D., and Seibert, J.: Glacio-hydrological model calibration and evaluation, Wiley Interdisciplin. Rev.: Water, 7, e1483, https://doi.org/10.1002/wat2.1483, 2020b. a, b
Water Survey of Canada: HYDAT database, available at: https://collaboration.cmc.ec.gc.ca/cmc/hydrometrics, last access: 10 September 2019. a
Werner, A. T., Schnorbus, M. A., Shrestha, R. R., Cannon, A. J., Zwiers, F. W., Dayon, G., and Anslow, F.: A long-term, temporally consistent, gridded daily meteorological dataset for northwestern North America, Scient. Data, 6, 1–16, https://doi.org/10.1038/sdata.2018.299, 2019. a
Zappa, M. and Kan, C.: Extreme heat and runoff extremes in the Swiss Alps, Nat. Hazards Earth Syst. Sci., 7, 375–389, https://doi.org/10.5194/nhess-7-375-2007, 2007. a, b, c, d, e
Zemp, M., Frey, H., Gärtner-Roer, I., Nussbaumer, S. U., Hoelzle, M., Paul, F., Haeberli, W., Denzinger, F., Ahlstrøm, A. P., Anderson, B., Bajracharya, S., Baroni, C., Braun, L. N., et al.: Historically unprecedented global glacier decline in the early 21st century, J. Glaciol., 61, 745–762, https://doi.org/10.3189/2015JoG15J017, 2015. a, b