the Creative Commons Attribution 4.0 License.
the Creative Commons Attribution 4.0 License.
 | 10 Jun 2021
Contrasting hydrological and thermal intensities determine seasonal lake-level variations – a case study at Paiku Co on the southern Tibetan Plateau
Tandong Yao
Kun Yang
Yaoming Ma
Broxton W. Bird
Evaporation from hydrologically closed lakes is one of the largest components of the lake water budget; however, its effects on seasonal lake-level variations remain unclear on the Tibetan Plateau (TP) due to a lack of comprehensive observations. In this study, weekly lake evaporation and its effects on seasonal lake-level variations are investigated at Paiku Co on the southern TP using in situ observations of thermal structure and hydrometeorology (2015–2018). Lake evaporation from Paiku Co was estimated to be 975±142 mm during the ice-free period (May to December), characterized by low values of 1.7 ± 0.6 mm d−1 during the pre-monsoon season (May to June), high values of 5.5±0.6 mm d−1 during the post-monsoon season (October to December), and intermediate values of 4.0±0.6 mm d−1 during the monsoon season (July to September). There was a ∼ 5-month lag between the maximum net radiation (June) and maximum lake evaporation (November). These results indicate that the seasonal pattern of lake evaporation from Paiku Co was significantly affected by the large lake heat storage. Contrasting hydrological and thermal intensities may play an important role in the large amplitude of seasonal lake-level variations at deep lakes like Paiku Co. High inflow from monsoon precipitation and glacier melting and moderate lake evaporation, for instance, drove rapid lake-level increase during the monsoon season. In contrast, high lake evaporation and reduced inflow caused lake level to decrease significantly during the post-monsoon season. This study implies that lake evaporation may play an important role in the different amplitudes of seasonal lake-level variations on the TP.
- Article
(6763 KB) - Full-text XML
-
Supplement
(522 KB) - BibTeX
- EndNote


The Tibetan Plateau (TP) hosts the greatest concentration of high-altitude inland lakes in the world. More than 1200 lakes (>1 km2) are distributed on the TP, with a total lake area of more than 45 000 km2 in the 2010s (Ma et al., 2011; G. Zhang et al., 2014a). During the past few decades, lakes on the TP have experienced significant changes in response to climate warming, increased precipitation, glacier mass loss, and permafrost thawing (Song et al., 2014; Lei and Yang, 2017). Most lakes on the interior TP have expanded dramatically since the late 1990s, in contrast with lake contraction on the southern TP (Lei et al., 2014). For most lakes across the TP, water temperature has also increased (G. Zhang et al., 2014b; Su et al., 2019), while lake ice duration has shortened considerably at the same time in response to rapid climate warming since the 1970s (Ke et al., 2013; Cai et al., 2017).
Compared to numerous studies of inter-annual to decadal lake changes, seasonal lake-level changes and the associated hydrological processes on the TP are less understood (Song et al., 2014). Phan et al. (2012) showed that seasonal lake-level variations on the southern TP were much larger than those on the northern and western TP. In situ observations gave additional details of seasonal lake-level variations, showing that large lakes usually exhibited considerably greater seasonal lake-level variations relative to small lakes (Lei et al., 2017). For example, lake levels at Zhari Namco and Nam Co, two large and deep lakes on the central TP (Wang et al., 2009, 2010), increased significantly by 0.3–0.6 m during the summer monsoon season and decreased by a similar amount during the post-monsoon season. Two nearby relatively small and shallow lakes, Dawa Co and Bam Co, exhibited considerably less lake-level variability despite showing a similar seasonal cycle (Lei et al., 2017). What caused these lake systems to experience different amplitudes of seasonal lake-level variations remains unstudied. Understanding how large and small lakes respond differently to similar forcing mechanisms is critical for understanding how continued warming will impact water storage on the TP. This work additionally may provide insight into discrepancies in lake-level reconstructions from large and small lakes on the TP that are used to reconstruct and understand long-term relationships between climate and water storage.
Evaporation from hydrologically closed lakes is one of the largest components of the lake water budget (Li et al., 2001; Morrill, 2004; Xu et al., 2009; Yu et al., 2011). Both the eddy covariance system and energy budget method are effective ways to determine lake evaporation (Blanken et al., 2000; Winter et al., 2003; Rouse et al., 2003, 2008; Lenters et al., 2005; Rosenberry et al., 2007; Giannoiu and Antonopoulos, 2007; Zhang and Liu, 2014; Sugita, 2019; Sugita et al., 2014, 2020). On the TP, several studies have used an eddy covariance system to estimate lake evaporation, e.g., Nogring Lake (Li et al., 2015), Qinghai Lake (Li et al., 2016), Nam Co (B. Wang et al., 2017, 2019), and Siling Co (Guo et al., 2016). Their results show that the seasonal pattern of lake evaporation is significantly affected by lake heat storage, especially for deep lakes. At Nam Co, for example, Haginoya et al. (2009) found that the sensible and latent heat fluxes were small during the spring and early summer and increased considerably during the autumn and early winter due to the large heat storage. However, lake evaporation during the late autumn and early winter is not typically investigated through an eddy covariance system because it is difficult to maintain the measurement platform due to the influence of lake ice. Likewise, energy budget studies that investigate changes in lake heat storage and its effects on lake evaporation have been limited on the TP. Although the energy budget method needs significant personnel commitment for fieldwork, it is more suitable for accurate, long-term monitoring of lake evaporation (Winter et al., 2003).
To fully understand the process that affects the lake water budget on the TP, we conducted comprehensive in situ observations at Paiku Co, a deep alpine lake on the southern TP since 2013. In this study, lake evaporation from Paiku Co during the ice-free period is estimated through the energy budget (Bowen ratio) method, and its effects on seasonal lake-level variations are investigated. We first show the thermal regime and changes in lake heat storage based on 3 years' water temperature profile data (2015–2018), then investigate energy budget and latent and sensible heat fluxes over the lake surface, and finally analyze the seasonal pattern of lake evaporation and its impact on seasonal lake-level variations. Meanwhile, the effects of lake evaporation on the different amplitude of seasonal lake-level changes between deep and shallow lakes and between the southern and northern TP are also discussed.
2.1 Site description
Paiku Co (85∘35.12′ E, 28∘53.52′ N; 4590 ) is a hydrologically closed lake on the southern TP, with a surface area of 280 km2, watershed area of 2376 km2, and salinity of 1.7 g L−1. A bathymetry survey showed that the lake has a mean water depth of 41.1 m, with a maximum water depth of 72.8 m (Lei et al., 2018). Glaciers are widely developed to the south of the lake, with a total area of ∼123 km2. Dozens of paleo-shorelines are visible around Paiku Co. The highest paleo-shoreline is ∼80 m above the modern lake level. Wünnemann et al. (2015) found that there has been a close relationship between glacier dynamics and lake-level changes since the Last Glacial Maximum (LGM). The lake has been shrinking since the 1970s (Nie et al., 2013; Dai et al., 2013). Between 1972 and 2015, lake level at Paiku Co decreased by 3.7±0.3 m, and water storage reduced by 8.5 % (Lei et al., 2018). According to rain gauge data collected between 2013 and 2016, annual rainfall in Paiku Co basin fluctuated significantly year to year. Typical annual precipitation varied between 150–200 mm, indicating that the lake basin belongs to the dry belt in the northern slope of the Himalaya mountains (Y. Wang et al., 2019). The mean annual temperature was 4.4 ∘C between June 2015 and May 2016 (Lei et al., 2018).
2.2 Data acquisition
In situ observations including lake water temperature, hydrometeorology, lake level, and runoff were carried out in the Paiku Co basin. HOBO water temperature loggers (U22-001, Onset Corp., USA) were used to monitor water temperature with an accuracy of ±0.2 ∘C. Two water temperature profiles were monitored in Paiku Co's southern (0–42 m in depth) and northern (0–72 m in depth) basins (Fig. 1). In the southern basin, water temperature was monitored at depths of 0.4, 5, 10, 15, 20, 30, and 40 m. In the northern basin, water temperature was monitored at depths of 0.4, 10, 20, 40, 50, 60, and 70 m. Since lake level fluctuates seasonally, the depth of water temperature loggers may also have fluctuated in a range of 0–0.5 m. Water temperatures were recorded at an interval of 1 h, and daily values were used to investigate lake thermal structure and changes in lake heat storage. Three years' observational data were acquired from June 2015 to May 2018 from the southern basin, while only 1 year of data (June 2016 and May 2017) was acquired from the northern basin.
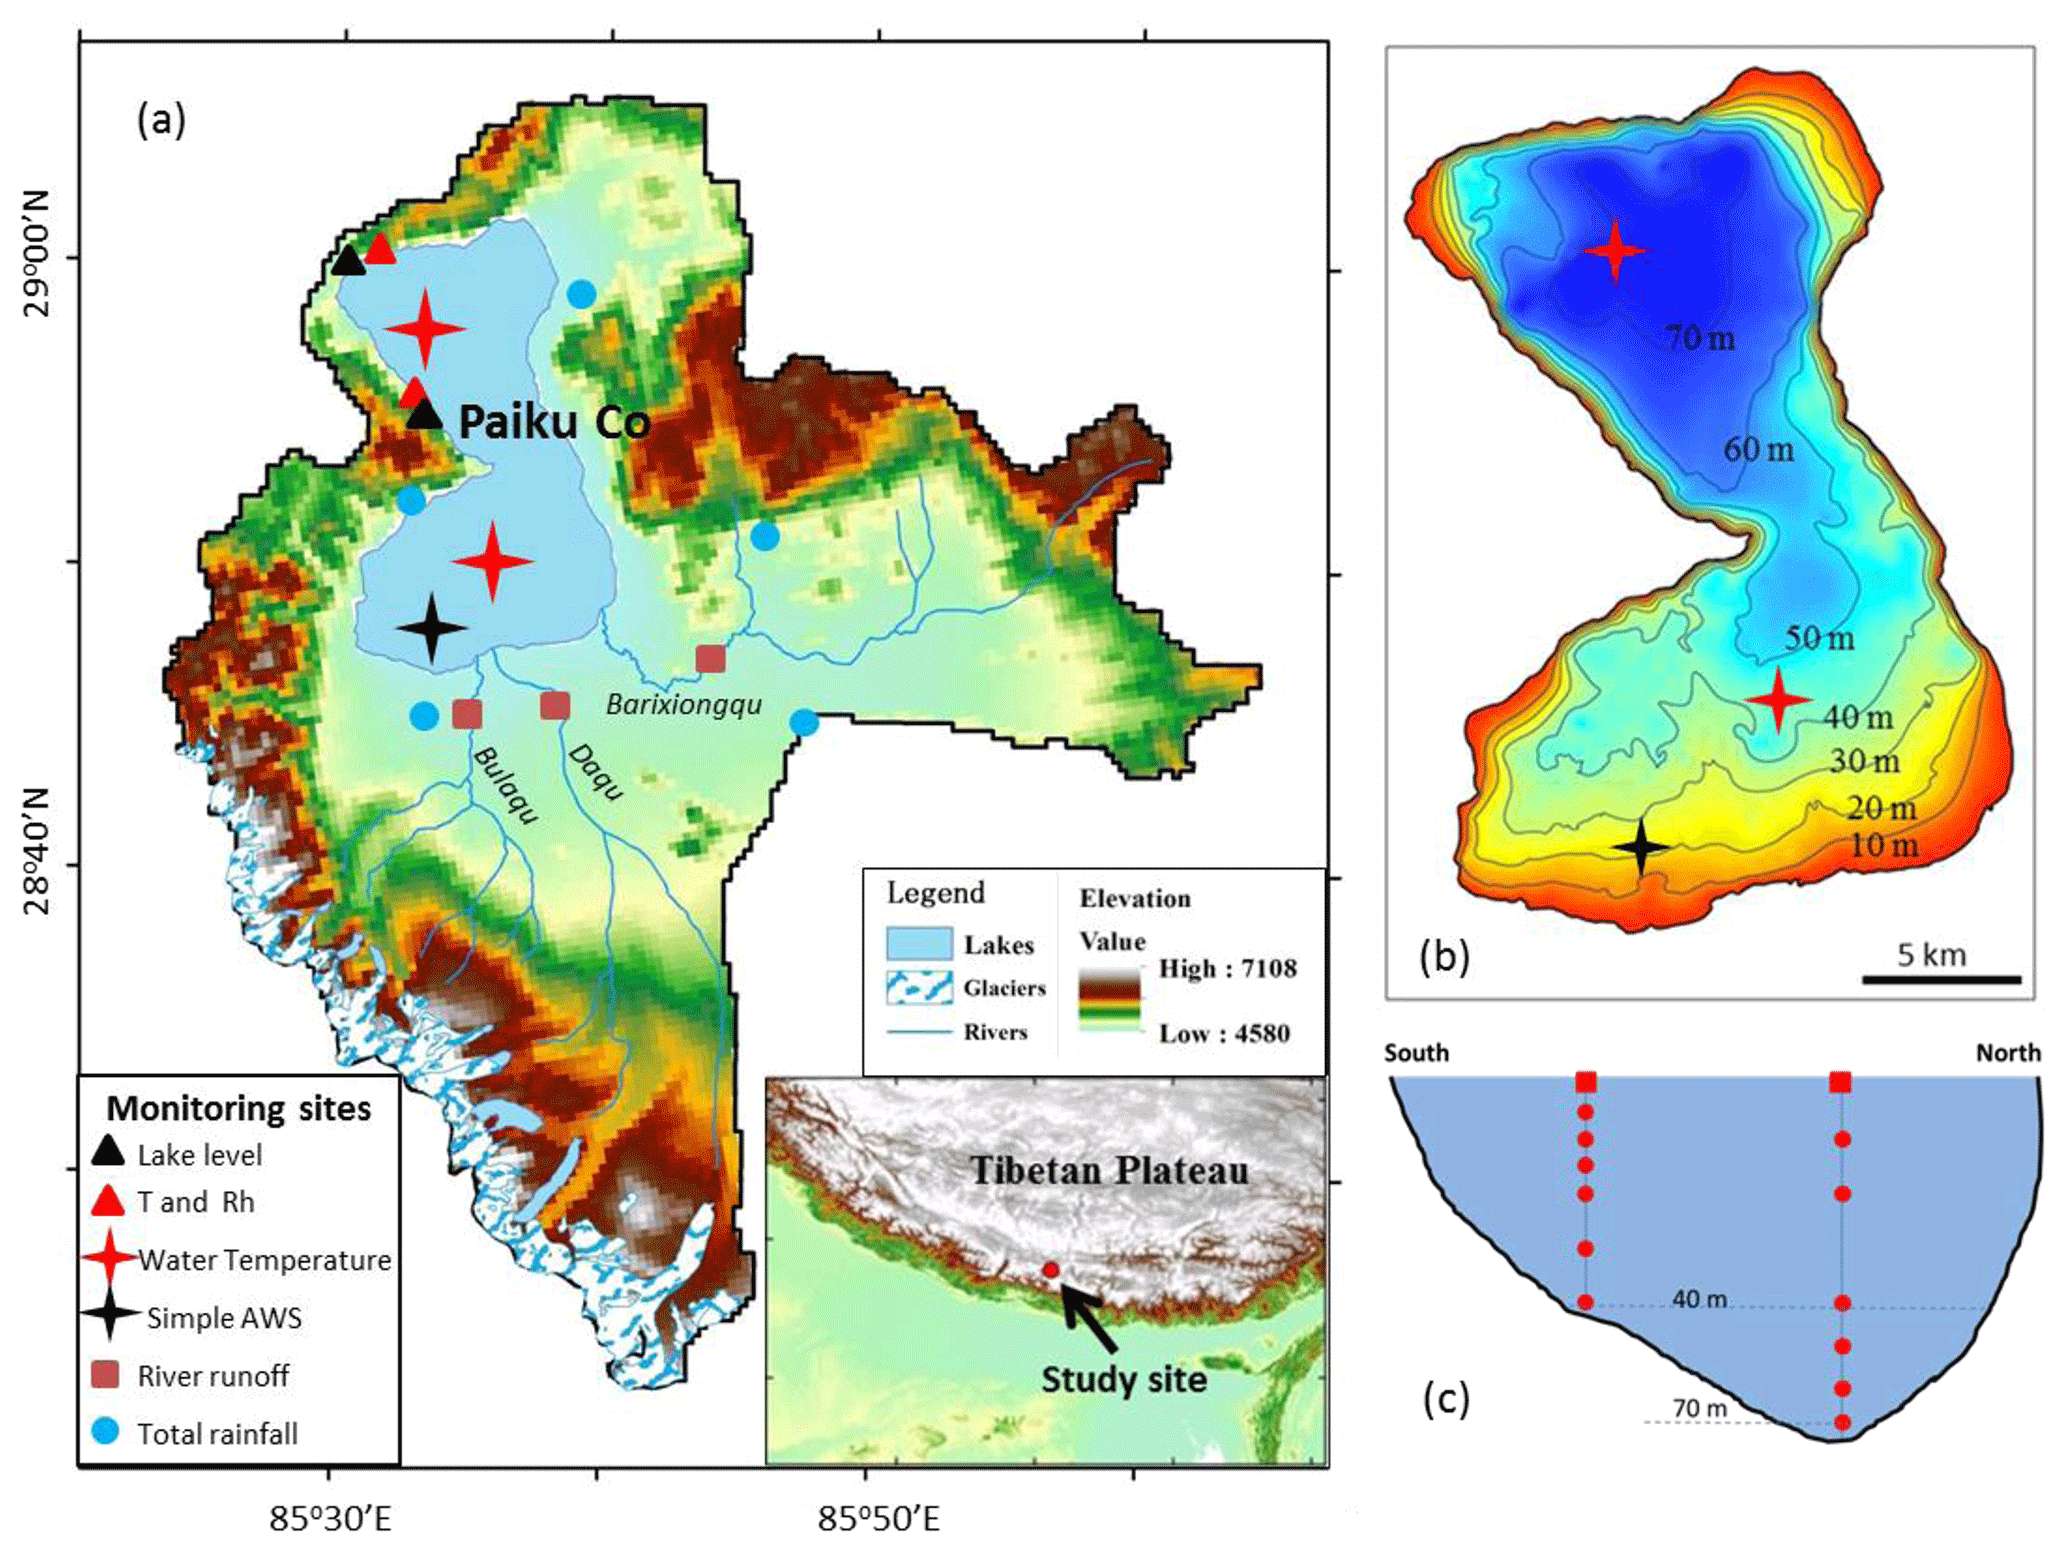
Figure 1Monitoring sites of the lake water budget in Paiku Co basin. (a) Monitoring sites of lake level, hydrometeorology, water temperature profile, runoff, and total rainfall. (b) The isobath of Paiku Co and the two monitoring sites of water temperature profile. (c) The water- temperature monitoring at different water depths.
Air temperature and relative humidity above the shoreline have been monitored since June 2015 using HOBO air-temperature and humidity loggers (U12-012, Onset Corp., USA). The instrument has an accuracy of 0.35 ∘C for air temperature and 2.5 % for relative humidity. Two loggers were installed in an outcrop ∼2 m above the lake surface. One is located in the north shoreline, and the other is located in the central shoreline (Fig. 1). The instruments were under a large rock where there was a hole facing the lake. The monitoring site was ventilated, and therefore the meteorological condition over the lake surface could be recorded (Fig. S1 in the Supplement). Air temperature and relative humidity were recorded at an interval of 1 h, and daily values were used to calculate the Bowen ratio. The related information about hydrometeorology observations in Paiku Co basin is listed in Table 1. There were no data available between February and May 2017 because the instrument battery was too low. The air temperature and humidity measurements in the shoreline were further validated by a simple automatic weather station (AWS) in Paiku Co's southern center (Sect. 3.6).
Table 1The related information about hydrometeorology observations.
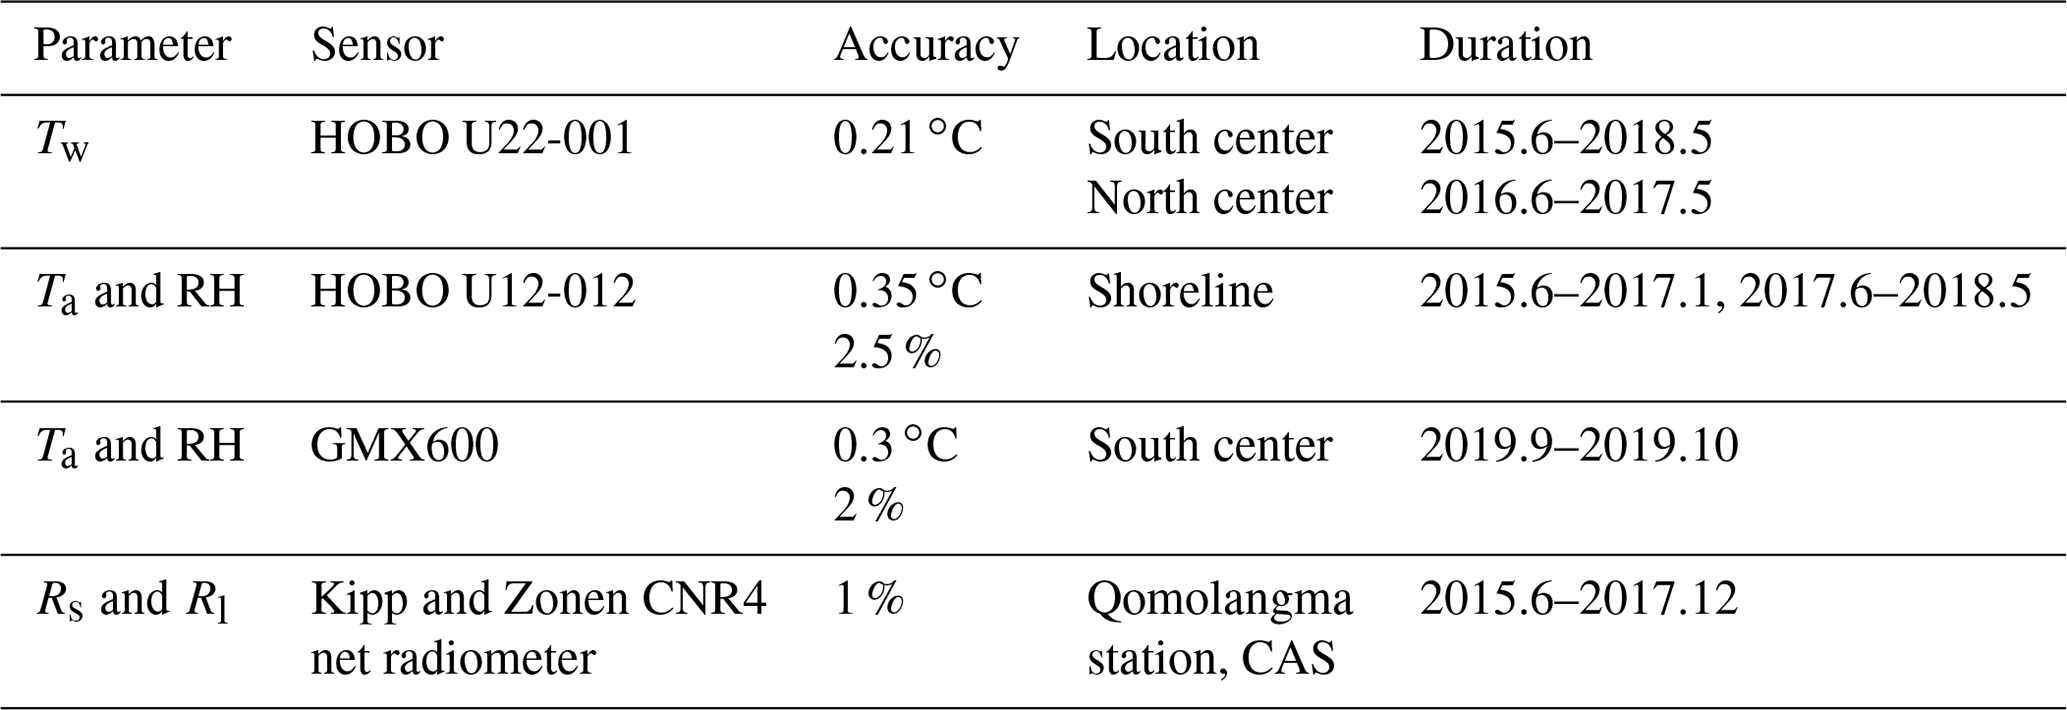
Tw is water temperature; Ta is air temperature; RH is relative humidity; Rs is shortwave solar radiation; Rl is downward longwave radiation.
Radiation, including solar radiation and downward longwave radiation to the lake, was measured at Qomolangma station for Atmospheric Environmental Observation and Research, Chinese Academy of Sciences (CAS). This station (87∘1.22′ E, 28∘25.23′ N; 4276 ) is located at the northern slope of Mount Everest, about 150 km east of Paiku Co. The 2 m air temperature, relative humidity, wind speed, and radiation were recorded at an interval of 10 min. In this study, daily solar radiation and downward longwave radiation at this station were used to calculate net radiation over the lake surface. The climate conditions between Paiku Co and Qomolangma station were similar, including topography, altitude, and precipitation.
As an important part of the lake water budget, runoff was measured at three main rivers, i.e., Daqu, Bulaqu, and Barixiongqu (Fig. 1). The water level of the three rivers was recorded at an interval of 1 h using HOBO water-level loggers (U20-001-01). Runoff during the pre-monsoon and post-monsoon seasons was measured at least twice a day, including the largest runoff in the afternoon and lowest runoff in the morning during field expeditions, using a LS1206B propeller-driven current meter (Nanjing Institute of Hydrological Automatization). Meanwhile, lake level was recorded at an interval of 1 h in the littoral zone of north Paiku Co (Lei et al., 2018). Daily water levels of Paiku Co and its rivers were used for comparison with the seasonal pattern of lake evaporation.
2.3 Energy-budget-derived lake evaporation
Lake evaporation was calculated using the energy budget (Bowen ratio) method, which has been described by Winter et al. (2003). The energy budget of a lake can be mathematically expressed as
where Rnet is the net radiation over the lake, H is the sensible heat flux from the lake surface, lE is the latent heat utilized for evaporation, S is the change in lake heat storage, G is the heat transfer between lake water and bottom sediment, and Av is the energy advected into lake water. The units used for the terms of Eq. (1) are watts per square meter (W m−2).
The energy advection into the lake (Av) can be roughly estimated according to total river discharge and the water temperature difference between river and lake. Lake water temperature was similar to that of the river between April and June but 2–6 ∘C higher between July and December (Fig. S3 in the Supplement). As a deep lake, total river discharge to Paiku Co was about 800–1000 mm water equivalent to lake level, accounting for 2 %–2.5 % of total lake storage. The river discharge can accumulatively decrease lake water temperature by ∼0.1 ∘C in summer, which corresponds to 2.1 W m−2 of heat flux between July and September and 0.07 mm d−1 of lake evaporation. Therefore, we do not consider the impact of river discharge and precipitation on the energy budget at Paiku Co because of its relatively small contribution to it.
Although it is still challenging to accurately quantify groundwater inflow, lake-level variations during the ice-covered season can give us some evidence because both lake water input (snowfall and runoff) and output (sublimation) are very limited. According to in situ lake-level observations, we found that there was no significant lake-level variation during the ice-covered season. Taking 2013/14 as an example, the lake level decreased slightly at a rate of 13 mm per month between mid-January and mid-April when the lake surface froze up (Lei et al., 2018). Lake ice sublimation is estimated to be ∼40 mm per month on average according to the results at Nam Co (Wang et al., 2019). Based on the lake water budget, we can conclude that groundwater inflow should be less than the rate of lake ice sublimation, which has a very limited impact on the energy budget of Paiku Co. Therefore, we do not consider the heat transfer between lake water and bottom sediment (G) during the estimation of the energy budget at Paiku Co.
The net radiation over the lake (Rnet) can be expressed as the following:
where Rs is solar radiation, Rsr is the reflection of solar radiation from the lake surface, which is taken as 0.07 Rs (Gianniou and Antonopouls, 2007), Rl is downward atmospheric longwave radiation to lake, Rlr is the reflected longwave radiation from the lake surface, which is taken as 0.03 Rl, and Rw is the upward longwave radiation from the lake. The units of the items in Eq. (2) are watts per square meter (W m−2).
The upward longwave radiation from the lake (Rw) is approached by the following equation:
where σ is the Stefan–Boltzmann constant (i.e., ), εa is the water emissivity (0.97 for water surface), and Tw is the lake surface temperature (∘C). In this study, the water temperature at the depth of 0.4 m was used to represent the lake surface temperature. Note that the bulk temperature is slightly different from the “skin” temperature (Wilson et al., 2013; Prats et al., 2018; Sugita et al., 2020). There is surface warming during the day and surface cooling at night for high-elevation lakes. However, the daily difference between them is small during most of the year because surface water can be mixed quickly by water convection or strong wind in the afternoon, and the two uncertainties by surface warming and cooling can cancel each other on a daily scale.
The sensible heat flux is related to the evaporative heat flux through the Bowen ratio (Henderson-Sellers, 1984):
where β is the Bowen ratio, Tw is the lake surface temperature (∘C), Ta is the air temperature (∘C) at 2 m high above the water surface, esw and ed are the saturated vapor pressure (kPa) at the lake surface and the air vapor pressure (kPa) above the lake surface, respectively, P is air pressure (kPa), and γ is the psychrometric constant, . Air temperature, air pressure, and relative humidity were monitored at the lake's shoreline. Saturated vapor pressure at the lake surface was calculated according to the lake water temperature at the depth of 0.4 m in the lake center. The daily Bowen ratio is calculated in this study.
Changes in lake heat storage (S) were calculated according to the detailed lake bathymetry and water temperature profile:
where cw is the specific heat of water (), ρw is the water density (i.e., 1000 kg m−3), ΔVi is the lake volume at certain depth (m3), ΔTi is the water temperature change at the same depth, and Al is lake area (m2). Changes in lake heat storage were calculated at an interval of 5 m, and therefore there are 15 layers in the vertical direction (maximum depth: 72.8 m). ΔVi was acquired according to the 5 m isobath of Paiku Co (Lei et al., 2018). ΔTi was calculated at a 5 m interval as the average temperature of the top and bottom layer. Changes in lake heat storage for the bottom water (>40 m) were calculated according to the data in 2016/17 since there are no data available in the other 2 years. Lake heat storage, sensible and latent heat fluxes, and lake evaporation were calculated at a weekly interval in order to reduce their uncertainty caused by the spatial difference of solar radiation and lake water temperature.
3.1 Thermal regime
Water temperature profiles between 2015 and 2018 show that Paiku Co was thermally stratified between July and October and fully mixed between November and June in each year of the study period (Fig. 2). Lake water temperature increased rapidly from 2 to 7 ∘C between April and June due to the high solar radiation. During this warming period, water temperature between the lake surface and bottom was almost the same, indicating the lake water was well mixed. The vertical temperature gradient increased considerably in late June, and clear stratification occurred by July. The occurrence of thermal stratification corresponded to a significant reduction in wind speed between July and the middle of October (Fig. S2 in the Supplement). Strong lake surface heating and a reduction in wind speed together contributed to the development of thermal stratification (Wetzel, 2001). During the summer stratification period, the surface water warmed rapidly from 7 to ∼13 ∘C between July and August, while the bottom water warmed much more slowly. As a result, surface water reached its highest temperature by late August, while bottom water (>40 m) reached its highest temperature by middle to late October. The thermocline formed between 15 and 25 m water depth, with the largest temperature difference of 5–6 ∘C by late August.
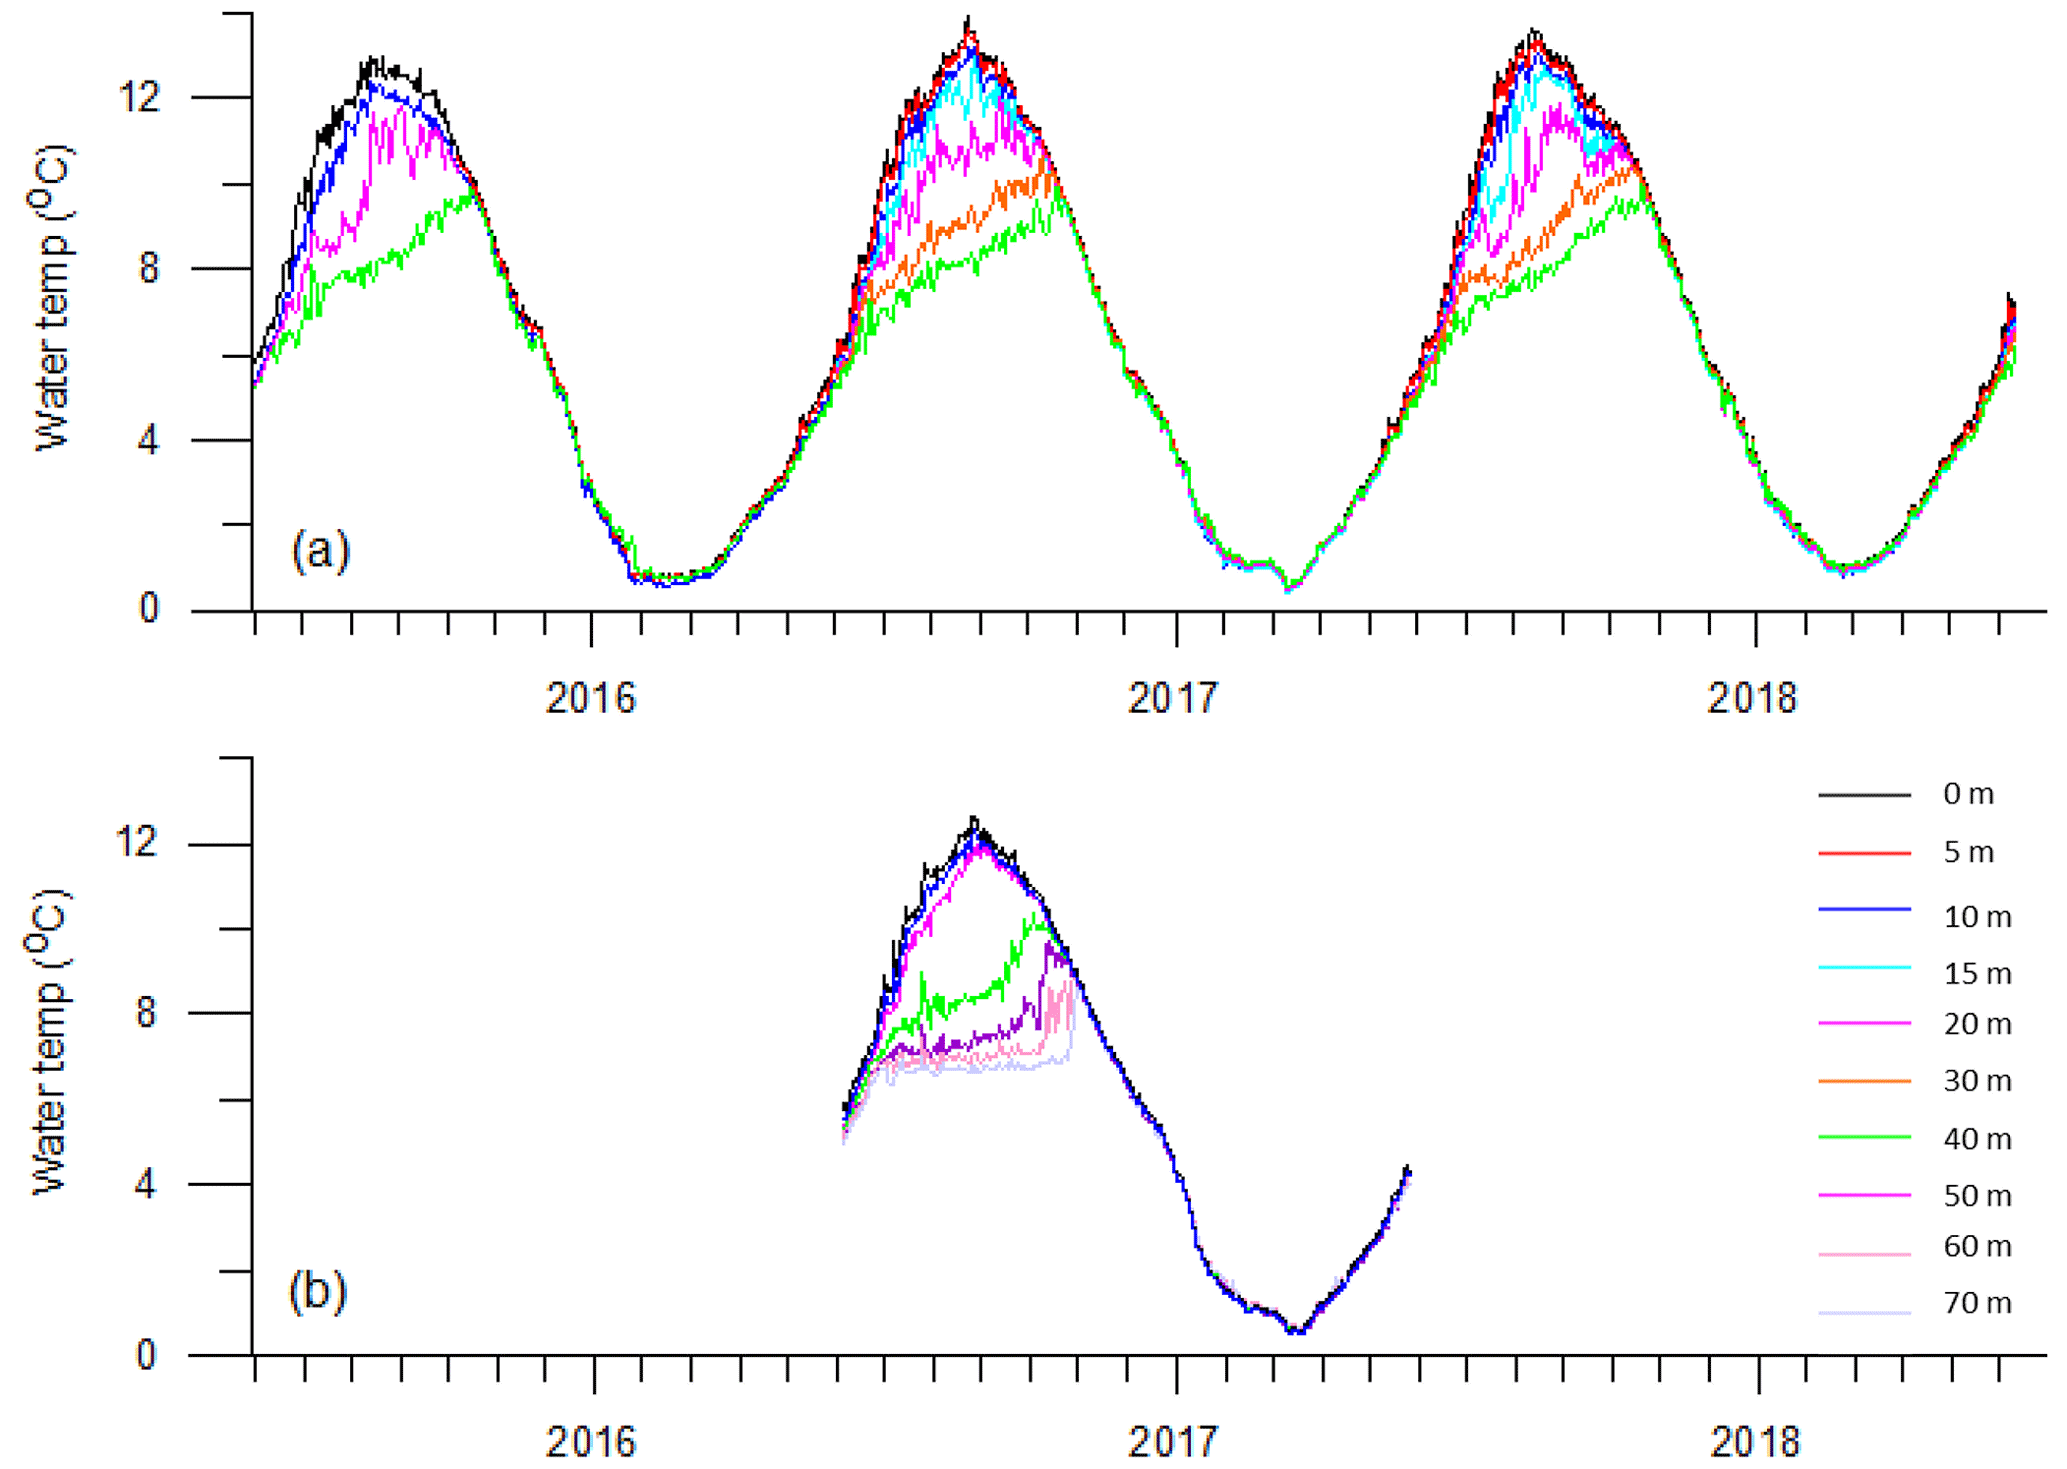
Figure 2Time series of daily lake water temperature at different water depths in Paiku Co's southern (a) and northern (b) basins.
Lake surface temperature started to decrease gradually from September, while the bottom water continued to warm slowly (Fig. 2). As a result, the vertical temperature gradient decreased gradually. The lake stratification completely broke down by late October of each year, corresponding to significantly increased wind speed during this period (Fig. S2). Notably, the breakdown of stratification occurred gradually, with the mixed layer deepening throughout October (Fig. 2). The mixed layer reached 40 m water depth on 13 October and 70 m water depth about 2 weeks later (30 October). Following the complete breakdown of the water column's stratification, the bottom water experienced rapid warming over several days due to its mixing with the warmer water from the upper layer. For example, the water temperature at 70 m water depth remained stable at ∼6.9 ∘C from July to October but increased abruptly from 6.9 to 8.6 ∘C over several days (25 to 30 October). Paiku Co's water column was fully mixed by November as indicated by the identical lake water temperature profiles at the two monitoring sites (Figs. 2 and 3). Water temperature of the whole lake decreased gradually from 8.6 to 1 ∘C from November to January and remained stable at 1–2 ∘C until March.
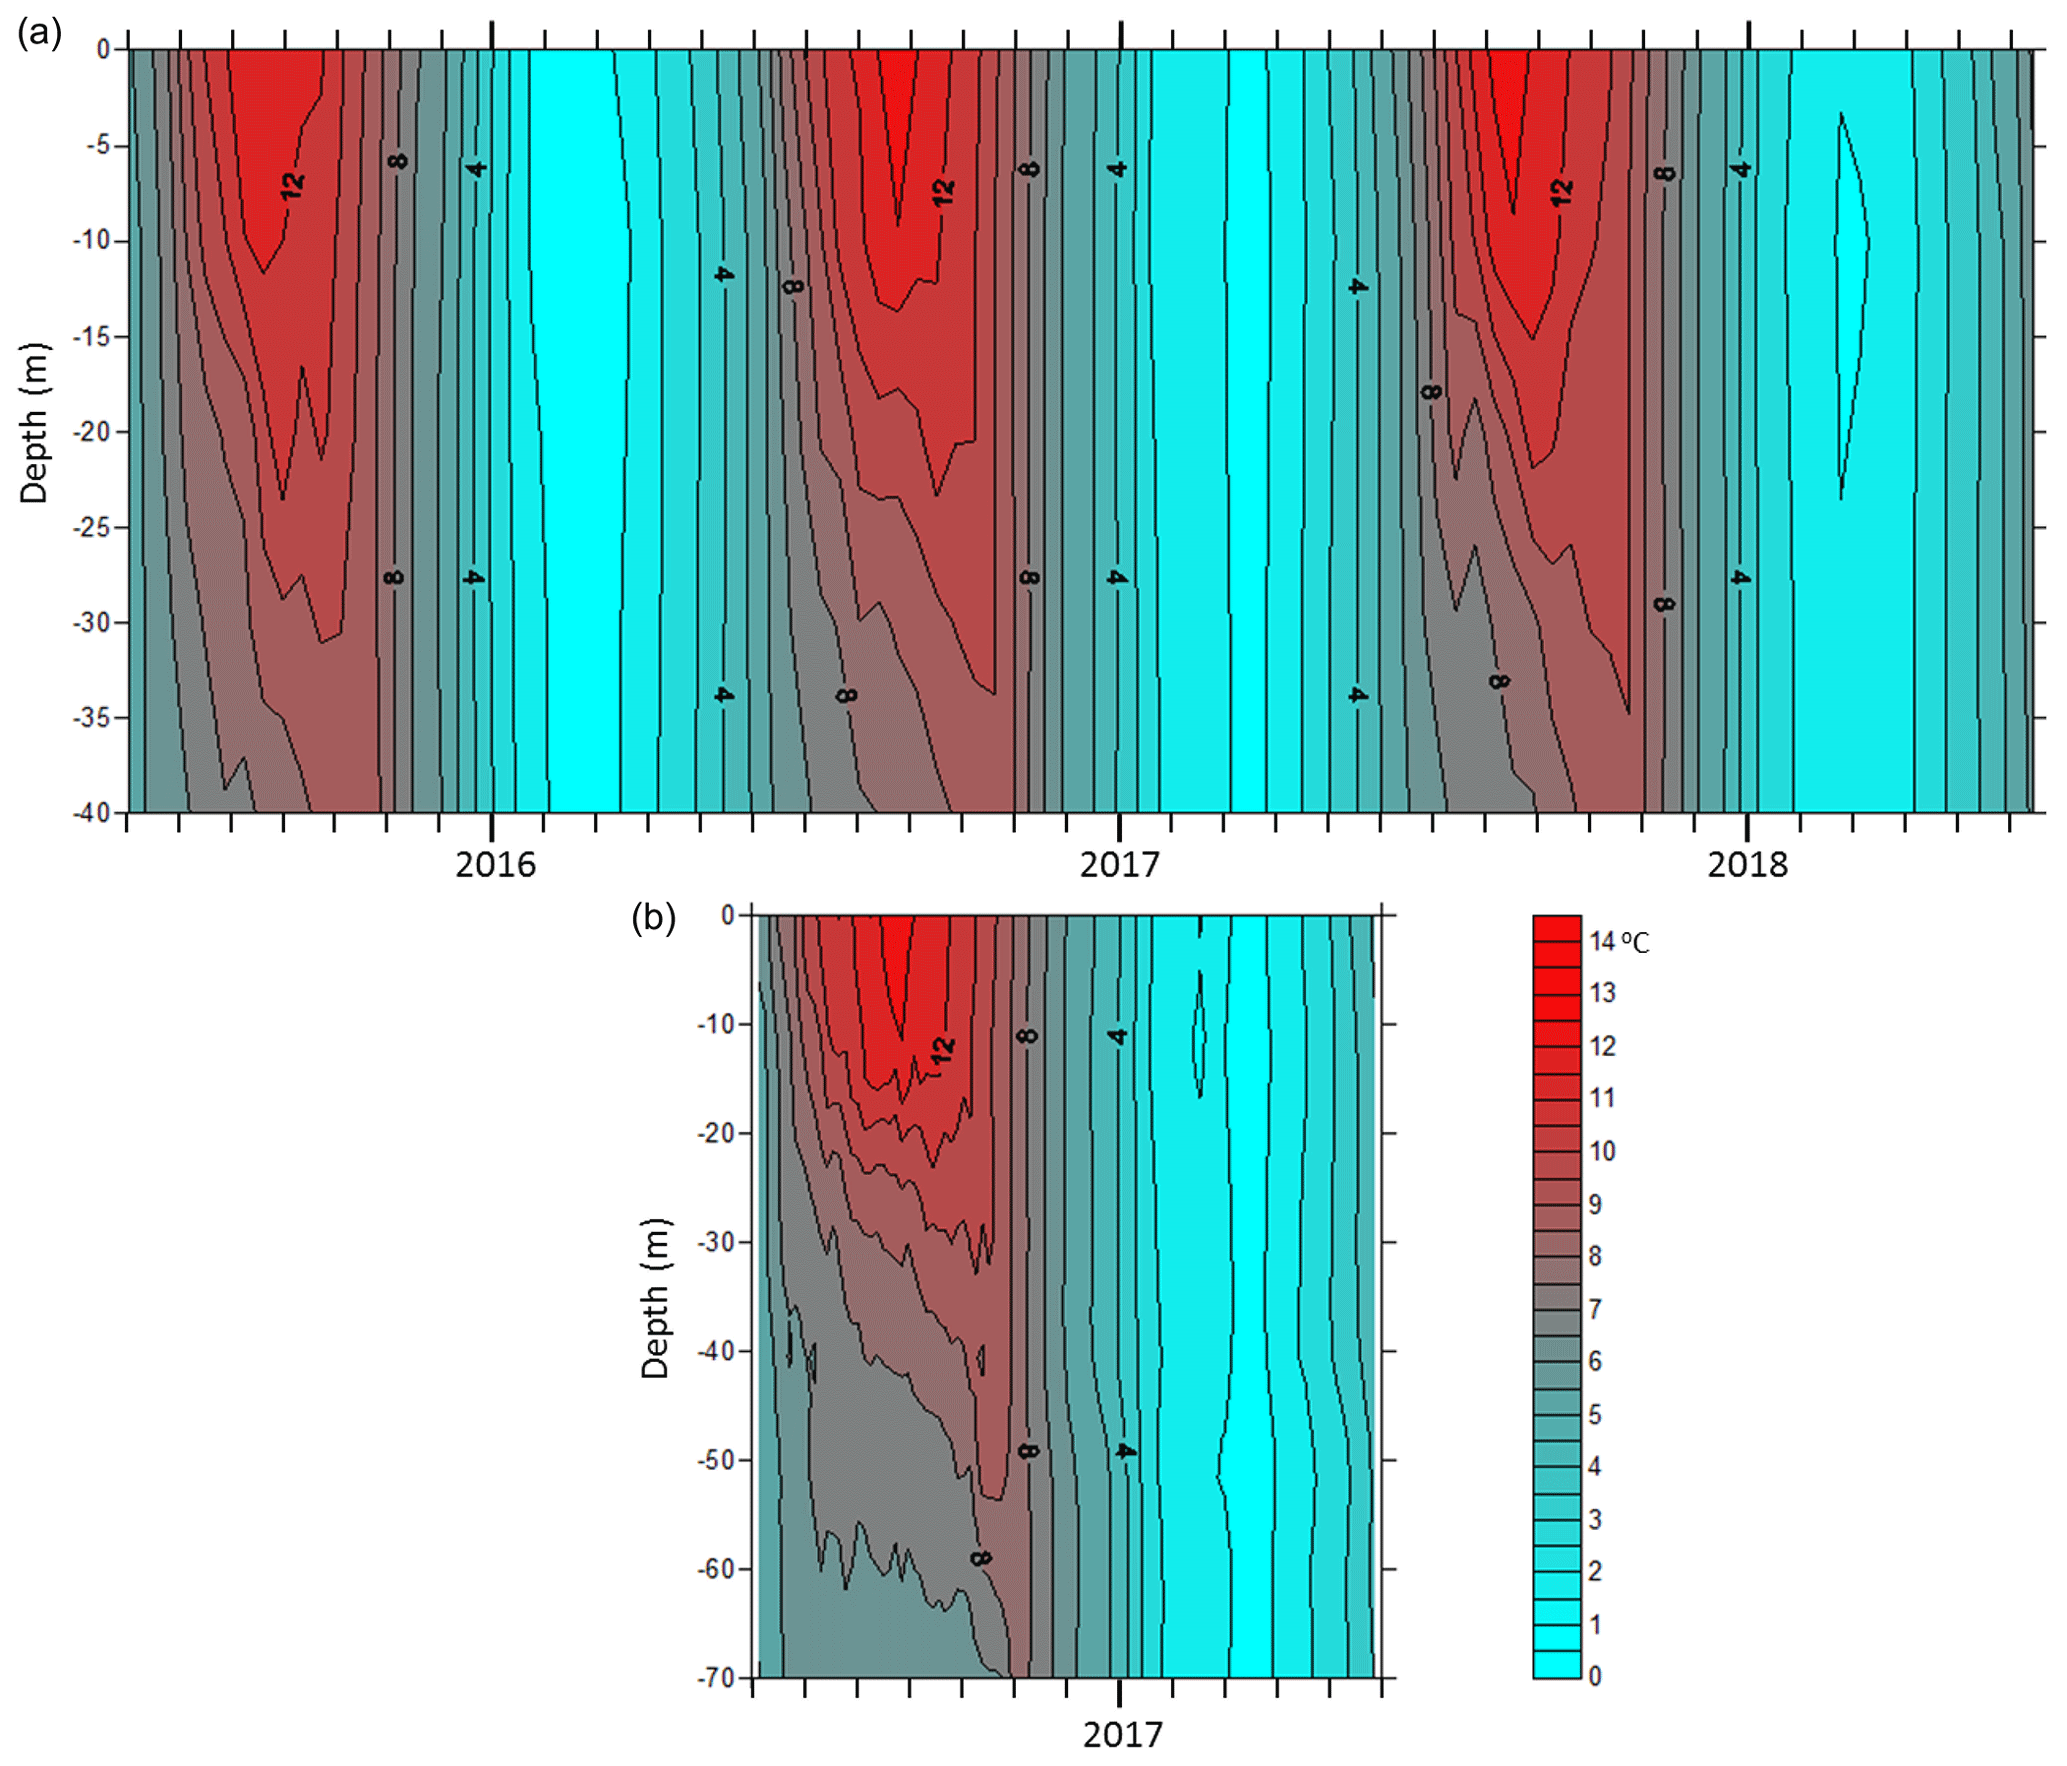
Figure 3Depth–time diagram of isotherm (∘C) in Paiku Co's southern (a, 42 m in depth) and northern (b, 72 m in depth) basins between June 2015 and May 2018.
Changes in thermal structure indicate that Paiku Co is a dimictic lake, which is similar to Bangong Co (Wang et al., 2014) and Nam Co (J. Wang et al., 2019) but different from Dagze Co (Wang et al., 2014). The vertical temperature gradients of Paiku Co and other dimictic lakes on the TP are considerably lower compared with lakes in other parts of the world, for example Lake Qiaodaohu (area: 580 km2, maximum depth: 108 m) in east China (Y. Zhang et al., 2014), Lake Zurich (area: 65 km2, maximum depth: 136 m) on the Swiss Plateau (Livingstone, 2003), and Lake Simcoe (area: 580 km2, maximum depth: >40 m) in Canada (Stainsby et al., 2011). This may be mainly related to the high elevation of Paiku Co. Due to the elevation effect, the highest air temperature near Paiku Co is only ∼12 ∘C in summer, and the highest lake surface temperature is 13 ∘C, which is considerably lower than lakes in other parts of the world (e.g., Lake Qiaodaohu: ∼32 ∘C, Lake Zurich: ∼22 ∘C, and Lake Simcoe: ∼22 ∘C), while the bottom water temperature does not show much difference (e.g., Paiku Co: 7 ∘C, Lake Qiaodaohu: ∼10 ∘C, Lake Zurich: ∼5 ∘C, and Lake Simcoe: ∼4 ∘C).
3.2 Energy budget over the lake surface
The main components of the radiation budget over the lake surface including solar radiation, atmospheric longwave radiation to the lake, and upward longwave radiation from the lake body are shown in Fig. 4a–c. Solar radiation had an annual average of 251.8 W m−2 (Fig. 4), which is slightly higher than the TP average due to its lower latitude (Yang et al., 2010). Atmospheric longwave radiation and upward longwave radiation from the lake body had an annual average of 235.8 and 336.8 W m−2, respectively. The net radiation over Paiku Co varied seasonally in a range of 19.0–212.1 W m−2, with an average value of 125.8 W m−2. Relatively high net radiation occurred between April and August, with the highest value of 212.1 W m−2 in June. Relatively low net radiation occurred between October and February, with the lowest value of 19.7 W m−2 in December.
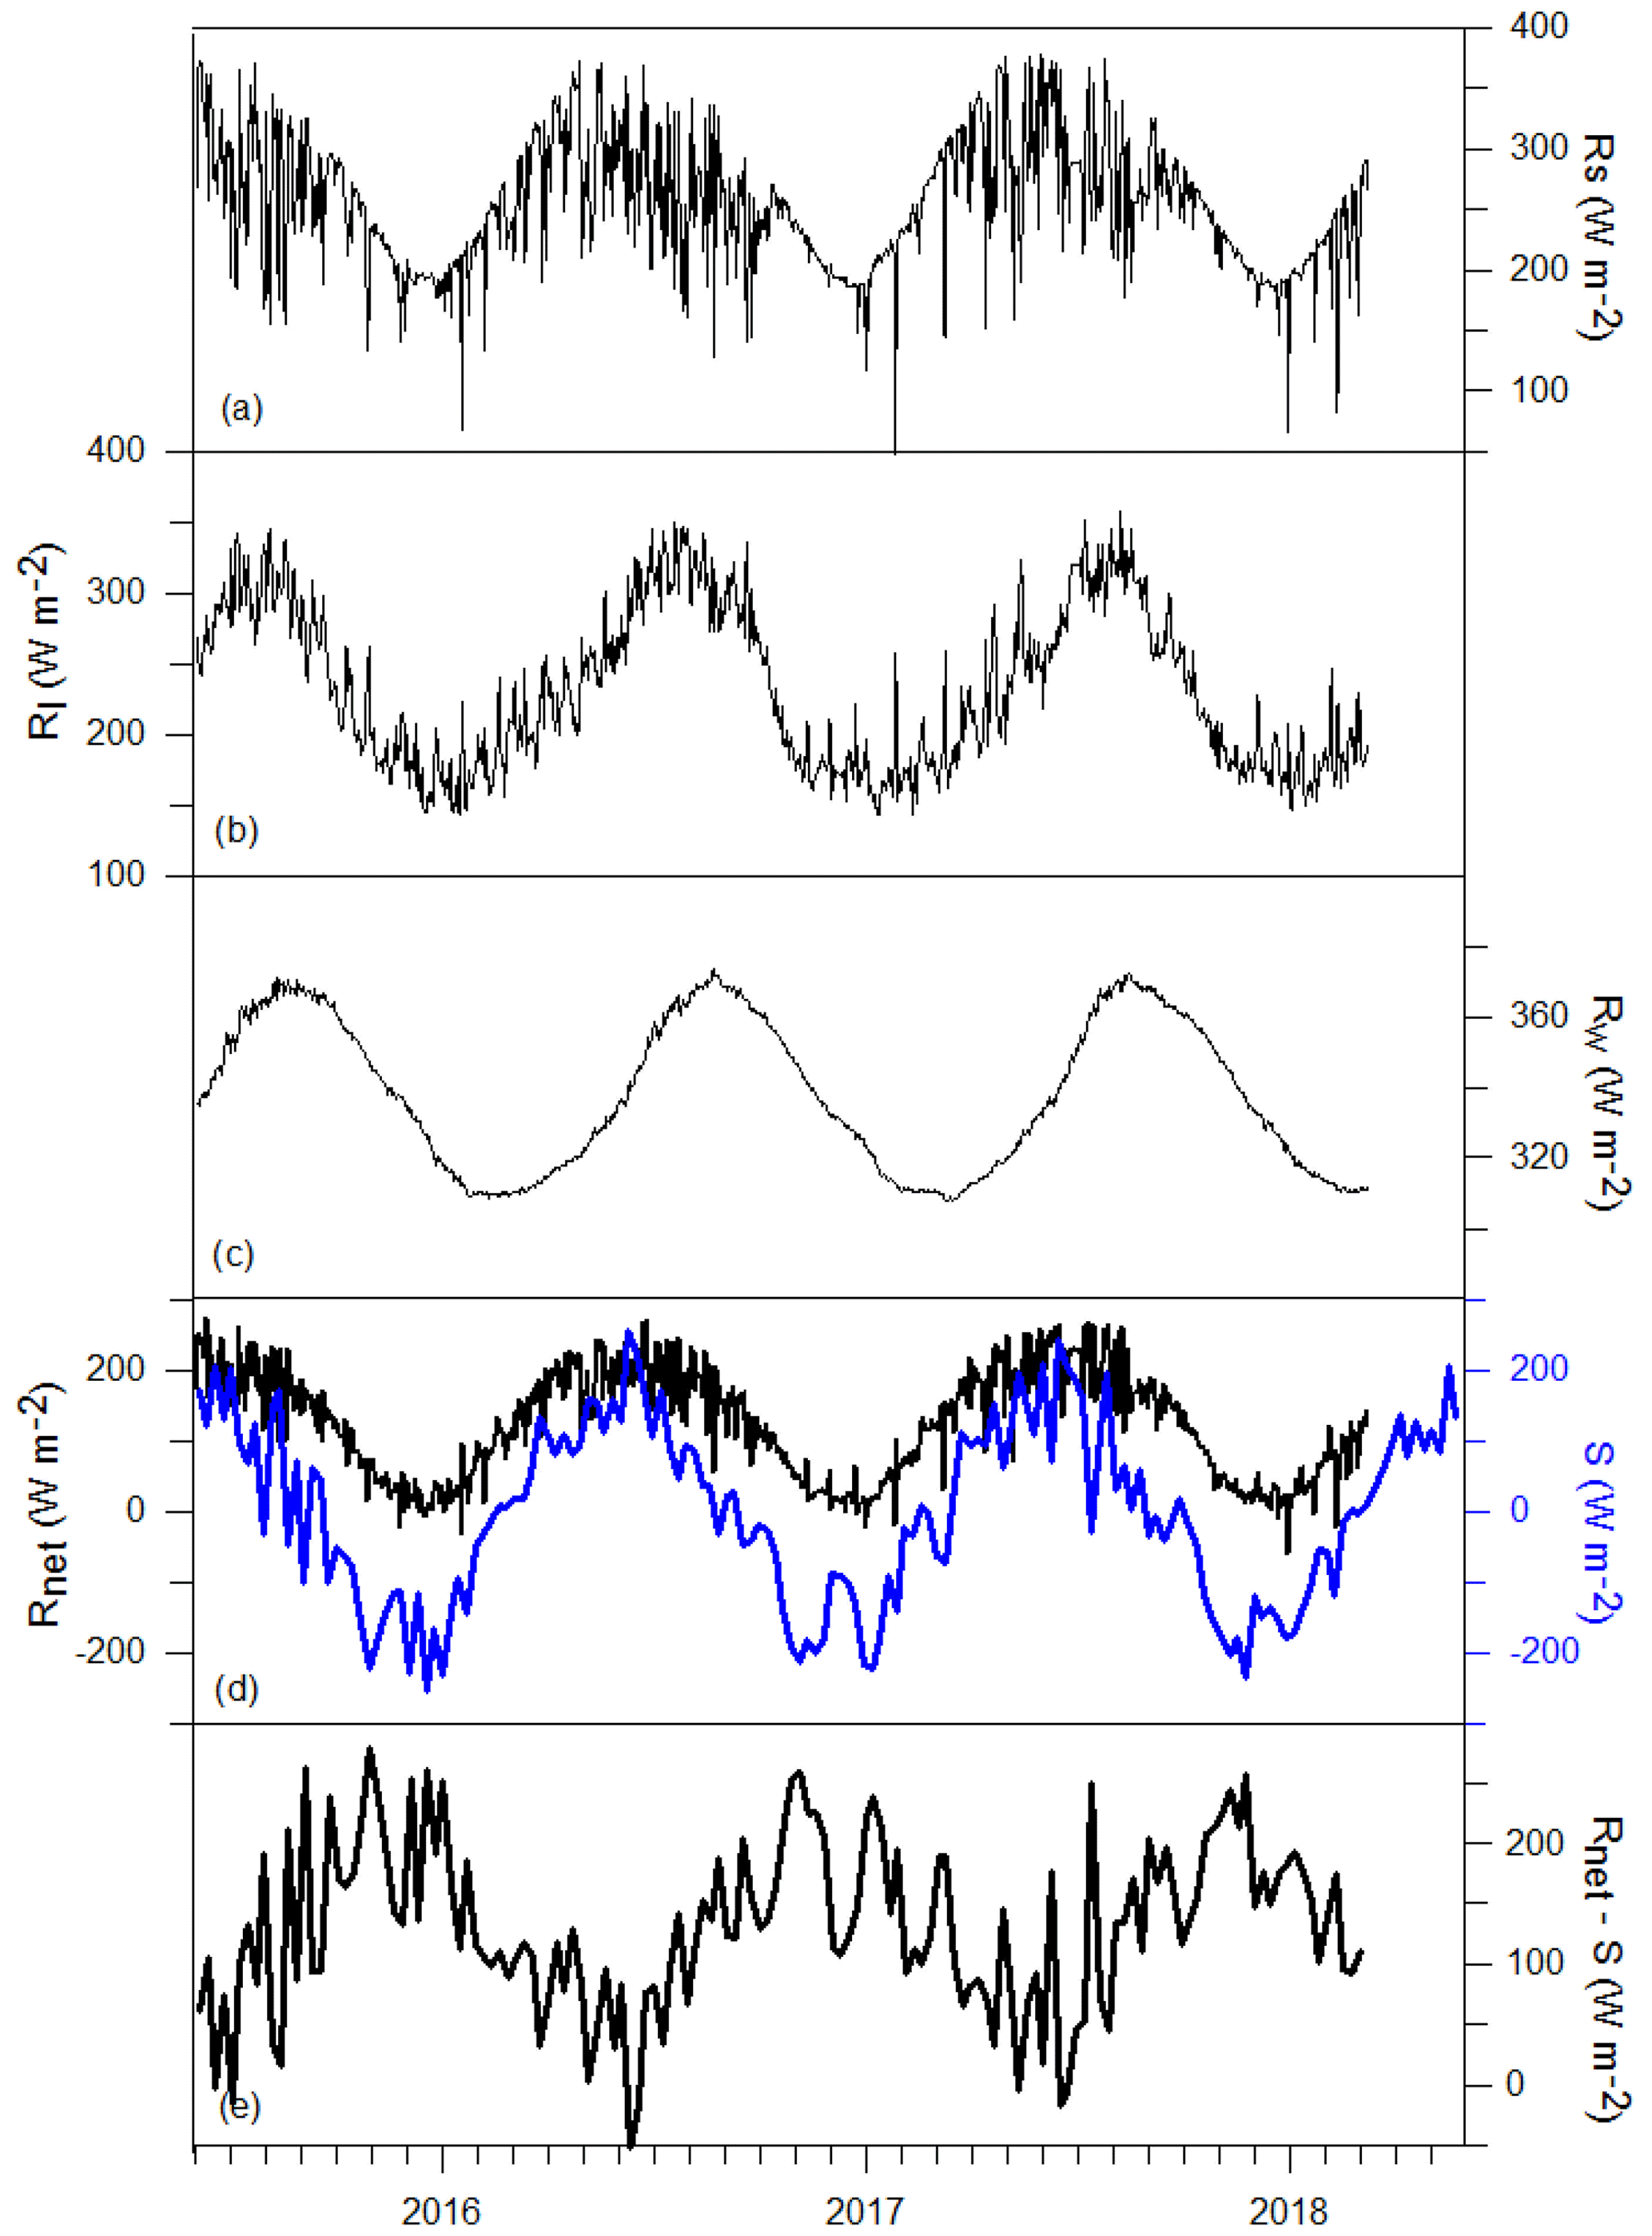
Figure 4The main components of energy budget at the lake surface. (a) Daily solar radiation (Rs), (b) daily atmospheric longwave radiation to the lake (Rl), (c) daily longwave radiation emitted from the lake (Rw), (d) daily net radiation (Rnet) and weekly changes in lake heat storage (S), and (e) the available energy (Rnet−S).
Changes in heat storage at Paiku Co were quantified using in situ observations of water temperature profiles and detailed lake bathymetry (Fig. 4d), which makes it possible to evaluate the impact of lake heat storage on the heat flux over the lake surface. Between April and July, when Paiku Co warmed gradually, the lake water absorbed energy at an average rate of 128.6 W m−2, accounting for 66.5 % of the net radiation during the same period. The lake heat storage increased most rapidly in June, with an average rate of 191.6 W m−2, accounting for 91.6 % of the net radiation during the same period. The lake heat storage reached its peak by late August, when the surface water temperature was highest. Between October and January, when the lake water cooled, the lake released energy to the overlying atmosphere at an average rate of 137.5 W m−2, which was more than 3 times greater than the net radiation during the same period. The lake heat storage decreased most rapidly in November at an average rate of 193.6 W m−2, which was about 5 times greater than the net radiation during the same period (Table 2).
Table 2Monthly net radiation, total lake heat storage, Bowen ratio, and lake evaporation between 2015 and 2017.
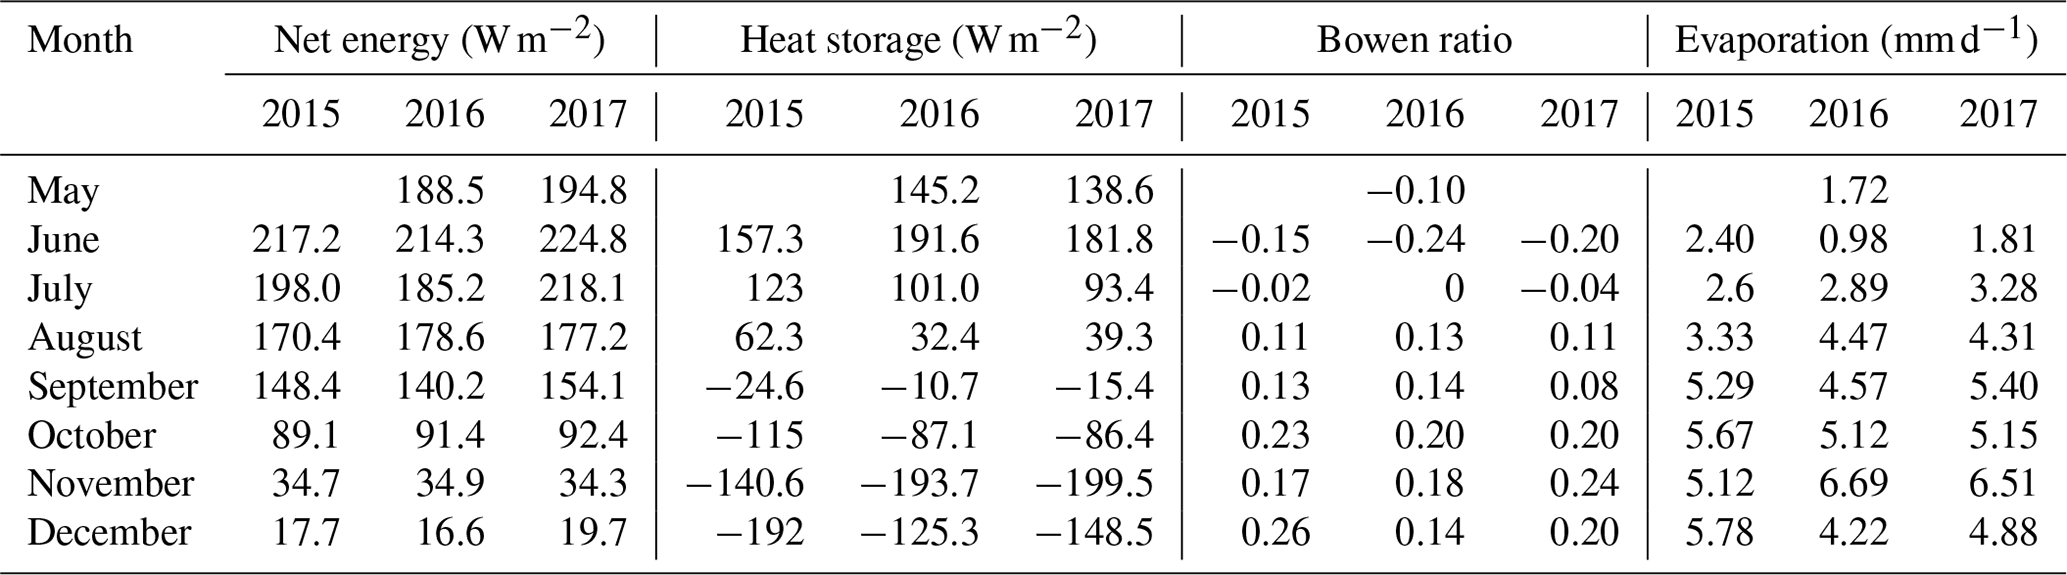
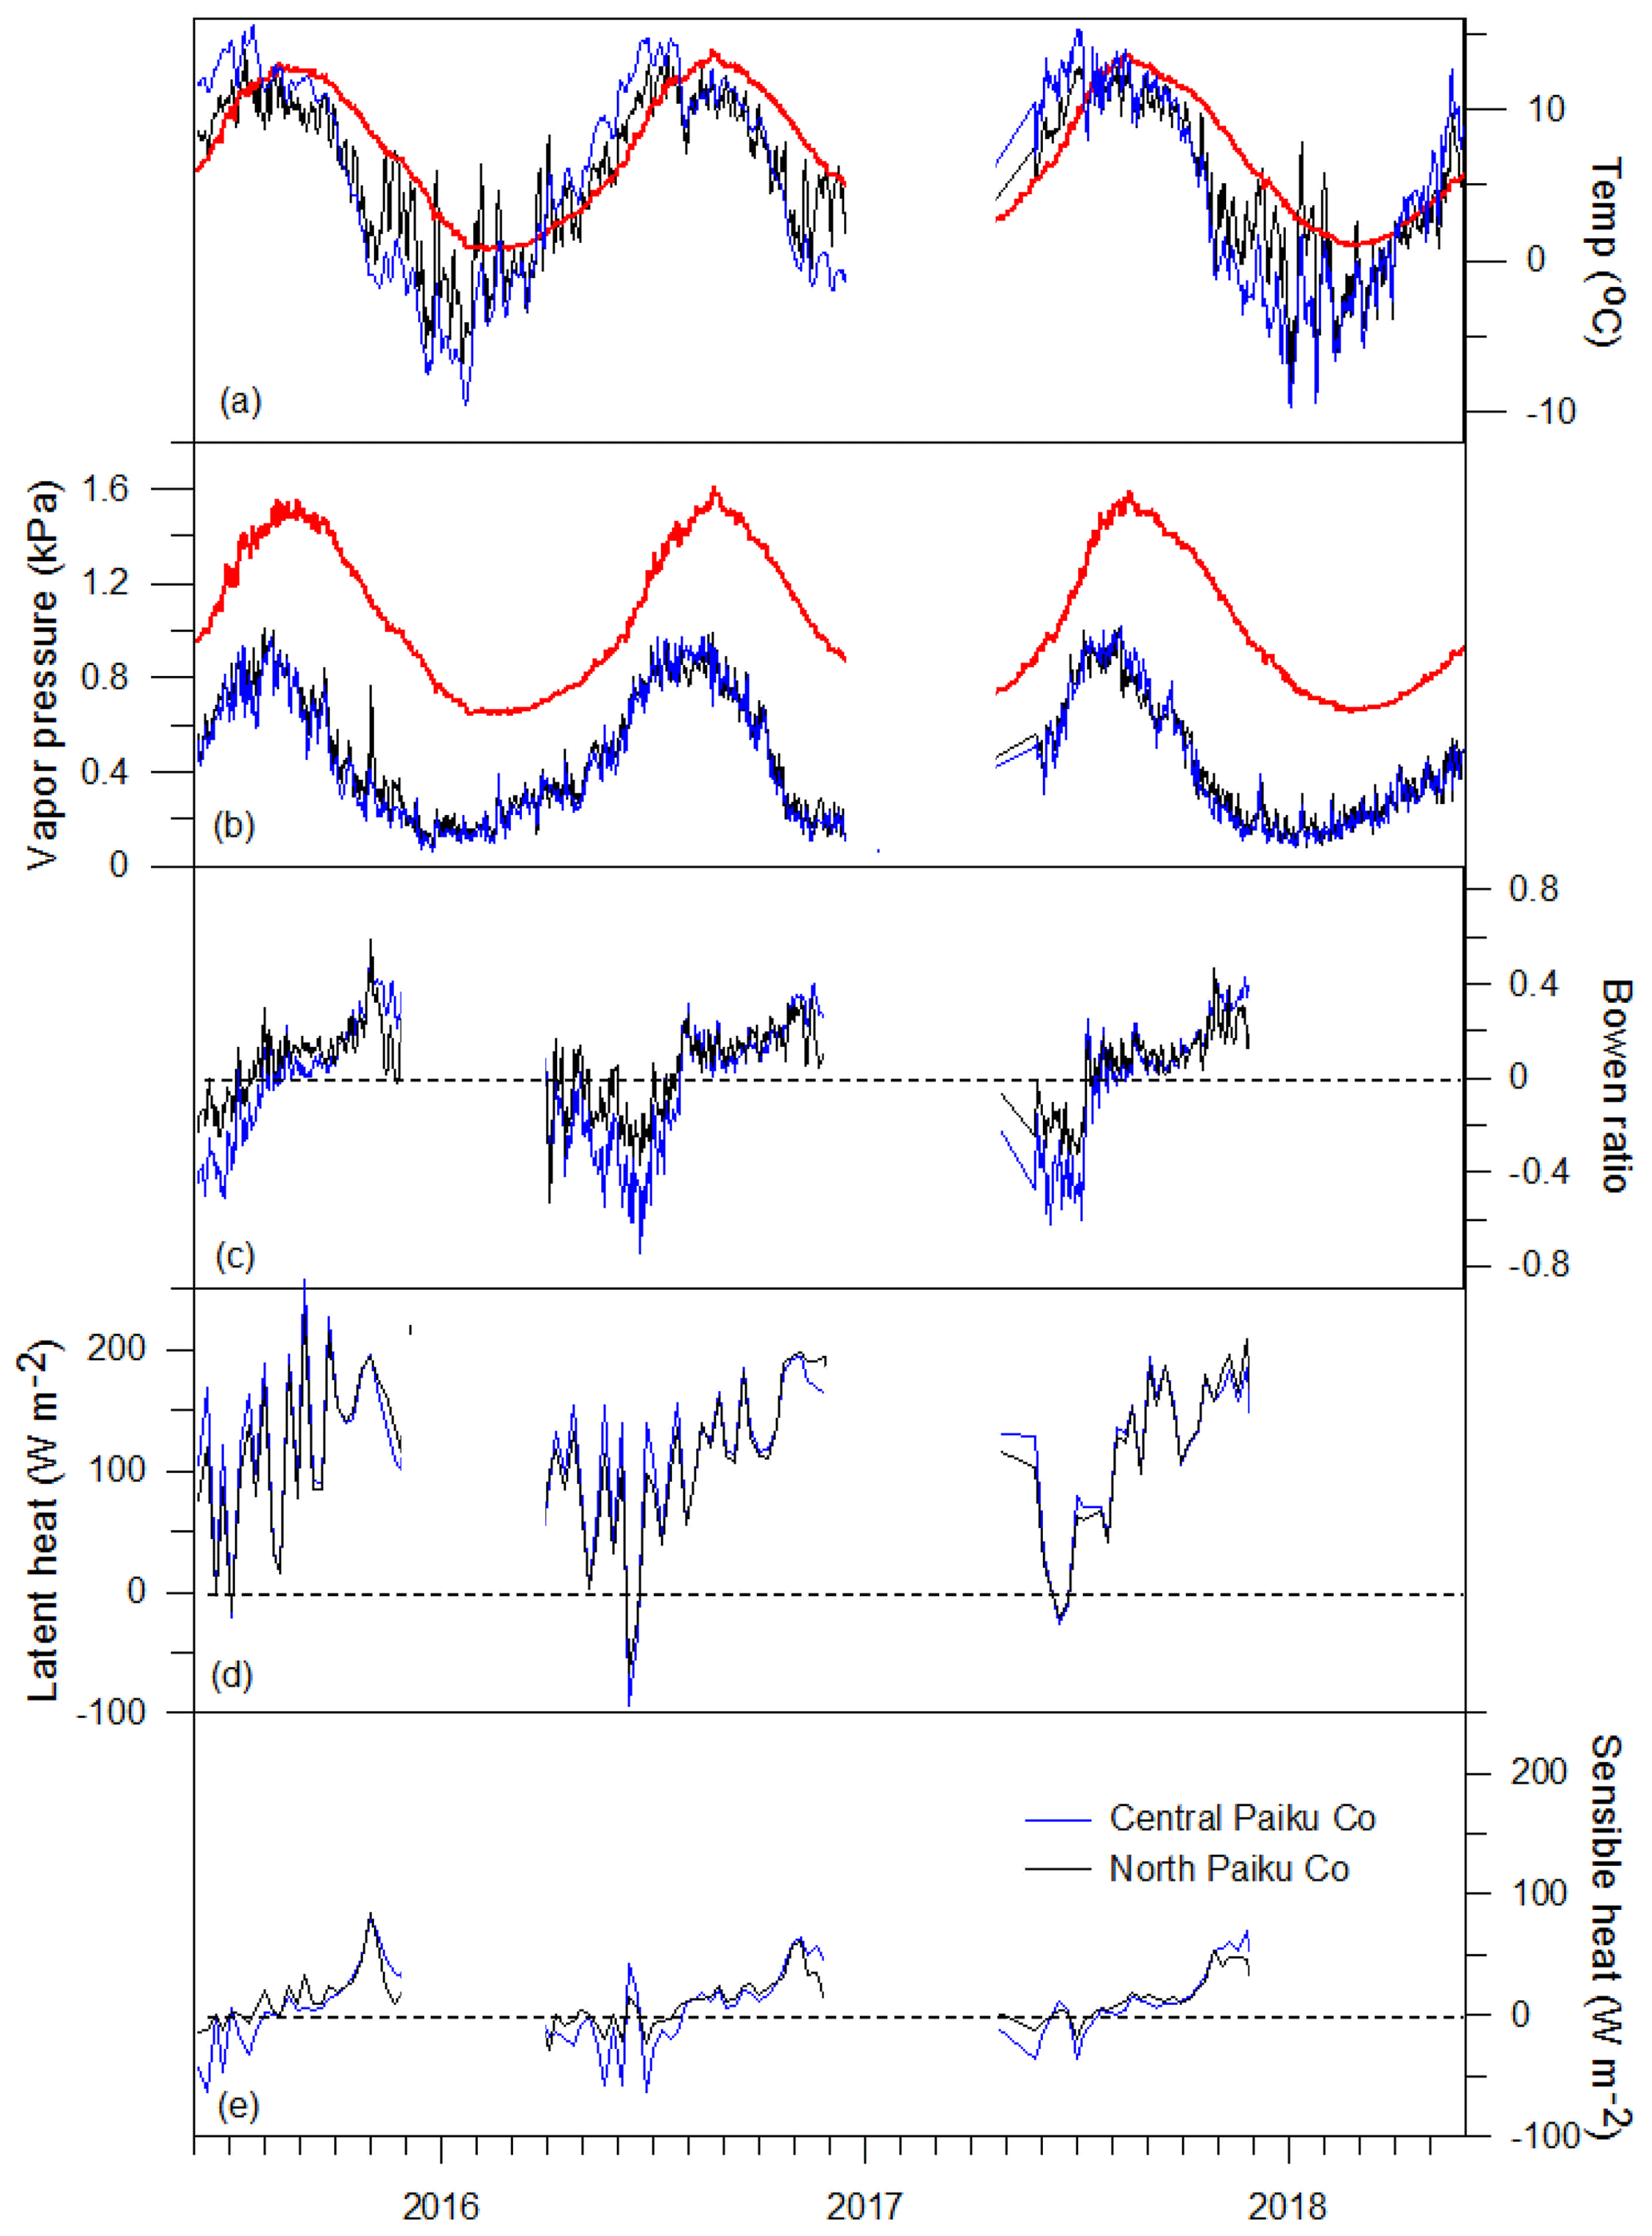
Figure 5Hydrometeorology and heat fluxes at the lake surface. (a) Daily air temperature and lake surface temperature (red line), (b) daily actual vapor pressure at lake surface (red line) and the overlying atmosphere, (c) daily Bowen ratio between May and December, (d and e) weekly averaged latent and sensible heat fluxes between May and December. For (a–e), black lines denote north Paiku Co, and blue lines denote central Paiku Co. There were no data available between February and May 2017.
The Bowen ratio at Paiku Co varied in a range of −0.26 to +0.37 between May and December (Fig. 5c). Negative values occurred between May and July, with an average value of −0.12. Positive values occurred between August and December, with an average value of +0.20. Latent heat flux was the main component of the total heat flux, with an average value of 112.3 W m−2 between May and December. Latent heat flux at Paiku Co was low between May and June, with an average of 38.7 W m−2, and was high between October and December, with an average of 153.3 W m−2 (Table 2). Latent heat flux was positively correlated with the water vapor pressure difference between the atmosphere and the underlying surface water (r2=0.41, P<0.001). Sensible heat flux had an average value of 13.3 W m−2 between May and December, accounting for ∼11 % of latent heat flux. Sensible heat flux was negative between May and July, with an average value of −5.6 W m−2, and was positive between August and December, with an average of 23.0 W m−2 (Table 2). The sensible heat flux was positively correlated with the water temperature difference between the atmosphere and the underlying surface water (r2=0.86, P<0.001).
3.3 Lake evaporation
Lake evaporation from Paiku Co between May and December was determined using the energy budget method (Fig. 6). Lake evaporation between January and April was not determined because part of the lake surface was covered by lake ice, which can significantly affect the energy balance over the lake surface. Monthly lake evaporation from Paiku Co during the ice-free season is shown in Fig. 6. Lake evaporation was generally low during the pre-monsoon season (May and June), with an average value of 1.7 mm d−1. During the monsoon season (July to September), lake evaporation increased rapidly from 2.9 to 5.1 mm d−1. High lake evaporation occurred during the post-monsoon season (October to December), with an average value of 5.4 mm d−1. Total lake evaporation from Paiku Co was estimated to be 975 mm between May and December.

Figure 6Comparison of monthly lake evaporation with net radiation (Rnet) and changes in lake heat storage (S). (a) Net radiation, (b) changes in lake heat storage, and (c) lake evaporation from Paiku Co and Nam Co on the central TP. Lake evaporation from Nam Co was determined using the eddy covariance system in the lake center (B. Wang et al., 2019). The bars denote the uncertainty of lake evaporation from Paiku Co.
Lake evaporation from Paiku Co was in anti-phase with the seasonal pattern of net radiation (Fig. 6), indicating that lake evaporation was not directly driven by the input energy. There is a ∼5-month lag between the maximum net radiation and maximum lake evaporation from Paiku Co due to the large lake heat storage. When the net radiation was high between May and July, most of the energy was used to heat the lake water, and only a small part of it was consumed as the latent heat flux, which led to low latent heat flux. When the net radiation was low between October and December, a large amount of heat was released from the lake water as latent heat to the overlying atmosphere, which led to high latent heat flux. Instead, lake evaporation exhibited a similar seasonal pattern to changes in lake heat storage, indicating that lake evaporation was significantly affected by large lake heat storage. Regression analysis shows that lake evaporation from Paiku Co was positively correlated with changes in lake heat storage (r2=0.63, P<0.001) but negatively correlated with net radiation (r2=0.22, P<0.001). Lake evaporation exhibited similar patterns to the water vapor pressure difference between the atmosphere and the underlying surface water (r2=0.33, P<0.001). According to the bulk transfer relation, lake evaporation is mainly controlled by humidity gradient in the atmospheric layer (Zhang and Liu, 2014). For deep lakes like Paiku Co, although net radiation and air temperature decrease considerably during the post-monsoon season, lake water temperature was still high due to its large lake heat storage, which led to large water vapor difference and high evaporation. During the pre-monsoon season, the above process was reversed, which led to relatively low lake evaporation.
3.4 Impact of lake heat storage on the seasonal pattern of lake evaporation
To further explore the impact of lake heat storage on the seasonal pattern of lake evaporation, we compare lake evaporation from Paiku Co with other lakes on the TP. We only select lakes with eddy covariance system measurements. At Ngoring Lake (area, 610 km2; mean depth, 17 m) on the eastern TP, Li et al. (2015) investigated the lake's energy budget and evaporation in 2011/12 and found that the latent heat at Nogring Lake was lowest in June, peaked in August, and then decreased gradually from September to November. At Qinghai Lake (area, 4430 km2; mean depth, 19 m) on the northeast TP, Li et al. (2016) conducted studies concerning the lake's energy budget and evaporation in 2013–2015 and found that there was a 2–3-month delay between the maximum net radiation and maximum heat flux. Compared with Paiku Co, there was a shorter time lag between net radiation and evaporation from the two relatively shallow lakes. The different phase of lake evaporation among these lakes can be partly attributed to lake heat storage. As we have shown, Paiku Co has a mean water depth of ∼41 m, and the water column is fully mixed between November and June. This means that Paiku Co as a deep lake can store more energy during the pre-monsoon and monsoon seasons than relatively shallow lakes and subsequently release more energy to the overlying atmosphere during the post-monsoon season.
At Nam Co, a large and deep lake on the central TP, there have been several studies regarding lake evaporation (Haginoya et al., 2009; Ma et al., 2016; B. Wang et al., 2017, 2019). Haginoya et al. (2009) found that lake evaporation from Nam Co was lowest in May and highest in October. Lake evaporation from Nam Co was estimated to be 916–986 mm through the Bowen ratio method (Lazhu et al., 2016) and eddy covariance system (Wang et al., 2019). Figure 6c shows that lake evaporation from Paiku Co and Nam Co exhibits similar seasonal variations. In fact, although the maximum depth at Nam Co is greater than that at Paiku Co, the average water depth of the two lakes is similar (Wang et al., 2009; Lei et al., 2018), which results in a similar seasonal pattern of changes in lake heat storage and lake evaporation (Fig. 6c). At Siling Co, another large lake on the central TP, monthly lake evaporation varied within a range of 2.4–3.3 mm d−1 between May and September, with a total amount of 417.0 mm during the study period in 2014 (Guo et al., 2016). Although the cumulative evaporation between Paiku Co and Siling Co is similar between May and September, lake evaporation during the post-monsoon season cannot be further compared because the heat flux at Siling Co was not measured after October.
3.5 The effects of lake evaporation on seasonal lake-level variations across the TP
The quantification of lake evaporation is important for understanding the lake water budget and associated lake-level changes. Compared with the eddy covariance system that is easily affected by lake ice after October/November when the lake surface begins to freeze (Li et al., 2015; Wang et al., 2017; Guo et al., 2016), our results give a full description of lake evaporation during the entire ice-free period. More importantly, our results indicate that for deep lakes on the TP, evaporation during the post-monsoon season can be much higher than that during the pre-monsoon season due to the release of a large amount of stored heat, despite both air temperature and net radiation being low already. In this sense, lake evaporation during the post-monsoon season is of great importance to the lake water budget and can significantly affect the amplitude of seasonal lake-level changes, especially for deep lakes.
As a monsoon-dominated region, the Indian summer monsoon around Paiku Co usually starts in middle June and ends in late September (Yu et al., 2016). For most years, more than 80 % precipitation occurs during the summer monsoon season. Glacier melting also occurs during the summer monsoon season. In contrast, heat flux from Paiku Co is still low during the summer monsoon season. During the post-monsoon season, precipitation and glacier melting decrease considerably, while heat flux from Paiku Co is high. This contrasting pattern of hydrological and thermal intensities plays an important role in the large amplitude of seasonal lake-level variations at Paiku Co. Precipitation and lake inflow, for instance, are mainly concentrated during the monsoon season, while lake evaporation is still low during this period (Fig. 7a and b), which causes a positive lake water budget and a rapid increase in lake level (40–60 cm). During the post-monsoon season, precipitation and lake inflow are already very low, while lake evaporation is high, which leads to a negative lake water budget and a rapid decrease in lake level (∼40 cm). The slight lake-level decrease during the pre-monsoon season is mainly due to low lake evaporation and lake inflow.
Figure 7The main components of the lake water budget at Paiku Co between 2015 and 2018. (a) Lake evaporation (mm d−1) derived from the north shoreline of Paiku Co. (b) Daily precipitation (mm) at Qomolangma station and water level (mm) of Bulaqu River in 2015 and 2016. Note the y axis (left) of precipitation is reversed. (c) Daily lake level (mm) at Paiku Co. The thick lines in (a) denote the five-point running average. The blue rectangles represent pre-monsoon and post-monsoon season periods, respectively.
On a broader scale, lake evaporation may affect the different amplitude of seasonal lake-level variations between deep and shallow lakes on the TP. Lei et al. (2017) investigated the lake-level seasonality across the TP and found that there were different amplitudes of seasonal lake-level fluctuations, even in similar climate regimes. For example, lake level at Nam Co and Zhari Namco, two large and deep lakes on the central TP (Wang et al., 2009, 2010), decreased considerably by 0.3–0.5 m during the post-monsoon season (Fig. 8), while lake level at two nearby small lakes, Bam Co and Dawa Co, decreased slightly by 0.1–0.2 m during the same period. A different seasonal pattern of lake evaporation may play an important role in the amplitude of lake-level seasonality. For deep lakes (e.g., Paiku Co, Nam Co and Zhari Namco), the latent heat flux (lake evaporation) over the lake surface may lag the net radiation by several months due to the large heat storage. For this kind of lake, the lake-level drop mainly occurs during the post-monsoon season when lake evaporation is high but lake water input is low. For shallow lakes, the latent heat flux closely follows solar radiation due to relatively small lake heat storage. High lake evaporation occurs during the pre-monsoon and monsoon seasons, and low lake evaporation occurs during the post-monsoon season (Morrill, 2004). Meanwhile, shallow lakes freeze up 1–2 months earlier than deep lakes. When the lake surface is covered by ice, lake evaporation (sublimation) is significantly reduced (Huang et al., 2019). Consequently, lake level at shallow lakes decreased slowly during the post-monsoon season compared with deep lakes. This phenomenon can also be seen at shallow thermokarst lakes on the northern TP (Luo et al., 2015; Pan et al., 2017).
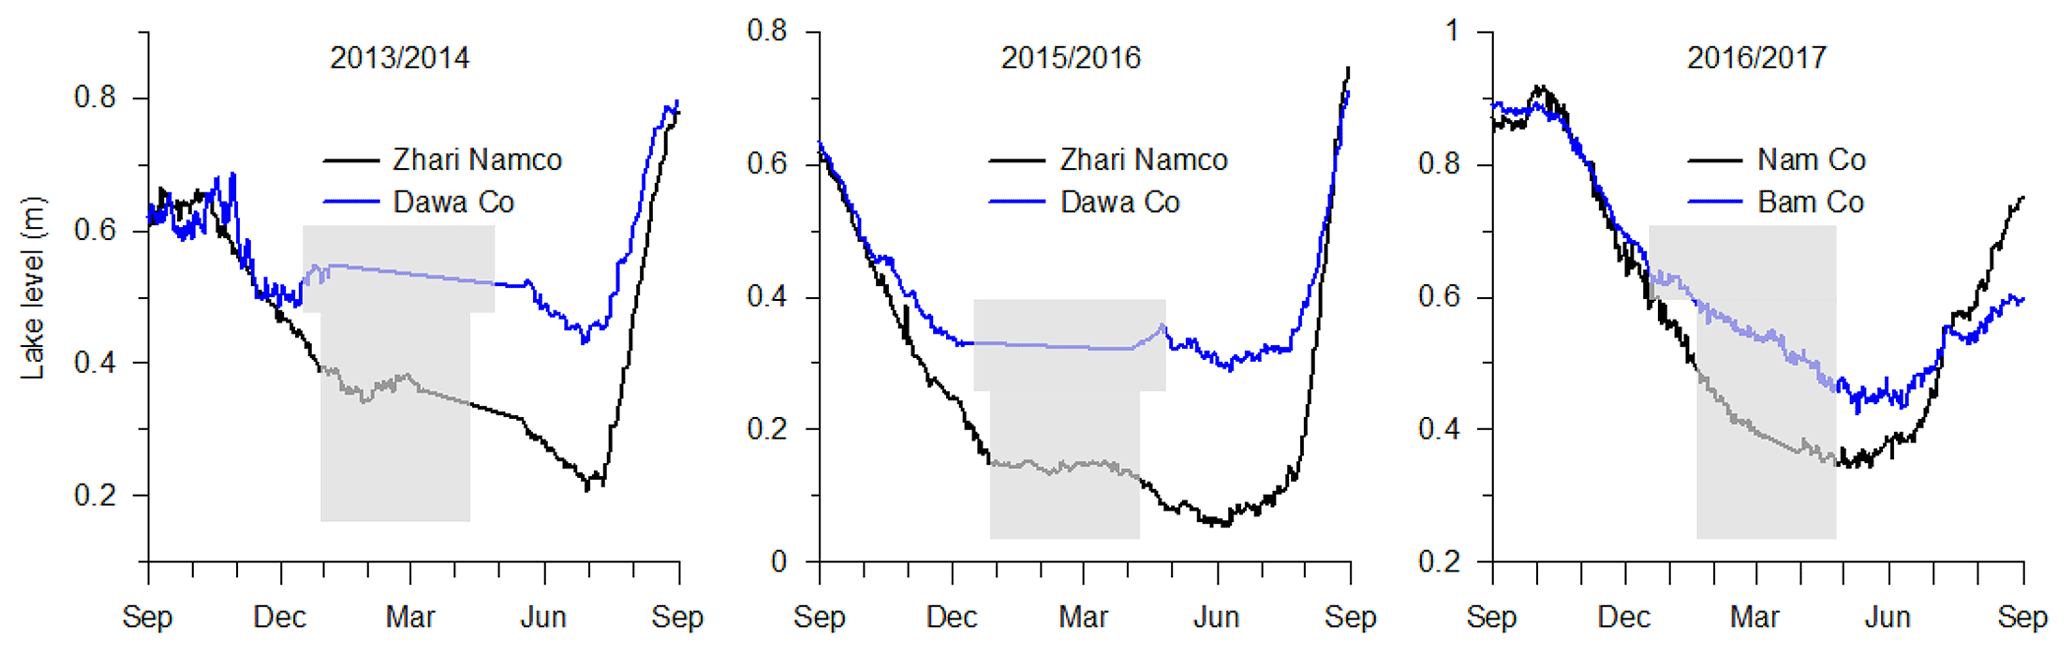
Figure 8Different amplitude of seasonal lake-level changes between deep and shallow lakes on the central TP. Relatively deep lakes: Zhari Namco (85.61∘ E, 30.93∘ N) and Nam Co (90.60∘ E, 30.74∘ N). Relatively shallow lakes: Dawa Co (84.96∘ E, 31.24∘ N) and Bam Co (90.58∘ E, 31.26∘ N). Grey rectangles in each figure represent lake ice-covered periods.
Lake evaporation may also have significant impact on the different amplitude of seasonal lake-level variations between the northern and southern TP. Based on ICESat satellite altimetry data, Phan et al. (2012) showed that there was a larger amplitude of seasonal lake-level variations on the southern TP relative to the northern TP. However, the main causes have not been investigated until now. Lakes on the northern TP usually freeze up earlier and break up later due to its lower temperature (Kropáček et al., 2013; Maussion et al., 2014), which results in longer ice cover duration on the northern TP (159–209 d) relative to the southern TP (126 d). Longer ice cover duration can considerably reduce lake evaporation during the post-monsoon season (Wang et al., 2020). Meanwhile, lakes on the southern TP are usually larger and deeper than those on the northern TP (e.g., Wang et al., 2009, 2010), which indicates that it can store more energy during the pre-monsoon and monsoon seasons and release it to the overlying atmosphere during the post-monsoon season. For endorheic lakes, relatively higher lake evaporation during the post-monsoon season may lead to larger lake-level decrease on the southern TP compared with the northern TP. Therefore, the different amplitudes of seasonal lake-level variations between the southern and northern TP can be partly attributed to the different seasonal patterns of lake evaporation. Note that other factors including lake salinity and solar radiation may also have an impact on lake evaporation across the TP besides lake ice phenology. More studies are still needed to quantify their impact on annual lake evaporation and the seasonal distribution.
3.6 Uncertainty of lake evaporation
In this study, the energy budget and lake evaporation from Paiku Co are estimated based on in situ measurements from a single point. However, studies showed that there are considerable spatial differences in lake evaporation due to the different surface temperature and meteorological conditions over the lake surface (Sugita et al., 2014). For example, Sugita (2019) showed that lake surface temperature and evaporation differ horizontally at Lake Kasumigaura due to the spatial variations of surface temperature, air temperature, and wind speed. Lake evaporation was larger at the center and the south of Lake Kasumigaura due to the strong wind regime. More detailed measurements from Paiku Co are still needed to investigate the spatial variations of lake evaporation. Here, uncertainty of lake evaporation is estimated from the following aspects: solar radiation, lake surface temperature, changes in lake heat storage, and meteorological data (air temperature and humidity).
Firstly, solar radiation and atmospheric longwave radiation at Qomolangma station were used to represent those at Paiku Co. To evaluate the spatial difference, we made a comparison of solar radiation at Paiku Co and Qomolangma station using Himawari-8 satellite data (Tang et al., 2019; Fig. S4 in the Supplement). The results show that daily solar radiation at the two sites exhibited similar seasonal fluctuations (R2=0.55, P<0.001). The mean difference of solar radiation at the two sites was estimated to be 3.8 W m−2 (ΔE1). The uncertainty in the atmospheric longwave radiation is not estimated, but the variations of solar radiation and atmospheric longwave radiation are usually opposite at a site, so their total uncertainty should not exceed the individual uncertainty (Yang et al., 2010).
Secondly, lake water temperature at the depth of 0.4–0.8 m, not lake skin temperature, is used to calculate upward longwave radiation. Studies show that lake skin temperature is higher than surface water temperature in the daytime, and vice versa at nighttime (Prats et al., 2018). Here, the Aqua MODIS 8 d lake surface temperature product is used to determine the difference between lake bulk temperature and skin temperature. The product is produced with a spatial resolution of about 1 km, and the accuracy is estimated to be 1 K under clear-sky conditions (Wan, 2013). During the pre-monsoon and monsoon seasons when the lake water got warm, the skin temperature derived from MODIS data was about 1.2 ∘C higher than lake body temperature. During the post-monsoon season when the lake water got cool, the skin temperature derived from MODIS data was about 0.05 ∘C higher than lake body temperature. Because MODIS data are easily affected by cloud cover and other factors during the monsoon season, the mean difference of 0.05 ∘C during the post-monsoon season is used to estimate uncertainty of upward longwave radiation, which corresponded to 7.6 W m−2 of heat flux (ΔE2) using error propagation.
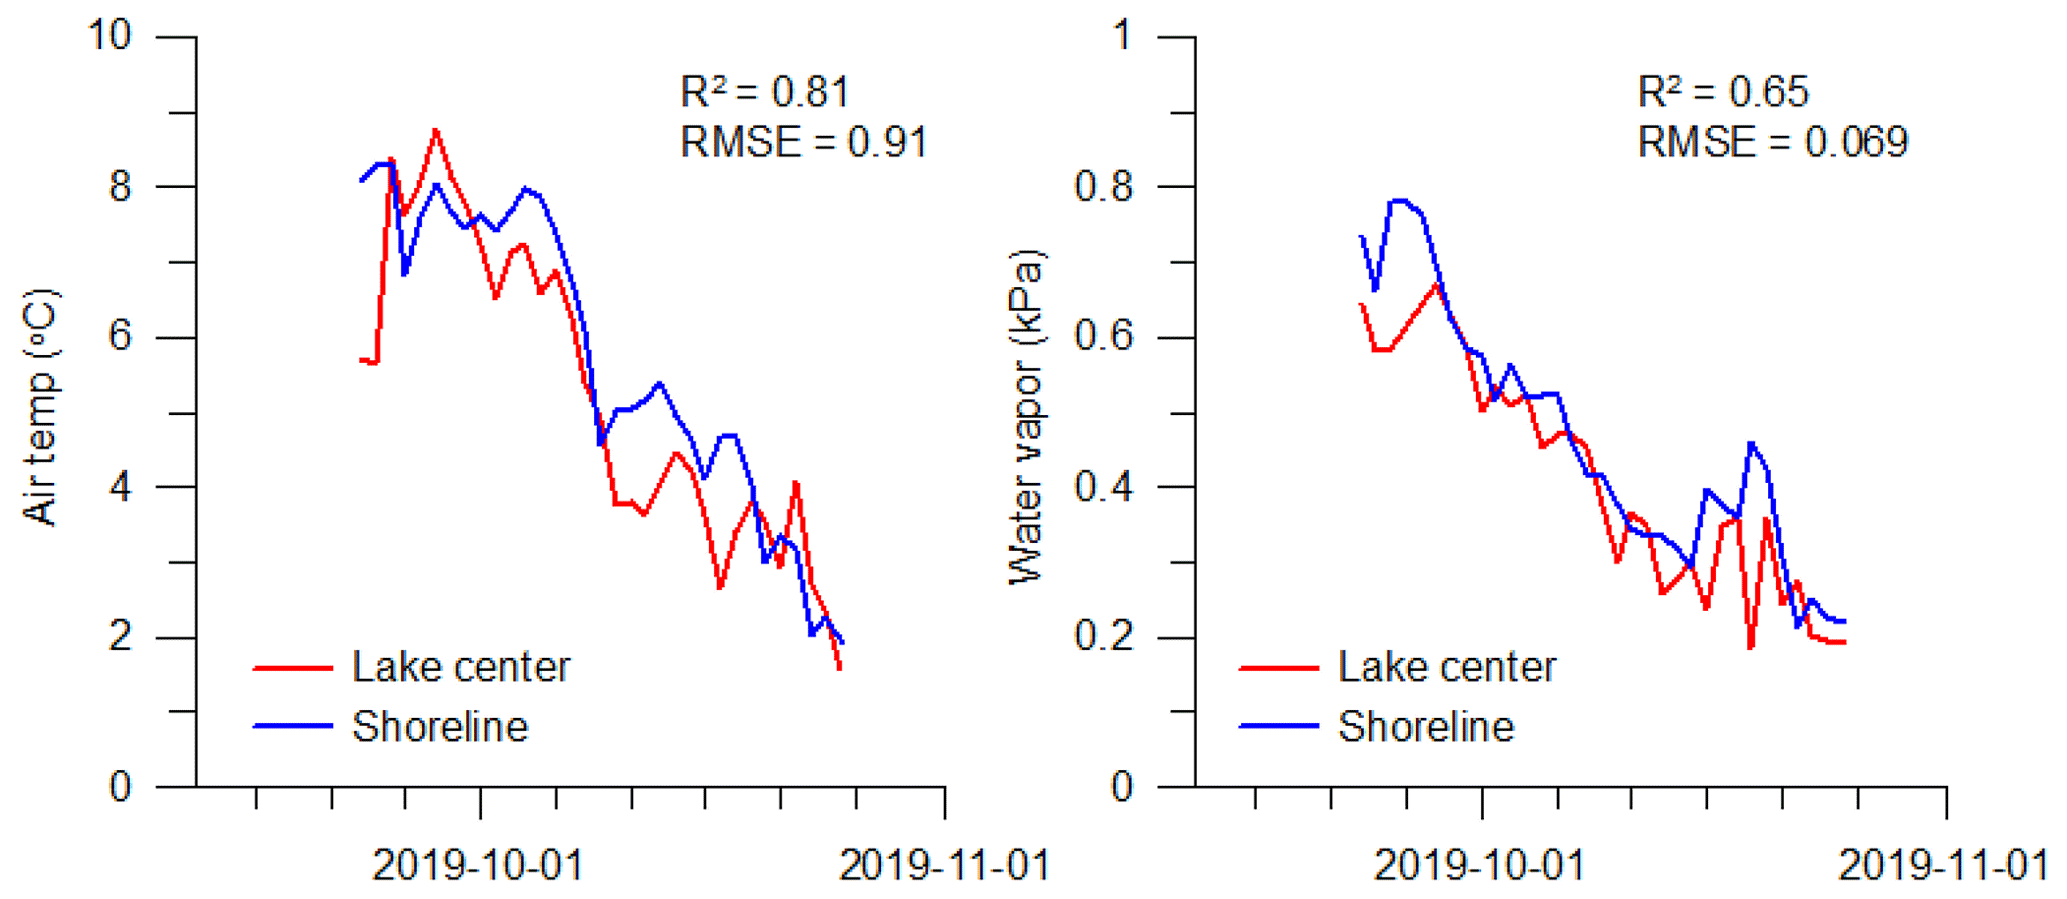
Figure 9Comparison of daily air temperature and water vapor pressure between the shoreline and the lake center during the period of 23 September–25 October 2019.
Thirdly, uncertainty of changes in lake heat storage mainly comes from the spatial distribution of lake water temperature. A comparison of lake water temperature between Paiku Co's southern and northern basins in 2016/17 is shown in Fig. S5 in the Supplement. Since the northern basin is deeper than the southern basin, lake water in the northern basin warmed more slowly than that in the southern basin during the pre-monsoon and monsoon seasons and cooled more slowly during the post-monsoon season. The daily surface water temperature in the southern basin was about 0.85 ∘C higher on average than that in the northern basin between April and September but was about 0.45 ∘C lower on average in November and December (Fig. S5). Water temperature became spatially uniform at both basins between January and March. Similar spatial difference can also be found at 10 m depth, indicating that this phenomenon may exist in the entire epilimnion. Uncertainty of changes in lake water temperature is estimated to be 0.007 during the ice-free period, corresponding to 14.3 W m−2 of heat flux (ΔE3).
Table 3Runoff (m3 s−1) of the three main rivers in Paiku Co basin during the pre-monsoon and post-monsoon seasons between 2015 and 2017 and their total contribution to lake-level increase (mm d−1).

Total contribution is calculated according to the total runoff of the three main rivers and lake area. The measuring dates are shown in brackets.
Fourthly, air temperature and relative humidity at the shoreline are used to calculate the Bowen ratio and lake evaporation. To validate its representativeness, we set up a platform (water depth: 19 m; least distance from shoreline: 2 km) in the southern center of Paiku Co in September 2019, and a simple AWS station (GMX600) was installed on the platform. Meteorological data between 22 September and 26 October were acquired. We made a comparison of meteorological data between the shoreline and the lake center. Results show that both air temperature and relative humidity fluctuated similarly between the shoreline and the lake center (Fig. 9), indicating the meteorological data from the shoreline of Paiku Co can be used to represent the general condition of the whole lake, at least during the observed period. The RMSE of daily air temperature and water vapor pressure in the shoreline was estimated to be 0.91 ∘C and 0.069 kPa. The uncertainty of the Bowen ratio was estimated to be 0.02 during the ice-free period using error propagation, which corresponds to 2.2 W m−2 of heat flux (ΔE4). Using error propagation, the uncertainties of latent heat flux and lake evaporation are estimated to be 16.8 Wm−2 ( and 0.6 mm d−1, respectively. The total uncertainty of lake evaporation is 142 mm during the ice-free period between May and December.
Lake evaporation is validated through comparison with lake-level changes during the pre-monsoon and post-monsoon seasons. Runoff measurements at the three largest rivers feeding Paiku Co are shown in Table 3. During the pre-monsoon season (May), lake evaporation (1.7 mm d−1) was similar to the rate of lake-level decrease (1.8 mm d−1). During the post-monsoon season (October to December), lake evaporation (5.4 mm d−1) was considerably higher than the rate of lake-level decrease (3.8 mm d−1). This discrepancy (1.6 mm d−1) may be largely due to the contribution of precipitation and surface runoff. As shown in Table 3, runoff at the three large rivers can contribute to lake-level increase by 1.0 mm d−1 on average in October, thereby partially offsetting lake-level changes from lake evaporation. This difference (0.6 mm d−1) between the estimated lake evaporation and the in situ measurements of lake-level decrease and runoff during the post-monsoon season is very close to the uncertainty of lake evaporation estimated by error propagation.
Lake evaporation and its effects on seasonal lake-level variations at Paiku Co on the southern TP are investigated based on 3 years' comprehensive observations of the lake water budget. The results show that Paiku Co is a dimictic lake with clear lake stratification between July and October. The surface water reaches its highest temperature by late August, while the bottom water reaches its highest 2 months later. The thermocline formed at the depth of 15–25 m, with the largest temperature difference of 5–6 ∘C in late August.
As a deep alpine lake, the seasonal patterns of heat flux and lake evaporation are significantly affected by the large lake heat storage. The lake absorbs most of the net radiation to heat the lake water during the pre-monsoon and monsoon seasons and releases it to the overlying atmosphere during the post-monsoon season. Between April and July, about 66.5 % of the net radiation was consumed to heat the lake water. Between October and January, heat released from lake water was about 3 times larger than the net radiation. As a result, there was a ∼5-month lag between the maximum net radiation and the maximum lake evaporation due to the large heat storage of lake water. Lake evaporation from Paiku Co was estimated to be 975±142 mm during the ice-free period between May and December, with low values of 1.7±0.6 mm d−1 during the pre-monsoon season (May and June) and high values of 5.4±0.6 mm d−1 during the post-monsoon season (October to December).
Our results imply that lake evaporation plays an important role in the different amplitudes of seasonal lake-level variations on the TP. For deep lakes like Paiku Co, contrasting hydrological and thermal intensities determine the large amplitude of seasonal lake-level variations. High lake evaporation and low lake inflow lead to the considerable lake-level decrease during the post-monsoon season. In contrast, relatively low lake evaporation but high lake inflow leads to rapid lake-level increase during the monsoon season. For relatively shallow lakes, the seasonal pattern of lake evaporation varies similarly with the net radiation, which results in slight lake-level decrease during the post-monsoon season and less amplitude of lake-level seasonality. Therefore, lake evaporation may play an important role in the different amplitudes of seasonal lake-level variations.
All original data presented in this paper are publicly available via the National Tibetan Plateau Data Center (https://doi.org/10.11888/Hydro.tpdc.270287, Lei et al., 2019).
The supplement related to this article is available online at: https://doi.org/10.5194/hess-25-3163-2021-supplement.
YL and TY conceived and designed the experiments; YL, TY, KY, L, and YM analyzed the data; YL performed the fieldwork and wrote the paper; and BWB helped write the paper.
The authors declare that they have no conflict of interest.
We thank Qomolangma Atmospheric and Environmental Observation and Research Station CAS for providing radiation data and Wenjun Tang for providing Himawari-8 satellite radiation data. We are also grateful to all the members who took part in the fieldwork.
This research has been supported by the Second Tibetan Plateau Scientific Expedition and Research Program (grant no. 2019QZKK0201), the Strategic Priority Research Program of Chinese Academy of Sciences (grant no. XDA2006020102), the NSFC project (grant nos. 41971097 and 21661132003), and the Youth Innovation Promotion Association CAS (grant no. 2017099).
This paper was edited by Bob Su and reviewed by three anonymous referees.
Blanken, P. D., Rouse, W. R., Culf, A. D., Spence, C., Boudreau, L. D., Jasper, J. N., Kochtubajda, B., Schertzer, W. M., Marsh, P., and Verseghy, D.: Eddy covariance measurements of evaporation from Great Slave Lake, Northwest Territories, Canada, Water Resour. Res., 36, 1069–1078, 2000.
Cai, Y., Ke, C. Q., and Duan, Z.: Monitoring ice variations in Qinghai Lake from 1979 to 2016 using passive microwave remote sensing data. Sci. Total Environ., 607–608, 120–131, https://doi.org/10.1016/j.scitotenv.2017.07.027, 2017.
Dai, Y., Gao, Y., Zhang, G., and Xiang, Y.: Water volume change of the Paiku Co in the southern Tibetan Plateau and its response to climate change in 2003–2011, J. Glaciol. Geocryol., 35, 723–732, 2013.
Gianniou, S. K. and Antonopoulos, V. Z.: Evaporation and energy budget in Lake Vegoritis, Greece, J. Hydrol., 345, 212–223, 2007.
Guo, Y., Zhang, Y., Ma, N., Song, H., and Gao, H.: Quantifying Surface Energy Fluxes and Evaporation over a significant Expanding Endorheic Lake in the Central Tibetan Plateau, J. Meteorol. Soc. Jpn., 94, 453–465, 2016.
Haginoya, S., Fujii, H., Kuwagata, T., Xu, J., Ishigooka, Y., Kang, S., and Zhang, Y.: Air-lake interaction features found in heat and water exchanges over Nam Co on the Tibetan Plateau, Sci. Online Lett. Atmos., 5, 172–175, https://doi.org/10.2151/sola.2009-044, 2009.
Henderson-Sellers, B.: Engineering Limnology, Pitman Publishing, Great Britain, 1984.
Huang, W., Cheng, B., Zhang, J., Zhang, Z., Vihma, T., Li, Z., and Niu, F.: Modeling experiments on seasonal lake ice mass and energy balance in the Qinghai–Tibet Plateau: a case study, Hydrol. Earth Syst. Sci., 23, 2173–2186, https://doi.org/10.5194/hess-23-2173-2019, 2019.
Ke, C., Tao, A., and Jin, X.: Variability in the ice phenology of Nam Co Lake in central Tibet from scanning multichannel microwave radiometer and special sensor microwave/imager: 1978 to 2013, J. Appl. Remote. Sens. 7, 073477, https://doi.org/10.1117/1.JRS.7.073477, 2013.
Kropáček, J., Maussion, F., Chen, F., Hoerz, S., and Hochschild, V.: Analysis of ice phenology of lakes on the Tibetan Plateau from MODIS data, The Cryosphere, 7, 287–301, https://doi.org/10.5194/tc-7-287-2013, 2013.
Lazhu, Yang, K., Wang, J., Lei, Y., Chen, Y., Zhu, L., Ding, B., and Qin, J.: Quantifying evaporation and its decadal change for Lake Nam Co, central Tibetan Plateau, J. Geophys. Res.-Atmos., 121, 7578–7591, https://doi.org/10.1002/2015JD024523, 2016.
Lei, Y., Yao, T., Yang, K., Lazhu, Ma, Y., and Bird, B.: Lake water temperature, hydrometeorology and lake evaporation at Paiku Co in the central Himalayas (2015–2018), National Tibetan Plateau Data Center, https://doi.org/10.11888/Hydro.tpdc.270287, 2019.
Lei Y. and Yang K.: The cause of rapid lake expansion in the Tibetan Plateau: climate wetting or warming?, WIREs Water, 4, e1236, https://doi.org/10.1002/wat2.1236, 2017.
Lei, Y., Yang, K., Wang, B., Sheng, Y., Bird, B., Zhang, G., and Tian, L.: Response of inland lake dynamics over the 405 Tibetan Plateau to climate change, Climatic Change, 125, 281–290, 2014.
Lei, Y., Yao, T., Yang, K., Sheng, Y., Kleinherenbrink, M., Yi, S., Bird, B. W., Zhang, X., Lazhu, and Zhang, G. Q.: Lake seasonality across the Tibetan Plateau and their varying relationship with regional mass changes and local hydrology, Geophys. Res. Lett., 44, 892–900, https://doi.org/10.1002/2016GL072062, 2017.
Lei, Y., Yao, T., Yang, K., Bird B. W., Tian, L., Zhang, X., Wang W., Xiang Y., Dai, Y. F., Lazhu, Zhou, J., and Wang, L.: An integrated investigation of lake storage and water level changes in the Paiku Co basin, central Himalayas, J. Hydrol., 562, 599–608, https://doi.org/10.1016/j.jhydrol.2018.05.040, 2018.
Lenters, J., Kratz, T., and Bowser, C.: Effects of climate variability on lake evaporation: results from a long-term energy budget study of Sparkling Lake, northern Wisconsin (USA), J. Hydrol., 308, 168–195, 2005.
Li, W., Li, S., and Pu P.: Estimates of plateau lake evaporation: A case study of Zige Tangco, J. Lake Sci., 13, 227–232, 2001.
Li, X. Y., Ma, Y. J., Huang, Y. M., Hu, X., Wu, X. C., Wang, P., Li, G. Y., and Zhang, S. Y.: Evaporation and surface energy budget over the largest high-altitude saline lake on the Qinghai-Tibet Plateau, J. Geophys. Res.-Atmos., 121, 10470–10485, https://doi.org/10.1002/2016JD025027, 2016.
Li, Z., Lyu, S., Ao, Y., Wen, L., Zhao, L., and Wang S.: Long-term energy flux and radiation balance observations over Lake Ngoring, Tibetan Plateau, Atmos. Res., 155, 13–25, https://doi.org/10.1016/j.atmosres.2014.11.019, 2015.
Livingstone, D.: Impact of secular climate change on the thermal structure of a large temperate central European lake, Climatic Changes, 57, 205–225, 2003.
Luo, J., Niu, F., Lin, Z., Liu, M., and Yin, G.: Thermokarst lake changes between 1969 and 2010 in the Beilu River Basin, Qinghai–Tibet Plateau, China, Sci. Bull., 60, 556–564, 2015.
Ma, N., J. Szilagyi, Niu, G. Y., Zhang, Y., Zhang, T., Wang, B., and Wu, Y.: Evaporation variability of Nam Co Lake in the Tibetan Plateau and its role in recent rapid lake expansion, J. Hydrol., 537, 27–35, https://doi.org/10.1016/j.jhydrol.2016.03.030, 2016.
Ma, R., Yang, G., Duan, H., Jiang, J., Wang, S., Feng, X., Li, A., Kong, F., Xue, B., Wu, J., and Li, S.: China's lakes at present: number, area and spatial distribution, Sci. China Earth Sci., 54, 283–289, 2011.
Maussion, F., Scherer, D., Mölg, T., Collier, E., Curio, J., and Finkelnburg, R.: Precipitation Seasonality and Variability over the Tibetan Plateau as Resolved by the High Asia Reanalysis, J. Climate, 27, 1910–1927, 2014.
Morrill, C.: The influence of Asian summer monsoon variability on the water balance of a Tibetan lake, J. Paleolimnol., 32, 273–286, 2004.
Nie, Y., Zhang, Y., Ding, M., Liu, L., and Wang, Z.: Lake change and its implication in the vicinity of Mt. Qomolangma (Everest), central high Himalayas, 1970–2009, Environ. Earth Sci., 68, 251–265, 2013.
Pan, X., Yu, Q., You, Y., Chun, K. P., Shi, X., and Li, Y.: Contribution of supra-permafrost discharge to thermokarst lake water balances on the northeastern Qinghai-Tibet Plateau, J. Hydrol., 555, 621–630, 2017.
Phan, V. H., Lindenbergh, R., and Menenti, M.: ICESat derived elevation changes of Tibetan lakes between 2003 and 2009, Int. J. Appl. Earth Obs., 17, 12–22, 2012.
Prats, J., Reynaud, N., Rebière, D., Peroux, T., Tormos, T., and Danis, P.-A.: LakeSST: Lake Skin Surface Temperature in French inland water bodies for 1999–2016 from Landsat archives, Earth Syst. Sci. Data, 10, 727–743, https://doi.org/10.5194/essd-10-727-2018, 2018.
Rosenberry, D. O., Winter, T. C., Buso, D. C., and Likens, G. E.: Comparison of 15 evaporation methods applied to a small mountain lake in the northeastern USA, J. Hydrol., 340, 149–166, https://doi.org/10.1016/j.jhydrol.2007.03.018, 2007.
Rouse, W. R., Oswald, C. J., Binyamin, J., Blanken, P. D., Schertzer, W. M., and Spence, C.: Interannual and seasonal variability of the surface energy balance and temperature of central Great Slave Lake, J. Hydrometeorol., 4, 720–730, 2003.
Rouse, W. R., Blanken, P. D., Bussières, N., Oswald, C. J., Schertzer, W. M., Spence, C., and Walker, A. E.: An Investigation of the Thermal and Energy Balance Regimes of Great Slave and Great Bear Lakes, J. Hydrometeorol., 9, 1318–1333, 2008.
Song, C., Huang, B., Ke, L., and Richards, K.: Seasonal and abrupt changes in the water level of closed lakes on the Tibetan Plateau and implications for climate impacts, J. Hydrol., 514, 131–144, 2014.
Stainsby, E. A., Winter, J. G., Jarjanazi, H., Paterson, A. M., Evans, D. O., and Young, J. D.: Changes in the thermal stability of Lake Simcoe from 1980 to 2008, J. Great Lakes Res., 37, 55–62, 2011.
Su, D., Hu, X., Wen, L., Lyu, S., Gao, X., Zhao, L., Li, Z., Du, J., and Kirillin, G.: Numerical study on the response of the largest lake in China to climate change, Hydrol. Earth Syst. Sci., 23, 2093–2109, https://doi.org/10.5194/hess-23-2093-2019, 2019.
Sugita, M.: Spatial variability of the surface energy balance of Lake Kasumigaura and implications for flux measurements, Hydrolog. Sci. J., 65, 401–414, https://doi.org/10.1080/02626667.2019.1701676, 2019.
Sugita, M., Ikura, H., Miyano, A., Yamamoto, K., and Wei, Z.: Evaporation from Lake Kasumigaura: annual totals and variability in time and space, Hydrological Research Letters, 8, 103–107, 2014.
Sugita, M., Ogawa, S., and Kawade, M.: Wind as a main driver of spatial variability of surface energy balance over a shallow 102-km2 scale lake: Lake Kasumigaura, Japan, Water Resour. Res., 56, e2020WR027173, https://doi.org/10.1029/2020WR027173, 2020.
Tang, W., Li, J., Yang, K., Qin, J., Zhang, G., and Wang, Y.: Dependence of remote sensing accuracy of global horizontal irradiance at different scales on satellite sampling frequency, Sol. Energy, 193, 597–603, 2019.
Wan, Z.: Collection-6 MODIS land surface temperature products users' guide, ICESS, University of California, Santa Barbara, 2013.
Wang, B., Ma, Y., Ma, W., and Su, Z.: Physical controls on half-hourly, daily, and monthly turbulent flux and energy budget over a high-altitude small lake on the Tibetan Plateau, J. Geophys. Res.-Atmos., 122, 2289–2303, https://doi.org/10.1002/2016JD026109, 2017.
Wang, B., Ma, Y., Wang, Y., Su, Z., and Ma, W.: Significant differences exist in lake-atmosphere interactions and the evaporation rates of high-elevation small and large lakes, J. Hydrol., 573, 220–234, 2019.
Wang, B., Ma, Y., Su, Z., Wang, Y., and Ma, W.: Quantifying the evaporation amounts of 75 high-elevation large dimictic lakes on the Tibetan Plateau, Sci. Adv., 6, eaay8558, https://doi.org/10.1126/sciadv.aay8558, 2020.
Wang, J., Zhu, L., Daut, G., Ju, J., Lin, X., Wang, Y., and Zhen, X.: Investigation of bathymetry and water quality of Lake Nam Co, the largest lake on the central Tibetan Plateau, China, Limnology, 10, 149–158, https://doi.org/10.1007/s10201-009-0266-8, 2009.
Wang, J., Peng, P., Ma, Q., and Zhu, L.: Modern limnological features of Tangra Yumco and Zhari Namco, Tibetan Plateau, J. Lake Sci., 22, 629–632, 2010.
Wang, J., Huang, L., Ju, J., Daut, G., Wang, Y., Ma, Q., Zhu, L., Haberzettl, T., Baade, J., and Mäusbacher, R.: Spatial and temporal variations in water temperature in a high-altitude deep dimictic mountain lake (Nam Co), central Tibetan Plateau, J. Great Lakes Res., 45, 212–223, 2019.
Wang, M., Hou, J., and Lei, Y.: Classification of Tibetan lakes based on variations in seasonal lake water temperature, Chinese Sci. Bull., 59, 4847–4855, https://doi.org/10.1007/s11434-014-0588-8, 2014.
Wang, Y., Yang, K., Zhou, X., Wang, B., Chen, D., Lu, H., Lin, C., and Zhang, F.: The formation of a dry-belt in the north side of central Himalaya Mountains. Geophys. Res. Lett., 46, 2993–3000, https://doi.org/10.1029/2018GL081061, 2019.
Wetzel, R. G.: Limnology: lake and river ecosystems, Elsevier, San Diego, 2001.
Wilson, R. C., Hook, S. J., Schneider, P., and Schladow, S. G.: Skin and bulk temperature difference at Lake Tahoe: A case study on lake skin effect, J. Geophys. Res.-Atmos., 118, 10332–10346, https://doi.org/10.1002/jgrd.50786, 2013.
Winter, T., Buso, D., Rosenberry, D., Likens, G., Sturrock Jr., A., and Mau, D.: Evaporation determined by the energy-budget method for Mirror Lake, New Hampshire, Limnol. Oceanogr., 48, 995–1009, 2003.
Wünnemann, B., Yan, D., and Ci, R.: Morphodynamics and lake level variations at Paiku Co, southern Tibetan Plateau, China, Geomorphology, 246, 489–501, 2015.
Xu, J., Yu, S., Liu, J., Haginoya, S., Ishigooka, Y., Kuwagata, T., Hara, M., and Yasunari, T.: The implication of heat and water balance changes in a lake basin on the Tibetan Plateau, Hydrol. Res. Lett., 3, 1–5, 2009.
Yang, K., He, J., Tang, W., Qin, J., and Cheng, C.: On downward shortwave and longwave radiations over high altitude regions: Observation and modeling in the Tibetan Plateau, Agr. Forest Meteorol., 150, 38–46, https://doi.org/10.1016/j.agrformet.2009.08.004, 2010.
Yu, S., Liu, J., Xu, J., and Wang, H.: Evaporation and energy balance estimates over a large inland lake in the Tibet-Himalaya, Environ. Earth Sci., 64, 1169–1176, 2011.
Yu, W., Yao, T., Tian, L., Ma, Y., Wen, R., Devkota, L., Wang, W., Qu, D., and Chhetri, T. B.: Short-term variability in the dates of the Indian monsoon onset and retreat on the southern and northern slopes of the central Himalayas as de-termined by precipitation stable isotopes, Clim. Dynam., 47, 159–172, 2016.
Zhang, G., Yao, T., Xie, H., Zhang, K., and Zhu, F.: Lakes' state and abundance across the Tibetan Plateau, Chinese Sci. Bull., 59, 3010–3021, 2014a.
Zhang, G., Yao, T., Xie, H., Qin, J., Ye, Q., Dai, Y., and Guo, R.: Estimating surface temperature changes of lakes in the Tibetan Plateau using MODIS LST data, J. Geophys. Res.-Atmos., 119, 8552–8567, https://doi.org/10.1002/2014JD021615, 2014b.
Zhang, Q. and Liu, H.: Seasonal changes in physical processes controlling evaporation over inland water, J. Geophys. Res.-Atmos., 119, 9779–9792, https://doi.org/10.1002/2014JD021797, 2014.
Zhang, Y., Wu, Z., Liu, M., He, J., Shi, K., Wang, M., and Yu, Z.: Thermal structure and response to long-term climatic changes in Lake Qiandaohu, a deep subtropical reservoir in China, Limnol. Oceanogr., 59, 1193–1202, 2014.