the Creative Commons Attribution 4.0 License.
the Creative Commons Attribution 4.0 License.
 | 28 Apr 2021
Evapotranspiration in the Amazon: spatial patterns, seasonality, and recent trends in observations, reanalysis, and climate models
Jessica C. A. Baker
Luis Garcia-Carreras
Manuel Gloor
John H. Marsham
Wolfgang Buermann
Humberto R. da Rocha
Antonio D. Nobre
Alessandro Carioca de Araujo
Dominick V. Spracklen
Water recycled through transpiring forests influences the spatial distribution of precipitation in the Amazon and has been shown to play a role in the initiation of the wet season. However, due to the challenges and costs associated with measuring evapotranspiration (ET) directly and high uncertainty in remote-sensing ET retrievals, the spatial and temporal patterns in Amazon ET remain poorly understood. In this study, we estimated ET over the Amazon and 10 sub-basins using a catchment-balance approach, whereby ET is calculated directly as the balance between precipitation, runoff, and change in groundwater storage. We compared our results with ET from remote-sensing datasets, reanalysis, models from Phase 5 and Phase 6 of the Coupled Model Intercomparison Projects (CMIP5 and CMIP6 respectively), and in situ flux tower measurements to provide a comprehensive overview of current understanding. Catchment-balance analysis revealed a gradient in ET from east to west/southwest across the Amazon Basin, a strong seasonal cycle in basin-mean ET primarily controlled by net incoming radiation, and no trend in ET over the past 2 decades. This approach has a degree of uncertainty, due to errors in each of the terms of the water budget; therefore, we conducted an error analysis to identify the range of likely values. Satellite datasets, reanalysis, and climate models all tended to overestimate the magnitude of ET relative to catchment-balance estimates, underestimate seasonal and interannual variability, and show conflicting positive and negative trends. Only two out of six satellite and model datasets analysed reproduced spatial and seasonal variation in Amazon ET, and captured the same controls on ET as indicated by catchment-balance analysis. CMIP5 and CMIP6 ET was inconsistent with catchment-balance estimates over all scales analysed. Overall, the discrepancies between data products and models revealed by our analysis demonstrate a need for more ground-based ET measurements in the Amazon as well as a need to substantially improve model representation of this fundamental component of the Amazon hydrological cycle.
- Article
(3887 KB) - Full-text XML
-
Supplement
(3452 KB) - BibTeX
- EndNote


Evapotranspiration (ET) is the transfer of water from the land to the atmosphere through evaporation from soil, open water, and canopy-intercepted rainfall, as well as transpiration from plants. More than half of all water that falls as precipitation over land is recycled back to the atmosphere through ET (Schlesinger and Jasechko, 2014; Good et al., 2015; Jasechko, 2018). This essential hydrological process affects the partitioning of heat fluxes at the Earth's surface, causing local cooling, while providing moisture for precipitation, thereby sustaining the hydrological cycle (Jung et al., 2010; Wang and Dickinson, 2012; K. Zhang et al., 2016). Transpiration is the dominant component of terrestrial ET, and transpiration rates over tropical forests are among the highest in the world (Zhang et al., 2001; Jasechko et al., 2013; Good et al., 2015; Wei et al., 2017). In the Amazon, where tropical forest covers approximately 5.5×10⁶ km2, sap flux measurements from a site near Manaus showed that the transpiration contribution to ET increased from 40 % in the wet season up to 95 % in the driest part of the year (Kunert et al., 2017).
Amazon ET is essential for maintaining the regional hydrological cycle and sustaining a climate favourable for tropical rainforests (Salati and Vose, 1984; Eltahir, 1996; Eltahir and Bras, 1994; Nepstad et al., 2008; van der Ent et al., 2010; Zemp et al., 2014). Consequently, changes in ET have implications for local and regional climate (Spracklen et al., 2012; Silvério et al., 2015; Spracklen et al., 2018; Baker and Spracklen, 2019) and may impact the stability of the Amazon forest biome (Zemp et al., 2017b). Deforestation, which has seen a recent upsurge in the region (Barlow et al., 2020), causes reductions in ET, although the magnitude of the response is still not fully understood. Estimates based on in situ and remote-sensing data from the southern Amazon suggest that deforestation-driven ET reductions range from 15 % to 40 % in the dry season (von Randow et al., 2004; Da Rocha et al., 2009b; Khand et al., 2017; da Silva et al., 2019). Changes in the global climate are also affecting Amazon ET by increasing atmospheric demand for water vapour, resulting in positive ET trends since the 1980s (Zhang et al., 2015b; Y. Zhang et al., 2016; Pan et al., 2020). Over the next century, coupled climate models suggest that there may be large reductions in ET as plants reduce stomatal conductance in response to rising atmospheric CO2 (Skinner et al., 2017; Kooperman et al., 2018), leading to changes in the surface energy balance and atmospheric circulation that drive reductions in Amazon rainfall (Langenbrunner et al., 2019). To assess changes in ET over the Amazon and evaluate climate model credibility, reliable observations of ET are required. However, despite being integral to the health of the Amazon ecosystem, ET over this region remains a challenging variable to measure and quantify (Pan et al., 2020).
Several early studies used measurements of stable water isotopes to evaluate water recycling in the Amazon, as the isotope composition of transpired water is distinct from that of evaporated water (Salati et al., 1979; Victoria et al., 1991; Martinelli et al., 1996; Moreira et al., 1997). Such work first highlighted the predominance of transpiration over the Amazon, relative to continental areas with lower forest cover, such as Europe (Salati et al., 1979; Gat and Matsui, 1991). More recently, studies based on satellite retrievals of hydrogen isotopes in tropospheric water vapour have suggested that transpiration could be key in triggering convection during the Amazon dry-to-wet season transition (Wright et al., 2017), and that ET reductions in the 2005 drought caused a delay in the wet season onset in the following year (Shi et al., 2019). However, while isotopes can help to partition ET into its respective components, they cannot provide information about the absolute magnitude of the ET flux; thus, other methods are required to quantify ET.
Amazon ET can be quantified using a catchment-balance (i.e. water budget) approach, whereby ET is approximated as the difference between precipitation and runoff. Estimates of annual mean Amazon ET using this method range from 992 to 1905 mm yr−1 (mean mm yr−1; Marengo, 2006, and references therein), although part of this uncertainty is due to differences in the definition of the Amazon Basin extent. Historically, catchment-balance approaches have assumed that groundwater storage does not change over time, although more recent studies have been able to also account for changes in groundwater using terrestrial water storage anomalies measured by the Gravity Recovery and Climate Experiment (GRACE) satellites (i.e. Swann and Koven, 2017; Maeda et al., 2017; Sun et al., 2019). Swann and Koven (2017) estimated annual mean Amazon ET to be 1058 mm yr−1, which is towards the lower end of previous estimates. Constraining Amazon ET in this way is useful, although a whole-basin-scale analysis by definition does not capture spatial variation in Amazon ET. Maeda et al. (2017) used a water-balance approach to estimate ET in five Amazon sub-basins and found values ranging from 986 mm yr−1 in the Solimões Basin in the western Amazon to 1497 mm yr−1 in the northern Negro Basin. However, even this sub-basin-scale analysis is likely to mask finer-scale spatial heterogeneities in ET.
Direct, site-level measurements of ET can be obtained from eddy-covariance (EC) flux towers. During the 1990s, a network of towers was established in Brazil as part of the Large-Scale Biosphere–Atmosphere Experiment in Amazonia (LBA) research programme (see Keller et al., 2009, and references therein). ET measurements from these towers have provided valuable insights into the drivers of variability in Amazon ET and how ET varies over different temporal scales (da Rocha et al., 2004; Hasler and Avissar, 2007; Fisher et al., 2009; Restrepo-Coupe et al., 2013; Christoffersen et al., 2014). EC data have shown that surface net radiation is the primary control on seasonal Amazon ET over wet areas of the Amazon (precipitation above 1900 mm), while variation in water availability governs ET in the seasonally dry tropical forests in the south and southeast Amazon, towards the boundary with the Cerrado biome (da Rocha et al., 2009a; Costa et al., 2010). Despite these advances in understanding, it should be noted that EC measurements have an inherent degree of uncertainty, as measured turbulent heat fluxes do not sum to the total measured available energy (i.e. the energy balance closure problem; Foken, 2008; Wilson et al., 2002). Tropical forest LBA tower sites underestimated the total energy flux by 20 %–30 % (Fisher et al., 2009), indicating that part of the ET flux might have been missed. A study in western Europe also suggested that flux towers may underestimate ET over forests compared with ET from lysimeters and water-balance methods (Teuling, 2018). Variation in energy closure between flux tower sites also makes it difficult to make direct comparisons between absolute ET values measured in different locations, presenting a further challenge (da Rocha et al., 2009a). Finally, the spatial distribution of flux towers in South America is uneven, with no EC ET measurements currently available over large areas of the western and northern Amazon (see Fig. 1). Given the relatively high costs associated with setting up and running flux towers as well as the inaccessibility of much of the Amazon Basin, it is desirable to find alternative methods of monitoring ET over this region of remote tropical forest and elsewhere.
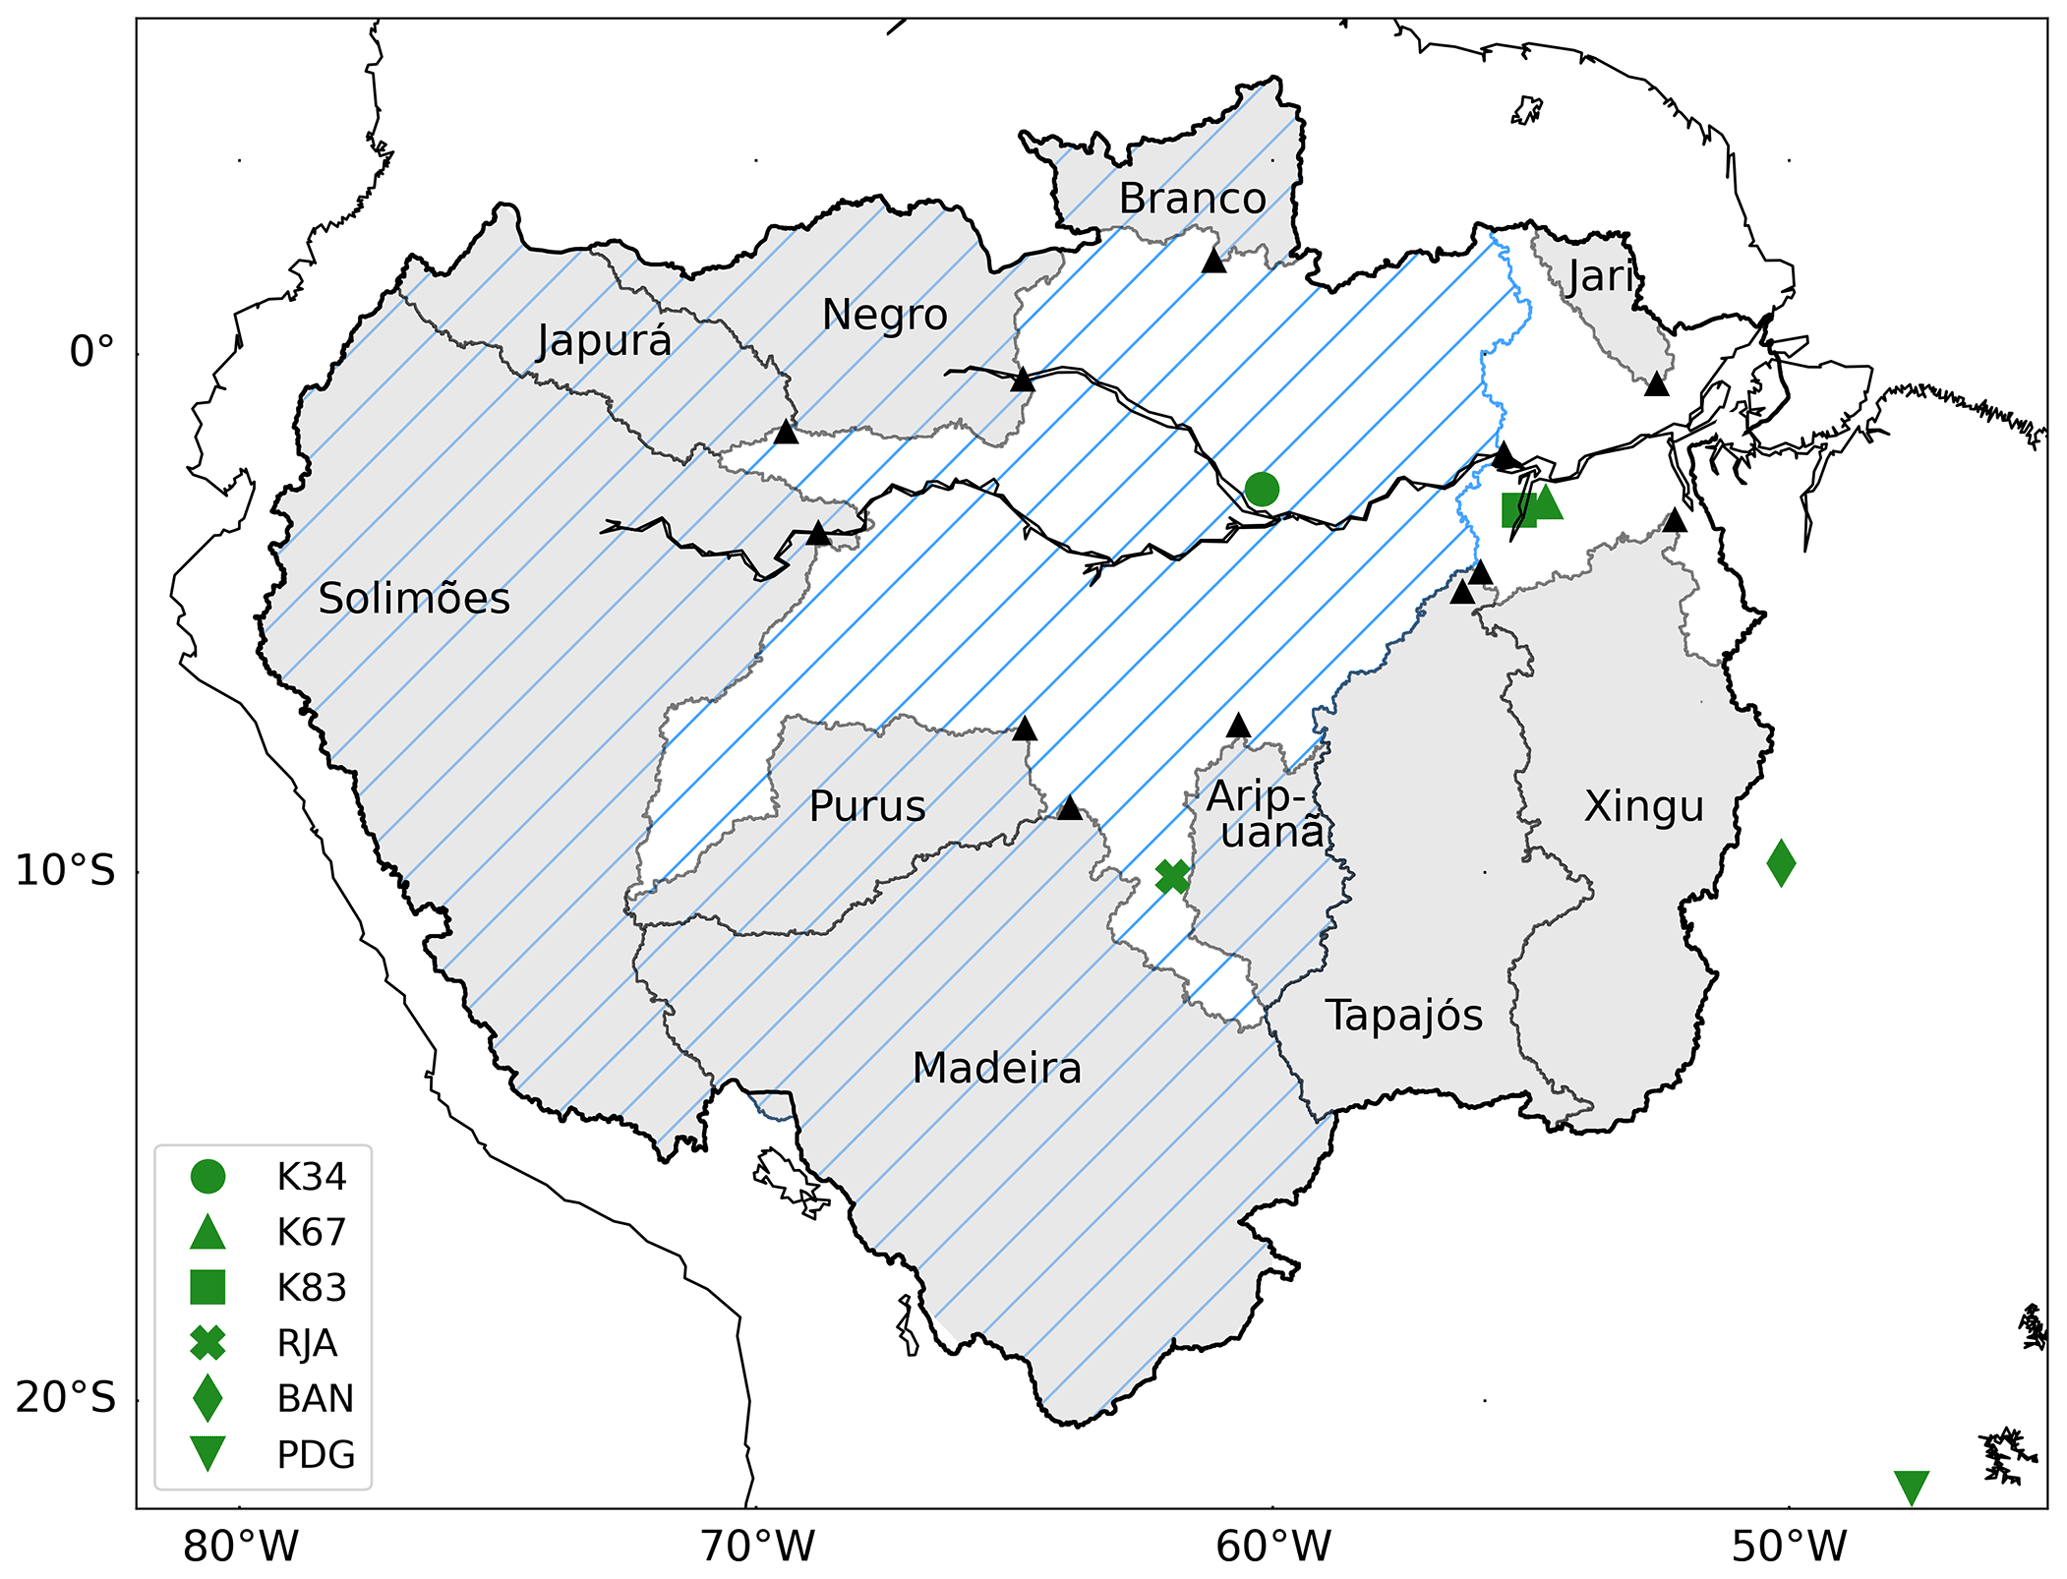
Figure 1Locations of river catchments and in situ data. Map showing the locations of the Amazon sub-basins (grey shaded regions) and the respective river-gauge stations (black triangles) used to estimate catchment-balance evapotranspiration (ET). Note that two stations in the Tapajós Basin were used (see Sect. 2.1). Blue hatching indicates the area drained by the Óbidos measurement station, which is used to represent “whole” Amazon ET. The locations of the LBA flux towers used in the study are also shown (green markers; see Table S3 for site information). The markers for K67 and K83 have been offset by 0.25∘ in longitude and latitude respectively to improve visibility.
Over the past few decades, ET products derived from Earth observation satellites have become available (e.g. Martens et al., 2017; Miralles et al., 2011; Mu et al., 2011, 2007; Zhang et al., 2010). These products offer ET estimates over previously unmonitored regions, such as the western Amazon, and therefore have potential to further our understanding of the controls and drivers of the Amazon hydrological cycle. Satellite-based ET products provide spatially and temporally homogeneous information at scales that are well suited for climate model evaluation. However, it is important to note that these products are not direct measures of ET, but rather ET is estimated from variables that satellites do measure (essentially radiation), other satellite retrievals (e.g. leaf area index, LAI), and, crucially, model-derived inputs. Thus, although often referred to as “observational datasets”, it is more accurate to consider satellite ET products as physically constrained land-surface models. Global-scale ET product comparisons have been conducted before – for example as part of the WACMOS-ET (WAter Cycle Multi-mission Observation Strategy – EvapoTranspiration) project (Michel et al., 2016; Miralles et al., 2016) as well as a more recent detailed evaluation that included multiple remote-sensing datasets and 14 land-surface models (Pan et al., 2020). While these studies made some comparisons between products over the Amazon, they did not include any “ground-truth” validation data over South America. Further work has evaluated satellite ET products over the Amazon at different spatial scales (e.g. de Oliveira et al., 2017; Maeda et al., 2017; Swann and Koven, 2017; Ruhoff et al., 2013; Paca et al., 2019; Sörensson and Ruscica, 2018; Wu et al., 2020), although a detailed analysis of spatial and temporal variation in remote-sensing ET products, evaluated against ET from catchment-balance analysis and flux towers, is currently lacking.
Finally, the representation of Amazon ET in coupled climate models is still underdeveloped, in part due to limited high-quality reference observations. To overcome uncertainties in benchmarking data, Mueller and Seneviratne (2014) utilised a synthesis of 40 observational, reanalysis, and land-surface model datasets (Mueller et al., 2013) to evaluate 14 models from Phase 5 of the Coupled Model Intercomparison Project (CMIP5). Their analysis showed that Amazon ET tended to be overestimated at the annual scale but underestimated from June to August. More recently it was observed that 28 out of 40 CMIP5 models misrepresented the controls on Amazon ET, with implications for future precipitation projections in the region (Baker et al., 2021b). Other assessments of CMIP5 models over the Amazon have found that the choice of reference ET dataset can have a large impact on model performance metrics (Schwalm et al., 2013; Baker et al., 2021a). Catchment-balance analysis accounting for changes in groundwater storage offers an alternative approach for directly quantifying Amazon ET and its associated uncertainty at the monthly timescale; however, to our knowledge, this has not previously been applied to evaluate climate models. With output from the sixth generation of CMIP models now available (Eyring et al., 2016), there is an opportunity to extend earlier evaluation studies by comparing simulated Amazon ET against catchment-balance estimates, thereby providing a first assessment of model performance over the Amazon.
The aim of this study was to summarise the current “state of the science” for Amazon ET in an attempt to determine what aspects of Amazon ET are well-understood, identify areas of remaining uncertainty, and provide a benchmark to evaluate the latest generation of coupled climate models. Given the challenges associated with estimating ET, we collated data from a variety of sources, expanding earlier studies by including “direct” estimates of ET from catchment-balance analysis and flux towers in our validation as well as deriving ET estimates for 10 Amazon sub-basins, permitting an assessment of controls on spatial variation in ET. Our results highlight substantial differences between ET products, while our catchment-balance analysis provides new insights into the spatial and temporal patterns of ET variability over the Amazon Basin.
To capture a complete spectrum of ET estimates over the Amazon, we combined data from catchment-balance analysis, flux towers, remote-sensing products, reanalysis, and coupled climate models. The origins of these datasets are described in the sections that follow.
2.1 Catchment-balance ET
Catchment-balance ET provides the closest approximation to a direct ET “measurement” over large spatial scales in this study. Using this approach, ET is calculated as the difference between terms in the water-budget equation that can be measured (within a margin of error), following Eq. (1):
where P is area-weighted, catchment-mean precipitation; R is river runoff from the basin; and is the area-weighted, basin-mean change in terrestrial water storage (S) over the basin with respect to time (t), all in units of mm per month. Catchment-balance ET was calculated, first as the simple difference between precipitation and runoff (climatological basin means only) and then using the more sophisticated approach that accounts for temporal variation in groundwater storage (Rodell et al., 2011; Long et al., 2014; Swann and Koven, 2017; Maeda et al., 2017; Sun et al., 2019).
The catchment-balance approach was used to estimate climatological annual mean ET for the Amazon Basin and 10 sub-catchments: the Solimões, Japurá, Negro, Branco, Jari, Purus, Madeira, Aripuanã, Tapajós. and Xingu catchments (Fig. 1). Temporal variation in catchment ET was analysed for the Amazon Basin only. Basin domains were constructed by aggregating sub-basin shapefiles that had previously been identified using a digital elevation model (Seyler et al., 2009), making sure to include all sub-basins upstream of the relevant river station.
Precipitation data came from the Climate Hazards Group InfraRed Precipitation with Station (CHIRPS) version 2.0 dataset, which combines data from satellites and rain gauges (Funk et al., 2015). CHIRPS has been validated against rain-gauge data from northeast Brazil, including four Amazon stations, and has been found to have mean bias and absolute error values of −3.6 % and 28.4 mm per month respectively (Paredes-Trejo et al., 2017).
Monthly mean river flow data were obtained from the Agência Nacional de Águas (ANA) database in Brazil (HidroWeb, 2018). To obtain runoff in millimetres per month, volumetric flow rates (m3 s−1) were divided by the catchment area (m2), scaled to the monthly time step by multiplying by the number of seconds in each month and multiplied by 1000 to convert to millimetres. To estimate “whole” Amazon ET, we used runoff measured at Óbidos, which drains approximately 77 % (Callède et al., 2008) of the Amazon Basin (Fig. 1). For the Tapajós catchment, runoff from Itaituba was gap-filled based on linear regression with data from the Buburé station, which is approximately 70 km upstream (R2=0.77, 15 data points in total). Details of the gauge stations used for the other basin river records are provided in Table S1 in the Supplement.
Terrestrial water storage data were derived from the Jet Propulsion Laboratory (JPL) RL06M Version 2.0 GRACE mascon solution, with coastline resolution improvement (CRI) filtering and land-grid scaling factors (derived from the Community Land Model, CLM) applied (Watkins et al., 2015; Wiese et al., 2016, 2019). This dataset, which has been processed to minimise measurement errors and optimise the signal-to-noise ratio, represents a new generation of GRACE solutions that do not require empirical post-processing to remove correlated errors and are, thus, considered to be more rigorous than the previous GRACE land water storage estimates based on spherical-harmonic solutions (Wiese et al., 2016).
To determine the change in water storage , in units of millimetres per month, we calculated the difference between consecutive GRACE measurements for each grid cell, divided by the time between measurements, as shown in Eq. (2):
where S represents the land water storage anomaly (in mm), n is the measurement number, and dt is the time between measurements [n] and [n−1] in months. Following this, we calculated the area-weighted, basin-mean for each catchment. Finally, to account for the uneven temporal sampling of GRACE data (due to battery management on the GRACE satellites), we used a linear spline to interpolate values to the same temporal grid as the precipitation and runoff data, i.e. one value per month for the period from May 2002 to December 2019.
Previous work has shown that GRACE is less sensitive at lower latitudes than at higher latitudes and may only be capable of detecting monthly changes in groundwater storage over regions larger than 200 000 km2 or seasonal changes over areas greater than 184 000 km2 (Rodell and Famiglietti, 1999). Three of the basins included in this analysis have areas smaller than these thresholds, namely Jari (49 000 km2), Branco (131 000 km2), and Aripuanã (138 000 km2, Table S1). However, we only computed climatological means over these basins, and the catchment-balance ET estimates were in excellent agreement with ET calculated as the difference between precipitation and runoff (r=0.997, p<0.001; Fig. S1 in the Supplement). Therefore, we have confidence that our results for these basins were not biased by the inclusion of GRACE in the calculations.
For the Amazon Basin only, we calculated catchment-balance ET at the monthly timescale. We estimated the relative uncertainty of our ET estimates (υET) by propagating errors in each of the terms of the water-budget equation (Rodell et al., 2011), following Eq. (3):
where σP, σR, and represent the absolute uncertainties in P, R, and respectively. Errors in precipitation were estimated as the random error (σP_random) plus the systematic error (σP_bias), combined in quadrature. Random errors were calculated following Eq. (4), from Huffman (1997):
where is the climatological mean precipitation over the basin, H is a constant (1.5), p is the frequency of non-zero rainfall, and N is the number of independent precipitation samples (defined as the number of Amazon pixels with finite P measurements in each month). For σP_bias, we used the value of −3.6 % estimated for CHIRPS from a validation analysis based on data from 21 meteorological stations in northeast Brazil (Table 4 in Paredes-Trejo et al., 2017). σR was estimated as 5 % of monthly river flow (Dingman, 2015). Uncertainty in groundwater storage was quantified by combining GRACE measurement errors and leakage errors (residual errors after filtering and rescaling) in quadrature. For these, we used Amazon-specific values from the literature (6.1 and 0.9 mm for measurement and leakage errors respectively) that had been calculated after CRI filtering and CLM scaling factors had been applied (Table 1 in Wiese et al., 2016). Finally, as values were calculated using data from two consecutive months, groundwater error values were multiplied by to obtain (e.g. Maeda et al., 2017). We calculated a mean υET value of 16.1 % (standard deviation =9.2 %) for Amazon catchment-balance ET (Fig. S2). At the monthly timescale, the and precipitation terms were found to be the dominant sources of uncertainty ( mm, σP=6.8 mm), followed by runoff (σR=4.9 mm; Table S2). Seasonal and interannual time series of precipitation, runoff, and ET, and their associated errors, are shown in Figs. S3 and S4. Due to small interannual variation in (Fig. S4), climatological estimates of ET calculated with and without water storage estimates were similar (Figs. 1, 2). Data from August 2017 to June 2018 were removed due to anomalously low and possibly unreliable data over this period (Fig. S4c). We tested the sensitivity of our interannual trend analysis to the removal of these data points and found it had no statistically significant impact on the reported results.
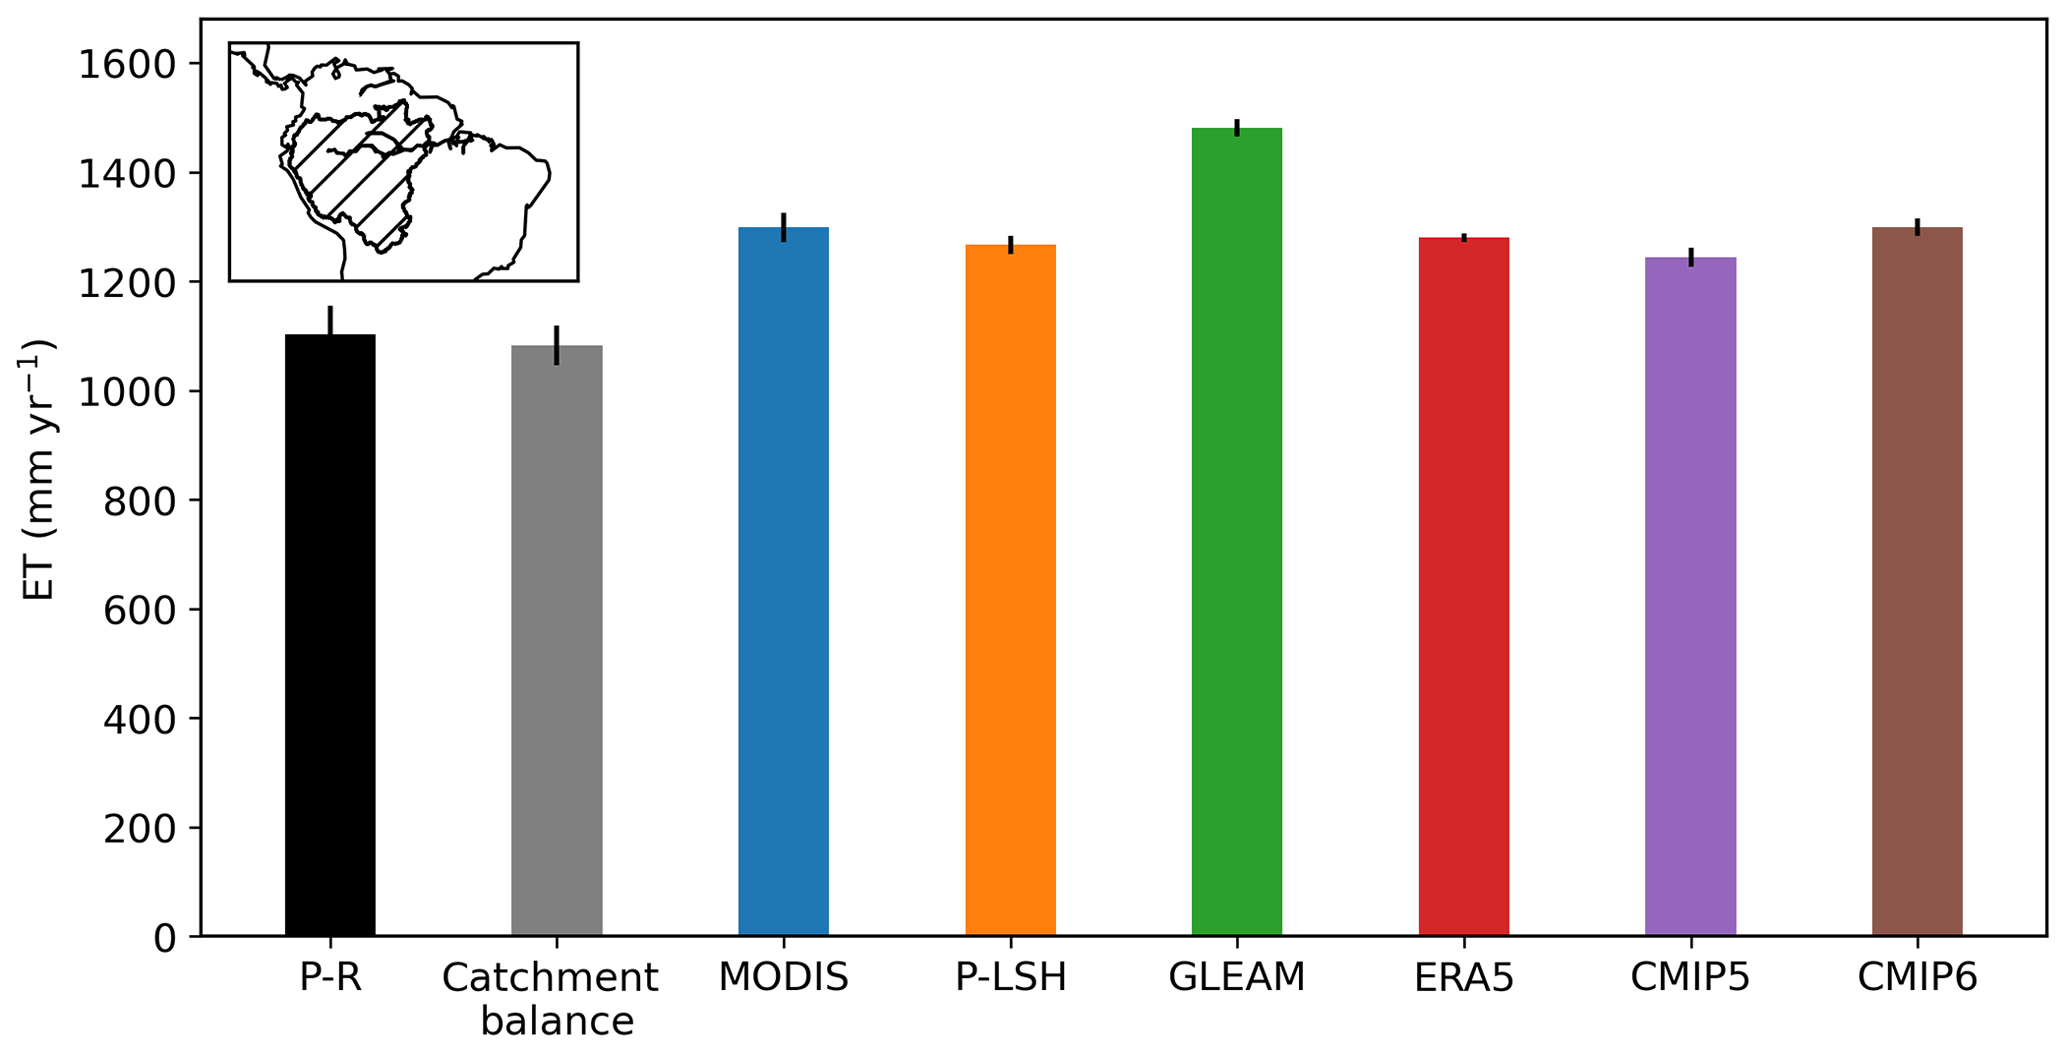
Figure 2Comparison of annual Amazon evapotranspiration (ET) estimates. Climatological mean Amazon ET estimated from water-balance approaches (precipitation minus runoff, P−R, and catchment-balance accounting for change in groundwater storage, ), satellites (MODIS, P-LSH, and GLEAM), ERA5 reanalysis, and climate models (CMIP5 and CMIP6). Data are from 2003 to 2013 with the exception of CMIP5, for which data are from 1994 to 2004. Error bars represent the interannual standard deviation for each dataset. For CMIP5 and CMIP6, the error bars represent the average standard deviation across all models. Data from satellites, reanalysis, and models were averaged over the region shown in the inset map for a direct comparison with the water-balance approaches.
Flux tower ET
To provide a ground-truth perspective, we used the 1999–2006 quality-assured, quality-controlled (QAQC), monthly flux tower ET observations from six flux towers in the LBA BrasilFlux database (Restrepo-Coupe et al., 2013; Saleska et al., 2013). These data have been processed to remove unreliable or low-quality measurements and can be downloaded from the LBA website: https://daac.ornl.gov/LBA/guides/CD32_Brazil_Flux_Network.html (last access: April 2019). We selected towers situated over land-cover types that were representative of the surrounding area, including towers in forest, savanna, and floodplain sites, but we excluded towers in pasture sites where the dominant regional land cover was forest (see Table S3). The site locations are shown in Fig. 1. We calculated ET in units of millimetres per month (kg m−2 per month) using Eq. (5):
where LE is the monthly mean tower measurement of latent heat flux (W m J s−1 m−2), scaled to joules per month per square metre (J per month m−2), and λ is the latent heat of vaporisation at 20 ∘C (2.453×10⁶ J kg−1).
In addition to the QAQC LBA data, we used a unique 19-year record (1999–2017) from the K34 flux tower site (2.6∘ S, 60.2∘ W) near Manaus, Brazil. Unlike the other tower sites, where data were only available for a few years (Table S3), this extended record could be used to derive a robust seasonal cycle in ET. Half-hourly data were averaged and scaled to obtain monthly means. To test the sensitivity of our results to missing data, we applied thresholds for the minimum number of hours or days required to calculate a mean value each month. Seasonal results were found to be relatively insensitive to minimum data requirement thresholds; thus, we decided to include all monthly ET measurements in our analysis (Table S4).
2.2 Satellite and reanalysis ET
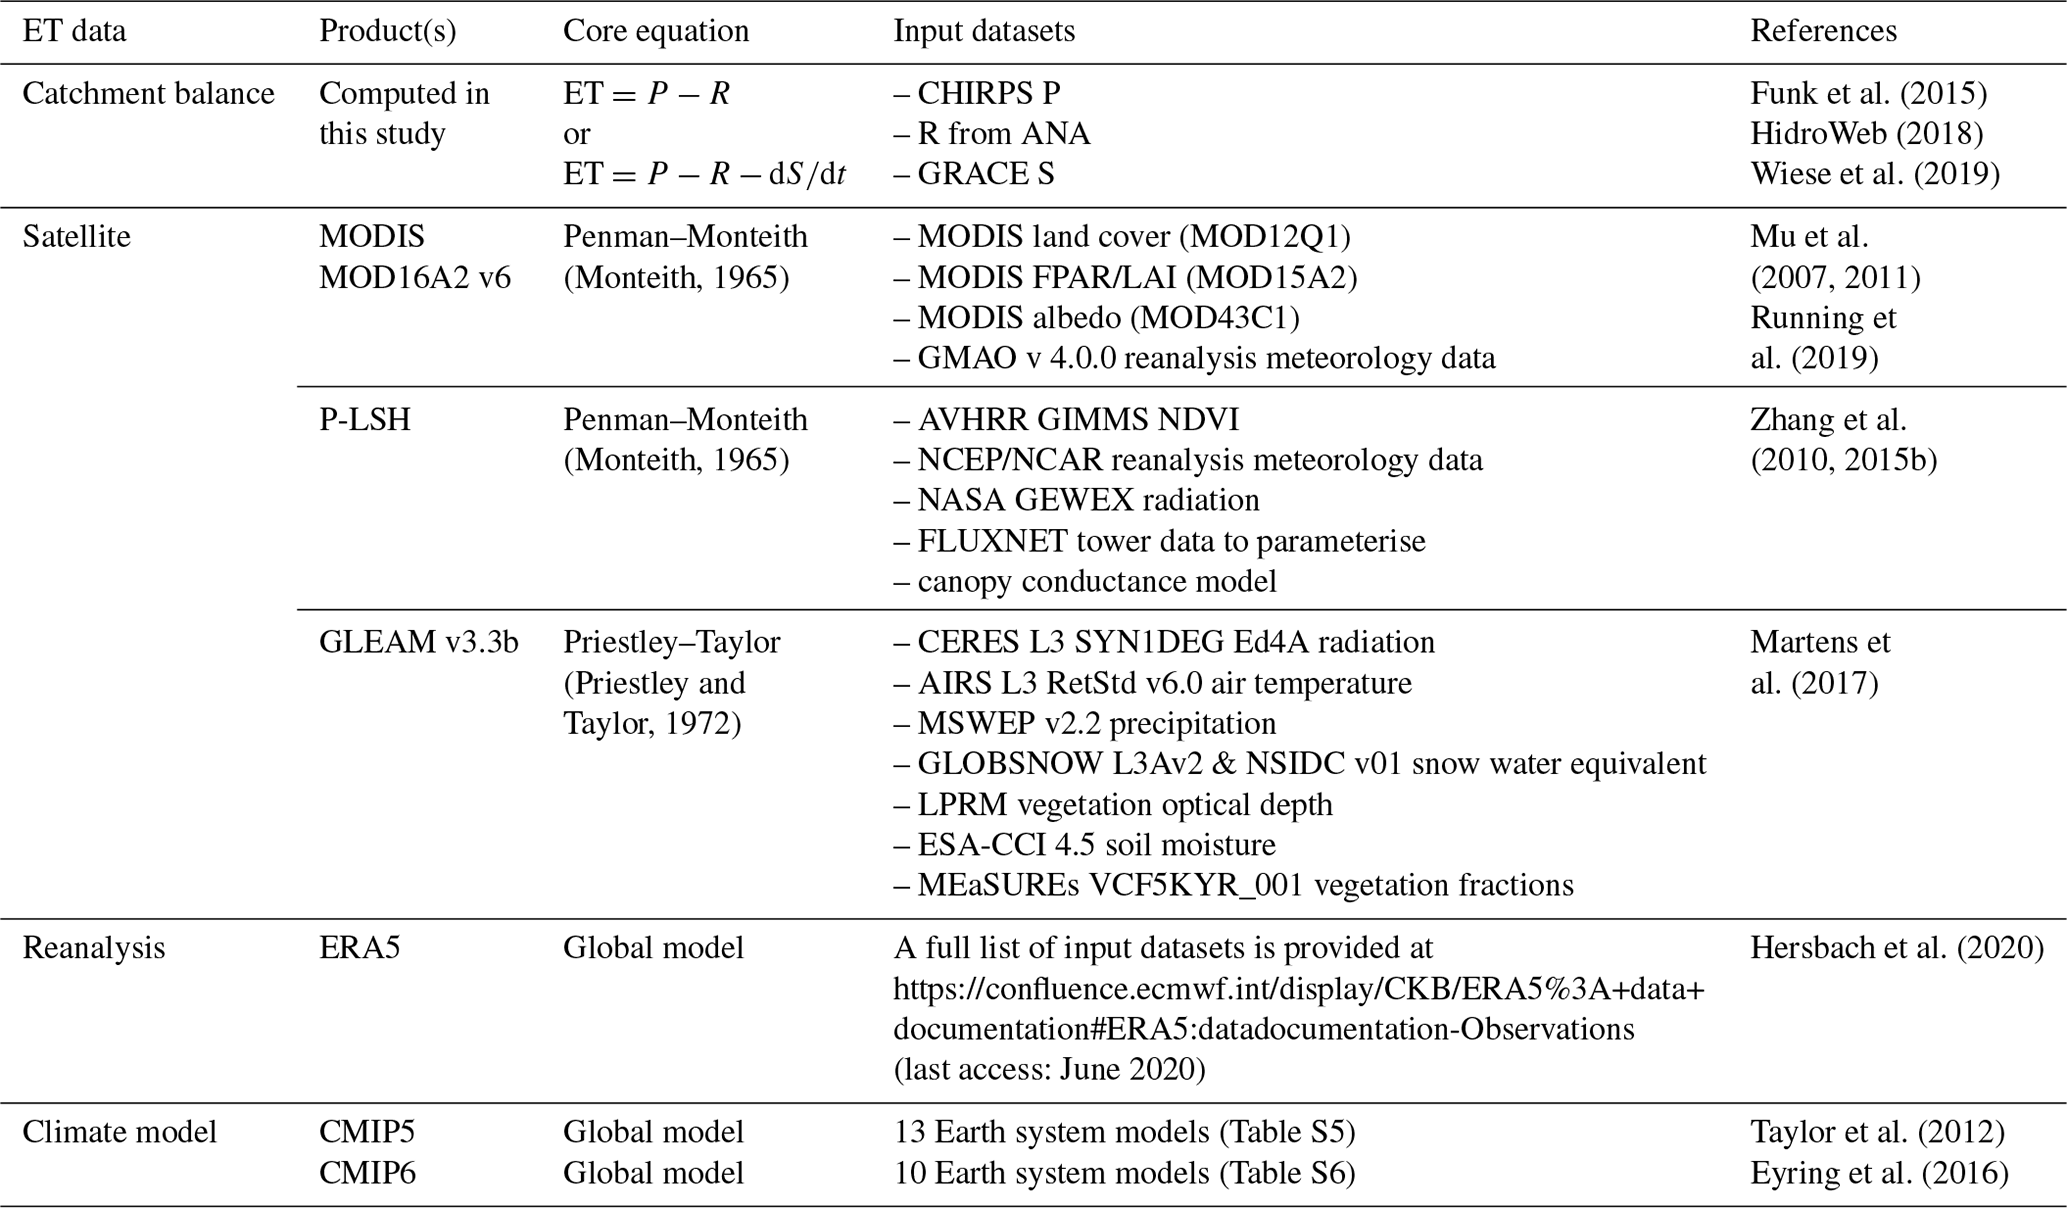
Three global, satellite-derived ET products and one reanalysis dataset were included in this study. The Moderate Resolution Imaging Spectroradiometer (MODIS) MOD16A2 Version 6 ET product (Mu et al., 2011, 2013; Running et al., 2019) was downloaded at a 500 m resolution from the NASA Earth Data website (https://earthdata.nasa.gov, last access: June 2020) for the period from 2001 to 2019. The MODIS ET algorithm is based on the Penman–Monteith equation (Monteith, 1965), which uses temperature, wind speed, relative humidity, and radiation data to approximate net ET, but it is modified by scaling canopy conductance by LAI. The sinusoidal 500 m MODIS tiles were merged and reprojected to a regular latitude–longitude grid (WGS84), using the Geospatial Data Abstraction Library software (GDAL/OGR Contributors, 2020) and resampling via weighted averaging. We also obtained ET estimates from the 8 km Process-based Land Surface ET/Heat Fluxes algorithm (P-LSH) product provided by the Numerical Terradynamic Simulation Group at the University of Montana (Zhang et al., 2010, 2015b) for the period from 1982 to 2013. This ET product is also based on the Penman–Monteith equation but uses an algorithm that incorporates remote-sensing normalised difference vegetation index (NDVI) data to estimate canopy conductance. Additionally, ET were retrieved from the satellite-constrained Global Land Evaporation Amsterdam Model (GLEAM) v3.3b dataset (Martens et al., 2017; Miralles et al., 2011) at . This version of GLEAM is based on satellite data only and is available for the 2003–2018 period. GLEAM is based on the Priestley–Taylor framework (Priestley and Taylor, 1972), which uses temperature and radiation to estimate potential ET (PET) and a hydrological model to convert PET to actual ET. Finally, ET data were retrieved for the 2001–2019 period from the European Centre for Medium-Range Weather Forecasts ERA5 reanalysis, which incorporates observations into a model to provide a numerical description of historical climate (Hersbach et al., 2020). As ET is not among the many observations that are assimilated in the reanalysis, ERA5 ET is independent of the other ET datasets analysed in this study. To permit a meaningful comparison between datasets, all satellite and reanalysis ET products were re-gridded to 0.25∘, analysed at a monthly timescale, and averaged over the common time period from 2003 to 2013 for those analyses based on temporal means. A summary of the equations and datasets used to derive the satellite ET products is presented in Table 1.
Table 1Details of the evapotranspiration (ET) datasets analysed in this study.
2.3 ET from coupled climate models
We obtained historical simulations of ET from models participating in CMIP5 and CMIP6 for the 1994–2004 and 2001–2014 periods respectively. We selected models that also provided precipitation, surface shortwave radiation, and LAI output, in order to investigate model processes controlling ET. In total, we used data from 13 CMIP5 models and 10 CMIP6 models (Tables S5, S6). Output was downloaded at a monthly resolution from the Centre for Environmental Data Analysis archives (http://archive.ceda.ac.uk, last access: August 2020), accessed via the JASMIN supercomputer. Where available, multiple realisations were used to derive an ensemble mean for each model, otherwise a single run was used. For basin-scale ET estimates, annual and seasonal climatological means were calculated for each model separately, using native-resolution data (see Tables S5 and S6), and then subsequently averaged across models. For CMIP5, climatologies were computed using data from 1994 to 2004 (the most recent 11 years of available data), whereas CMIP6 climatologies were estimated using the same period as for observations (i.e. 2003–2013). To visualise the spatial variation in ET over the Amazon and make comparisons with site-level ET measurements, multi-model ensemble means were also computed for CMIP5 and CMIP6. To do this, we re-gridded ET from each model to the same horizontal grid and then calculated the ensemble mean across all models. Although not all models simulate the level of detail provided by a grid (see Tables S5 and S6 for native resolutions), this resolution enabled us to extract data from each Amazon sub-basin with more accuracy than using a coarser grid.
2.4 Dataset intercomparison
We compared differences in ET magnitude, spatial variation, seasonality, and trends over the past 2 decades, identifying where estimates were in good agreement and where inconsistencies occurred. For annual comparisons, we computed climatological means over the Amazon Basin (the area drained by Óbidos; Fig. 2) and its sub-catchments (Fig. 3), using an area-weighted averaging approach. We applied a two-sample Kolmogorov–Smirnov test (Hodges, 1958) to identify whether monthly Amazon ET values from 2003 to 2013 from satellite, reanalysis, and climate models were drawn from the same distribution as the catchment-balance ET values. We examined how well each ET product was able to capture spatial variation in Amazon ET, using comparisons with catchment-balance ET estimates and flux tower measurements and by correlating basin-scale annual means with catchment-balance ET (Table S7). ET products were also evaluated at the seasonal timescale over the Amazon catchment and at the K34 flux tower site (Fig. 1). For comparisons between flux tower and gridded ET data, we selected data from the single grid cell containing the tower.
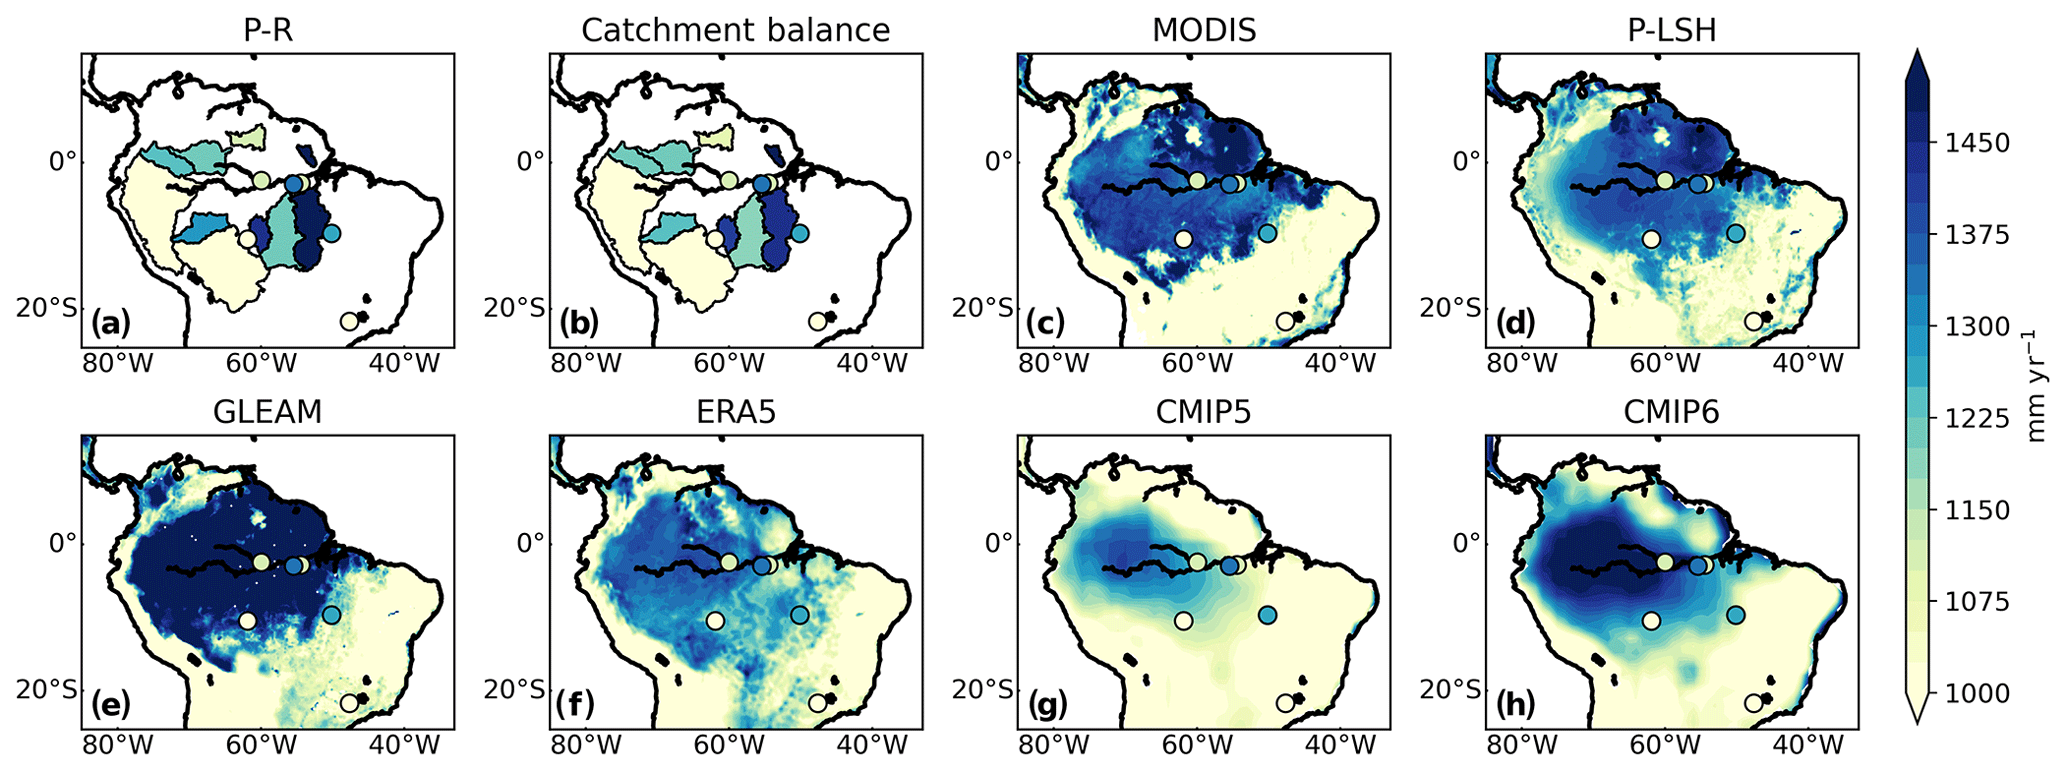
Figure 3Spatial variation in Amazon evapotranspiration (ET) from different approaches. Climatological mean annual ET from (a) differencing precipitation and runoff, (b) catchment-balance analysis accounting for change in groundwater storage, (c–e) satellite-based ET products, (f) ERA5 reanalysis, and (g, h) climate models. The coloured circles in each panel indicate ET measured at six flux tower sites. In areas where there were multiple tower sites in close proximity, circles were plotted with an offset of 0.5∘ to improve data visualisation. Data for panels (a–f) and (h) are from 2003 to 2013, data for panel (g) are from 1994 to 2004, and flux tower data are from the periods shown in Table S3. Data in panels (c–h) are plotted as contour maps with contours at 25 mm intervals from 1000 to 1500 mm yr−1. GLEAM data are presented with an alternative scale in Fig. S6.
All data were analysed over the 2003–2013 period with the exception of CMIP5, which was analysed over the 1994–2004 period. The Amazon hydrological cycle has intensified between these periods, with increases in basin-mean P (Gloor et al., 2013); therefore, we might expect CMIP5 ET to show some differences from other ET products. However, results from CMIP5 were largely consistent with results from CMIP6, showing that any differences caused by the analysis time period were smaller than the differences between the models and other types of ET data. We acknowledge that the period for evaluating Amazon ET is relatively short, although we were constrained by our reliance on satellite data and the availability of climate model output.
We also analysed linear trends in Amazon Basin ET, using data averaged across all months (annual), the wettest 3 months (January–March, JFM), and the driest 3 months (July–September, JAS) over the past 2 decades using ordinary least squares regression. Years with fewer than 10 months of data were excluded from the annual time series (2017 and 2018), and years with any missing months in JFM or JAS were excluded from the wet and dry season time series (2017 in JAS only). Trends were analysed over the time period common to all datasets (2003–2013) and across all years with available data for each dataset.
2.5 Investigating controls on Amazon ET
To better understand differences between ET products, we analysed relationships with potential drivers of ET, including precipitation, surface radiation, and LAI. Satellite-based ET estimates were compared with precipitation from CHIRPS, radiation from CLARA-A1 (CLoud, Albedo and RAdiation dataset, AVHRR-based, version 1; Karlsson et al., 2013), and LAI from the quality-controlled MODIS MOD15A2H Collection 6 (C6) product provided by Boston University (Myneni et al., 2015; Yan et al., 2016a), which were all re-gridded to . MODIS LAI has been shown to perform relatively well against ground-based LAI measurements (R2=0.7–0.77), although uncertainty regarding the validity of high LAI values (>4 m2 m−2), such as those that occur over the Amazon, is larger due to there being few ground measurements and the satellite reflectance signal reaching saturation over dense canopies (Yan et al., 2016b). Furthermore, the satellite-based MODIS ET product incorporates MODIS LAI (Table 1); thus, these datasets are not fully independent of one another. CLARA-A1 radiation is independent of the ET datasets evaluated in this study and is estimated to have an accuracy of ≤10 W m−2, although few validation measurements were available over South America and none were available in the Amazon region (Karlsson et al., 2013). Thus, there is some uncertainty in the accuracy of these satellite products over the Amazon that must be considered when interpreting the results. Reanalysis and model ET were compared with reanalysis and model variables respectively. For ERA5, we used the “high vegetation” LAI field as the Amazon is predominantly covered with tropical forest, although repeating the analysis with “low vegetation” LAI made little difference to the results. For the K34 tower site, ET was compared against precipitation and radiation data only. Half-hourly measurements of precipitation and incoming radiation from the tower site were averaged and scaled to a monthly resolution, following the same procedures as applied to the ET data. Due to missing data in several years, climatological means and seasonal cycles for K34 were calculated using all data from 1999 to 2017.
We analysed controls on spatial variation in ET by comparing catchment-mean values against catchment means of precipitation, radiation, and LAI. As there were only 11 data points in this analysis (representing the Amazon and 10 sub-catchments), we also analysed the response of ET to spatial variation in its potential drivers at the grid-cell level, following a similar approach to Ahlström et al. (2017). This enabled us to better understand non-linear relationships between ET and its controlling variables. Mean annual ET values from all Amazon grid cells were binned by annual precipitation, radiation, and LAI using bin widths of 100 mm yr−1, 5 W m−2, and 0.2 m2 m−2 respectively. Bins with fewer than five data points were excluded from the analysis. Finally, to distinguish between the controls on seasonal variation in ET from the controls in interannual variation in ET, we analysed relationships between ET and possible driving variables at the climatological monthly timescale and at the interannual timescale. While this approach was useful to understand the relative importance of controlling variables at different timescales, it reduced the number of data points in each analysis such that statistical power was correspondingly low. This meant that when we did not detect a statistically significant signal then it could either be because there was no signal to detect or because the signal-to-noise ratio was too low. This should be taken into consideration when assessing the analysis of controls on Amazon ET reported here.
3.1 Comparing estimates of annual ET over the Amazon
Climatological annual Amazon ET estimates from water-balance approaches, satellite-based products, reanalysis, and two coupled-model ensembles are presented in Fig. 2. ET from catchment balance was the lowest of all estimates (mean ± standard deviation mm yr−1 for 2003–2013; Fig. 2, Table S7), which, given uncertainties, is indistinguishable from the value obtained from differencing precipitation and runoff (1102±53 mm yr−1). This confirms that the GRACE-observed changes in groundwater storage are relatively small over decadal timescales. Our mean annual catchment-balance ET estimate for the Amazon was very similar to that from a previous catchment-balance study (1058 mm yr−1), calculated over the same drainage region (drained by Óbidos) but based on different precipitation data and an alternative GRACE solution (Swann and Koven, 2017), suggesting that the approach is relatively robust. The area drained by Óbidos excludes the far eastern Amazon, which our spatial catchment-balance analysis revealed to have the highest annual ET across the basin, decreasing towards the west and south (Fig. 3a, b). This may explain why our catchment-balance annual Amazon ET value was towards the lower end of previous estimates (Marengo, 2006).
Annual Amazon ET from satellites, reanalysis, and coupled models was 15 %–37 % higher than catchment-balance ET, with GLEAM showing the largest bias (Fig. 2). With the exception of GLEAM, mean annual ET values from satellites, reanalysis, and coupled models were remarkably similar to one another (within 50 mm, or <4 %), with a mean bias of 18 % (relative to catchment-balance ET). ET from all of the products and models analysed showed statistically different distributions from catchment-balance ET (Kolmogorov–Smirnov test; Fig. S5a), tending to show a narrower range and fewer low ET values (Fig. S5b). This substantial and consistent overestimation of annual Amazon ET across data products and coupled models highlights that even basic features of the Amazon hydrological cycle are still not well characterised.
MODIS and P-LSH captured a northeast to southwest gradient in ET across the basin that was evident in the water-balance approaches, showing the highest ET over the Guiana Shield in the north of the Amazon and decreasing southwest across the basin (Fig. 3c, d). Catchment-mean ET values from these two products were strongly correlated with ET from the catchment-balance approach across the 11 basins analysed in this study (r=0.84, p<0.01 and r=0.82, p<0.01 for MODIS and P-LSH respectively), although spatial variability was weaker and interannual variability was also strongly underestimated (Fig. S7, Tables 2 and S7). Flux tower ET measurements, although spatially limited, appear to show an east–west gradient in Amazon ET, with the highest annual values over forest and seasonally flooded sites in the east of the basin (coloured circles in Fig. 3). However, the gradient in tower data should be interpreted with some caution, as variation in energy-balance closure between sites will affect the absolute ET values (da Rocha et al., 2009a; Fisher et al., 2009). Furthermore, two nearby towers in the northeast Amazon showed a clear difference in mean annual ET (K67 and K83), likely due to being located on different land-cover types (primary forest and selectively logged forest respectively; Table S5). ET from GLEAM, which exceeded 1400 mm yr−1 over much of the Amazon, showed a north–south ET gradient (Fig. 3e, see Fig. S6 for an alternative scale) and a positive, although not statistically significant, correlation with catchment-balance estimates (r=0.51, p=0.11; Fig. S7, Table S7). Previous studies based on flux tower measurements (Fisher et al., 2009), water-budget analysis (Zeng et al., 2012; Maeda et al., 2017; Sun et al., 2019), and a combination of satellites and flux towers (Paca et al., 2019) showed similar north/northeast–south/southwest gradients in ET across the Amazon, in line with the catchment-balance results presented in Fig. 3.
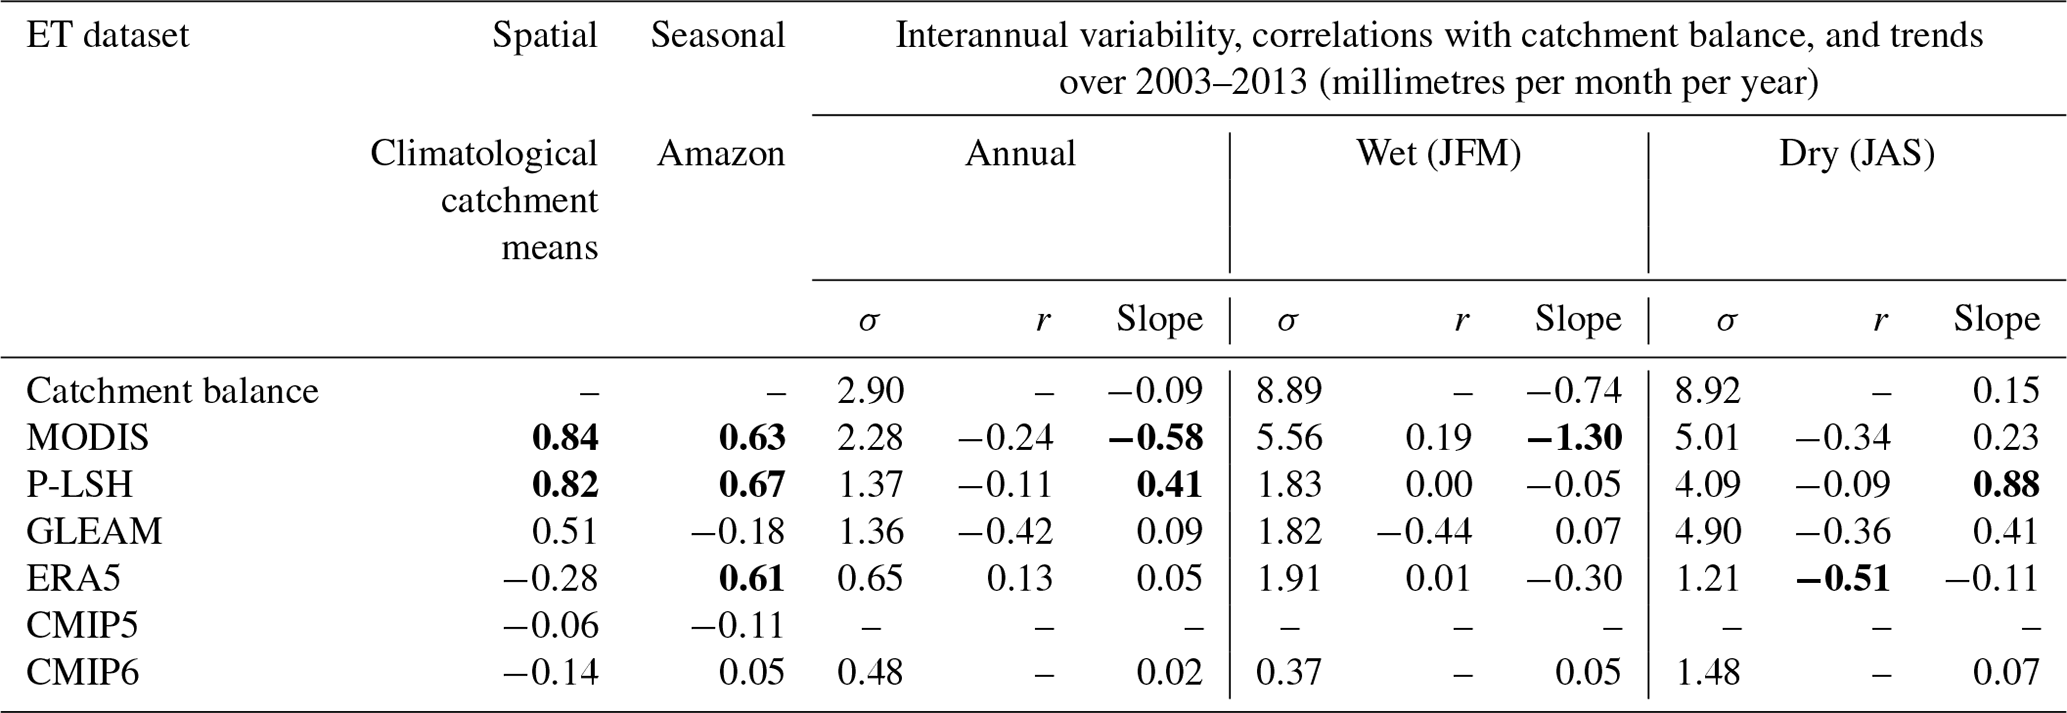
Table 2Summary of comparative statistics. Datasets listed in the table were correlated with catchment-balance evapotranspiration (ET) estimates (spatial, seasonal, and interannual), and interannual standard deviations (σ) were calculated over the 2003–2013 period using data standardised by the climatological mean over that period (in units of millimetres per month per year). Interannual analysis was performed using data from all months (annual), January to March (JFM), and July to September (JAS). Statistically significant (p<0.05) relationships are shown in bold. Note that CMIP data were not correlated at the interannual scale because model years would not be expected to align with real-world years.
ET from ERA5, CMIP5, and CMIP6 bore no relation to catchment-balance ET, simulating the highest ET values in the northwest of the basin and decreasing to the east (Fig. 3e–g). The CMIP models do not incorporate any observations and, therefore, might not be expected to perform as well as the other products analysed in this study. However, an analysis of Amazon precipitation in 11 CMIP5 models found that most were able to capture spatial patterns relatively well, including shifting distributions through the course of the seasonal cycle (Yin et al., 2013). The poor representation of spatial variation in Amazon ET in reanalysis and coupled models shown in Fig. 3 demonstrates a need for improvement of this key hydrological variable in these products.
To understand the drivers of spatial variation in Amazon ET, we compared catchment-scale estimates against catchment means of precipitation, surface radiation, and LAI (Fig. 4). As there were only 11 data points in the analysis (representing the Amazon and 10 sub-catchments), statistical power was relatively low. However, we found that spatial variation in catchment-balance ET showed some indication of an influence from radiation (r=0.38, p=0.25; Fig. 4h) but not from precipitation (r=0.14, p=0.68; Fig. 4a) or LAI (r=0.06, p=0.87; Fig. 4o). This result tentatively suggests that spatial variation in radiation explains more of the spatial variability in ET across Amazon sub-catchments than other variables. None of the ET products and models analysed captured positive relationships between catchment-mean ET and radiation. ET from ERA5 and the CMIP ensembles instead showed negative associations with radiation (Fig. 4l–n) and, along with GLEAM ET, positive relationships with precipitation (Fig. 4d–g), indicative of water availability influencing the spatial variation in ET (Fig. 4d–g). These results confirm that the reanalysis and climate models analysed here struggled to capture spatial patterns in Amazon ET due to misrepresentation of the controlling drivers, specifically the relative importance of precipitation and net radiation. ET from ERA5 and the models also showed positive correlations between LAI and ET (Fig. 4s–u), which are not seen in the satellite observations. However, it should be noted that satellite LAI was generally slightly lower and showed less spatial variability than other LAI datasets over the Amazon (Fig. S8i–l), likely due to the satellite sensor being insensitive to variation in LAI over areas of dense tropical forest (Yan et al., 2016b; Myneni et al., 2002). This could hamper our ability to accurately assess the extent to which LAI influences spatial variation in ET.
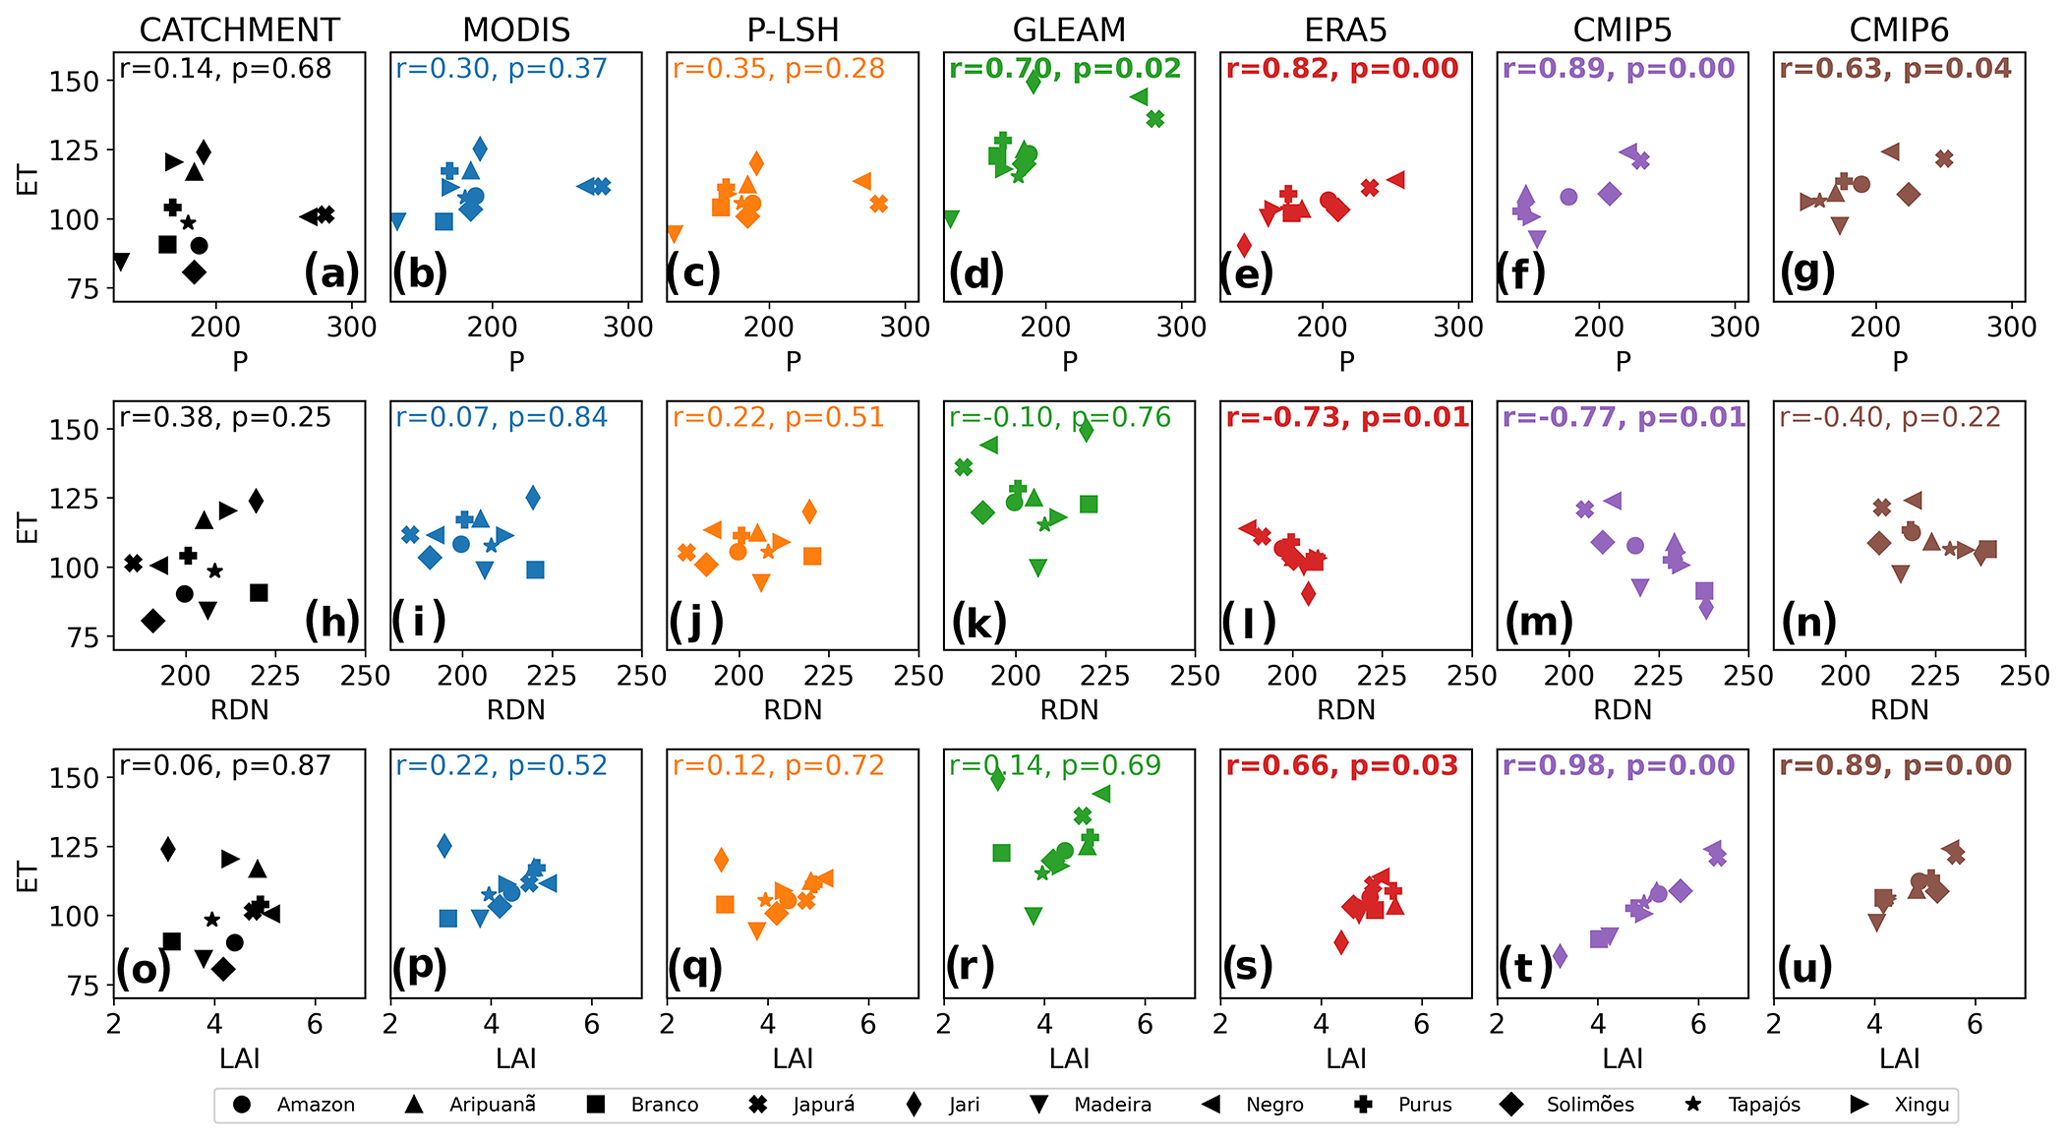
Figure 4Controls on spatial variation in Amazon evapotranspiration (ET). Annual mean ET (in millimetres per month) for the Amazon and 10 sub-catchments (Fig. 1) from catchment balance, satellites (MODIS, P-LSH, and GLEAM), ERA5 reanalysis, and climate models (CMIP5 and CMIP6), plotted against (a–g) precipitation (P, millimetres per month), (h–n) surface shortwave radiation (RDN, W m−2), and (o–u) leaf area index (LAI, m2 m−2). Satellite ET data are plotted against P from CHIRPS, RDN from CLARA-A1, and LAI from MODIS; ERA5 and climate model ET are plotted against ERA5 and model P, RDN, and LAI respectively. Data are from 2003 to 2013 with the exception of CMIP5, for which data are from 1994 to 2004. Note that the axes do not start at zero.
For further insights into the validity of Amazon ET products and the factors controlling ET, we evaluated ET responses to spatial variation in precipitation, radiation, and LAI at the grid-cell level (Fig. 5). Differences between ET products were most apparent in their responses to annual precipitation (Fig. 5a). Above 2000 mm yr−1, datasets followed three patterns of behaviour: GLEAM ET continued to increase to approximately 1600 mm yr−1; ET from MODIS, P-LSH, and ERA5 remained relatively stable at around 1300 mm yr−1; and CMIP5 and CMIP6 showed slight reductions in ET with further increases in precipitation. The precipitation threshold of 2000 mm yr−1 has previously been suggested as the level above which tropical forests are able to sustain photosynthesis during the dry season (Guan et al., 2015) and as the breaking point between productivity in the Amazon being water (<2000 mm yr−1) or radiation (>2000 mm yr−1) limited (Ahlström et al., 2017). Indeed, below 2000 mm yr−1 ET increased with increasing precipitation for all satellite, reanalysis, and model datasets (lines in Fig. 5a), indicating a water limitation on ET. The two catchments in the northwest Amazon where P exceeds 3000 mm yr−1, Japurá and Negro, were most closely aligned with the products that showed ET levelling off when precipitation exceeded 2000 mm yr−1 (i.e. MODIS, P-LSH, and ERA5), suggesting that these products represent the ET response to rainfall in very wet areas relatively well. For MODIS and P-LSH, this finding provides additional support that spatial patterns in Amazon ET correspond well with spatial variation in its controlling variables. In contrast, although ERA5 generally captured the correct ET response to precipitation (Fig. 5a), there are spatial differences between satellite and ERA5 precipitation datasets in Amazon regions with rainfall above 2000 mm yr−1 (Fig. S8a–d). This explains why relationships between ERA5 precipitation and ET differed at the catchment (Fig. 4e) and the grid-cell (Fig. 5a) scales. In the GLEAM model, the “stress factor” that is used to scale PET takes precipitation as an input variable to the soil module (Table 1), which, in turn, controls the amount of water available for ET (Martens et al., 2017). Our results indicate that the GLEAM model overestimates the dependence of ET on soil moisture in regions with high annual rainfall, highlighting a possible target for improvements to the GLEAM algorithm.
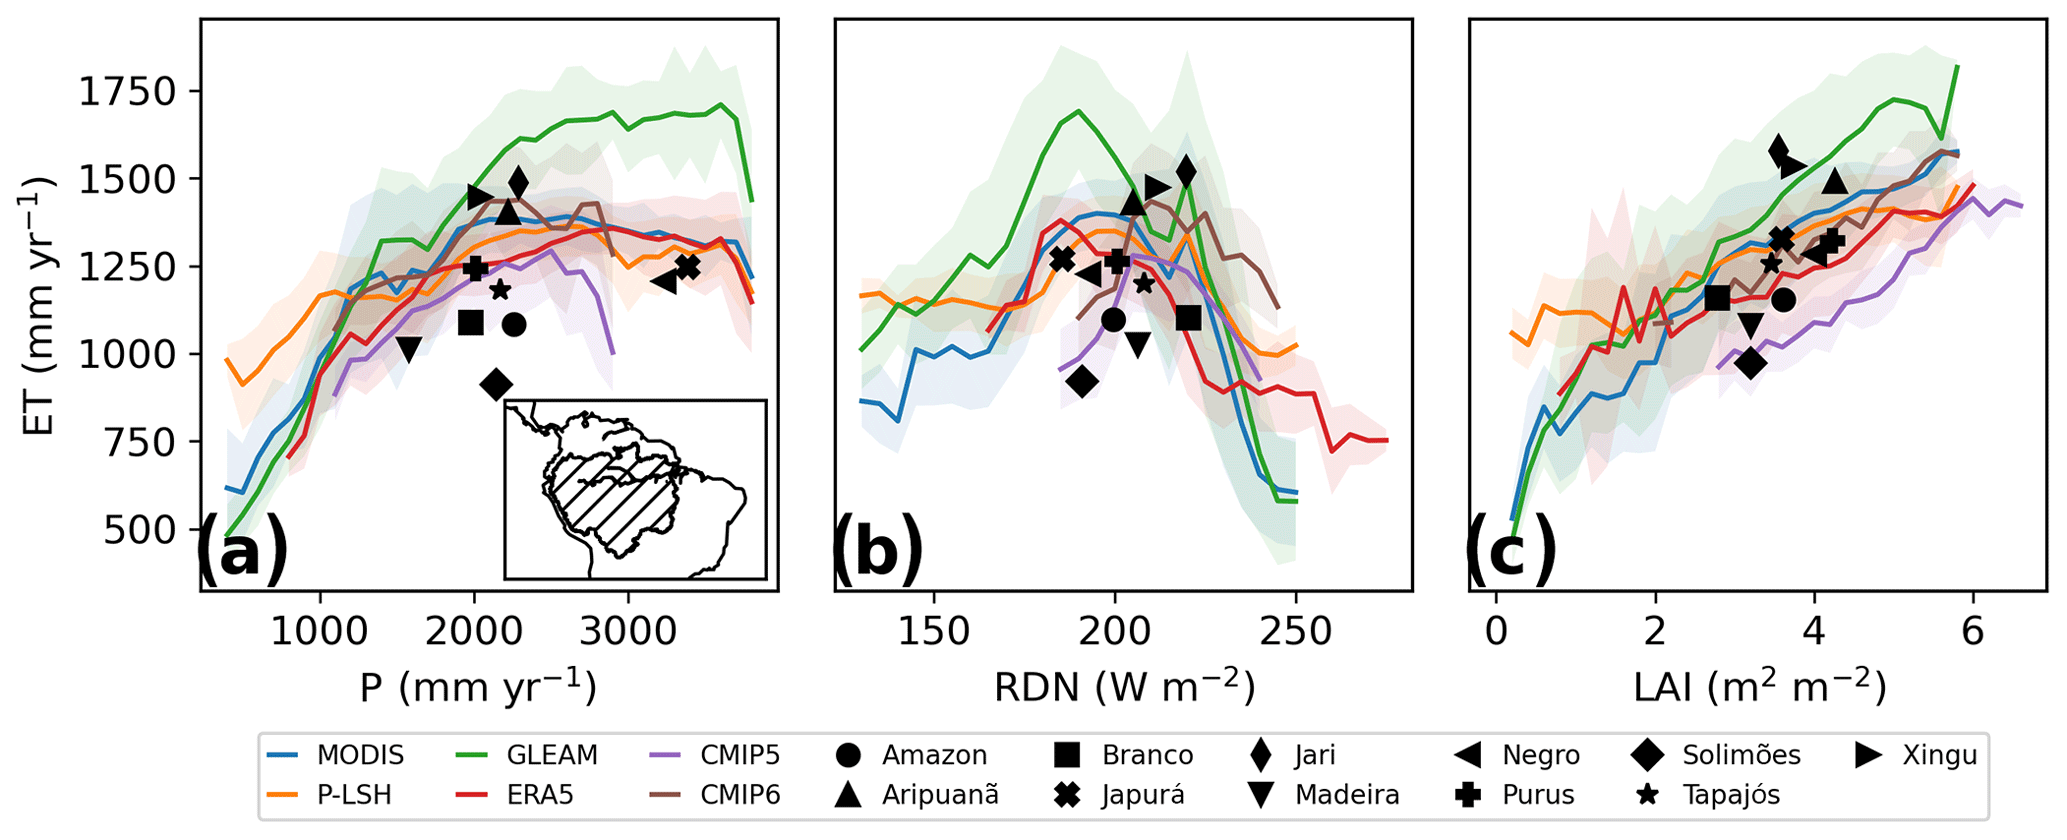
Figure 5Evapotranspiration (ET) response to spatial variation in controls. ET data from satellites (MODIS, P-LSH, and GLEAM), ERA5 reanalysis, climate models (CMIP5 and CMIP6), and catchment balance (black markers) are plotted against annual (a) precipitation (P), (b) surface shortwave radiation (RDN), and (c) leaf area index (LAI). Shading represents the standard deviation of the mean. Satellite ET data are plotted against P from CHIRPS, RDN from CLARA-A1, and LAI from MODIS; ERA5 and climate model ET are plotted against ERA5 and model P, RDN, and LAI respectively. Data were extracted from the Amazon region indicated in the inset map in panel (a). The locations of the catchments and tower sites are indicated in Fig. 1. Data are from 2003 to 2013 with the exception of CMIP5, for which data are from 1994 to 2004. Note that the axes do not start at zero.
Differences between ET products in their relationships with other variables were more subtle. ET dependence on radiation was broadly similar among datasets, showing a peak at approximately 200 W m−2 (Fig. 5b). This is consistent with low and high levels of radiation tending to correspond to high and low levels of precipitation respectively (Fig. S8a–h) and ET peaking at an optimum between the two. LAI–ET relationships were also fairly consistent, with ET increasing relatively linearly with increasing LAI (Fig. 5c). GLEAM generally tended to overestimate ET relative to LAI, whereas CMIP5 underpredicted ET for a given LAI value, in comparison with ET from other products and catchment-balance estimates. In general, radiation over the Amazon was substantially higher in the models compared with satellite and reanalysis datasets (Fig. S8a–h), and satellite-derived LAI values were uniformly lower than other estimates (Fig. S8a–h), likely due to signal saturation (Myneni et al., 2007).
3.2 Seasonal variation in Amazon ET
The mean seasonal cycle in Amazon ET was estimated from catchment-balance analysis, satellite, reanalysis, and model ET datasets for the whole Amazon Basin (Fig. 6). Amazon catchment-balance ET showed a strong seasonal cycle (standard deviation, σ=22 mm per month), with annual minima during April–June and maxima in August–October (Fig. 6). ET at the K34 tower site, located in the central Amazon, showed a similar seasonal pattern to that over the wider basin (Fig. S9), although intra-annual variation was weaker (σ=14 mm per month). Furthermore, we observed strong, positive correlations between ET and radiation for the Amazon Basin and the K34 tower site (r=0.93, p<0.001 and r=0.68, p<0.05 respectively; Figs. 7h, S10) as well as between ET and LAI for the basin (r=0.63, p<0.05; Figs. 7o, S11). These results agree with findings from da Rocha et al. (2009a), who made a detailed comparison of seasonal ET at seven flux tower sites in Brazil. They showed that ET increased during the dry season at the four wet tropical forest sites (including K34), contrasting with three transition-forest and savanna sites where ET followed seasonal soil moisture availability. The seasonal cycle in ET shown in Fig. 6 is consistent with studies reporting an increase in leaf flush driving Amazon greening in the dry season (Lopes et al., 2016; Saleska et al., 2016). Studies based on catchment-balance analysis (Swann and Koven, 2017), and satellite observations of vegetation photosynthetic properties (Guan et al., 2015) also showed that ET and forest productivity peak during the drier part of the year over the majority of the Amazon. Finally, our results are in agreement with those from Fisher et al. (2009), who identified radiation and NDVI as the primary and secondary controls on ET across the tropics based on analysis of flux tower measurements.
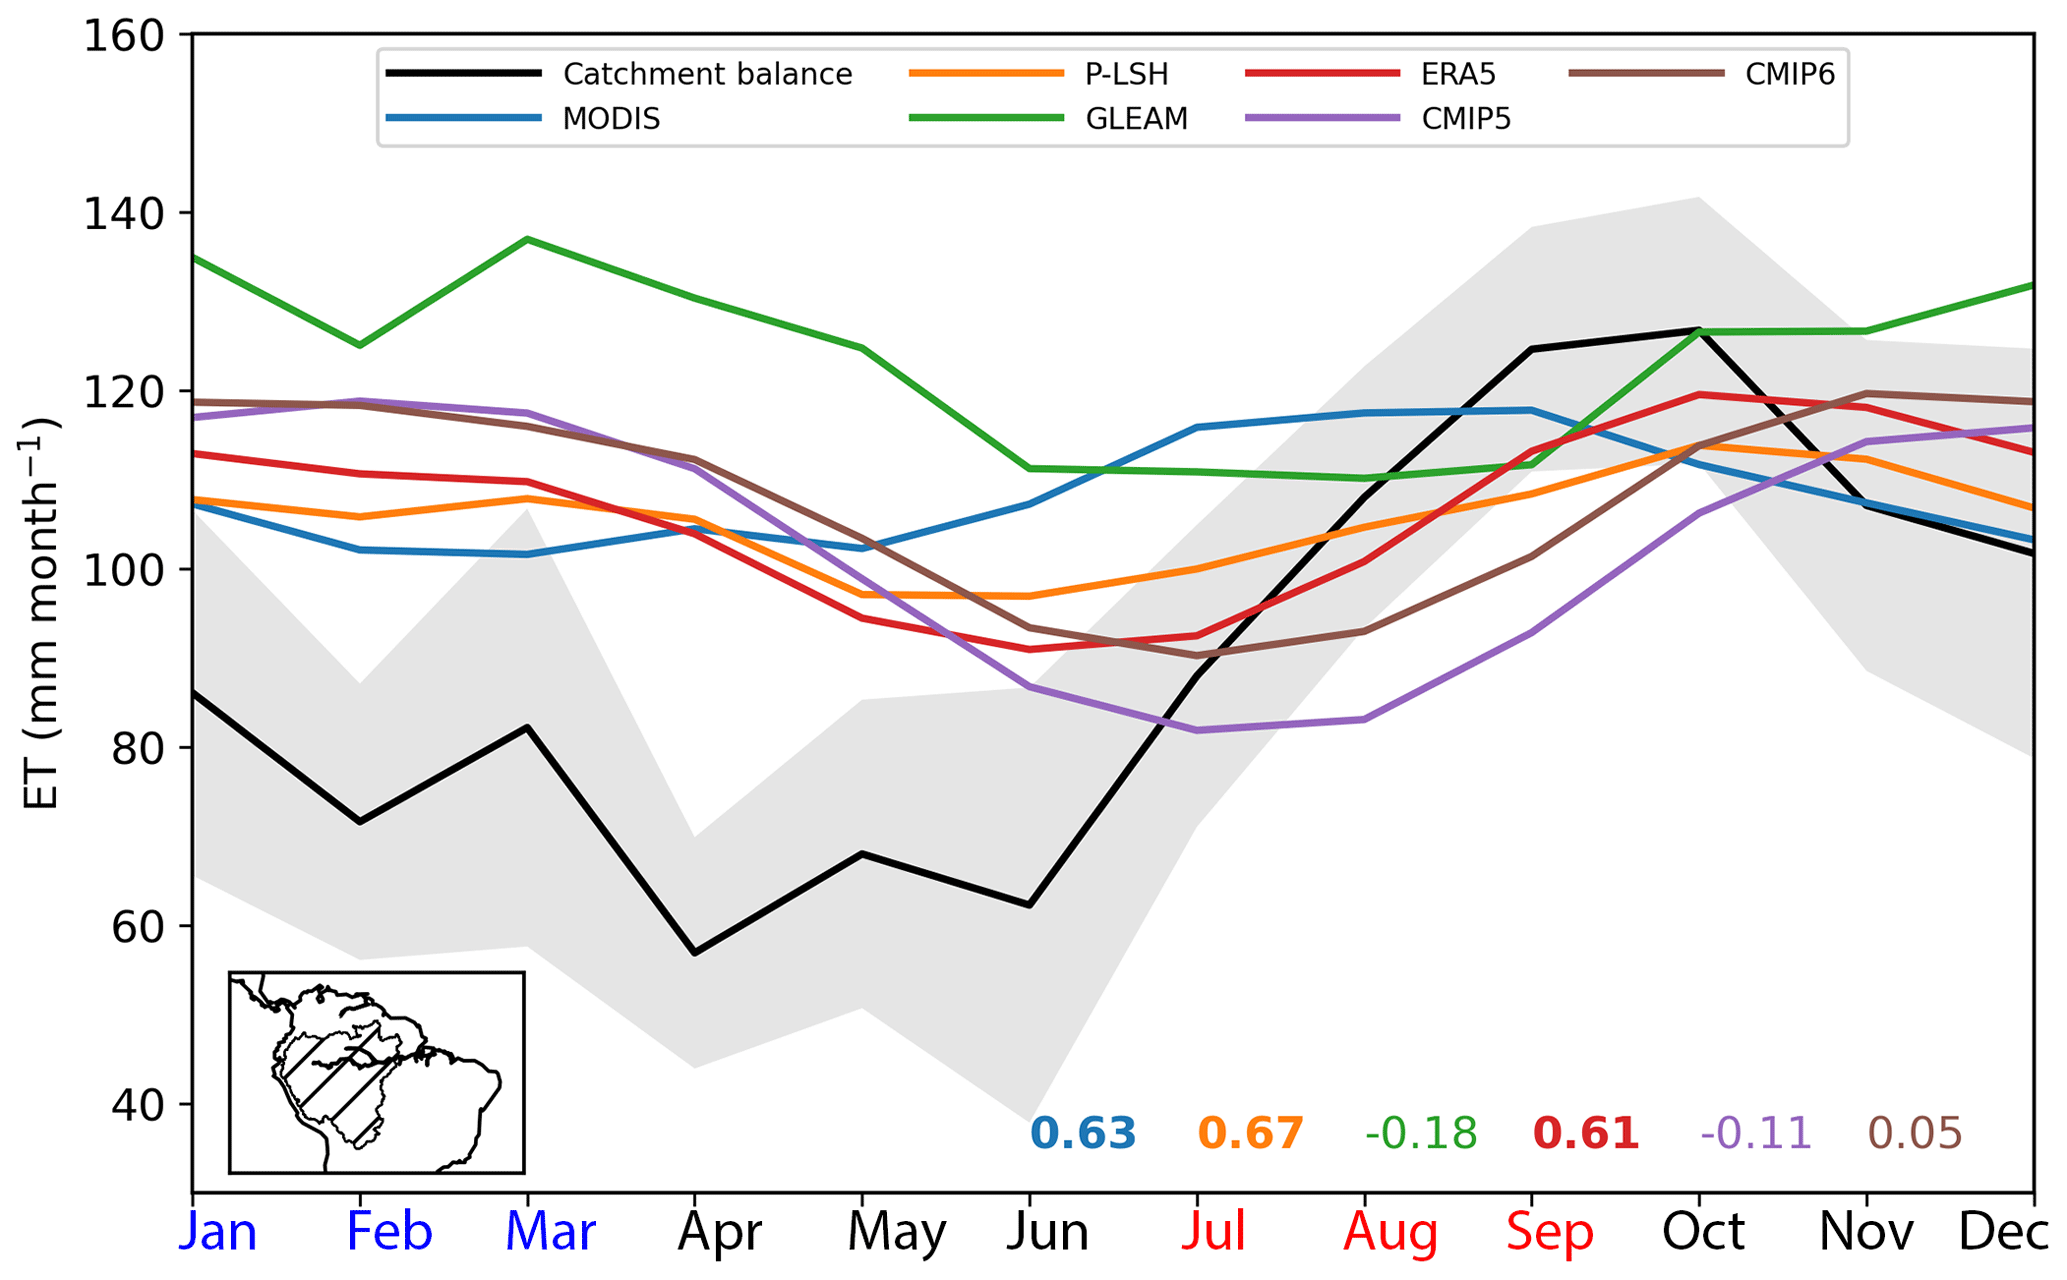
Figure 6Climatological seasonal cycles in evapotranspiration (ET) over the Amazon. Mean seasonal cycle in ET from catchment balance, satellites (MODIS, P-LSH, and GLEAM), ERA5 reanalysis, and climate models (CMIP5 and CMIP6) over the Amazon region drained by Óbidos (region indicated in the inset map). Shading represents the monthly standard deviation of the mean. Correlations with catchment-balance ET are shown, with bold numbers indicating statistical significance (p<0.05). Data are from 2003 to 2013 with the exception of CMIP5, for which data are from 1994 to 2004. On the x axis, the three wettest months are indicated in blue and three driest months are indicated in red. Note that the y axis does not start at zero.
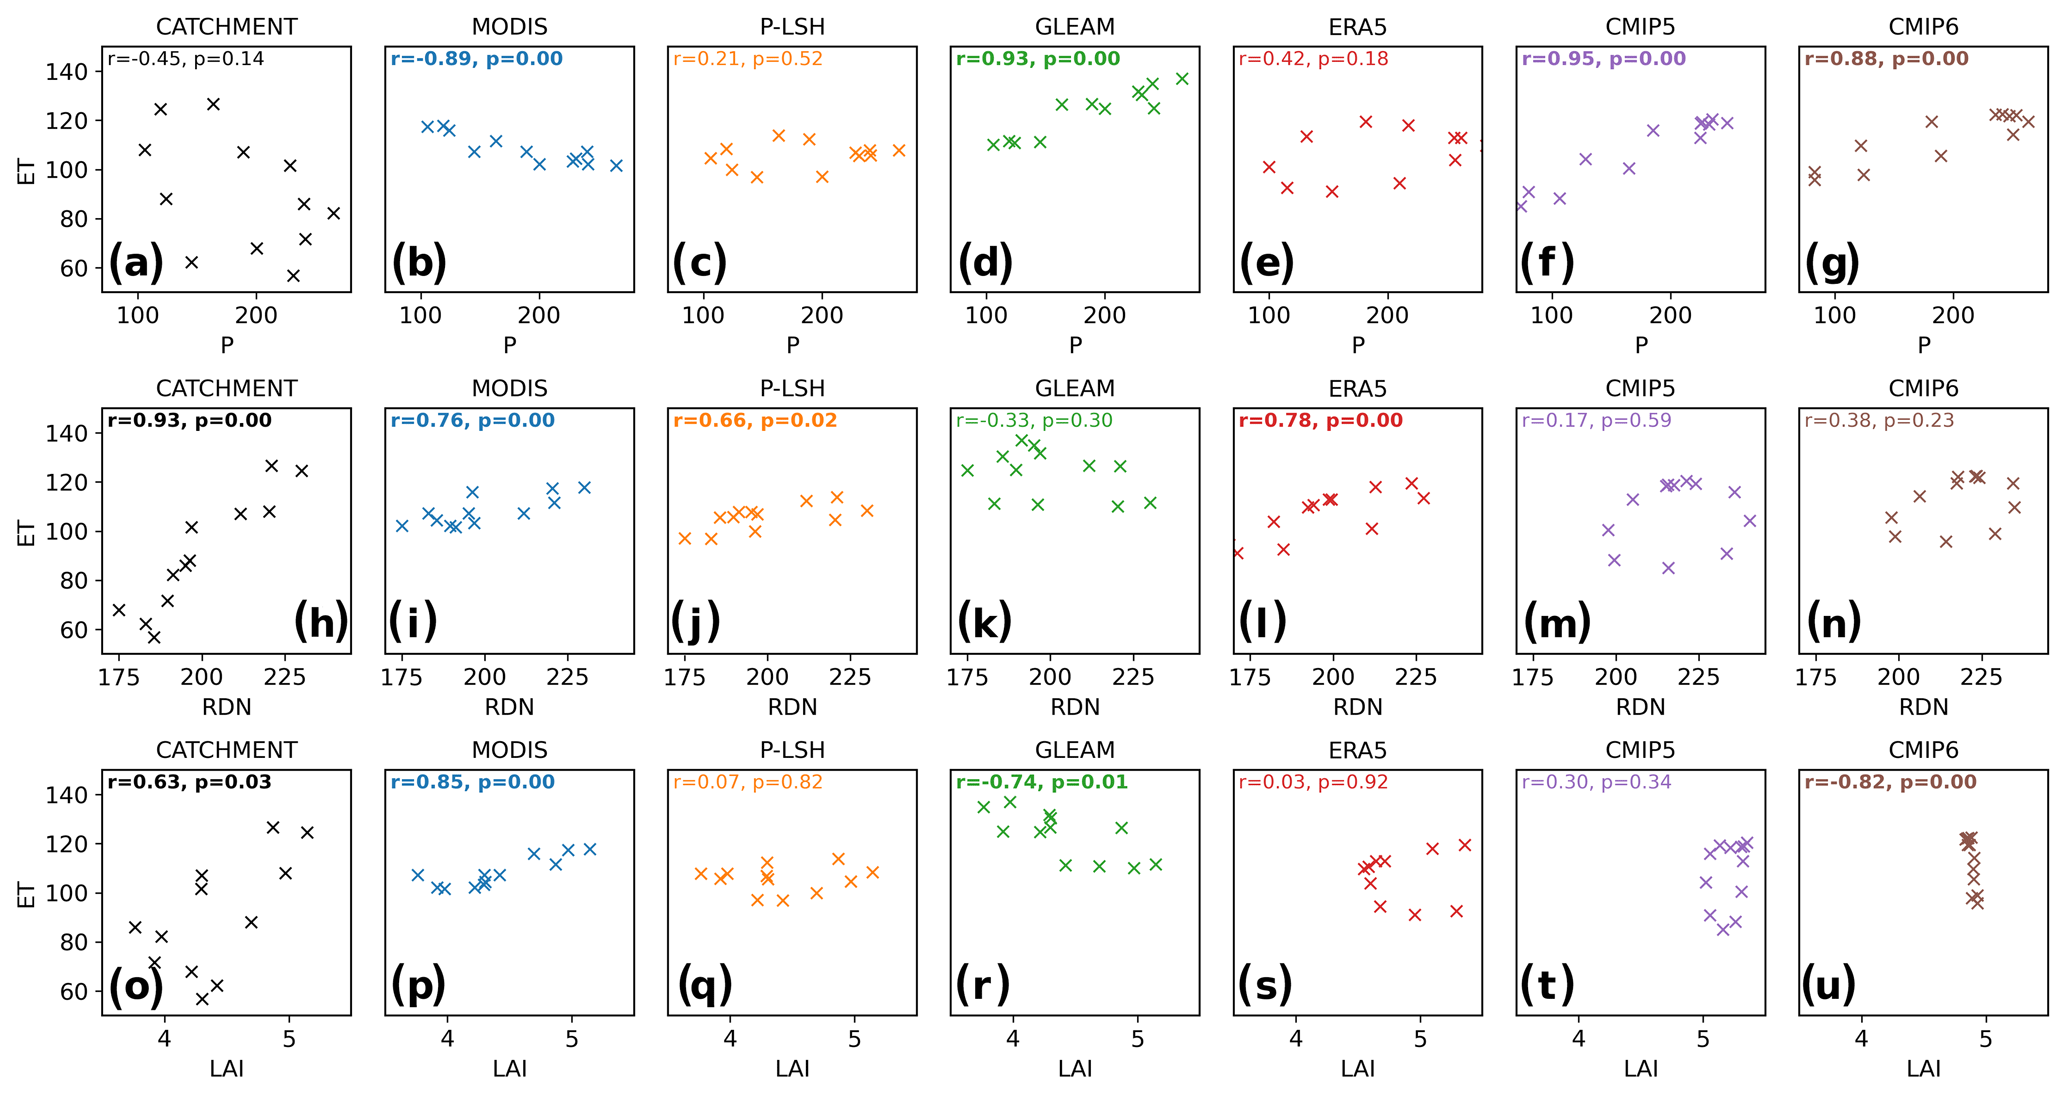
Figure 7Controls on seasonal variation in Amazon evapotranspiration (ET). Monthly ET (in units of millimetres per month) for the Amazon region drained by Óbidos (see Fig. 1) from catchment balance, satellites (MODIS, P-LSH, and GLEAM), ERA5 reanalysis, and climate models (CMIP5 and CMIP6) plotted against (a–g) precipitation (P, millimetres per month), (h–n) surface shortwave radiation (RDN, W m−2), and (o–u) leaf area index (LAI, m2 m−2). Satellite ET data are plotted against P from CHIRPS, RDN from CLARA-A1, and LAI from MODIS; ERA5 and climate model ET are plotted against ERA5 and model P, RDN, and LAI respectively. Data are from 2003 to 2013 with the exception of CMIP5, for which data are from 1994 to 2004. Note that the axes do not start at zero.
Monthly ET cycles from MODIS, P-LSH, and ERA5 correlated with Amazon catchment ET (r=0.61–0.67, p<0.05; Table 2, Fig. 6) and captured positive relationships with surface radiation (r=0.66–0.78, p<0.05; Fig. 7). However, despite representing the direction of seasonal fluctuations relatively well, these datasets underestimated the seasonal variability by 39 %–77 %, relative to catchment-balance ET (Fig. 6). Biases from catchment-balance ET were generally strongly positive from January to June and weakly negative in September and October. At K34, MODIS and ERA5 overestimated the seasonal ET range by 61 % and 28 % respectively, whereas P-LSH underestimated the range by 26 % (Fig. S9). With such poor representation of the magnitude of seasonal variability, and inconsistencies in the direction of amplitude biases, ET from these satellite and reanalysis datasets may be of limited use for assessing long-term changes in the seasonality of the Amazon hydrological cycle (Gloor et al., 2013) or for evaluating seasonal ET representation in coupled climate models.
ET from GLEAM, CMIP5, and CMIP6 neither correlated with seasonal catchment-balance Amazon ET nor captured the correct seasonal amplitude (Figs. 6, 7, Table 2). Instead, ET from these datasets followed the same seasonal cycle as precipitation, peaking during the wettest part of the year. A previous study comparing Amazon ET estimates derived using different methods also observed that climate model and reanalysis ET tended to follow the precipitation seasonal cycle, with annual ET minima in the dry season (Werth and Avissar, 2004). The authors suggested that this was due to a strong vegetation control on modelled ET due to downregulation of stomatal conductance in the dry season, concluding such a control to be as credible as a radiation control on Amazon ET. However, a subsequent study queried this assertion, citing evidence from flux towers as proof that vegetation controls on Amazon ET were secondary to environmental controls (Costa et al., 2004). Over the Congo, where ET follows the same seasonal cycle as precipitation, CMIP5 models were shown to capture the seasonality of ET but to overestimate the magnitude of the flux, particularly during the two wet seasons (Crowhurst et al., 2020). The results presented in Fig. 6 indicate a disconnect between our mechanistic understanding of the controls on seasonal Amazon ET based on catchment-balance analysis, and the algorithms used to predict ET in GLEAM and the CMIP models.
Northern and southern Amazon sub-basins were analysed separately, due to differences in the timing of the seasonal precipitation cycle above and below the Equator. Uncertainties in monthly ET estimates were higher over these areas than over the whole Amazon, although it was still possible to detect differences between catchment-balance ET and other datasets (Fig. S12). The seasonal cycle in catchment-balance ET was weaker in the north than in the south (σ=16 and 26 mm per month respectively), following the pattern of precipitation seasonality (σ=69 and 115 mm per month in northern and southern basins respectively). In general, satellite, reanalysis, and climate model ET related fairly well to seasonal catchment-balance ET in the northern Amazon (Fig. S12b) but showed much weaker relationships in the southern Amazon (Fig. S12c). The CMIP5 and CMIP6 models, which were unable to capture seasonal ET variation over the whole Amazon or southern Amazon, replicated month-to-month variation in ET over the northern Amazon well, although both model groups underestimated seasonal variability (Figs. 6, S12). MODIS, which captured seasonal ET over the whole Amazon (Fig. 6), performed especially poorly in the south, showing a negative relationship with catchment-balance ET (, p=0.06; Fig. S12b). These results suggest the ability of ET products to capture seasonal ET varies regionally, and a product that performs well over one region may not be reliable elsewhere. Finally, we note that relative uncertainties in ET estimated using the catchment-balance approach increase at smaller spatial scales, precluding a more in-depth assessment of seasonal ET over individual sub-basins.
3.3 Interannual variation and trend analysis
Interannual time series of Amazon ET from 2001 to 2019 for the whole year, the three wettest months (JFM, see Fig. S10), and the three driest months (JAS) are shown in Fig. 8. From 2003 to 2013, interannual variability (σ) in catchment-balance ET was 2.9 mm per month, or 3.2 % of the climatological mean. This value is comparable to the interannual variation in precipitation over the same period (σ=3.6 %), half the variation in runoff (σ=7.0 %), and represents around 10 % of the seasonal variation in Amazon ET (Fig. 6). With only a relatively short time series, controls on interannual variability were hard to detect, although radiation appeared to play a role (Fig. S13). Interannual variation was underestimated in ET from satellites, reanalysis, and climate models by up to a factor of 6 relative to catchment balance (Fig. 8a, Table 2). In JFM and JAS, ET variation was higher than at the annual scale (catchment balance σ=8.89 and 8.91 mm per month respectively) and similarly underestimated by other datasets (Fig. 8b, c, Table 2). Relationships between interannual catchment-balance ET and ET from satellites or reanalysis were generally poor (Table 2), and an especially high JFM catchment-balance ET recorded in 2016, coinciding with a severe El Niño event (Koren et al., 2018), was not captured by other ET products (Fig. 8b). ERA5 and CMIP6 showed the least interannual variation, indicating poor model representation of the factors influencing inter-year changes in ET.
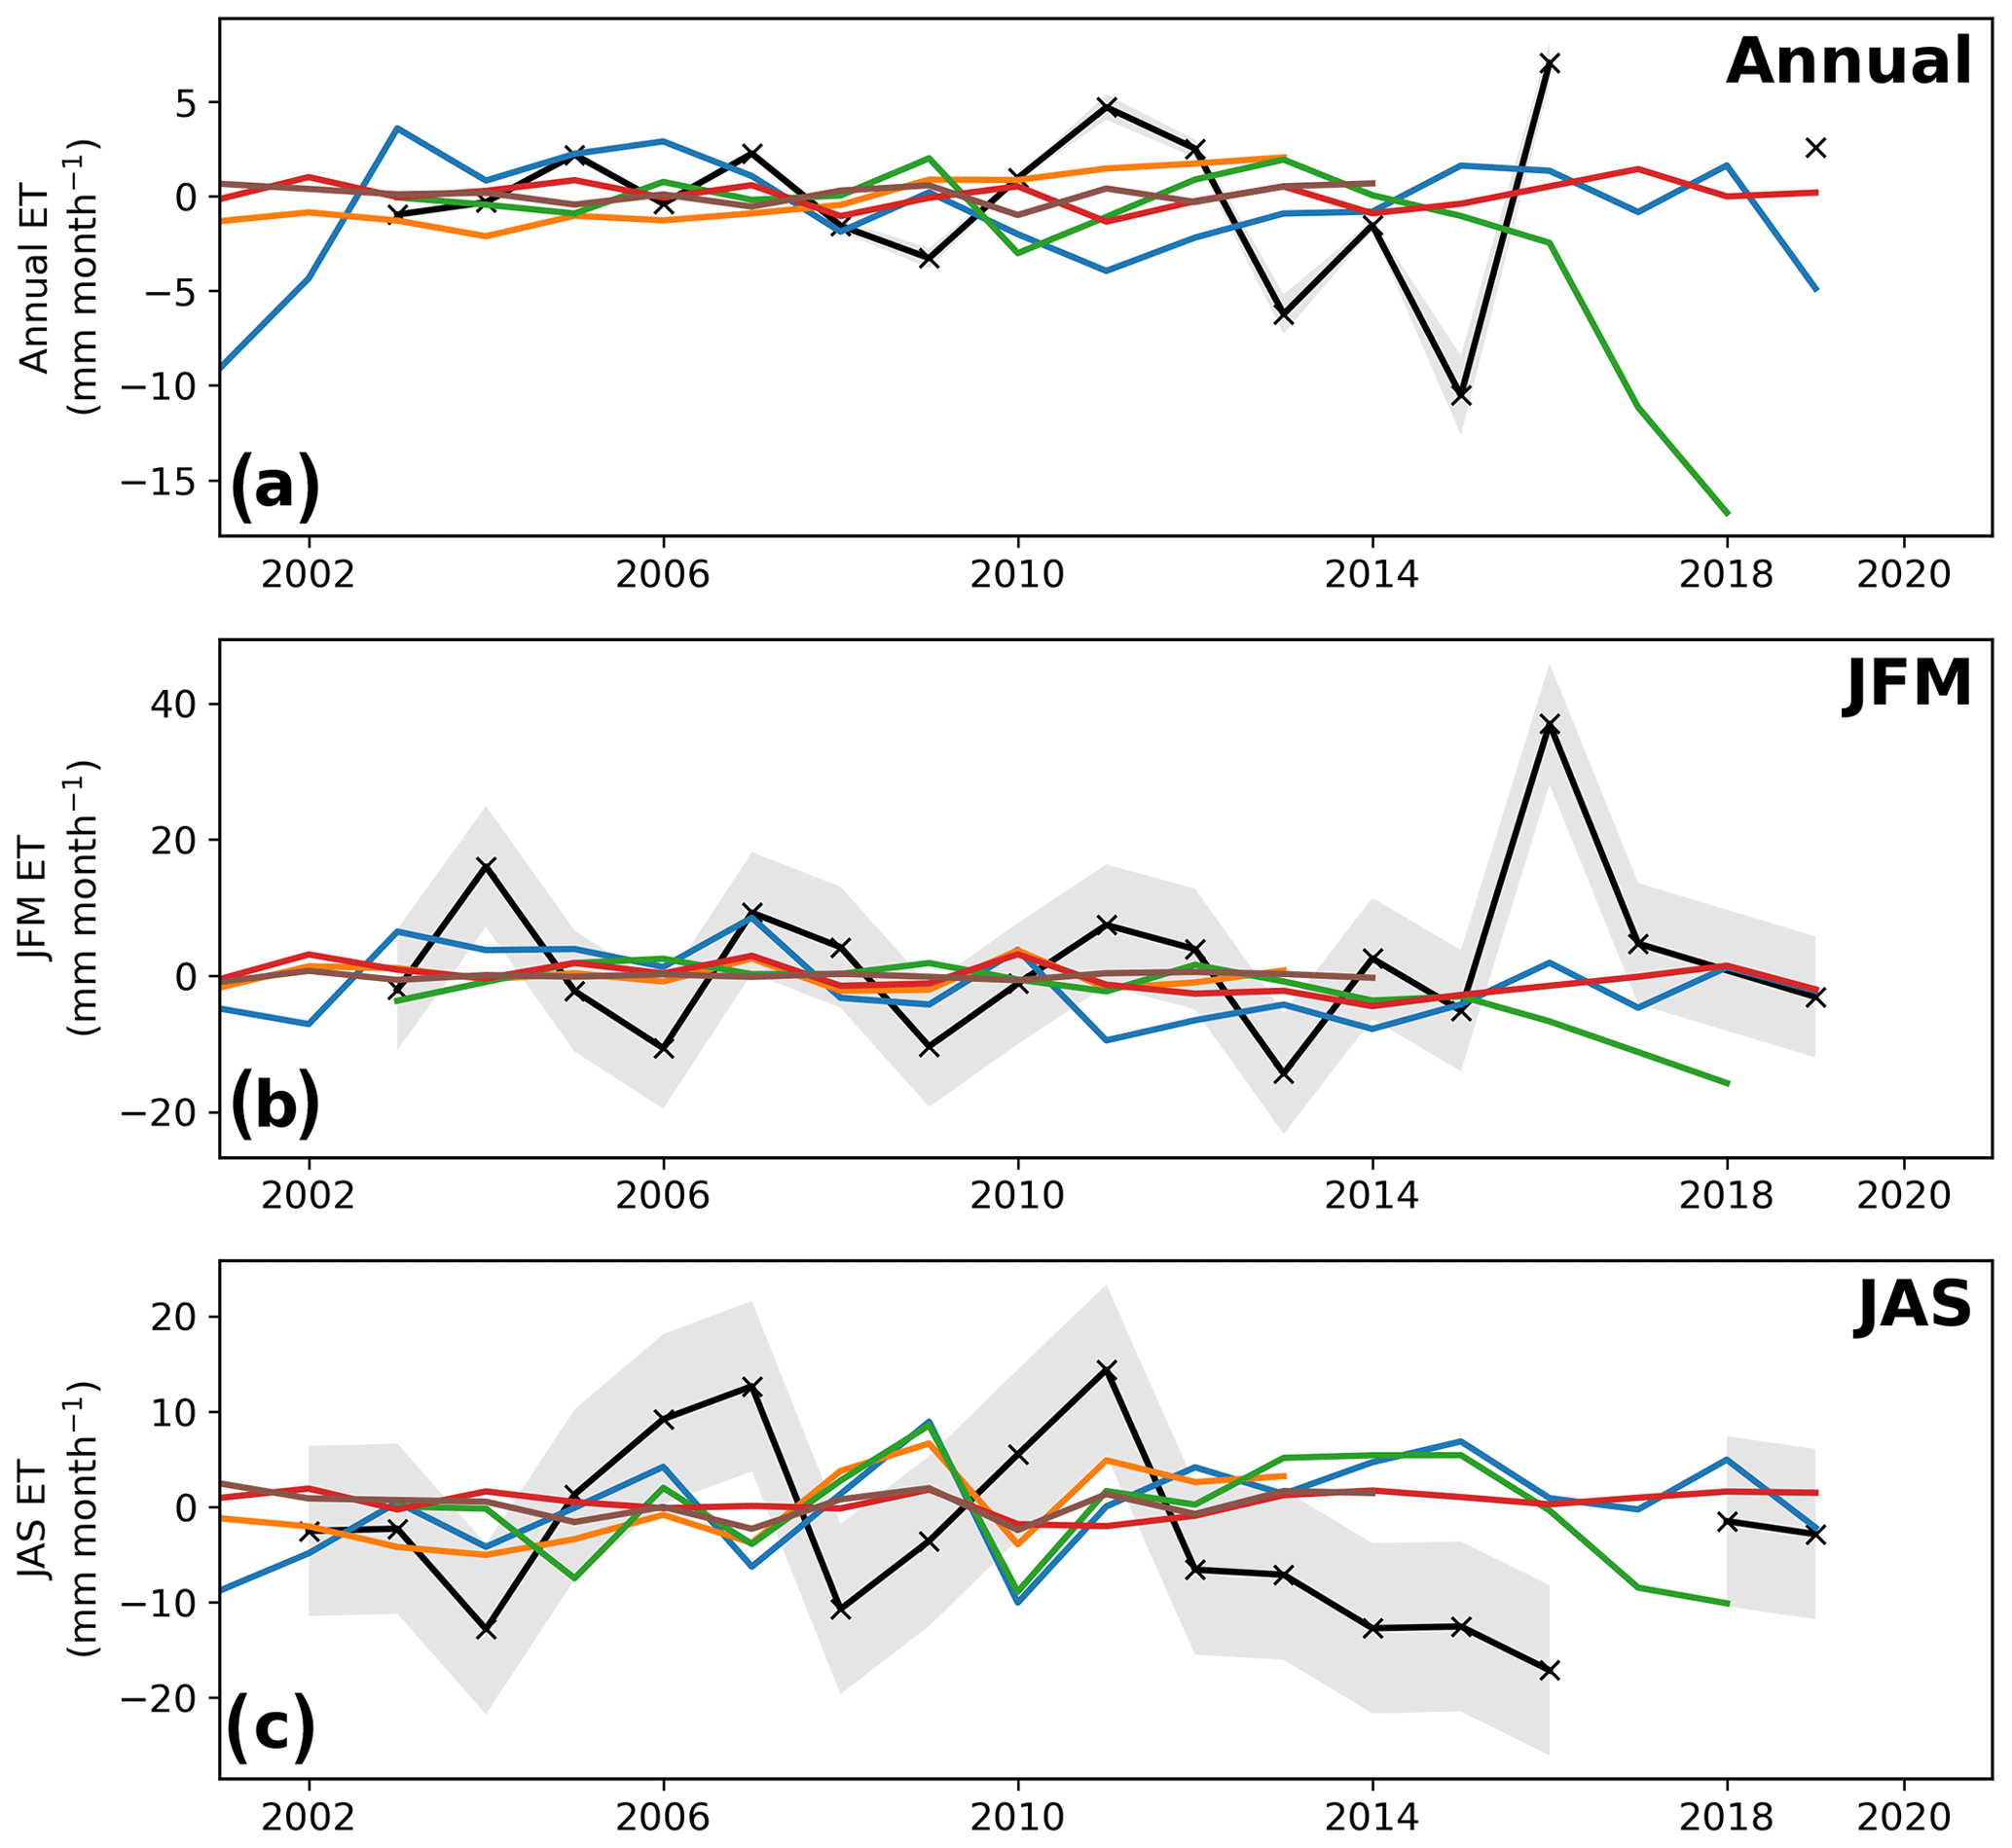
Figure 8Interannual variation in evapotranspiration (ET) from 2001 to 2019. Time series in ET over the Amazon from catchment balance (black, region drained by Óbidos; Fig. 1), satellites (MODIS, P-LSH, and GLEAM), ERA5 reanalysis, and CMIP6 models for (a) the whole year, (b) January–March (JFM), and (c) July–September (JAS), normalised by the 2003–2013 climatological mean. Interannual trends are listed in Table 3. Grey shading indicates the interannual standard deviation in the catchment-balance approach.
Finally, we assessed interannual trends in Amazon ET over the common time period of 2003 to 2013 and using all years of available data for each dataset (Table 3). No statistically significant temporal trends were observed for annual, JFM, or JAS catchment-balance ET over the respective periods analysed. Removal of the anomalous El Niño year had no impact on the results. Previous studies based on the P-LSH satellite product (Zhang et al., 2015b), and other satellite ET products and machine-learning approaches (Y. Zhang et al., 2016; Pan et al., 2020) have reported multi-decadal increases in ET, globally and over the Amazon, from the early 1980s to the early 2010s, due to long-term warming driving increased evaporative demand. Meanwhile, climate models predict that Amazon ET will decrease over the next century due to reductions in plant stomatal conductance driven by rising atmospheric CO2 (i.e. the CO2 fertilisation effect), leading to declines in Amazon rainfall (Skinner et al., 2017; Kooperman et al., 2018; Langenbrunner et al., 2019). Swann and Koven (2017) observed a statistically significant reduction in monthly catchment-balance Amazon ET from 2002 to 2016 (−0.12 mm per month yr−1), which they hypothesised may have been driven by a reduction in Amazon precipitation, deforestation, or CO2 fertilisation. Our catchment-balance ET data, analysed over a similar period but at the annual timescale, gave a similar value (i.e. −0.09 mm per month yr−1, 2003–2013; Table 3), although the result was not statistically significant due to the short length of the time series. Extension of the record to 2019 gave a similar result (Table 3). The absence of a discernible trend in catchment-balance ET in this study suggests that previously reported positive trends in Amazon ET may have levelled off but that there has not yet been a systematic shift towards long-term reductions in ET driven by precipitation, deforestation, or the CO2 fertilisation effect, over the portion of the Amazon drained by Óbidos (Fig. 1), with the caveat that ET changes over the eastern portion of the basin would not be detected in our approach.
Table 3Interannual trends in Amazon evapotranspiration (ET). Linear trends in annual, January–March (JFM), and July–September (JAS) ET were calculated over the time period common to all datasets (2003–2013) and for all years with available data over the past 2 decades (units of millimetres per month per year). Statistically significant (p<0.05) trends are shown in bold.
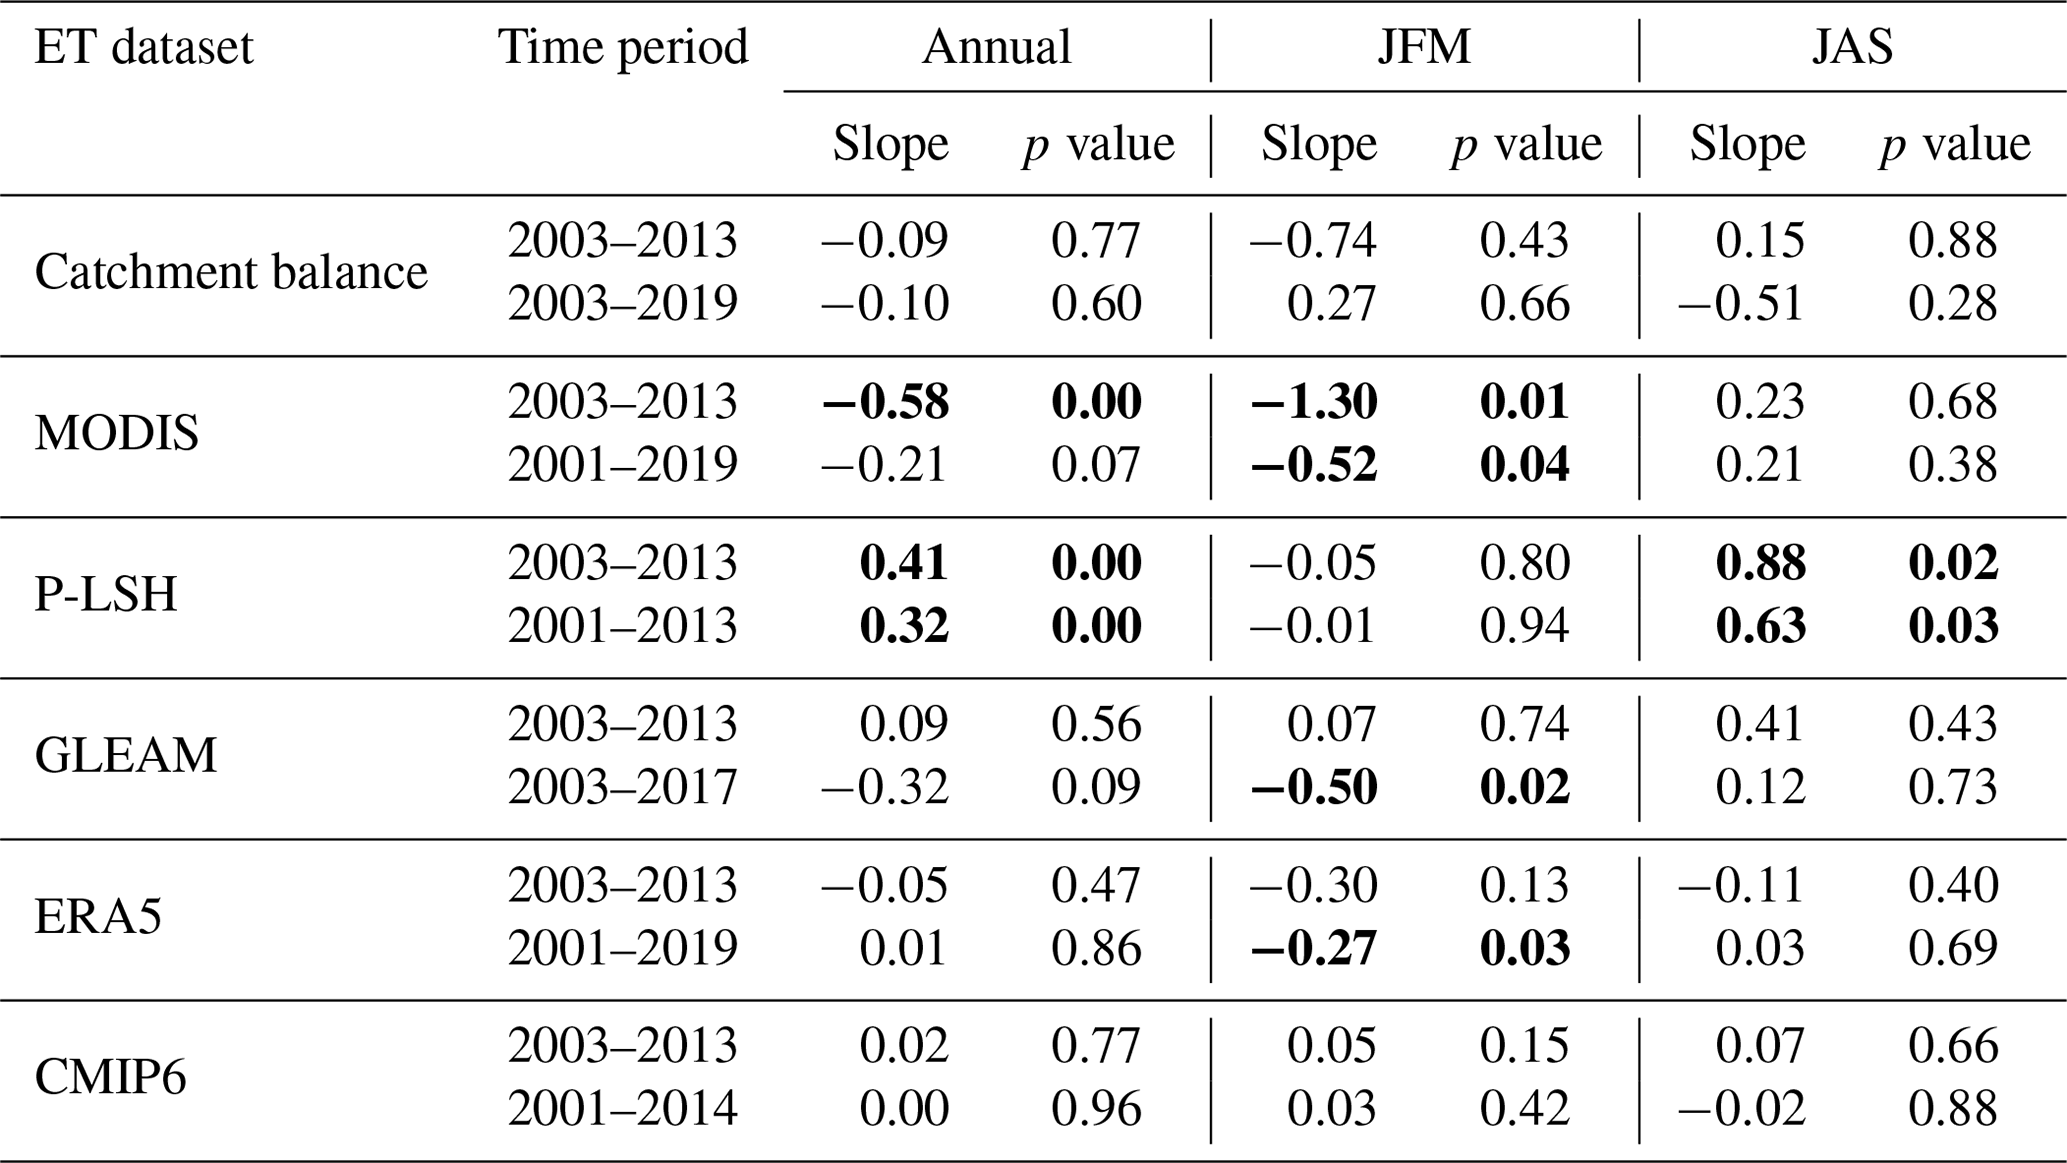
Among other datasets, there was little agreement in the direction of ET trends, with both positive and negative trends detected at the annual timescale (P-LSH and MODIS respectively), and only one product showing a statistically significant upward trend in JAS ET (P-LSH; Table 3). There was more agreement in JFM, with MODIS, GLEAM, and ERA5 all showing modest declines in ET (−0.27 to −1.3 mm per month yr−1, variable time periods; Table 3). Divergent trends in remote-sensing ET products have been reported previously (Wu et al., 2020). Trends in satellite-derived climate datasets can occur from gradual changes in the satellite orbit over time (drift), which could explain some of the observed trend disparities, although such artefacts should have been corrected for during data processing (Gutman, 1999; Pinzón et al., 2005). Overall, the inconsistencies between satellite, reanalysis, and climate model ET records at the interannual timescale, and poor correspondence with catchment-balance ET, highlight that current products are inadequate for evaluating long-term changes in Amazon ET.
This study aimed to collate estimates of Amazon ET from catchment-balance analysis, remote sensing, reanalysis, flux tower measurements, and coupled climate models to identify key characteristics of the regional hydrological cycle, compare and evaluate datasets, and identify remaining gaps in our understanding of this important variable. Our quantification of Amazon ET from terms in the water-budget equation revealed a clear spatial gradient in annual ET from east to west/southwest across the Amazon, consistent with measurements from flux towers. We observed a robust seasonal cycle in Amazon-wide ET peaking in August–October and no evidence of a long-term trend in annual, January–March, or July–September ET from 2001 to 2019. Spatial, seasonal, and (to a lesser degree) interannual variation in ET was shown to be largely governed by surface radiation and LAI, highlighting the main factors controlling surface water fluxes in the Amazon region.
The catchment-balance approach, although providing a relatively direct measure of ET, still has a degree of associated uncertainty (Table S2) and assumes complete closure of the water budget. In particular, subsurface runoff to other catchments and anthropogenic hydrological management could potentially impact the R term in Eq. (1) (Miralles et al., 2016). Incorporating groundwater measurements, as applied here, should account for sub-surface runoff. However, human encroachment on the Amazon hydrological regime has risen in recent decades with the expansion of hydropower impacting river flow patterns and flood pulse frequency (Fearnside, 2014; Timpe and Kaplan, 2017). ET estimates for the Aripuanã and all (“whole”) Amazon river catchments may have been affected by dam development, although our focus on temporal means made it less likely that our findings were affected by human-induced perturbations to monthly river flows. Furthermore, the generally good agreement between our results and those from previous studies using different data inputs (e.g. Swann and Koven, 2017) provides confidence that our approach was robust.
Performance of satellite, reanalysis, and climate model ET was highly variable, although all products overestimated ET at the annual scale (15 %–37 %) while substantially underestimating temporal variability relative to catchment balance. In general, satellite ET estimates based on the Penman–Monteith equation (MODIS and P-LSH) showed the best correspondence with catchment-balance ET, mostly capturing spatial and seasonal patterns of variation. The satellite-based GLEAM ET product showed strong positive relationships with rainfall even over very wet parts of the Amazon, suggesting an overdependence on soil moisture in the GLEAM land-surface model. ERA5 reanalysis ET performed well at the seasonal scale and mostly captured the correct relationships with factors controlling ET. However, misrepresentation of other reanalysis variables, including the spatial distribution of precipitation over the Amazon, detrimentally affected ERA5 ET. Our analysis provided a first assessment of the Amazon ET representation in the CMIP6 climate models, showing that they struggled to capture major features of Amazon ET, including spatial and seasonal variability across the Amazon Basin. Furthermore, CMIP6, which represents the latest generation of coupled climate models, showed little evidence of improvement in the representation of Amazon ET compared to CMIP5, highlighting the need for further process-based model development. It has been suggested that errors in model rooting (Pan et al., 2020) could play a role in the mischaracterisation of simulated Amazon ET, highlighting a possible area for future research.
Correspondence between ET products at the interannual timescale was particularly poor, suggesting that they are currently inadequate for monitoring long-term trends in Amazon ET. Given that changes in ET have implications for regional climate and the sustainability of the Amazon forest biome, there is a clear need for further long-term ground measurements of ET in the region, including direct measures such as sap flow. Although it remains a challenge to scale ground-based ET observations from a few kilometres up to the catchment level of thousands of kilometres, recent advances, such as the installation of the Amazon Tall Tower Observatory (ATTO), which captures regional processes over a footprint on the order of a thousand kilometres (Andreae et al., 2015), are expected to provide new insights in the field.
The future of Amazon ET is entwined with the fate of the Amazon rainforest, with its rich biodiversity and valuable stores of terrestrial carbon (Malhi et al., 2008; Zhang et al., 2015a). However, uncertainty remains over the direction of future ET trends, with climate warming and increasing LAI promoting ET increases (Kergoat et al., 2002; Zhang et al., 2015b) and deforestation and CO2-induced reductions in sap flow forcing declines in ET (Zemp et al., 2017a; Skinner et al., 2017; Baker and Spracklen, 2019). Discrepancies in the direction of trends from different ET products in this study make it difficult to assess which of these opposing mechanisms are in operation. Furthermore, the deficiencies in the representation of ET in CMIP5 and CMIP6 models highlighted here raise questions over the reliability of Amazon ET projections over the next century, with implications for other regions. Until models are better able to capture historical patterns of ET and its controlling variables, attempts to understand future changes in the Amazon hydrological cycle will be severely hampered.
The observational, reanalysis, model, and flux tower datasets analysed in the study are available from the following repositories, with additional information and references provided in Table 1:
-
CHIRPS precipitation: https://data.chc.ucsb.edu/products/CHIRPS-2.0/global_monthly/netcdf/ (last access: 1 June 2020), https://doi.org/10.1038/sdata.2015.66, Funk et al. (2015).
-
Amazon river-gauge station data: https://www.snirh.gov.br/hidroweb/serieshistoricas (last access: 1 June 2020), Hidroweb (2018).
-
GRACE terrestrial water storage: https://podaac-tools.jpl.nasa.gov/drive/files/allData/tellus/L3/mascon/RL06/JPL/v02/CRI/netcdf (last access: 6 May 2020), https://doi.org/10.5067/TEMSC-3JC62, Wiese et al. (2019)
-
MODIS ET: https://lpdaac.usgs.gov/products/mod16a2v006/ (last access: 1 June 2020), https://doi.org/10.5067/MODIS/MOD16A2.006, Running et al. (2019).
-
P-LSH ET: http://files.ntsg.umt.edu/data/ET_global_monthly/Global_8kmResolution/ (last access: 1 June 2020), https://doi.org/10.1029/2009wr008800, Zhang et al. (2010).
-
GLEAM ET: https://www.gleam.eu/#downloads (last access: 6 March 2020), https://doi.org/10.5194/gmd-10-1903-2017, Martens et al. (2017).
-
ERA5 reanalysis: https://cds.climate.copernicus.eu/cdsapp#!/dataset/reanalysis-era5-single-levels-monthly-means?tab=overview (last access: 1 June 2020), https://doi.org/10.24381/cds.f17050d7, Hersbach et al. (2019).
-
CMIP5 historical simulations: https://esgf-index1.ceda.ac.uk/search/cmip5-ceda/ (last access: 1 January 2020), https://doi.org/10.1175/bams-d-11-00094.1, Taylor et al. (2012).
-
CMIP6 historical simulations: https://esgf-index1.ceda.ac.uk/search/cmip6-ceda/ (last access: 1 June 2020), https://doi.org/10.5194/gmd-9-1937-2016, Eyring et al. (2016).
-
CLARA-A1 radiation: https://wui.cmsaf.eu/safira/action/viewProduktDetails?fid=2&eid=20506 (last access: 1 June 2020), https://doi.org/10.5676/EUM_SAF_CM/CLARA_AVHRR/V001, Karlsson et al. (2012).
-
MODIS LAI: https://lpdaac.usgs.gov/products/mod15a2hv006/ (last access: 1 June 2020), https://doi.org/10.5067/MODIS/MOD15A2H.006, Myneni et al. (2015).
-
LBA-ECO CD-32 Flux Tower Network Data Compilation: https://daac.ornl.gov/cgi-bin/dsviewer.pl?ds_id=1174 (last access: 1 January 2020), https://doi.org/10.3334/ORNLDAAC/1174, Saleska et al. (2013).
We have uploaded a dataset containing Amazon catchment-scale estimates of ET, precipitation, surface radiation, and LAI for 2003–2013 from the data sources described in this study to an online repository (https://doi.org/10.5281/zenodo.4271331, Baker, 2020). Catchment-balance error estimates for Amazon ET are also provided (https://doi.org/10.5281/zenodo.4580292, Baker, 2021a). The scripts used to process the raw data and conduct the catchment-balance analysis are available from https://doi.org/10.5281/zenodo.4580447 (Baker, 2021b).
The supplement related to this article is available online at: https://doi.org/10.5194/hess-25-2279-2021-supplement.
JCAB, LGC, MG, JHM, WB, and DVS devised the study, planned the analysis, and discussed the results. HRdR, ADN, and ACdA provided ET data and expertise on Amazon flux tower measurements. JCAB performed the analysis and wrote the paper. All authors provided feedback on the article.
The authors declare that they have no conflict of interest.
The authors acknowledge the World Climate Research Programme's Working Group on Coupled Modelling, which is responsible for CMIP, and thank the climate modelling groups (listed in Tables S3 and S4 of this paper) for producing and making available their model output. For CMIP, the U.S. Department of Energy’s Program for Climate Model Diagnosis and Intercomparison provides coordinating support and led development of software infrastructure in partnership with the Global Organization for Earth System Science Portals. The authors also thank contributors to the LBA-ECO CD-32 Flux Tower Network. Finally, the authors thank the editor Stan Schymanski and the three anonymous reviewers for their constructive comments on the paper.
This research has been supported by the European Research Council (ERC) under the European Union's Horizon 2020 Research and Innovation programme (DECAF project; grant no. 771492), a Natural Environment Research Council standard grant (grant no. NE/K01353X/1), and the Newton Fund, through the Met Office Climate Science for Service Partnership Brazil (CSSP Brazil). Humberto R. da Rocha was supported by Coordenação de Aperfeiçoamento de Pessoal de Nível Superior (CAPES) and Agencia Nacional de Aguas (ANA) project (grant no. 88887.144979/2017-00).
This paper was edited by Stan Schymanski and reviewed by three anonymous referees.
Ahlström, A., Canadell, J. G., Schurgers, G., Wu, M., Berry, J. A., Guan, K., and Jackson, R. B.: Hydrologic resilience and Amazon productivity, Nat. Commun., 8, 387, https://doi.org/10.1038/s41467-017-00306-z, 2017.
Andreae, M. O., Acevedo, O. C., Araùjo, A., Artaxo, P., Barbosa, C. G. G., Barbosa, H. M. J., Brito, J., Carbone, S., Chi, X., Cintra, B. B. L., da Silva, N. F., Dias, N. L., Dias-Júnior, C. Q., Ditas, F., Ditz, R., Godoi, A. F. L., Godoi, R. H. M., Heimann, M., Hoffmann, T., Kesselmeier, J., Könemann, T., Krüger, M. L., Lavric, J. V., Manzi, A. O., Lopes, A. P., Martins, D. L., Mikhailov, E. F., Moran-Zuloaga, D., Nelson, B. W., Nölscher, A. C., Santos Nogueira, D., Piedade, M. T. F., Pöhlker, C., Pöschl, U., Quesada, C. A., Rizzo, L. V., Ro, C.-U., Ruckteschler, N., Sá, L. D. A., de Oliveira Sá, M., Sales, C. B., dos Santos, R. M. N., Saturno, J., Schöngart, J., Sörgel, M., de Souza, C. M., de Souza, R. A. F., Su, H., Targhetta, N., Tóta, J., Trebs, I., Trumbore, S., van Eijck, A., Walter, D., Wang, Z., Weber, B., Williams, J., Winderlich, J., Wittmann, F., Wolff, S., and Yáñez-Serrano, A. M.: The Amazon Tall Tower Observatory (ATTO): overview of pilot measurements on ecosystem ecology, meteorology, trace gases, and aerosols, Atmos. Chem. Phys., 15, 10723–10776, https://doi.org/10.5194/acp-15-10723-2015, 2015.
Baker, J. C. A.: Catchment-scale estimates of Amazon evapotranspiration (Version pre_publication), Zenodo [data set], https://doi.org/10.5281/zenodo.4271331, 2020.
Baker, J. C. A.: Error estimates of Amazon catchment-balance evapotranspiration, Zenodo [data set], https://doi.org/10.5281/zenodo.4580292, 2021a.
Baker, J. C. A.: amazon_et: Amazon evapotranspiration scripts for HESS (Version v1.0), Zenodo [data set], https://doi.org/10.5281/zenodo.4580447, 2021b.
Baker, J. C. A. and Spracklen, D. V.: Climate Benefits of Intact Amazon Forests and the Biophysical Consequences of Disturbance, Frontiers in Forests and Global Change, 2, 47, https://doi.org/10.3389/ffgc.2019.00047, 2019.
Baker, J. C. A., Castilho de Souza, D., Kubota, P., Buermann, W., Coelho, C. A. S., Andrews, M. B., Gloor, M., Garcia-Carreras, L., Figueroa, S. N., and Spracklen, D. V.: An assessment of land-atmosphere interactions over South America using satellites, reanalysis and two global climate models, J. Hydrometeorol., 22, 905–922, 2021a.
Baker, J. C. A., Garcia-Carreras, L., Buermann, W., Castilho de Souza, D., Marsham, J. H., Kubota, P., Gloor, M., Coelho, C. A. S., and Spracklen, D. V.: Robust Amazon precipitation projections in climate models that capture realistic land-atmosphere interactions, Environ. Res. Lett., in review, 2021b.
Barlow, J., Berenguer, E., Carmenta, R., and França, F.: Clarifying Amazonia's burning crisis, Glob. Change Biol., 26, 319–321, https://doi.org/10.1111/gcb.14872, 2020.
Callède, J., Ronchail, J., Guyot, J.-L., and Oliveira, E. D.: Déboisement amazonien: son influence sur le débit de l'Amazone à Óbidos (Brésil), Revue des sciences de l'eau/Journal of Water Science, 21, 59–72, 2008.
Christoffersen, B. O., Restrepo-Coupe, N., Arain, M. A., Baker, I. T., Cestaro, B. P., Ciais, P., Fisher, J. B., Galbraith, D., Guan, X. D., Gulden, L., van den Hurk, B., Ichii, K., Imbuzeiro, H., Jain, A., Levine, N., Miguez-Machor, G., Poulter, B., Roberti, D. R., Sakaguchi, K., Sahoo, A., Schaefer, K., Shi, M. J., Verbeeck, H., Yang, Z. L., Araujo, A. C., Kruijt, B., Manzi, A. O., da Rocha, H. R., von Randow, C., Muza, M. N., Borak, J., Costa, M. H., de Goncalves, L. G. G., Zeng, X. B., and Saleska, S. R.: Mechanisms of water supply and vegetation demand govern the seasonality and magnitude of evapotranspiration in Amazonia and Cerrado, Agr. Forest Meteorol., 191, 33–50, https://doi.org/10.1016/j.agrformet.2014.02.008, 2014.
Costa, M. H., Souza-Filho, J. C., and Ribeiro, A.: Comments on “The Regional Evapotranspiration of the Amazon”, J. Hydrometeorol., 5, 1279–1280, https://doi.org/10.1175/jhm-393.1, 2004.
Costa, M. H., Biajoli, M. C., Sanches, L., Malhado, A. C. M., Hutyra, L. R., da Rocha, H. R., Aguiar, R. G., and de Araújo, A. C.: Atmospheric versus vegetation controls of Amazonian tropical rain forest evapotranspiration: Are the wet and seasonally dry rain forests any different?, J. Geophys. Res., 115, G04021, https://doi.org/10.1029/2009jg001179, 2010.
Crowhurst, D. M., Dadson, S. J., and Washington, R.: Evaluation of Evaporation Climatology for the Congo Basin Wet Seasons in 11 Global Climate Models, J. Geophys. Res.-Atmos., 125, e2019JD030619, https://doi.org/10.1029/2019JD030619, 2020.
da Rocha, H. R., Goulden, M. L., Miller, S. D., Menton, M. C., Pinto, L. D. V. O., de Freitas, H. C., and e Silva Figueira, A. M.: Seasonality of water and heat fluxes over a tropical forest in eastern Amazonia, Ecol. Appl., 14, 22–32, https://doi.org/10.1890/02-6001, 2004.
da Rocha, H. R., Manzi, A. O., Cabral, O. M., Miller, S. D., Goulden, M. L., Saleska, S. R., R.-Coupe, N., Wofsy, S. C., Borma, L. S., Artaxo, P., Vourlitis, G., Nogueira, J. S., Cardoso, F. L., Nobre, A. D., Kruijt, B., Freitas, H. C., von Randow, C., Aguiar, R. G., and Maia, J. F.: Patterns of water and heat flux across a biome gradient from tropical forest to savanna in Brazil, J. Geophys. Res., 114, G00B12, https://doi.org/10.1029/2007jg000640, 2009a.
da Rocha, H. R., Manzi, A. O., and Shuttleworth, J.: Evapotranspiration, in: Amazonia and Global Change, edited by: Keller, M., Bustamante, M., Gash, J., and Silva Dias, P., Geophysical Monograph Series, 186, 261–272, 2009b.
da Silva, H. J. F., Gonçalves, W. A., and Bezerra, B. G.: Comparative analyzes and use of evapotranspiration obtained through remote sensing to identify deforested areas in the Amazon, Int. J. Appl. Earth Obs., 78, 163–174, https://doi.org/10.1016/j.jag.2019.01.015, 2019.
de Oliveira, G., Brunsell, N. A., Moraes, E. C., Shimabukuro, Y. E., Bertani, G., dos Santos, T. V., and Aragao, L.: Evaluation of MODIS-based estimates of water-use efficiency in Amazonia, Int. J. Remote Sens., 38, 5291–5309, https://doi.org/10.1080/01431161.2017.1339924, 2017.
Dingman, S. L.: Physical hydrology, Waveland press, Long Grove, Illinois, USA, 3rd edn., ISBN: 1-4786-1118-9, 2015.
Eltahir, E. A.: Role of vegetation in sustaining large-scale atmospheric circulations in the tropics, J. Geophys. Res., 101, 4255–4268, 1996.
Eltahir, E. A. and Bras, R. L.: Precipitation recycling in the Amazon basin, Q. J. Roy. Meteor. Soc., 120, 861–880, 1994.
Eyring, V., Bony, S., Meehl, G. A., Senior, C. A., Stevens, B., Stouffer, R. J., and Taylor, K. E.: Overview of the Coupled Model Intercomparison Project Phase 6 (CMIP6) experimental design and organization, Geosci. Model Dev., 9, 1937–1958, https://doi.org/10.5194/gmd-9-1937-2016, 2016 (data available at: https://esgf-index1.ceda.ac.uk/search/cmip6-ceda/, last access: 1 June 2020).
Fearnside, P. M.: Viewpoint-Brazil's Madeira River Dams: A Setback for Environmental Policy in Amazonian Development, Water Alternatives, 7, 256–269, 2014.
Fisher, J. B., Malhi, Y., Bonal, D., Da Rocha, H. R., De AraÚJo, A. C., Gamo, M., Goulden, M. L., Hirano, T., Huete, A. R., Kondo, H., Kumagai, T. O., Loescher, H. W., Miller, S., Nobre, A. D., Nouvellon, Y., Oberbauer, S. F., Panuthai, S., Roupsard, O., Saleska, S., Tanaka, K., Tanaka, N., Tu, K. P., and Von Randow, C.: The land–atmosphere water flux in the tropics, Glob. Change Biol., 15, 2694–2714, https://doi.org/10.1111/j.1365-2486.2008.01813.x, 2009.
Foken, T.: The Energy Balance Closure Problem: An Overview, Ecol. Appl., 18, 1351–1367, https://doi.org/10.1890/06-0922.1, 2008.
Funk, C., Peterson, P., Landsfeld, M., Pedreros, D., Verdin, J., Shukla, S., Husak, G., Rowland, J., Harrison, L., Hoell, A., and Michaelsen, J.: The climate hazards infrared precipitation with stations – a new environmental record for monitoring extremes, Scientific Data, 2, 150066, https://doi.org/10.1038/sdata.2015.66, 2015 (data available at: https://data.chc.ucsb.edu/products/CHIRPS-2.0/global_monthly/netcdf/, last access: 1 June 2020).
Gat, J. R. and Matsui, E.: Atmospheric water balance in the Amazon basin: An isotopic evapotranspiration model, J. Geophys. Res., 96, 13179–13188, https://doi.org/10.1029/91JD00054, 1991.
GDAL/OGR Contributors: Geospatial Data Abstraction software Library: https://gdal.org, last access: June 2020.
Gloor, M., Brienen, R. J. W., Galbraith, D., Feldpausch, T. R., Schöngart, J., Guyot, J. L., Espinoza, J. C., Lloyd, J., and Phillips, O. L.: Intensification of the Amazon hydrological cycle over the last two decades, Geophys. Res. Lett., 40, 1729–1733, https://doi.org/10.1002/grl.50377, 2013.
Good, S. P., Noone, D., and Bowen, G.: Hydrologic connectivity constrains partitioning of global terrestrial water fluxes, Science, 349, 175–177, https://doi.org/10.1126/science.aaa5931, 2015.
Guan, K., Pan, M., Li, H., Wolf, A., Wu, J., Medvigy, D., Caylor, K. K., Sheffield, J., Wood, E. F., Malhi, Y., Liang, M., Kimball, J., Saleska, S., Berry, J., Joiner, J., and Lyapustin, A.: Photosynthetic seasonality of global tropical forests constrained by hydroclimate, Nature Geoscience, 8, 284-289, 2015.
Gutman, G. G.: On the monitoring of land surface temperatures with the NOAA/AVHRR: Removing the effect of satellite orbit drift, Int. J. Remote Sens., 20, 3407–3413, https://doi.org/10.1080/014311699211435, 1999.
Hasler, N. and Avissar, R.: What Controls Evapotranspiration in the Amazon Basin?, J. Hydrometeorol., 8, 380–395, https://doi.org/10.1175/jhm587.1, 2007.
Hersbach, H., Bell, B., Berrisford, P., Biavati, G., Horányi, A., Muñoz Sabater, J., Nicolas, J., Peubey, C., Radu, R., Rozum, I., Schepers, D., Simmons, A., Soci, C., Dee, D., and Thépaut, J.-N.: ERA5 monthly averaged data on single levels from 1979 to present, Copernicus Climate Change Service (C3S) Climate Data Store (CDS) [data set], https://doi.org/10.24381/cds.f17050d7, 2019 (data available at: https://cds.climate.copernicus.eu/cdsapp#!/dataset/reanalysis-era5-single-levels-monthly-means?tab=overview, last access: 1 June 2020).
Hersbach, H., Bell, B., Berrisford, P., Hirahara, S., Horányi, A., Muñoz-Sabater, J., Nicolas, J., Peubey, C., Radu, R., Schepers, D., Simmons, A., Soci, C., Abdalla, S., Abellan, X., Balsamo, G., Bechtold, P., Biavati, G., Bidlot, J., Bonavita, M., De Chiara, G., Dahlgren, P., Dee, D., Diamantakis, M., Dragani, R., Flemming, J., Forbes, R., Fuentes, M., Geer, A., Haimberger, L., Healy, S., Hogan, R. J., Hólm, E., Janisková, M., Keeley, S., Laloyaux, P., Lopez, P., Lupu, C., Radnoti, G., De Rosnay, P., Rozum, I., Vamborg, F., Villaume, S., and Thépaut, J.-N.: The ERA5 global reanalysis, Q. J. Roy. Meteor. Soc., 146, 1999–2049, 2020.
HidroWeb: HidroWeb, Brazilian Water Resources Database, Agência Nacional de Águas, Water Resources National Agency, Brazil, available at: https://www.snirh.gov.br/hidroweb/serieshistoricas (last access: 1 June 2020), 2018.
Hodges, J. L.: The significance probability of the Smirnov two-sample test, Arkiv för Matematik, 3, 469–486, 1958.
Huffman, G. J.: Estimates of root-mean-square random error for finite samples of estimated precipitation, J. Appl. Meteorol., 36, 1191–1201, 1997.
Jasechko, S., Sharp, Z. D., Gibson, J., Birks, S. J., Yi, Y., and Fawcett, P. J.: Terrestrial water fluxes dominated by transpiration, Nature, 496, 347–350, https://doi.org/10.1038/nature11983, 2013.
Jasechko, S.: Plants turn on the tap, Nat. Clim. Change, 8, 562–563, https://doi.org/10.1038/s41558-018-0212-z, 2018.
Jung, M., Reichstein, M., Ciais, P., Seneviratne, S. I., Sheffield, J., Goulden, M. L., Bonan, G., Cescatti, A., Chen, J., de Jeu, R., Dolman, A. J., Eugster, W., Gerten, D., Gianelle, D., Gobron, N., Heinke, J., Kimball, J., Law, B. E., Montagnani, L., Mu, Q., Mueller, B., Oleson, K., Papale, D., Richardson, A. D., Roupsard, O., Running, S., Tomelleri, E., Viovy, N., Weber, U., Williams, C., Wood, E., Zaehle, S., and Zhang, K.: Recent decline in the global land evapotranspiration trend due to limited moisture supply, Nature, 467, 951–954, https://doi.org/10.1038/nature09396, 2010.
Karlsson, K.-G., Riihelä, A., Müller, R., Meirink, J. F., Sedlar, J., Stengel, M., Lockhoff, M., Trentmann, J., Kaspar, F., Hollmann, R., and Wolters, E.: CLARA-A1: CM SAF cLouds, Albedo and Radiation dataset from AVHRR data, Edition 1 – Monthly Means / Daily Means / Pentad Means / Monthly Histograms, Satellite Application Facility on Climate Monitoring (CM SAF) [data set], https://doi.org/10.5676/EUM_SAF_CM/CLARA_AVHRR/V001, 2012.
Karlsson, K.-G., Riihelä, A., Müller, R., Meirink, J. F., Sedlar, J., Stengel, M., Lockhoff, M., Trentmann, J., Kaspar, F., Hollmann, R., and Wolters, E.: CLARA-A1: a cloud, albedo, and radiation dataset from 28 yr of global AVHRR data, Atmos. Chem. Phys., 13, 5351–5367, https://doi.org/10.5194/acp-13-5351-2013, 2013.
Keller, M., Bustamante, M., Gash, J., and Dias, P. S.: Amazonia and global change, Geophysical Monograph Series American Geophysical Union, Washington, DC, ISBN: 978-0-87590-476-4, 2009.
Kergoat, L., Lafont, S., Douville, H., Berthelot, B., Dedieu, G., Planton, S., and Royer, J.-F.: Impact of doubled CO2 on global-scale leaf area index and evapotranspiration: Conflicting stomatal conductance and LAI responses, J. Geophys. Res., 107, 4808, https://doi.org/10.1029/2001jd001245, 2002.
Khand, K., Numata, I., Kjaersgaard, J., and Vourlitis, G. L.: Dry season evapotranspiration dynamics over human-impacted landscapes in the southern Amazon using the Landsat-based METRIC model, Remote Sensing, 9, 706, https://doi.org/10.3390/rs9070706, 2017.
Kooperman, G. J., Chen, Y., Hoffman, F. M., Koven, C. D., Lindsay, K., Pritchard, M. S., Swann, A. L. S., and Randerson, J. T.: Forest response to rising CO2 drives zonally asymmetric rainfall change over tropical land, Nat. Clim. Change, 8, 434–440, https://doi.org/10.1038/s41558-018-0144-7, 2018.
Koren, G., Schaik, E. v., Araújo, A. C., Boersma, K. F., Gärtner, A., Killaars, L., Kooreman, M. L., Kruijt, B., Laan-Luijkx, I. T. v. d., Randow, C. v., Smith, N. E., and Peters, W.: Widespread reduction in sun-induced fluorescence from the Amazon during the 2015/2016 El Niño, Philos. T. Roy. Soc. B, 373, 20170408, https://doi.org/10.1098/rstb.2017.0408, 2018.
Kunert, N., Aparecido, L. M. T., Wolff, S., Higuchi, N., Santos, J. d., Araujo, A. C. d., and Trumbore, S.: A revised hydrological model for the Central Amazon: The importance of emergent canopy trees in the forest water budget, Agr. Forest Meteorol., 239, 47–57, https://doi.org/10.1016/j.agrformet.2017.03.002, 2017.
Langenbrunner, B., Pritchard, M. S., Kooperman, G. J., and Randerson, J. T.: Why Does Amazon Precipitation Decrease When Tropical Forests Respond to Increasing CO2?, Earth's Future, 7, 450–468, https://doi.org/10.1029/2018ef001026, 2019.
Long, D., Longuevergne, L., and Scanlon, B. R.: Uncertainty in evapotranspiration from land surface modeling, remote sensing, and GRACE satellites, Water Resour. Res., 50, 1131–1151, https://doi.org/10.1002/2013WR014581, 2014.
Lopes, A. P., Nelson, B. W., Wu, J., Graça, P. M. L. d. A., Tavares, J. V., Prohaska, N., Martins, G. A., and Saleska, S. R.: Leaf flush drives dry season green-up of the Central Amazon, Remote Sens. Environ., 182, 90–98, https://doi.org/10.1016/j.rse.2016.05.009, 2016.
Maeda, E. E., Ma, X., Wagner, F. H., Kim, H., Oki, T., Eamus, D., and Huete, A.: Evapotranspiration seasonality across the Amazon Basin, Earth Syst. Dynam., 8, 439–454, https://doi.org/10.5194/esd-8-439-2017, 2017.
Malhi, Y., Roberts, J. T., Betts, R. A., Killeen, T. J., Li, W., and Nobre, C. A.: Climate change, deforestation, and the fate of the Amazon, Science, 319, 169–172, 2008.
Marengo, J. A.: On the hydrological cycle of the Amazon Basin: A historical review and current state-of-the-art, Revista Brasileira de Meteorologia, 21, 1–19, 2006.
Martens, B., Miralles, D. G., Lievens, H., van der Schalie, R., de Jeu, R. A. M., Fernández-Prieto, D., Beck, H. E., Dorigo, W. A., and Verhoest, N. E. C.: GLEAM v3: satellite-based land evaporation and root-zone soil moisture, Geosci. Model Dev., 10, 1903–1925, https://doi.org/10.5194/gmd-10-1903-2017, 2017 (data available at: https://www.gleam.eu/#downloads, last access: 6 March 2020).
Martinelli, L. A., Victoria, R. L., Silveira Lobo Sternberg, L., Ribeiro, A., and Zacharias Moreira, M.: Using stable isotopes to determine sources of evaporated water to the atmosphere in the Amazon basin, J. Hydrol., 183, 191–204, https://doi.org/10.1016/0022-1694(95)02974-5, 1996.
Michel, D., Jiménez, C., Miralles, D. G., Jung, M., Hirschi, M., Ershadi, A., Martens, B., McCabe, M. F., Fisher, J. B., Mu, Q., Seneviratne, S. I., Wood, E. F., and Fernández-Prieto, D.: The WACMOS-ET project – Part 1: Tower-scale evaluation of four remote-sensing-based evapotranspiration algorithms, Hydrol. Earth Syst. Sci., 20, 803–822, https://doi.org/10.5194/hess-20-803-2016, 2016.
Miralles, D. G., Holmes, T. R. H., De Jeu, R. A. M., Gash, J. H., Meesters, A. G. C. A., and Dolman, A. J.: Global land-surface evaporation estimated from satellite-based observations, Hydrol. Earth Syst. Sci., 15, 453–469, https://doi.org/10.5194/hess-15-453-2011, 2011.
Miralles, D. G., Jiménez, C., Jung, M., Michel, D., Ershadi, A., McCabe, M. F., Hirschi, M., Martens, B., Dolman, A. J., Fisher, J. B., Mu, Q., Seneviratne, S. I., Wood, E. F., and Fernández-Prieto, D.: The WACMOS-ET project – Part 2: Evaluation of global terrestrial evaporation data sets, Hydrol. Earth Syst. Sci., 20, 823–842, https://doi.org/10.5194/hess-20-823-2016, 2016.
Monteith, J.: Evaporation and environment. The state and movement of water in living organisms, Symposium of the Society of Experimental Biology, 19, 205–234, 1965.
Moreira, M., Sternberg, L., Martinelli, L., Victoria, R., Barbosa, E., Bonates, L., and Nepstad, D.: Contribution of transpiration to forest ambient vapour based on isotopic measurements, Glob. Change Biol., 3, 439–450, 1997.
Mu, Q., Heinsch, F. A., Zhao, M., and Running, S. W.: Development of a global evapotranspiration algorithm based on MODIS and global meteorology data, Remote Sens. Environ., 111, 519–536, https://doi.org/10.1016/j.rse.2007.04.015, 2007.
Mu, Q., Zhao, M., and Running, S. W.: Improvements to a MODIS global terrestrial evapotranspiration algorithm, Remote Sens. Environ., 115, 1781–1800, https://doi.org/10.1016/j.rse.2011.02.019, 2011.
Mu, Q., Zhao, M., and Running, S. W.: MODIS global terrestrial evapotranspiration (ET) product (NASA MOD16A2/A3), Algorithm Theoretical Basis Document, NASA, Washinton, DC, Collection 5, 1–66, 2013.
Mueller, B. and Seneviratne, S. I.: Systematic land climate and evapotranspiration biases in CMIP5 simulations, Geophys. Res. Lett., 41, 128–134, https://doi.org/10.1002/2013gl058055, 2014.
Mueller, B., Hirschi, M., Jimenez, C., Ciais, P., Dirmeyer, P. A., Dolman, A. J., Fisher, J. B., Jung, M., Ludwig, F., Maignan, F., Miralles, D. G., McCabe, M. F., Reichstein, M., Sheffield, J., Wang, K., Wood, E. F., Zhang, Y., and Seneviratne, S. I.: Benchmark products for land evapotranspiration: LandFlux-EVAL multi-data set synthesis, Hydrol. Earth Syst. Sci., 17, 3707–3720, https://doi.org/10.5194/hess-17-3707-2013, 2013.
Myneni, R., Hoffman, S., Knyazikhin, Y., Privette, J., Glassy, J., Tian, Y., Wang, Y., Song, X., Zhang, Y., and Smith, G.: Global products of vegetation leaf area and fraction absorbed PAR from year one of MODIS data, Remote Sens. Environ., 83, 214–231, 2002.
Myneni, R., Knyazikhin, Y., and Park, T.: MOD15A2H MODIS/Terra Leaf Area Index/FPAR 8-Day L4 Global 500m SIN Grid V006, NASA EOSDIS Land Processes DAAC [data set], https://doi.org/10.5067/MODIS/MOD15A2H.006, 2015 (data available at: https://lpdaac.usgs.gov/products/mod15a2hv006/, last access: 1 June 2020).
Myneni, R. B., Yang, W., Nemani, R. R., Huete, A. R., Dickinson, R. E., Knyazikhin, Y., Didan, K., Fu, R., Negrón Juárez, R. I., Saatchi, S. S., Hashimoto, H., Ichii, K., Shabanov, N. V., Tan, B., Ratana, P., Privette, J. L., Morisette, J. T., Vermote, E. F., Roy, D. P., Wolfe, R. E., Friedl, M. A., Running, S. W., Votava, P., El-Saleous, N., Devadiga, S., Su, Y., and Salomonson, V. V.: Large seasonal swings in leaf area of Amazon rainforests, P. Natl. Acad. Sci. USA, 104, 4820–4823, https://doi.org/10.1073/pnas.0611338104, 2007.
Nepstad, D. C., Stickler, C. M., Soares-Filho, B., and Merry, F.: Interactions among Amazon land use, forests and climate: prospects for a near-term forest tipping point, Philos. T. Roy. Soc. B, 363, 1737–1746, https://doi.org/10.1098/rstb.2007.0036, 2008.
Paca, V. H. d. M., Espinoza-Dávalos, G. E., Hessels, T. M., Moreira, D. M., Comair, G. F., and Bastiaanssen, W. G. M.: The spatial variability of actual evapotranspiration across the Amazon River Basin based on remote sensing products validated with flux towers, Ecological Processes, 8, 6, https://doi.org/10.1186/s13717-019-0158-8, 2019.
Pan, S., Pan, N., Tian, H., Friedlingstein, P., Sitch, S., Shi, H., Arora, V. K., Haverd, V., Jain, A. K., Kato, E., Lienert, S., Lombardozzi, D., Nabel, J. E. M. S., Ottlé, C., Poulter, B., Zaehle, S., and Running, S. W.: Evaluation of global terrestrial evapotranspiration using state-of-the-art approaches in remote sensing, machine learning and land surface modeling, Hydrol. Earth Syst. Sci., 24, 1485–1509, https://doi.org/10.5194/hess-24-1485-2020, 2020.
Paredes-Trejo, F. J., Barbosa, H. A., and Lakshmi Kumar, T. V.: Validating CHIRPS-based satellite precipitation estimates in Northeast Brazil, J. Arid Environ., 139, 26–40, https://doi.org/10.1016/j.jaridenv.2016.12.009, 2017.
Pinzón, J. E., Brown, M. E., and Tucker, C. J.: EMD CORRECTION OF ORBITAL DRIFT ARTIFACTS IN SATELLITE DATA STREAM, in: Hilbert-Huang Transform and Its Applications, edited by: Huang, N. E., and Shen, S. S. P., World Scientific, Interdisciplinary Mathematical Sciences, 16, 167–186, 2005.
Priestley, C. and Taylor, R.: On the assessment of surface heat flux and evaporation using large-scale parameters, Mon. Weather Rev., 100, 81–92, 1972.
Restrepo-Coupe, N., da Rocha, H. R., Hutyra, L. R., da Araujo, A. C., Borma, L. S., Christoffersen, B., Cabral, O. M. R., de Camargo, P. B., Cardoso, F. L., da Costa, A. C. L., Fitzjarrald, D. R., Goulden, M. L., Kruijt, B., Maia, J. M. F., Malhi, Y., Manzi, A. O., Miller, S. D., Nobre, A. D., von Randow, C., Sá, L. D. A., Sakai, R. K., Tota, J., Wofsy, S. C., Zanchi, F. B., and Saleska, S. R.: What drives the seasonality of photosynthesis across the Amazon basin? A cross-site analysis of eddy flux tower measurements from the Brasil flux network, Agr. Forest Meteorol., 182–183, 128–144, 2013.
Rodell, M. and Famiglietti, J. S.: Detectability of variations in continental water storage from satellite observations of the time dependent gravity field, Water Resour. Res., 35, 2705–2723, https://doi.org/10.1029/1999WR900141, 1999.
Rodell, M., McWilliams, E. B., Famiglietti, J. S., Beaudoing, H. K., and Nigro, J.: Estimating evapotranspiration using an observation based terrestrial water budget, Hydrol. Process., 25, 4082–4092, https://doi.org/10.1002/hyp.8369, 2011.
Ruhoff, A. L., Paz, A. R., Aragao, L., Mu, Q., Malhi, Y., Collischonn, W., Rocha, H. R., and Running, S. W.: Assessment of the MODIS global evapotranspiration algorithm using eddy covariance measurements and hydrological modelling in the Rio Grande basin, Hydrolog. Sci. J., 58, 1658–1676, https://doi.org/10.1080/02626667.2013.837578, 2013.
Running, S. W., Mu, Q., Zhao, M., and Moreno, A.: MODIS Global Terrestrial Evapotranspiration (ET) Product (MOD16A2/A3 and Year-End Gap-Filled MOD16A2GF/A3GF) NASA Earth Observing System MODIS Land Algorithm (For Collection 6), National Aeronautics and Space Administration, Washington, DC, USA [data set], https://doi.org/10.5067/MODIS/MOD16A2.006, 2019 (data available at: https://lpdaac.usgs.gov/products/mod16a2v006/, last access: 1 June 2020).
Salati, E. and Vose, P. B.: Amazon Basin: A System in Equilibrium, Science, 225, 129–138, https://doi.org/10.1126/science.225.4658.129, 1984.
Salati, E., Dall'Olio, A., Matsui, E., and Gat, J. R.: Recycling of water in the Amazon basin: an isotopic study, Water Resour. Res., 15, 1250–1258, 1979.
Saleska, S. R., Da Rocha, H. R., Huete, A. R., Nobre, A. D., Artaxo, P. E., and Shimabukuro, Y. E.: LBA-ECO CD-32 Flux Tower Network Data Compilation, Brazilian Amazon: 1999–2006, Oak Ridge National Laboratory Distributed Active Archive Center, Oak Ridge, Tennessee, USA [data set], https://doi.org/10.3334/ORNLDAAC/1174, 2013 (data available at: https://daac.ornl.gov/cgi-bin/dsviewer.pl?ds_id=1174, last access: 1 January 2020).
Saleska, S. R., Wu, J., Guan, K., Araujo, A. C., Huete, A., Nobre, A. D., and Restrepo-Coupe, N.: Dry-season greening of Amazon forests, Nature, 531, E4–E5, https://doi.org/10.1038/nature16457, 2016.
Schlesinger, W. H. and Jasechko, S.: Transpiration in the global water cycle, Agr. Forest Meteorol., 189–190, 115–117, https://doi.org/10.1016/j.agrformet.2014.01.011, 2014.
Schwalm, C. R., Huntinzger, D. N., Michalak, A. M., Fisher, J. B., Kimball, J. S., Mueller, B., Zhang, K., and Zhang, Y.: Sensitivity of inferred climate model skill to evaluation decisions: a case study using CMIP5 evapotranspiration, Environ. Res. Lett., 8, 024028, https://doi.org/10.1088/1748-9326/8/2/024028, 2013.
Seyler, F., Muller, F., Cochonneau, G., Guimarães, L., and Guyot, J. L.: Watershed delineation for the Amazon sub-basin system using GTOPO30 DEM and a drainage network extracted from JERS SAR images, Hydrol. Process., 23, 3173–3185, https://doi.org/10.1002/hyp.7397, 2009.
Shi, M., Liu, J., Worden, J. R., Bloom, A. A., Wong, S., and Fu, R.: The 2005 Amazon Drought Legacy Effect Delayed the 2006 Wet Season Onset, Geophys. Res. Lett., 46, 9082–9090, https://doi.org/10.1029/2019gl083776, 2019.
Silvério, D. V., Brando, P. M., Macedo, M. N., Beck, P. S., Bustamante, M., and Coe, M. T.: Agricultural expansion dominates climate changes in southeastern Amazonia: the overlooked non-GHG forcing, Environ. Res. Lett., 10, 104015, https://doi.org/10.1088/1748-9326/10/10/104015, 2015.
Skinner, C. B., Poulsen, C. J., Chadwick, R., Diffenbaugh, N. S., and Fiorella, R. P.: The Role of Plant CO2 Physiological Forcing in Shaping Future Daily-Scale Precipitation, J. Climate, 30, 2319–2340, https://doi.org/10.1175/JCLI-D-16-0603.1, 2017.
Sörensson, A. A. and Ruscica, R. C.: Intercomparison and Uncertainty Assessment of Nine Evapotranspiration Estimates Over South America, Water Resour. Res., 54, 2891–2908, https://doi.org/10.1002/2017wr021682, 2018.
Spracklen, D. V., Arnold, S. R., and Taylor, C. M.: Observations of increased tropical rainfall preceded by air passage over forests, Nature, 489, 282–285, https://doi.org/10.1038/nature11390, 2012.
Spracklen, D. V., Baker, J. C. A., Garcia-Carreras, L., and Marsham, J.: The Effects of Tropical Vegetation On Rainfall, Annu. Rev. Env. Resour., 43, 14.11–14.26, https://doi.org/10.1146/annurev-environ-102017-030136, 2018.
Sun, L., Baker, J. C. A., Gloor, E., Spracklen, D., Boesch, H., Somkuti, P., Maeda, E., and Buermann, W.: Seasonal and Inter-annual Variation of Evapotranspiration in Amazonia Based on Precipitation, River Discharge and Gravity Anomaly Data, Frontiers in Earth Science, 7, 1–9, https://doi.org/10.3389/feart.2019.00032, 2019.
Swann, A. L. S. and Koven, C. D.: A Direct Estimate of the Seasonal Cycle of Evapotranspiration over the Amazon Basin, J. Hydrometeorol., 18, 2173–2185, https://doi.org/10.1175/jhm-d-17-0004.1, 2017.
Taylor, K. E., Stouffer, R. J., and Meehl, G. A.: An Overview of CMIP5 and the Experiment Design, B. Am. Meteorol. Soc., 93, 485–498, https://doi.org/10.1175/bams-d-11-00094.1, 2012 (data available at: https://esgf-index1.ceda.ac.uk/search/cmip5-ceda/, last access: 1 January 2020).
Teuling, A. J.: A Forest Evapotranspiration Paradox Investigated Using Lysimeter Data, Vadose Zone J., 17, 1–7, https://doi.org/10.2136/vzj2017.01.0031, 2018.
Timpe, K. and Kaplan, D.: The changing hydrology of a dammed Amazon, Science Advances, 3, e1700611, https://doi.org/10.1126/sciadv.1700611, 2017.
van der Ent, R. J., Savenije, H. H., Schaefli, B., and Steele-Dunne, S. C.: Origin and fate of atmospheric moisture over continents, Water Resour. Res., 46, W09525, https://doi.org/10.1029/2010WR009127, 2010.
Victoria, R. L., Martinelli, L. A., Jefferson, M., and Jeffrey, R.: Mechanisms of Water Recycling in the Amazon Basin: Isotopic Insights, Ambio, 20, 384–387, 1991.
von Randow, C., Manzi, A. O., Kruijt, B., de Oliveira, P. J., Zanchi, F. B., Silva, R. L., Hodnett, M. G., Gash, J. H. C., Elbers, J. A., Waterloo, M. J., Cardoso, F. L., and Kabat, P.: Comparative measurements and seasonal variations in energy and carbon exchange over forest and pasture in South West Amazonia, Theor. Appl. Climatol., 78, 5–26, https://doi.org/10.1007/s00704-004-0041-z, 2004.
Wang, K. and Dickinson, R. E.: A review of global terrestrial evapotranspiration: Observation, modeling, climatology, and climatic variability, Rev. Geophys., 50, RG2005, https://doi.org/10.1029/2011rg000373, 2012.
Watkins, M. M., Wiese, D. N., Yuan, D.-N., Boening, C., and Landerer, F. W.: Improved methods for observing Earth's time variable mass distribution with GRACE using spherical cap mascons, J. Geophys. Res.-Sol. Ea., 120, 2648–2671, https://doi.org/10.1002/2014jb011547, 2015.
Wei, Z., Yoshimura, K., Wang, L., Miralles, D. G., Jasechko, S., and Lee, X.: Revisiting the contribution of transpiration to global terrestrial evapotranspiration, Geophys. Res. Lett., 44, 2792–2801, https://doi.org/10.1002/2016gl072235, 2017.
Werth, D. and Avissar, R.: The Regional Evapotranspiration of the Amazon, J. Hydrometeorol., 5, 100–109, https://doi.org/10.1175/1525-7541(2004)005<0100:Treota>2.0.Co;2, 2004.
Wiese, D. N., Yuan, D.-N., Boening, C., Landerer, F. W., and Watkins, M. M.: JPL GRACE and GRACE-FO Mascon Ocean, Ice, and Hydrology Equivalent Water Height Coastal Resolution Improvement (CRI) Filtered Release 06 Version 02, PO.DAAC, CA, USA [data set], https://doi.org/10.5067/TEMSC-3JC62, 2019 (data available at: https://podaac-opendap.jpl.nasa.gov/opendap/allData/tellus/L3/mascon/RL06/JPL/v02/CRI/netcdf/, last access: 6 May 2020).
Wiese, D. N., Landerer, F. W., and Watkins, M. M.: Quantifying and reducing leakage errors in the JPL RL05M GRACE mascon solution, Water Resour. Res., 52, 7490–7502, https://doi.org/10.1002/2016wr019344, 2016.
Wilson, K., Goldstein, A., Falge, E., Aubinet, M., Baldocchi, D., Berbigier, P., Bernhofer, C., Ceulemans, R., Dolman, H., Field, C., Grelle, A., Ibrom, A., Law, B. E., Kowalski, A., Meyers, T., Moncrieff, J., Monson, R., Oechel, W., Tenhunen, J., Valentini, R., and Verma, S.: Energy balance closure at FLUXNET sites, Agr. Forest Meteorol., 113, 223–243, https://doi.org/10.1016/S0168-1923(02)00109-0, 2002.
Wright, J. S., Fu, R., Worden, J. R., Chakraborty, S., Clinton, N. E., Risi, C., Sun, Y., and Yin, L.: Rainforest-initiated wet season onset over the southern Amazon, P. Natl. Acad. Sci. USA, 114, 8481–8486, https://doi.org/10.1073/pnas.1621516114, 2017.
Wu, J., Lakshmi, V., Wang, D., Lin, P., Pan, M., Cai, X., Wood, E. F., and Zeng, Z.: The Reliability of Global Remote Sensing Evapotranspiration Products over Amazon, Remote Sensing, 12, 2211, https://doi.org/10.3390/rs12142211, 2020.
Yan, K., Park, T., Yan, G., Chen, C., Yang, B., Liu, Z., Nemani, R. R., Knyazikhin, Y., and Myneni, R. B.: Evaluation of MODIS LAI/FPAR Product Collection 6. Part 1: Consistency and Improvements, Remote Sensing, 8, 1–16, 2016a.
Yan, K., Park, T., Yan, G., Liu, Z., Yang, B., Chen, C., Nemani, R. R., Knyazikhin, Y., and Myneni, R. B.: Evaluation of MODIS LAI/FPAR product collection 6. Part 2: Validation and intercomparison, Remote Sensing, 8, 460, https://doi.org/10.3390/rs8060460, 2016b.
Yin, L., Fu, R., Shevliakova, E., and Dickinson, R. E.: How well can CMIP5 simulate precipitation and its controlling processes over tropical South America?, Clim. Dynam., 41, 3127–3143, https://doi.org/10.1007/s00382-012-1582-y, 2013.
Zemp, D. C., Schleussner, C.-F., Barbosa, H. M. J., van der Ent, R. J., Donges, J. F., Heinke, J., Sampaio, G., and Rammig, A.: On the importance of cascading moisture recycling in South America, Atmos. Chem. Phys., 14, 13337–13359, https://doi.org/10.5194/acp-14-13337-2014, 2014.
Zemp, D. C., Schleussner, C.-F., Barbosa, H. M. J., Hirota, M., Montade, V., Sampaio, G., Staal, A., Wang-Erlandsson, L., and Rammig, A.: Self-amplified Amazon forest loss due to vegetation-atmosphere feedbacks, Nat. Commun., 8, 1–10, https://doi.org/10.1038/ncomms14681, 2017a.
Zemp, D. C., Schleussner, C.-F., Barbosa, H. M. J., and Rammig, A.: Deforestation effects on Amazon forest resilience, Geophys. Res. Lett., 44, 6182–6190, https://doi.org/10.1002/2017gl072955, 2017b.
Zeng, Z., Piao, S., Lin, X., Yin, G., Peng, S., Ciais, P., and Myneni, R. B.: Global evapotranspiration over the past three decades: estimation based on the water balance equation combined with empirical models, Environ. Res. Lett., 7, 014026, https://doi.org/10.1088/1748-9326/7/1/014026, 2012.
Zhang, K., Kimball, J. S., Nemani, R. R., and Running, S. W.: A continuous satellite-derived global record of land surface evapotranspiration from 1983 to 2006, Water Resour. Res., 46, W09522, https://doi.org/10.1029/2009wr008800, 2010 (data available at: http://files.ntsg.umt.edu/data/ET_global_monthly/Global_8kmResolution/, last access: 1 June 2020).
Zhang, K., Almeida Castanho, A. D., Galbraith, D. R., Moghim, S., Levine, N. M., Bras, R. L., Coe, M. T., Costa, M. H., Malhi, Y., and Longo, M.: The fate of Amazonian ecosystems over the coming century arising from changes in climate, atmospheric CO2, and land use, Glob. Change Biol., 21, 2569–2587, https://doi.org/10.1111/gcb.12903, 2015a.
Zhang, K., Kimball, J. S., Nemani, R. R., Running, S. W., Hong, Y., Gourley, J. J., and Yu, Z.: Vegetation Greening and Climate Change Promote Multidecadal Rises of Global Land Evapotranspiration, Scientific Reports, 5, 15956, https://doi.org/10.1038/srep15956, 2015b.
Zhang, K., Kimball, J. S., and Running, S. W.: A review of remote sensing based actual evapotranspiration estimation, WIREs Water, 3, 834–853, https://doi.org/10.1002/wat2.1168, 2016.
Zhang, L., Dawes, W. R., and Walker, G. R.: Response of mean annual evapotranspiration to vegetation changes at catchment scale, Water Resour. Res., 37, 701–708, https://doi.org/10.1029/2000wr900325, 2001.
Zhang, Y., Peña-Arancibia, J. L., McVicar, T. R., Chiew, F. H. S., Vaze, J., Liu, C., Lu, X., Zheng, H., Wang, Y., Liu, Y. Y., Miralles, D. G., and Pan, M.: Multi-decadal trends in global terrestrial evapotranspiration and its components, Scientific Reports, 6, 19124, https://doi.org/10.1038/srep19124, 2016.