the Creative Commons Attribution 4.0 License.
the Creative Commons Attribution 4.0 License.
 | 23 Apr 2021
Exploring the role of hydrological pathways in modulating multi-annual climate teleconnection periodicities from UK rainfall to streamflow
Mark Cuthbert
John Bloomfield
Ron Corstanje
Nicholas Howden
Ian Holman
An understanding of multi-annual behaviour in streamflow allows for better estimation of the risks associated with hydrological extremes. This can enable improved preparedness for streamflow-dependant services, such as freshwater ecology, drinking water supply and agriculture. Recently, efforts have focused on detecting relationships between long-term hydrological behaviour and oscillatory climate systems (such as the North Atlantic Oscillation – NAO). For instance, the approximate 7 year periodicity of the NAO has been detected in groundwater-level records in the North Atlantic region, providing potential improvements to the preparedness for future water resource extremes due to their repetitive, periodic nature. However, the extent to which these 7-year, NAO-like signals are propagated to streamflow, and the catchment processes that modulate this propagation, are currently unknown. Here, we show statistically significant evidence that these 7-year periodicities are present in streamflow (and associated catchment rainfall), by applying multi-resolution analysis to a large data set of streamflow and associated catchment rainfall across the UK. Our results provide new evidence for spatial patterns of NAO periodicities in UK rainfall, with areas of greatest NAO signal found in southwest England, south Wales, Northern Ireland and central Scotland, and show that NAO-like periodicities account for a greater proportion of streamflow variability in these areas. Furthermore, we find that catchments with greater subsurface pathway contribution, as characterised by the baseflow index (BFI), generally show increased NAO-like signal strength and that subsurface response times (as characterised by groundwater response time – GRT), of between 4 and 8 years, show a greater signal presence. Our results provide a foundation of understanding for the screening and use of streamflow teleconnections for improving the practice and policy of long-term streamflow resource management.
- Article
(7330 KB) - Full-text XML
- BibTeX
- EndNote


Meteorological conditions in many parts of the world are modulated by large-scale ocean–atmosphere systems, such as the Pacific Decadal Oscillation (PDO) and El Niño–Southern Oscillation (ENSO) in the western US (DeFlorio et al., 2013) and the North Atlantic Oscillation (NAO) in Europe (Trigo et al., 2002; Hurrell and Van Loon, 1997), with important multi-annual periodicities (Labat, 2010; Kuss and Gurdak, 2014). The NAO, a dipolar system of atmospheric pressure in the North Atlantic region (Hurrell and Deser, 2010), has been shown to account for the majority of European rainfall variability during the winter months and is particularly influential in western Europe (West et al., 2019; Uvo, 2003; Alexander et al., 2005; López-Moreno et al., 2011). This is achieved through a modulation of westerly storm tracks (Trigo et al., 2002; Dawson et al., 2004) and Gulf Stream strength (Frankignoul et al., 2001; Chaudhuri et al., 2011; Watelet et al., 2017) by the winter state of the NAO. As such, the NAO has been shown to drive hydrological variability in Europe, including river flow (Kingston et al., 2011; Svensson et al., 2015) and groundwater systems (Rust et al., 2019; Neves et al., 2019; Holman et al., 2011).
In addition to sub-annual variability, the NAO has been shown to exhibit a weak multi-annual cycle of between 6 and 9 years, often described as pseudo-periodic due to its varying strength (Hurrell et al., 2003; Zhang et al., 2011; Olsen et al., 2012). Despite this reported weakness, many hydroclimatology studies have identified a relationship between the NAO index (NAOI) and groundwater-level records, at multi-annual frequencies, in the USA (e.g Kuss and Gurdak, 2014), continental Europe (e.g. Neves et al., 2019) and the UK (e.g. Holman et al., 2011). The strength of these detected cycles in groundwater records is often considerably stronger than those found in the NAOI, indicating that the 6–9 year periodicity of the NAO may still yield a considerable modulation on hydrological systems that are sensitive to long-term changes in water fluxes, such as groundwater stores. (Bloomfield and Marchant, 2013; Forootan et al., 2018; Van Loon, 2015). Rust et al. (2019) compared NAO-like periodicities in composite rainfall records and groundwater levels in the UK's principal aquifers, demonstrating the degree to which multi-annual periodic signals (similar to those in the NAO) can be modulated through part of the hydrological cycle. Given the presence of these multi-annual cycles in both UK rainfall and groundwater records, it follows that these signals may be propagated to streamflow, particularly in groundwater-dominated streams such as those found in many parts of southern and eastern England (Bloomfield et al., 2009). High baseflow streams are often critical for the function of public water supply and freshwater ecosystems and provide a greater amenity value for surrounding areas (Acreman and Dunbar, 2004). Therefore, an understanding of the catchment processes that modulate multi-annual cycles in streamflow may provide a new opportunity to better manage the long-term use and sustainability of these streamflow-dependant services (Acreman and Dunbar, 2004; Chun et al., 2009). While existing studies have shown that the winter-averaged NAO can modulate streamflow in the UK at an annual scale (Kingston et al., 2006), the strength and spatiality of multi-annual cycles in streamflow, and the catchment processes that modulate them, have yet to be assessed.
Hydrological pathways are often used to conceptualise the propagation of effective rainfall signals (rainfall minus evapotranspiration) through a catchment to streamflow (Misumi et al., 2001; Bracken et al., 2013; Crossman et al., 2014; Lane et al., 2019). For example, surface pathways are the result of infiltration- or saturation-excess runoff from the land surface and provide a direct response to rainfall of the order of hours or days (Nathan and McMahon, 1990; Gericke and Smithers, 2014; Kronholm and Capel, 2016). Subsurface pathways (such as the travel of water through the unsaturated zone and groundwater flow paths to channel baseflow) exhibit generally lower celerities than surface pathways and can produce a protracted response to rainfall of the order of months or years, where faster subsurface pathways dominate (Carr and Simpson, 2018; Hellwig and Stahl, 2018), but range to decades or even millennia for longer, deeper groundwater flow pathways with low hydraulic diffusivity (Rousseau-Gueutin et al., 2013; Cuthbert et al., 2019). Existing research into periodic NAO teleconnections with groundwater resources has highlighted the importance of subsurface pathway responsiveness in modulating NAO-like signals in groundwater stores (Kuss and Gurdak, 2014; Neves et al., 2019; Rust et al., 2019). Where a groundwater resource receives a periodic recharge signal (such as those from a climatic teleconnection), Townley (1995) suggests that pathways with response times shorter than the period length will propagate these signals to baseflow more effectively and with minimal damping. Conversely, groundwater pathways with response times longer than the period length cannot convey these signals to the stream at a sufficient rate, meaning that the amplitude of the periodic signal is damped as it passes through the aquifer. Therefore, in the case of streamflow, we may expect the following:
-
The propagation of multi-annual periodic signals from rainfall to streamflow that is dependent on the relative contribution of surface and subsurface (e.g. groundwater) hydrological pathways within a catchment.
-
Response times of subsurface pathways will modulate the amplitude of multi-annual periodic signals in streamflow where they are propagated by subsurface pathways.
Finally, these effects (modulation of NAO signal propagation by hydrological pathways) may be expected to differ between winter and summer streamflow. Catchments in the UK have been shown to receive the strongest NAO signals in winter rainfall (Alexander et al., 2005; Hurrell and Deser, 2010; West et al., 2019). However, given the degree of fine-scale variability seen in precipitation records (Meinke et al., 2005), winter streamflow may contain a relatively low signal-to-noise ratio as surface (and some subsurface) hydrological pathways respond to rainfall within the same winter season. Conversely, slower subsurface pathways provide a protracted response to winter rainfall signals and are generally accepted to filter finer-scale variability (Bloomfield and Marchant, 2013). As such, we may expect the NAO teleconnection to have a greater influence on summer streamflow in permeable catchments which have a greater contribution from subsurface pathways (baseflow) and proportionally less contribution from surface pathways. In these instances, we may expect the teleconnection between NAO and UK streamflow may be asymmetric between summer and winter. If multi-annual periodic signals in streamflow are present via a teleconnection with the NAO, their use for improving the long-term projection of hydrological extremes will rely on an understanding of the catchment processes that modulate the strength of these signals and their seasonal sensitivities.
The aim of this paper is to assess the extent to which NAO-like multi-annual signals are propagated from rainfall to streamflow across the UK and to assess how this is modulated by the relative contribution of faster and slower hydrological pathways. We define NAO-like as those multi-annual cycles in hydrometeorological records that cover a wide spatial domain and are similar in length to the 6–9 year periodicity reported in the NAO, which we might expect given the control between the NAO and hydrological systems (Svensson et al., 2015).
This aim will be met by addressing the following research objectives:
-
characterising the strength, statistical significance and spatial distribution of NAO-like multi-annual periodicities in rainfall and associated UK streamflow; and
-
quantifying the relationship between catchment pathway contribution and response times and the NAO teleconnection by comparing NAO-like periodicity strength in summer and winter streamflow.
2.1 Streamflow data
Monthly streamflow data and catchment metadata from the UK National River Flow Archive (NRFA; Dixon et al., 2013; http://nrfa.ceh.ac.uk/, last access: 14 July 2020) has been used in this study. Gauging stations with more than 20 years of continuous streamflow data (and coincident catchment rainfall, discussed in the following section) and no data gaps greater than 12 months were initially selected. Where there were multiple gauging stations in a single named river catchment, only the sites with the largest catchment area were taken forward. This produced a final list of 705 streamflow gauging stations for use in this study. These streamflow records range from 20 to 128 years in length, with a median length of 44.6 years (536 months). These sites provide a representative sample of sites from across the UK, with minimal bias towards the south of England, as indicated by Fig. 1. It should be noted that, ideally, streamflow that has minimal influence from human factors should be used in hydroclimate studies to avoid confounding mechanisms; however, no such large-scale data set exists for the UK. Furthermore, over the period of analysis and the broad scale of this assessment, inconsistences in the way water resource management practices are implements is expected to result in noise to the observations rather than some systematic signal or bias that would affect the results of this paper.
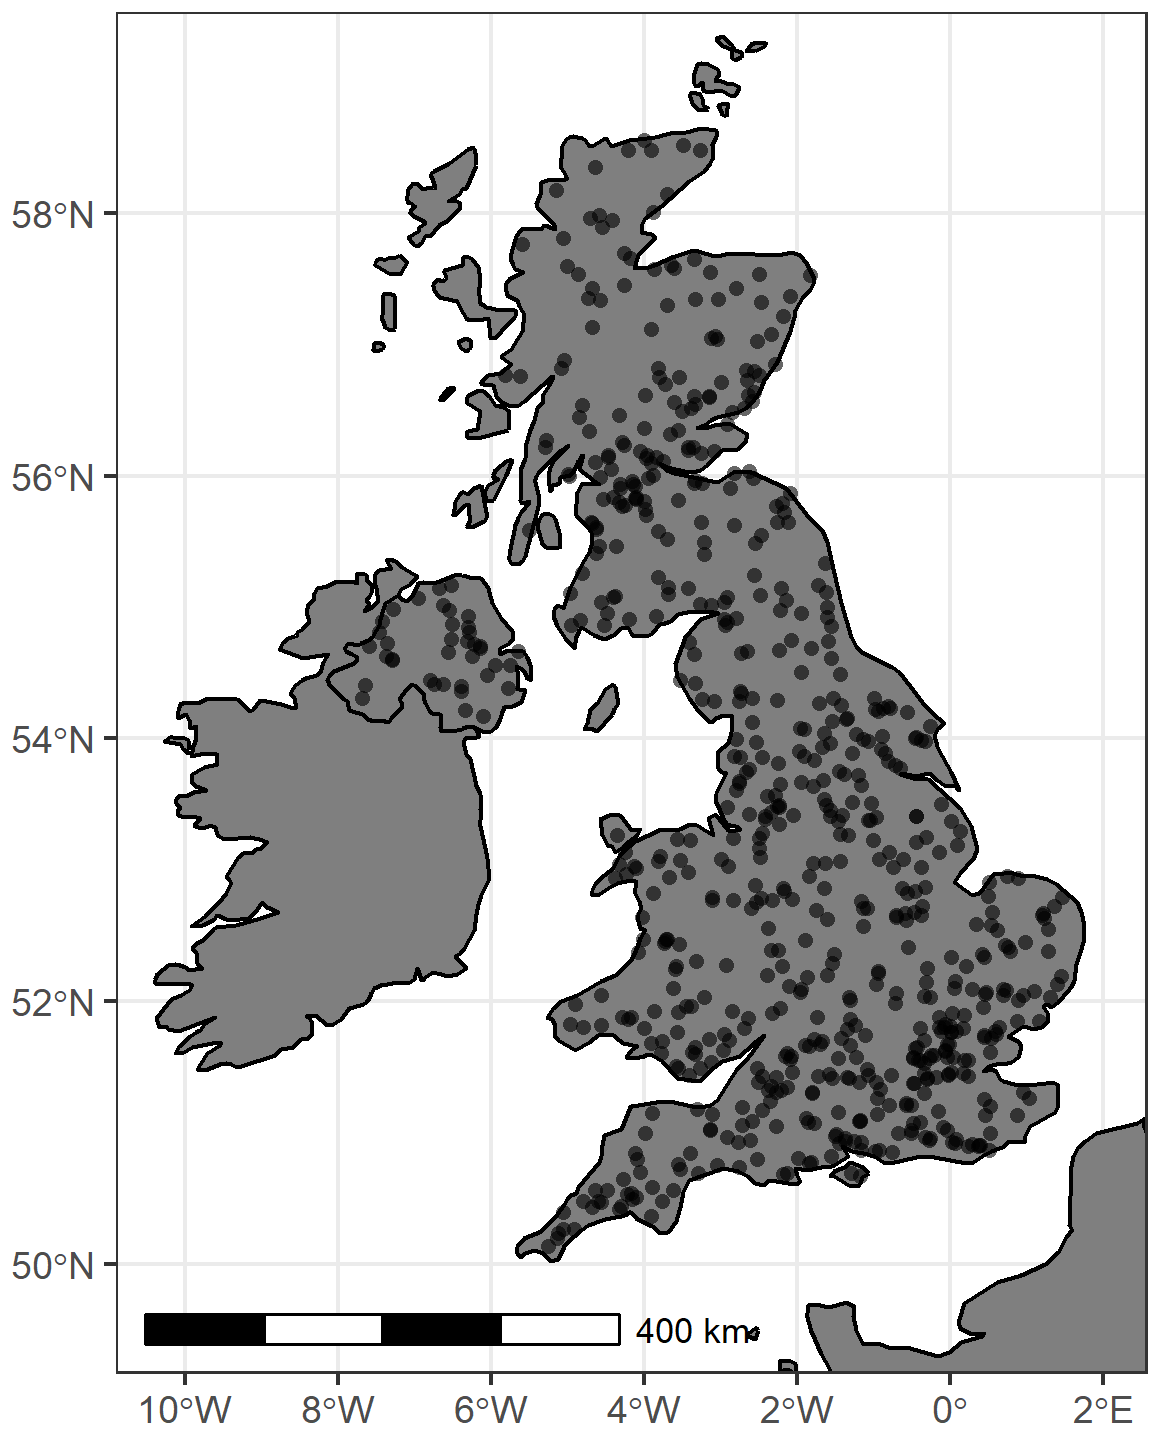
Figure 1Locations of streamflow gauges used in this study.
2.2 Catchment rainfall data
Calculated monthly rainfall totals for each streamflow gauge catchment are also provided by the NRFA. This data set has been derived from CEH-GEAR (Centre for Ecology and Hydrology – Gridded Estimates of Areal Rainfall) data (Tanguy et al., 2019), which cover the 1890–2015 time period, using NRFA catchment boundaries. This catchment rainfall data set has been used in multiple studies investigating catchment hydrology dynamics and catchment response to rainfall signals (Chiverton et al., 2015; Guillod et al., 2018; Gnann et al., 2020).
2.3 Catchment metadata
In order to categorise the relative influence of surface and subsurface hydrological pathways on streamflow, the baseflow index (BFI) from the NRFA has been used for each streamflow gauge (Gustard et al., 1992). The BFI is a calculated proportion of the flow hydrograph (ranging from 0 to 1) that is derived from slower subsurface pathways such as groundwater-driven baseflow, where 1 is entirely baseflow. While empirical, BFI has been shown to be effective in relating physical catchment pathway processes to streamflow behaviour (Bloomfield et al., 2009; Chiverton et al., 2015) in addition to catchment storage. Figure 2a shows the spatial distribution of BFI across the UK. Higher BFI values are generally found in catchments with greater groundwater influence, such as those in southern and eastern England which are dominated by the UK's chalk aquifer (Marsh and Hannaford, 2008). Areas of moderate BFI can also be found where there are substantial superficial or glacial deposits, such as western England, central Wales and eastern Scotland. In this study, BFI has been grouped into low (0–0.25), medium (0.25–0.5), high (0.5–0.75) and very high (0.75–1). Bins at 0.25 intervals have been generated to test the relationship between varying BFI and multi-annual signal presence. While this potentially produces a non-normal distributed categorisation, it is necessary to effectively test a spread of BFI values. This non-normal distribution is mitigated by our choice of significance test described in the methods section.
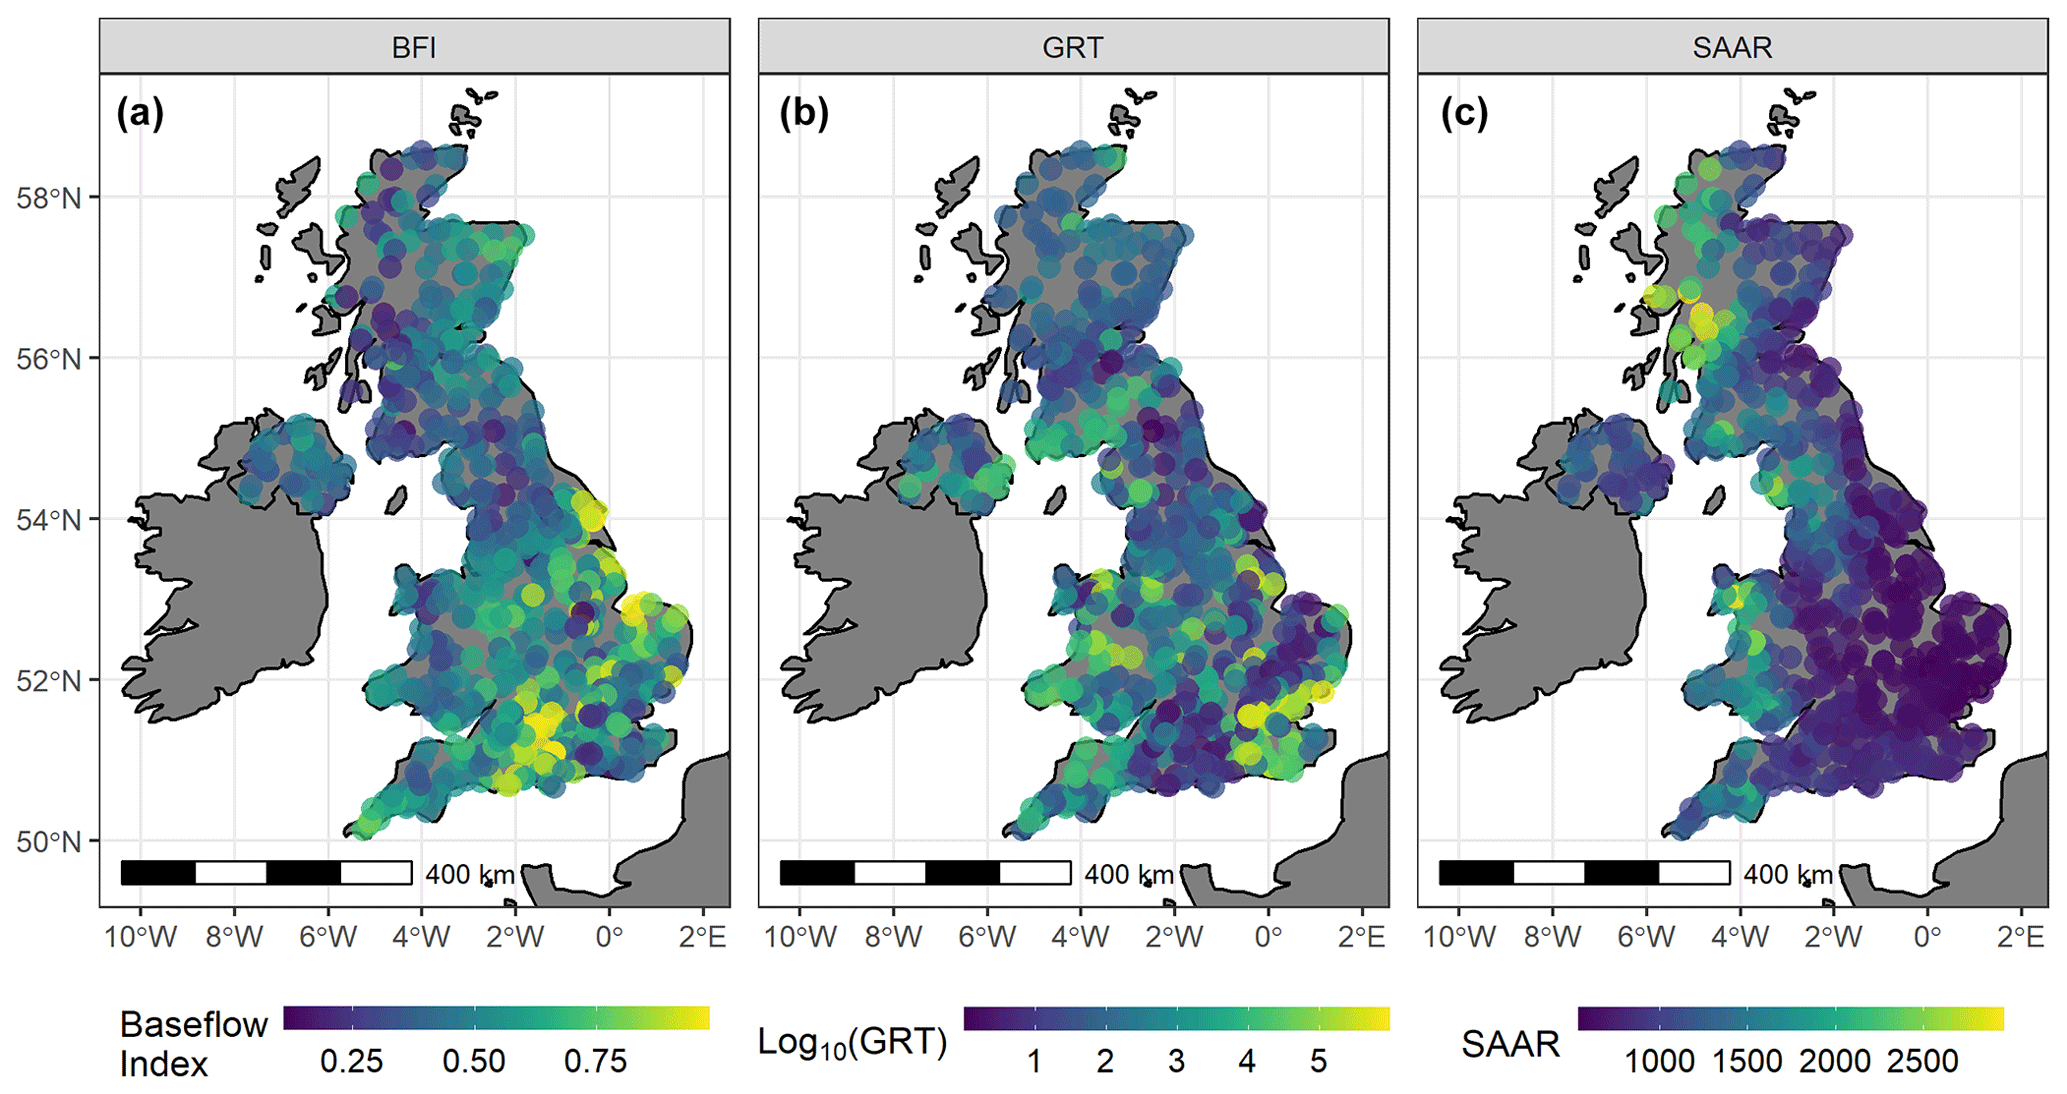
Figure 2Spatial distribution of (a) baseflow index (BFI), (b) log10(GRT) and (c) standard average annual rainfall (SAAR) for each streamflow record.
In addition to the BFI, the global data set of groundwater response times (GRTs), developed by Cuthbert et al. (2019), has been used in this study to estimate the responsiveness of unconfined subsurface pathways. GRT (T) can be conceptualised as a measure of the time required for a groundwater store to return to equilibrium after a perturbation in recharge, and it is given by the following:
where β is a dimensionless constant, T is transmissivity (L2T−1), S is storativity (–) and L is the characteristic groundwater flow path length approximated for unconfined groundwater systems by the distance between perennial streams (L). In this study, the mean GRT was taken for each of the NRFA catchment boundaries for each streamflow gauge. Log10 of GRT is displayed in Fig. 2b for clarity purposes as the GRT ranges from approximately 1 year to approximately a million years (e.g. in very low permeability geological formations) for gauge catchments used in this study. While the mapping of GRT was carried out using global data sets with their inherent uncertainties, it should nevertheless enable categorisation of the likely timescales of groundwater response sufficiently well for the purposes of this paper. GRT is seen to be lowest (indicating shorter response times) in areas similar to areas of higher BFI, i.e. southern and eastern England but excluding the most southeasterly regions which show some of the highest GRT values (indicating longer response times). Lower GRT values are also seen in northern England. While BFI and GRT appear inversely similar in spatial extent, their correlation is low (). This is to be expected as they measure different aspects of the catchment process. Unlike BFI, which is an empirical measure of the degree to which slower pathways contribute to streamflow variability (which may encompass groundwater and throughflow), GRT is an estimate of the responsiveness of groundwater stores. In this study, GRT is grouped into five categories, namely 0–4 years, 4–8 years, 8–16 years, 16–32 years and greater than 32 years.
Finally, standard average annual rainfall (SAAR) for the period 1961–1990 is also provided as metadata in the NRFA. While not used in our analysis, it is provided here to aid later discussion. There is a clear zonal divide in SAAR distribution in the UK, with greater values on the west coast and lower values found on the east coast of the UK and central England; the greatest values are found in western Scotland.
2.4 Methods
2.4.1 Data pre-processing
In this study, we follow a similar pre-processing methodology to that set out in Rust et al. (2019). The following pre-processing steps were undertaken. First, all time series were centred on the long-term mean and normalised to the standard deviation to produce a time series of anomalies. This is to allow spectra between rainfall and streamflow (and between sites across the UK) to be directly compared. From these anomalies, three time series were created for both streamflow and rainfall, namely monthly, winter-averaged (December, January and February – DJF) data and summer-averaged (June, July and August – JJA) data.
2.4.2 Continuous wavelet transform (CWT) and identification of multi-annual periodic signals
The continuous wavelet transform (CWT) is a multi-resolution analysis use to quantify the amplitude of periodic components of a time series. It has been used increasingly on hydrological data sets to extract information on non-stationary periodic behaviours in rainfall (Rashid et al., 2015), river flow (Su et al., 2017) and groundwater (Holman et al., 2011; Kuss and Gurdak, 2014). We use the package of WaveletComp, produced by Rosch and Schmidbauer (2018), for all transformations in this paper. The wavelet power, W, represents a dimensionless, absolute measure of periodic amplitude at a time index, t, and scale index, s, through a convolution of the data sequence (xt) with scaled and time-shifted versions of a wavelet as follows:
where the asterisk represents the complex conjugate, t is the localised time index, s is the wavelet scale, and dt is the increment of the time shifting of the wavelet. The choice of the set of scales, s, determines the wavelet coverage of the series in its frequency domain. The Morlet wavelet was favoured over other candidates due to its good definition in both the time and frequency domains (Tremblay et al., 2011; Holman et al., 2011). Since all data sets have been converted to anomalies prior to the CWT, the calculated wavelet power represents the relative strength of periodicities within the frequency spectra of the anomaly data set. CWT was undertaken on all three data set time resolutions (monthly, winter average and summer average) to gain an understanding of the periodicities within UK seasonal hydrological data.
2.4.3 Wavelet significance testing
Environmental data sets generally exhibit non-zero lag-1 autocorrelations (AR1) due to system storages (Meinke et al., 2005). As a result, they can produce low frequencies as a function of internal variance rather than an external forcing (Allen and Smith, 1996; Meinke et al., 2005; Velasco et al., 2015). In order to assess whether the periodicities detected as part of the CWT are likely to be the result of noise within the data set, a red noise (AR1) significance test has been carried out on all wavelet transforms. For this, 1000 randomly constructed synthetic series with the same AR1 as the original time series were created using Monte Carlo methods. Wavelet spectra maxima from these represent periodicity strength that can arise from a purely red noise process. Wavelet powers from the original data set that are greater than these red periodicities are, therefore, considered to be driven by a process other than red noise, thus rejecting the null hypothesis. It is important to note that this does not test the significance of a relationship with the NAO but simply the probability that any periodicity detected is the result of internal variance. Teleconnection processes are often noisy, meaning that the identification of significant periodic behaviours in hydrological data sets can be problematic (Rust et al., 2019). While we highlight any periodicities equal to or above a 95 % confidence interval (CI) (<=0.05 p values, due to convention), we also report the full range of p-value results in order to accrue an understanding of periodic forcing across the large data set.
2.4.4 Identification of common multi-annual period strengths in rainfall and streamflow
An exploratory approach was undertaken to identify the most prominent, common multi-annual periodicity across the streamflow records. The wavelet powers of defined peaks in the wavelet power spectrum, greater than 1 year, were identified since the NAO is expected to produce a dominant, widespread multi-annual periodicity similar to those found in UK groundwater-level records (Rust et al., 2019). Where no peak multi-annual periodicity was found (this occurred in 20 data sets; ∼3 % of the total data), the maximum wavelet power was identified from within the 25th and 75th percentile of the identified peak wavelet powers from the rest of the streamflow data set. These bounds were used to calculate peak multi-annual periodicities in rainfall data sets for the winter and summer streamflow time resolutions. In order to isolate the relationship between catchment responsiveness and multi-annual signal strength, the effect of spatially varying signal powers in rainfall needs to be minimised. As such, a residual wavelet power was calculated for each of the streamflow gauges by subtracting the rainfall multi-annual wavelet power from the streamflow multi-annual wavelet power. This is, therefore, also a measure of how signal strength is modulated between rainfall and streamflow. For the summer streamflow NAO powers, a pragmatic decision was made to construct the residual using summer streamflow and winter rainfall, given the dominant control of the NAO on winter rainfall totals, the perennial nature of all UK catchments in this study and the expectation that winter recharge will be a dominant driver for summer baseflow (Hannaford and Harvey, 2010). It is important to note that modulation, in this case, refers to a change in the spectral strength of specific periods between rainfall and streamflow and not a measure of change in the amplitude of a temporally periodic behaviour between rainfall and streamflow.
2.4.5 Testing the relationship between NAO-like signal strength and hydrological pathway characteristics
In order to test the significance of the relationship between the BFI and GRT groups and NAO-like signal presence, the Mann–Whitney U test (MWU) was undertaken. The MWU tests the null hypothesis that it is equally likely that a randomly selected value from one population will be different to a randomly selected value from a second population. We use this test here to investigate whether populations from each successive pair of ordinal groups (e.g. low to medium for BFI) have significantly different distributions. The MWU is appropriate for non-normally distributed BFI and GRT data sets.
3.1 Average wavelet power and p values
Wavelet power spectra and p values for each of the 705 streamflow and catchment rainfall records are displayed in Figs. 3 and 4, respectively. Average wavelet power and p values across all sites are shown by the thick line in each plot. Wavelet power is a measure of the relative strength of periodic behaviour (periodicity) within a data set. It should be noted that these spectra are produced from normalised monthly, winter and summer data sets and, as such, represent signal presence relative to the variance of the individual data set. In the monthly streamflow and rainfall spectra figures, two discrete bands of periodicity can be seen in the average wavelet powers. These are centred on the 1-year and, approximately, 7-year periodicity, with average 1-year wavelet powers of 0.661 (range – 0.113–0.980) for streamflow and 0.284 (range – 0.051–0.621) for catchment rainfall and average 7-year wavelet powers of 0.056 (range – 0.002–0.360) for streamflow and 0.036 (range – 0.003 and 0.070) for rainfall. The ∼7-year periodicity (P7) signal is also exhibited as discrete periodicities in the seasonal data, with mean P7 wavelet powers of 0.274 (0.029–0.582) and 0.198 (0.010–0.571) for winter and summer streamflow and 0.253 (0.015–0.472) and 0.107 (0.006–0.535) for winter and summer catchment rainfall, respectively.
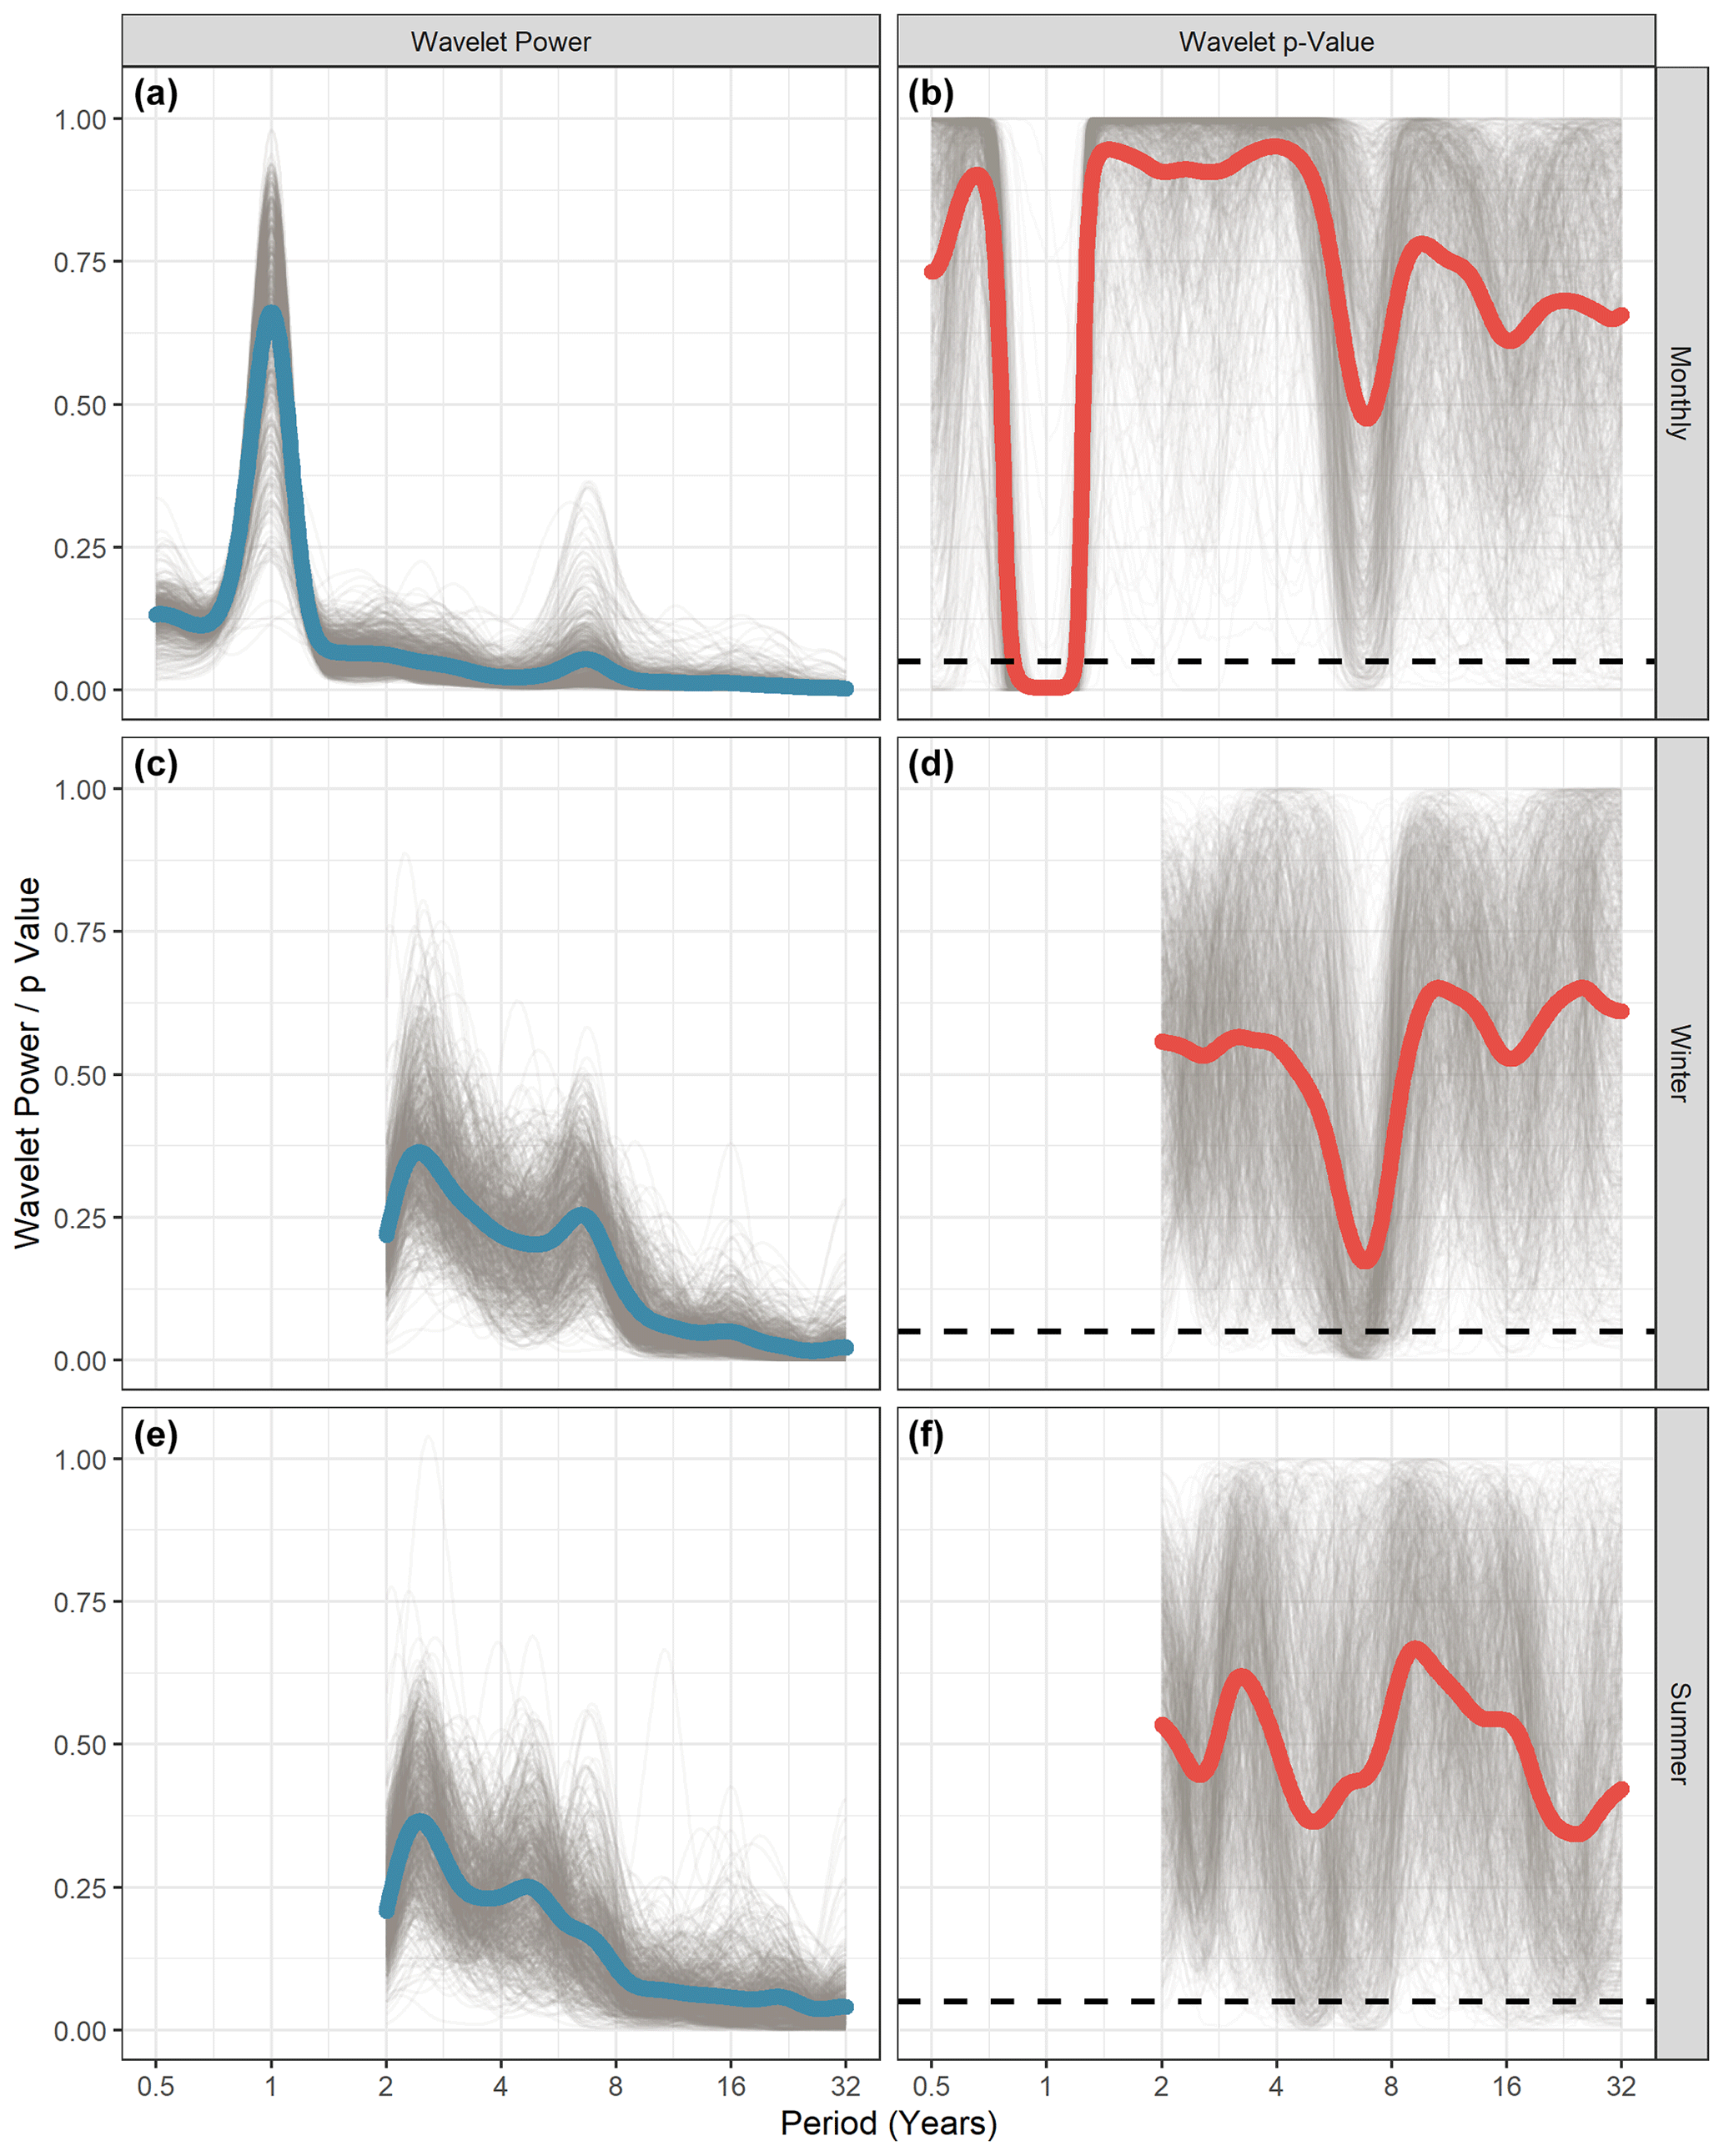
Figure 3Stacked streamflow wavelet spectra power (a, c, e) and p values (b, d, f) from the normalised monthly, winter and summer resolution data of 705 catchments. The 95 % confidence interval is shown as a dashed black line in the right column figures. The opacity of each average spectra line has been lowered to allow general trends to be identified.
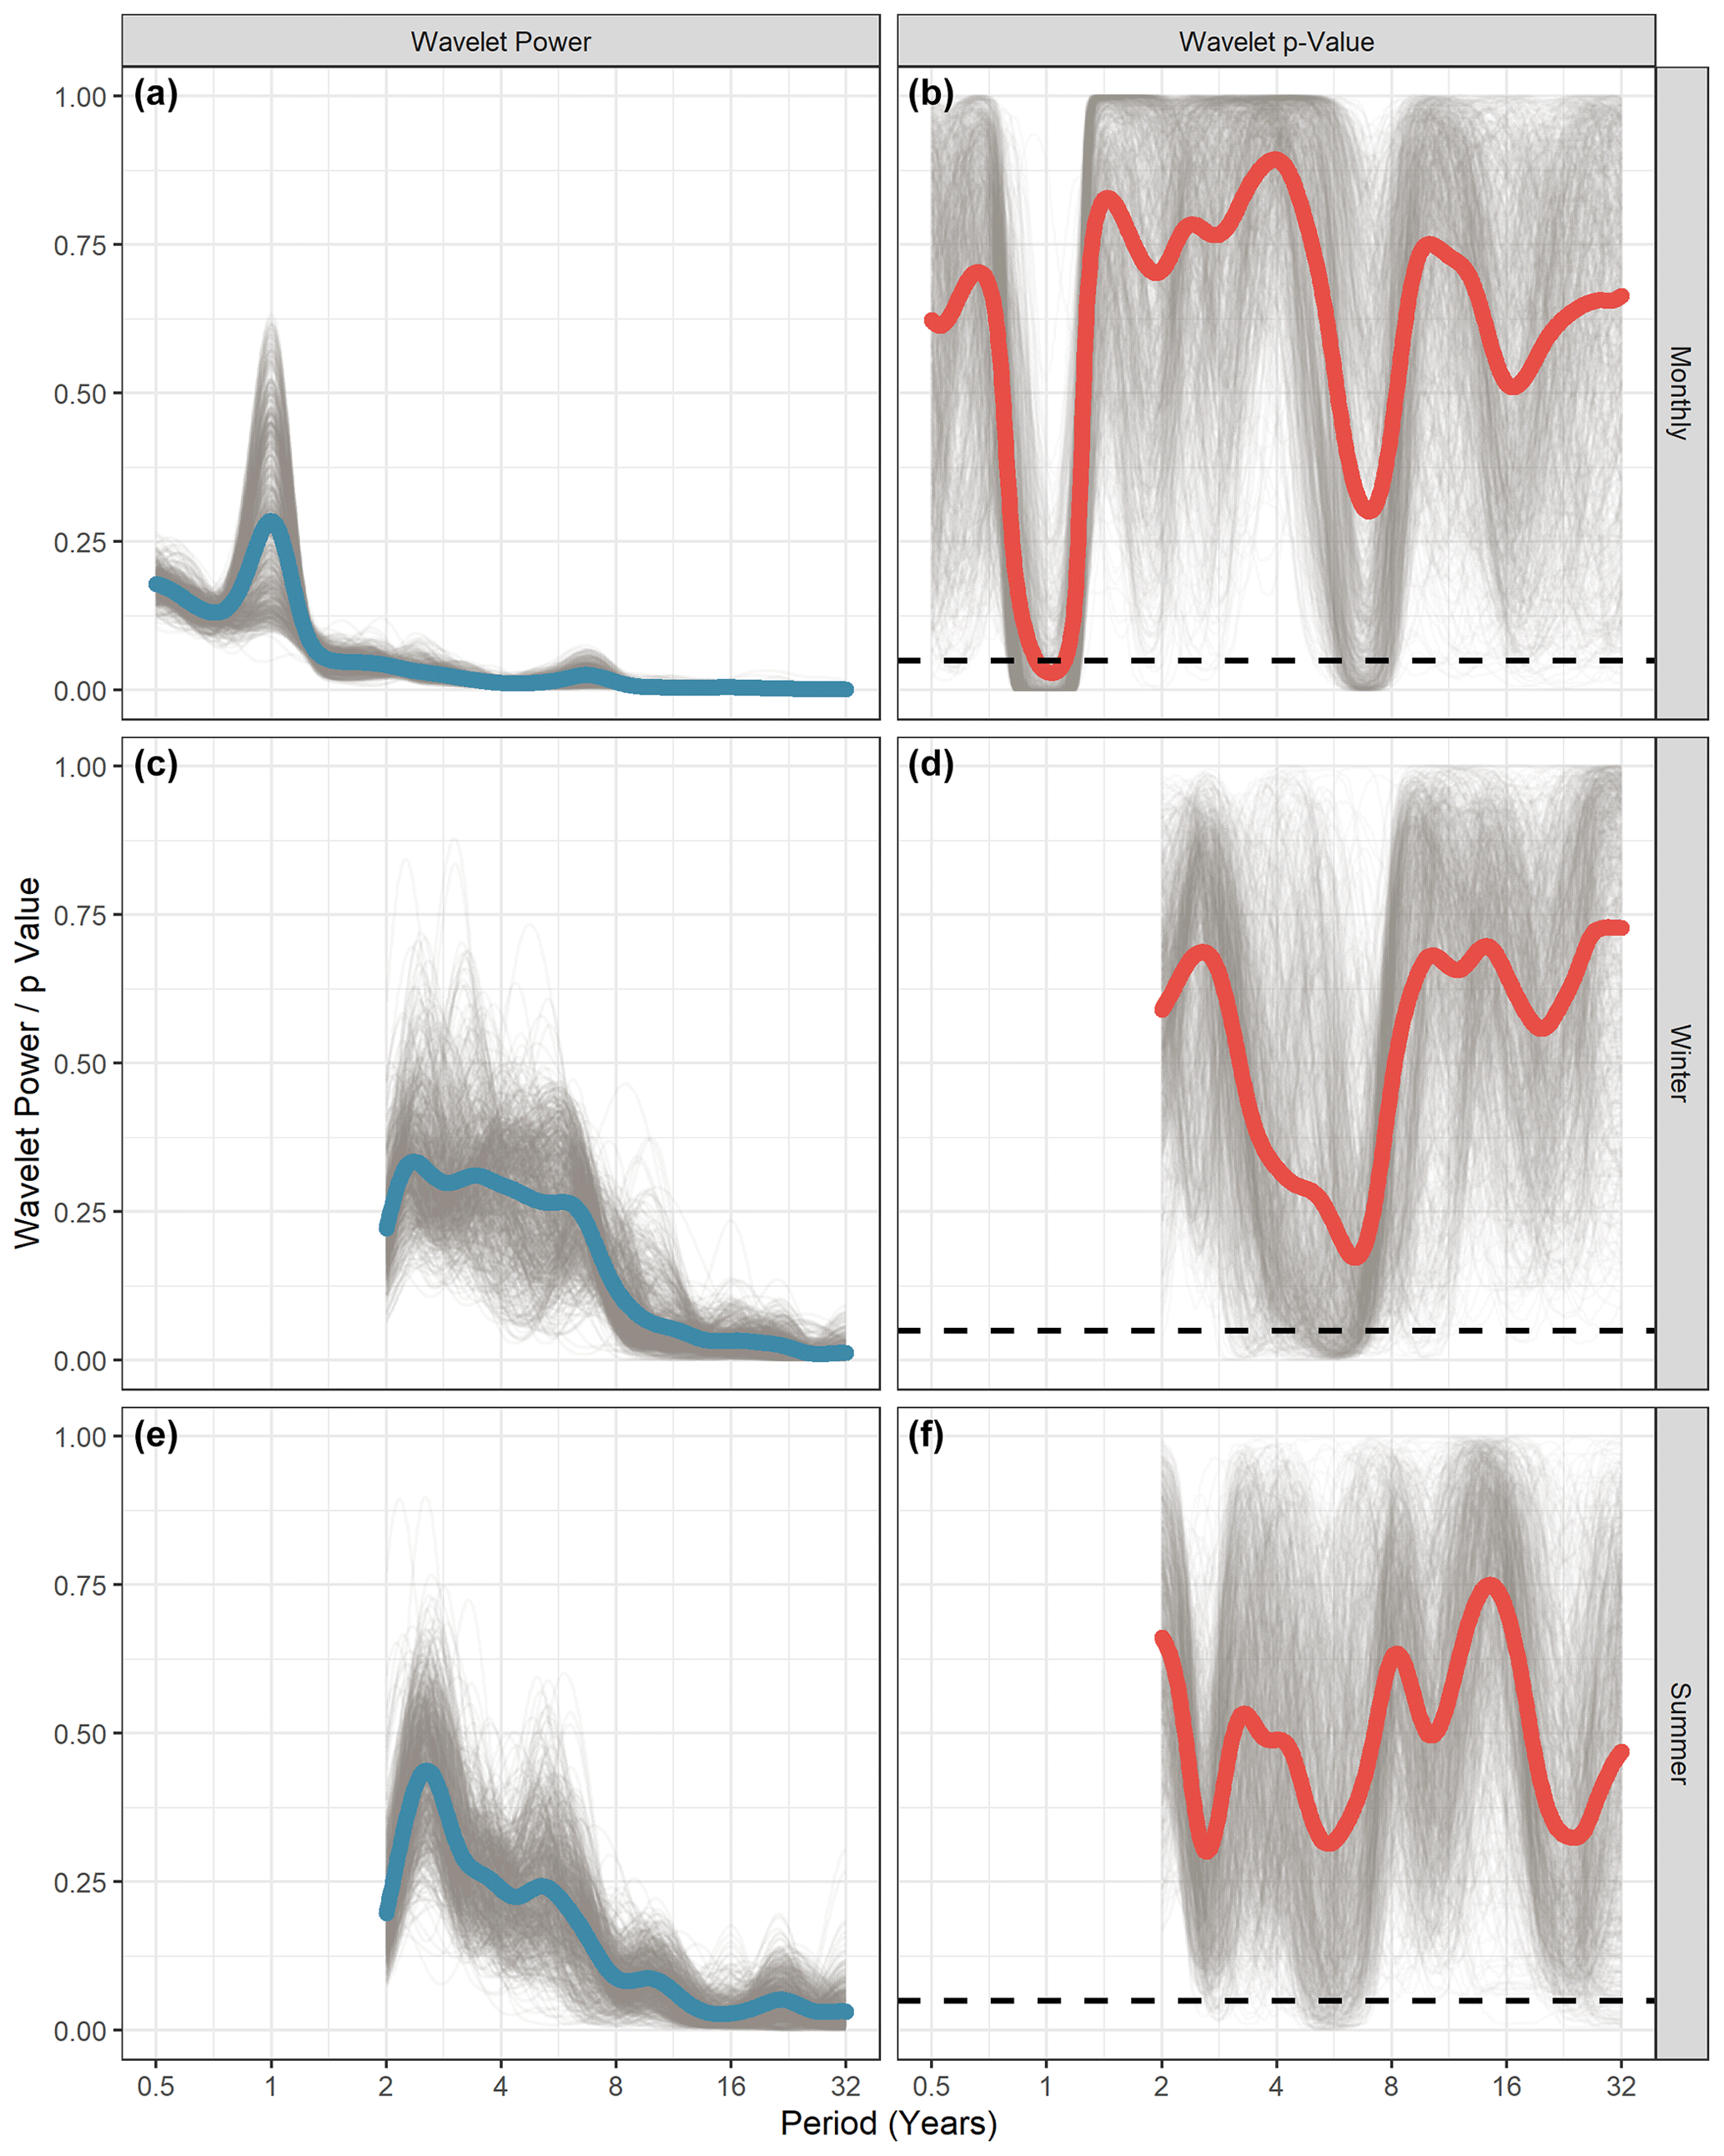
These strengths are generally reflected in the wavelet p values, with bands of lower p values at the (approximately) 7-year periodicity in the monthly data and seasonal data and at the 1 year in the monthly data. Wavelet p values indicate the likelihood that the detected wavelet powers are not the result of external forcing. As such, lower values indicate the increased significance of external forcing over the red noise null hypothesis. Wavelet p values are generally lower in the monthly catchment rainfall spectra (0.002–0.996; mean of 0.289) compared with monthly streamflow (0–0.995; mean of 0.443), but this may be an artefact of longer autocorrelations in streamflow records relative to rainfall. Wavelet p values are comparable for the seasonal spectra, with the exception of summer rainfall, which shows the lowest significance (winter rainfall – 0.003–0.995 and mean of 0.148; winter streamflow – 0.001–0.839 and mean of 0.129; summer rainfall – 0.005–0.992 and mean of 0.462; summer streamflow – 0.000–0.997 and mean of 0.348). Summer rainfall shows the weakest wavelet powers and greatest p values for the P7 band.
Discrete bands of decreased average wavelet p values can also be seen between 16 and 32 years for all the streamflow (monthly – 0.502; winter – 0.400; summer – 0.209) and rainfall data sets (monthly – 0.456; winter – 0.569; summer – 0.355). This periodicity band, however, exhibits negligible average wavelet power, indicating minimal influence on variability. In the winter- and summer-averaged power spectra, there is a band of increased strength at the 2–3 year periodicity. In the winter-averaged data, there is no comparably low p value, suggesting these higher powers are the result of noise within the averaged time series However, all the summer spectra appear to exhibit some decreased p value at this 2–3 year band.
3.2 Spatial distribution of wavelet powers
The main multi-annual periodicity detected in the winter and summer river flow data (P7) was mapped for seasonal catchment rainfall and streamflow in Fig. 5. The winter spatial distributions show three distinct areas of increased wavelet power and significance, which are shared between catchment rainfall and streamflow. The largest area is located in the southwest of England and south Wales, extending north into the Midlands and east into the southeast of England in the streamflow data. For rainfall, this area encompasses 101 of the 221 catchments, with significant (greater than 95 % CI) P7 wavelet power and 224 of the 262 significant sites in streamflow. The two other areas of increased wavelet significance in rainfall and streamflow cover Northern Ireland (20 significant sites for rainfall; 12 for streamflow) and central Scotland (30 significant sites for rainfall; 25 for streamflow). There are also stronger P7 wavelet powers along the west coast of the UK in both winter rainfall and streamflow; however, most significant powers (>95 % CI) are found in England and Wales. Additionally, the location of the greatest wavelet powers differs between winter rainfall and streamflow. Winter rainfall shows higher wavelet powers along the southwestern peninsula of England and south Wales, whereas the greatest winter streamflow wavelet powers are found in south and southeastern England and appear to be co-located over the chalk and other principal aquifers (Allen et al., 1996).
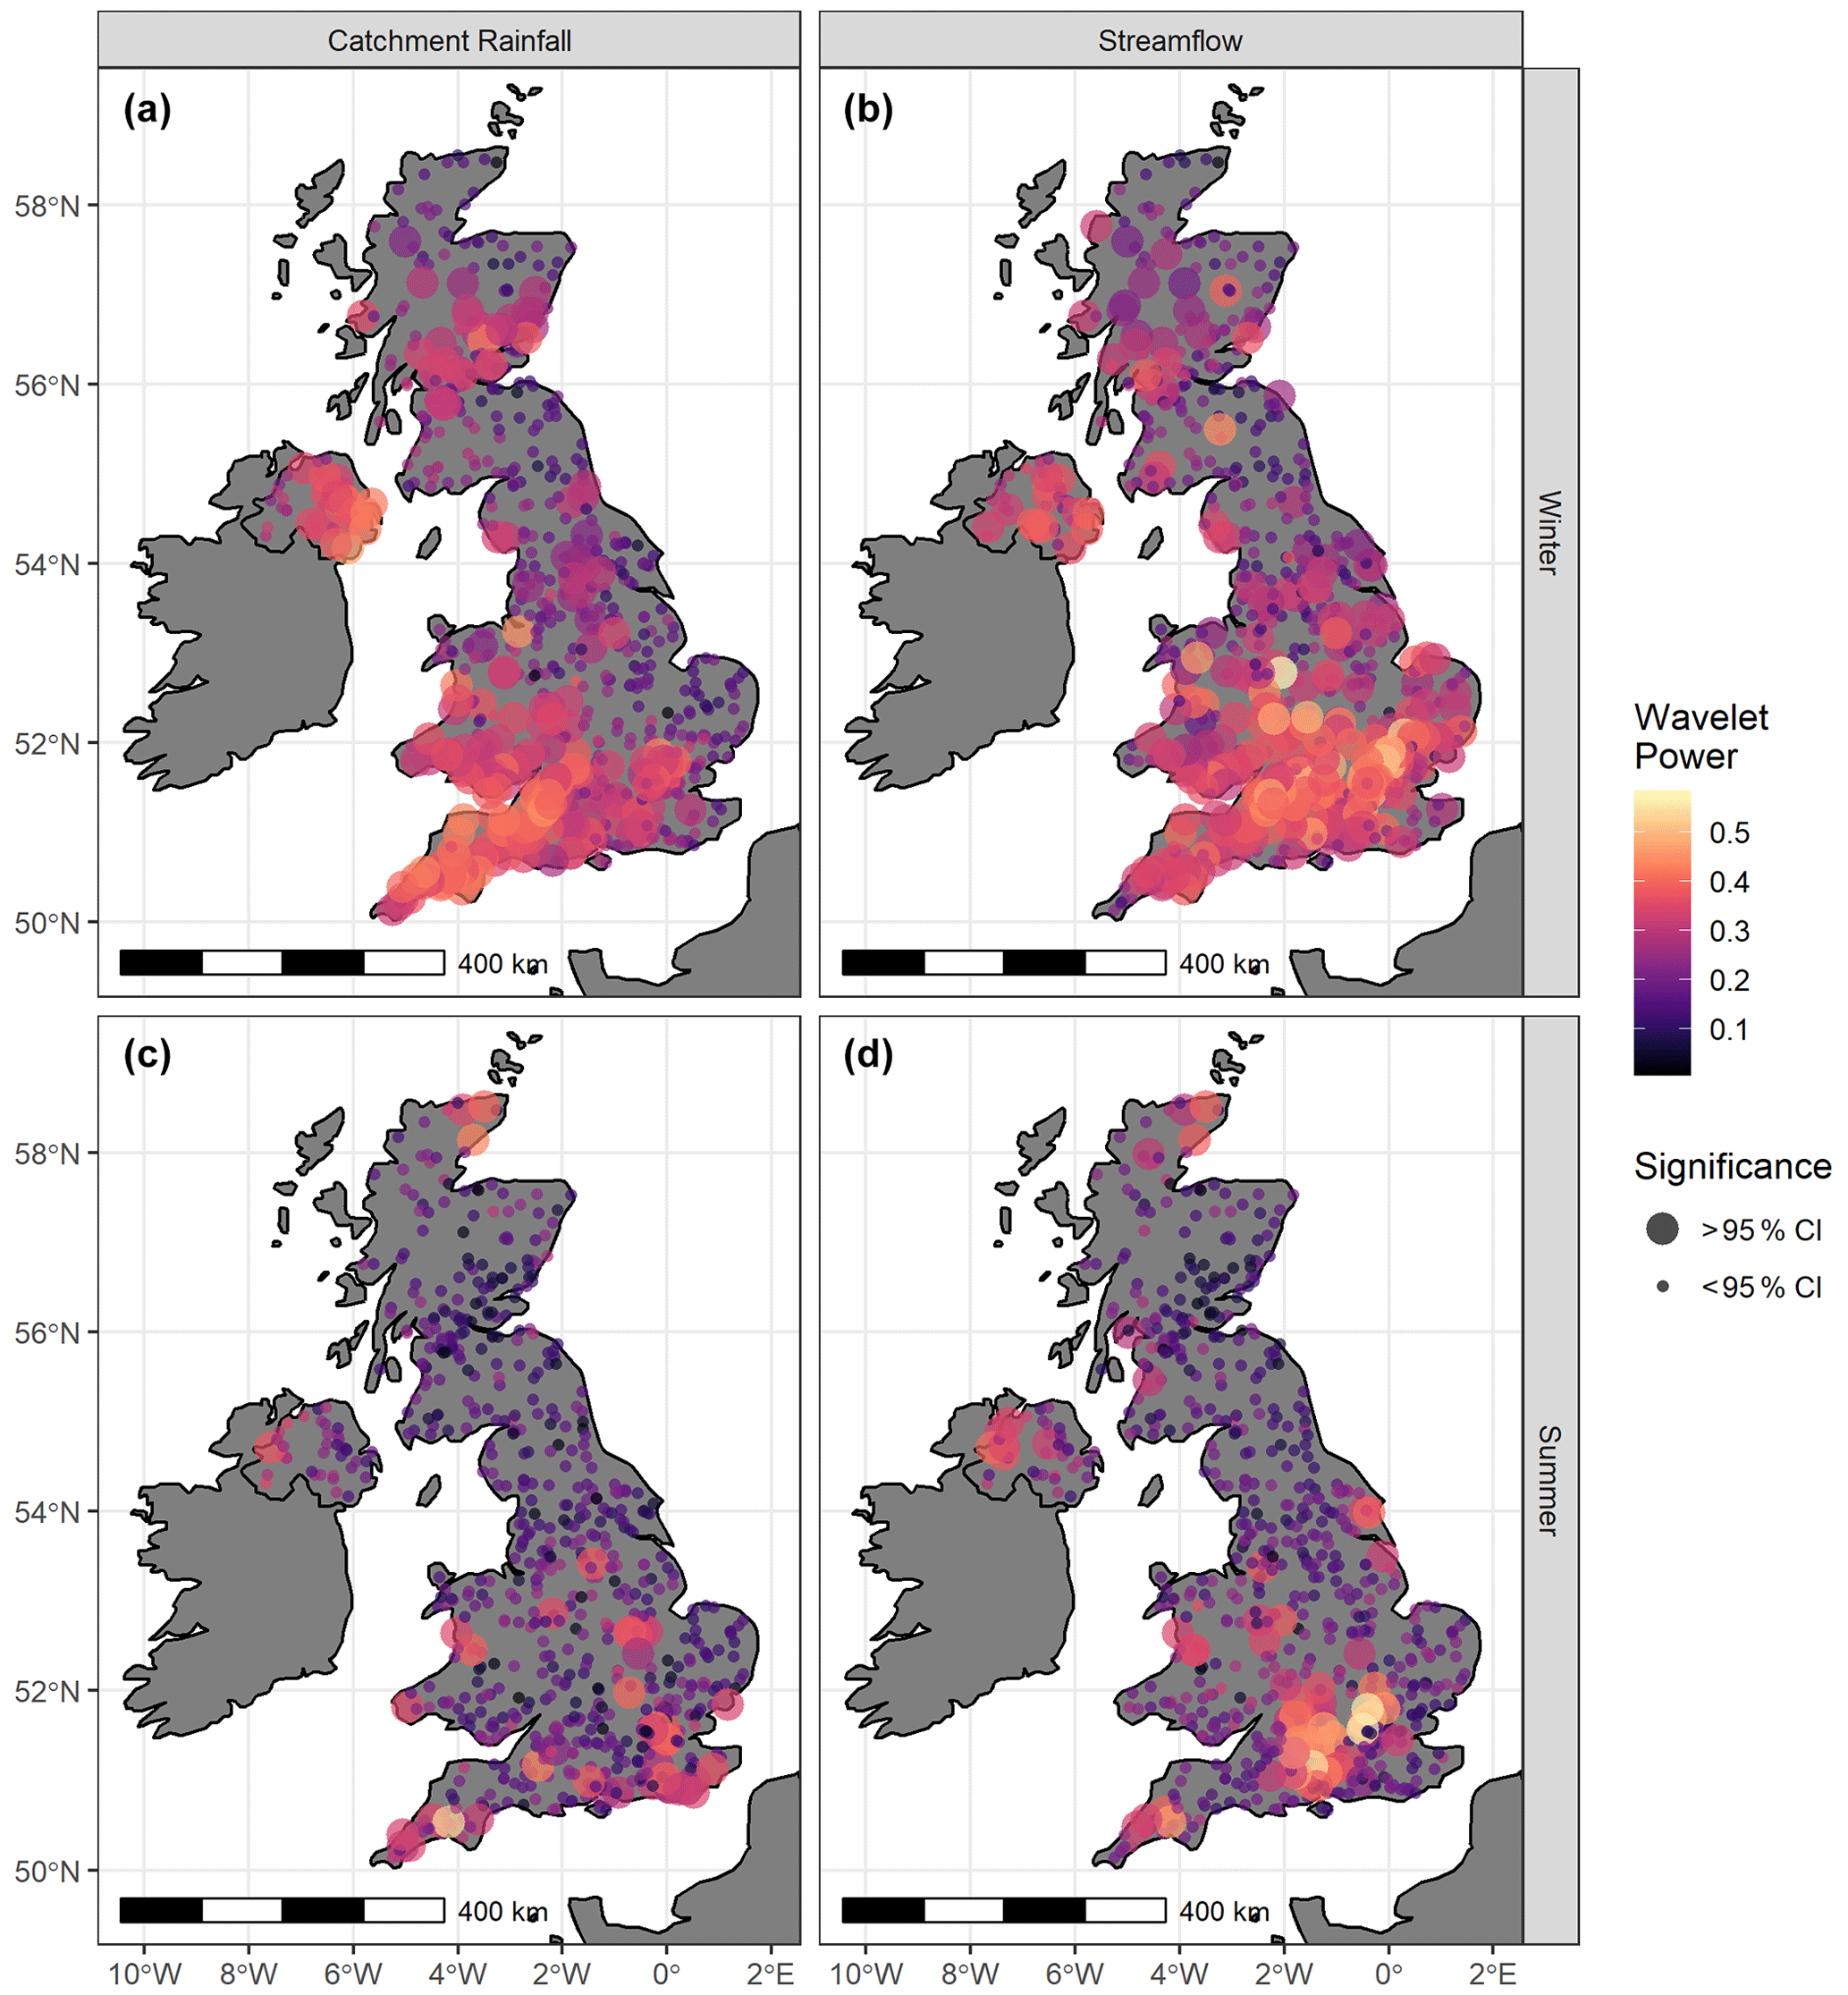
Figure 5Spatial distribution of P7 wavelet power and significance in catchment rainfall and streamflow for winter- and summer-averaged data sets.
Little spatial structure exists in P7 wavelet power and significance for the summer-averaged rainfall data. Some increased density in significance is seen towards the south coast of England; however, this may be due to the increased density of sites in this region, as seen in Fig. 1, especially given the negligible average P7 wavelet strength displayed in Fig. 3. Conversely, summer-averaged river flows show some clear spatial structure of wavelet power and significance in the south of England, where 51 of the 70 sites with significant P7 powers are located. Again, these sites appear to be co-located over the chalk aquifer (Allen et al., 1996).
3.3 Testing of hydrological pathways
Figure 6 shows scatterplots of the P7 residual wavelet powers (RWPs) for winter and summer streamflow plotted by BFI category (Fig. 6a) and a comparison of median P7 RWPs with significance results from the MWU (Fig. 6b). Winter P7 median RWPs show a trend of increasing wavelet powers with increasing BFI category, with the exception between the low and medium categories (0.001, −0.002, 0.019 and 0.093 for low, medium, high and very high groups, respectively). A similar relationship is seen in the summer median P7 RWPs (−0.063, −0.079, and −0.054 for low, medium and high groups), with a notably steeper increase for the final group when compared to winter P7 residuals (increasing to 0.101). This brings the median P7 residual powers for summer streamflow to a comparable magnitude to winter streamflow. In general, winter median P7 residual powers are close to zero, except for the very high category, indicating minimal modulation of P7 signal strength between rainfall and streamflow in the catchments with low to high BFI. Summer P7 residuals are negative for low–high BFI catchments, indicating a reduction in P7 wavelet powers in streamflow compared to winter rainfall. The median P7 residual for sites in the very high BFI is the only positive residual for summer streamflow, indicating an increase in relative P7 signal strength between winter rainfall and summer streamflow for these sites.
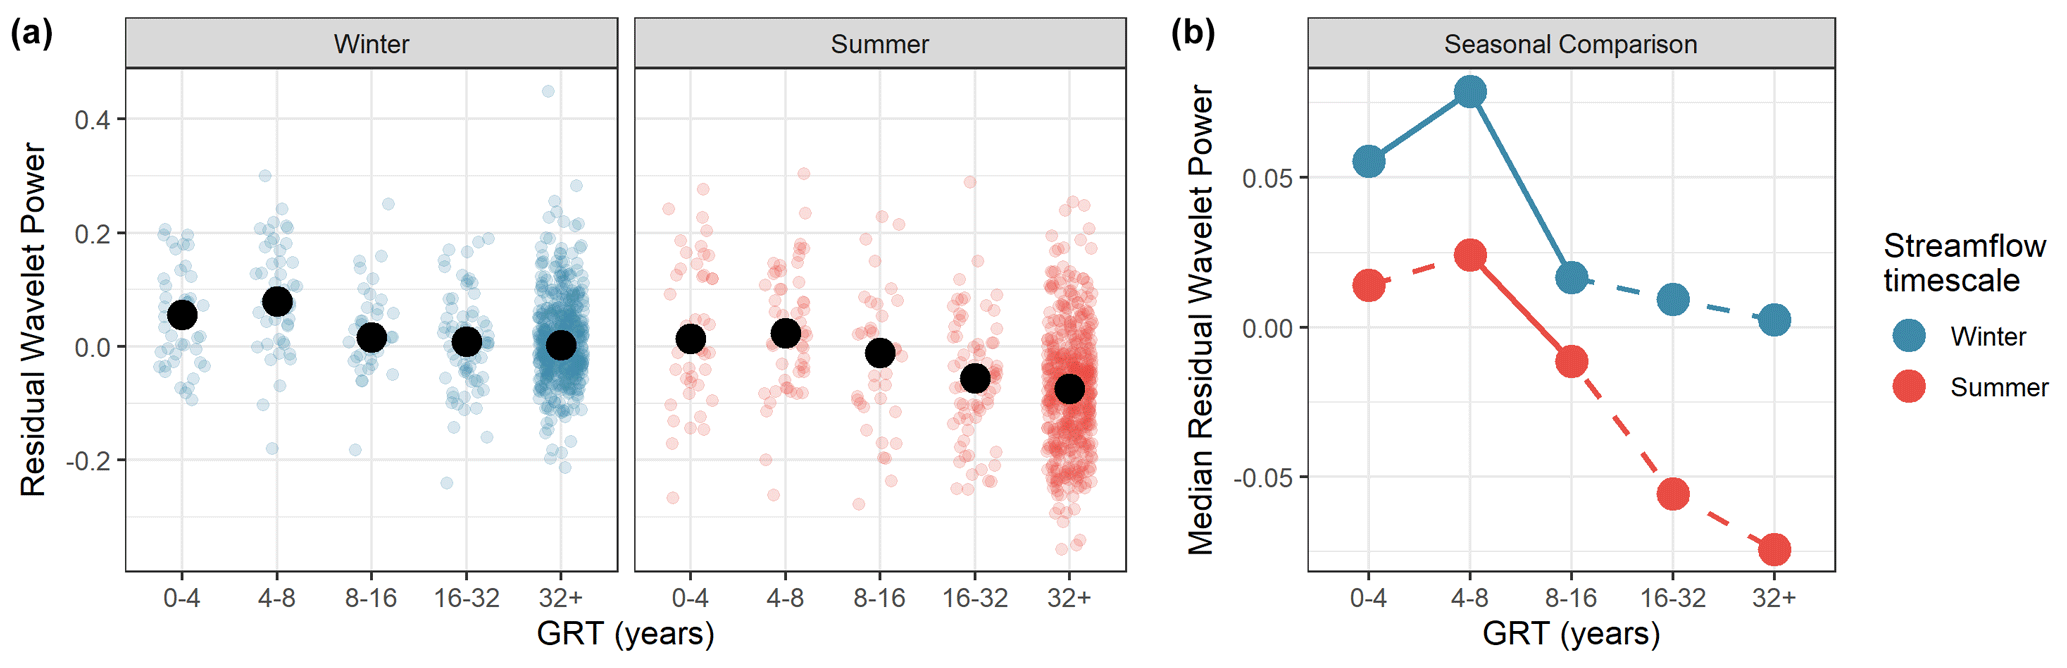
Figure 7 shows P7 RWPs plotted against groundwater response time (GRT) groups, showing all gauges (Fig. 7a) and median RWPs with significant results from the MWU (Fig. 7b). Winter streamflow shows higher, positive median RWPs across all GRT groups (0.056, 0.079, 0.017, 0.009 and 0.002 for the 0–4, 4–8, 8–16, 16–32 and 32+ year groups, respectively), whereas summer streamflow only shows positive RWPs for catchments in the 0–4 and 4–8 year GRT groups (median RWP of 0.014 and 0.024, respectively). GRTs groups greater than or equal to 8 years all show negative median RWPs (−0.011, −0.058 and −0.074 for 8–16, 18–32 and 32+ year groups, respectively). Both winter and summer streamflow show decreasing median RWPs with increasing GRT, with the exception of the 4–8 year GRT group, which shows the greatest median RWP in both winter and summer. Significant differences between GRT groups are found between 0–4 and 4–8 and 4–8 and 8–16 for winter streamflow and between 4–8 and 8–16 for summer streamflow.
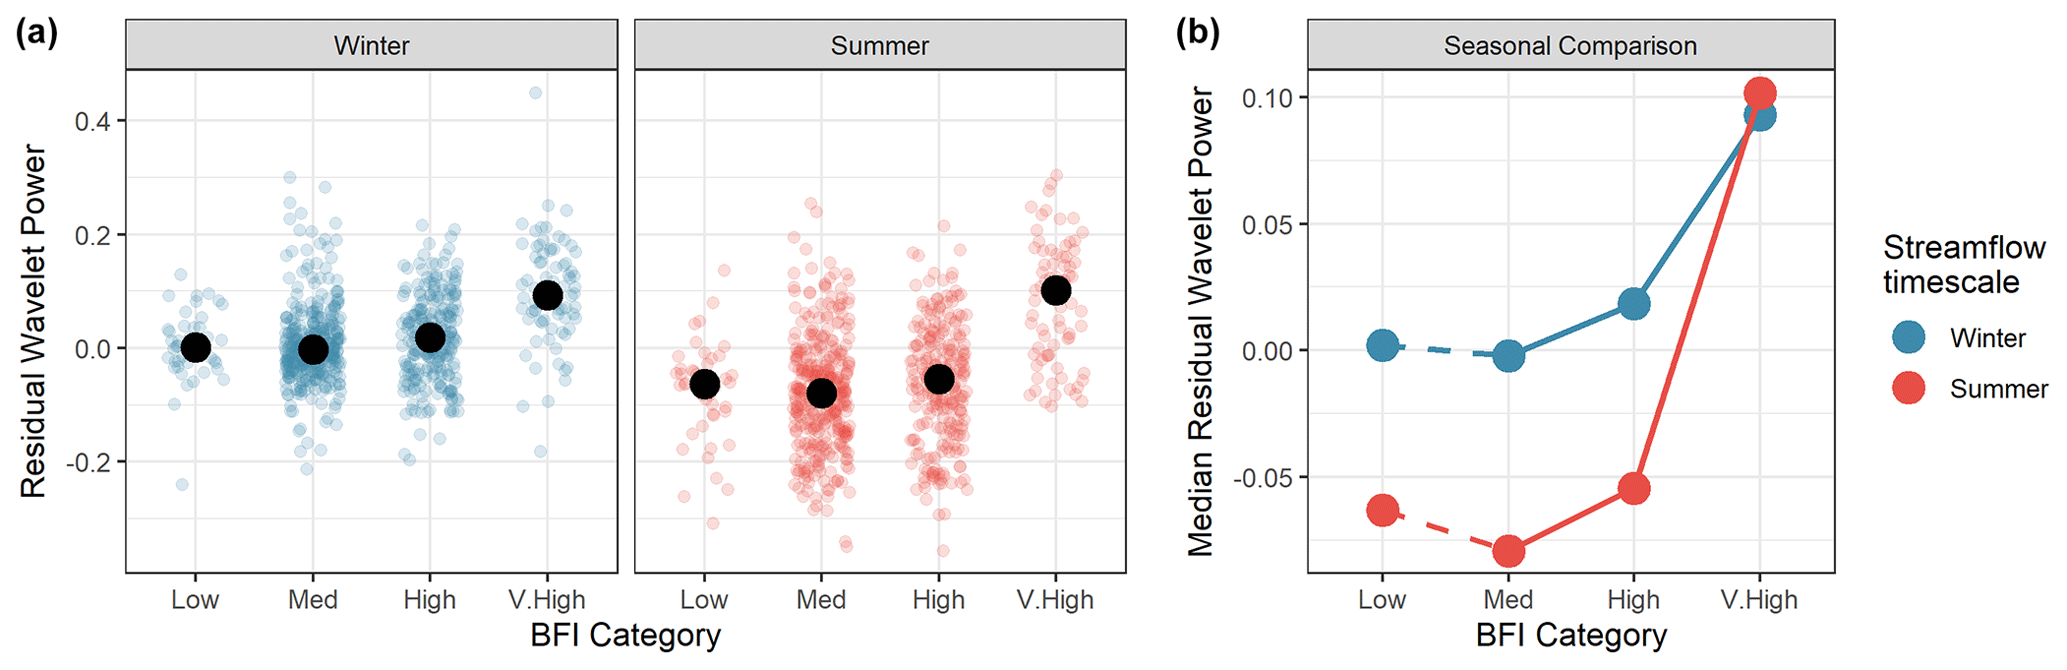
Figure 6(a) Jittered scatterplots for residual wavelet powers in winter and summer, categorised by BFI; bold black points mark the average residual wavelet power for each BFI category. (b) Comparison of these median residual wavelet powers with significant changes between groups (shown as solid lines) and non-significant changes between groups (shown as dashed lines).
4.1 Detecting a teleconnection between the NAO and UK streamflow
Our results indicate that the dominant, common multi-annual periodicity in UK streamflow (and catchment rainfall) is that of an ∼7-year cycle. This can be seen most clearly in the monthly and winter streamflow spectra (Fig. 3a–d). This cycle compares to the 6–9 year pseudo-periodicity documented in the strength of the NAO's atmospheric dipole, which has been associated with multi-annual periodicities in hydrometeorological records globally (Labat, 2010; Rust et al., 2019; Tremblay et al., 2011; Kuss and Gurdak, 2014; Holman et al., 2011; Neves et al., 2019). We show here that this ∼7-year cycle is widespread within rainfall and streamflow variability across the UK, with the majority of streamflow and rainfall records assessed here exhibiting a coherent band of increased periodicity strength and significance around this 7-year frequency range. This, combined with greater significance for this periodicity, and the wide spatial domain on which it is detected, indicates an external control on this multi-annual mode of variability. As such, we build upon evidence in existing research that documents the teleconnection between the NAO and rainfall in Europe and show new evidence of the propagation of the NAO's ∼7-year cycle to UK streamflow variability. Additionally, we detect expected differences between signal presence in summer and winter rainfall, showing increased strength and spatial structure of NAO-like signals during the winter months and weaker summer values with little spatial structure (suggesting noise). This generally agrees with existing research showing that NAO's control over European rainfall is primarily expressed in winter months (Trigo et al., 2004; West et al., 2019). However, it should also be noted that there are multiple interacting climate systems that affect European weather (for instance, the East Atlantic and Scandinavia patterns; Bru and McDermott, 2014) that, while generally weaker than the NAO's influence in European weather variability, may have an additional or compounding influence on the cycles detected in streamflow and rainfall presented here. For the remainder of the paper, we will continue to refer to these cycles as NAO-like, however, given the NAO's established dominant control on European weather variability (Hurrell and Van Loon, 1997).
4.2 Controls on multi-annual signals in catchment rainfall
We provide new evidence that NAO-like multi-annual periodicities in UK rainfall are seen in the winter months and are heavily localised to the southwest of England, south Wales, the east coast of Northern Ireland and the central band of Scotland (Fig. 5). This is contrary to previous research that has typically found the strongest relationships between the NAOI and UK rainfall along the west coast of the UK, particularly on the west coast of Scotland (Murphy and Washington, 2001; Fowler and Kilsby, 2002; West et al., 2019). Rust et al. (2018) suggest that the NAO may have two pathways for its modulation on UK rainfall, namely a fine-scale (e.g. subannual or annual) atmospheric pathway via modulation of westerly storm tracks (Trigo et al., 2002; Parker et al., 2019; Woollings and Blackburn, 2012) or an oceanic pathway via long-term influences on the Gulf Stream (Taylor and Stephens, 1998; Chaudhuri et al., 2011; Watelet et al., 2017). As such, we may expect teleconnection studies that assess the annual relationship between the NAO and rainfall (such as existing research) to better capture the atmospheric pathway. Conversely, studies that assess a longer-term influence (such as the wavelet analysis used here), may better capture the oceanic pathway for NAO control on rainfall (i.e. via the Gulf Stream). Haarsma et al. (2015) show that precipitation in the southwest of England exhibits the strongest negative correlation in the UK () with modelled variability in the Atlantic Meridional Overturning Current (of which the Gulf Stream is part). As such, the increased strength in NAO-like signals in winter rainfall shown here in the southeast of England could be explained by the NAO's long-term control on the Gulf Stream.
4.3 Hydrological drivers for signal strengths
We have shown that NAO-like periodicities are localised to specific regions in the UK in winter rainfall (Fig. 5a) and are negligible in summer rainfall (Fig. 5c). This suggests that NAO-like periodicities in summer streamflow do not originate from summer rainfall and that catchment processes that drive winter rainfall signal propagation to summer streamflow (e.g. subsurface pathways, Haslinger et al., 2014; Folland et al., 2015; Barker et al., 2016) may inform our understanding of catchment controls on the NAO teleconnection with streamflow. Here, we provide statistically significant evidence that multi-annual periodic signals in rainfall are propagated to streamflow differently between winter and summer months, depending on the contribution from different hydrological pathways (and their response times). Furthermore, we provide evidence that pathways of specific response times propagate these periodic signals to UK streamflow more effectively than others, highlighting the catchment properties that may produce a sensitivity to the NAO teleconnection with streamflow. Below, we discuss how these relationships align with current hydrological understanding.
Rust et al. (2019) establish that multi-annual, NAO-like periodicities in groundwater-level records are considerably stronger than those in co-located rainfall records. Groundwater behaviour generally exhibits longer autocorrelations than rainfall with negligible fine-scale variability (noise), due to the damping effect of subsurface hydrological pathways (Townley, 1995; Dickinson, 2004; Gnann et al., 2020). As such, groundwater can express a greater signal-to-noise ratio for low-frequency variations (such as those produced by the NAO teleconnection; Holman et al., 2009; Rust et al., 2018). By comparison, rainfall, which generally contains more fine-scale (hourly–daily) variability, exhibits a lower signal-to-noise ratio which suppresses the proportional strength of multi-annual, NAO-like signals (Meinke et al., 2005; Brown, 2018). A parallel can be drawn here with hydrological pathway influence on streamflow, as surface pathways more closely reflect rainfall variability, and subsurface pathways more closely reflect groundwater variability (Ockenden and Chappell, 2011; Kamruzzaman et al., 2014; Mathias et al., 2016; Gnann et al., 2020).
Streamflow driven primarily by surface processes (e.g. BFI <0.5) exhibits close-to-zero median RWPs in winter (Fig. 6b), indicating that surface pathways affect a minimal modulation of NAO periodicity strength from winter rainfall to winter streamflow; this is likely due to their relatively short response times (minutes to days; Mathias et al., 2016). This also explains why the spatial footprint of NAO-like periodicities in winter streamflow (Fig. 5b) generally matches that of winter rainfall (Fig. 5a) as a greater proportion of surface pathways are active in response to greater in-season rainfall (due to more infiltration- or saturation-excess runoff from the land surface; Ledingham et al., 2019). Summer streamflow, where driven by surface pathways, shows minimal sensitivity to NAO periodicities in winter rainfall (negative median RWPs), due to fewer catchment storage mechanisms available convey winter rainfall signals to summer streamflow (Barker et al., 2016) and the weaker NAO teleconnection with UK summer rainfall (as noted by Alexander et al., 2005; Hurrell and Deser, 2010; West et al., 2019, and indicated here). Conversely, streamflow that is dominated by subsurface pathway influence (e.g. BFI >0.75) exhibits the greatest NAO periodicities (Fig. 6b). We also see significant increases in NAO periodicity strength with increasing BFI in all but the lowest two BFI categories (low to medium). We, therefore, confirm our expectation that NAO periodicities in groundwater are propagated to streamflow via subsurface pathways. This relationship is also seen in the spatial footprints of NAO periodicities in winter (Fig. 5b) and summer streamflow (Fig. 5d). Gauges with the strongest NAO-like periods in summer and winter streamflow are found in catchments that are within, or that drain, the chalk outcrop in south-central England. These catchments are known to be heavily driven by groundwater behaviour (Marsh and Hannaford, 2008). In Fig. 5b, we see that the spatial footprint of NAO periodicities in summer streamflow is localised to these chalk-dominated catchments. Permeable catchments such as those on the chalk aquifer are known to slowly respond to winter rainfall at a seasonal timescale (Hellwig and Stahl, 2018). As such, these catchments have sufficient subsurface pathway contributions to protract NAO periodicities in winter rainfall through to summer streamflow. Conversely, Fig. 5 also shows some areas of the chalk with relatively low NAO-like periods, such as the southern coast of England. Similarities can be seen here with Marchant and Bloomfield (2018), who identify discrete regions of groundwater-level behaviour within the chalk aquifer, with varying autocorrelations. The chalk of the south coast of England tends to have thinner superficial deposits and negligible glacial deposits (unlike those in the area of the chalk outcrop), producing a faster recharge response to rainfall with shorter autocorrelations (Marsh and Hannaford, 2008; Marchant and Bloomfield, 2018). Dickinson et al. (2014) highlight the importance of unsaturated zone thickness in modulating periodic signal progression, which may explain why catchments in the southern chalk exhibit lower signal-to-noise ratios for NAO periodicities.
While the relationship between NAO periodicities and streamflow BFI indicates the importance of subsurface pathway contribution to teleconnection strength, properties of the subsurface pathways themselves are expected to modulate periodic signal propagation from rainfall to streamflow (Rust et al., 2018). We show streamflow in catchments with shorter groundwater response times (GRTs) exhibit stronger NAO-like periodicities, but the strongest NAO periodicity is found in catchments with GRTs between 4 and 8 years. Townley (1995) shows that where the groundwater response time of a subsurface store is longer than a periodicity in recharge, the system will exhibit larger periodic variations in groundwater head but a greater attenuation of periodic discharges at a streamflow boundary. This is because the pathway cannot equilibrate the periodic recharge to its hydraulic boundaries at a sufficient rate. Conversely, where the pathway response time is shorter than that of a periodicity in recharge, groundwater discharge will show greater periodic variations as the entire pathway is able to convey this signal. This may explain the reduction in NAO periodicities seen as GRT increases in Fig. 6b. Where subsurface pathway response times are longer than the principal P7 of the NAO, we may expect the pathway to dampen the signal propagation to baseflow (Townley, 1995; Dickinson, 2004). However, this process fails to explain the reduced NAO periodicity strength seen in our results, where GRT is less than the ∼7-year NAO periodicity (seen principally in the winter streamflow data). As suggested by Najafi et al. (2017) and Wilby (2006), faster pathways can exhibit a weaker signal-to-noise ratio when compared to slower pathways which are known to smooth signal propagation (Barker et al., 2016). As such, streamflow in catchments with the shortest GRT (i.e. 0–4 years) may exhibit greater response to finer-scale variability in rainfall, which suppresses the relative strength of the NAO periodicity. This would also explain why summer streamflow does not show a similarly reduced NAO-like period strength for the 0–4 years GRT band, as summer streamflow generally would be expected to exhibit greater signal-to-noise ratios due to a greater proportion of slow pathway contribution. As such, our results suggest that, in addition to the described periodic signal modulations in Townley et al. (1995), there is an ideal range of subsurface pathway response times that are long enough to produce a greater signal-to-noise ratio but sufficiently short so that there is minimal damping.
These results may have important implications for streamflow management, as we show that readily available estimates of BFI and GRT may be used to screen or identify catchments where further work may be necessary to understand long-term cyclical behaviour in streamflow. This may be particularly important for ensuring the sustainable, ongoing use of water resources, such as abstraction for water supply and ecosystem management. This is particularly important for summer streamflow, where streamflow services are often vulnerable to drought conditions (Visser et al., 2019). Furthermore, there is a need for consideration of these cycles within water management policy and practice in the UK. For instance, stochastic or probabilistic approaches often used for water resource planning periods may need to be augmented in order to account for the cyclical, non-stationary variability reported here and for their potential benefits to be realised.
This paper assesses the degree to which the principal multi-annual periodicity (P7) of the NAO is present in streamflow and catchment rainfall records using the continuous wavelet transform to identify multi-annual periodicities. We provide new evidence for the role of oceanic and atmospheric pathways in propagating NAO periodicities to catchment rainfall by identifying spatial patterns of statistically significant NAO-like periodicities in UK catchment rainfall and streamflow. This may help further explicate the varying spatial extent of the NAO influence over Europe and the North Atlantic region. Furthermore, we identify specific streamflow catchment characteristics that are most responsive to the NAO periodicities in catchment rainfall. We find that streamflow that is driven predominantly by subsurface pathway contributions often exhibits greater NAO-like periodicities and that subsurface pathways with response times comparable in length to the P7 of the NAO produce the greatest sensitivity to the NAO teleconnection. These findings build on the fundamental understanding of periodic signal propagation through hydrological pathways and can aid in the identification of catchments with sensitivities to multi-annual control, for instance, those found in climatic teleconnections. The ability to screen catchments for their potential teleconnection-driven multi-annual variability may have direct implications for water management decision-making, for example, the permitting of surface water abstractions and their implications for ecologically sensitive streamflow systems. Such information may help to protect vulnerable habitats or aid appropriate investment in surface water abstraction infrastructure. Our results here take necessary steps towards a greater understanding of how climatic teleconnections can be used to improve water resource management practices.
The streamflow and precipitation data, as well as the metadata used in this study, are freely available from the NRFA website (http://nrfa.ceh.ac.uk/, NRFA, 2021).
WR designed the methodology and carried them out with supervision from all co-authors. WR prepared the article with contributions from all co-authors.
The authors declare that they have no conflict of interest.
This work was supported by the Natural Environment Research Council (grant nos. NE/M009009/1 and NE/L010070/1) and the British Geological Survey (Natural Environment Research Council). John Bloomfield publishes with the permission of the executive director of the British Geological Survey (NERC). Mark Cuthbert gratefully acknowledges funding as part of an Independent Research Fellowship from the UK Natural Environment Research Council (grant no. NE/P017819/1). We thank Angi Rosch and Harald Schmidbauer for making their wavelet package, WaveletComp, freely available. This study was a re-analysis of existing data that are publicly available from the NRFA at https://nrfa.ceh.ac.uk/ (last access: 14 July 2020).
This research has been supported by the Natural Environment Research Council (grant nos. NE/M009009/1 and NE/L010070/1) and the UK Natural Environment Research Council (grant no. NE/P017819/1).
This paper was edited by Laurent Pfister and reviewed by two anonymous referees.
Acreman, M. C. and Dunbar, M. J.: Defining environmental river flow requirements – a review, Hydrol. Earth Syst. Sci., 8, 861–876, https://doi.org/10.5194/hess-8-861-2004, 2004.
Alexander, L. V., Tett, S. F. B., and Jonsson, T.: Recent observed changes in severe storms over the United Kingdom and Iceland, Geophys. Res. Lett., 32, L13704, https://doi.org/10.1029/2005GL022371, 2005.
Allen, M. R. and Smith, L. A.: Monte Carlo SSA: Detecting Irregular Oscillations in the Presence of Colored Noise, J. Climate, 9, 3373–3404, https://doi.org/10.1175/1520-0442(1996)009<3373:MCSDIO>2.0.CO;2, 1996.
Barker, L. J., Hannaford, J., Chiverton, A., and Svensson, C.: From meteorological to hydrological drought using standardised indicators, Hydrol. Earth Syst. Sci., 20, 2483–2505, https://doi.org/10.5194/hess-20-2483-2016, 2016.
Bloomfield, J. P. and Marchant, B. P.: Analysis of groundwater drought building on the standardised precipitation index approach, Hydrol. Earth Syst. Sci., 17, 4769–4787, https://doi.org/10.5194/hess-17-4769-2013, 2013.
Bloomfield, J. P., Allen, D. J., and Griffiths, K. J.: Examining geological controls on baseflow index (BFI) using regression analysis: An illustration from the Thames Basin, UK, J. Hydrol., 373, 164–176, https://doi.org/10.1016/j.jhydrol.2009.04.025, 2009.
Bracken, L. J., Wainwright, J., Ali, G. A., Tetzlaff, D., Smith, M. W., Reaney, S. M., and Roy, A. G.: Concepts of hydrological connectivity: Research approaches, Pathways and future agendas, Earth-Sci. Rev., 119, 17–34, https://doi.org/10.1016/j.earscirev.2013.02.001, 2013.
Brown, S. J.: The drivers of variability in UK extreme rainfall, Int. J. Climatol., 38, 119–130, https://doi.org/10.1002/joc.5356, 2018.
Bru, L. and McDermott, F.: Impacts of the EA and SCA Patterns on the European Twentieth Century NAO-Winter-Climate Relationships, Q. J. Roy. Meteor. Soc., 140, 354–63, https://doi.org/10.1002/qj.2158, 2014.
Carr, E. J. and Simpson, M. J.: Accurate and efficient calculation of response times for groundwater flow, J. Hydrol., 558, 470–481, https://doi.org/10.1016/j.jhydrol.2017.12.023, 2018.
Chaudhuri, A. H., Gangopadhyay, A., and Bisagni, J. J.: Response of the Gulf Stream transport to characteristic high and low phases of the North Atlantic Oscillation, Ocean Model., 39, 220–232, https://doi.org/10.1016/j.ocemod.2011.04.005, 2011.
Chiverton, A., Hannaford, J., Holman, I. P., Corstanje, R., Prudhomme, C., Hess, T. M., and Bloomfield, J. P.: Using variograms to detect and attribute hydrological change, Hydrol. Earth Syst. Sci., 19, 2395–2408, https://doi.org/10.5194/hess-19-2395-2015, 2015.
Chun, K. P., Wheater, H. S., and Onof, C. J.: Streamflow estimation for six UK catchments under future climate scenarios, Hydrol. Res., 40, 96–112, https://doi.org/10.2166/nh.2009.086, 2009.
Crossman, J., Futter, M. N., Whitehead, P. G., Stainsby, E., Baulch, H. M., Jin, L., Oni, S. K., Wilby, R. L., and Dillon, P. J.: Flow pathways and nutrient transport mechanisms drive hydrochemical sensitivity to climate change across catchments with different geology and topography, Hydrol. Earth Syst. Sci., 18, 5125–5148, https://doi.org/10.5194/hess-18-5125-2014, 2014.
Cuthbert, M. O., Gleeson, T., Moosdorf, N., Befus, K. M., Schneider, A., Hartmann, J., and Lehner, B.: Global patterns and dynamics of climate-groundwater interactions, Nat. Clim. Change, 9, 137–141, https://doi.org/10.1038/s41558-018-0386-4, 2019.
Dawson, A., Elliott, L., Noone, S., Hickey, K., Holt, T., Wadhams, P., and Foster, I.: Historical storminess and climate “see-saws” in the North Atlantic region, Mar. Geol., 210, 247–259, https://doi.org/10.1016/j.margeo.2004.05.011, 2004.
DeFlorio, M. J., Pierce, D. W., Cayan, D. R., and Miller, A. J.: Western US Extreme Precipitation Events and Their Relation to ENSO and PDO in CCSM4, J. Climate, 26, 4231–4243, https://doi.org/10.1175/JCLI-D-12-00257.1, 2013.
Dickinson, J. E.: Inferring time-varying recharge from inverse analysis of long-term water levels, Water Resour. Res., 40, W07403, https://doi.org/10.1029/2003WR002650, 2004.
Dickinson, J. E., Ferré, T. P. A., Bakker, M., and Crompton, B.: A Screening Tool for Delineating Subregions of Steady Recharge within Groundwater Models, Vadose Zone J., 13, 1–15, https://doi.org/10.2136/vzj2013.10.0184, 2014.
Dixon, H., Hannaford, J., and Fry, M. J.: The effective management of national hydrometric data: experiences from the United Kingdom, Hydrolog. Sci. J., 58, 1383–1399, https://doi.org/10.1080/02626667.2013.787486, 2013.
Folland, C. K., Hannaford, J., Bloomfield, J. P., Kendon, M., Svensson, C., Marchant, B. P., Prior, J., and Wallace, E.: Multi-annual droughts in the English Lowlands: a review of their characteristics and climate drivers in the winter half-year, Hydrol. Earth Syst. Sci., 19, 2353–2375, https://doi.org/10.5194/hess-19-2353-2015, 2015.
Forootan, E., Khaki, M., Schumacher, M., Wulfmeyer, V., Mehrnegar, N., van Dijk, A. I. J. M., Brocca, L., Farzaneh, S., Akinluyi, F., Ramillien, G., Shum, C. K., Awange, J., and Mostafaie, A.: Understanding the Global Hydrological Droughts of 2003–2016 and Their Relationships with Teleconnections, Sci. Total Environ., 9, 2587–2604, https://doi.org/10.1016/J.SCITOTENV.2018.09.231, 2018.
Fowler, H. J. and Kilsby, C. G.: Precipitation and the North Atlantic Oscillation: a study of climatic variability in northern England, Int. J. Climatol., 22, 843–866, https://doi.org/10.1002/joc.765, 2002.
Frankignoul, C., de Coëtlogon, G., Joyce, T. M., and Dong, S.: Gulf Stream Variability and Ocean-Atmosphere Interactions, J. Phys. Oceanogr., 31, 3516–3529, https://doi.org/10.1175/1520-0485(2002)031<3516:GSVAOA>2.0.CO;2, 2001.
Gericke, O. J. and Smithers, J. C.: Revue des méthodes d'évaluation du temps de réponse d'un bassin versant pour l'estimation du débit de pointe, Hydrolog. Sci. J., 59, 1935–1971, https://doi.org/10.1080/02626667.2013.866712, 2014.
Gnann, S. J., Howden, N. J. K., and Woods, R. A.: Hydrological signatures describing the translation of climate seasonality into streamflow seasonality, Hydrol. Earth Syst. Sci., 24, 561–580, https://doi.org/10.5194/hess-24-561-2020, 2020.
Guillod, B. P., Jones, R. G., Dadson, S. J., Coxon, G., Bussi, G., Freer, J., Kay, A. L., Massey, N. R., Sparrow, S. N., Wallom, D. C. H., Allen, M. R., and Hall, J. W.: A large set of potential past, present and future hydro-meteorological time series for the UK, Hydrol. Earth Syst. Sci., 22, 611–634, https://doi.org/10.5194/hess-22-611-2018, 2018.
Gustard, A., Bullock, A., and Dixon, J. M.: Low flow estimation in the United Kingdom, IH Report No. 108, Institute of Hydrology, Wallingford, UK, 88 pp., http://nora.nerc.ac.uk/id/eprint/6050 (last access: 14 July 2020), 1992.
Haarsma, R. J., Selten, F. M., and Drijfhout, S. S.: Decelerating Atlantic Meridional Overturning Circulation Main Cause of Future West European Summer Atmospheric Circulation Changes, Environ. Res. Lett., 094007, https://doi.org/10.1088/1748-9326/10/9/094007, 2015.
Hannaford, J. and Harvey, C.: UK seasonal river flow variability in near-natural catchments, regional outflows and long hydrometric records, in: BHS Third International Symposium, Managing Consequences of a Changing Global Environment, Newcastle, United Kingdom, 2010, 1–7, 2010.
Haslinger, K., Koffler, D., Schöner, W., and Laaha, G.: Exploring the link between meteorological drought and streamflow: Effects of climate-catchment interaction, Water Resour. Res., 50, 2468–2487, https://doi.org/10.1002/2013WR015051, 2014.
Hellwig, J. and Stahl, K.: An assessment of trends and potential future changes in groundwater-baseflow drought based on catchment response times, Hydrol. Earth Syst. Sci., 22, 6209–6224, https://doi.org/10.5194/hess-22-6209-2018, 2018.
Holman, I. P., Rivas-Casado, M., Howden, N. J. K., Bloomfield, J. P., and Williams, A. T.: Linking North Atlantic ocean-atmosphere teleconnection patterns and hydrogeological responses in temperate groundwater systems, Hydrol. Process., 23, 3123–3126, https://doi.org/10.1002/hyp.7466, 2009.
Holman, I. P., Rivas-Casado, M., Bloomfield, J. P., and Gurdak, J. J.: Identifying non-stationary groundwater level response to North Atlantic ocean-atmosphere teleconnection patterns using wavelet coherence, Hydrogeol. J., 19, 1269–1278, https://doi.org/10.1007/s10040-011-0755-9, 2011.
Hurrell, J. W. and Deser, C.: North Atlantic climate variability: The role of the North Atlantic Oscillation, J. Marine Syst., 79, 231–244, https://doi.org/10.1016/j.jmarsys.2009.11.002, 2010.
Hurrell, J. W. and Van Loon, H.: Decadal Variations in Climate Associated with the North Atlantic Oscillation, Climatic Change, 36, 301–326, https://doi.org/10.1023/A:1005314315270, 1997.
Hurrell, J. W., Kushnir, Y., Ottersen, G., and Visbeck, M.: An Overview of the North Atlantic Oscillation, in: The North Atlantic Oscillation: Climatic Significance and Environmental Impact, American Geophysical Union, USA, 1–35, https://doi.org/10.1029/GM134, 2003.
Kamruzzaman, M., Shahriar, M. S., and Beecham, S.: Assessment of short term rainfall and stream flows in South Australia, Water, 6, 3528–3544, https://doi.org/10.3390/w6113528, 2014.
Kingston, D. G., Lawler, D. M., and McGregor, G. R.: Linkages between atmospheric circulation, climate and streamflow in the northern North Atlantic: research prospects, Prog. Phys. Geog., 30, 143–174, https://doi.org/10.1191/0309133306pp471ra, 2006.
Kingston, D. G., Hannah, D. M., Lawler, D. M., and McGregor, G.: Regional Classification, Variability, and Trends of Northern North Atlantic River Flow, Hydrol. Process., 25, 1021–1033, https://doi.org/10.1002/hyp.7655, 2011.
Kronholm, S. and Capel, P.: Estimation of time-variable fast flow path chemicalconcentrations for application in tracer-based hydrographseparation analyses, J. Am. Water Resour. As., 52, 6881–6896, https://doi.org/10.1002/2016WR018797, 2016.
Kuss, A. M. and Gurdak, J. J.: Groundwater level response in U.S. principal aquifers to ENSO, NAO, PDO, and AMO, J. Hydrol., 519, 1939–1952, https://doi.org/10.1016/j.jhydrol.2014.09.069, 2014.
Labat, D.: Cross Wavelet Analyses of Annual Continental Freshwater Discharge and Selected Climate Indices, J. Hydrol., 385, 269–278, https://doi.org/10.1016/j.jhydrol.2010.02.029, 2010.
Lane, R. A., Coxon, G., Freer, J. E., Wagener, T., Johnes, P. J., Bloomfield, J. P., Greene, S., Macleod, C. J. A., and Reaney, S. M.: Benchmarking the predictive capability of hydrological models for river flow and flood peak predictions across over 1000 catchments in Great Britain, Hydrol. Earth Syst. Sci., 23, 4011–4032, https://doi.org/10.5194/hess-23-4011-2019, 2019.
Ledingham, J., Archer, D., Lewis, E., Fowler, H., and Kilsby, C.: Contrasting seasonality of storm rainfall and flood runoff in the UK and some implications for rainfall-runoff methods of flood estimation, Hydrol. Res., 50, 1309–1323, https://doi.org/10.2166/nh.2019.040, 2019.
López-Moreno, J. I., Vicente-Serrano, S. M., Morán-Tejeda, E., Lorenzo-Lacruz, J., Kenawy, A., and Beniston, M.: Effects of the North Atlantic Oscillation (NAO) on combined temperature and precipitation winter modes in the Mediterranean mountains: Observed relationships and projections for the 21st century, Global Planet. Change, 77, 62–76, https://doi.org/10.1016/j.gloplacha.2011.03.003, 2011.
Marchant, B. P. and Bloomfield, J. P.: Spatio-temporal modelling of the status of groundwater droughts, J. Hydrol., 564, 397–413, https://doi.org/10.1016/J.JHYDROL.2018.07.009, 2018.
Marsh, T. and Hannaford, J.: UK Hydrometric Register, Hydrological data UK series, Centre for Ecology and Hydrology, Wallingford, UK, 2008.
Mathias, S. A., McIntyre, N., and Oughton, R. H.: A study of non-linearity in rainfall-runoff response using 120 UK catchments, J. Hydrol., 540, 423–436, https://doi.org/10.1016/j.jhydrol.2016.06.039, 2016.
Meinke, H., de Voil, P., Hammer, G. L., Power, S., Allan, R., Stone, R. C., Folland, C., and Potgieter, A.: Rainfall variability of decadal and longer time scales: Signal or noise?, J. Climate, 18, 89–90, https://doi.org/10.1175/JCLI-3263.1, 2005.
Misumi, R., Bell, V. A., and Moore, R. J.: River flow forecasting using a rainfall disaggregation model incorporating small-scale topographic effects, Meteorol. Appl., 8, 297–305, https://doi.org/10.1017/S135048270100305X, 2001.
Murphy, S. J. and Washington, R.: United Kingdom and Ireland precipitation variability and the North Atlantic sea-level pressure field, Int. J. Climatol., 21, 939–959, https://doi.org/10.1002/joc.670, 2001.
Najafi, M. R., Zwiers, F. W., and Gillett, N. P.: Attribution of Observed Streamflow Changes in Key British Columbia Drainage Basins, Geophys. Res. Lett., 44, 11012–11020, https://doi.org/10.1002/2017GL075016, 2017.
Nathan, R. J. and McMahon, T. A.: Evaluation of automated techniques for base flow and recession analyses, Water Resour. Res., 26, 1465–1473, https://doi.org/10.1029/WR026i007p01465, 1990.
Neves, M. C., Jerez, S., and Trigo, R. M.: The response of piezometric levels in Portugal to NAO, EA, and SCAND climate patterns, J. Hydrol., 568, 1105–1117, https://doi.org/10.1016/J.JHYDROL.2018.11.054, 2019.
NRFA: Streamflow and precipitation data, metadata, available at: http://nrfa.ceh.ac.uk/ (last access: 14 July 2020), 2021.
Ockenden, M. C. and Chappell, N. A.: Identification of the dominant runoff pathways from data-based mechanistic modelling of nested catchments in temperate UK, J. Hydrol., 402, 71–79, https://doi.org/10.1016/j.jhydrol.2011.03.001, 2011.
Olsen, J., Anderson, N. J., and Knudsen, M. F.: Variability of the North Atlantic Oscillation over the Past 5200 Years, Nat. Geosci., 5, 808–812, https://doi.org/10.1038/ngeo1589, 2012.
Parker, T., Woollings, T., Weisheimer, A., O'Reilly, C., Baker, L., and Shaffrey, L.: Seasonal Predictability of the Winter North Atlantic Oscillation from a Jet Stream Perspective, Geophys. Res. Lett., 46, 10159–10167, https://doi.org/10.1029/2019GL084402, 2019.
Rashid, M., Beecham, S., and Chowdhury, R. K.: Assessment of Trends in Point Rainfall Using Continuous Wavelet Transforms, Adv. Water Resour., 82, 1–15, https://doi.org/10.1016/j.advwatres.2015.04.006, 2015.
Rosch, A. and Schmidbauer, H.: WaveletComp 1.1: a guided tour through the R package, available at: https://pdfs.semanticscholar.org/3825/de34e8ae27624eece03abf6fbb8fd07c795a.pdf (last access: 20 Janurary 2021), 2018.
Rousseau-Gueutin, P., Love, A. J., Vasseur, G., Robinson, N. I., Simmons, C. T., and De Marsily, G.: Time to reach near-steady state in large aquifers, Water Resour. Res., 49, 6893–6908, https://doi.org/10.1002/wrcr.20534, 2013.
Rust, W., Holman, I., Corstanje, R., Bloomfield, J., and Cuthbert, M.: A conceptual model for climatic teleconnection signal control on groundwater variability in Europe, Earth-Sci. Rev., 177, 164–174, https://doi.org/10.1016/j.earscirev.2017.09.017, 2018.
Rust, W., Holman, I., Bloomfield, J., Cuthbert, M., and Corstanje, R.: Understanding the potential of climate teleconnections to project future groundwater drought, Hydrol. Earth Syst. Sci., 23, 3233–3245, https://doi.org/10.5194/hess-23-3233-2019, 2019.
Su, L., Miao, C., Borthwick, A. G. L., and Duan, Q.: Wavelet-based variability of Yellow River discharge at 500-, 100-, and 50-year timescales, Gondwana Res., 49, 94–105, https://doi.org/10.1016/j.gr.2017.05.013, 2017.
Svensson, C., Brookshaw, A., Scaife, A. A., Bell, V. A., Mackay, J. D., Jackson, C. R., Hannaford, J., Davies, H. N., Arribas, A., and Stanley, S.: Long-Range Forecasts of UK Winter Hydrology, Environ. Res. Lett., 10, 064006, https://doi.org/10.1088/1748-9326/10/6/064006, 2015.
Tanguy, M., Dixon, H., Prosdocimi, I., Morris, D. G., and Keller, V. D. J.: Gridded estimates of daily and monthly areal rainfall for the United Kingdom (1890–2017) [CEH-GEAR], NERC Environmental Information Data Centre, Wallingford, UK, https://doi.org/10.5285/ee9ab43d-a4fe-4e73-afd5-cd4fc4c82556, 2019.
Taylor, A. H. and Stephens, J. A.: The North Atlantic Oscillation and the latitude of the Gulf Stream, Tellus A, 50, 134–142, https://doi.org/10.3402/tellusa.v50i1.14517, 1998.
Townley, L. R.: The response of aquifers to periodic forcing, Adv. Water Resour., 18, 125–146, https://doi.org/10.1016/0309-1708(95)00008-7, 1995.
Tremblay, L., Larocque, M., Anctil, F., and Rivard, C.: Teleconnections and Interannual Variability in Canadian Groundwater Levels, J. Hydrol., 410, 178–188, https://doi.org/10.1016/j.jhydrol.2011.09.013, 2011.
Trigo, R. M., Osborn, T. J., and Corte-real, J. M.: The North Atlantic Oscillation influence on Europe: climate impacts and associated physical mechanisms, Clim. Res., 20, 9–17, https://doi.org/10.3354/cr020009, 2002.
Trigo, R. M., Pozo-Vazquez, D., Osborn, T. J., Castro-Diez, Y., Gamiz-Fortis, S., and Esteban-Parra, M. J.: North Atlantic oscillation influence on precipitation, river flow and water resources in the Iberian peninsula, Int. J. Climatol., 24, 925–944, https://doi.org/10.1002/joc.1048, 2004.
Uvo, C. B.: Analysis and regionalization of northern European winter precipitation based on its relationship with the North Atlantic oscillation, Int. J. Climatol., 23, 1185–1194, https://doi.org/10.1002/joc.930, 2003.
Van Loon, A. F.: Hydrological Drought Explained, WIRES Water, 2, 359–392, https://doi.org/10.1002/wat2.1085, 2015.
Velasco, E. M., Gurdak, J. J., Dickinson, J. E., Ferré T. P. A., and Corona, C. R.: Interannual to Multidecadal Climate Forcings on Groundwater Resources of the U.S. West Coast, J. Hydrol., 11, 250–265, https://doi.org/10.1016/j.ejrh.2015.11.018, 2015.
Visser, A., Beevers, L., and Patidar, S.: The impact of climate change on hydroecological response in chalk streams, Water, 11, 596, https://doi.org/10.3390/w11030596, 2019.
Watelet, S., Beckers, J. M., and Barth, A.: Reconstruction of the Gulf Stream from 1940 to the present and correlation with the North Atlantic Oscillation, J. Phys. Oceanogr., 47, 2741–2754, https://doi.org/10.1175/JPO-D-17-0064.1, 2017.
West, H., Quinn, N., and Horswell, M.: Regional rainfall response to the North Atlantic Oscillation (NAO) across Great Britain, Hydrol. Res., 50, 1549–1563, https://doi.org/10.2166/nh.2019.015, 2019.
Wilby, R. L.: When and where might climate change be detectable in UK river flows?, Geophys. Res. Lett., 33, L19407, https://doi.org/10.1029/2006GL027552, 2006.
Woollings, T. and Blackburn, M.: The North Atlantic Jet Stream under Climate Change and Its Relation to the NAO and EA Patterns, J. Climate, 25, 886–902, https://doi.org/10.1175/JCLI-D-11-00087.1, 2012.
Zhang, X. J., Jin, L. Y., Chen, C. Z., Guan, D. S., and Li, M. Z.: Interannual and interdecadal variations in the North Atlantic Oscillation spatial shift, Chinese Sci. Bull., 56, 2621–2627, https://doi.org/10.1007/s11434-011-4607-8, 2011.