the Creative Commons Attribution 4.0 License.
the Creative Commons Attribution 4.0 License.
 | 19 Apr 2021
Minimizing the impact of vacating instream storage of a multi-reservoir system: a trade-off study of water supply and empty flushing
Chia-Wen Wu
Frederick N.-F. Chou
Fong-Zuo Lee
A reservoir operator does not favor storage above a certain level in situations such as the pre-release operation prior to a flood; scheduled engineering construction; or mechanical excavation of sediment in the impoundments, drawdown, and empty flushing, etc. This paper selects empty flushing as the case study, and a method is presented to promote the feasibility of emptying the reservoir storage. The impact of emptying reservoir on water supply is minimized through appropriate joint operation in a multi-reservoir system, where drawdown and empty flushing is carried out in a primary reservoir, and the other reservoir provides backup water for supply. This method prioritizes allocating the storage in the primary reservoir for water supply during specific periods prior to its emptying. If the storage of every reservoir achieves its predefined conditions, drawdown of the primary reservoir is activated and followed by empty flushing. Previously preserved storage in the other reservoir ensures adequate water supply during the periods of emptying the primary reservoir. Flushing of the primary reservoir is continued until either the accumulative released water exceeds the specified volume, storage in the backup reservoir drops below the predefined threshold, or the inflow to the primary reservoir recedes from the flood peak to be below the releasing capacity of outlets. This behavior is simulated and linked with a nonlinear optimization algorithm to calibrate the optimal parameters defining the activation and termination of empty flushing. The optimized strategy limits the incremental water shortage within the acceptable threshold and maximizes the expected benefits of emptying reservoir.
- Article
(6098 KB) - Full-text XML
- BibTeX
- EndNote


Reservoirs intercept watercourses to store excessive water and regulate natural flow patterns into expected releases for different purposes. Besides conserving water, there are also circumstances in which storage above certain levels in reservoirs is not favored. These situations include when an imminent flood is anticipated, when engineering construction or mechanical excavation of sediments within the impoundments is scheduled, and during empty flushing operations. While the last of which are focused on in this paper, the concept of minimizing the impact of vacating storage from reservoirs on the original purposes of water usage through careful management is general to all situations.
Empty flushing is the most effective method for removing deposited sediments from reservoirs (Fan and Morris, 1992; Morris and Fan, 1998; Shen, 1999). This process requires complete drawdown of reservoir storage to allow for “inflows to pass through at riverine depths” (Atkinson, 1996). The drawdown of storage is usually carried out by releasing water through bottom outlets. During this process, the accelerated flow near the inlet may partially reactivate and scour out the depositions to generate a flushing cone in the vicinity of the inlet. By completely emptying the reservoir and maintaining the riverine flow condition, retrogressive erosion may be induced from the rim of the flushing cone extending upstream to create a flushing channel. The formation of the flushing channel usually leads to hyper sediment concentration of the bottom release and thus effectively recovers partial deposited capacity of the reservoir. This operation has been used to pursue sustainable utilization by many reservoirs worldwide (Atkinson, 1996; White, 2001; Chaudhry and Habib-ur-rehman, 2012), and some examples of which are presented in Table A1.
Because draining the storage of a reservoir contradicts its water supply function, empty flushing is generally limited to reservoirs that operate solely for hydropower generation, flood mitigation, or irrigation. These purposes usually do not require reservoir storage during certain periods of the year, during which empty flushing can be implemented without impairing the original design function of the reservoir. However, for reservoirs with municipal or industrial end-users that rely on sufficient storage for steady water supply, the implementation of empty flushing is relatively rare.
The conflict between water supply and empty flushing has been addressed by Chang et al. (2003) and Khan and Tingsanchali (2009). However, these previous studies only dealt with a single reservoir. If there are additional reservoirs in the system that can act as backup water sources, it may be possible to elevate the feasibility of empty flushing by reducing its impact on water supply through appropriate joint operation. The ideal strategy may require utilizing the reservoir with the most excessive sediment deposition, referred to as the primary reservoir throughout the remainder of this paper, to supply demands while preserving the storage in the other reservoirs before empty flushing. This will lead to a lower water surface level (WSL) in the primary reservoir and a higher WSL in the others. Empty flushing in the primary reservoir can then be activated once favorable conditions are achieved, such as adequate storage distribution among reservoirs to ensure both high sediment flushing efficiency and steady backup water supply.
This study focused on a water resources system that contains two reservoirs, among which one is an on-stream primary reservoir and requires empty flushing operation. The other with backup storage is an off-stream reservoir and supplies demands jointly with the primary one. This specific schematic protects the backup storage from the turbid release by the reservoir undergoing empty flushing, thus ensuring uninterrupted water supply, and could be the prototype for more complex systems. The goal is to develop the optimal strategy, which maximizes the efficiency of empty flushing without significantly hindering water supply. In the following section, the case study system is introduced. Key factors influencing the efficiency of sediment flushing as well as the stability of water supply are then discussed, followed by developing the methodology to derive the strategy for joint water supply and empty flushing in the case study system. The results validate the efficacy of the proposed optimal strategy.
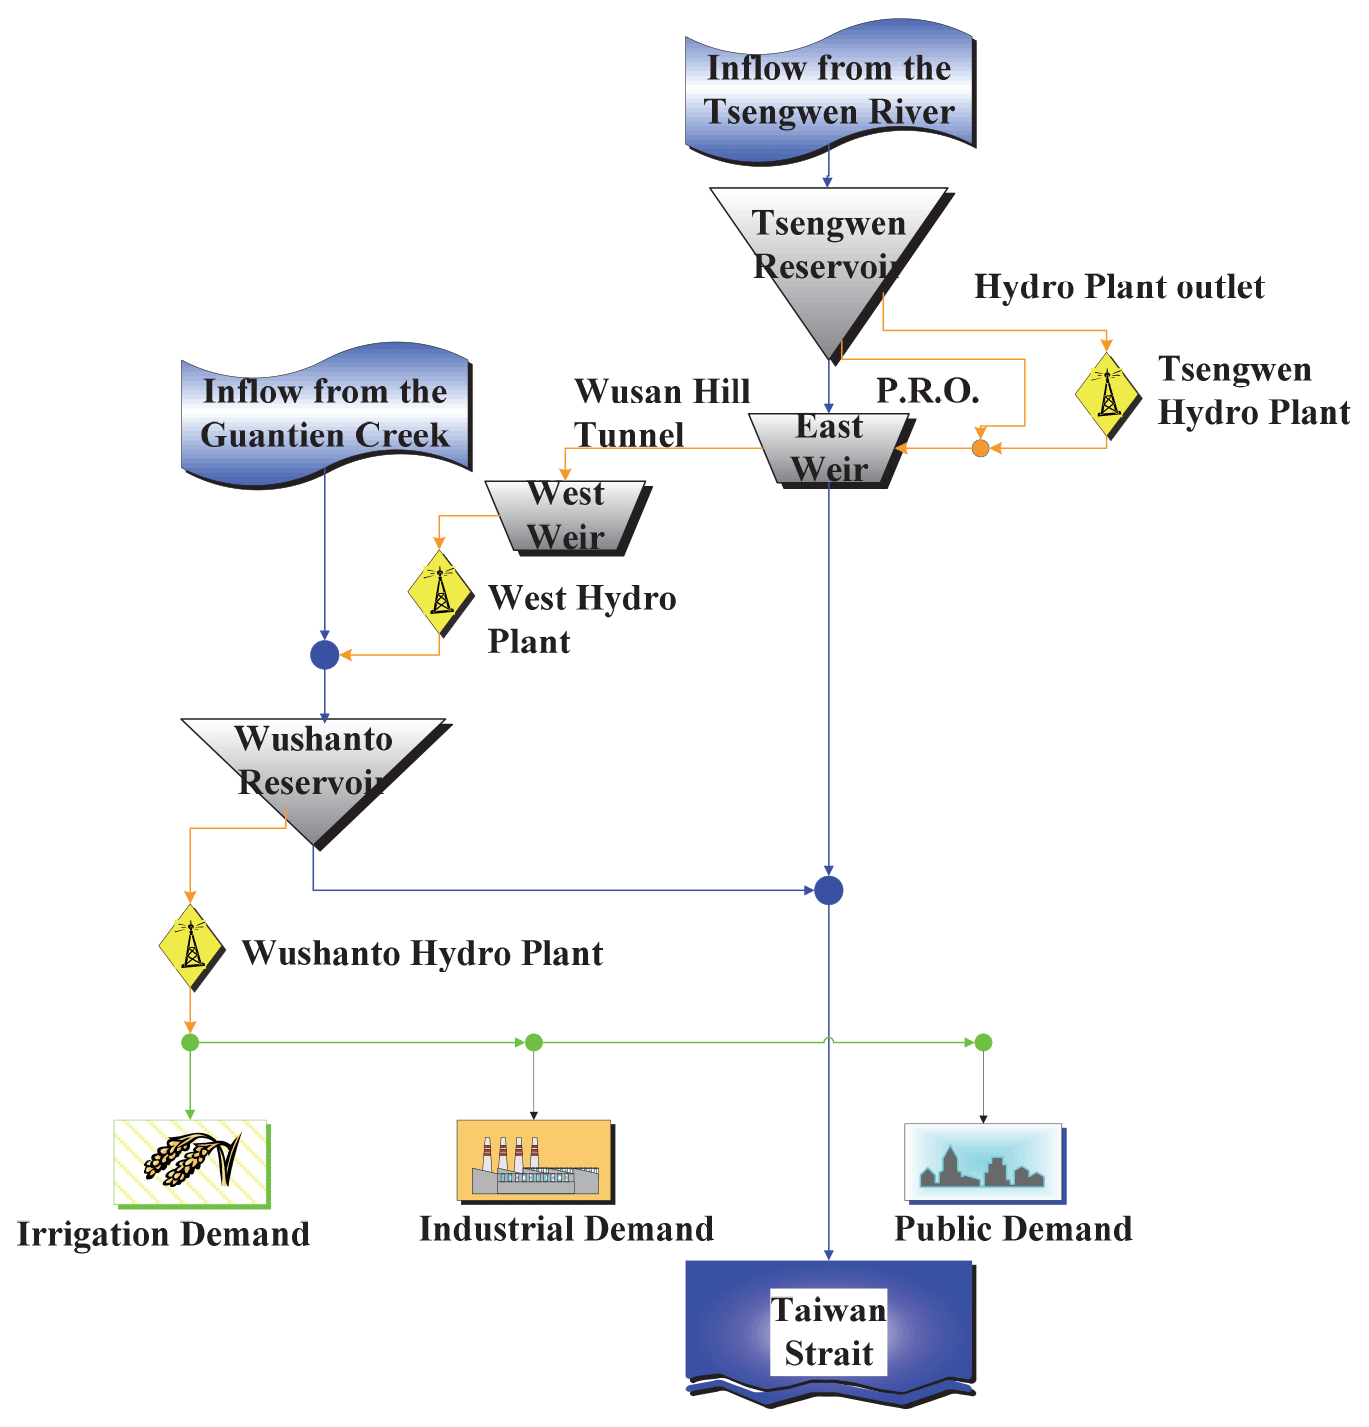
The joint operating system of the serial Tsengwen and Wushanto reservoirs is in southern Taiwan. Figures 1 and 2 show the location of these reservoirs and the network of the water resources system, respectively. The Tsengwen Reservoir is in the upper section of the Tsengwen River, with a watershed area of 481.6 km2. The original effective capacity with the WSL as the normal pool level 227 m above sea level (a.s.l.) was 631.2×10⁶ m3 when the reservoir was completed in 1973. Operated by the Southern Regional Water Resources Office (SRWRO) of the Taiwan Water Resources Agency, its purposes include agricultural water supply, flood control, and hydropower generation. Located 6 km downstream of the Tsengwen Reservoir, the East Weir diverts the releases from the Tsengwen Reservoir to the Wushanto Reservoir through Wushan Hill Tunnel of 3.3 km at a conveyance capacity of 56 m3 s−1.
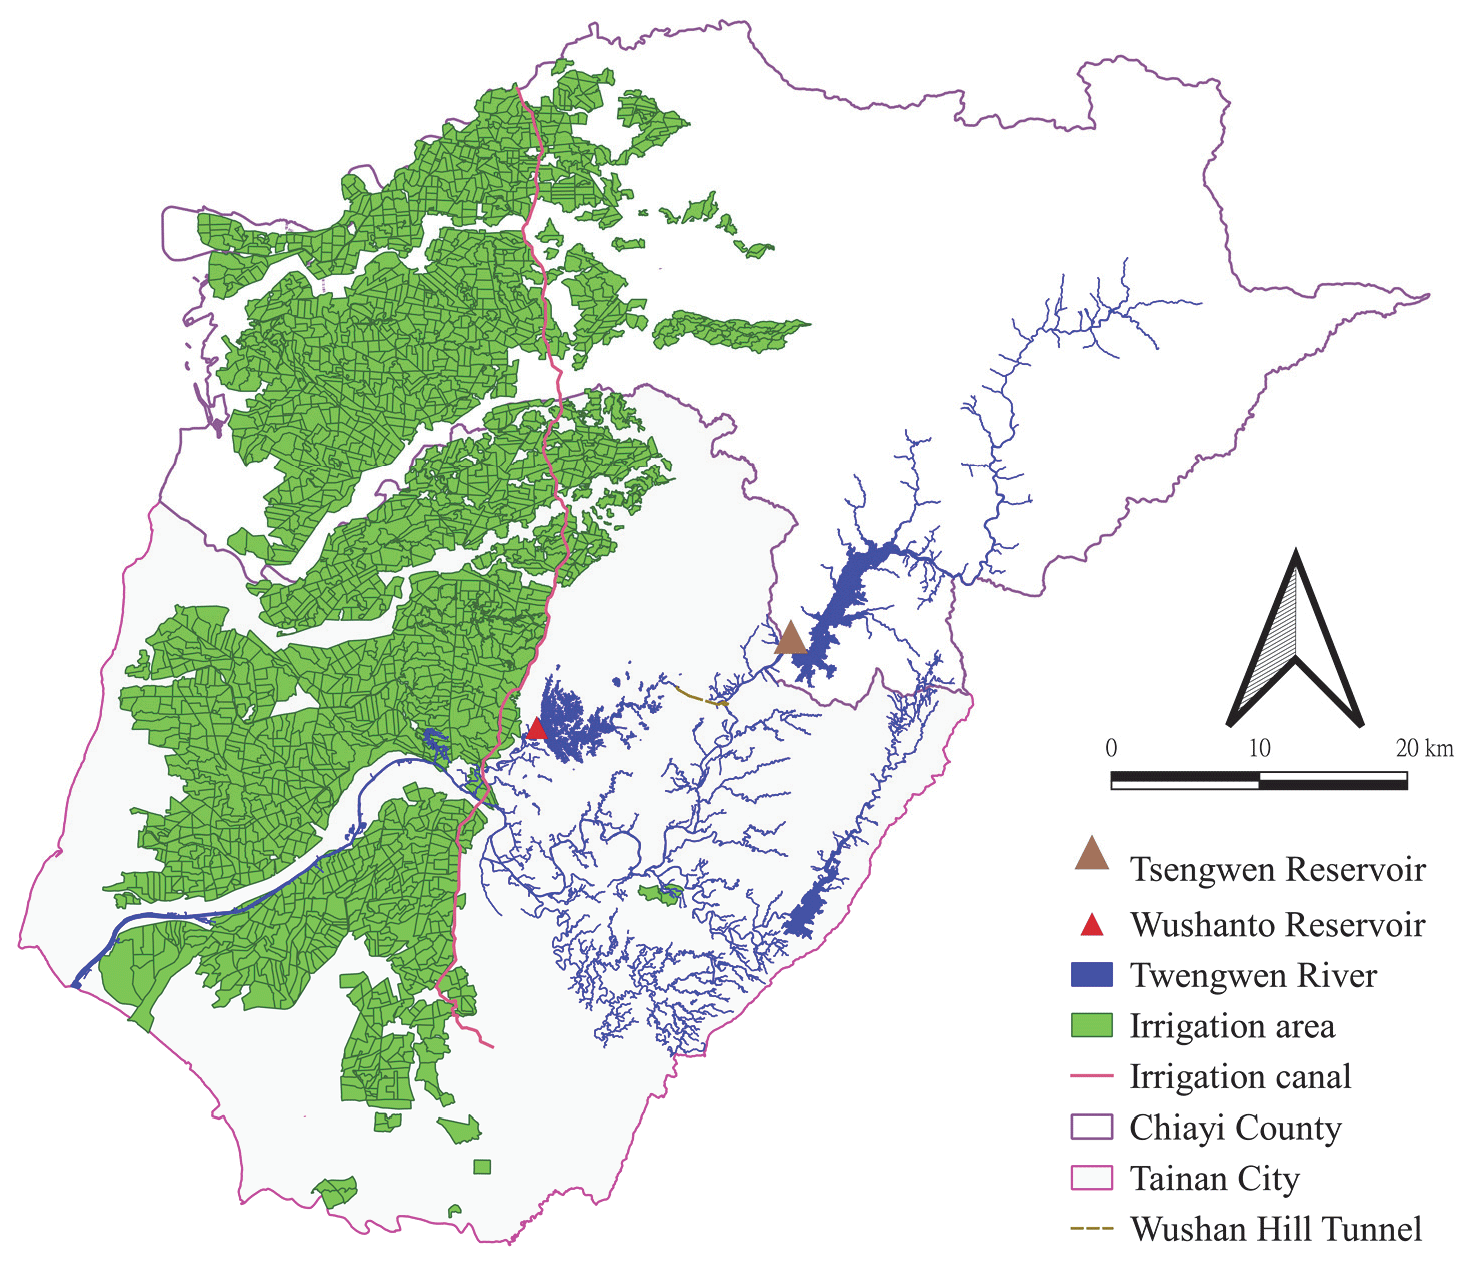
Figure 1The map of Tsengwen and Wushanto reservoirs.
The Wushanto Reservoir is situated to the southwest of the Tsengwen Reservoir in the upper section of Guantien Creek, a tributary of Tsengwen River. The watershed area of the Wushanto Reservoir is only 60 km2, which renders it conceptually as an off-stream reservoir. In 2015, its effective capacity was measured to be 78.28×10⁶ m3. The Chianan Irrigation Association manages the Wushanto Reservoir in coordination with the release from Tsengwen Reservoir, supplying irrigation water to over 70 000 ha of farmland in the Chianan Plain and providing the public and industrial water to Tainan City and Chiayi County.
2.1 The rules of joint operation for water supply
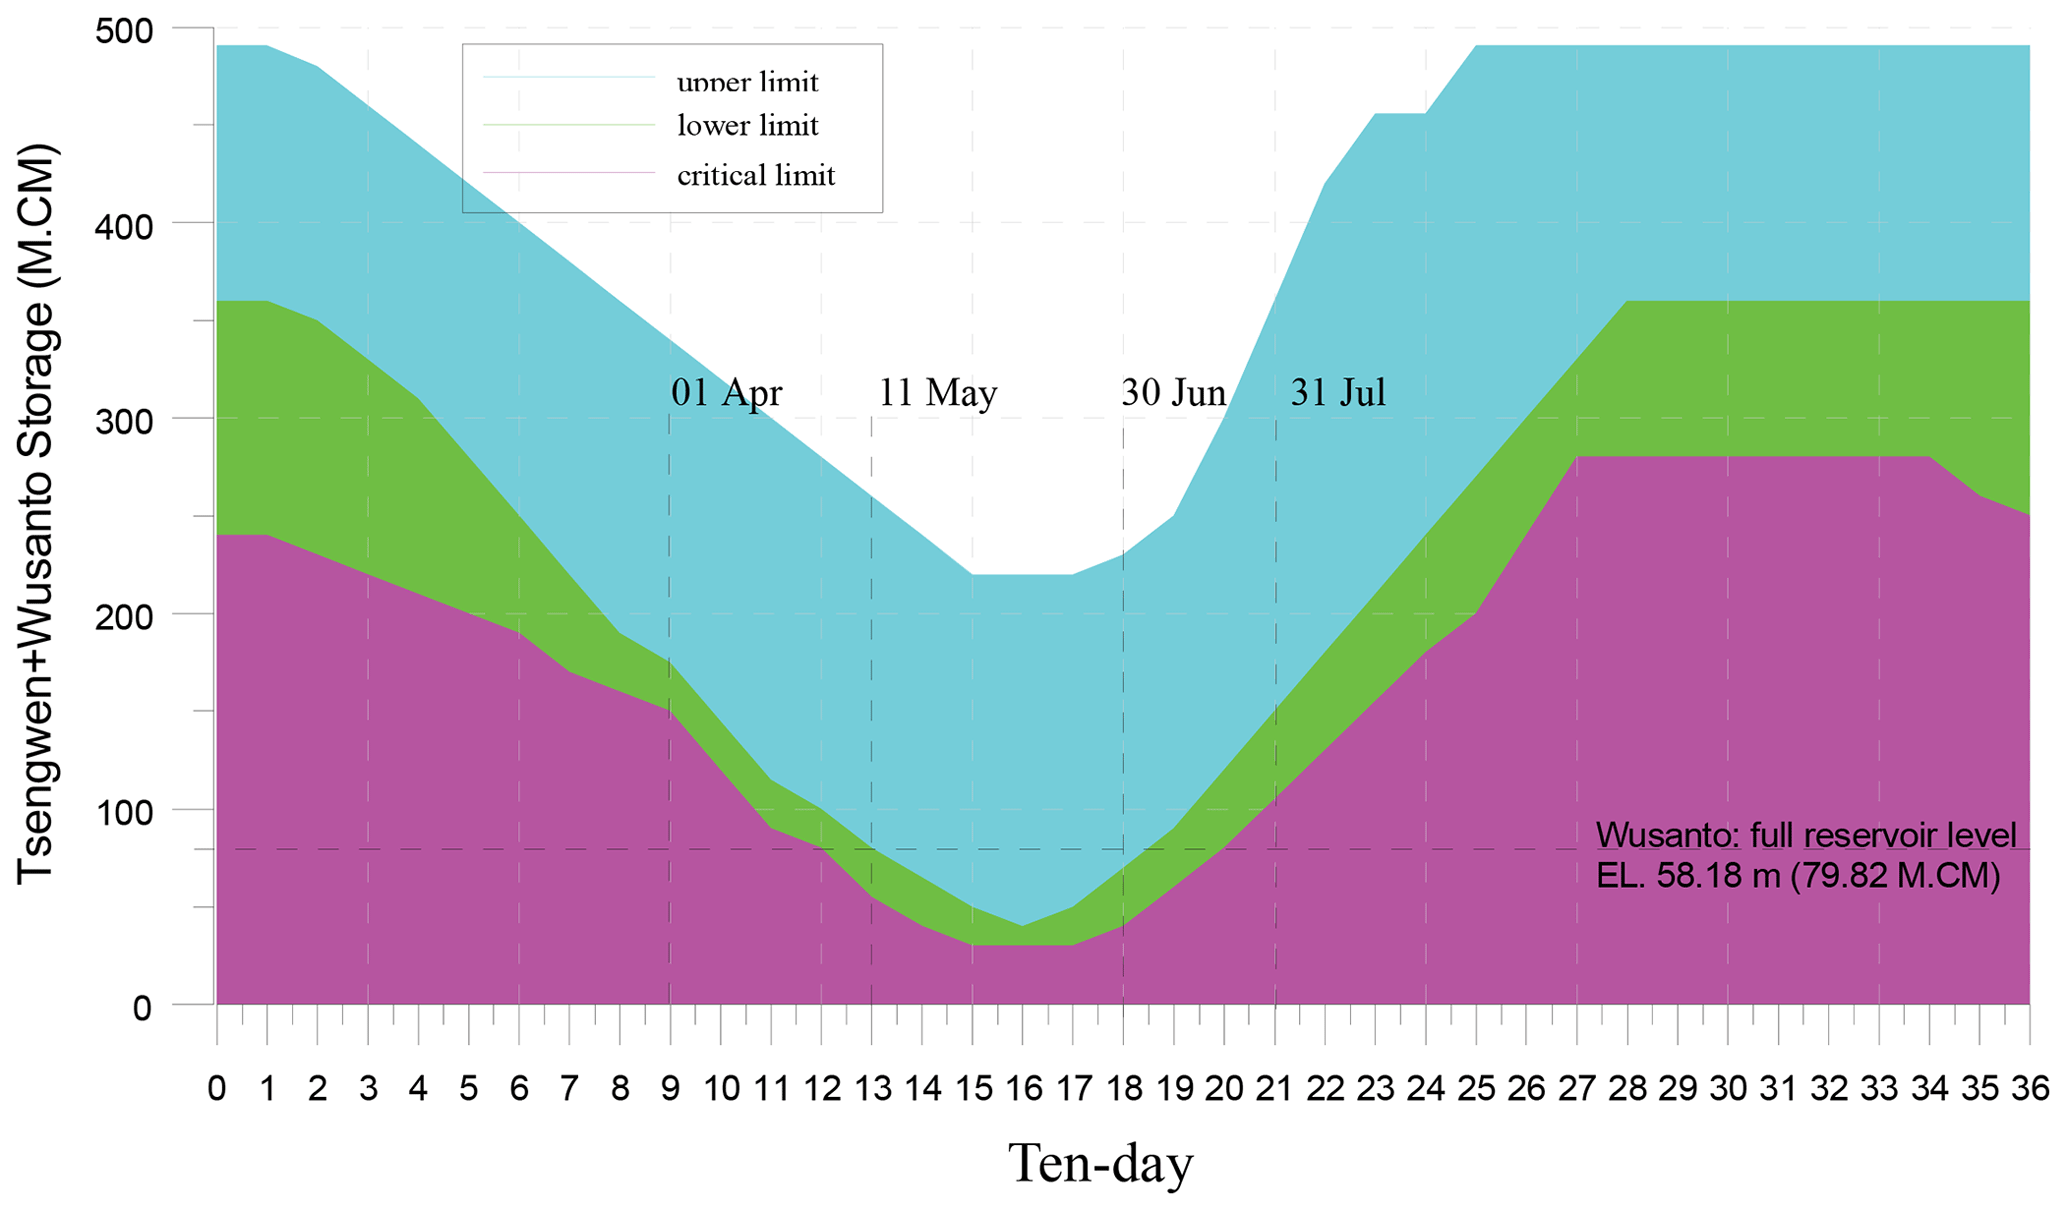
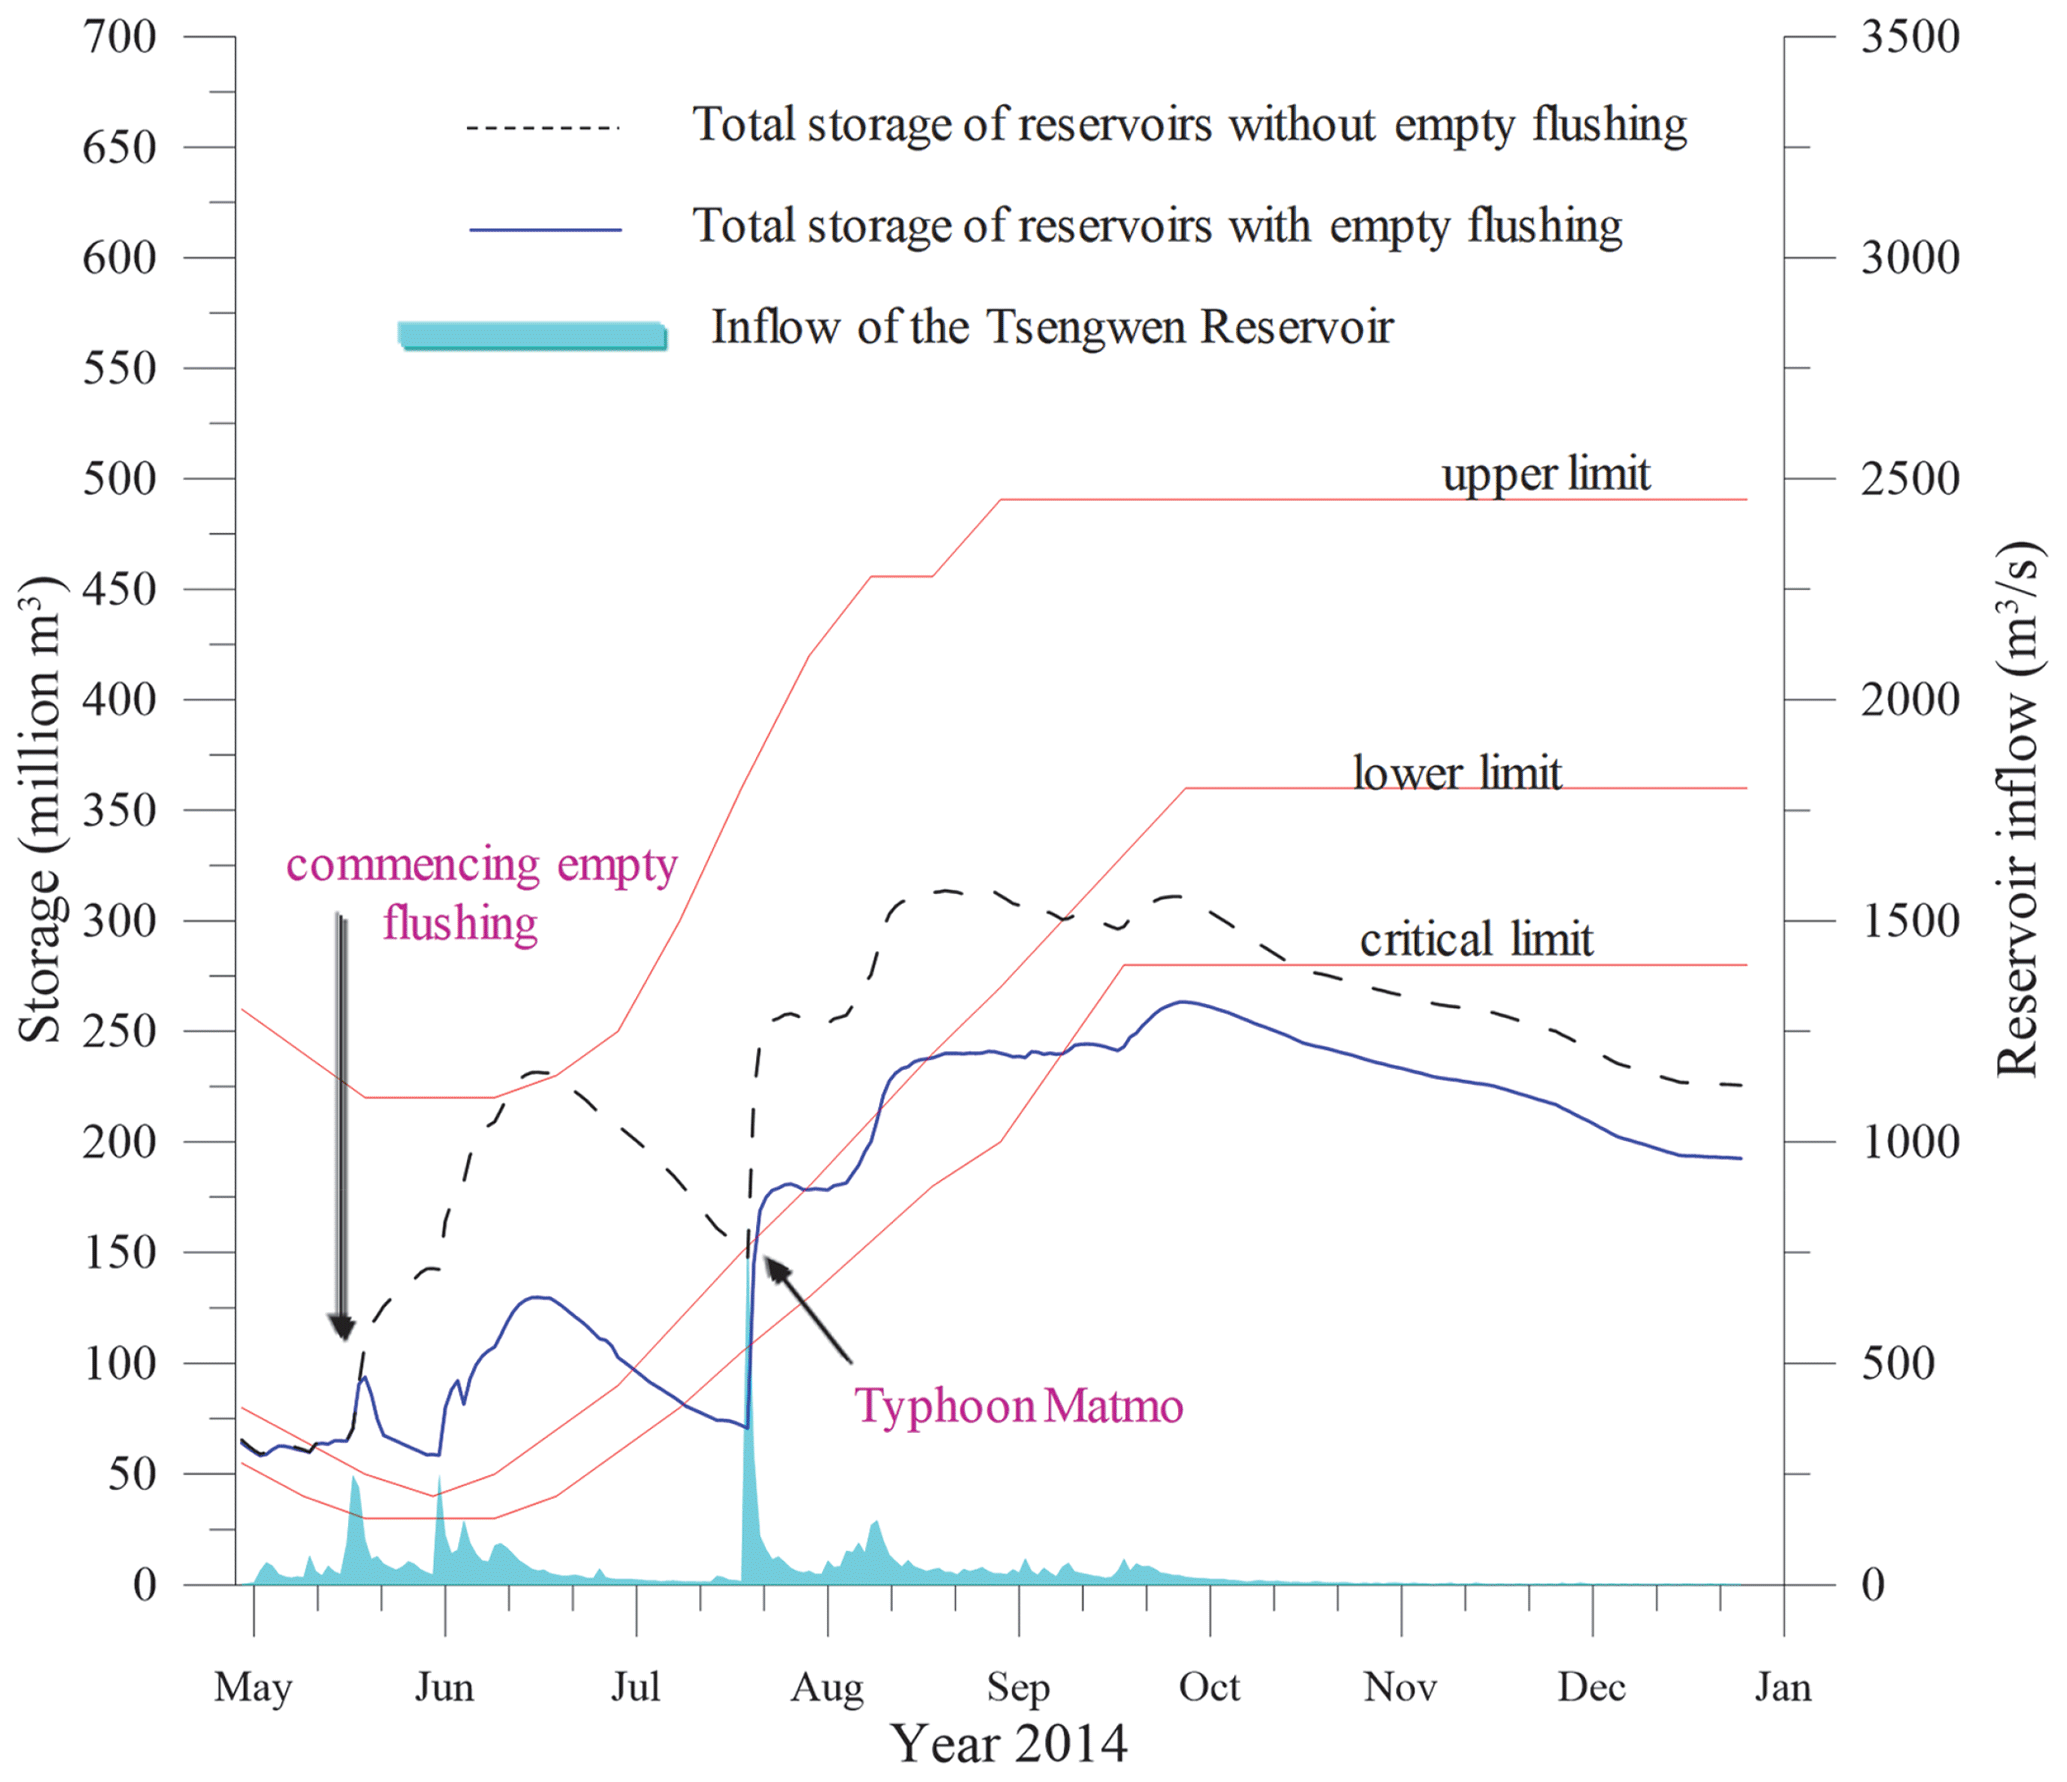
Figure 3 presents the joint operating rule curves for the Tsengwen and Wushanto reservoirs. The rules stipulate that when the total storage of the two reservoirs is below the critical limit, only 80 % of the public demand and 50 % of the agricultural and industrial demands will be satisfied. When the total storage is between the lower and critical limits, the public demand should be fulfilled, and 75 % of the agricultural and industrial demands need to be satisfied. When the total storage is between the upper and lower limits, all demands should be fulfilled. In the event that the storage in the Tsengwen Reservoir exceeds the upper limit, extra water can provide excess supply or full-loaded hydropower generation can be used until the storage returns to the upper limit.
In addition to the joint rule curves, the operators also prefer certain storage distribution among reservoirs to enhance the overall operating efficiency. The preference is represented by the form of storage balancing curves as shown by Fig. 4, which exhibits the storage preference for the two reservoirs in early April (Southern Regional Water Resources Office, 2012). The horizontal axis in the figure measures the total storage in the system, and the two curves represent the suggested desired storage for the respective reservoirs with regard to various total storage amounts. These curves vary during each 10 d period within a year to facilitate efficient storage allocation according to the pattern of water demands and reservoir inflow.

Figure 4Storage balancing curves for Tsengwen and Wushanto reservoirs in the tenth 10 d period (early April).

Figure 5Demand and inflow patterns of Tsengwen Reservoir of all 10 d periods throughout a year.
Figure 5 illustrates the whisker box of daily inflow discharge to the Tsengwen Reservoir in 10 d increments over a year. It shows a pattern of two peaks during the wet season: the first of which is induced by the front-induced plum rain between late May and early June, and the second is by typhoons mostly occurred in August. The average annual inflow volume of the reservoir is around 1.2×10⁹ m3. Water demand of this system is also included in Fig. 5, with an annual amount of 0.9×10⁹ m3 for two semiannual irrigations and 0.147×10⁹ m3 for public and industrial purposes with a steady demand pattern.
2.2 The sedimentation of Tsengwen Reservoir and the adopted counteractions
From the beginning of operations in April 1973 until October 2017, the effective capacity of the Tsengwen Reservoir was reduced from 631.2×10⁶ to 453.7×10⁶ m3. A major cause was Typhoon Morakot in 2009, which brought record-breaking rainfall to the reservoir watershed. The flood inflow of Tsengwen Reservoir peaked at 11 729 m3 s−1, which is only slightly below the peak of its probable maximum flood as 12 430 m3 s−1. Measurements at the end of 2009 indicated that the sedimentation of Tsengwen reservoir had increased by a massive 91.08×10⁶ m3 that year, which is 19.7 times that of the average annual sedimentation between 1973 and 2008. The average annual inflowing sediment volume was elevated to 5.6×10⁶ m3.
In response to the substantial increase in sedimentation, the SRWRO increased the releasing capacity of the permanent river outlet (PRO) to 177 m3 s−1 and constructed a new desilting tunnel (DST) near the dam to enhance sediment venting during floods. The improvement of PRO includes replacing the Howell-Bunger valve by a jet flow gate with invert at 153.37 m a.s.l. The design discharge and minimum operating WSL of the DST are 1070 m3 s−1 and 210 m a.s.l., respectively. The average annual sluicing volume of sediments through the PRO and DST is estimated as 1.6×10⁶ m3 by the SRWRO.
In addition to hydraulic sluicing, the master plan of desilting Tsengwen Reservoir counters the annual inflowing sediment by 3.0×10⁶ m3 through hydrosuction, 0.5×10⁶ m3 through sediment excavation, and 0.5×10⁶ m3 through sediment yield reduction. This shows hydrosuction is the major approach adopted, due to its recent economic cost of USD 2.5 per desilted sediment volume (m3) and its ability to continue desilting during non-flood periods. Several soil dikes were constructed in the river immediately downstream from the dam as temporary depositing area for the dredged slurries. The lump-sum volume of the depositing area, which constrains the annual dredging capacity, already reaches the available maximum of 3.5×10⁶ m3. For the other desilting measures, empty flushing could be a potential alternative due to the high cost of sediment excavation of USD 20 per cubic meter and uncertainties of effectiveness of sediment yield reduction. At present, the bed elevation in front of the Tsengwen Dam is raised beyond 178 m a.s.l. This level is higher than the invert of the PRO inlet which allows for empty flushing.
3.1 Qualitative analysis: key factors for successful operations of empty flushing
Two major performance indices, expected desilting volume and the induced increments of water shortage, are used to evaluate an empty flushing strategy. An optimal strategy should maximize the desilting volume while maintaining the incremental shortage under an acceptable threshold. According to the characteristics of the case study area and the other cases in Table A1, key factors for succeeding in these indices are identified as follows.
-
Qualitative conditions for water supply (WS)
- a.
WS1F: adequate water supply during empty flushing
Episodes between periods with heavy water supply pressure while backup water resources in the system is adequate can be utilized as windows of opportunity to implement empty flushing. As can be seen in Fig. 5, periods between late May and early June are when the irrigational water demand, which constitutes the majority of total demands, is lower. The first semiannual rice crop is harvested, and the second semiannual irrigation just begins. As shown in Fig. 2, between 11 May and 30 June, the lower limit of joint operation rule curves of the two reservoirs is below the effective capacity of the Wushanto Reservoir. Even if the Tsengwen Reservoir is empty, as long as the Wushanto Reservoir is full, the total storage of the system would still exceed the lower limit and is generally adequate to fulfill demand.
- b.
WS2A: adequate water supply after empty flushing
Satisfaction of this condition requires sufficient reservoir inflow following empty flushing to rapidly replenish the storage of the reservoir. Thus, the capacity of a reservoir undergoing empty flushing is usually relatively small compared to the volume of its inflow. Basson and Rooseboom (1997) indicated that empty flushing is more feasible for reservoirs with an effective capacity to annual inflow volume ratio (capacity and inflow ratio, CIR) of less than 0.03. Many of the reservoirs in Table A1 fulfill this criterion. The others that have a CIR greater than 0.03 are located in areas with uneven seasonal rainfall distributions, such that the abundance of inflow during flood seasons can effectively refill the storage soon after empty flushing. The case study system with the CIR for the Tsengwen Reservoir as 0.38 shares the same characteristic of uneven rainfall distribution. The proper timing for terminating empty flushing should thus be carefully determined to ensure the remaining inflow during wet season satisfies this condition.
- a.
-
Qualitative conditions for flushing sediments (FS)
Compliance with FS promotes efficiency of sediment flushing. The key is to take advantage of opportunities with both high inflow and low WSL of the primary reservoir to perform empty flushing.
- a.
FS1Q: high inflow during empty flushing
High inflow is required to more effectively scour and flush out the depositions of the reservoir. Atkinson (1996) and White (2001) indicated that empty flushing should only be initiated when the inflow is at least double the inflow in ordinary conditions. For the Tsengwen Reservoir, the wet season generally begins between late May and early June as the front-induced precipitation occurs. For floods during this period, the daily inflow discharge usually exceeds 100 m3 s−1, which is over 10 times the average inflow during January to April, and the hourly peak discharge could be beyond 1000 m3 s−1.
- b.
FS2L: low WSL before and during empty flushing
-
Before empty flushing is started. The operating records of Tsengwen Reservoir over 4 decades shows its WSL is generally the lowest in mid-May, with average storage of 98.7×10⁶ m3 and median of 68.98×10⁶ m3. This means that if the storage can be properly allocated to the Wushanto Reservoir, then the Tsengwen Reservoir is likely to be nearly empty during these periods. The capacity of PRO would also allow for timely drawdown prior to expected flood so that the flood inflow can satisfy FS1Q.
-
After empty flushing is initiated. Once empty flushing operation is initiated, the reservoir should remain as close to empty as possible to maintain high flushing efficiency. However, if the inflow exceeds the capacity of PRO, then the WSL of the reservoir will rise. This leads to decreased flow velocity and reduced flushing efficiency in the reservoir. Atkinson (1996) suggested the use of the drawdown ratio (DDR) to measure the flushing efficiency. This index is defined as 1 minus the ratio between the depth of WSL during empty flushing and the depth of normal pool level of the reservoir. Atkinson (1996) and White (2001) defined incomplete drawdown flushing as situations in which DDR is less than 0.66, wherein the depth of the water during flushing is greater than one-third of the maximum depth. For the case of Tsengwen Reservoir, this threshold marks at the elevation of 185 m a.s.l., which corresponds to an impoundment of 16.6×10⁶ m3. In circumstances when the WSL exceeds this level, the efficiency of empty flushing is significantly reduced, and it is recommended to switch the operation to regular mode of water supply.
-
- a.
The above analysis eventually leads to a conclusion that the meteorological and operating conditions during May and June are favorable for empty flushing of the Tsengwen Reservoir.
3.2 Quantitative derivation of the optimal empty flushing strategy
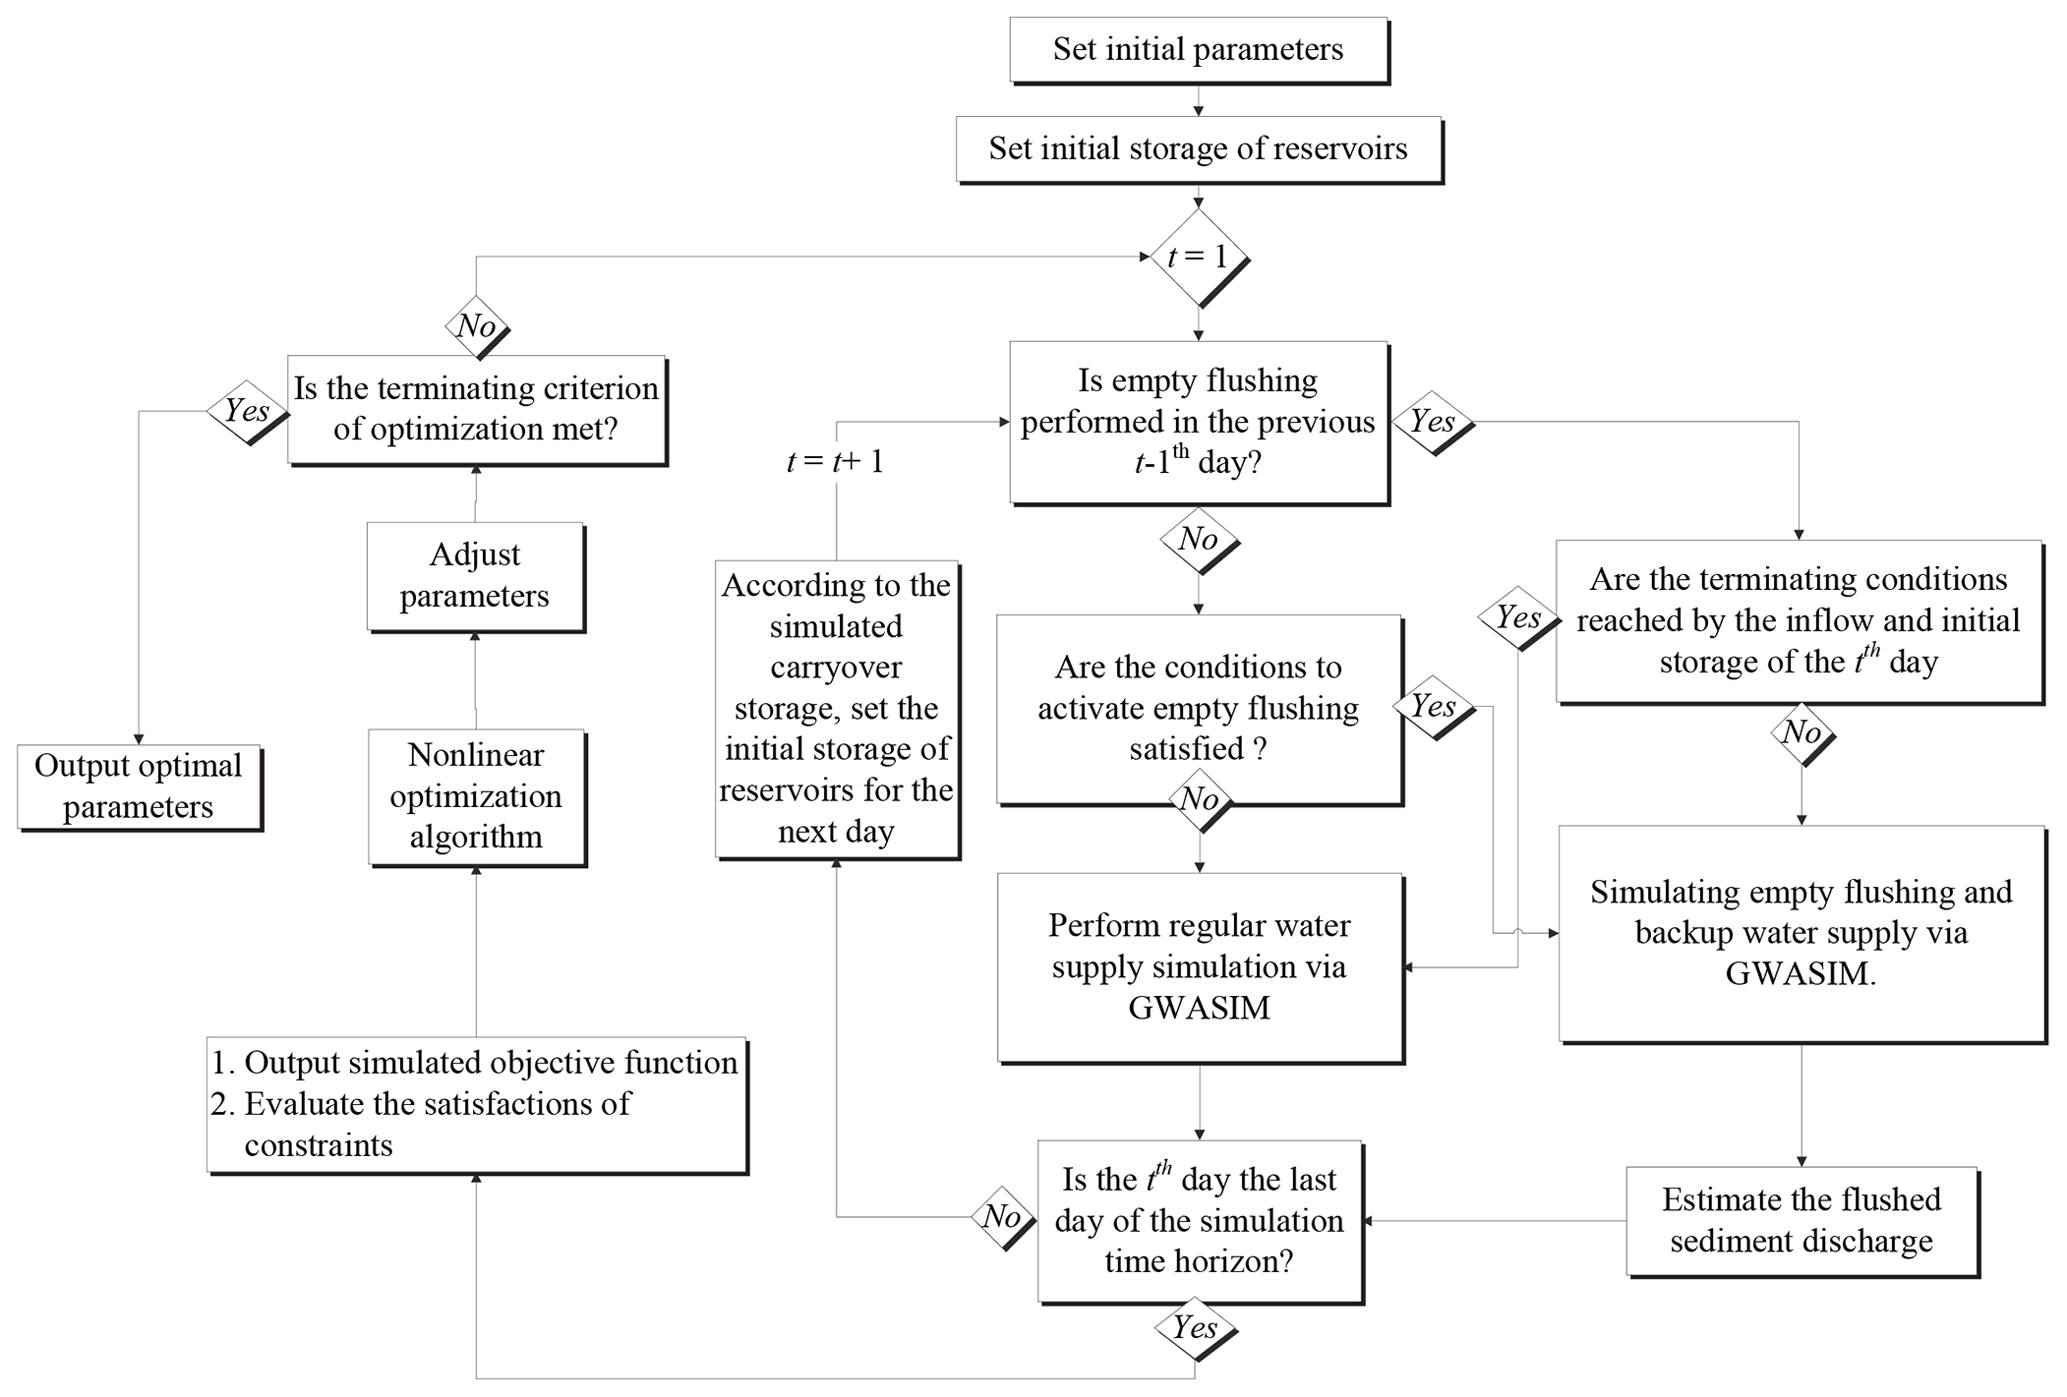
The proposed method adopts the simulation–optimization linkage approach for deriving optimal strategy. It requires simulating the operations of water supply and empty flushing, thus allowing for quantifying the desilting volume as well as the incremental water shortage generated by a given strategy. The process of water supply is simulated according to a set of joint operating rules as presented in Sect. 3.2.1. When specific quantitative conditions presented in Sect. 3.2.2 are achieved, empty flushing in the primary reservoir is activated, and the approach in Sect. 3.2.3 is employed to estimate the desilting volume. The empty flushing terminates when the conditions presented in Sect. 3.2.4 are reached, and the simulation is switched to regular water supply operation until the next time activation conditions are satisfied. The simulation model is linked to an optimization algorithm to calibrate optimal parameters in the activation and termination conditions, according to the formulation presented in Sect. 3.2.5. Figure 6 depicts a flowchart of the analyzing procedure.
3.2.1 Joint operating rules for a multi-reservoir system
According to Oliveria and Loucks (1997), the rules to jointly operate multiple reservoirs for water supply include the following two phases.
-
Determination of total water supply. The total amount of water supply is determined based on the total storage of reservoirs and the system-wide release rule. The rule stipulates that if the total storage does not suffice, a discount of total water supply may be applied, such as the joint rule curves shown in Fig. 2 and the water rationing mechanism described in Sect. 2.
-
Distributing storage to individual reservoirs. Based on the calculated total water supply, the total end-of-period storage in the system can be estimated with the expected reservoir inflow during one single operating period. The release from each individual reservoir can then be determined by applying an individual reservoir storage balancing function, such as the storage balancing curves depicted in Fig. 4.
Figure 4 was designed to ensure efficient utilization of water resources, without any consideration of empty flushing. It was derived initially based on field operating experiences and revised through a trial and error process. The first part of the proposed method requires appropriate adjustment of the storage balancing curves before and during the periods feasible for empty flushing. This adjustment prioritizes the water released from the primary Tsengwen Reservoir while preserving storage in the Wushanto Reservoir. This complies with the aforementioned WS1F and FS2L strategies and creates a favorable initial condition for empty flushing. Figure 7 depicts the balancing curves updated from the original Fig. 4.
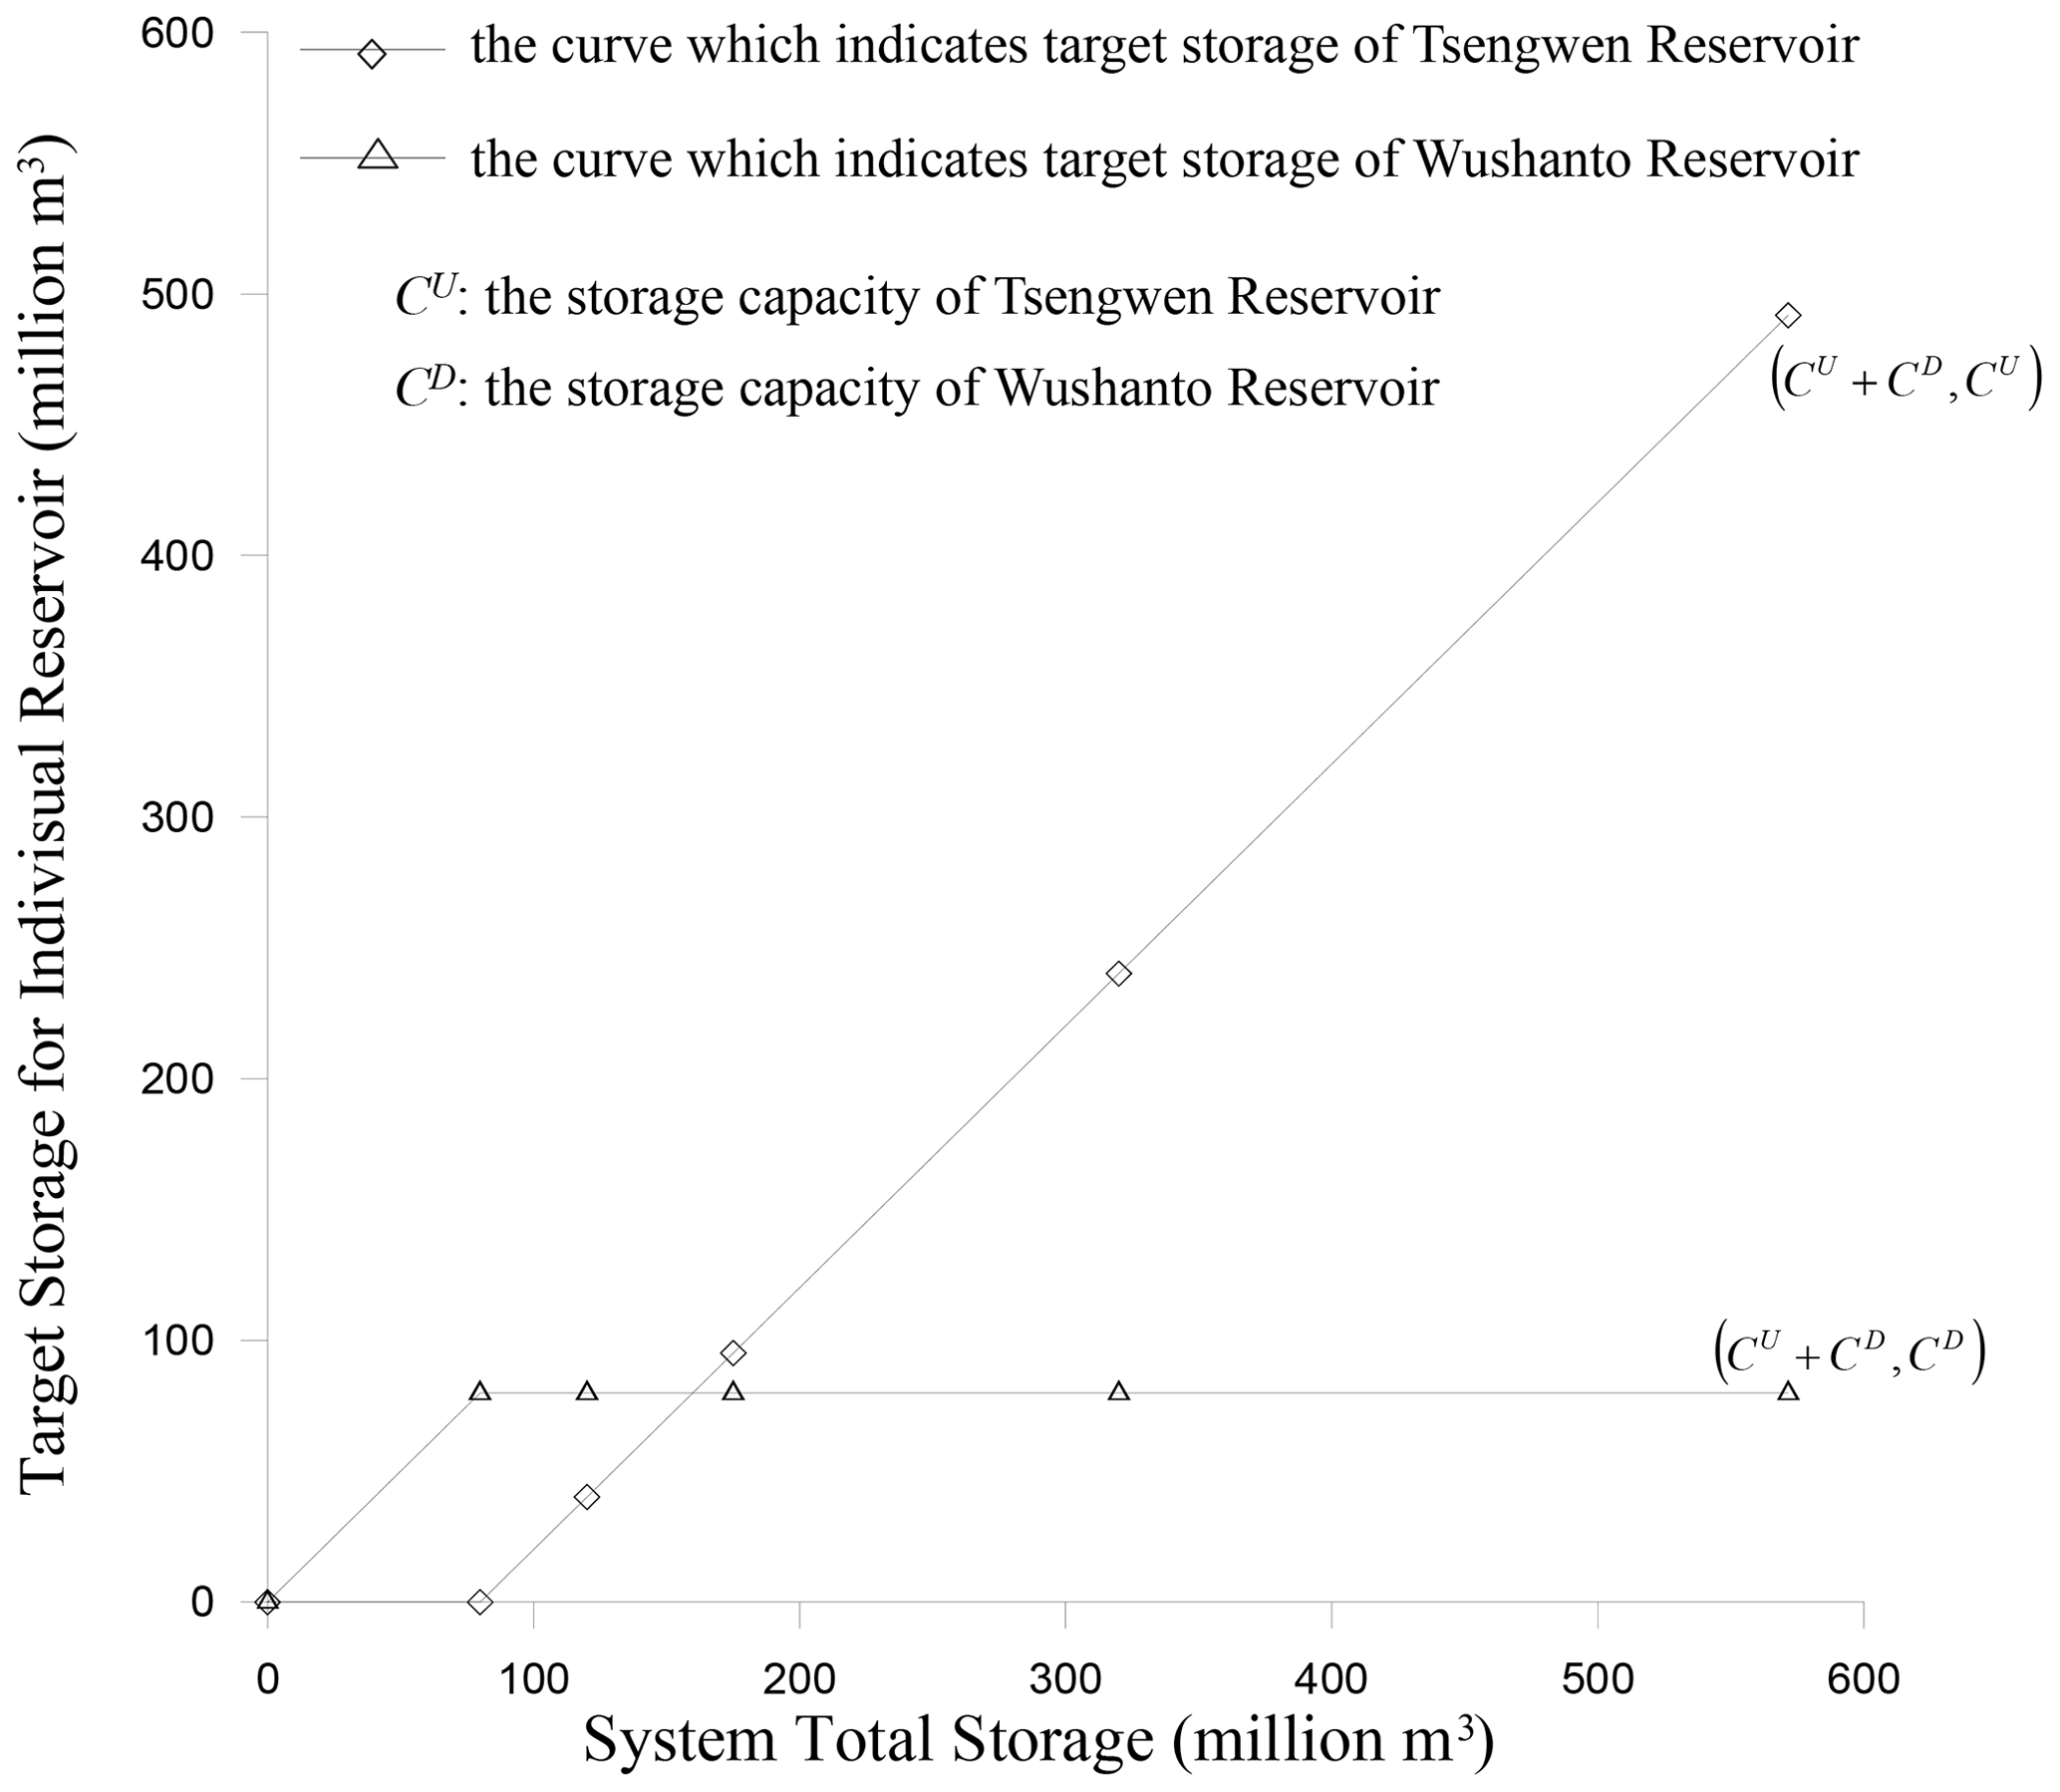
Figure 7Modified storage balancing curves using Tsengwen Reservoir as primary source to satisfy water demand.
3.2.2 Conditions for initiation of an empty flushing operation
Water supply simulation of historical daily reservoir inflow records is sequentially performed according to the joint operating rules. During the simulation, empty flushing operation is activated when all of the following conditions are satisfied:
-
The current simulating date falls within the pre-evaluated feasible time frame for empty flushing.
-
The storage of the primary reservoir is lower than a threshold TU. This ensures the satisfaction of FS2L. A higher value of TU allows for initiating drawdown flushing at higher primary reservoir storage, thus increasing the range of opportunities for empty flushing. Nonetheless, a higher TU incurs the risk that, if subsequent reservoir inflow falls short of predicted values, the emptied storage may not be replenished.
-
The total storage in the backup reservoir is greater than a threshold TD. This ensures the satisfaction of WS1F. A higher value of TD elevates the stability of water supply during empty flushing. In cases where either this or the above condition has not been met, demand should be supplied from the primary reservoir as much as possible, or storage should be diverted from the primary reservoir to the other. However, this storage reallocation may be limited by the water-transmitting capacity between reservoirs, such that the conditions for initiating empty flushing may not be met within the prespecified feasible period for flushing. Therefore, a higher TD may reduce the number of opportunities to perform empty flushing.
3.2.3 Estimation of the flushed sediment discharge
Once the activation conditions are met, the gates of the PRO of Tsengwen Reservoir are fully opened to empty the storage and route the inflowing water and sediments. The release from the primary reservoir would cause blockages of the downstream water diversion or water treatment facilities due to its high sediment concentration. Thus, the water supply relies solely on the storage preserved in the Wushanto Reservoir. During empty flushing, the inflow, outflow, and WSL of the primary reservoir are used to estimate the volume of flushed sediments. The estimation can be based on either numerical simulation or empirical formula, and the second of which is adopted by this paper due to its simplicity and easy incorporation with the proposed optimization framework. After the optimized strategy identifies feasible events of empty flushing, numerical simulation is then used to verify the effectiveness of the empirical formula, as presented in Appendix A3.
The empirical formula developed by the International Research and Training Center on Erosion and Sediment (IRTCES) in Tsinghua University, Beijing (IRTCES, 1985), is employed for the estimation of releasing sediment discharge from the primary reservoir. The formula is based on measurements from 14 reservoirs in China:
where QCt and Qt denote the sediment discharge (t s−1) and water discharge (m3 s−1) flushed from the primary reservoir during the tth simulating day, respectively; Sf represents the energy slope associated with the flow in the primary reservoir during empty flushing; W is the width of the flushing channel (m), which can be estimated using the empirical formula (Atkinson, 1996); and ψ is the flushing coefficient, associated with the characteristics of the sediment and topography of the reservoir.
For the current case study area, the value of ψ is set to 60 when the reservoir storage remains nearly empty, as suggested by Atkinson (1996) for cases with limited-capacity bottom outlets. To prevent overestimating the effectiveness of empty flushing, it is assumed that if a flood raises the WSL of the Tsengwen Reservoir to exceed 185 m a.s.l., which is about 30 % of its maximum depth, then the flushed sediment volume from the PRO is set to be 0. This setting is supported by field measurements of Tsengwen Reservoir and other adjacent reservoirs which regularly undergo empty flushing in southern Taiwan. These measurements are reported in Appendix A2.
3.2.4 Conditions for termination of empty flushing operation
Empty flushing should be terminated if one of the following circumstances occurs.
-
The accumulative released water volume from the primary reservoir exceeding a certain threshold TV would halt the flushing of the year. Empty flushing consumes water originally stored in the reservoir for water supply. This consumption is expected to be compensated by subsequent floods which refill the reservoir and induce spillage. Nonetheless, if the floods are not significant enough following the flushing, the impacts of excess releasing will be carried on to the next dry season and increase water shortage. The threshold TV alleviates this impact by restraining the water consumption volume of empty flushing.
-
Providing the accumulative release volume is still under TV, the flushing should be terminated when the flood flow has raised the WSL of the primary reservoir and daily inflow subsequently recedes to be below the capacity of associated bottom outlets. This situation indicates that the operation has been successfully timed to encounter a flood and should thus be ended when the flood ends.
-
The flushing should be ended when the storage of backup reservoir decreases to below a threshold Td. This condition prevents short-term water shortages following flushing operations resulting from insufficient storage. During the emptying of the primary reservoir, providing a water supply will gradually reduce available storage in the other reservoir. A higher value of Td will cause the storage to be below threshold more quickly, thus reducing the window of operation for empty flushing. Nonetheless, adequate reservoir inflow and proper storage reallocation after an earlier termination of one flushing operation will facilitate the reinitiation of a subsequent operation during the feasible period for empty flushing. Thus, under conditions of a higher Td value, the pattern of empty flushing may be transformed from a few operations of longer duration into multiple intermittent operations of shorter durations.
A generalized water allocation simulation model (GWASIM) developed by Chou and Wu (2010) is used to simulate the alternating operations of empty flushing and joint water supply according to the aforementioned rules and conditions. The simulation is designed to evaluate the performance of the water resources system under specific storage volume, water demand, and operating rules. It requires sequential daily routing of system operation for several decades of inflow series to reflect the long-term hydrological variation. GWASIM has already been implemented in the planning and management studies of all water resource systems of western Taiwan. Details of its simulations regarding the operations of multi-reservoir systems can be found in Chou et al. (2006) and Chou and Wu (2014).
3.2.5 Evaluation of optimal empty flushing strategies
The thresholds for activating and terminating an empty flushing operation as described in Sect. 3.2.2 and 3.2.4 are regarded as decision variables. They are calibrated to maximize the total desilting volume without inducing both short- and long-term intolerable water shortage scenarios. The short-term scenario relies on the occurrence of subsequent floods to induce spillage and fully compensate for the impact of emptying reservoir. Thus the incremental shortage following empty flushing is concentrated in a few months before the consequent floods, during each of which the monthly shortage increment and ratio are calculated:
where and represent the water shortage increment and ratio during the mth month following the feasible period of empty flushing in the nth simulating year; Dm denotes the water demand during the mth month following empty flushing; and dn,m and represent simulated water shortages under conditions with and without empty flushing operations. is from simulating the default regular water supply process using the GWASIM, and dn,m is obtained by incorporating empty flushing operations according to the activating and terminating conditions defined by the decision variables. nm is the number of months within which the impact of empty flushing on water supply is carried over, and ny is the number of simulating years.
The long-term shortage scenario aims at situations that subsequent floods are not significant enough to induce reservoir spillage. Thus the incremented shortage extends into the next dry season, of which shortage ratios with or without empty flushing are expressed below:
where Ddry represents the total demand during the dry season, and , dn,dry, , and are the water shortage volumes and ratios with and without executing empty operation during the dry season, respectively.
The formulation of the optimization problem is as follows:
subject to
where nt is the total number of days within the simulating horizon; QCt is the simulated sediment discharge from the primary reservoir by empty flushing on the tth day. It is determined by substituting the release of the primary reservoir during the flushing period into Eq. (1). The left-hand side (LHS) of Eq. (7), , represents the maximum monthly water shortage ratio from the ny simulating years given that the short-term shortage is induced by empty flushing. The right-hand side (RHS) of Eq. (7), α, is the maximum acceptable value for . The LHS of Eq. (8), , represents the maximum shortage ratio during the dry season following empty flushing, given that the original shortage ratio of the same periods without flushing is less than a failure threshold. The failure threshold of shortage ratio β usually means the irrigation for majority areas needs to be suspended to ensure steady public water supply in Taiwan. Equation (8) thus avoids inducing additional failure events of water supply in the dry season following empty flushing.
The BOBYQA (Bound Optimization BY Quadratic Approximation) algorithm, a nonlinear optimization algorithm of Powell (2009), is used to solve the problem. The details of BOBYQA can be found in Powell (2009), and the barrier function approach to handle the constraint of Eqs. (7) and (8) can be found in Chou and Wu (2015).
4.1 The base scenario with default operating rules
In the base scenario, sequential water supply simulation in the absence of empty flushing is performed using the daily inflow records of the reservoirs from 1975 to 2009 and the joint operating rules as described in Sect. 2. It generates the default water supply condition, i.e., , , and in Eqs. (2) and (4), and provides a basis to evaluate the incremental shortage induced by empty flushing.
Table 1Monthly probabilities of Tsengwen Reservoir storage dropping below 20×106 m3 under various strategies of storage allocation.
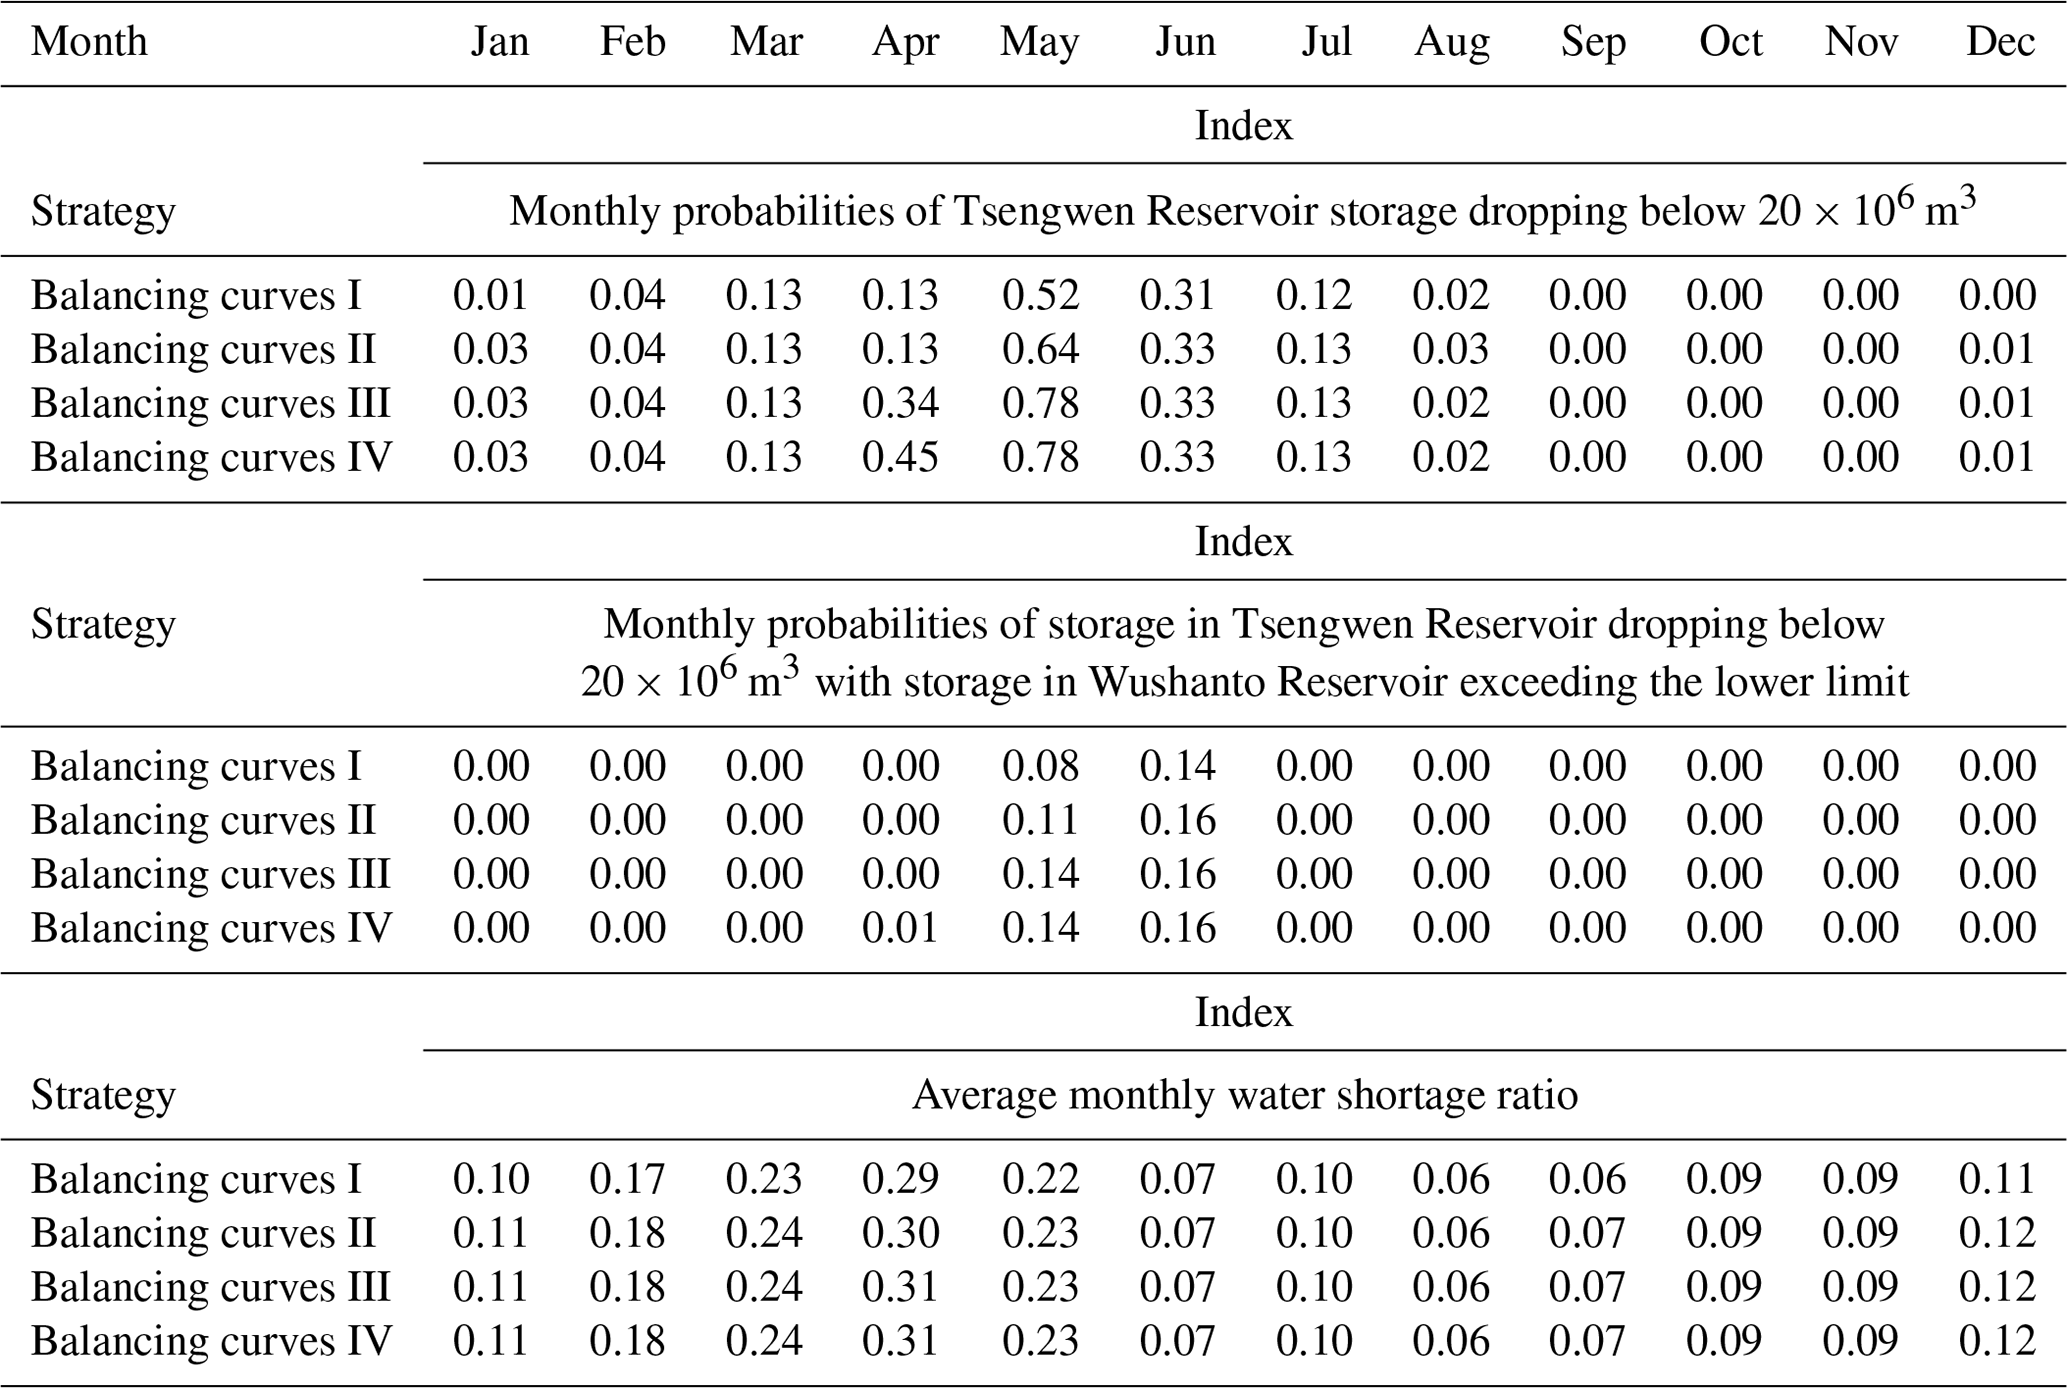
Balancing curves I: the original storage balancing curves as shown in Fig. 4.
Balancing curves II: adopting the modified curves as in Fig. 7 from 1 May to
20 June.
Balancing curves III: adopting the modified curves as in Fig. 7 from 1 April
to 20 June.
Balancing curves IV: adopting the modified curves as in Fig. 7 from 1 March
to 20 June.
Based on the simulated results, the probability that the storage in the Tsengwen Reservoir drops below 20×106 m3 for preparing empty flushing timely in a given month while the Wushanto Reservoir storage simultaneously exceeds the lower limit of the rule curves is calculated. The results are displayed in the “Balancing curves I” rows of Table 1. The results show that in May there is a 52 % probability that the storage of the Tsengwen Reservoir will drop below 20×106 m3 and an 8 % probability that the Tsengwen Reservoir storage drops below 20×106 m3 while the Wushanto Reservoir storage simultaneously exceeds the lower limit. In June, the two probabilities are 31 % and 14 %, respectively. These 2 months with the highest probabilities of desired storage distribution within a year are most promising for empty flushing. The respective storage of the Tsengwen and Wushanto reservoirs each satisfies the abovementioned conditions only between 11 May and 20 June, which is selected as the feasible period for empty flushing in the Tsengwen Reservoir.
4.2 Schemes for the modification of storage balancing curves
Based on the base scenario, three additional simulations are conducted in which the modified storage balancing curves of Fig. 7 are applied during (1) 1 May to 20 June, (2) 1 April to 20 June, and (3) 1 March to 20 June. The simulated results are summarized in Table 1. It demonstrates that the probability of favorable storage distribution for empty flushing during May and June can be effectively elevated by modifying storage balancing curves in April. The trade-off of creating this favorable initial condition is that preserving the storage of Wushanto Reservoir before and during empty flushing might cause unnecessary spillage while the full reservoir cannot store the inflow from Guantien Creek. Also, allocating storage between reservoirs through the Wushan Hill Tunnel will induce more transmitting loss of water. Nonetheless, the shortage ratios generated by the modified balancing curves are no more than 0.01 higher than those from the original balancing curves, which means that the modification has only a trivial impact on the efficiency of water resources utilization.
The results also indicate that the average water shortage ratio during the wet season drops considerably after July. This is because the first typhoon of the wet season generally occurs in July or early August, bringing substantial inflow to the reservoirs. Thus in the following evaluation of empty flushing strategies, the water shortage scenarios through the end of July are selected to represent the impact of empty flushing on short-term water supply, i.e., nm in Eqs. (3) and (7) is set to 1. For the long-term impact, the shortage ratio during the next dry season, from January to May of the next year, are considered, referring to dn,dry, , and in Eqs. (4) and (8).
4.3 Preliminary simulations and assessment of empty flushing strategies
The thresholds to activate and terminate an empty flushing operation, i.e., TU for the Tsengwen Reservoir, TD and Td for the Wushanto Reservoir, and TV for the maximum accumulative releasing volume, are parameters to be optimized. Except TV, the other parameters are allowed to vary during different 10 d periods from 11 May to 20 June to promote the performance of desilting and backup water supply. Before actually optimizing these parameters, preliminary simulations are performed with constant storage thresholds throughout 11 May to 20 June. This process facilitates determination of a good initial solution as well as a basis for comparison to measure the effects of optimization. The preliminary simulations consider seven different TU values, ranging from 0 to 60×106 m3 with a constant interval of 10×106 m3, for the Tsengwen Reservoir. Six values (including 55×106, 60×106, 65×106, 70×106, 75×106, and 78×106 m3) for TD and nine values (including 30 to 70×106 m3 with a constant interval of 5×10⁶ m3) for Td are considered. The value TV is set to an extremely high value, thus imposing no constraint on the water releasing volume of empty flushing as well as the long-term water supply. All these values contribute to a total of 308 combinations of empty flushing strategies in which Td is less than TD. Simulations of the 308 combinations are performed using the original storage balancing curves. The resulting average annual desilting volume and maximum short-term monthly water shortage ratio induced by empty flushing are then calculated. The results are presented in Fig. 8, in which the desilting volume is converted from the estimated flushing discharge by Eq. (1) with bulk density as 1.56 t m−3 (Water Resources Agency, 2010b). The simulations are then repeated by applying the modified storage balancing curves in Fig. 7 to the period between April and June, and the results of which are displayed in Fig. 9. A comparison of Figs. 8 and 9 shows that the modified storage balancing curves effectively enhance the effectiveness of desilting. For instance, strategies with between 0.17 and 0.23 correspond to a maximum annual desilting volume of 0.06×10⁶ m3 yr−1 in Fig. 8, whereas the same strategies in Fig. 9 result in an increase of desilting volume reaching 0.54×10⁶ m3 yr−1.
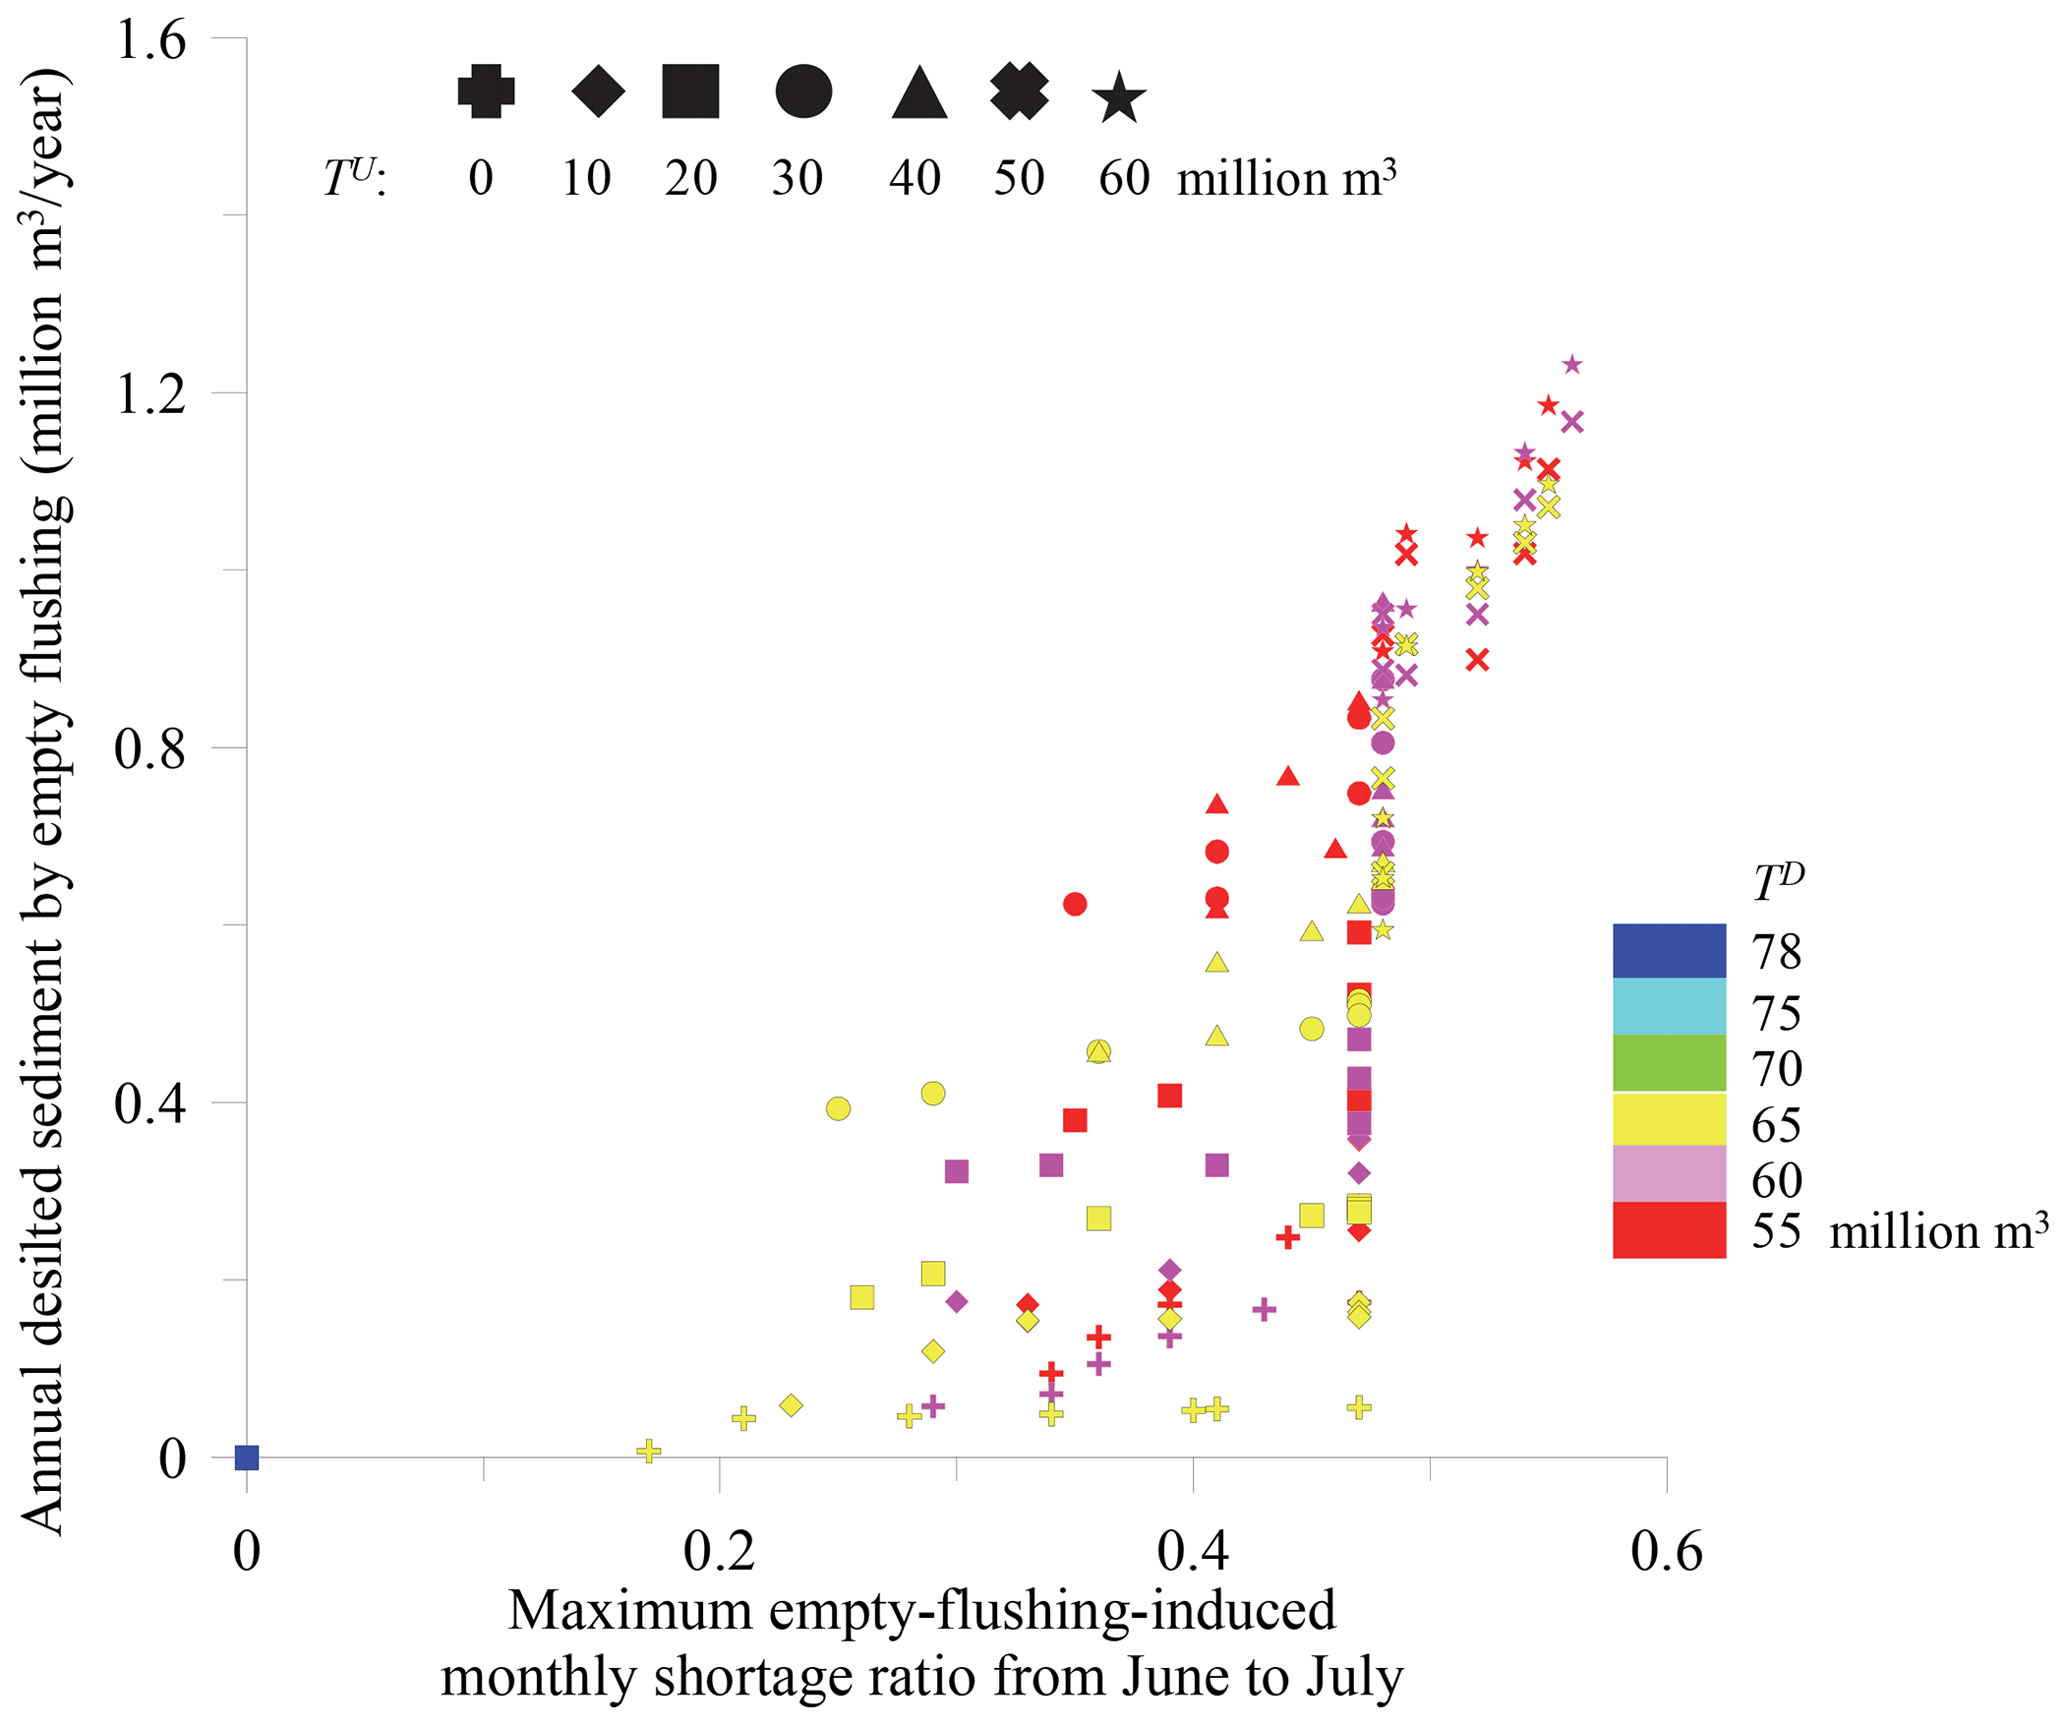
Figure 8Simulation results of various empty flushing strategies using the original storage balancing curves.
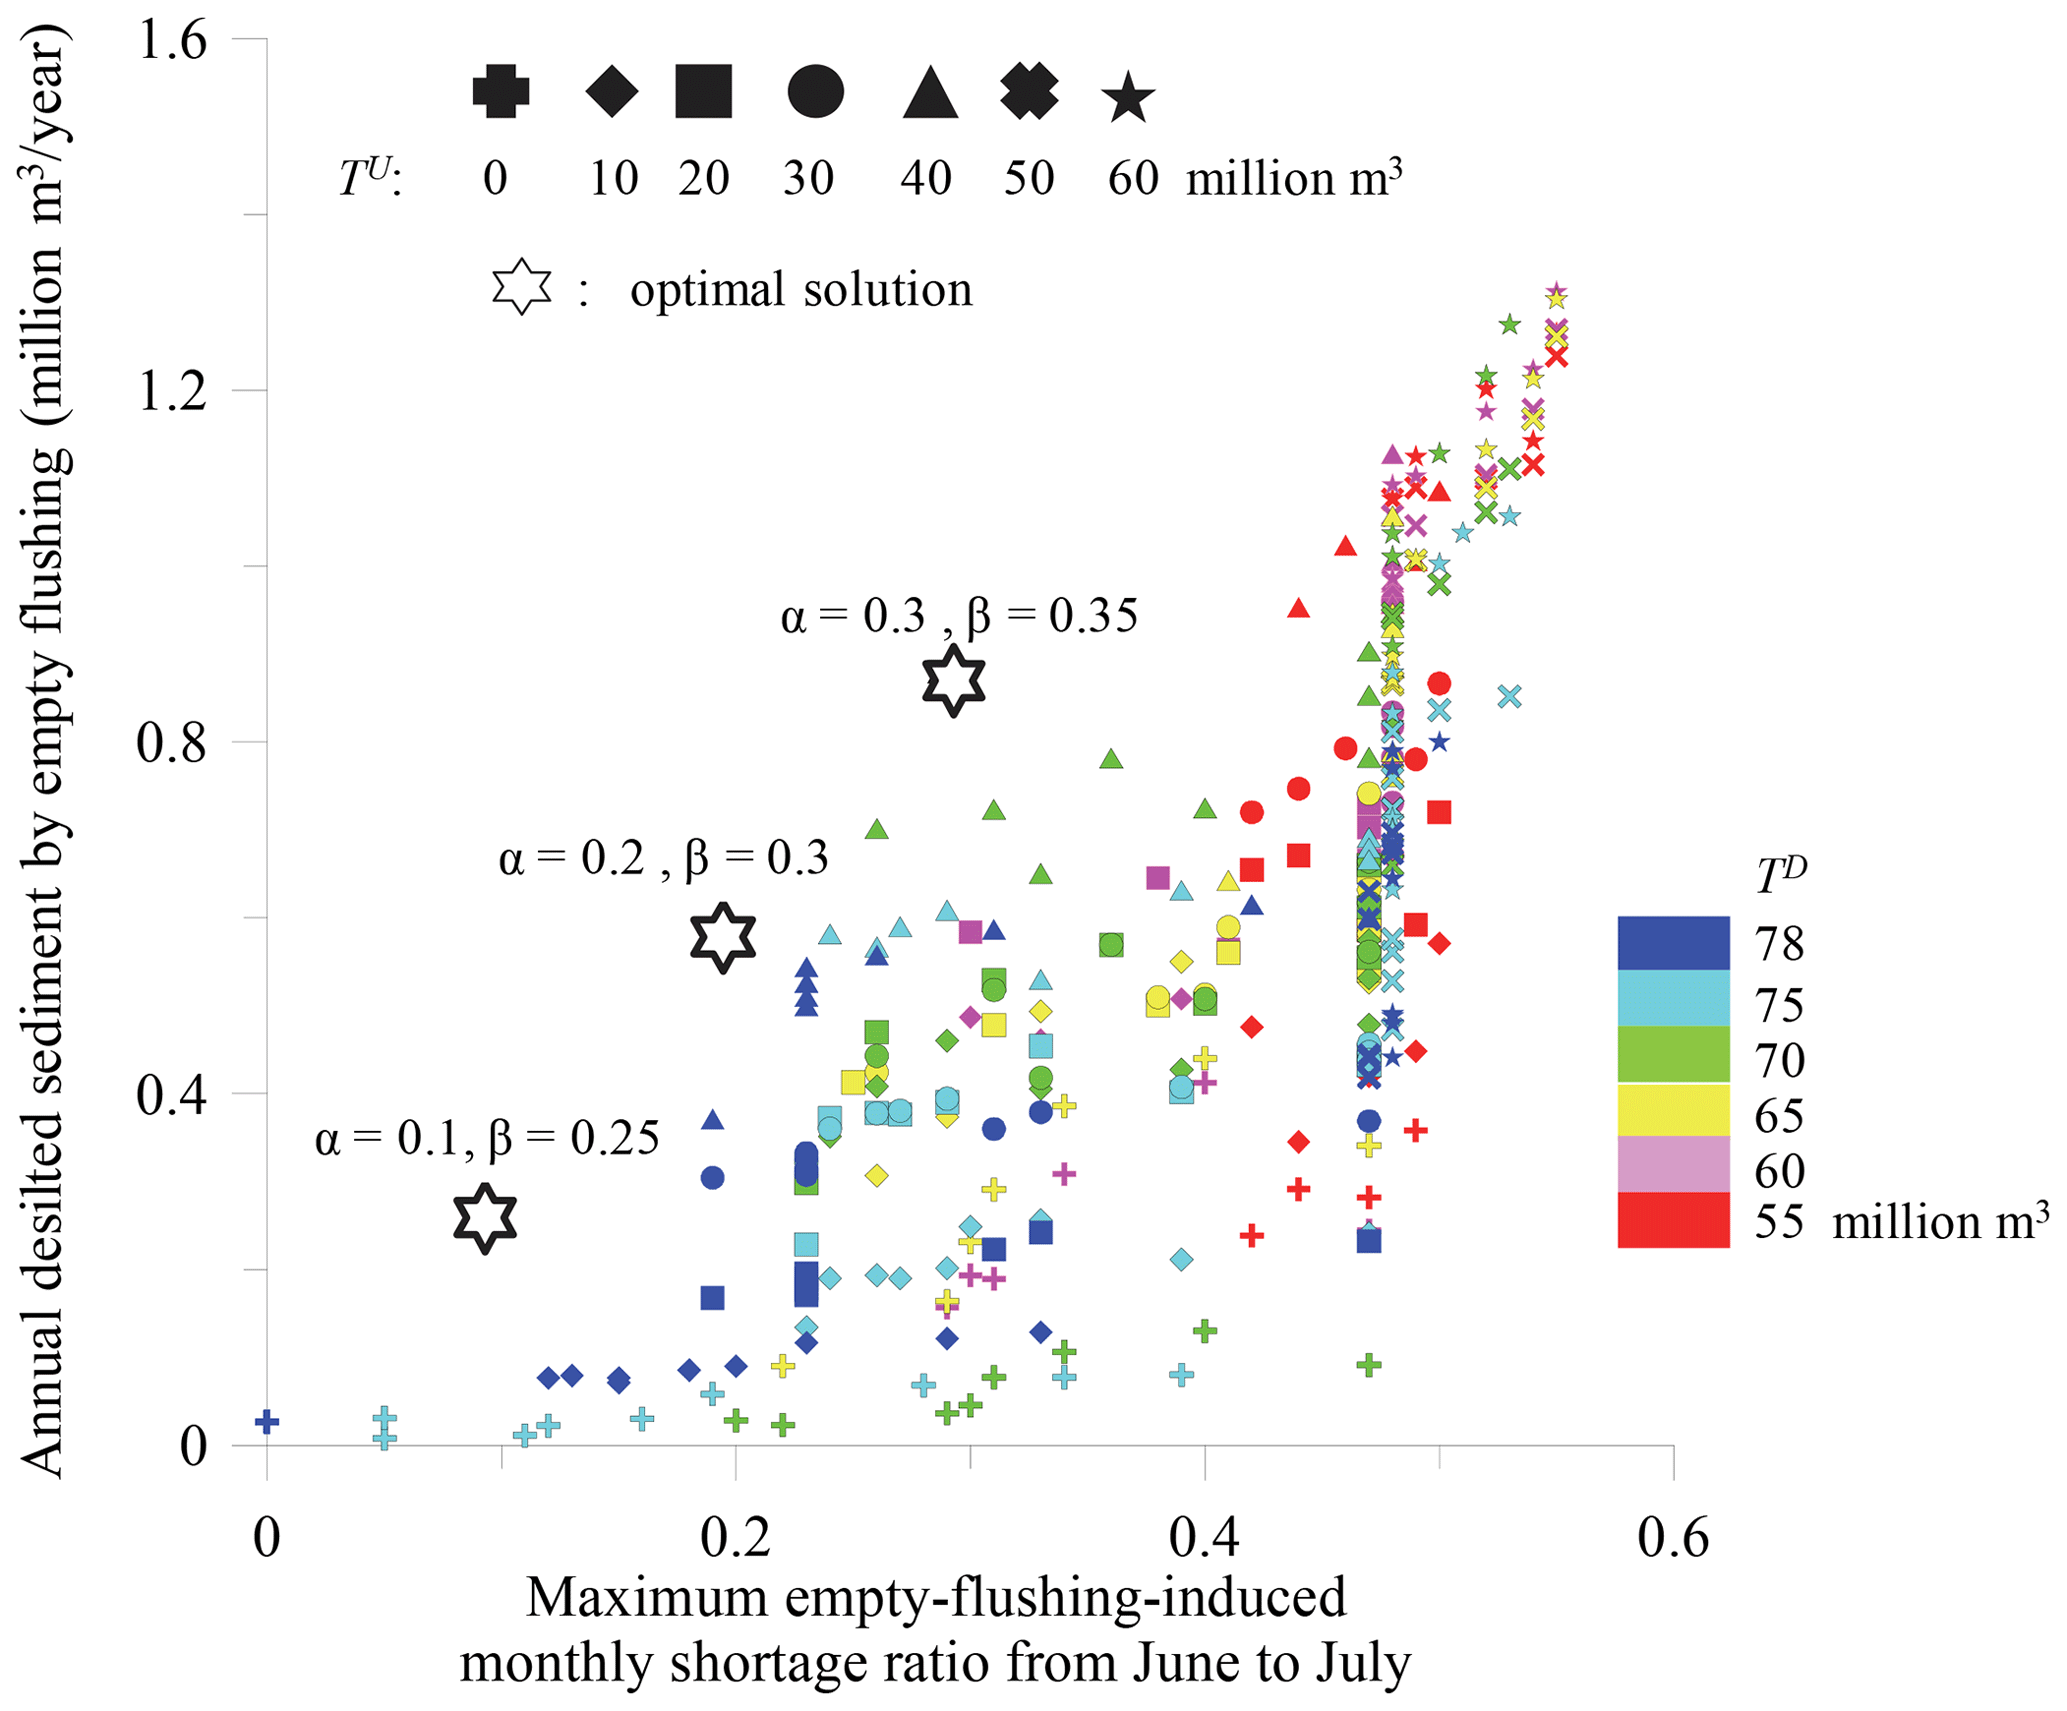
Figure 9Simulation results of various empty flushing strategies using modified storage balancing curves from April to June.
4.4 Optimization of empty flushing strategies
Coupling GWASIM which simulates the water supply and empty flushing process from 1975 to 2009 with the optimization algorithm leads to an optimal solution of Eqs. (6), (7), and (8) under specific values of α and β. Three sets of α and β are tested, which are (0.1, 0.25), (0.2, 0.30), and (0.3, 0.35). The corresponding optimized results are presented in Table 2. The average annual desilting volume and maximum monthly shortage ratio induced by empty flushing are also marked in Fig. 9. The abovementioned desilting volumes are calculated using Eq. (1) with the setting of ψ described in Sect. 3.2.3. To validate this estimation, numerical simulations of sediment flushing process by the SRH-2D model of the US Bureau of Reclamation (Lai, 2008) are carried out for the major flushing events identified in the optimal strategy associated with α=0.1 and β=0.25. The result shows great agreement between the empirical estimation and numerical simulation and is reported in Appendix A3. Sensitivity analysis of the flushing coefficient in the scenario of (α=0.1, β=0.25) is also performed to inspect its impact on the optimization. The result is presented in Appendix A4, which shows that the optimal strategy is dominated by the shortage constraints and insensitive to the value of ψ.
Table 2Optimal empty flushing strategies based on acceptable water shortage rates following the completion of empty flushing operations.
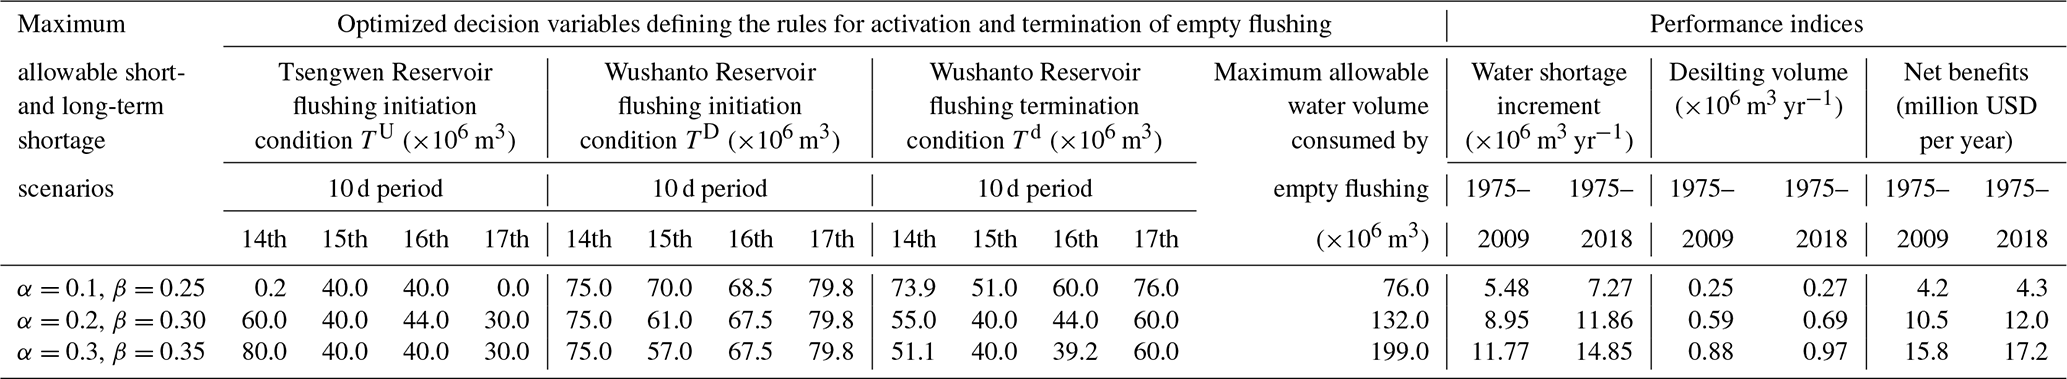
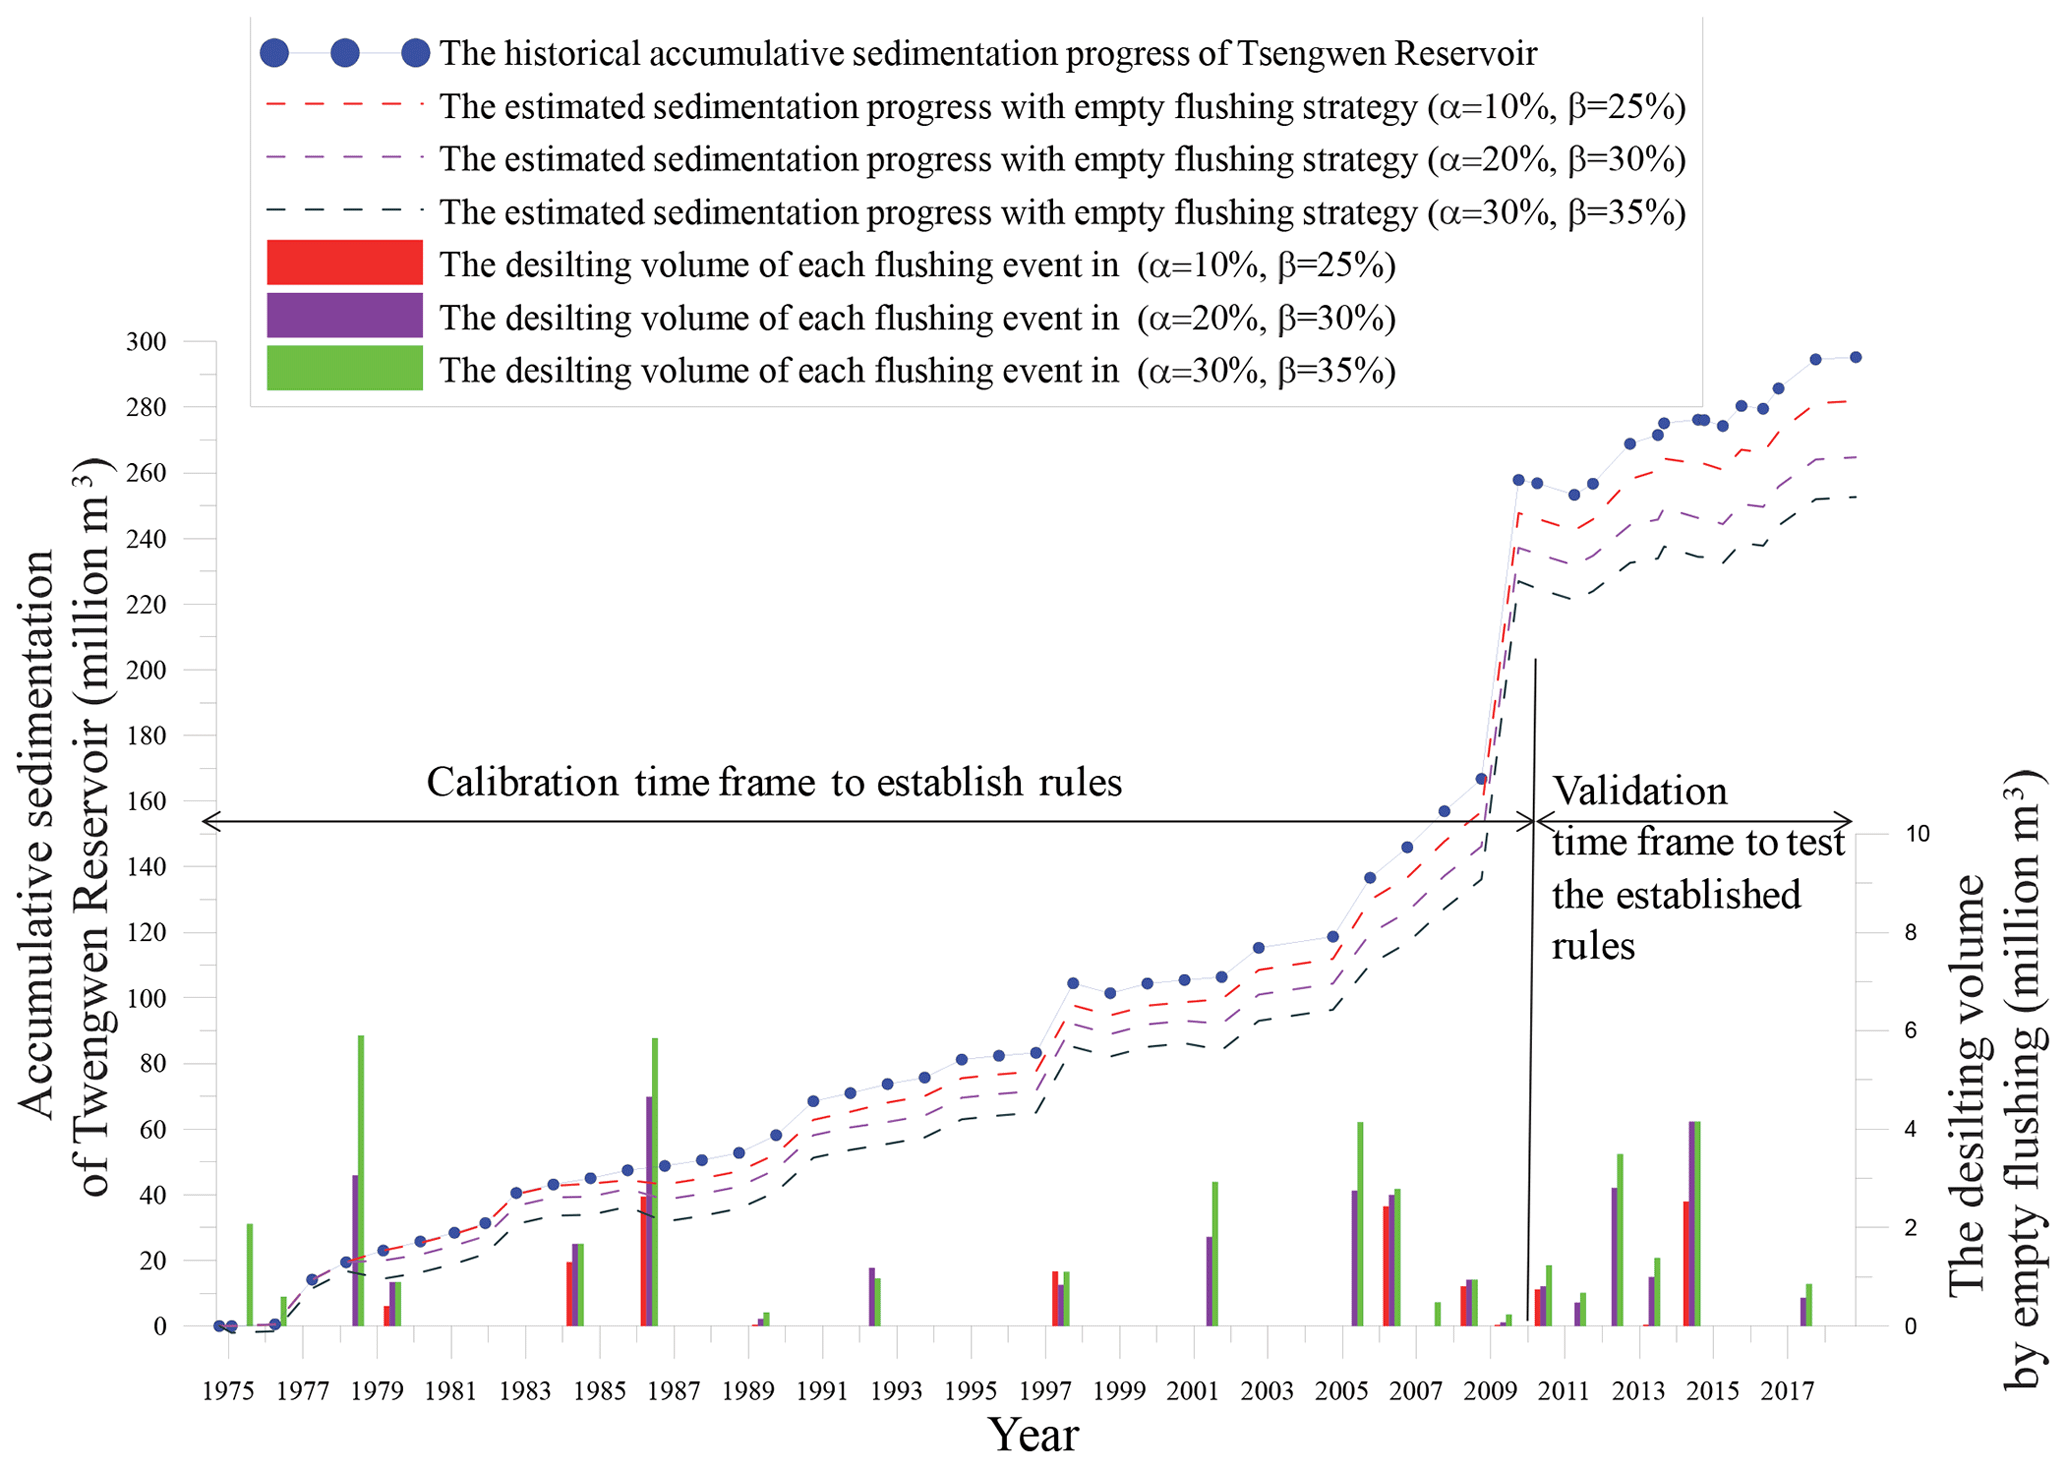
Figure 10 depicts the historical accumulative sedimentation record of Tsengwen Reservoir, as well as the updated progress by imposing the suggested empty flushing events and subtracting the generated desilting volume from the actual sedimentation. Some features can be observed as follows.
-
Typhoon Morakot in 2009 represents an outlier and boosts the average annual sedimentation and inflowing sediment by over 2×10⁶ m3 yr−1. The newly constructed DST aims for this kind of extreme flood, and it allows nearly 40 % of sediments of density current and turbid storage to pass through the reservoir along with the updated PRO. Most of the remaining detained sediments are expected to be removed by the cost-effective perennial hydrosuction. Nonetheless, its annual capacity has reached a maximum while no convenient downstream deposition area is currently available for further expansion.
-
Empty flushing serves as an alternative for more expensive or uncertain desilting measures, other than hydraulic sluicing and hydrosuction, to achieve a long-term balance between the incoming and outgoing sediment of a reservoir. The estimated net benefits by empty flushing are also included in Table 2. The referred benefit of flushing is the alternative cost by mechanical excavation as USD 20 per unit volume (m3) of sediment. The induced cost is from the water transferring fee, USD 0.15 per cubic meter of water, for compensating the agricultural purpose, and enhancing irrigation management. The results reveal the economic superiority of empty flushing over mechanical excavation, as long as it does not induce unmanageable water shortage and create additional large-scale suspensions of irrigation.
-
The hydrological characteristic of the case study system allows for empty flushing only feasible in less than 40 % of the simulating years. During the other years the reservoir storage is inadequate, i.e., either the storage of Wushanto Reservoir is lower than TD or Tsengwen Reservoir is higher than TU between 11 May to 20 June. A trend of increasing frequency of empty flushing in recent years can also be observed in the figure. This might be the result of climate change which increases the variance of flood magnitude and more frequently lead to lower but adequate reservoir storage in the end of dry season in the case study area.
-
Due to the frequency of drought and high pressure of water supply in this system, the optimal strategy associated with α=0.1 and β=0.25 is selected for further scrutiny. Table 3 displays the simulated events of empty flushing based on this calibrated strategy.
Table 3Simulated empty flushing events based on the optimal strategy with α=0.1 and β=0.25.
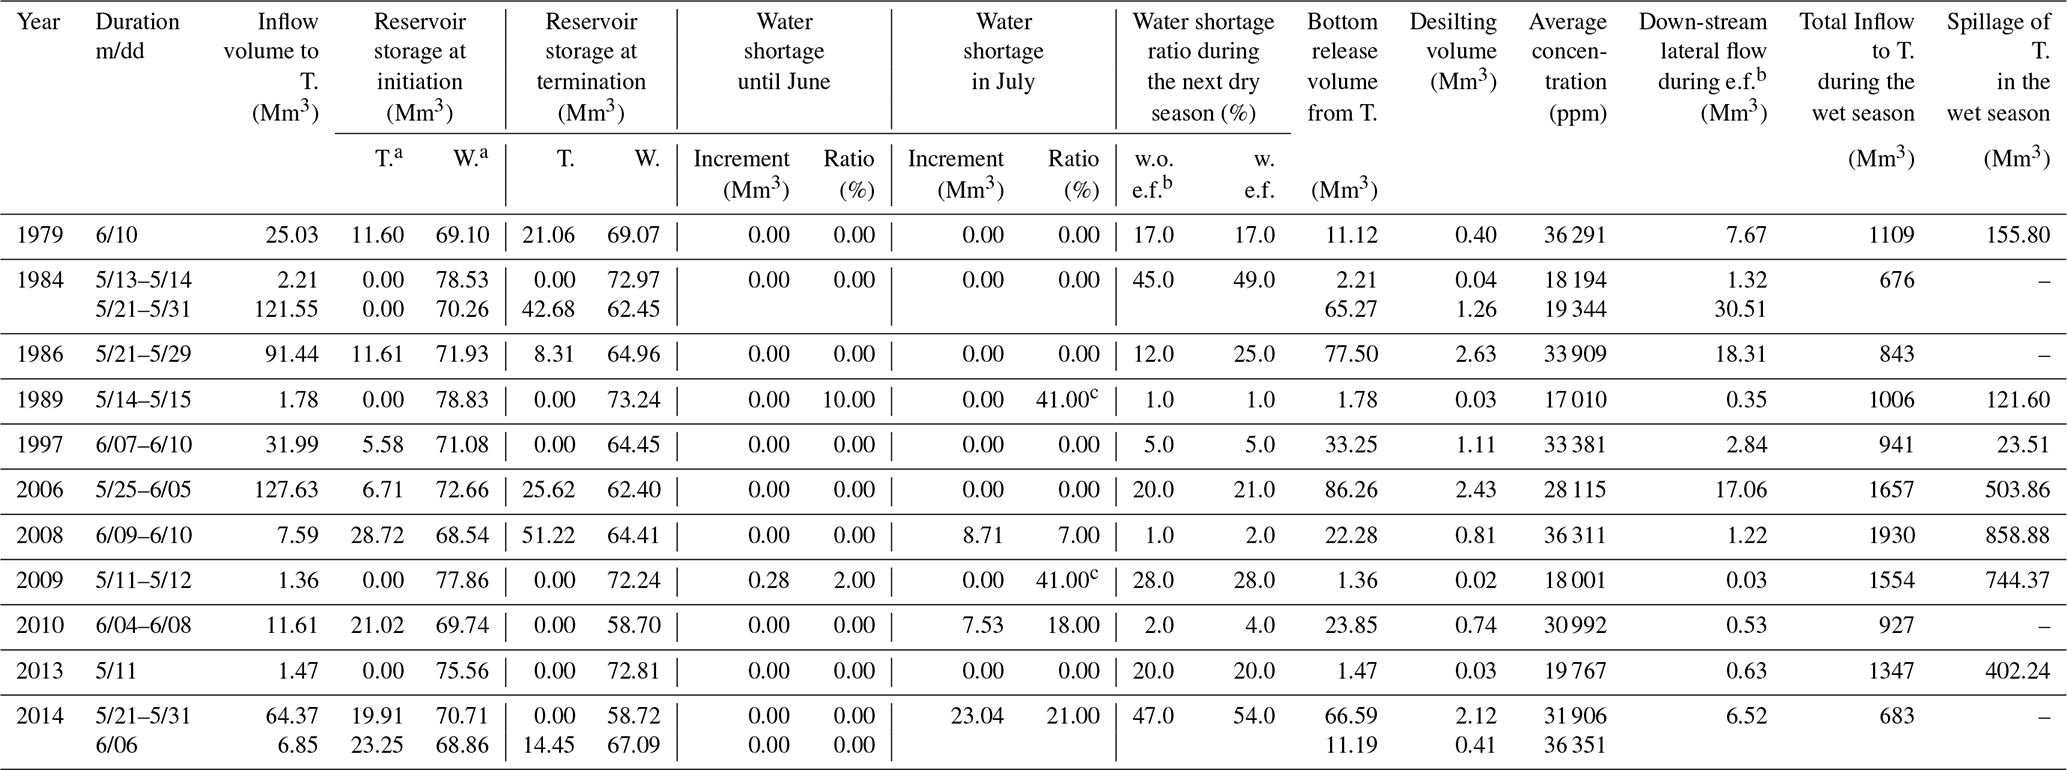
a T. and W. represent Tsengwen and Wushanto reservoirs, respectively.
b e.f. is the abbreviation of empty flushing.
c The monthly shortage ratio in July following the empty flushing
operations in 1989 and 2009 both reach 0.41. However, the corresponding
shortage increments are both 0; therefore, they did not violate the
constraints of Eqs. (7) and
(8). For these events, the Tsengwen Reservoir
is nearly empty and the Wushanto Reservoir is nearly full before the
initiation of empty flushing operations. Thus, the empty flushing operations
only consume the inflow of Tsengwen
Reservoir during a 2 d period. These
water consumption volumes are too insignificant to induce the subsequent
water shortage seen in July. The primary reason for the subsequent shortage
is the delayed arrival of the first typhoon in
late July or early August, by
which time the total storage falls below the critical limit of the joint
operating rule curves and water rationing is applied. Following the arrival
of the typhoons, however, the total reservoir storage exceeds
the lower
limit and even the upper limit of rule curves, thereby alleviating the water
shortage.
4.5 Validation of the optimal strategies
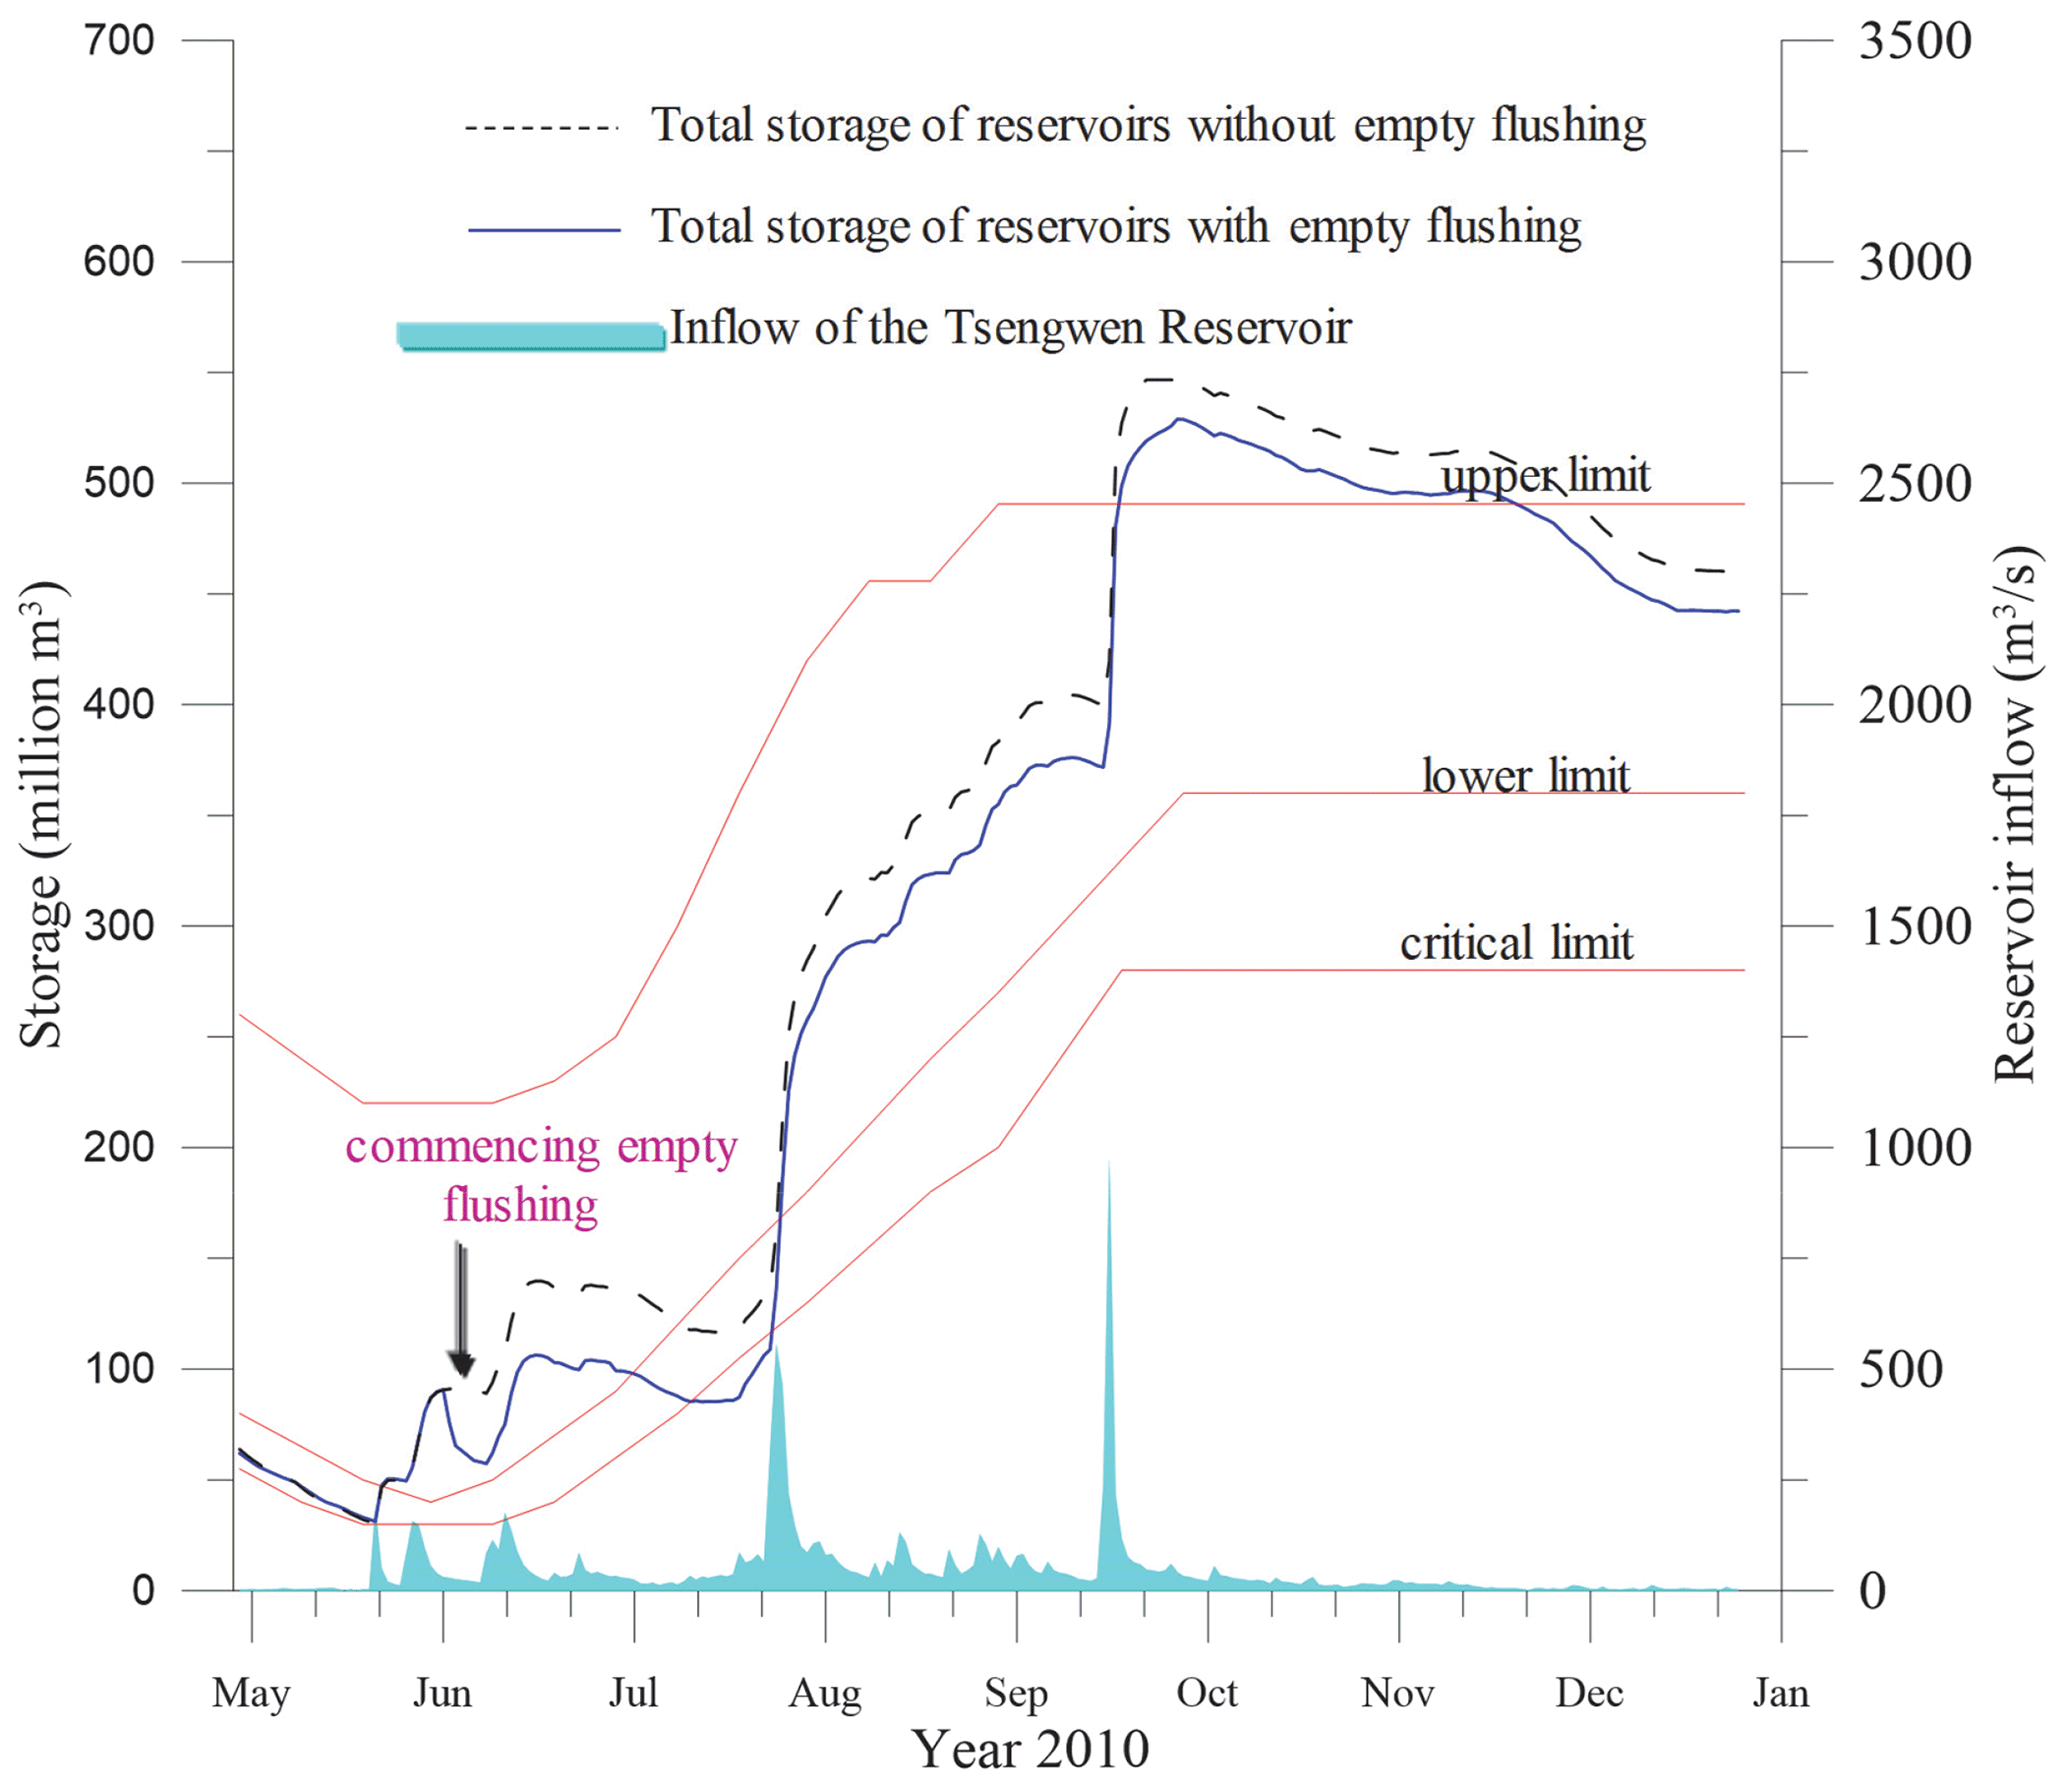
The optimal strategies in Table 2 are derived according to the records of daily reservoir inflow between 1975 and 2009. In other words, their average performances regarding Eqs. (6), (7), and (8) are boosted and customized against the hydrological conditions during this calibration time period. Following which, the records through the end of 2018 are used to verify the effectiveness of the established strategy. The validation tests the strategy with inflow series outside of the calibration time frame to check its validity for general conditions. The results indicate that four additional flushing operations could have been conducted, two of which occur in 2010 and 2013 and the others in 2014. The last four rows in Table 3 summarize these events. In addition to the case of 2013 which imposes no impact on water supply, the empty flushing operations in the other years are depicted in Figs. 11 and 12 and discussed below.
-
Following the empty flushing in early June of 2010, the monthly water shortage ratio during July is 0.18, which is higher than the 0.12 that would have been the case without empty flushing. The increased shortage ratio is induced by drawdown and empty flushing, which causes the total storage to fall below the critical limit of rule curve earlier in July. Empty flushing thus necessitates a slightly longer water rationing period. Nonetheless, torrential rains in late July elevate the storage to exceed the lower limit, thereby resolving the shortage crisis. The major impact of water shortage during this period is on the second semiannual irrigation operation, which requires large quantities of water during July. One of the adopted mitigation measures is to postpone the beginning of irrigation schedule no later than 10 August. For example, in June of 2004, the total storage in the two reservoirs fell below the critical limit, which delayed the second semiannual irrigation from the originally planned 6 June to 17 July when Typhoon Mindulle invaded and elevated the storage above the upper limit in one single day of early July.
-
In 2014, over 40 % of the wet season inflow of Tsengwen Reservoir occurred in May and June, which means the front-induced inflow in the early flood season is abundant, and only one typhoon invaded Taiwan for the remaining 5 months. The unexpected lack of subsequent floods leads to partial recovery of reservoir storage. The impact is alleviated through water rationing during the wet season to allow for carrying out the second semiannual irrigation. For the following, drought occurred in the dry season in 2015, and it inevitably leads to large-scale suspension of the first semiannual irrigation to reduce the agricultural demand to nearly 0, whether empty flushing in the previous year is performed or not. With or without empty flushing, the water originally supplied to the first semiannual irrigation, the volume of which ranges between 0.2×10⁹ and 0.3×10⁹ m3, will be kept to secure public water supply. The annual demand of public and industrial purposes of this system is only 0.147×10⁹ m3, and every empty flushing practice consumes a water volume of no more than 0.09×10⁹ m3 according to Table 3. The demand magnitude and water transfer mechanism guarantee that the risk of increased shortage induced by empty flushing for this particular situation will be completely offset in reality.
In addition to induce incremental water shortage, potential adverse impacts on the downstream environment may appear due to flushing. They originate from the high sediment concentration of flushing release in the absence of a simultaneous downstream flood, which may significantly reduce dissolved oxygen in the river, smother stream benthos, and clog gravels, thus endangering spawn sites and habitat, impairing river functions such as flood conveyance, navigation, or recreation, etc. (Morris, 2014). Some measures to minimize these impacts by carefully determining the timing, duration, and frequency of flushing and controlling the releasing discharge and concentration can be found in Morris (2014), Moridi and Yazdi (2017), Espa et al. (2019), and Cattanéo et al. (2021).
The theme of this paper, to secure water supply while enhancing desilting, acts similarly as mitigating environmental impacts, since they both need to restrain the effectiveness of empty flushing. The conjunctions include the following:
-
Meeting WS1F and FS1Q suggests that the flushing periods coincide with the first flood of wet season, while subsequent typhoon-induced floods satisfy WS2A. These conditions prompt adequate water during and following flushing for dilution and transportation of sediments downstream.
-
The second termination condition in Sect. 3.2.4 allows for empty flushing until the inflow recedes below the capacity of PRO. The release during the recession limb of flood inflow with lower concentration and higher WSL of reservoir partially offsets the impact immediately following the empty flushing.
-
The strict requirement on the stability of water supply leads to a higher Td for the third termination condition, which is the threshold backup storage to stop an empty flushing operation. In the absence of a flood, this induces an earlier termination and increases the opportunities for re-activation of another flushing operation. This results in more frequent flushing with shorter duration, which is considered more favorable to mitigate downstream impacts (Morris, 2014; Sumi and Kantoush, 2010; Crosa et al., 2010).
Some characteristics of the case study area to temper the impact on environment include the following:
-
The capacity of PRO of the Tsengwen Reservoir when the storage is nearly empty is around 130 m3 s−1. This flushing discharge is relatively insignificant compared to the magnitudes of spillway releases and downstream lateral flow during a moderate flood.
-
The downstream major benthos species of interest is Sinogastromyzon nantaiensis (Chen et al., 2002), with spawning season from June to September and habitation site within the first downstream reach from the Tsengwen Dam. The empty flushing is limited before mid-June to minimize the concurrence periods of the spawning season. The river reach has a moderate slope of 0.0036 and short distance of 20.5 km. These prompt transportation of sediments by the typhoon-induced reservoir spillage.
-
The spillway release during typhoon is expected to flush out the artificially deposited sediments as well as the soil dikes in the downstream river reach to allow for continuation of hydrosuction. The required volume from the reservoir release to vacate downstream depositions and soil dikes is estimated at 40×106 m3 (900 m3 s−1 times 12 h) based on field experience. It is expected that the sediments from empty flushing can be partially detained in the depositing area and then carried downstream along with the dredging depositions by the subsequent reservoir spillage. The impact by empty flushing is thus limited within the already existed deposition area.
-
From Table 3, either the bottom release during empty flushing or the spillage during the rest of the year in almost every identified event exceeds 40×106 m3 to effectively transport downstream depositions. The only two exceptions are the events of 1997 and 2010. To manage these years, the reservoir may need to deliberately release water before the end of the wet season to vacate downstream depositions. This will increase the shortage situation in the dry season of next year by 40×106 m3, which is about 10 % of the first semiannual irrigation demand. For these 2 years, this shortage increment can still be managed by regular water saving measures without inducing suspension of irrigation.
Some suggestions for future extension of the current study are provided below:
-
To incorporate short-term forecasting of reservoir inflow in determining the activation or termination of an empty flushing operation. If the forecast is reliable, a certain amount of storage can be kept in the primary reservoir and pre-emptied shortly before an expected flood. The forecast uncertainty should be incorporated to avoid inducing intolerable water shortage in case the flood does not occur after emptying the reservoir.
-
To test the established rules with synthetically generated hydrological series containing more years with unexpected lacks of floods. This would allow for a more comprehensive evaluation of the potential risk of water shortage especially under the impact of climate change. To facilitate this extension, the correlation across daily inflows of different sites in a multi-reservoir system should be properly modeled to correctly represent the temporal and spatial stochastic hydrological nature.
-
The case study specifically discusses a system with an upstream online reservoir requiring empty flushing and a downstream offline reservoir which provides backup water supply. Implementations for other systems with different schematics may require more complex optimization formulations with additional parameters. For example, if an additional reservoir is available upstream from the primary reservoir, its storage could serve to generate artificial flushing discharge. The flushing operation may start from emptying the downstream reservoir and then drawing down the storage of the upstream reservoir and allowing the drawdown release to scour and pass through the downstream reservoir. The timing to start and terminate the joint flushing operation may be guided by the joint operating rule curves. The joint rule curves can also be included as parameters to be optimized to promote the performance of empty flushing without inducing significant water shortage. A similar study can be found in Chou and Wu (2017).
-
Numerical modeling may be directly integrated into the optimization framework for a more accurate estimation of the desilting volume. The transportation of flushed sediments in the downstream river could also be simulated to more comprehensively evaluate of the impacts of empty flushing on environment and incorporate the threshold of releasing concentration as constraints to the optimization problem.
This study optimizes the performance of empty flushing of one primary reservoir within a multi-reservoir system. Prior to empty flushing, the total available storage in a system is allocated from the primary reservoir to the other to create favorable initial conditions and prepare backup water to be supplied during empty flushing. The activation and termination conditions of an empty flushing operation are determined according to whether storage in the primary and auxiliary reservoirs satisfies applicable thresholds. Optimization analysis calibrates these storage thresholds to maximize the desilting volume without inducing intolerable water shortage. The case study of the water resources system of the Tsengwen and Wushanto reservoirs of southern Taiwan verifies the effectiveness of the derived optimal strategy.
Integrating reservoir desilting considerations with water supply operation creates more facets into the multi-objective water resources management. In addition to irrigation, municipal, industrial, and hydropower purposes, the competition of water extends to include sediment flushing, sluicing, vacating previously dredged and deposited sediments, and alleviating their impacts on the downstream environment. The high risk of water shortage in the case study area currently dictates the operating objective to solely focus on reliable water supply. This restricts the feasibility of not only empty flushing but also any other operations that may cause additional consumption of reservoir storage, and this leads to great reliance on hydrosuction to reservoir desilting, degradation of downstream environment, and inefficient utilization of water resources. This paper elaborately creates an opportune chance for potential empty flushing under such a high pressure of water supply. If this pressure can be somehow relieved, the practical benefits of the proposed method could be more evident, since all the problems stem from the same core: insufficiency of available water with acceptable quality for all purposes. While the operators are forced to myopically prevent the imminent water shortage risks, reservoir sedimentation also imposes an equivalent and long-term threat to the degeneration of water supply yield. The urgent needs of both desilting and water supply may also endow a new role to the conventional projects of water resources development. In addition to elevating the yield of water supply, it may exploit more water to allow for recovery and enhanced desilting of existing reservoirs, thus allowing the entire system to advance toward the goal of sustainability.
A1 Cases of reservoirs adopting empty flushing in the world
Table A1Cases of empty flushing (HP: hydropower generation, FC: flood control, IR: irrigation, ID: industrial water supply, S: single reservoir system, and M: multi-reservoir system).

A2 Cases of other reservoirs adopting empty flushing in southern Taiwan
Exact data from flushing in Tsengwen Reservoir does not exist since the reservoir has never been gone through such operations. The operators have constantly maintained the reservoir at high WSL to ensure stable water supply. The only experience for the reservoir drawing nearly to empty was in the beginning of wet seasons in 2004 before the Typhoon Mindulle invaded, during which the reservoir did not release water at all. Figure A1 includes the data of the reservoir WSL, inflowing discharge, and measured sediment concentration in front of the dam in a few hours of the rising periods of Typhoon Mindulle flood, during which the WSL had yet been raised beyond 190 m a.s.l.. It shows the corresponding value of ψ ranges from 20 to 160, surrounding the value of 60 suggested by Atkinson (1996) for cases with limited-capacity bottom outlets. To prevent overestimating the effectiveness of empty flushing, it is assumed that if a flood raises the WSL of the Tsengwen Reservoir to exceed 185 m a.s.l., then the flushed sediment volume from the PRO is set to be 0; otherwise ψ is set to 60.
It should be noted that similar setting of ψ has been applied and validated in other reservoirs in adjacent basins of southern Taiwan (Southern Regional Water Resources Office, 2015). One of which is the Akungten reservoir, which annually undergoes empty flushing between 1 May to 10 September. The estimated volumes of flushed sediments during several floods appears to be in the same order to the measurements as shown by Table A2. Substituting the above setting of ψ and a full-capacity discharge of PRO of Tsengwen Reservoir into Eq. (1) will lead to a volumetric sediment concentration as 39 928 ppm. Another adjacent Jensanpei Reservoir in southern Taiwan recorded the volumetric sediment concentration from its historical empty flushing operations ranging between 54 014 to 446 182 ppm, and averaged at 105 478 ppm (Water Resources Planning Institute, 2010). This shows the conservativeness of the adopted setting of ψ in the current study.
A3 Numerical simulation of the empty flushing process
Flow in reservoir during empty flushing is relatively shallow and the effect of vertical motions is negligible. The 3D Navier–Stokes equations coupled with sediment transport formulas may be vertically averaged to obtain a set of depth averaged 2D equations. A numerical model solving these equations, SRH-2D, is applied to validate the releasing sediment discharge under the condition of empty flushing. An extensive list of SRH-2D calibrations, verifications, and applications had been carried out (Lai, 2008, 2010). The model can be downloaded from the website of the US Bureau of Reclamation.
The flushing events in 1984, 1986, 1997, and 2006 listed in Table 3 are selected for numerical investigation. The Dirichlet boundary conditions are given at upstream and downstream simulation grids. Sediment transport equation of Engelund and Hansen (1967) is adopted to simulate sediment discharge. The particle size of sediment deposited on the reservoir bottom is given from field survey. Figure A2a shows the simulated bottom variation of the event in 2006. It shows that the erosion mechanism dominates the reservoir bed changing due to low water level. A flushing channel is created from the inlet of sluiceway toward the midstream of the reservoir. The flushing process, including discharges of reservoir inflow and release, storage, sediment concentration of release, and accumulative desilting volume during this event is also depicted in Fig. A2b. The entire process consists of two stages of drawdown, empty, and refill phases regarding reservoir storage. The release concentration peaks around 50 000 mg L−1 while the reservoir is empty and the flushing channel is formed. The release with lower concentration during the two refill phases also facilitates alleviating the impacts on downstream environment. Figure A2c reveals that the simulated desilting volumes by SRH-2D agree well with the estimated values from Eq. (1). This validates the acceptability of the adopted empirical formula.
A4 Sensitivity analysis of the flushing coefficient in the optimal scenario
The major uncertainty of the proposed method is the use of the empirical formula Eq. (1) to estimate the volume of flushed sediments. Due to the lack of field data, the flushing coefficient ψ is directly assigned as 60, a most common and conservative value found in literatures (Atkinson, 1996). To investigate how this uncertainty affects the optimization procedure, sensitivity analysis is performed by applying another two values of ψ as 180 and 300, which are originated from IRTCES (1985). It turns out that the recalibrated parameters by different values of ψ remain unchanged. To demonstrate this characteristic, sensitivity simulation trials are run by expanding the storage thresholds to activate flushing, TU and TD, of the 15th 10 d from the optimal solution, with a discrete interval of 1 ×10⁶ m3. Figure A3 depicts the contour maps of desilting volume and maximum monthly shortage ratio induced by empty flushing with axis as TU and TD for different values of ψ. It reveals that using a different ψ value only leads to a linearly varied value of the objective function, while the optimal solution is dictated by the water shortage constraint and free of ψ. This validates the ability of the proposed approach to produce strategies which maximize the potential desilting performance under acceptable water shortage scenarios.
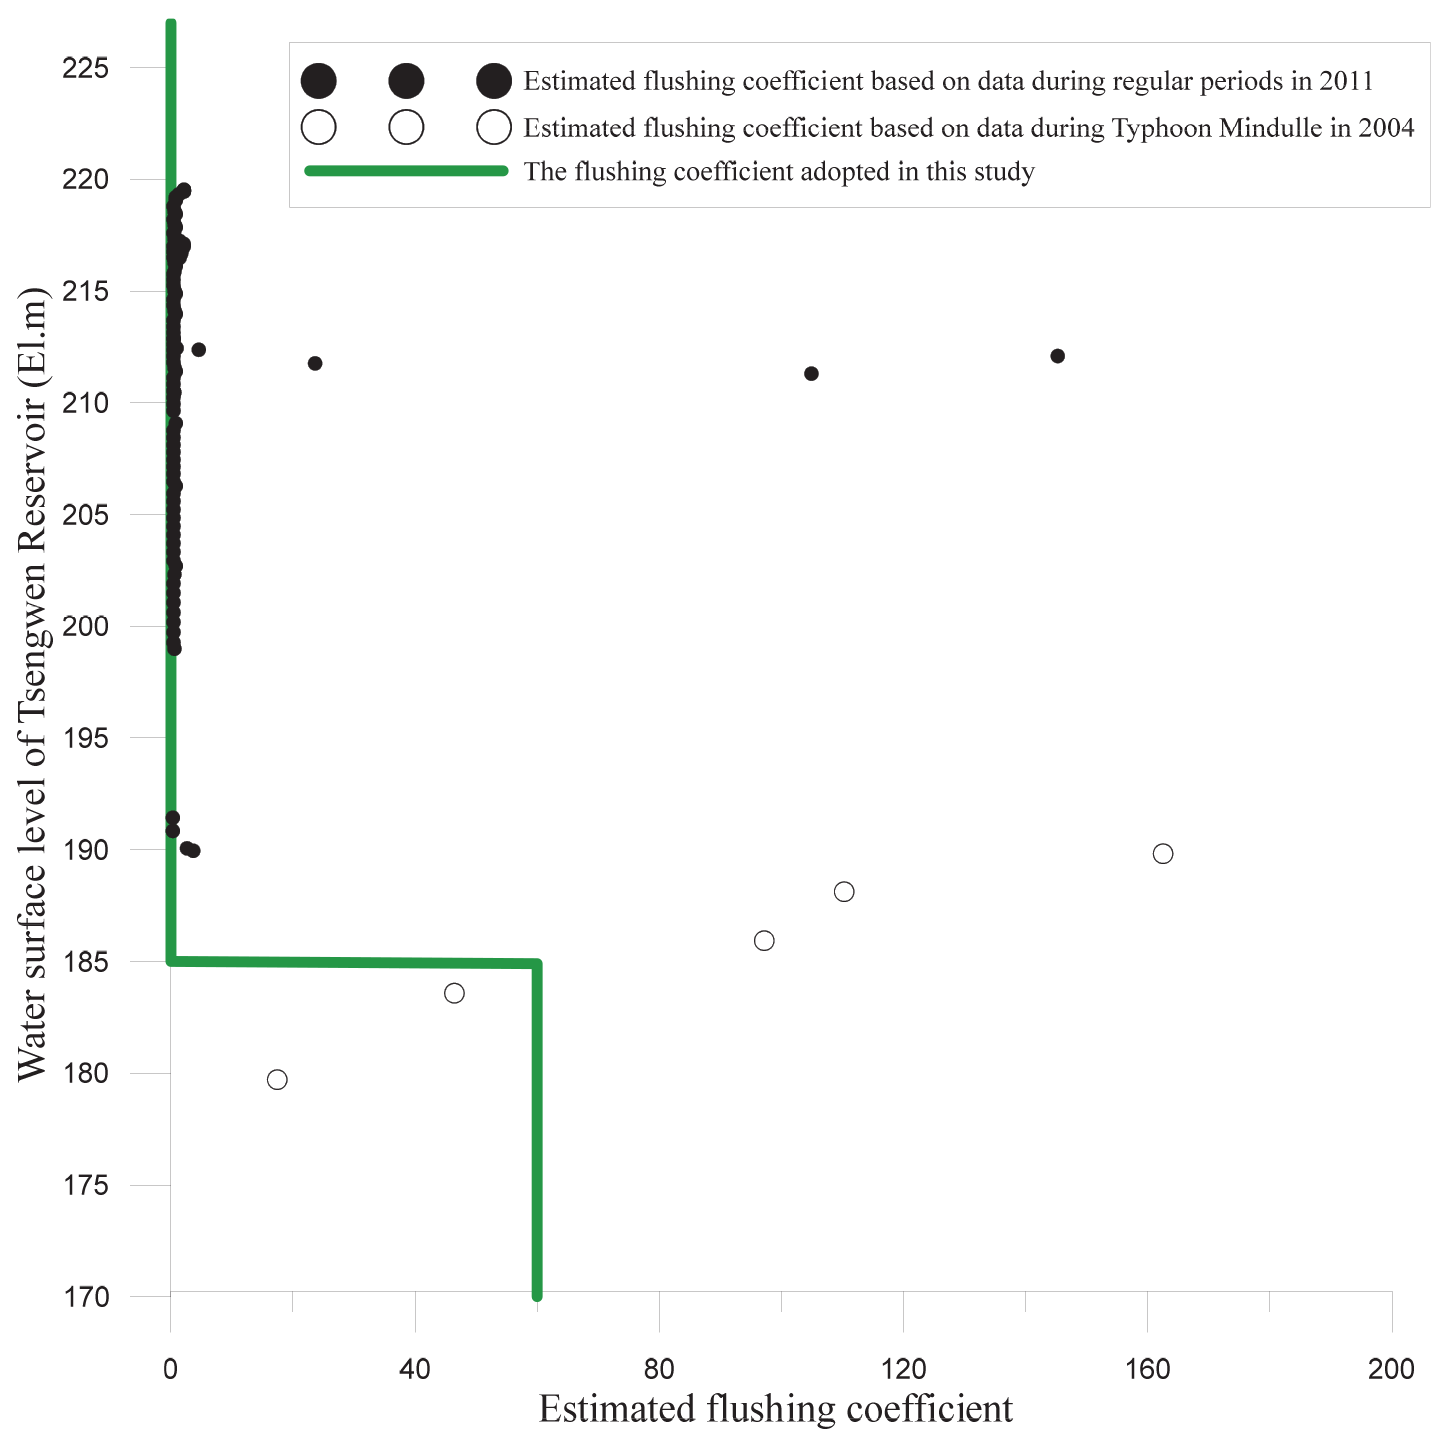
Table A2The operating records of Akungten Reservoir during its empty flushing periods (Southern Regional Water Resources Office, 2015).
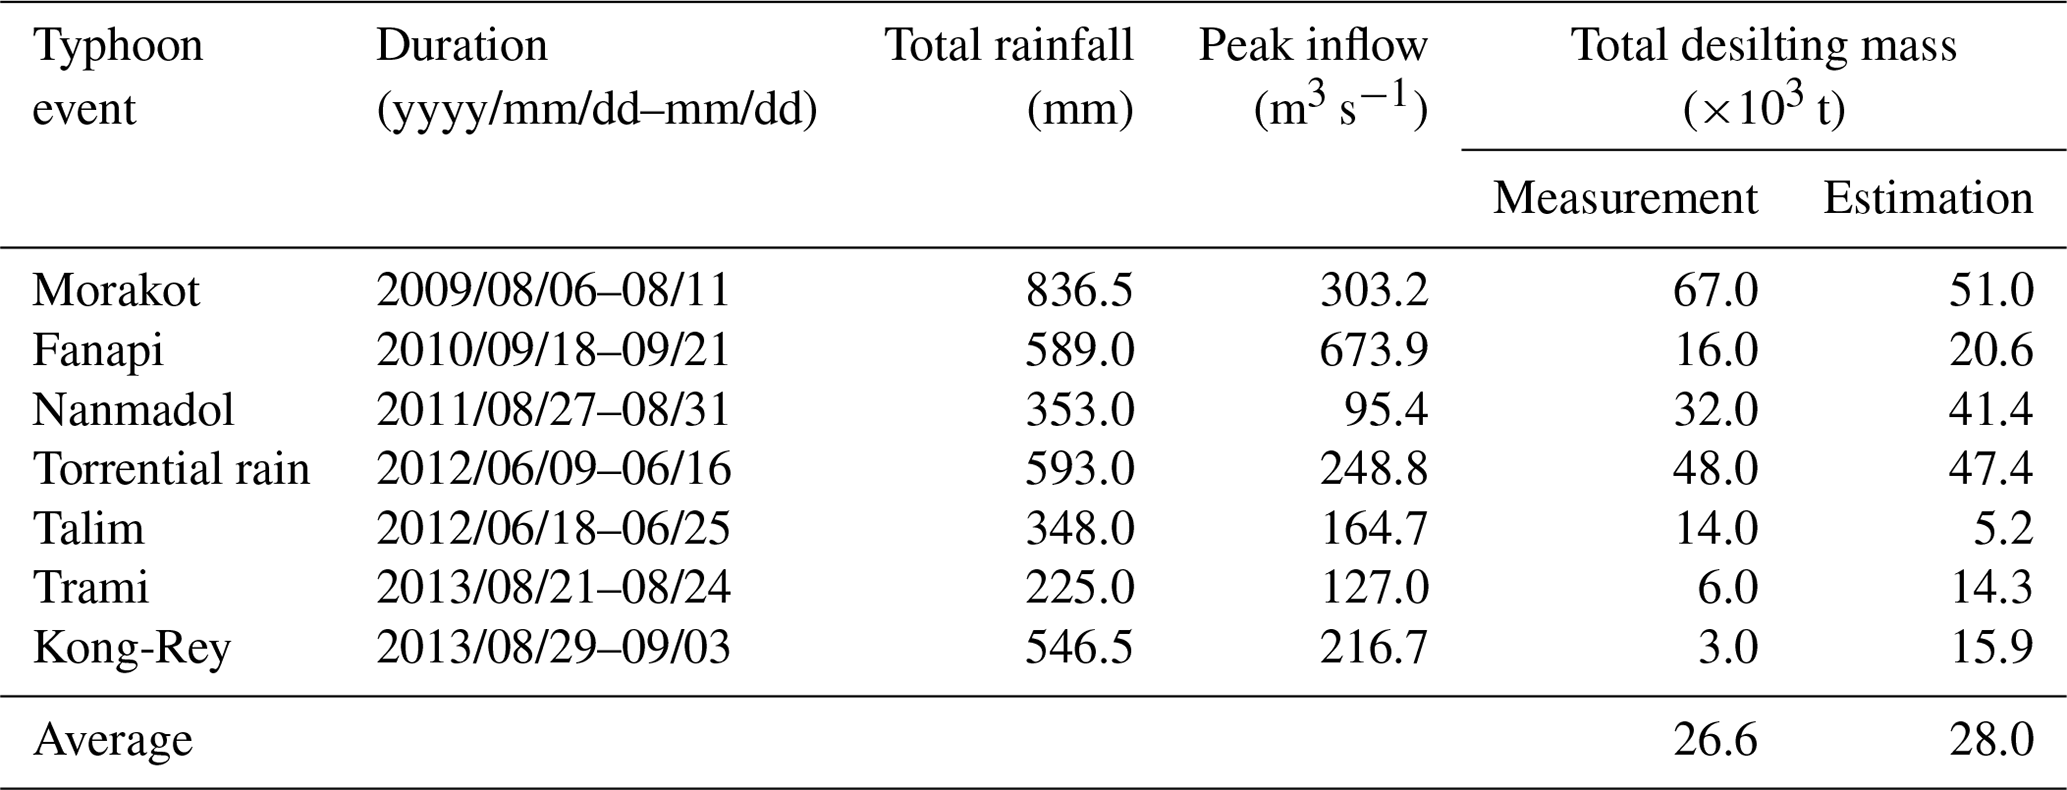

Figure A2Simulation results of the SRH-2D.
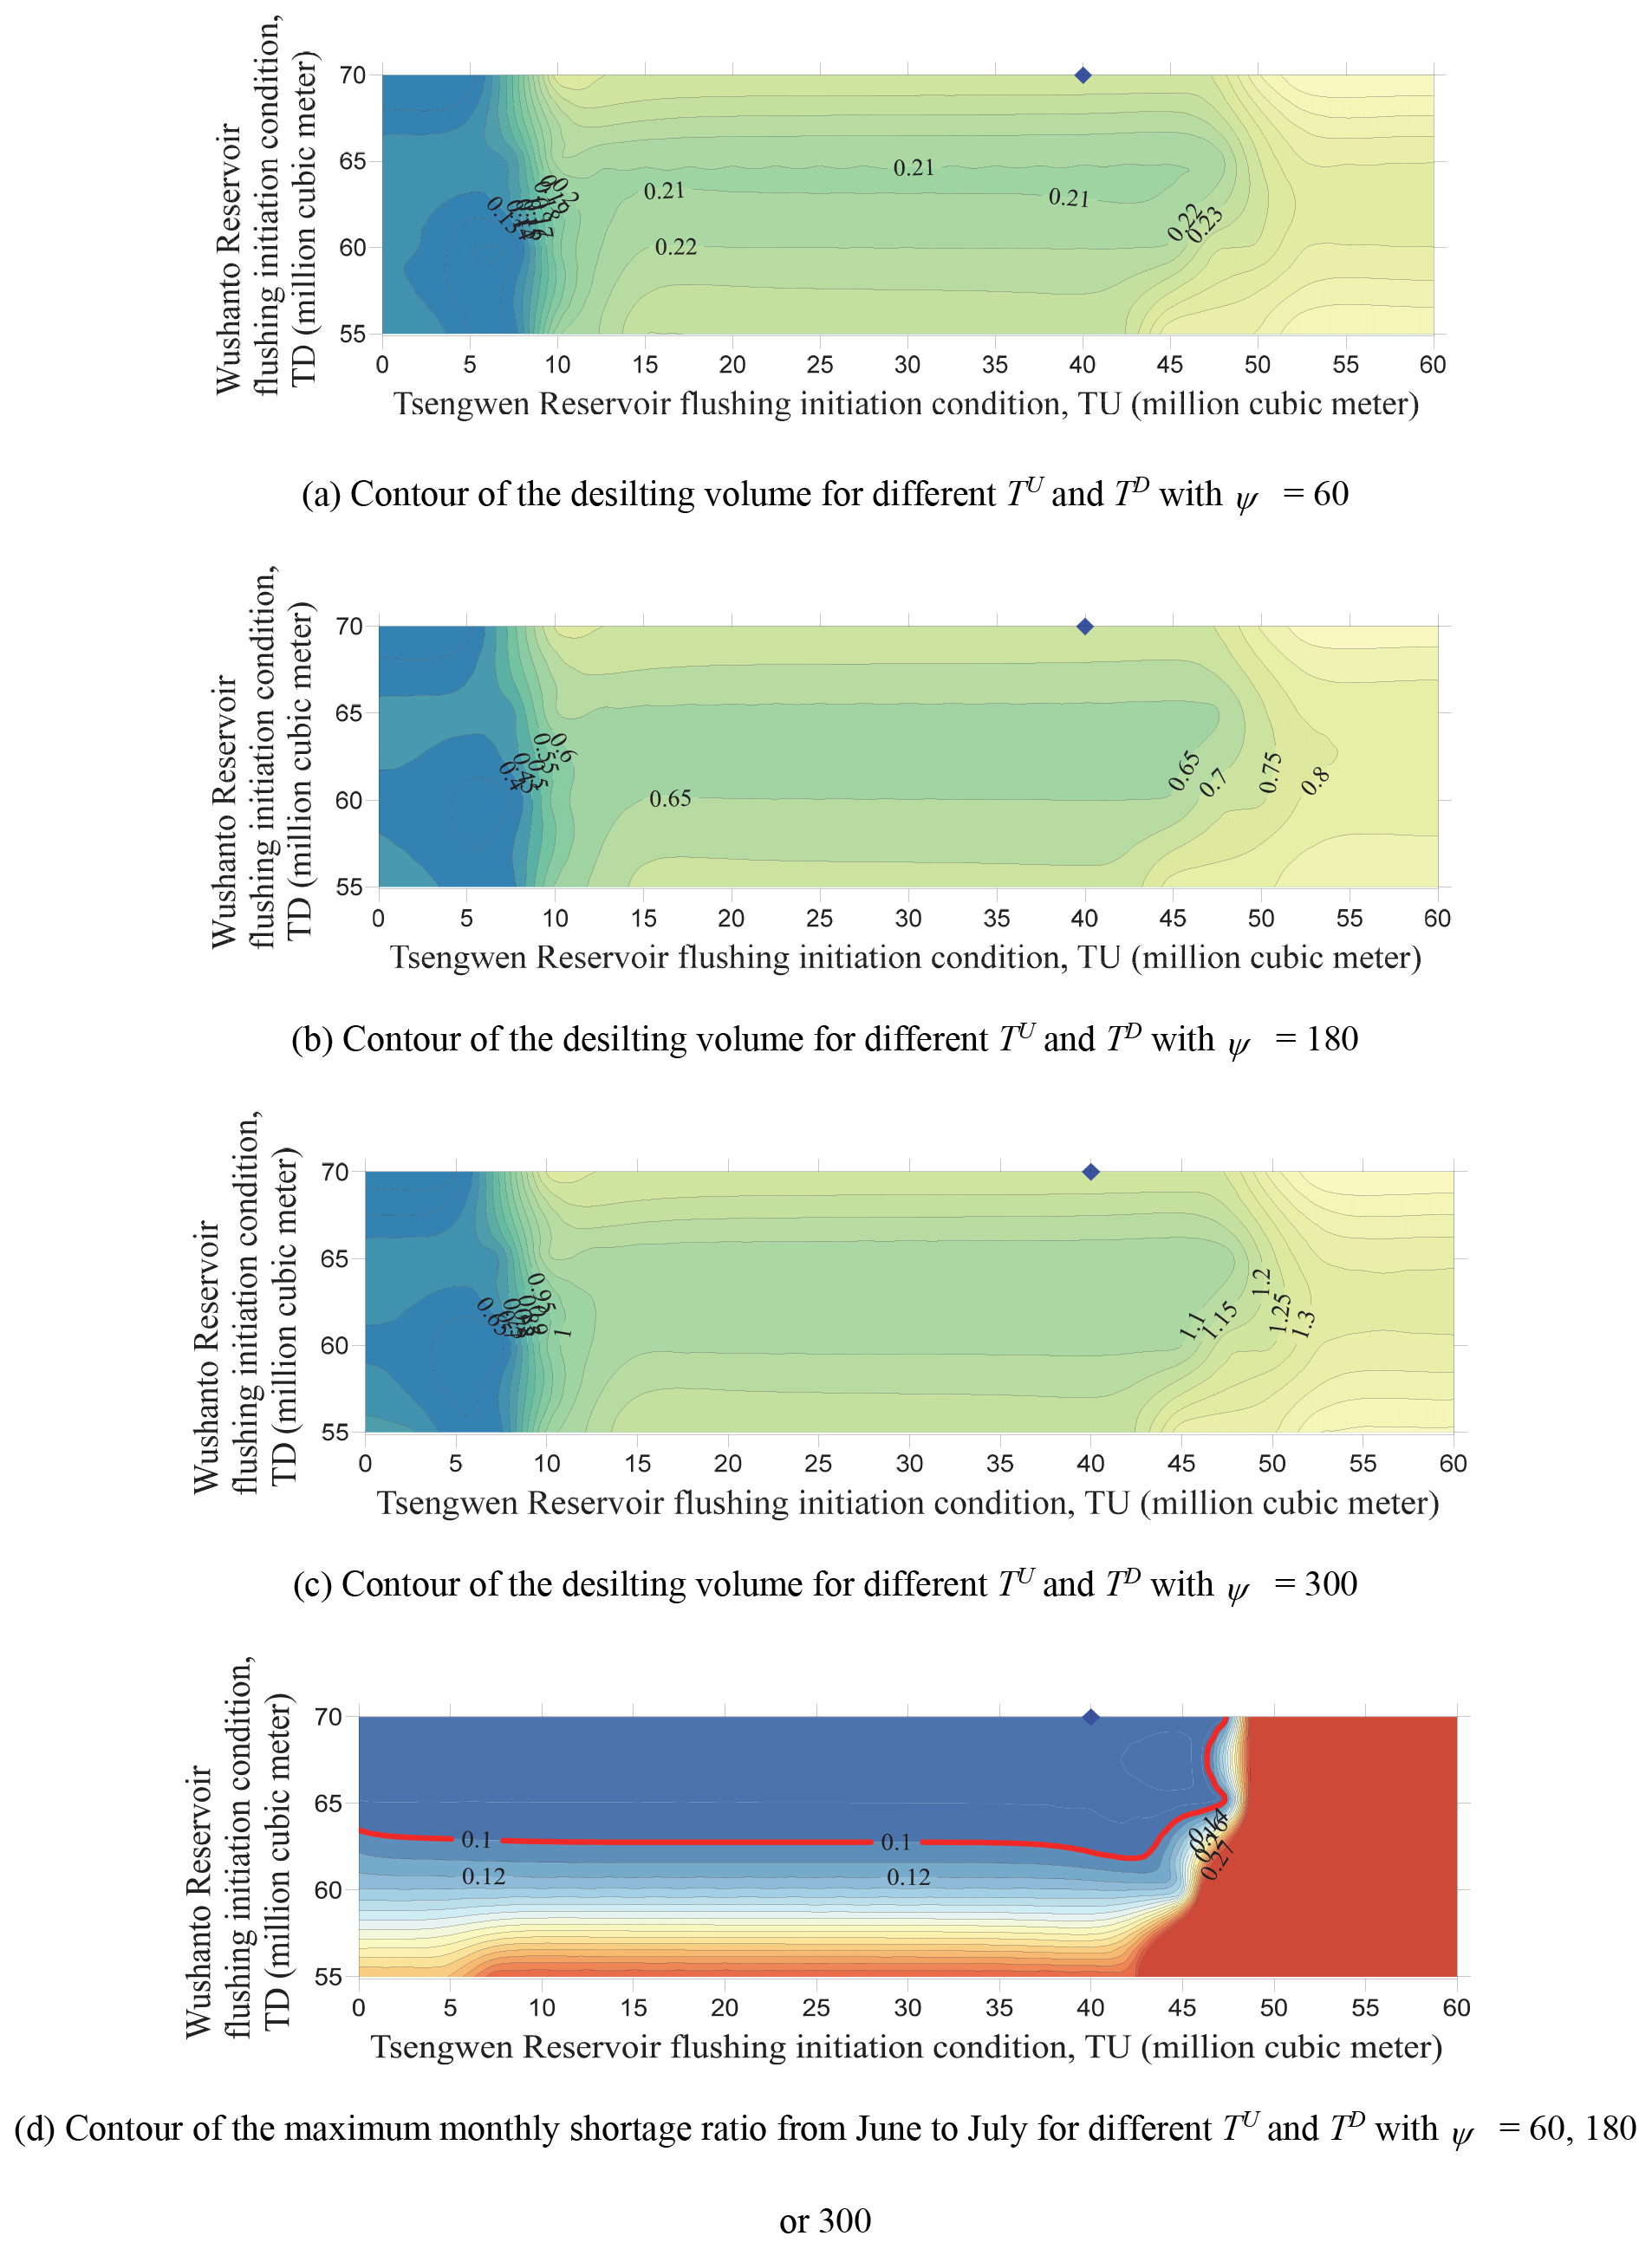
Figure A3Results of sensitivity analysis of flushing coefficient and threshold storage for the 15th 10 d.
The data used in this study, including 46 years of daily hydrological series, simulated water allocation process, and hundreds of input and output files of the GWASIM and SRH-2D models, are available from the authors upon requests (chiawenwu1977@gmail.com). The executive file of the SRH-2D model and the associated manuals are available on the website of the US Bureau of Reclamation (https://www.usbr.gov/tsc/techreferences/computer%20software/models/srh2d/index.html, Lai, 2008).
The study was initiated by FNFC, who also acquired the funds. FNFC and CWW both contributed to the methodological development of simulation and optimization models. CWW carried out the contents of most analysis in the case study. The numerical simulation of SRH-2D was performed by FZL. The article was jointly drafted by CWW and FNFC.
The authors declare that they have no conflict of interest.
The authors acknowledge the Technical Service Center, US Bureau of Reclamation for the numerical software provided for this study. We also appreciate Jihn-Sung Lai, the research fellow of Hydrotech Research Institute, National Taiwan University, for providing the sediment transport knowledge and suggestions on simulation implementation.
This research has been supported by the Ministry of Science and Technology, Taiwan (grant no. NSC102-2221-E006-179) and the Water Resources Agency, Taiwan (grant no. MOEA/WRA/101-WRASB-03).
This paper was edited by Alberto Guadagnini and reviewed by two anonymous referees.
Atkinson, E.: The feasibility of flushing sediment from reservoirs, Report OD137, HR Wallingford, Wallingford, UK, 1996.
Basson, G. R. and Rooseboom, A.: Dealing with reservoir sedimentation, Water Research Commission, Report no. TT91/97, Pretoria, South Africa, 1997.
Brandt, S. A. and Swenning, J.: Sedimentological and geomorphological effects of reservoir flushing: the Cachí Reservoir, Costa Rica, 1996, Geogr. Ann. A, 81, 391–407, https://doi.org/10.1111/j.0435-3676.1999.00069.x, 1999.
Bruk, S.: Methods of Computing Sedimentation in Lakes and Reservoirs. International Hydrological Programme, Project A.2.6.1., UNESCO, Paris, France, 1985.
Cattanéo, F., Guillard, J., Diouf, S., O'Rourke, J., and Grimardias, D.: Mitigation of ecological impacts on fish of large reservoir sediment management through controlled flushing – The case of the Verbois dam (Rhône River, Switzerland), Sci. Total Environ., 756, 144053, https://doi.org/10.1016/j.scitotenv.2020.144053, 2021.
Chang, F. J., Lai, J. S., and Kao, L. S.: Optimization of operation rule curves and flushing schedule in a reservoir, Hydrol. Process., 17, 1623–1640, 2003.
Chaudhry, M. A. and Habib-ur-rehman: Worldwide experience of sediment flushing through reservoirs, Mehran University Research Journal of Engineering & Technology, 31, 395–408, 2012.
Chen, I. S., Han, C. C., and Fang, L. S.: Sinogastromyzon nantaiensis, a new balitorid fish from southern Taiwan (Teleostei: Balitoridae), Ichthyol. Explor. Freshwat., 13, 239–242, 2002.
Chen, J. L. and Zhao, K. Y.: Sediment management in Nanqin Reservoir, Int. J. Sediment Res., 7, 71–84, 1992.
Chou, F. N. F. and Wu, C. W.: Reducing the impacts of flood-induced reservoir turbidity on a regional water supply system, Adv. Water Resour., 33, 146–157, 2010.
Chou, F. N.-F. and Wu, C.-W.: Determination of cost coefficients of a priority-based water allocation linear programming model – a network flow approach, Hydrol. Earth Syst. Sci., 18, 1857–1872, https://doi.org/10.5194/hess-18-1857-2014, 2014.
Chou, F. N. F. and Wu, C. W.: Stage-wise optimizing operating rules for flood control in a multi-purpose reservoir, J. Hydrol., 521, 245–260, 2015.
Chou, F. N. F. and Wu, C. W.: Allocating water storage of multiple reservoirs to enhance empty flushing, Proceedings of the 2nd International Workshop on Sediment Bypass Tunnels, 9–12 May 2017, Kyoto, Japan, 2017.
Chou, F. N. F., Wu, C. W., and Lin, C. H.: Simulating multi-reservoir operation rules by network flow model, Operating Reservoirs in Changing Conditions, Operations Management Conference, Sacramento, California, USA, 14–16 August 2006, https://doi.org/10.1061/40875(212)33, 2006.
Crosa, G., Castelli, E., Gentili, G., and Espa, P.: Effects of suspended sediments from reservoir flushing on fish and macroinvertebrates in an alpine stream, Aquat. Sci., 72, 85–95, https://doi.org/10.1007/s00027-009-0117-z, 2010.
Engelund, F. and Hansen, E.: A Monograph on Sediment Transport in Alluvial Stream, Teknisk Forlag, Copenhagen V, Denmark, 1967.
Espa, P., Batalla, R. J., Brignoli, M. L., Crosa, G., Gentili, G., and Quadroni, S.: Tackling reservoir siltation by controlled sediment flushing: Impact on downstream fauna and related management issues, PLoS ONE, 14, e0218822, https://doi.org/10.1371/journal.pone.0218822, 2019.
Fan, J. and Morris, G. L.: Reservoir sedimentation, II: Reservoir desiltation and long-term storage capacity, J. Hydr. Eng., 118, 370–384, 1992.
International Research and Training Center on Erosion and Sedimentation (IRTCES): Lecture notes of the training course on reservoir sedimentation, Tsinghua University, Beijing, China, 1985.
Jaggi, A. L. and Kashyap, B. R.: Desilting of Baira Reservoir of Baira Siul Project, Irrigation and Power, 41, 375–380, 1984.
Jansson, M. B. and Erlingsson, U.: Measurement and quantification of a sedimentation budget for a reservoir with regular flushing, Regul. Rivers: Res. Mgmt., 16, 279–306, https://doi.org/10.1002/(SICI)1099-1646(200005/06)16:3<279::AID-RRR586>3.0.CO;2-S, 2000.
Jowett, I.: Sedimentation in New Zealand hydroelectric schemes, Water Int., 9, 172–173, 1984.
Khan, N. M. and Tingsanchali, T.: Optimization and simulation of reservoir operation with sediment evacuation: a case study of the Tarbela Dam, Pakistan, Hydrol. Process., 23, 730–747, 2009.
Lai, Y. G.: SRH-2D version 2: Theory and user's manual, Sedimentation and River Hydraulics Group, Technical Service Center, Bureau of Reclamation, Denver, USA, available at: https://www.usbr.gov/tsc/techreferences/computer%20software/models/srh2d/index.html (last access: 15 April 2021), 2008.
Lai, Y. G.: Two-dimensional depth-averaged flow modeling with an unstructured hybrid mesh, J. Hydraul. Eng., 136, 12–23, 2010.
Meile, T., Bretz, N. V., Imboden, B., and Boillat, J. L.: Reservoir sedimentation management at Gebidem Dam(Switzerland), chap. 28, Reservoir Sedimentation, Taylor & Francis Group, London, UK, 2014.
Moridi, A. and Yazdi, J.: Sediment flushing of reservoirs under environmental considerations, Water Resour. Manag., 31, 1899–1914, 2017.
Morris, G. L.: Sediment management and sustainable use of reservoirs, in: Modern Water Resources Engineering, edited by: Wang, L. K. and Yang, C. T., Humana Press, New York, USA, 279–338, https://doi.org/10.1007/978-1-62703-595-8, 2014.
Morris, G. L. and Fan, J.: Reservoir Sedimentation Handbook, McGraw-Hill Book Co., New York, USA, 1998.
Oliveira, R. and Loucks, D. P.: Operating rules for multireservoir system, Water Resour. Res., 33, 839–852, 1997.
Powell, M.: The BOBYQA algorithm for bound constrained optimization without derivatives. Technical report, DAMTP 2009/NA06. University of Cambridge, Cambridge, United Kingdom, 2009.
Shen, H. W.: Flushing sediment through reservoirs, J. Hydraul. Res., 37, 743–757, 1999.
Southern Regional Water Resources Office: The study of the reservoir operation strategy during the engineering construction for improvement of the intake of Tsengwen Reservoir, Technical report, Water Resources Agency, Tainan, Taiwan, 2012 (in Chinese).
Southern Regional Water Resources Office: Sediment observation and efficiency evaluation for desiltation of Agongdian Reservoir by using empty flushing in 2013, Technical report, Water Resources Agency, Kaohsiung, Taiwan, 2013 (in Chinese).
Southern Regional Water Resources Office: Review and modification of the operating guidelines of Agongdian Reservoir, Technical report, Water Resources Agency, Kaohsiung, Taiwan, 2015 (in Chinese).
Sumi, T.: Evaluation of efficiency of reservoir sediment flushing in Kurobe River, Fourth International Conference on Scour and Erosion, 5–7 November 2008, Tokyo, Japan, 2008.
Sumi, T. and Kantoush, S. A.: Integrated management of reservoir sediment routing by flushing, replenishing, and bypassing sediments in Japanese river basins, 8th International Symposium on Ecohydraulics, 12–16 September 2010, Seoul, Korea, 2010.
Sumi, T., Nakamura, S., and Hayashi, K.: The effect of sediment flushing and environmental mitigation measures in the Kurobe River, Twenty-third international congress on large dams, 25–29 May 2009, Brasilia, Brazil, 2009.
Taklimy, M. H. R. and Tolouie, E.: Sefidrud Dam desiltation operation, WASER/IAHR/IRTCES Study Tour to the Three Gorges Project (TGP), 8–15 August 2005, Yichang, Hubei Province, China, 2005.
Water Resources Agency: Reservoir sediment releasing countermeasures cope with climate change, Technical report, Water Resources Agency, Taichung, Taiwan, 2010a (in Chinese).
Water Resources Agency: Feasibility planning of hydraulic desilting scenarios of Tsengwen Reservoir, Water Resources Agency, Taichung, Taiwan, 2010b (in Chinese).
Water Resources Planning Institute: Assessment framework for sustainable reservoir, Technical report, Water Resources Agency, Taichung, Taiwan, 2010 (in Chinese).
White, R.: Evacuation of Sediments from Reservoirs, Thomas Telford Publishing, London, UK, 2001.
- Abstract
- Introduction
- Case study area
- Methodology
- Analysis, results, and discussion
- The impacts on downstream environment and potential extensions of the proposed method
- Conclusions
- Appendix A
- Data availability
- Author contributions
- Competing interests
- Acknowledgements
- Financial support
- Review statement
- References