the Creative Commons Attribution 4.0 License.
the Creative Commons Attribution 4.0 License.
 | 24 Mar 2021
The value of ASCAT soil moisture and MODIS snow cover data for calibrating a conceptual hydrologic model
Juraj Parajka
Andreas Salentinig
Isabella Pfeil
Jürgen Komma
Borbála Széles
Martin Kubáň
Peter Valent
Mariette Vreugdenhil
Wolfgang Wagner
Günter Blöschl
Recent advances in soil moisture remote sensing have produced satellite data sets with improved soil moisture mapping under vegetation and with higher spatial and temporal resolutions. In this study, we evaluate the potential of a new, experimental version of the Advanced Scatterometer (ASCAT) soil water index data set for multiple objective calibrations of a conceptual hydrologic model. The analysis is performed in 213 catchments in Austria for the period 2000–2014. An HBV (Hydrologiska Byråns Vattenbalansavdelning)-type hydrologic model is calibrated based on runoff data, ASCAT soil moisture data, and Moderate Resolution Imaging Spectroradiometer (MODIS) snow cover data for various calibration variants. Results show that the inclusion of soil moisture data in the calibration mainly improves the soil moisture simulations, the inclusion of snow data mainly improves the snow simulations, and the inclusion of both of them improves both soil moisture and snow simulations to almost the same extent. The snow data are more efficient at improving snow simulations than the soil moisture data are at improving soil moisture simulations. The improvements of both runoff and soil moisture model efficiencies are larger in low elevation and agricultural catchments than in others. The calibrated snow-related parameters are strongly affected by including snow data and, to a lesser extent, by soil moisture data. In contrast, the soil-related parameters are only affected by the inclusion of soil moisture data. The results indicate that the use of multiple remote sensing products in hydrological modeling can improve the representation of hydrological fluxes and prediction of runoff hydrographs at the catchment scale.
- Article
(5753 KB) - Full-text XML
-
Supplement
(3025 KB) - BibTeX
- EndNote


Estimating the spatial and temporal variability in water balance components at the regional scale is important for solving a range of practical issues in water resources management and planning and for understanding catchment functioning in terms of how runoff-generation processes interact to produce catchment response. An estimation approach is using hydrologic models. There are a variety of model types and model parameter estimation methods. Notwithstanding their usefulness, the resulting simulations of the water balance components are subject to uncertainty due to uncertainty in model inputs, parameter estimation, and model structure (Kavetski et al., 2006; Parajka et al., 2007; Wagener and Montanari, 2011).
Previous studies have demonstrated that multiple objective calibration helps to constrain hydrologic models and, hence, to reduce uncertainty and to improve predictions in hydrological modeling (e.g., Efstratiadis and Koutsoyiannis, 2010). Most of these studies examined the value of constraining hydrologic models by combining different runoff signatures (e.g., by simultaneous calibration of the models to low and high flows or timing) or calibrating hydrologic models to runoff and some additional hydrological variable, such as snow cover (e.g., Udnæs et al., 2007; Parajka and Blöschl, 2008; Franz and Karsten, 2013; Duethmann et al., 2014; Finger et al., 2015, Han et al., 2019, Sleziak et al., 2020), soil moisture (e.g., Parajka et al., 2009; Sutanudjaja et al., 2014; Wanders et al., 2014; Rajib et al., 2016; Kundu et al., 2017, Li et al., 2018), evaporation (e.g., Immerzeel and Droogers, 2008; Zhang et al., 2009), groundwater level data (Seibert, 2000), or total water storage (e.g., Lo et al., 2010; Werth and Güntner, 2010; Rakovec et al., 2016; Bai et al., 2018; Trautmann et al., 2018). These studies showed that the use of additional information typically improves the spatial and/or temporal patterns of internal state variables and fluxes but does not necessarily improve the efficiency of simulating runoff. Most of the studies reported a small degradation of runoff model efficiency while the internal consistency of the models improved. A few studies also tested the combination of more variables in multiple objective calibration (e.g., Milzow et al., 2011; Kunnath-Poovakka et al., 2016; López López et al., 2017; Nijzink et al., 2018; Demirel et al., 2019; Szeles et al., 2020, 2021) and found that the combination of different variables generally reduced the parameter uncertainty, particularly in data-poor regions. For example, Nijzink et al. (2018) demonstrated that constraining hydrologic models profited from an increased number of data sources. Interestingly, the use of different soil moisture products had a positive impact on the identifiability of not only soil but also snow module parameters.
The factors that control these improvements are less well understood. Snow cover data improved snow and runoff simulations in small catchments without precipitation observations (Parajka and Blöschl, 2008). They helped to reduce snow underestimation errors in flatland catchments in changing climate conditions (Sleziak et al., 2020). Including evapotranspiration estimates improved regionalization and simulations of daily and monthly runoff, particularly in drier regions with lower runoff volumes (Zhang et al., 2009). The use of total water storage data from the Gravity Recovery and Climate Experiment (GRACE) improved runoff simulations on monthly or longer timescales, particularly in wet catchments (Rakovec et al., 2016). Only a few studies examined the factors that control the changes in soil moisture efficiency when using soil moisture information (Rajib et al., 2016). Parajka et al. (2006) showed that the soil moisture efficiency of a model calibrated to runoff and satellite soil moisture was lower in hilly and alpine regions, with large topographical variability as compared to the flatlands. Nijzink et al. (2018) reported that the Advanced Microwave Scanning Radiometer for the Earth Observing System (AMSR-E) soil moisture product improved the identifiability of model parameters in peaty lowland catchments.
Recent advances in the observation techniques of soil moisture, particularly in passive and active microwave remote sensing, increase the availability of regional and global soil moisture data sets (Babaeian et al., 2019). Passive microwave sensors operating in the 1–10 GHz frequency range suitable for soil moisture retrieval include the L-band radiometers flown on board the Soil Moisture Active Passive (SMAP) and Soil Moisture and Ocean Salinity (SMOS) missions and the multifrequency radiometer Advanced Microwave Scanning Radiometer 2 (AMSR2). In the active domain, soil moisture retrievals from the C-band Advanced Scatterometer (ASCAT) have found widespread use in geoscientific applications (Brocca et al., 2017). All these satellites have a rather coarse spatial resolution of the order of tens of kilometers (10–50 km). Various validation studies have shown that ASCAT soil moisture data sets (Wagner et al., 2013) are less accurate than corresponding SMAP soil moisture data sets (Kim et al., 2020) but are, overall, comparable in quality with SMOS and AMSR2 (Chen et al., 2018; El Hajj et al., 2018; Mousa and Shu, 2020). Nonetheless, there are important regional differences in the quality of the satellite soil moisture data sets, with ASCAT performing, in general, the poorest over arid environments and the best over more densely vegetated regions. Over the United States and Europe, comparisons with in situ soil moisture data from dense networks have revealed the presence of seasonal biases in the ASCAT soil moisture time series (Wagner et al., 2014). Pfeil et al. (2018) and Hahn et al. (2020) have demonstrated that these seasonal biases can be reduced by enhancing the vegetation parameterization of the TU Wien change detection model introduced by Wagner et al. (1999). The launch of the Sentinel-1 series provides observations at a high spatial resolution of 5×20 m. Over mountainous environments, soil moisture retrievals from all microwave sensors are, in general, much less reliable than over flatland regions due to significant topographic variations within the coarse-resolution satellite footprints and the presence of rocks, ice, snow, and dense vegetation. Nonetheless, in the snow- and frost-free summer months, the satellite retrievals may have some skill, as demonstrated by Brocca et al. (2013) for an alpine catchment in northern Italy.
The objective of this study is to test the value of a new ASCAT soil water index (SWI) data product for multiple objective calibration and validation of a conceptual hydrologic model. Compared to the operational ASCAT SWI product, as distributed by the Copernicus Global Land Service, this experimental SWI data product mainly benefits from a new vegetation parameterization of the ASCAT surface soil moisture retrieval algorithm and an improved spatial representation due to the application of a new directional resampling method based on Sentinel-1 synthetic aperture radar (SAR) data. The main aims are as follows: (1) to evaluate the performance of a conceptual hydrologic model calibrated to satellite soil moisture and runoff, (2) to test the impact of weight on the runoff objective in model calibration, (3) to compare the multiple objective calibrations to three different calibration variants, namely (i) traditional calibration to runoff only, (ii) multiple objective calibration to satellite snow cover and runoff, and (iii) multiple objective calibration to satellite snow cover, soil moisture, and runoff, and (4) to examine factors that control the model performance at the regional scale. The analysis is performed by confronting a conceptual hydrologic model with ASCAT SWI soil moisture data for 213 catchments in Austria, which represent a wide range of physiographic settings typical of central European conditions.
2.1 ASCAT soil water index product
For producing a new, experimental version of the ASCAT SWI data set, we deployed the same algorithms used within the European Organisation for the Exploitation of Meteorological Satellites (EUMETSAT) Satellite Application Facility on Support to Operational Hydrology and Water Management (H-SAF) and the Copernicus Global Land Service. The novelty is the application of a new parameterization for the vegetation correction (Hahn et al., 2020) and a new approach for disaggregating the ASCAT soil moisture retrievals to a finer grid. This approach is currently under review by H-SAF for producing the planned MetOp (Meteorological Operational satellite) ASCAT disaggregated surface soil moisture near-real-time 1 km sampling (ASCAT DIS SSM NRT 1 km – H28) data product. The main steps in the processing are as follows: (i) retrieving surface soil moisture from ASCAT backscatter time series using the TU Wien change detection algorithm adopted by ASCAT (Naeimi et al., 2009) and using the vegetation parameterization as recommended by Pfeil et al. (2018), (ii) disaggregating the ASCAT surface soil moisture data to a regular 500 m grid using the directional resampling method described in the Algorithm Theoretical Baseline Document (ATBD) for the planned H-SAF H28 data product, and (iii) computing the SWI using the iterative implementation of the exponential filter introduced by Wagner et al. (1999) and Albergel et al. (2008), with a characteristic time value of T=10 d, representing root zone soil moisture. This last processing step makes the ASCAT soil moisture data better comparable to the modeled soil moisture data as it filters out high-frequency fluctuations of the ASCAT surface soil moisture retrievals and samples the data at regular time intervals. The disaggregation step is based on the analysis of Sentinel-1 backscatter time series sampled to 500 m. It essentially looks for the best direction from which the ASCAT data are interpolated to the 500 m grid. Thus, it improves the resampling, especially near large lakes or near large urban areas. The ASCAT product used in this research is the same product which is used as the active product in the European Space Agency Climate Change Initiative (ESA CCI). The study of Dorigo et al. (2017) demonstrated the quality of the active ESA CCI product over temperate climates such as Austria. Considering that the spatial sampling of the ESA CCI data set is 0.25∘, whereas the ASCAT product has a sampling of 12.5 km, the ASCAT product was chosen to be applied in this study. In addition, the algorithm of the ASCAT product, which improved vegetation parameters, performed better over Austria (Pfeil et al., 2018).
To exclude invalid ASCAT measurements of snow and frozen ground, soil moisture was masked using soil temperature and snow cover from the European Centre for Medium-Range Weather Forecasts (ECMWF) Copernicus Climate Service ERA5-Land data set (Muñoz Sabater, 2019). Soil moisture was masked when soil temperatures at a soil depth of 0–7 cm were below 1 ∘C or snow cover exceeded 30 % of the pixel.
2.2 MODIS snow cover product
Snow cover is mapped by combining the MODIS products from the Terra (MOD10A1) and Aqua (MYD10A1) satellites (Hall and Riggs, 2016a, b). Version 6 of the MOD10A1 and MYD10A1 data sets provides daily maps of normalized difference snow index (NDSI) at a 500 m spatial resolution. The NDSI values range between 0.0 and 1.0, and snow cover is considered to be present if the NDSI is larger than a threshold. Former MODIS versions used a fixed threshold (0.4), but Tong et al. (2020) found that, in Austria, this threshold can be seasonally optimized for different altitudes and land cover classes. In this study, we use a threshold that varies seasonally, decreases with increasing elevation, and is lower in forested than open land cover settings (see Table S1 in the Supplement). Such a varying threshold improves the regional snow cover mapping by 3 %–10 %, mainly in forested regions above 900 m a.s.l. (meters above sea level; Tong et al., 2020). The classified snow cover maps from Terra and Aqua are then combined to reduce the effect of clouds. Pixels classified as clouds or missing in Terra are replaced by pixels from Aqua if these are classified as snow covered or snow free (Parajka and Blöschl, 2008).
2.3 Study area and other data
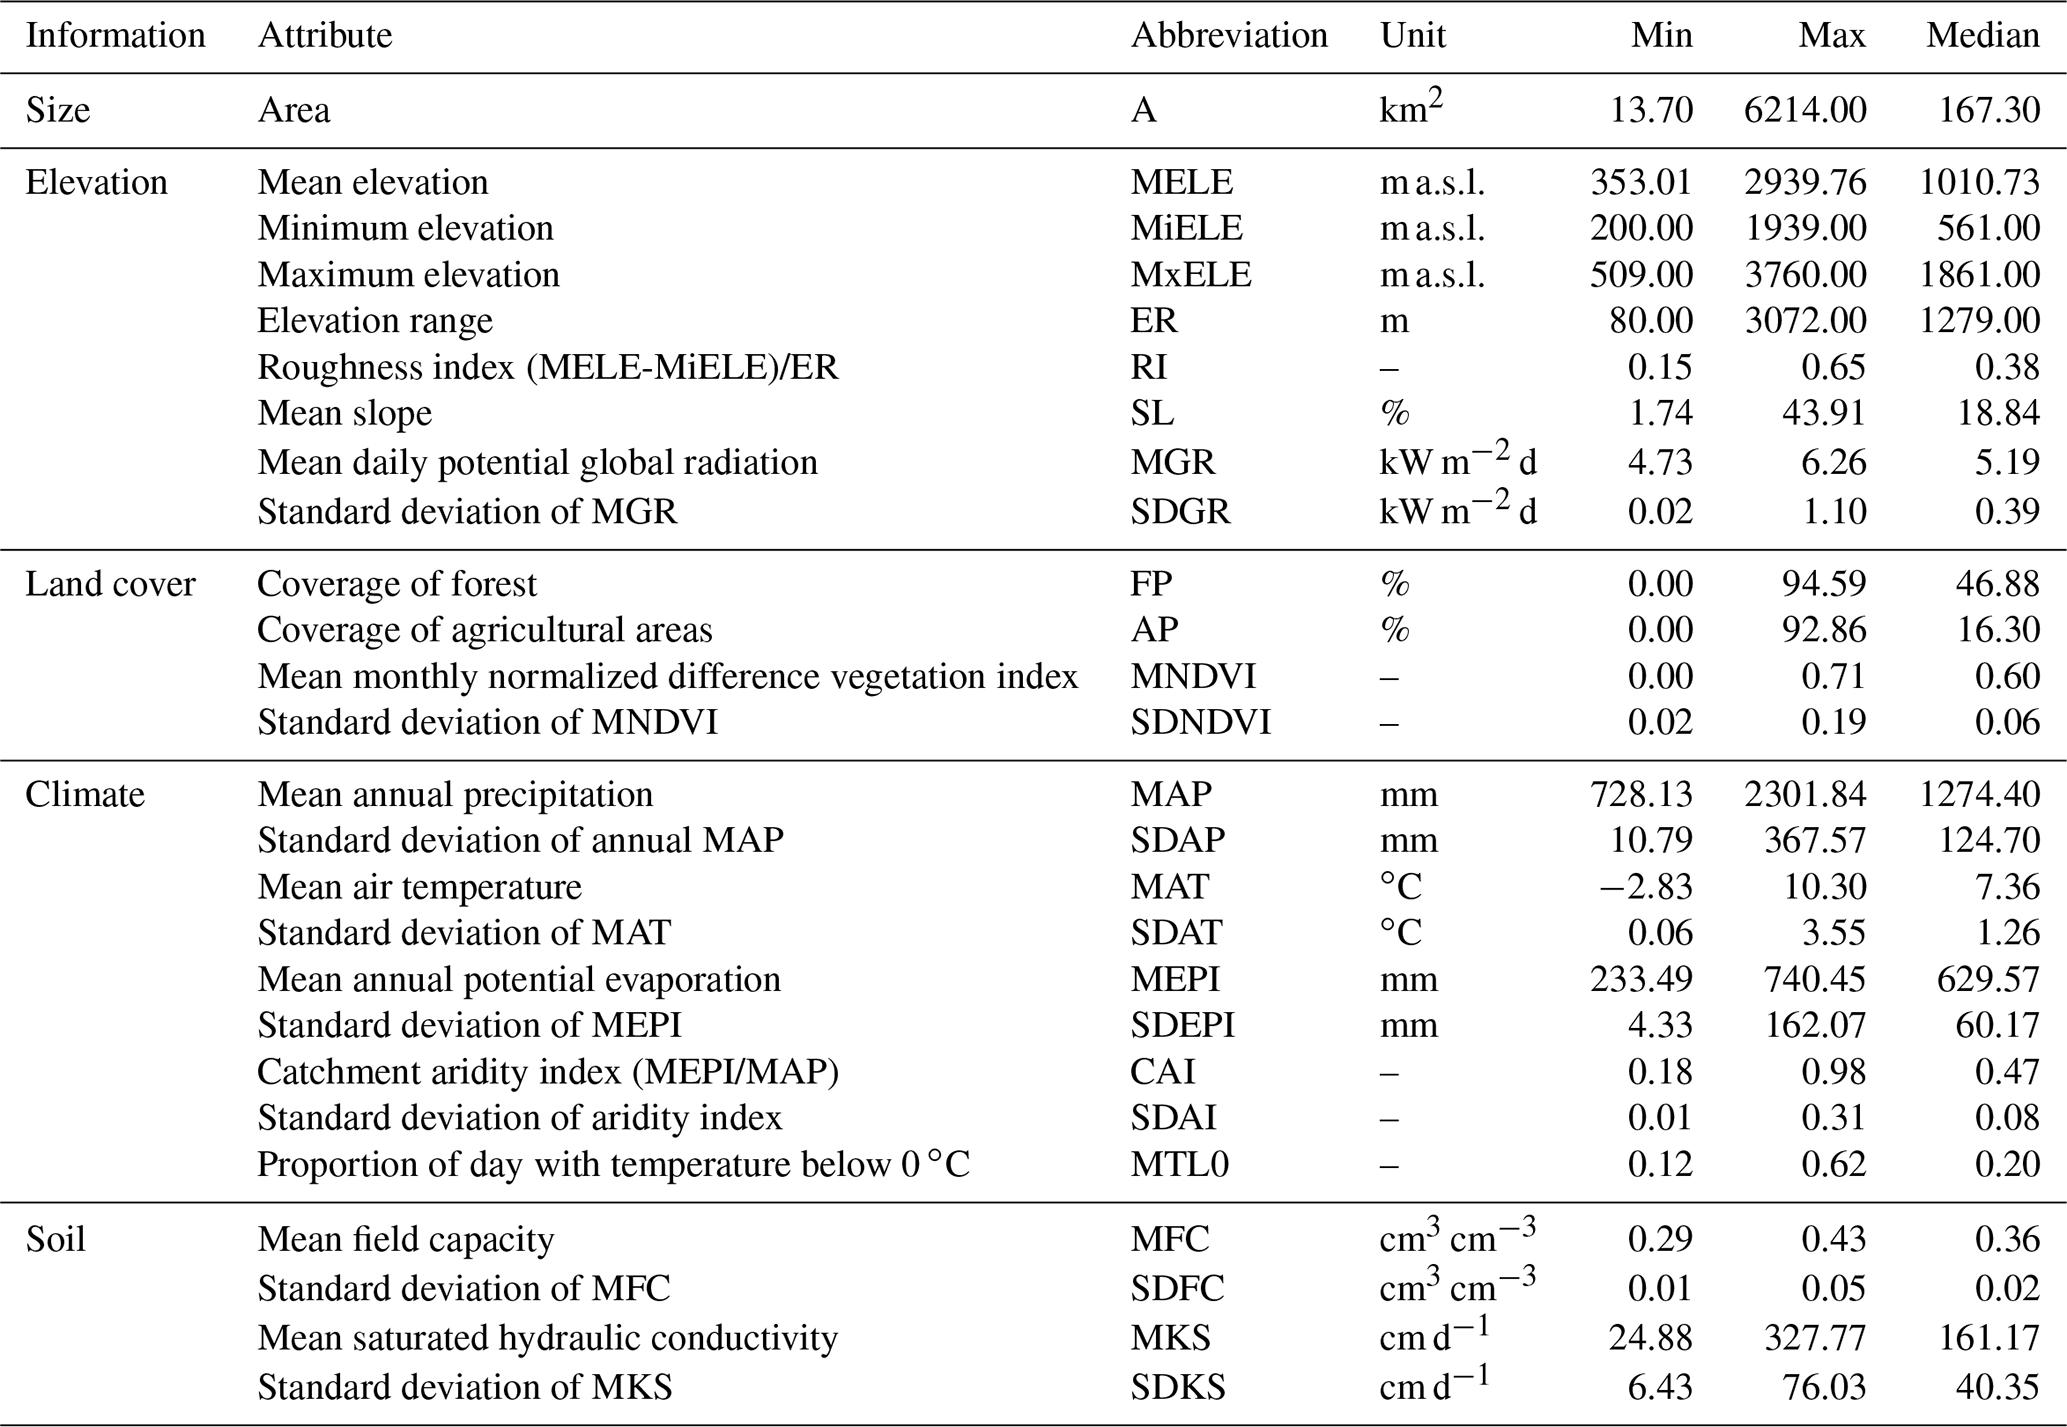
The value of satellite data for the calibration of hydrologic models is evaluated in 213 catchments in Austria (Fig. 1; Table 1). This set of catchments has been selected in previous studies (Viglione et al., 2013; Sleziak et al., 2020) to represent diverse physiographic, landscape, and hydrologic characteristics which are not significantly affected by human impact. Selected catchment characteristics of this data set are presented in Table 1. The size of the catchments varies from 13.7 to 6214 km2, and their mean elevation ranges from 353 to 2940 m a.s.l. Topographical characteristics are derived from a digital elevation model with 500 m spatial resolution. Land cover in Austria is mainly agricultural crops and meadows in the lowlands and forest in the medium elevation ranges. Alpine vegetation and rocks prevail in catchments in the Alps. Land cover characteristics are derived from the CORINE land cover mapping (CLC2006 data set; EEA, 2013; https://land.copernicus.eu/, last access: 5 June 2020), and the NDVI (normalized difference vegetation index; MOD13A3v006) is generated from MODIS C6 1 km monthly data (Didan, 2015). Austria has a warm, temperate climate, except for the Alps. The largest precipitation rates (more than 2000 mm yr−1) occur in the west, mainly due to orographic lifting of northwesterly airflows at the rim of the Alps. Mean annual catchment precipitation is lower (less than 800 mm yr−1) in the lowlands in the east, and the contrast with the Alps is reinforced by the higher air temperature and much higher evaporation in the lowlands. Soil characteristics are derived from a 1 km global map of soil hydraulic properties (Zhang et al., 2018). This data set provides the mean and standard deviations of selected soil hydraulic parameters based on the Kosugi water retention model (Kosugi 1994, 1996) at a 1 km resolution for surface soils (0–5 cm).
Table 1Statistics of the catchment attributes of the 213 catchments in Fig. 1, with abbreviation, unit, minimum, maximum, and median. The standard deviations refer to spatial variability within each catchment. Note: m a.s.l. – meters above sea level.
Hydrological and meteorological data are obtained from the Central Hydrographical Bureau (HZB; https://ehyd.gv.at/, last access: 17 March 2021) and Zentralanstalt für Meteorologie und Geodynamik (ZAMG). Model inputs (i.e., mean daily precipitation and air temperature) are derived from the gridded SPARTACUS data set (Hiebl and Frei, 2016, 2018). This data set provides long-term daily gridded (1 km spatial resolution) maps, which are consistently interpolated by using a consistent station network throughout the entire period (Duethmann et al., 2020). Mean daily potential evaporation is derived from gridded maps of mean daily air temperature and potential sunshine duration index by using a modified Blaney–Criddle approach (Parajka et al., 2003). Daily runoff data from 213 catchments are used for calibrating and 208 catchments for validating the hydrologic model.
The precipitation, air temperature, runoff, and MODIS snow cover data are available from September 2000 to August 2014. The concurrently available period for the soil moisture ASCAT SWI data is January 2007 to August 2014.
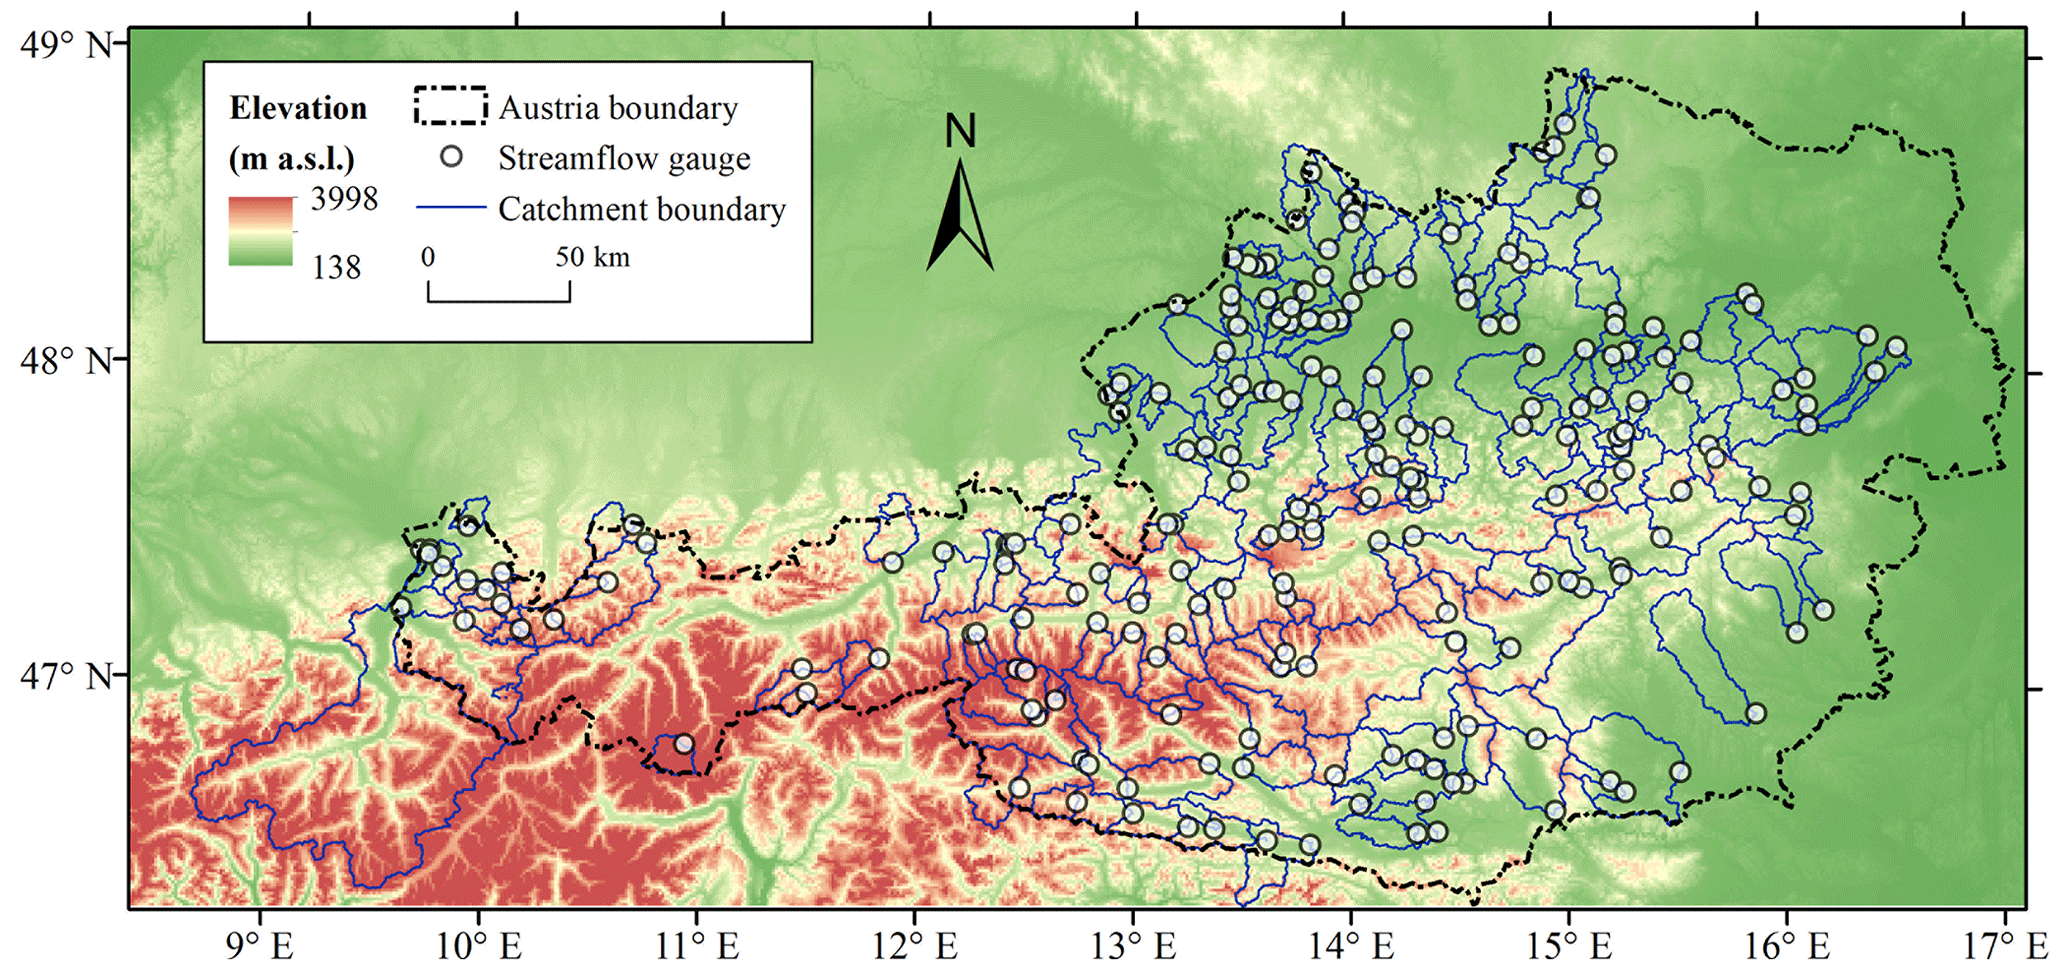
Figure 1Topography of Austria and the location of the 213 catchments.
3.1 Conceptual hydrologic model
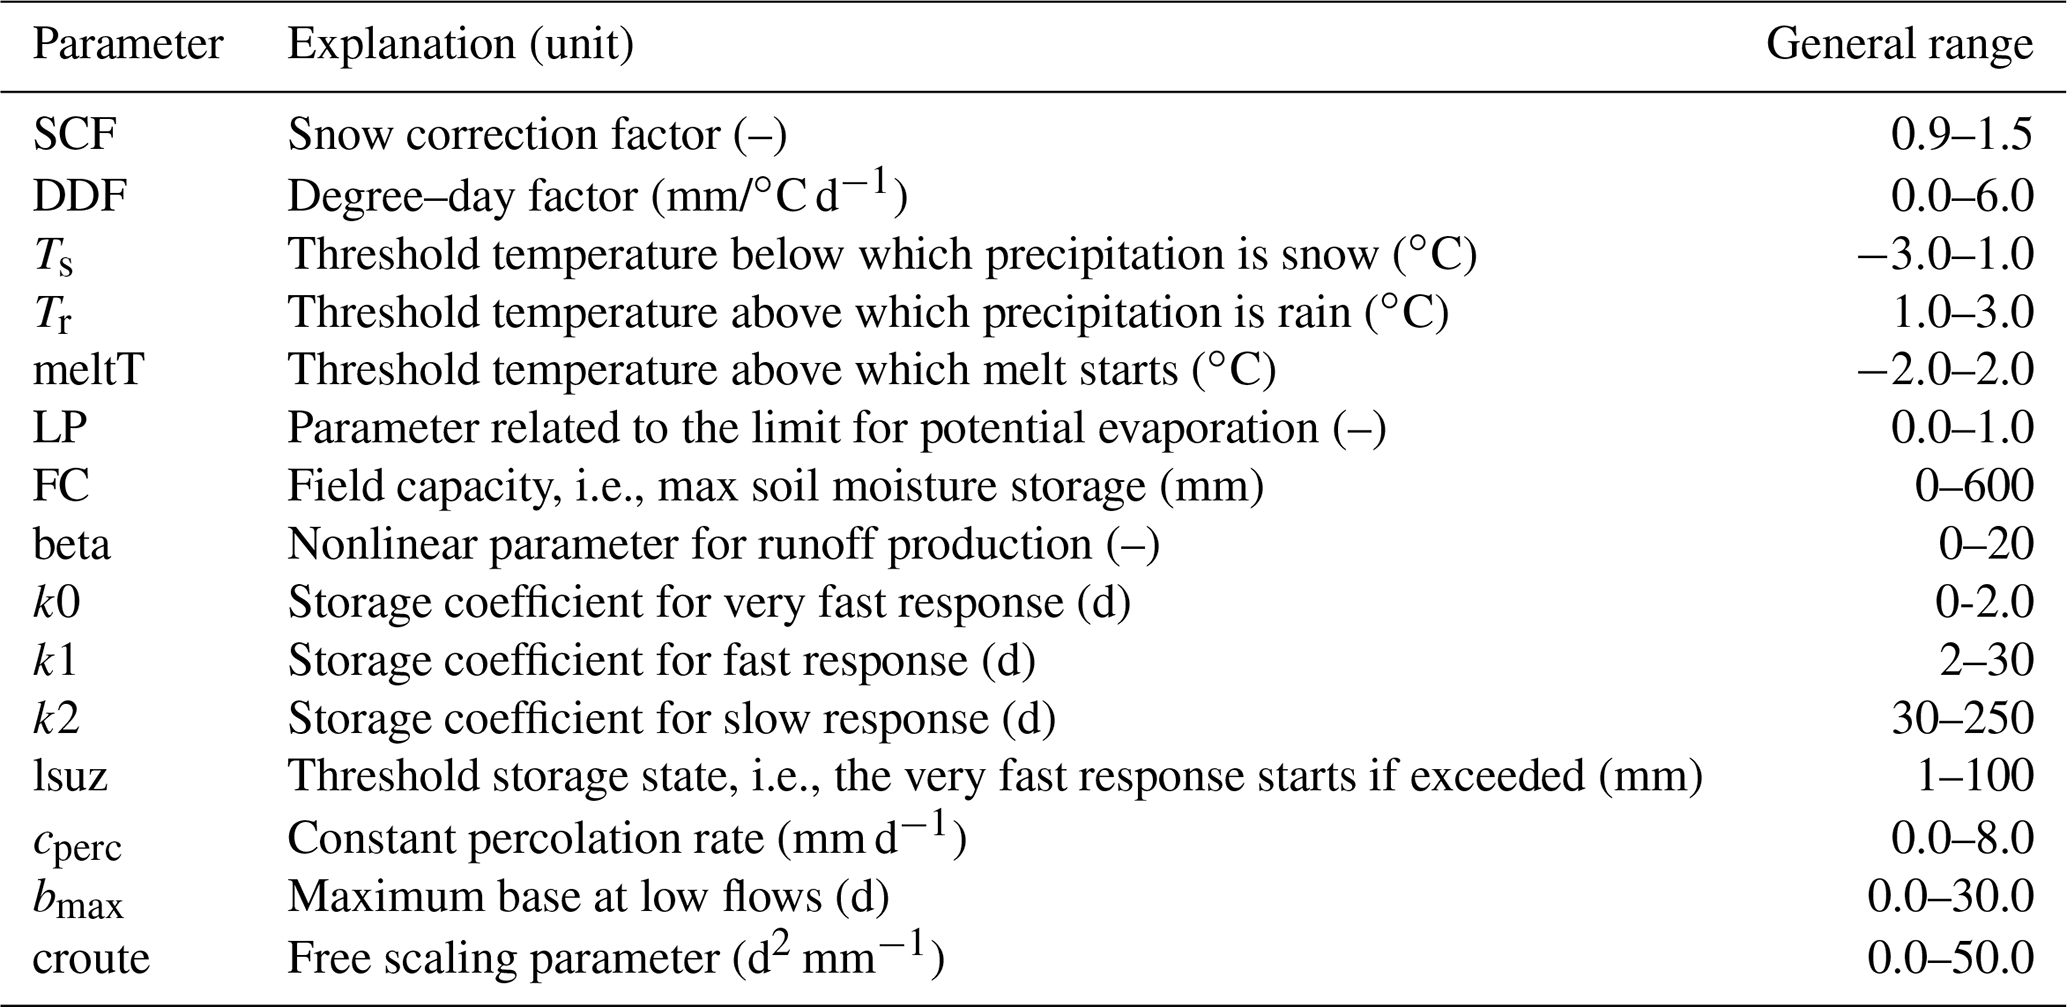
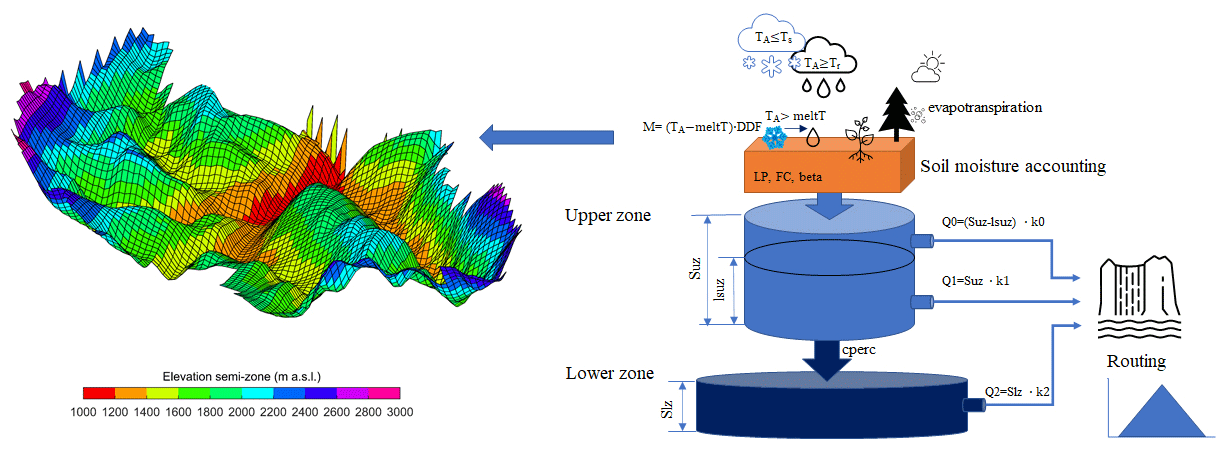
The hydrologic model used in this study is a semi-distributed version of TUWmodel, following the structure of the HBV (Hydrologiska Byråns Vattenbalansavdelning) model (Bergström, 1992; Parajka et al., 2007). A simple illustration of the model structure is presented in Fig. 2. The model consists of three routines, i.e., snow accumulation and melt, soil moisture accounting, and runoff routine. The snow part has five model parameters and is based on a simple degree–day method. This entails the snow correction factor (SCF), to account for errors in measurement of snowfall due to gauge undercatch, the degree–day factor (DDF), and three threshold temperatures (Ts, Tr, and meltT). The soil moisture routine has three parameters, namely the maximum soil moisture storage in the root zone field capacity (FC), a limit that controls the actual evapotranspiration limit potential (LP), and a nonlinear parameter for runoff production beta. The routing involves two parts, i.e., within-catchment routing and stream routing. The within-catchment routing has five parameters, including three storage coefficients k0, k1, and k2 for three conceptual reservoirs representing overland flow, interflow, and base flow, respectively, a threshold for very fast response lsuz (see Table 2 for the definition), and a constant percolation rate cperc connecting the fast and slow reservoirs. The stream routing uses a triangular transfer function with two parameters, namely bmax and croute. The total number of model parameters calibrated is 15 (Table 2). The model is run in a semi-distributed way, i.e., model inputs and outputs are estimated for elevation zones of 200 m, while the model parameters are assumed to be lumped (i.e., constant) in each catchment. In order to match the model simulations to the dimensionless satellite soil water index, the simulated soil moisture is scaled by the field capacity (i.e., the model parameter FC) to obtain a relative root zone moisture ranging from 0 to 1. More details about the model can be found in the Appendix of Parajka et al. (2007).
Table 2Parameters of the hydrologic model (TUWmodel) and ranges used in model calibration. A suitable parameter range may vary by climate and land cover regions and is usually set by expert judgment. The range used here is based on the previous experience of Merz et al. (2011) and Viglione et al. (2013) in the study area.
3.2 Multiple objective calibration and validation of hydrologic model
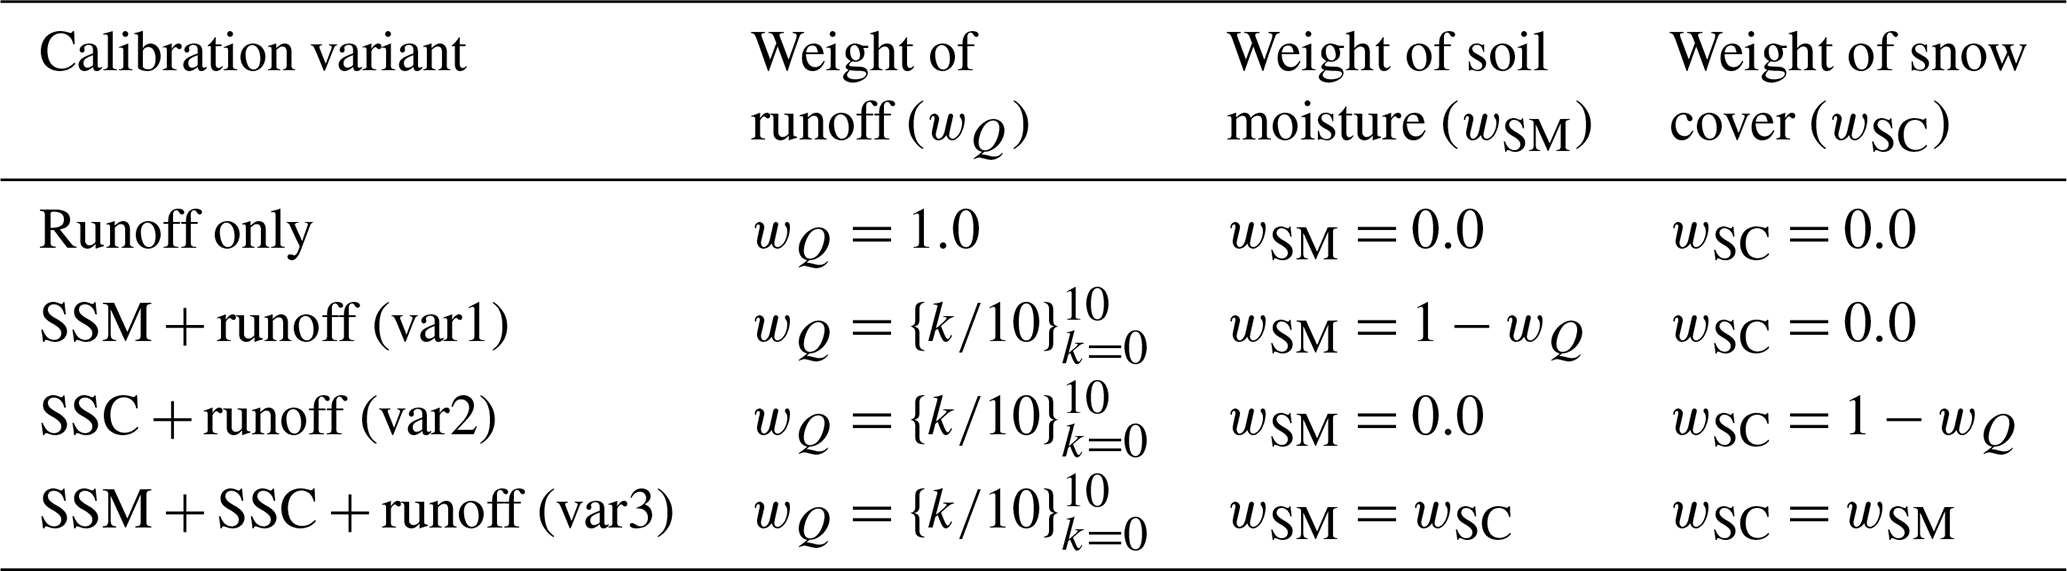
The value of using satellite soil moisture (SSM) data for multiple objective calibration of conceptual hydrologic models is compared to the following three other calibration variants: (1) traditional calibration to runoff only, (2) multiple objective calibration to satellite snow cover (SSC) and runoff, and (3) multiple objective calibration to SSM, SSC, and runoff. The general form of the calibration objective function F, used in this study, consists of minimizing the weighted sum of individual objectives related to runoff (OQ), soil moisture (OSM), and snow cover (OSC) as follows:
where wQ, wSM, and wSC are the weights of the respective objectives. In each multiple objective calibration variant, 11 runoff weights (from 0.0 to 1.0, with a step of 0.1) are tested (Table 3). The soil moisture and snow weights are assumed to be equal for symmetry and are calculated by setting the sum of all weights to 1.0.
Table 3Weights given to runoff, satellite soil moisture (SSM), and satellite snow cover (SSC) in the multiple objective calibration (Eq. 1) for different calibration variants. A set of 11 wQ weights in the range 0.0 and 1.0 is tested for each multiple objective calibration variant. The sum of weights is always 1.0.
The individual objectives OQ, OSM, and OSC are defined below. The runoff objective OQ consists of a combination of two variants of the Nash–Sutcliffe coefficient, NSE and NSElog (Nash and Sutcliffe, 1970), as follows:
where Qobs, i and Qsim, i represent observed and simulated daily runoff of day i, respectively, and Qobs is the average of observed daily runoff over the calibration (or verification) period of n days. The choice of the equal weighting of NSE and NSElog is based on previous studies in the study region (e.g., Parajka and Blöschl, 2008) that emphasize both the high- and low-flow conditions.
The soil moisture objective function (OSM) is expressed by the correlation coefficient r between relative soil moisture estimated from the ASCAT and simulated by the hydrologic model, as follows:
where θsim is the relative root zone soil moisture simulated by the model, and θobs is the ASCAT SWI. The correlation coefficient is selected as a measure of similarity because it allows a comparison of the temporal dynamics irrespective of the respective magnitudes and possible intercepts in the relationship between observed and simulated soil moisture.
The snow cover objective function OSC involves the sum of snow overestimation SO and underestimation SU errors as follows:
The estimation of SO and SU follows the strategy proposed and evaluated in Parajka and Blöschl (2008). The snow overestimation error indicates the relative number of days for which the hydrologic model simulates snow, but the satellite (MODIS) does not observe snow cover, as follows:
where Ai, j is the area of zone j on the day i, which is cloud free from MODIS. SWEi, j is the simulated snow water equivalent in elevation zone j larger than 10 mm (Parajka and Blöschl, 2008), SCAi, j is the snow-covered area estimated from MODIS within this zone, and Ndays is the number of days i for which MODIS images are available with cloud cover less than a threshold (ξC) 50 %.
The snow underestimation error indicates the relative number of days for which the hydrologic model does not simulate snow in a zone, but MODIS indicates that a snow-covered area greater than a threshold of 25 % is present in the zone, i.e., as follows:
The snow-covered area, SCA, within each zone is calculated from the MODIS data as follows:
where S and L represent the number of pixels mapped as snow and snow free, respectively, for a given day and a given elevation zone.
The thresholds ξSWE, ξSCA, and ξC are chosen on the basis of the sensitivity analysis performed by Parajka and Blöschl (2008).
The procedure of model parameters calibration is carried out for each calibration variant and each catchment independently. All calibration variants are automatically calibrated by using the Shuffled Complex–Self-Adaptive Hybrid Evolution (SC–SAHEL) developed by Naeini et al. (2018). It combines four evolutionary algorithms (EAs) with the self-selected scheme, and hence, the evolution process of generating parameter values is more robust. The number of complexes is set to eight, allowing the four EAs to be automatically changed by each evolution generation. The optimization is stopped at any of the following three criteria: if the parameters converge to a space of geometric size less than 0.01, if the best objective function value has not improved by 0.1 % over the last 10 loops, and if the total number of runs reaches 1 000 000 (see Chu et al., 2011; Naeini et al., 2018).
The calibration period used in all variants is from 1 September 2000 to 31 August 2010. The validation period is from 1 September 2010 to 31 August 2014. The warmup period is 1 year before the start of the calibration or validation period. Since soil moisture satellite data are available only from January 2007, the soil moisture simulation efficiency for the calibration period is calculated for a shorter time period.
4.1 Performance of multiple objective calibration
The calibration model performance of three multiple objective calibration variants is presented in Fig. 3 and Table 4. The objective function involves a runoff component weighted by wQ and additional soil moisture and snow components (Table 3). The limiting case is wQ=1, where only the runoff component is used, and this case represents a typical calibration to runoff only. The case where wQ=0 represents calibration only to SSM and/or SSC without the use of runoff data. The median runoff efficiency over the 213 catchments (Fig. 3a; Table 4) ranges between 0.74 and 0.79 for wQ larger than 0.3, irrespective of the calibration variants. Using SSM and SSC with runoff for model calibration results in a similar pattern of model performance to the case when only SSM and runoff are used, but the former variant has a smaller regional variability (scatter) of runoff model efficiency for wQ less than 0.6. Interestingly, when no runoff is involved (wQ=0), using only SSC results in slightly better runoff simulations than when using only SSM, while for wQ from 0.1 to 0.3 the opposite is the case.
Table 4Median of runoff (Eq. 2), soil moisture (Eq. 5), and snow cover (Eq. 6) model efficiency obtained from the following three multiple objective calibration variants: (1) satellite soil moisture (ASCAT) and runoff (var1), (2) satellite snow cover (MODIS) and runoff (var2), and (3) satellite soil moisture (ASCAT), satellite snow cover (MODIS), and runoff (var3) in 213 catchments in the calibration period 2000–2010.
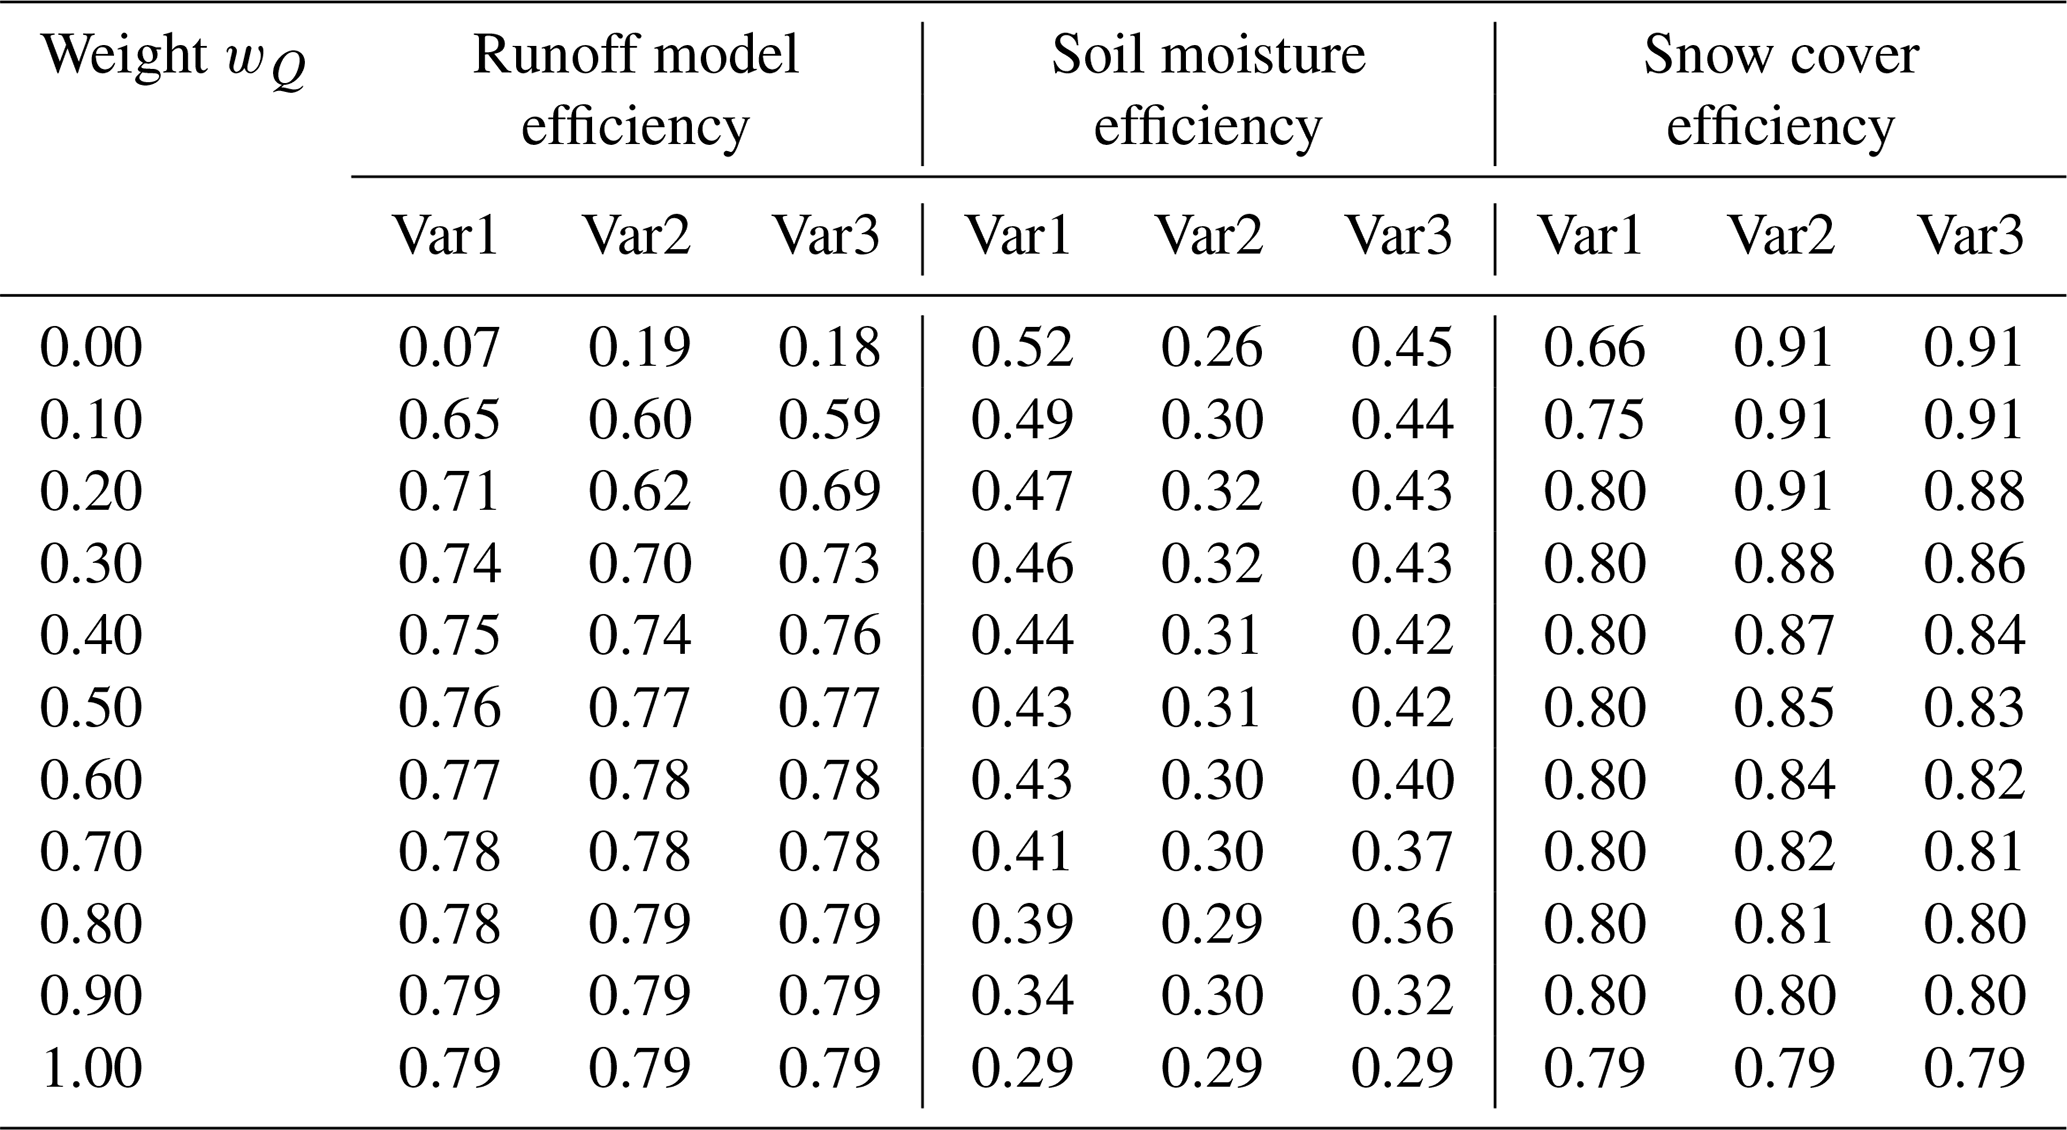
The correlation between ASCAT and simulated soil moisture (Fig. 3b) has a much larger regional variability (i.e., variability between catchments) than the wQ variants. For the SSM and runoff variant, the median correlation increases from 0.29 to 0.52, with decreasing wQ, and the variant using all three variables is similar. For the snow cover and runoff variant, wQ has little effect on soil moisture correlation, and correlation is similar to the runoff-only calibration (wQ=1).
Similar patterns are observed for the snow cover efficiency. The SSM weighting has little effect on the snow cover simulations. The median OSC is between 0.75 and 0.79 for wQ larger than 0.0. The variants that use SSC show increasing performance with decreasing wQ, and the regional variability decreases. For wQ less than 0.5, the median OSC is between 0.84 to 0.91, which is 5 % to 13 % larger than the median for calibration to runoff only (OSC=0.79). These results indicate that the simultaneous use of SSM and SSC in model calibration can improve simulations of soil moisture and snow cover in the calibration period without any significant reduction in runoff model efficiency, particularly for wQ between 0.3 and 0.4.
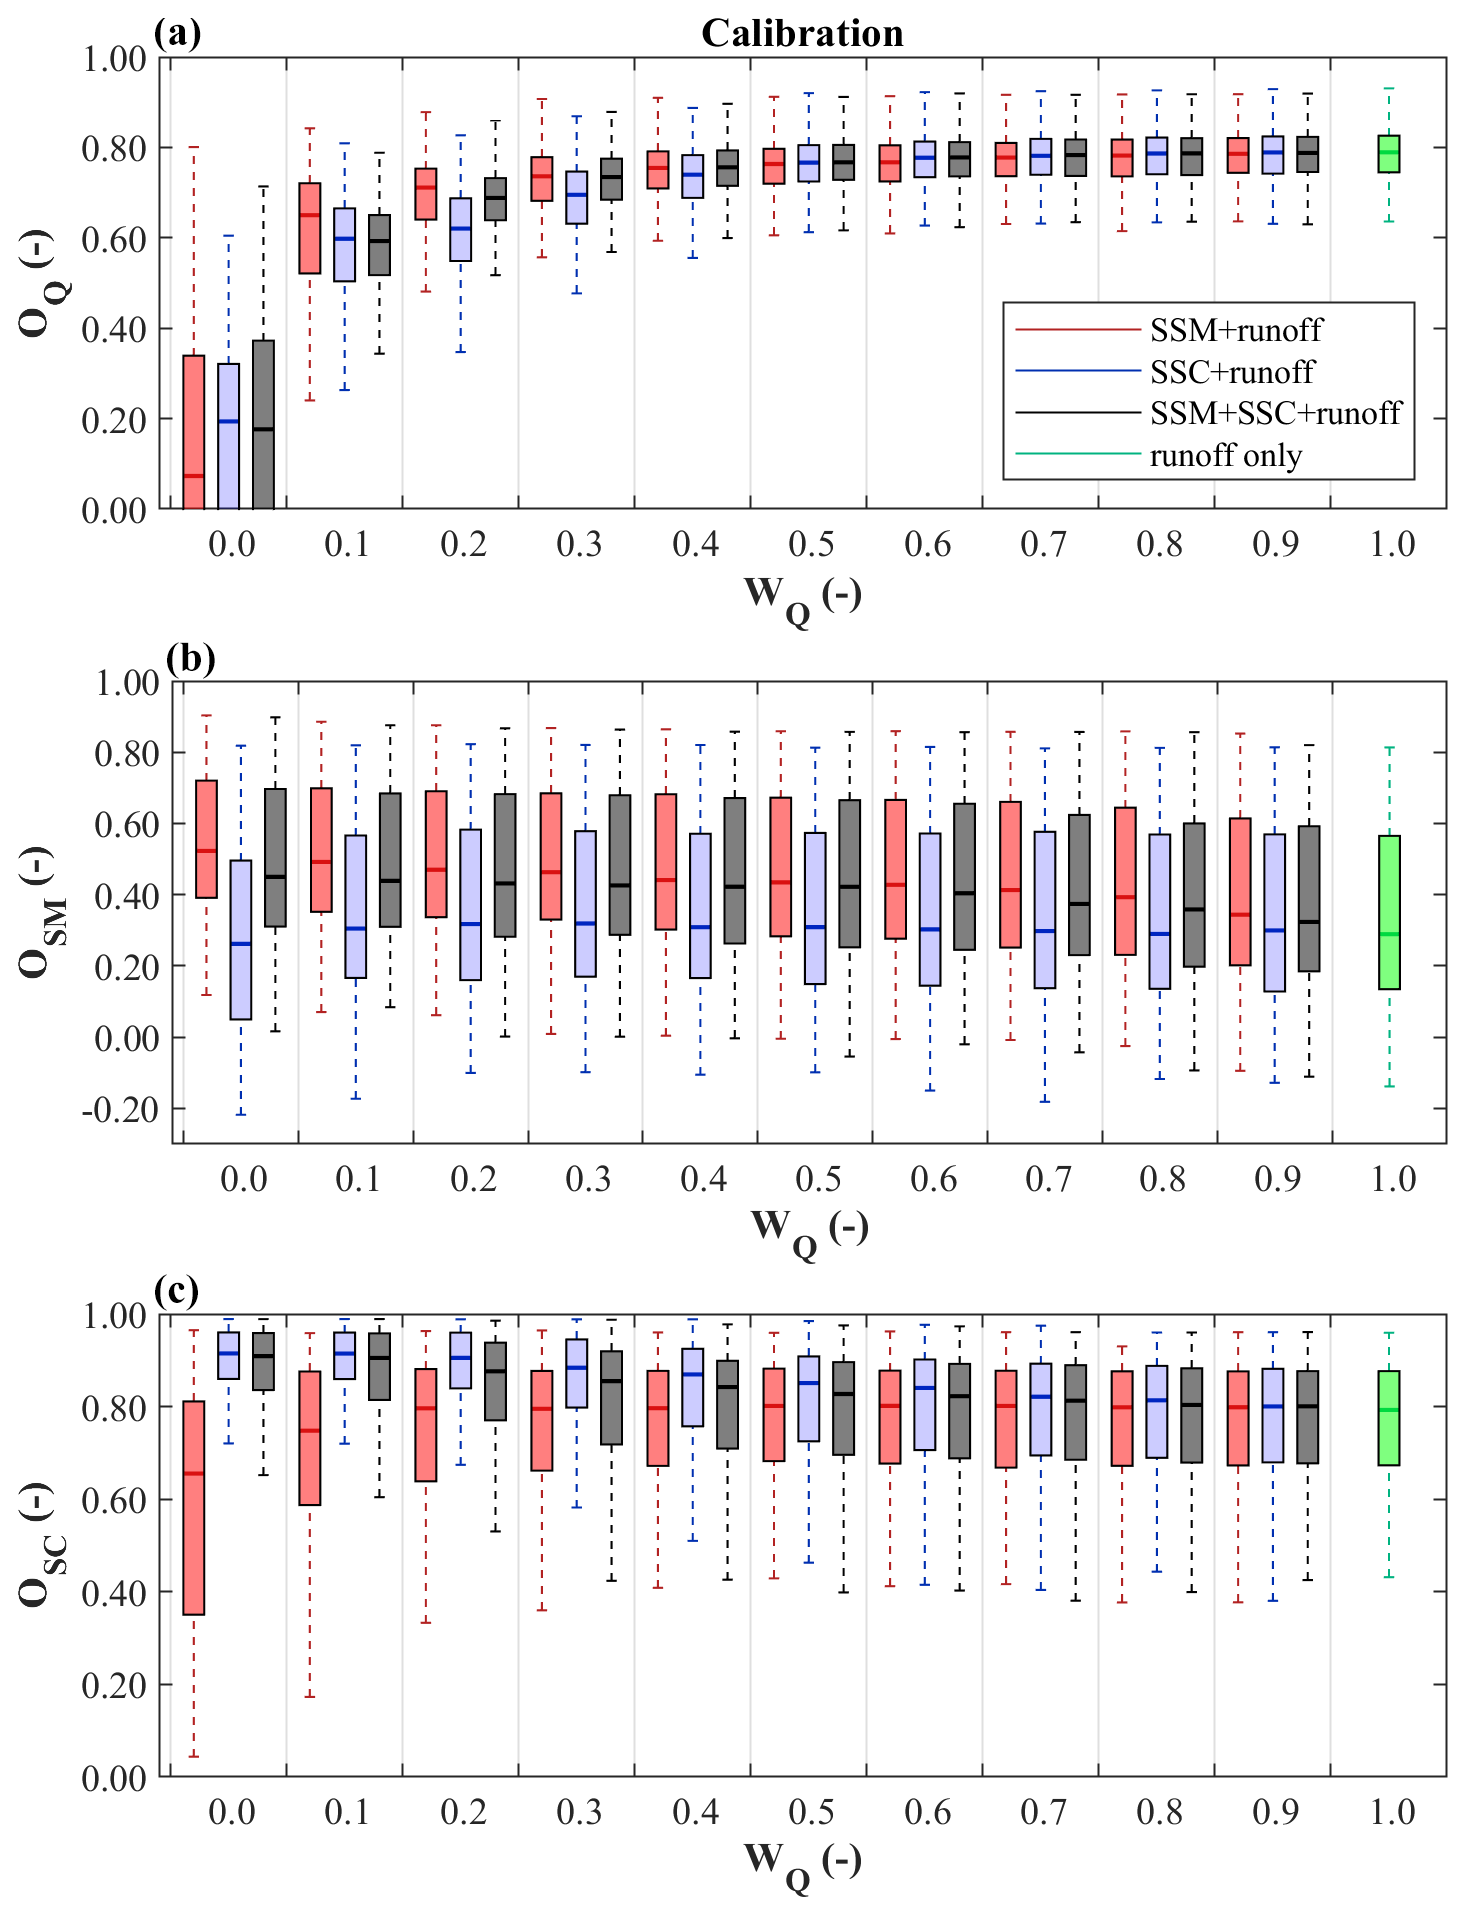
Figure 3Hydrologic model performance for the following three multiple objective calibration variants: calibration to satellite soil moisture and runoff (red boxes), calibration to satellite snow cover and runoff (blue boxes), and calibration to satellite soil moisture, snow cover, and runoff (gray boxes). Panels (a), (b), and (c) show runoff (Eq. 2), soil moisture (Eq. 5), and snow cover (Eq. 6) model efficiency for different weights of the runoff objective wQ in the calibration period 2000–2010, respectively. wQ=1 represents calibration to runoff only. Boxes represent the values from the different catchments, and the size of the boxes represents the spatial variability across the 213 catchments.
The model performance for the validation period (2010–2014) is presented in Fig. 4 and Table 5. The patterns of changing model efficiency with changing wQ are very similar to those in the calibration period. The median of validation runoff model efficiency of the SSM and runoff calibration variant for wQ>0.3 is between 0.71 and 0.73, which is similar or only somewhat smaller to that for calibration to runoff only (wQ=1). The SSC and runoff calibration variant results show a slightly lower runoff model performance for weights wQ<0.3 compared to the other calibration variants. The calibration with all three variables gives practically identical validation efficiencies to the variant with SSM and runoff.
Table 5Median of runoff (Eq. 2), soil moisture (Eq. 5), and snow cover (Eq. 6) model efficiency obtained from the following three multiple objective calibration variants: (1) satellite soil moisture (ASCAT) and runoff (var1), (2) satellite snow cover (MODIS) and runoff (var2), and (3) satellite soil moisture (ASCAT), satellite snow cover (MODIS), and runoff (var3) in 213 catchments in the validation period 2010–2014.
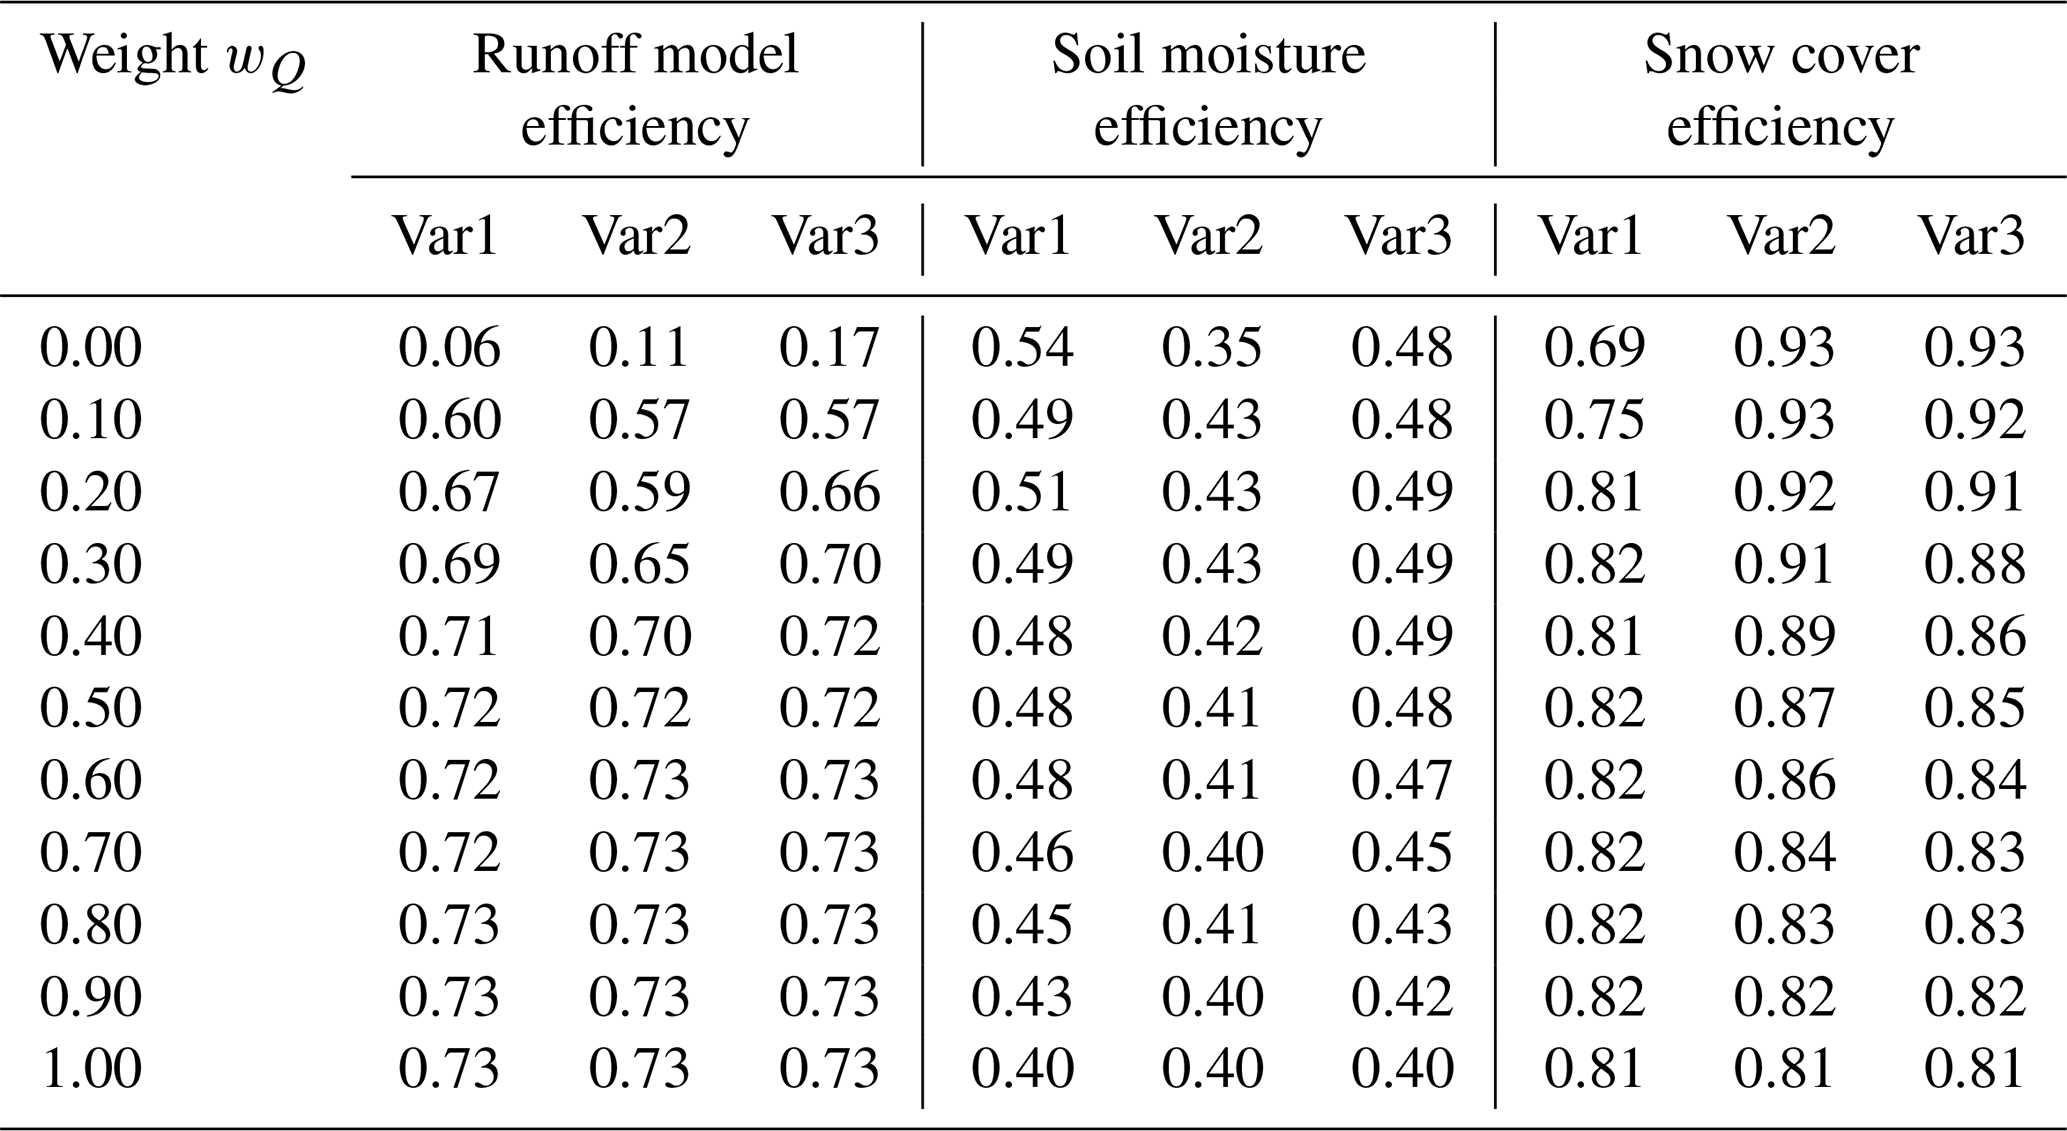
The median soil moisture correlation increases from 0.43 to 0.54, with decreasing wQ, for the SSM and runoff calibration variant and ranges from 0.42 to 0.49 for the variant that uses all variables. The smallest correlations are found for the SSC and runoff variant, where the median of correlation r varies between 0.35 and 0.43. The regional variability in r is, however, much larger for all variants than for the calibration period. The scatter (i.e., difference between 75th and 25th percentiles) in r is around 0.3 for all wQ. For the variants that include SSM, the 75th percentiles vary between 0.60 and 0.68.
The snow cover efficiency for wQ larger than 0.5 is very similar for all three variants. For wQ smaller than 0.5, OSC tends to increase, and the regional variability decreases for the variants involving SSC. The validation OSC is about 2 % larger than that obtained in the calibration period. Similar to the calibration period, the weighting of SSM and runoff has hardly any impact on OSC. Adding SSC data to SSM and runoff improves the snow simulation, particularly for wQ less than 0.4.
It is also interesting to compare the relative performances in the validation period to that in the calibration period. The runoff model performance always decreases when moving from the calibration to the validation period, although the decrease is relatively small, suggesting that there is no overfitting. The soil moisture model performance, in contrast, always increases when moving from the calibration to the validation period. This is likely because, in the case of soil moisture, the calibration period only consists of about 4 years. The snow model performance increases slightly, probably because the proportion of days with temperatures below 0 ∘C for the validation period is 0.21, which is lower than that for the calibration period (0.24), but the precipitation during the days with the air temperature below 0 ∘C does not show obvious changes (2.62 mm d−1 for the calibration and 2.67 mm d−1 for the validation periods).
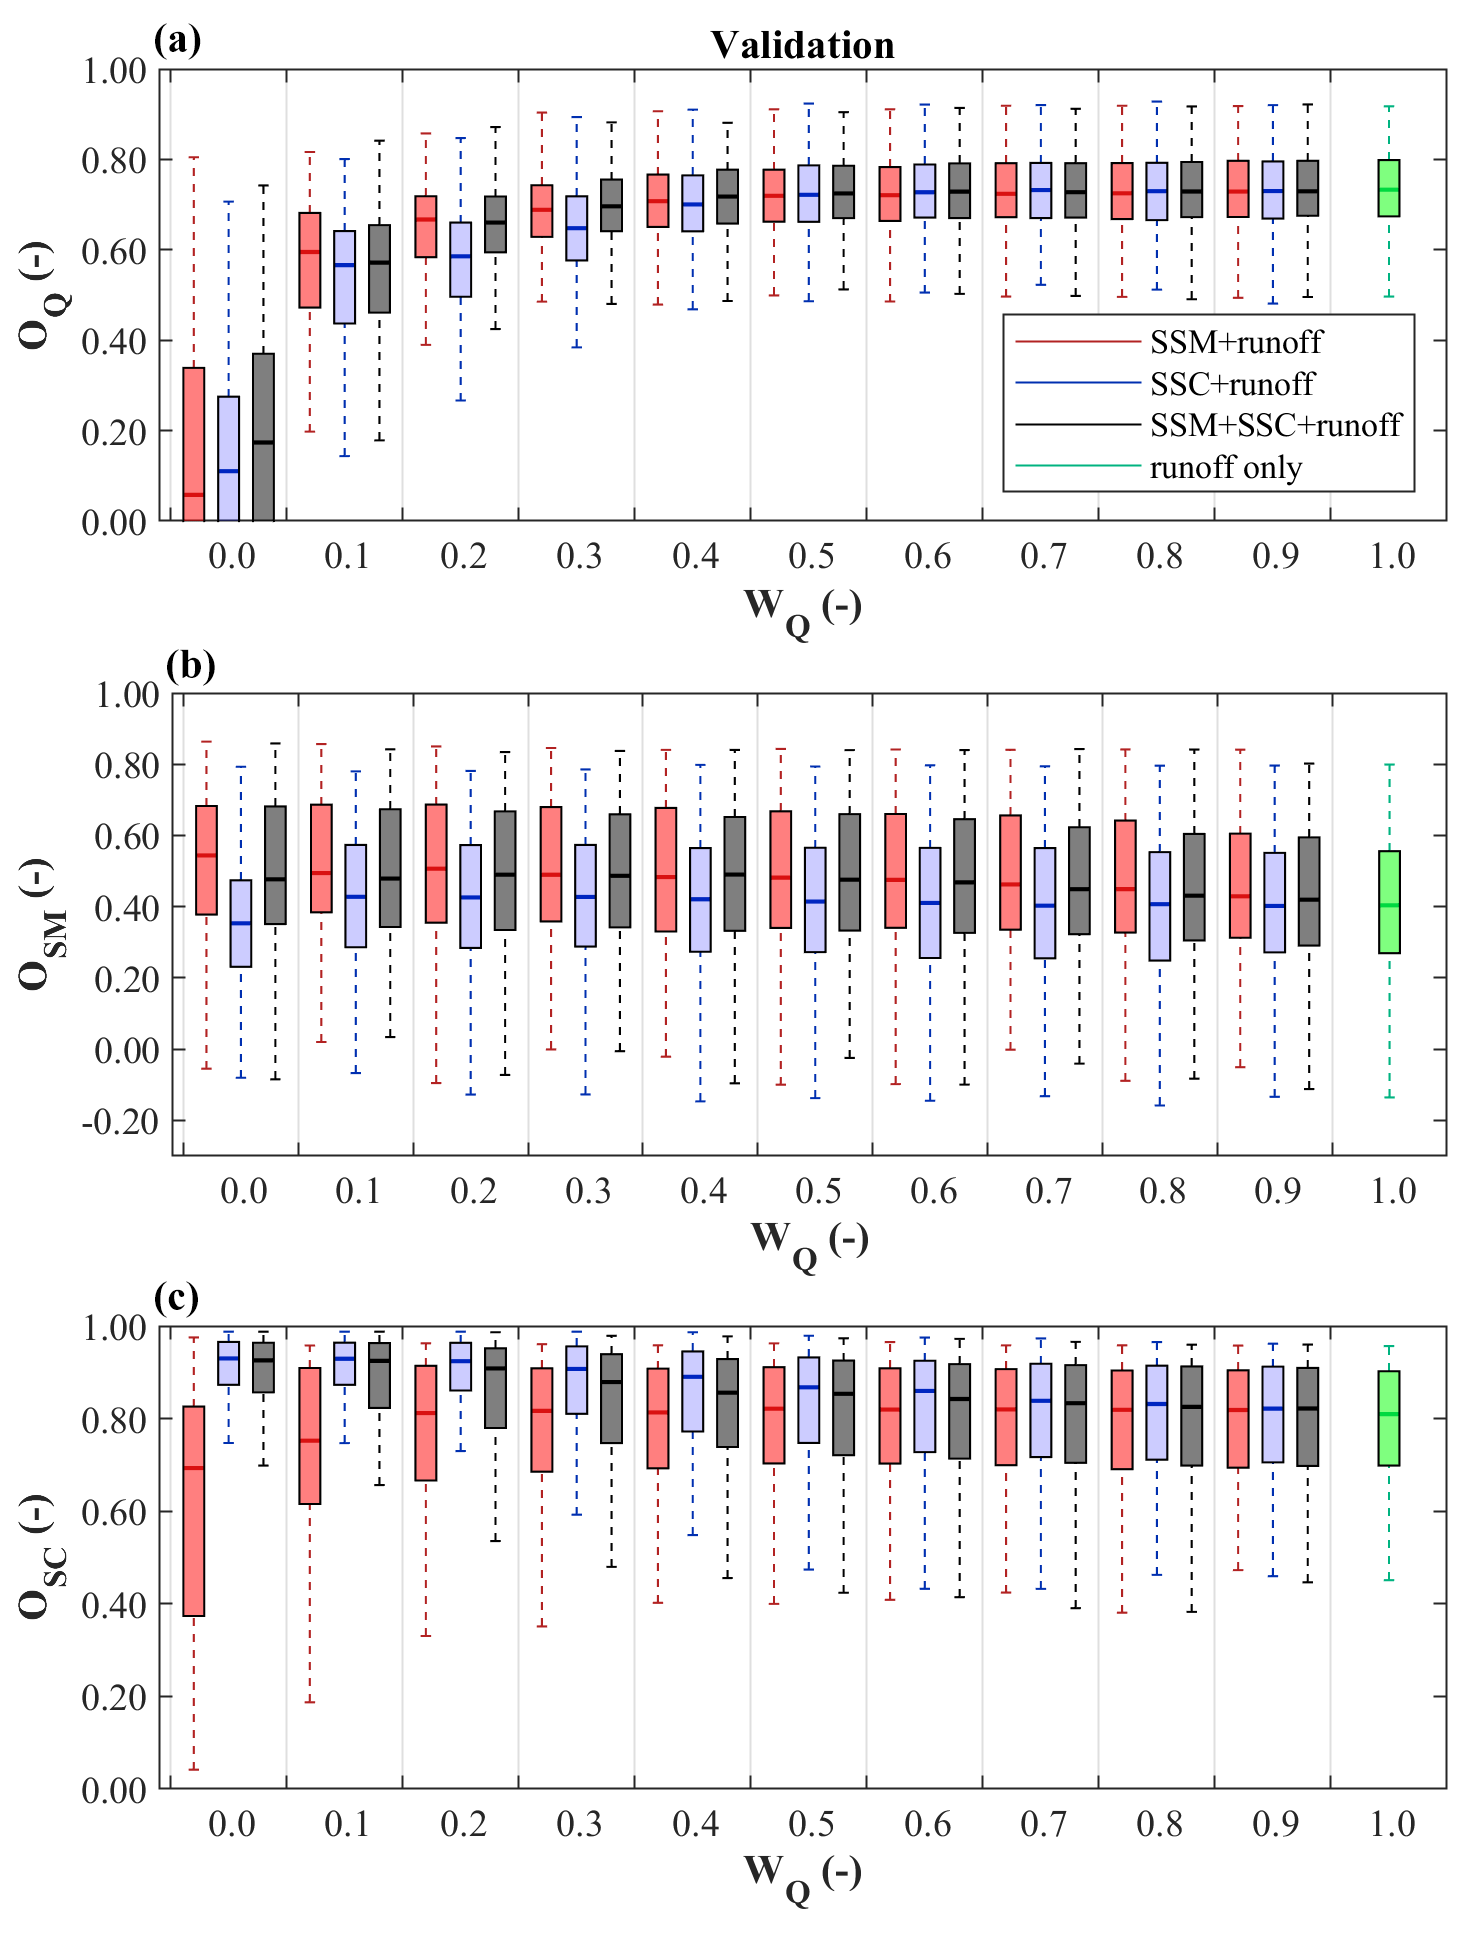
Figure 4Hydrologic model performance for the following three multiple objective calibration variants: calibration to satellite soil moisture and runoff (red boxes), calibration to satellite snow cover and runoff (blue boxes), and calibration to satellite soil moisture, snow cover, and runoff (gray boxes). Panels (a), (b), and (c) show runoff (Eq. 2), soil moisture (Eq. 5), and snow cover (Eq. 6) model efficiency for different weights of the runoff objective in the validation period 2010–2014, respectively. wQ=1 represents calibration to runoff only. Boxes represent the values from the different catchments, and the size of the boxes represents the spatial variability across the 213 catchments.
The correlation (in terms of the Pearson correlation coefficient) between model performance and selected catchment attributes (Table 1) is evaluated in Figs. 5 and 6 in order to understand in which type of catchments SSM and SSC have the most relevant effect on model performance. The runoff model efficiency during the calibration period (Fig. 5a) increases with the increasing mean number of days, with negative air temperatures (MTL0; correlation over 0.57 for wQ larger than 0.4) and mean catchment elevation (MELE; correlation over 0.55 for wQ larger than 0.4), and tends to decrease with increasing catchment mean annual air temperature (MAT; absolute correlation over 0.57 for wQ larger than 0.4). The larger runoff model efficiency in Alpine catchments compared to the lowlands is likely related to the seasonality of snowmelt runoff, which is easier to simulate than the individual, more erratic events in the lowlands (Merz and Blöschl, 2009). The correlation of runoff model efficiency and catchment attributes increases with increasing runoff weight wQ and is not statistically significant or low (i.e., less 0.4) for wQ<0.4 for most of the attributes. The correlations of the catchment attributes with soil moisture and snow efficiencies are not consistently related to runoff weight. Soil moisture efficiency increases with the increasing fraction of agricultural land (AP), where the correlation varies between 0.75 and 0.79 for different wQ. This trend may be explained by the fact that soil moisture can generally be monitored more accurately in a relatively flat, agricultural landscape than in rugged mountainous terrain (Brocca et al., 2013; Parajka et al., 2006), which, in Austria, is furthermore dominantly covered by forests and other dense vegetation impenetrable to the radar and scatterometer signals. Accordingly, we find the soil moisture efficiency tends to decrease with increasing forest cover (FP; correlation varies between −0.35 and −0.49). The active rooting zones are much shallower in agricultural lands, whereas trees root much deeper. Hence, the satellite soil moisture data used in this study which monitored for the top 100 cm soil layer may fit the soil moisture for arable land better. Also, snow model efficiency tends to increase with decreasing MELE and SL (correlation is between −0.52 to −0.89) but increases with increasing MAT (correlations exceed 0.8 for most of the wQ). In the flatlands, snow is less important, so the cumulative number of days with potential snow errors in the objective function is generally lower.
The correlations for the validation period (Fig. 6) have the same pattern as for the calibration period (Fig. 5). The attributes with the largest correlations with runoff efficiency are the same, and correlation tends to increase with increasing wQ as well. The correlation is generally only slightly lower than that estimated in the calibration period. The soil moisture efficiency in the validation period is positively correlated with AP (correlation equals 0.76–0.79) and MAT (correlation equals 0.55–0.68), but the correlation with AP is lower than in the calibration period. The largest negative correlation of soil moisture efficiency and attributions is found for calibration to runoff only (wQ=1) in general and is larger than 0.7 for MELE, catchment elevation range (ER), and standard deviation of MAT and mean daily potential global radiation (SDGR). The snow model efficiency is clearly related to topography, as it increases with decreasing MELE and increasing MAT.
The relationship between model efficiencies and catchment attributes for the other two calibration variants are similar and are presented in Figs. S3–S6. The results show that including snow or soil moisture data in model calibration does not change the correlation between model efficiencies and catchment characteristics. It is obvious that for runoff weight wQ>=0.4 for OQ, wQ>=0.0 for OSM, and wQ>=0.1 for OSC, the correlations between model efficiency and catchment characteristics are similar to those for the runoff-only calibration. The model efficiency is mainly related to topography and certain climate, land cover, and soil attributes, which are, on the other hand, cross-correlated with topography (Fig. S3).
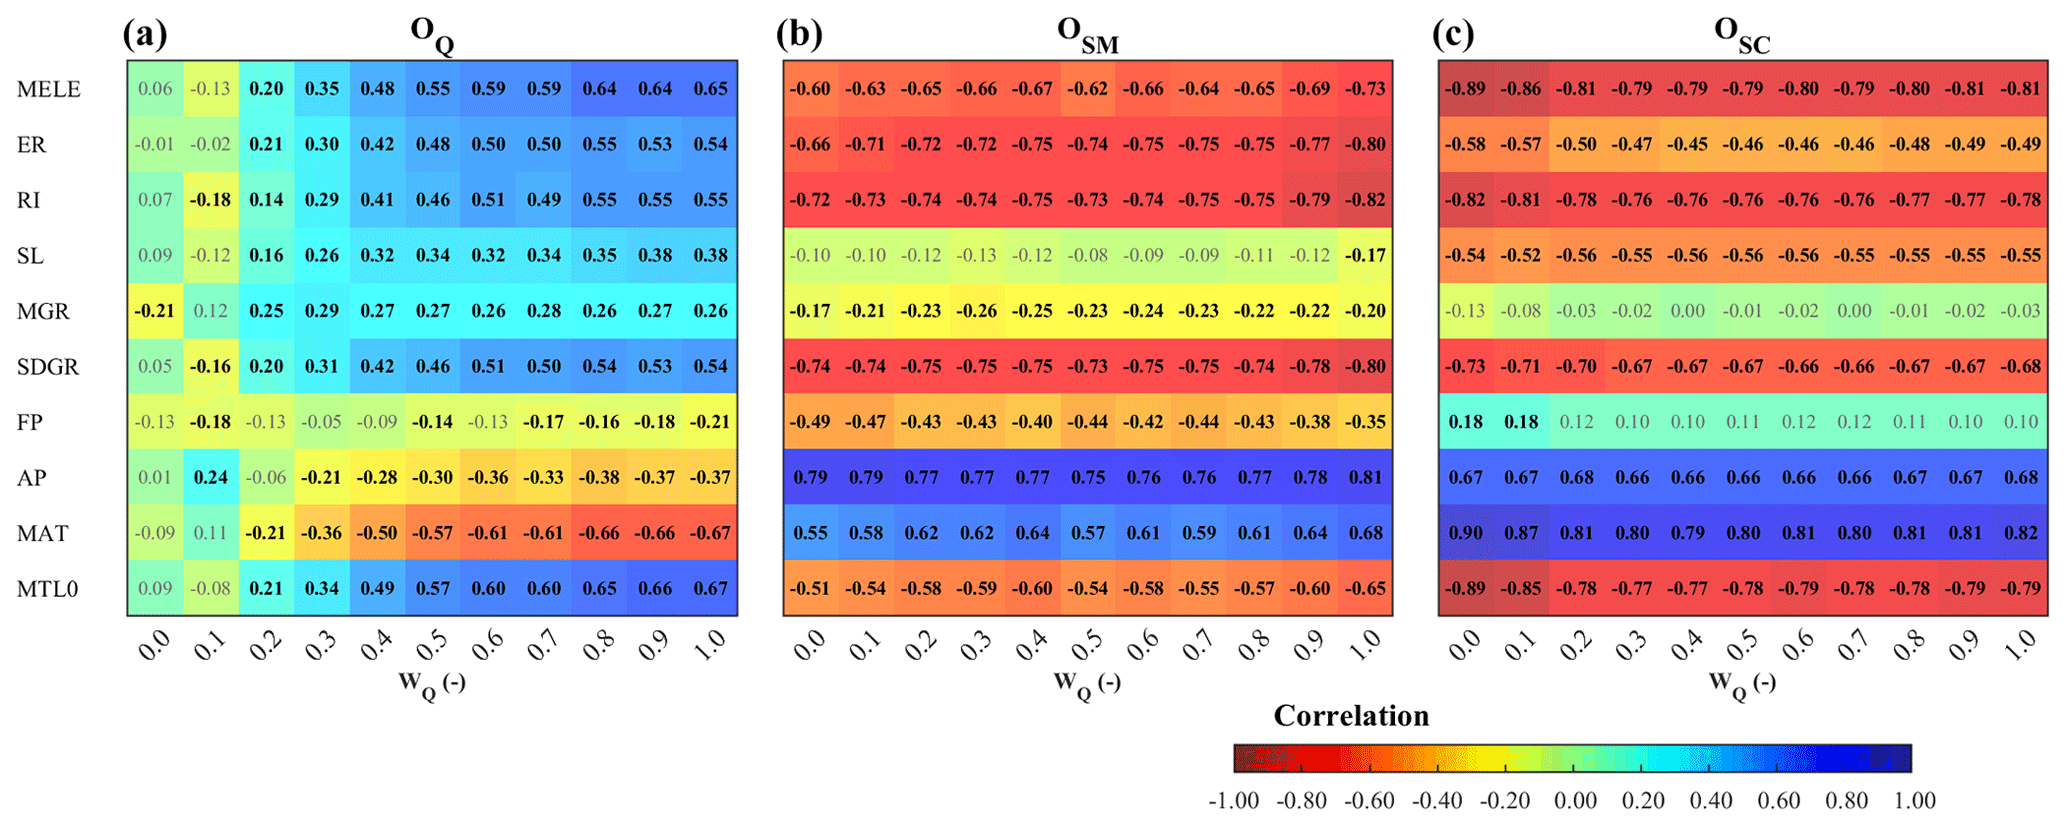
Figure 5Correlation between catchment attributes (Table 1; other attributes can be found in Fig. S1) and model performance, i.e., runoff (Eq. 2; a), soil moisture (Eq. 5; b), and snow cover (Eq. 6; c) obtained from multiple objective calibration to satellite soil moisture (ASCAT), satellite snow cover (MODIS), and runoff (var3 of Table 4; SSM + SCM + runoff) in the calibration period 2000–2010. Cool and warm colors represent positive and negative correlations, respectively. Tex in bold indicates significance with p values lower than 0.05.
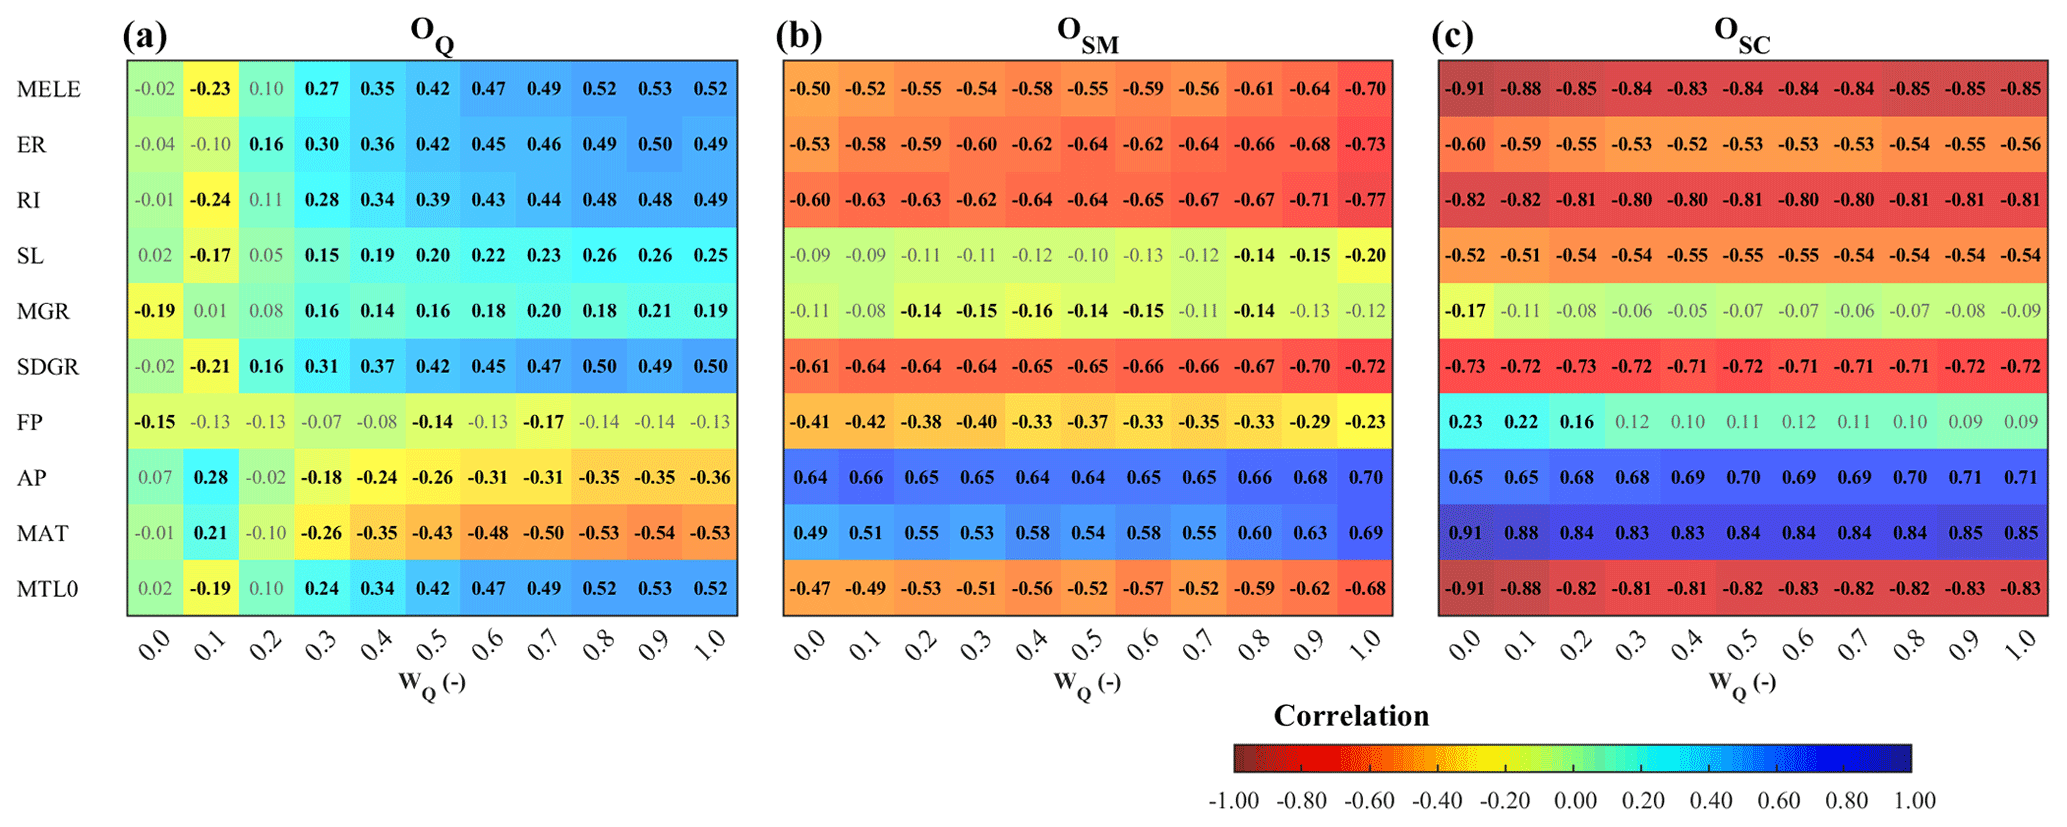
Figure 6Correlation between catchment attributes (Table 1; other attributes can be found in Fig. S2) and model performance, i.e., runoff (Eq. 2; a), soil moisture (Eq. 5; b), and snow cover (Eq. 6; c) obtained from multiple objective calibration to satellite soil moisture (ASCAT), satellite snow cover (MODIS), and runoff (var3 of Table 5; SSM + SCM + runoff) in the validation period 2010–2014. Cool and warm colors represent positive and negative correlations, respectively. Text in bold print indicates significance with p values lower than 0.05.
4.2 Variability in calibrated model parameter values
Figure 7 compares the medians of the model parameters for all catchments obtained with the three multiple calibration variants grouped by snow, soil, runoff generation, and runoff routing parameters in the columns from left to right. The snow-related parameters (Fig. 7; left column) are similar for the two calibration variants that use satellite snow cover. In contrast, the variant that uses soil moisture and runoff tends to have different values, particularly for the threshold temperature parameters (Tr, Ts, and meltT). The medians of the snow correction (SCF) and melt (DDF) factors tend to be similar in all three variants if wQ>0.4.
The soil-related parameters (Fig. 7; middle column) show similar patterns. The variants that use satellite soil moisture in model calibration have more similar soil model parameter values than the one that uses only SSC and runoff. This suggests that adding soil moisture satellite data in model calibration affects the soil-related parameters strongly, and adding snow and soil moisture satellite data is complementary as they influence both snow and soil-moisture-related parameters. The similarity of the variant using all three variables with those variants where, alternatively, SSC and SSM are left out suggests that SSC is more important for the snow-related parameters, and SSM is more important for the soil-related parameters, as would be expected. Increasing the runoff weight tends to decrease the difference between the calibration variants of the snow-related and the soil-related parameters. The runoff-generation-related parameters (Fig. 7; right column) tend to be more similar for the two variants that use SSC, and the runoff-routing-related parameters (Fig. 7; right column) are always rather similar.
In the next step, the model parameters obtained by multiple objective calibration are compared with those obtained by traditional calibration to runoff only (Fig. 8). The figure shows that the similarity between model parameters decreases with decreasing wQ.
Snow-related parameters calibrated using SSC (Fig. 8b; top five lines) deviate quickly from those using runoff only as wQ decreases. Similarly, the soil-related parameters calibrated using SSM (Fig. 8a; lines 6–8 from top) deviate quickly from their counterparts based only on runoff calibration. The difference in the similarity or correlation between multiple objective calibration variants and runoff-only calibration is smaller for runoff-generation parameters. The runoff-routing model parameters seem to be not very sensitive to selected model efficiencies, and the correlation between model parameters is very small.
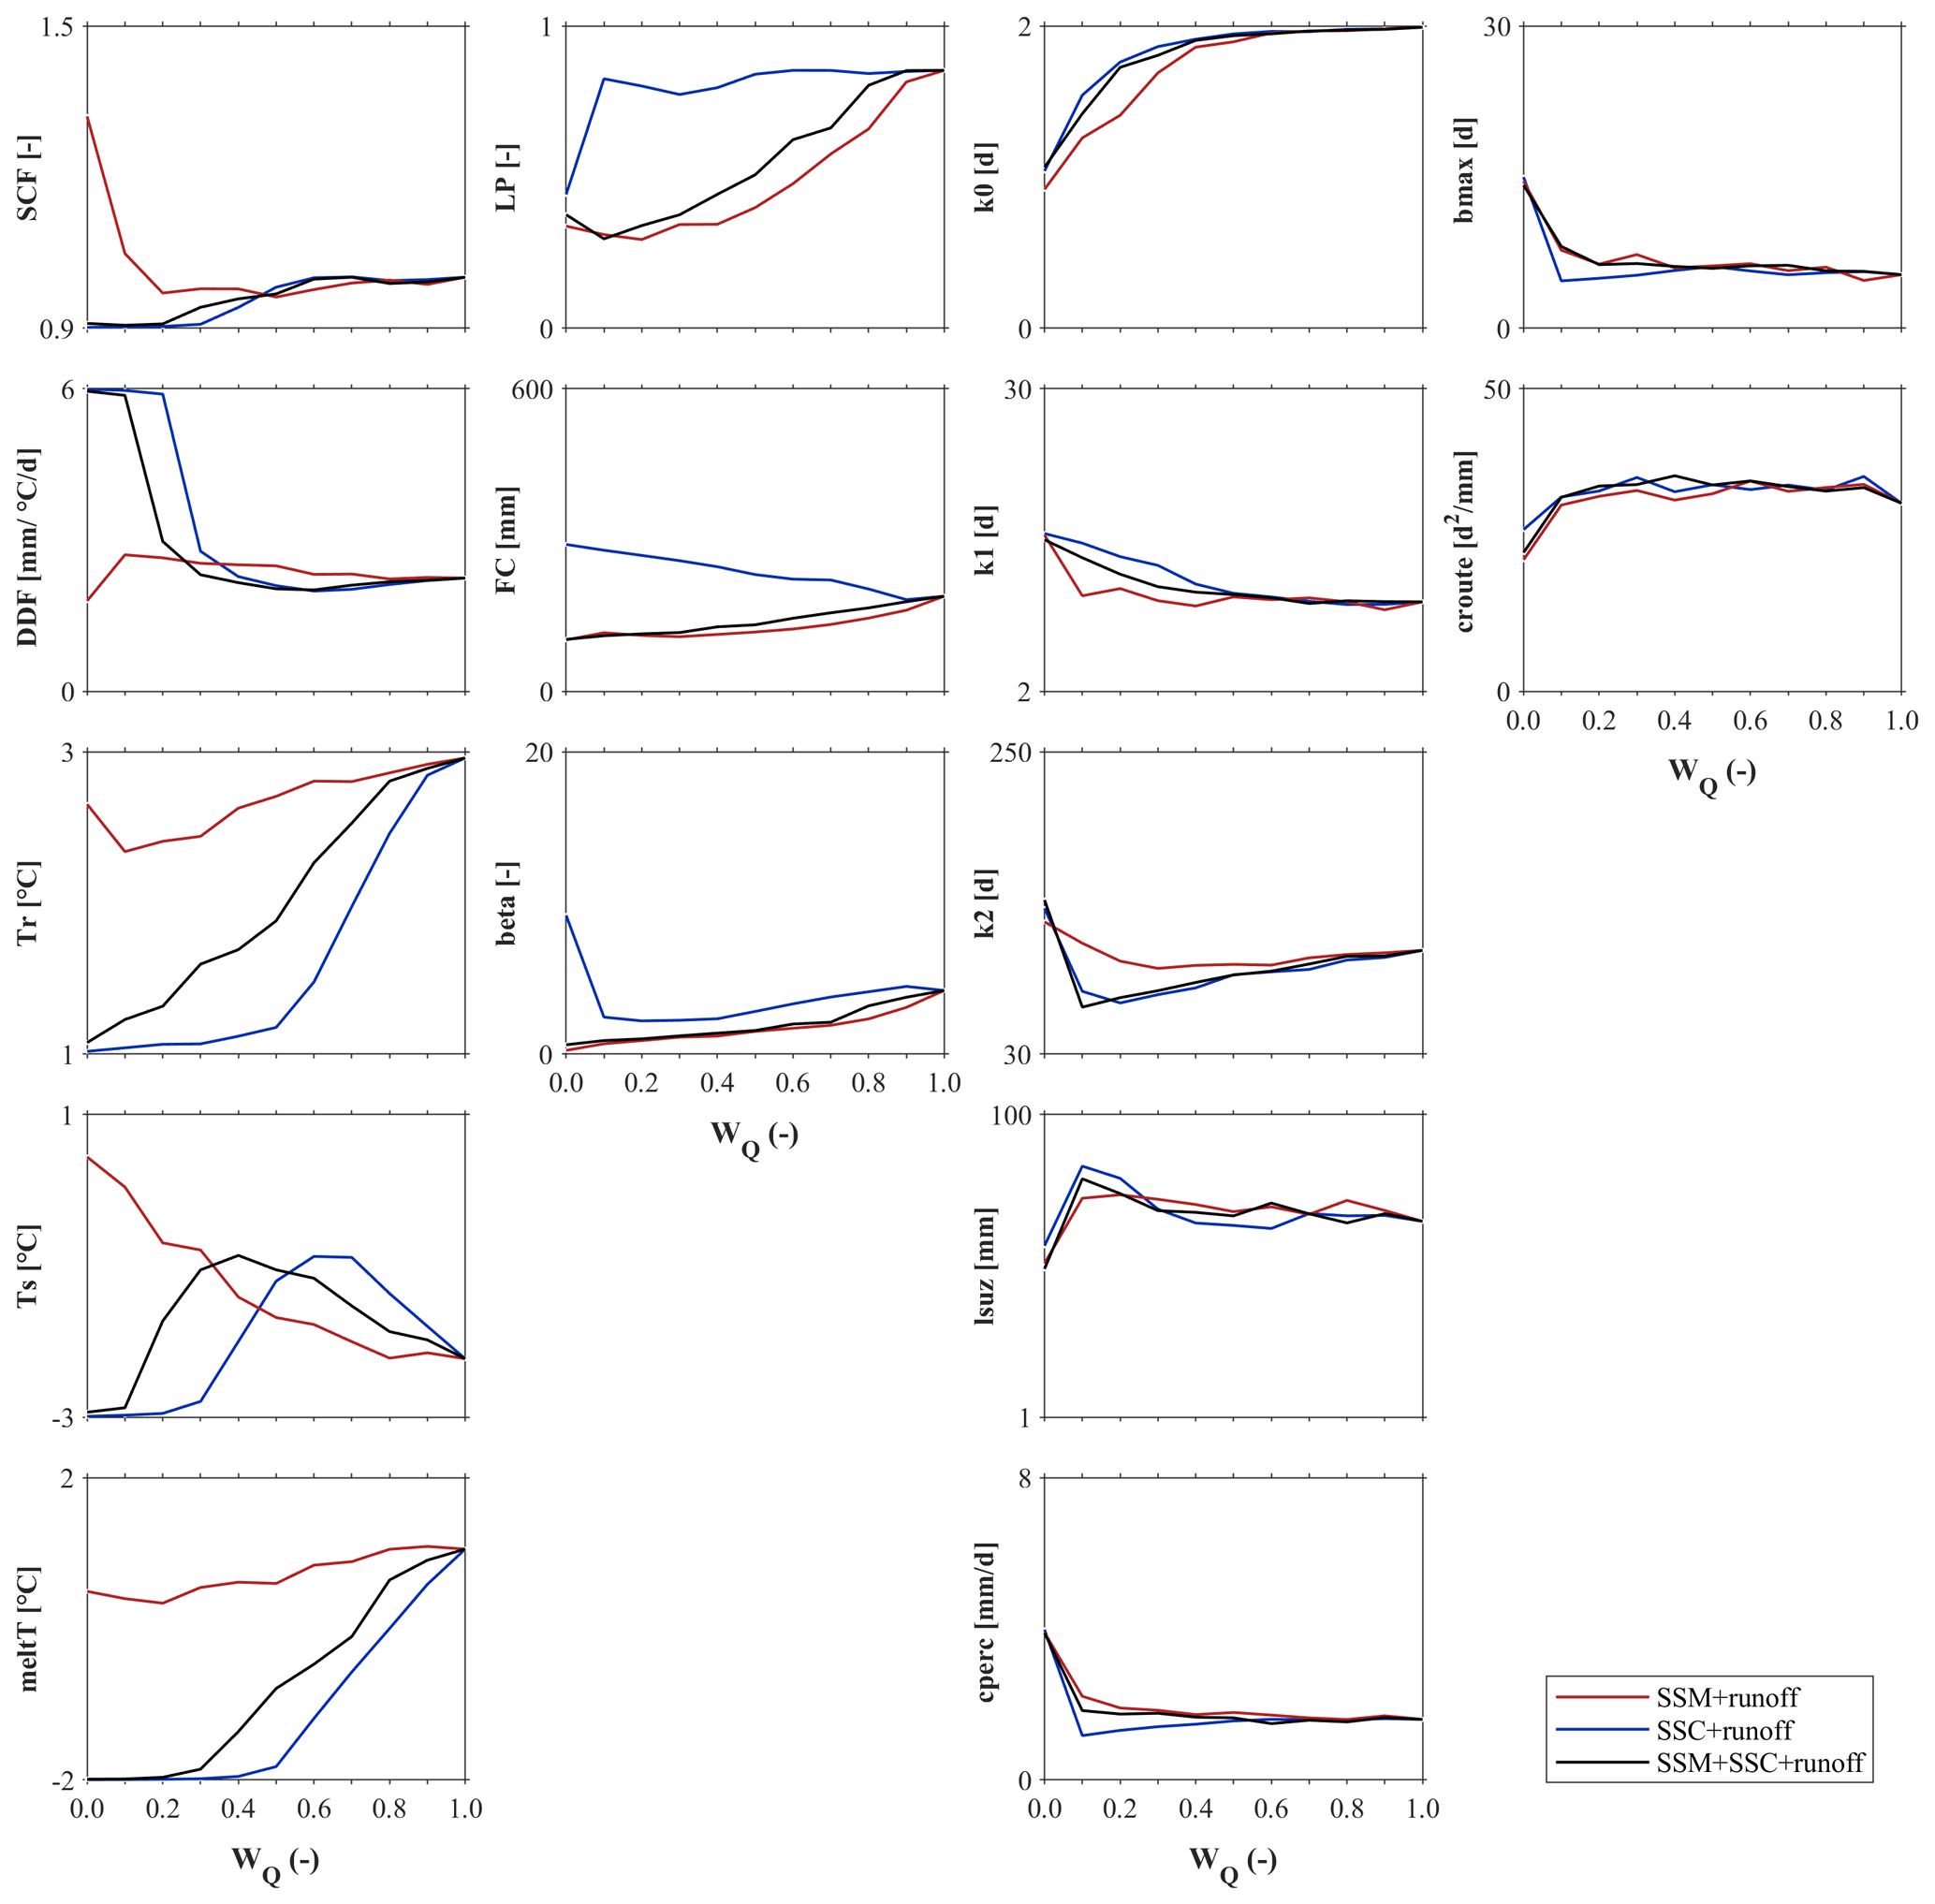
Figure 7Medians of the parameter values from the three multiple objective calibration variants (lines) and different runoff weights wQ (Table 3). Red, blue, and gray lines represent the calibration variants using soil moisture and runoff, snow cover and runoff, and soil moisture, snow cover data, and runoff, respectively. Lines represent the median of the 213 Austrian catchments.
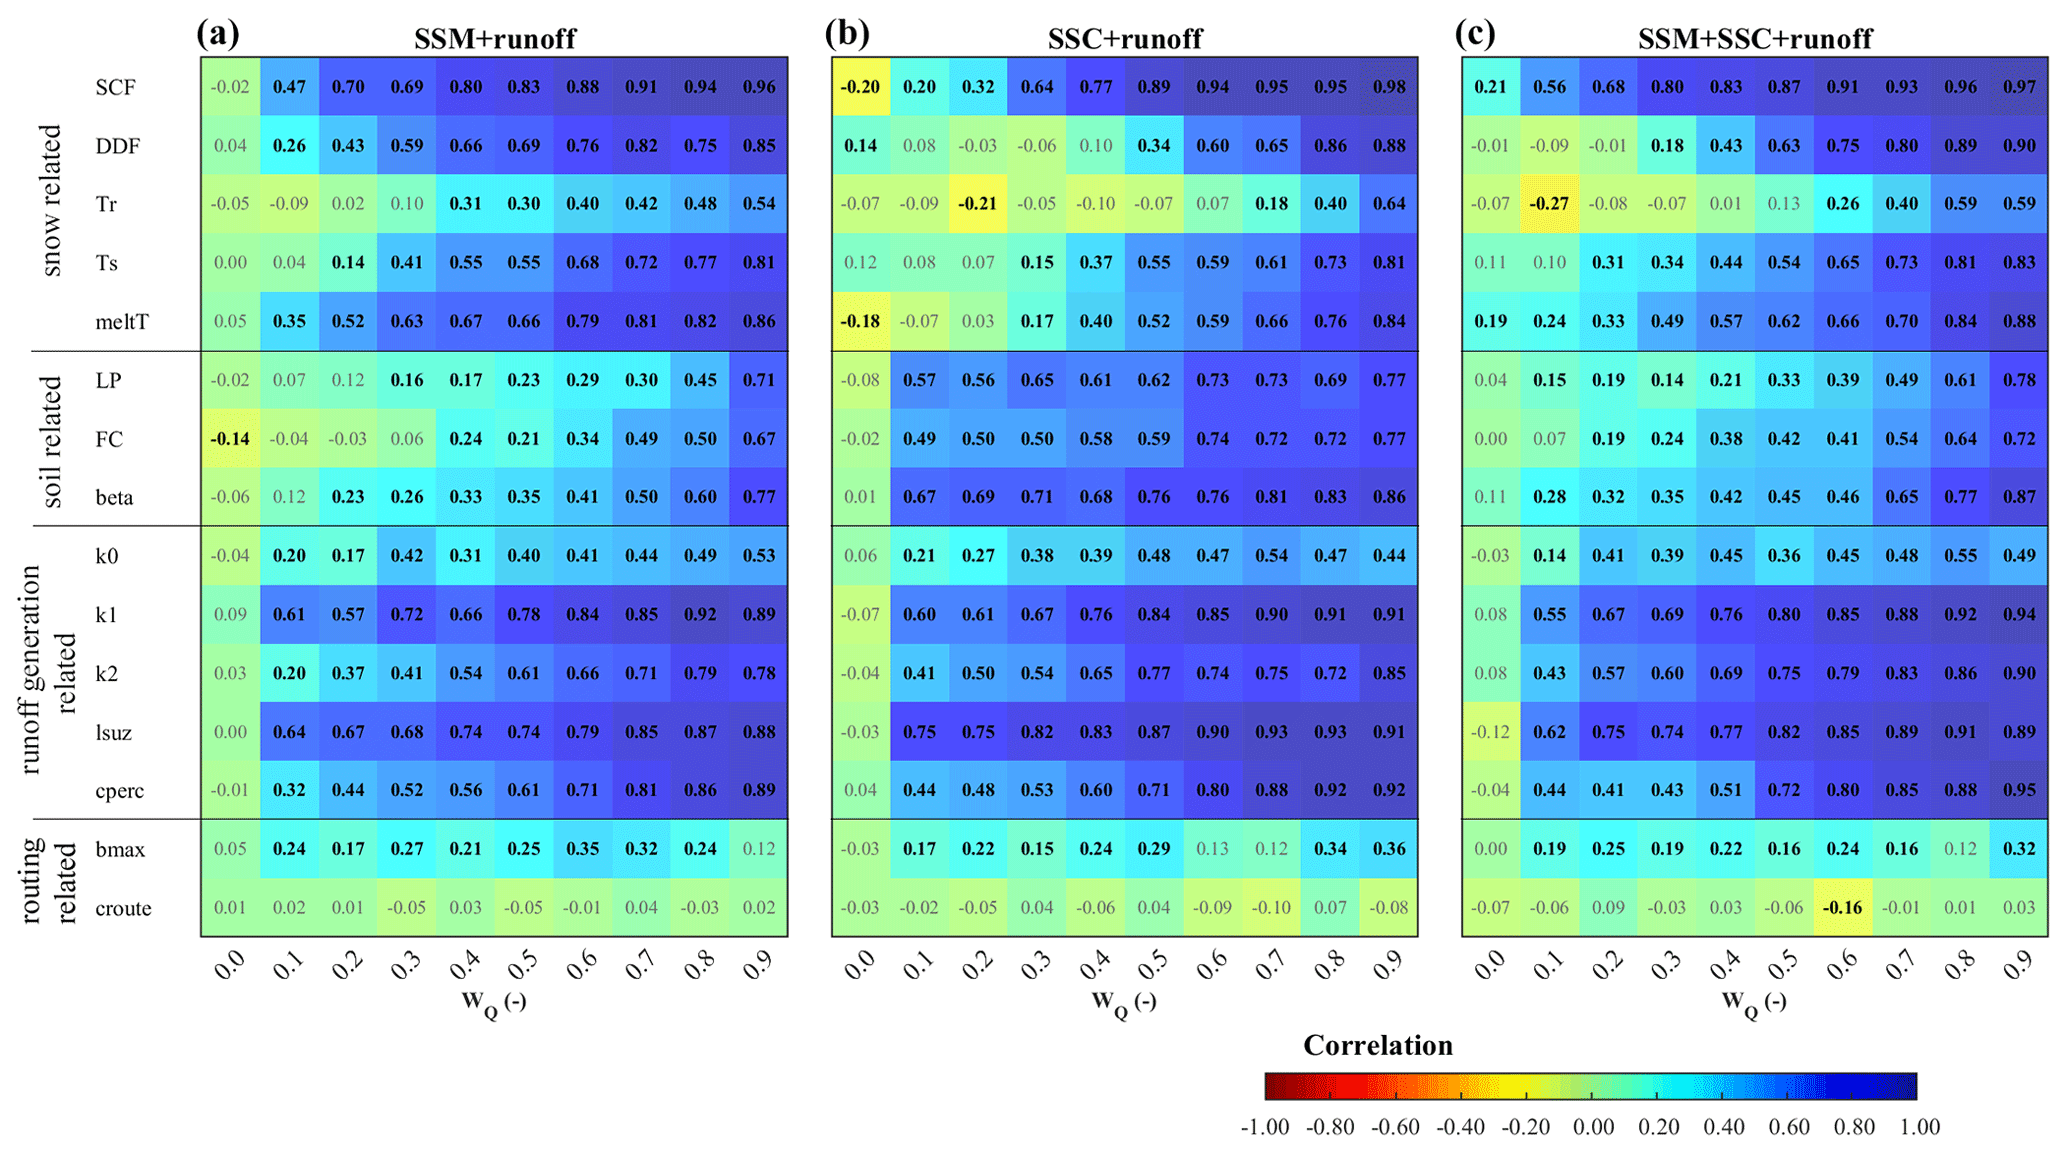
Figure 8Correlation of parameter values from three multiple objective calibration variants (runoff weights – wQ=0.0 to 0.9; Table 3) with those from traditional calibration to runoff only (wQ=1.0). Panels (a), (b), and (c) represent calibration variants using soil moisture and runoff, snow cover and runoff, and all three variables, respectively (var1, var2, and var3 of Tables 4 and 5). Cool and warm colors represent positive and negative correlations, respectively. Text in bold indicates significance with p values lower than 0.05.
4.3 Comparison of multiple objective and runoff only calibration efficiencies
The relative difference between the model efficiency of the three multiple objective variants and that based on calibration to runoff only is presented in Fig. 9. The runoff model efficiency of multiple objective calibration tends to be slightly lower than the traditional calibration to runoff only. The median of difference in runoff model efficiency of the two variants that use SSM in model calibration is less than 3.2 % for wQ larger than 0.3 in both calibration and validation periods. The multiple objective calibration to SSC and runoff has a somewhat larger median of difference for wQ between 0.2 and 0.4, but for larger wQ, the median is almost identical with that of the other multiple objective variants. The integration of soil moisture in model calibration improves the correlation of satellite and simulated soil moisture. The median improvement for wQ<0.6 is larger than 30 % and 15 % in the calibration and validation periods, respectively. The calibration to all variables has a median relative improvement of about 3 % to 35 % lower than the calibration to SSM and runoff in the calibration period but is very similar in the validation period. The calibration to SSM and runoff does not improve snow cover simulations, but the use of all variables improves the snow model efficiency. For wQ less than 0.5, the median improvement is larger than 5 % in both calibration and validation periods.
Given that the median runoff efficiency is not improved by the addition of soil moisture and snow data (Fig. 9), it is of interest to see how the changes are distributed in space. Figure 10 shows that, in up to 40 % of catchments, the validation runoff efficiency is improved by using multiple objective calibration as compared to calibration to runoff alone. The number of catchments with runoff improvements increases with increasing runoff weight. The flip side, of course, is that in the remaining catchments the runoff model efficiency deteriorates. The calibration variants that use SSM data improve soil moisture simulations in more than 80 % of the catchments for all weights, and the addition of snow data does not change the performance. The snow model efficiency is vastly improved by the inclusion of the SSC data for wQ<0.6 in almost all catchments, and the inclusion of soil moisture (in the variant that uses all variables) still has a very big improvement in snow simulations as compared to the case when only runoff is used in the calibration.
Overall, there are two important messages. The inclusion of soil moisture data in the calibration mainly improves the soil moisture simulations, the inclusion of snow data in the calibration mainly improves the snow simulations, and including both of them improves both soil moisture and snow simulations to a similar extent. Second, when comparing the panels of Fig. 10, one sees that the snow data are more efficient at improving snow simulations than the soil moisture data are at improving soil moisture simulations.
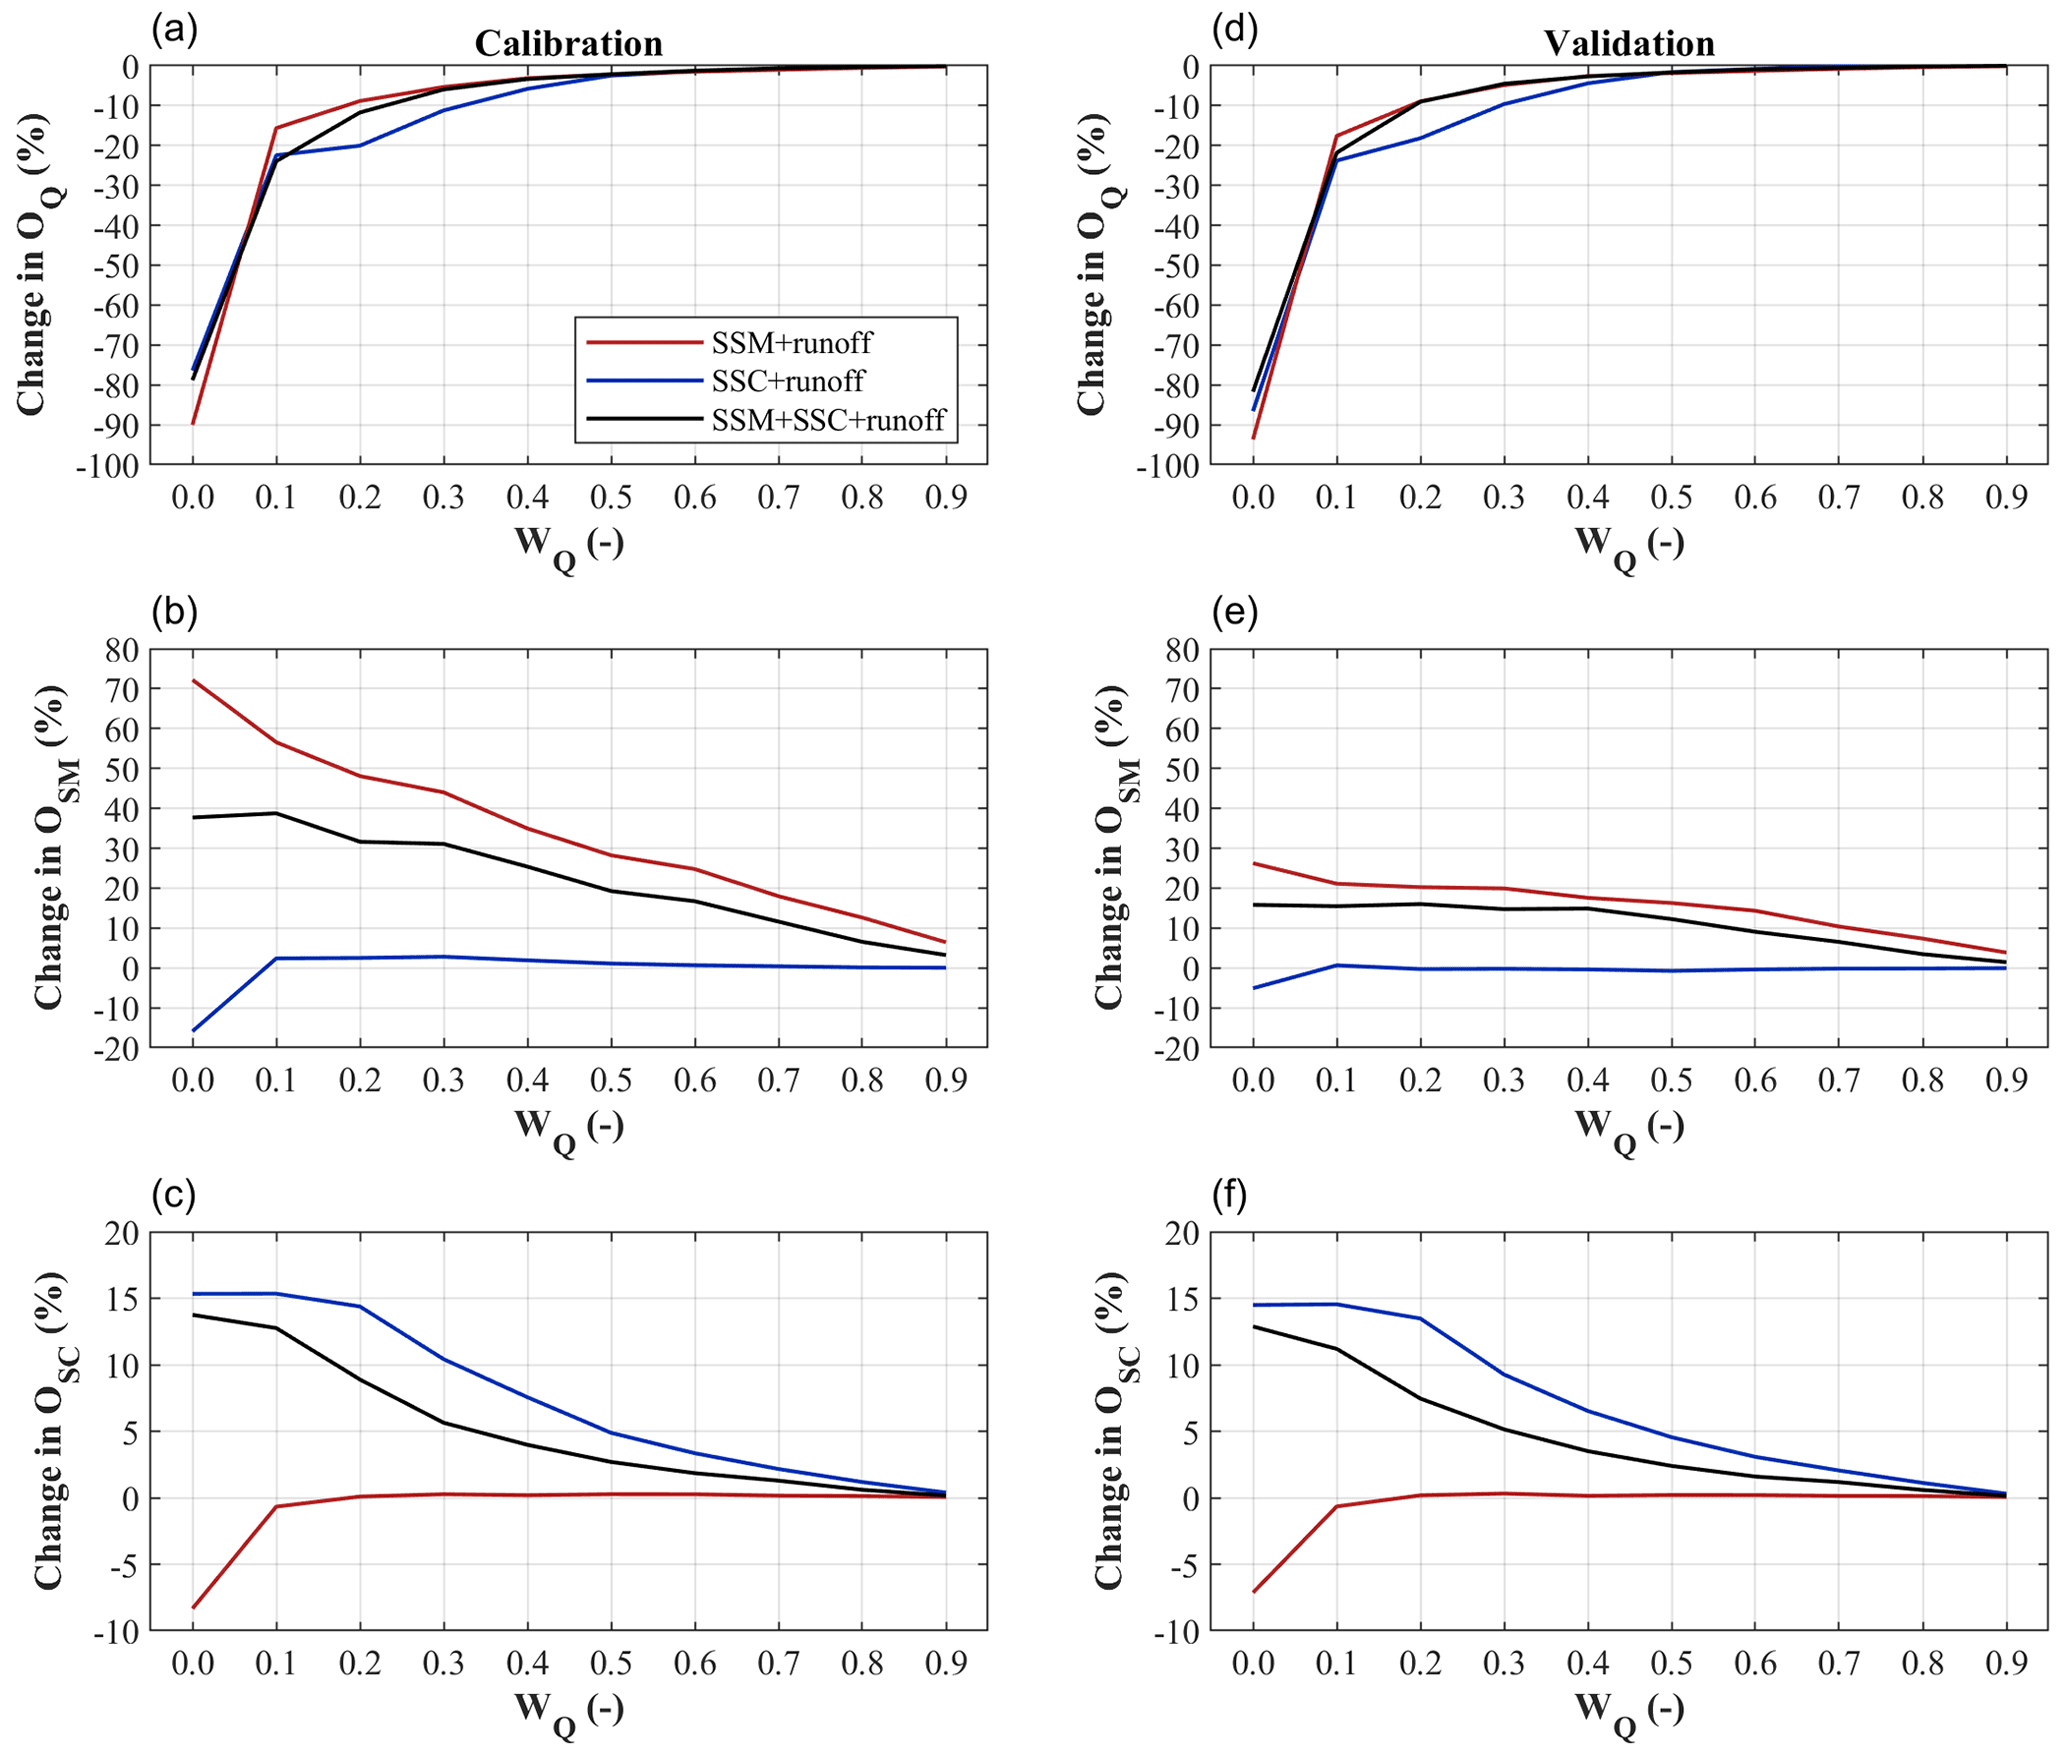
Figure 9Relative difference in model efficiency (OQ – runoff model efficiency; OSM – soil moisture model efficiency; OSC – snow model efficiency) of three multiple objective calibration variants (lines), using different runoff weights wQ (Table 3) compared to traditional calibration to runoff only (wQ=1). Red, blue, and gray lines represent calibration variants using soil moisture and runoff, snow cover and runoff, and soil moisture, snow cover, and runoff, respectively. Lines represent the median of the 213 Austrian catchments. Panels (a, d), (b, e), and (c, f) refer to runoff, soil moisture, and snow cover efficiencies in the calibration (a–c) and validation (d–f) periods, respectively.
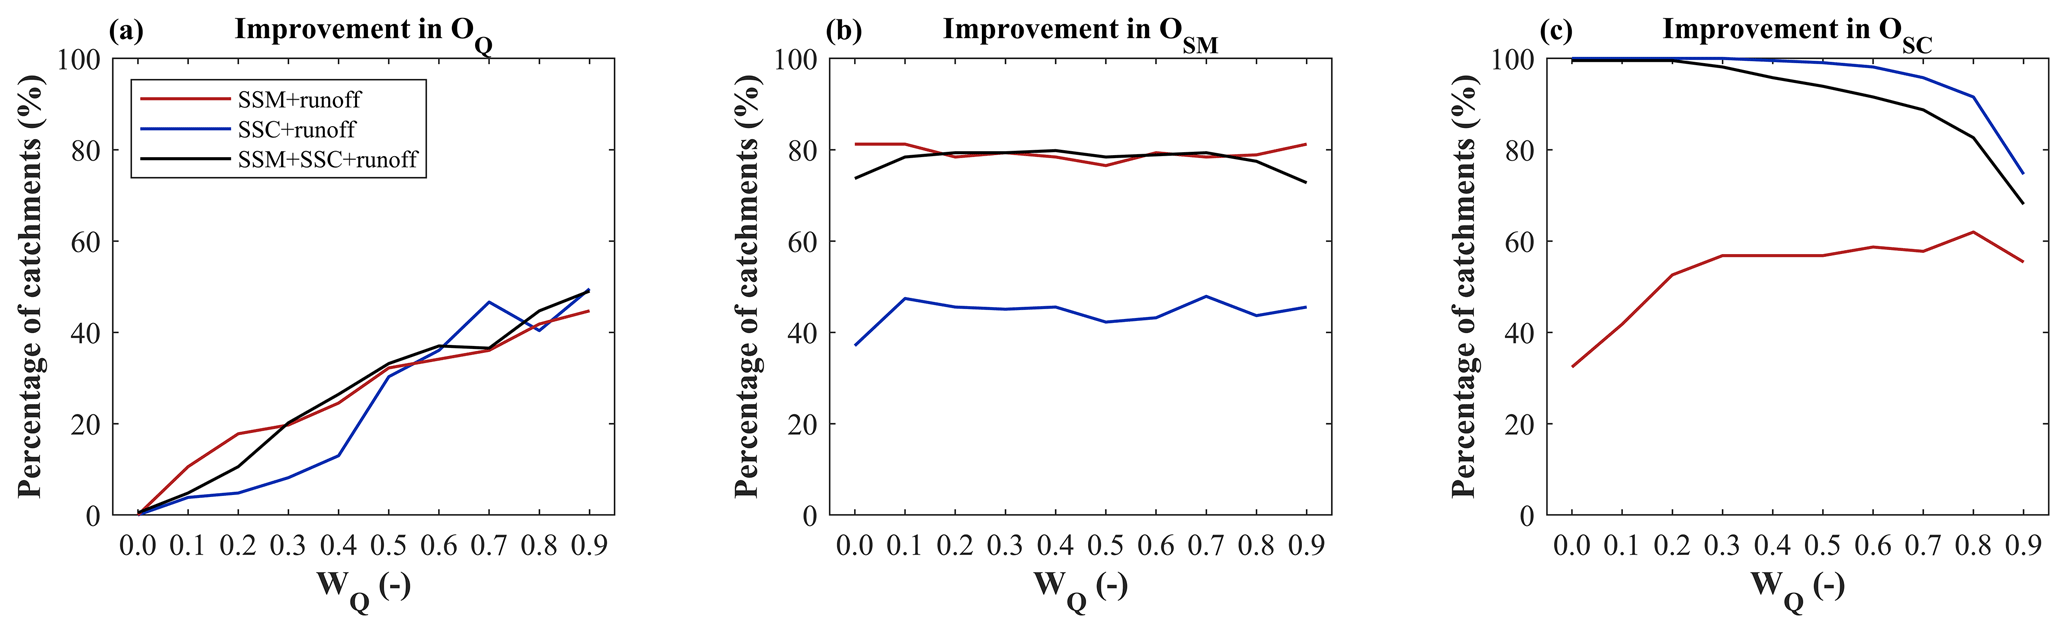
Figure 10Relative number of catchments with improvement in runoff (a), soil moisture (b), and snow cover (c) model efficiency in the validation period. Relative number relates to the 213 Austrian catchments used in this study.
Table 6Kolmogorov–Smirnov p values testing the similarity of the distribution of catchment attributes across the 213 catchments between those catchments where the runoff model efficiency is improved in the validation period by the inclusion of the soil moisture and snow data in the calibration and those catchments where this is not the case. The null hypothesis that the two samples were drawn from the same distribution is rejected if the p value is less than the significance level (shown in bold).
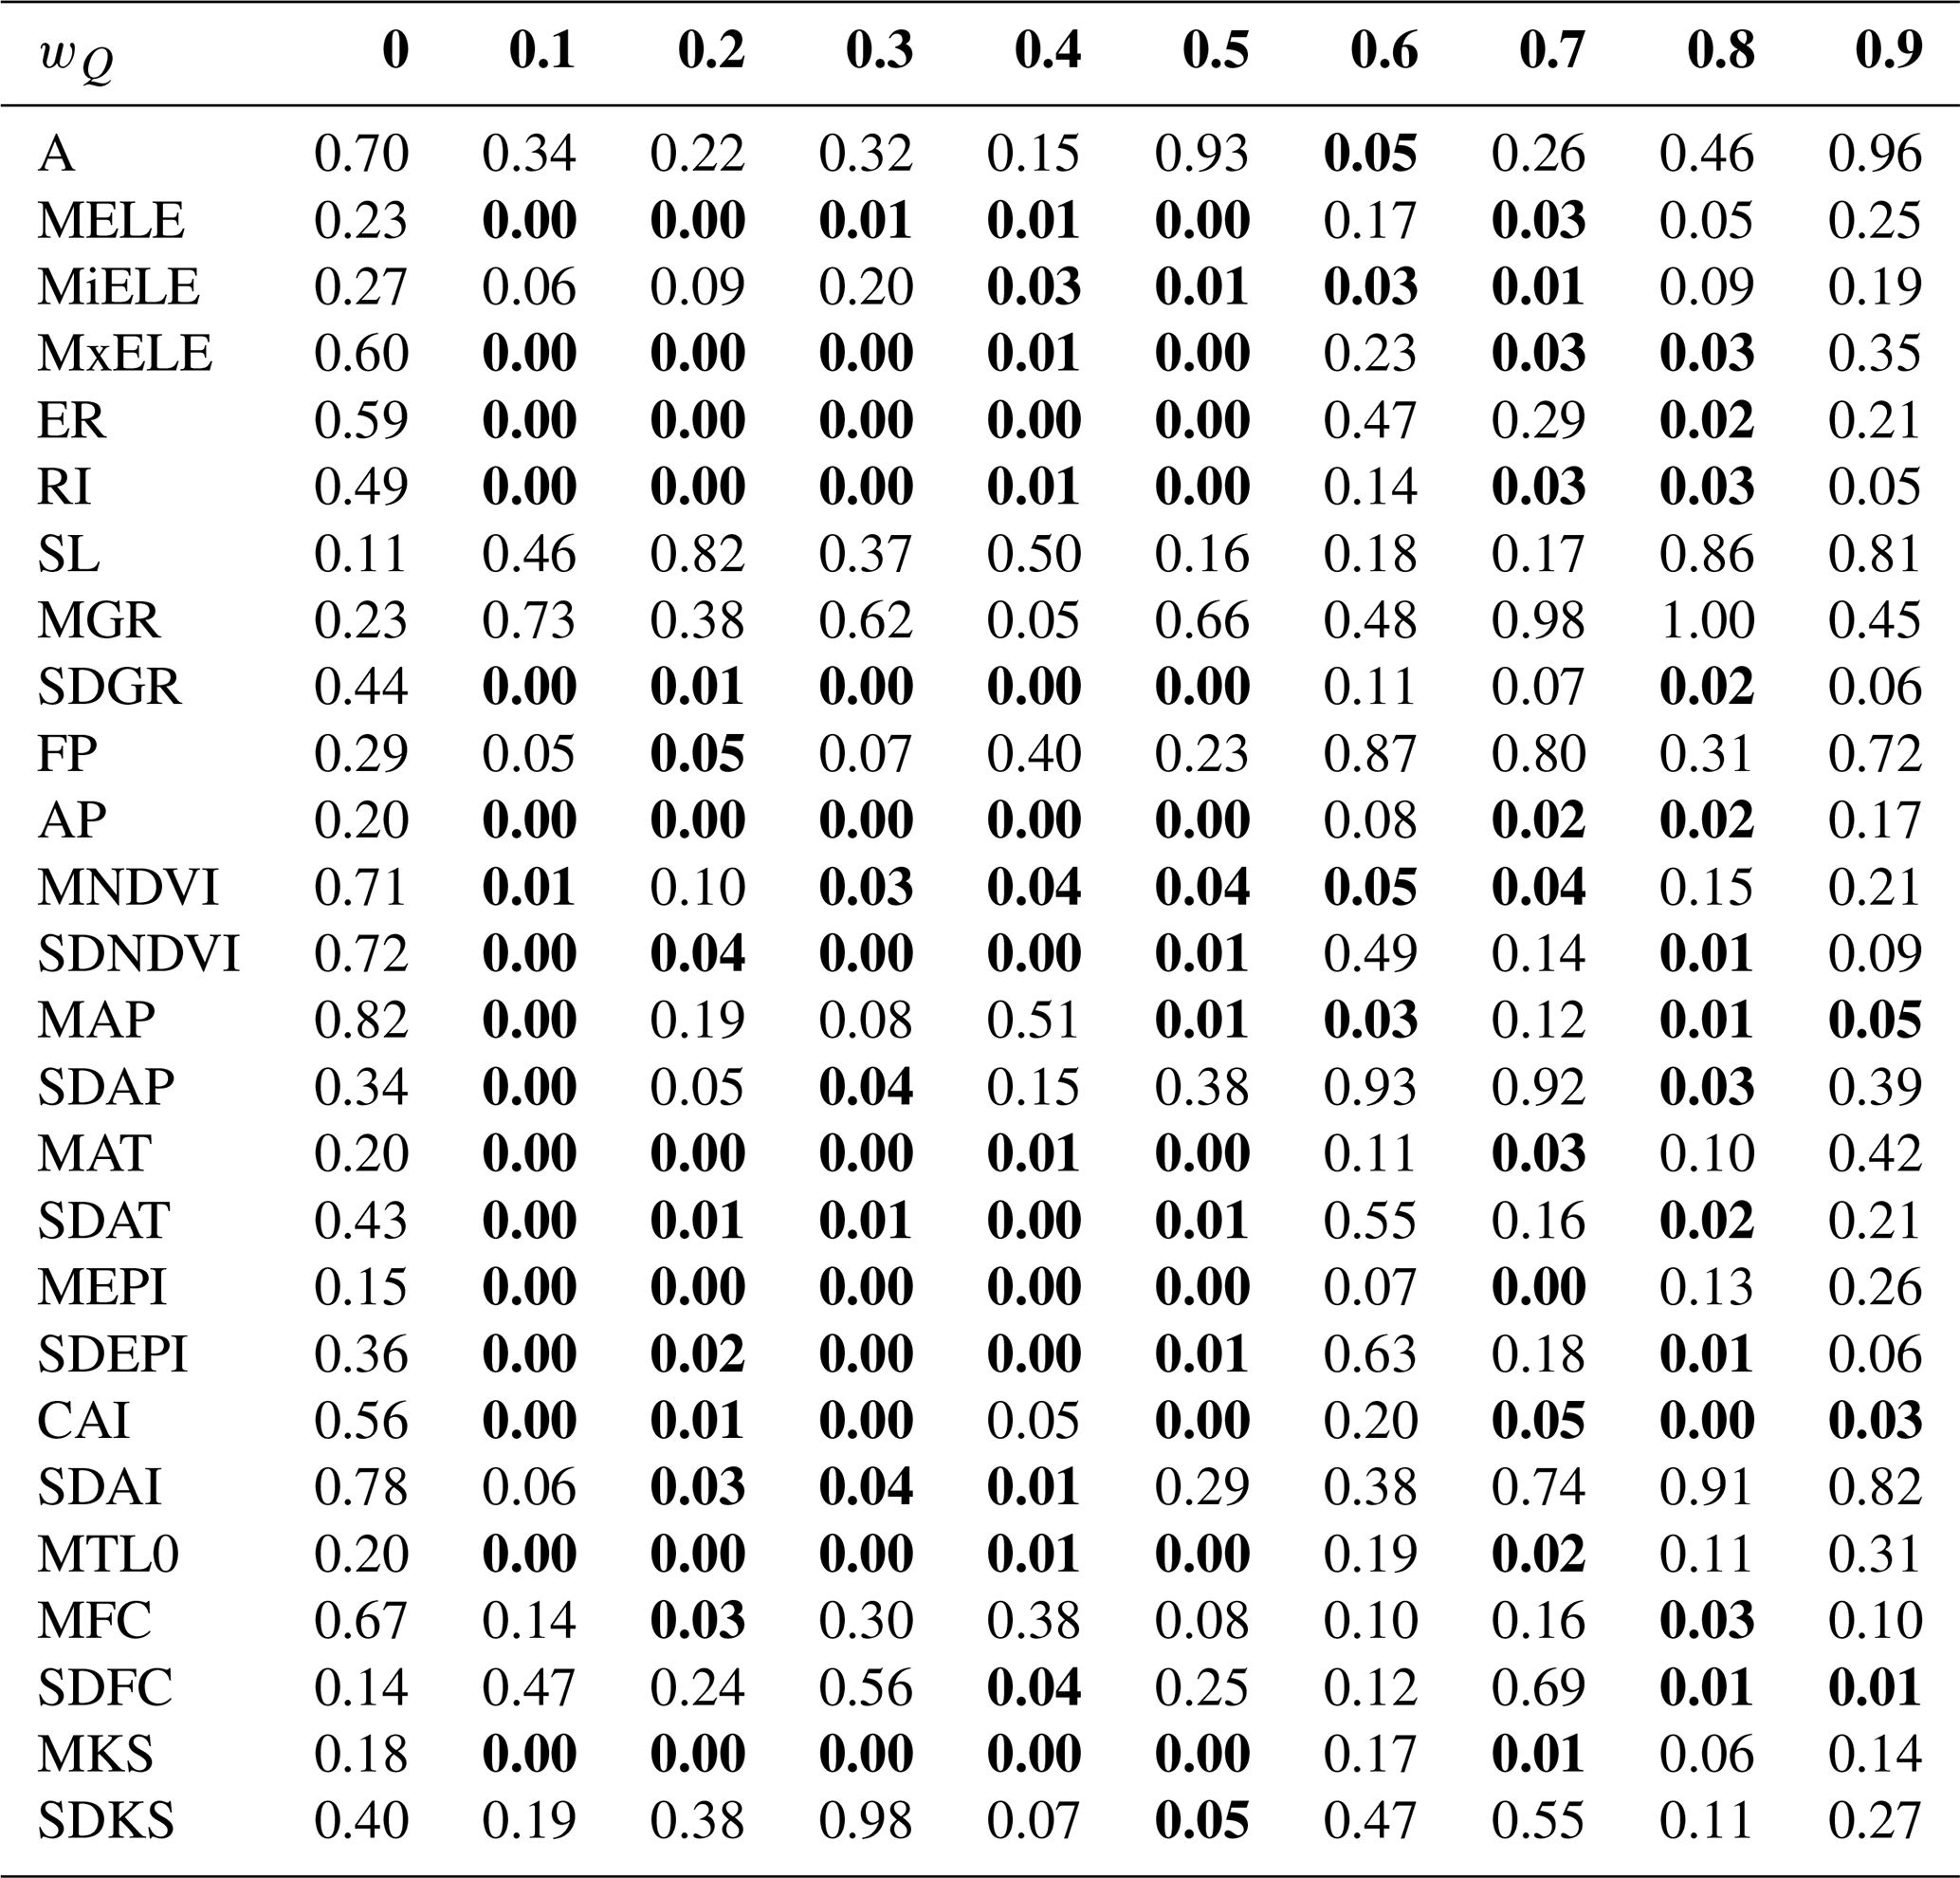
It is now of interest to see whether the catchments for which the runoff and soil moisture model efficiencies are improved by the inclusion of SSC and SSM data (Fig. 10) are different from those for which this is not the case. The distribution of the catchment attributes of these two catchment groups are therefore compared with the Kolmogorov–Smirnov (KS) two sample test. Since the snow model efficiency is improved in almost all study catchments, it is not analyzed here. Tables 6 and 7 show the p values of the KS for the runoff and soil moisture model efficiencies, respectively, indicating statistically significant differences between the catchment groups in many cases. For catchments with a large frequency of runoff improvements (e.g., for wQ=0.7 and 0.8) there are a number of differentiating factors including those related to topography (mean catchment elevation and mean catchment slope), proportion of agricultural land, mean annual air temperature, number of days with negative air temperature, and mean saturated hydraulic conductivity. An example of differences between the groups in terms of mean catchment elevation (MELE) and percentage of arable land (AP) is presented in Fig. S7. The results indicate that improvement in runoff is observed in catchments with lower mean catchment elevation and a larger proportion of agricultural land. The other catchment attributes with statistically significant differences are correlated with MELE, so they have similar differences in the distributions to those presented in Fig. S7.
Table 7Same as Table 6 but for the soil moisture model efficiency.
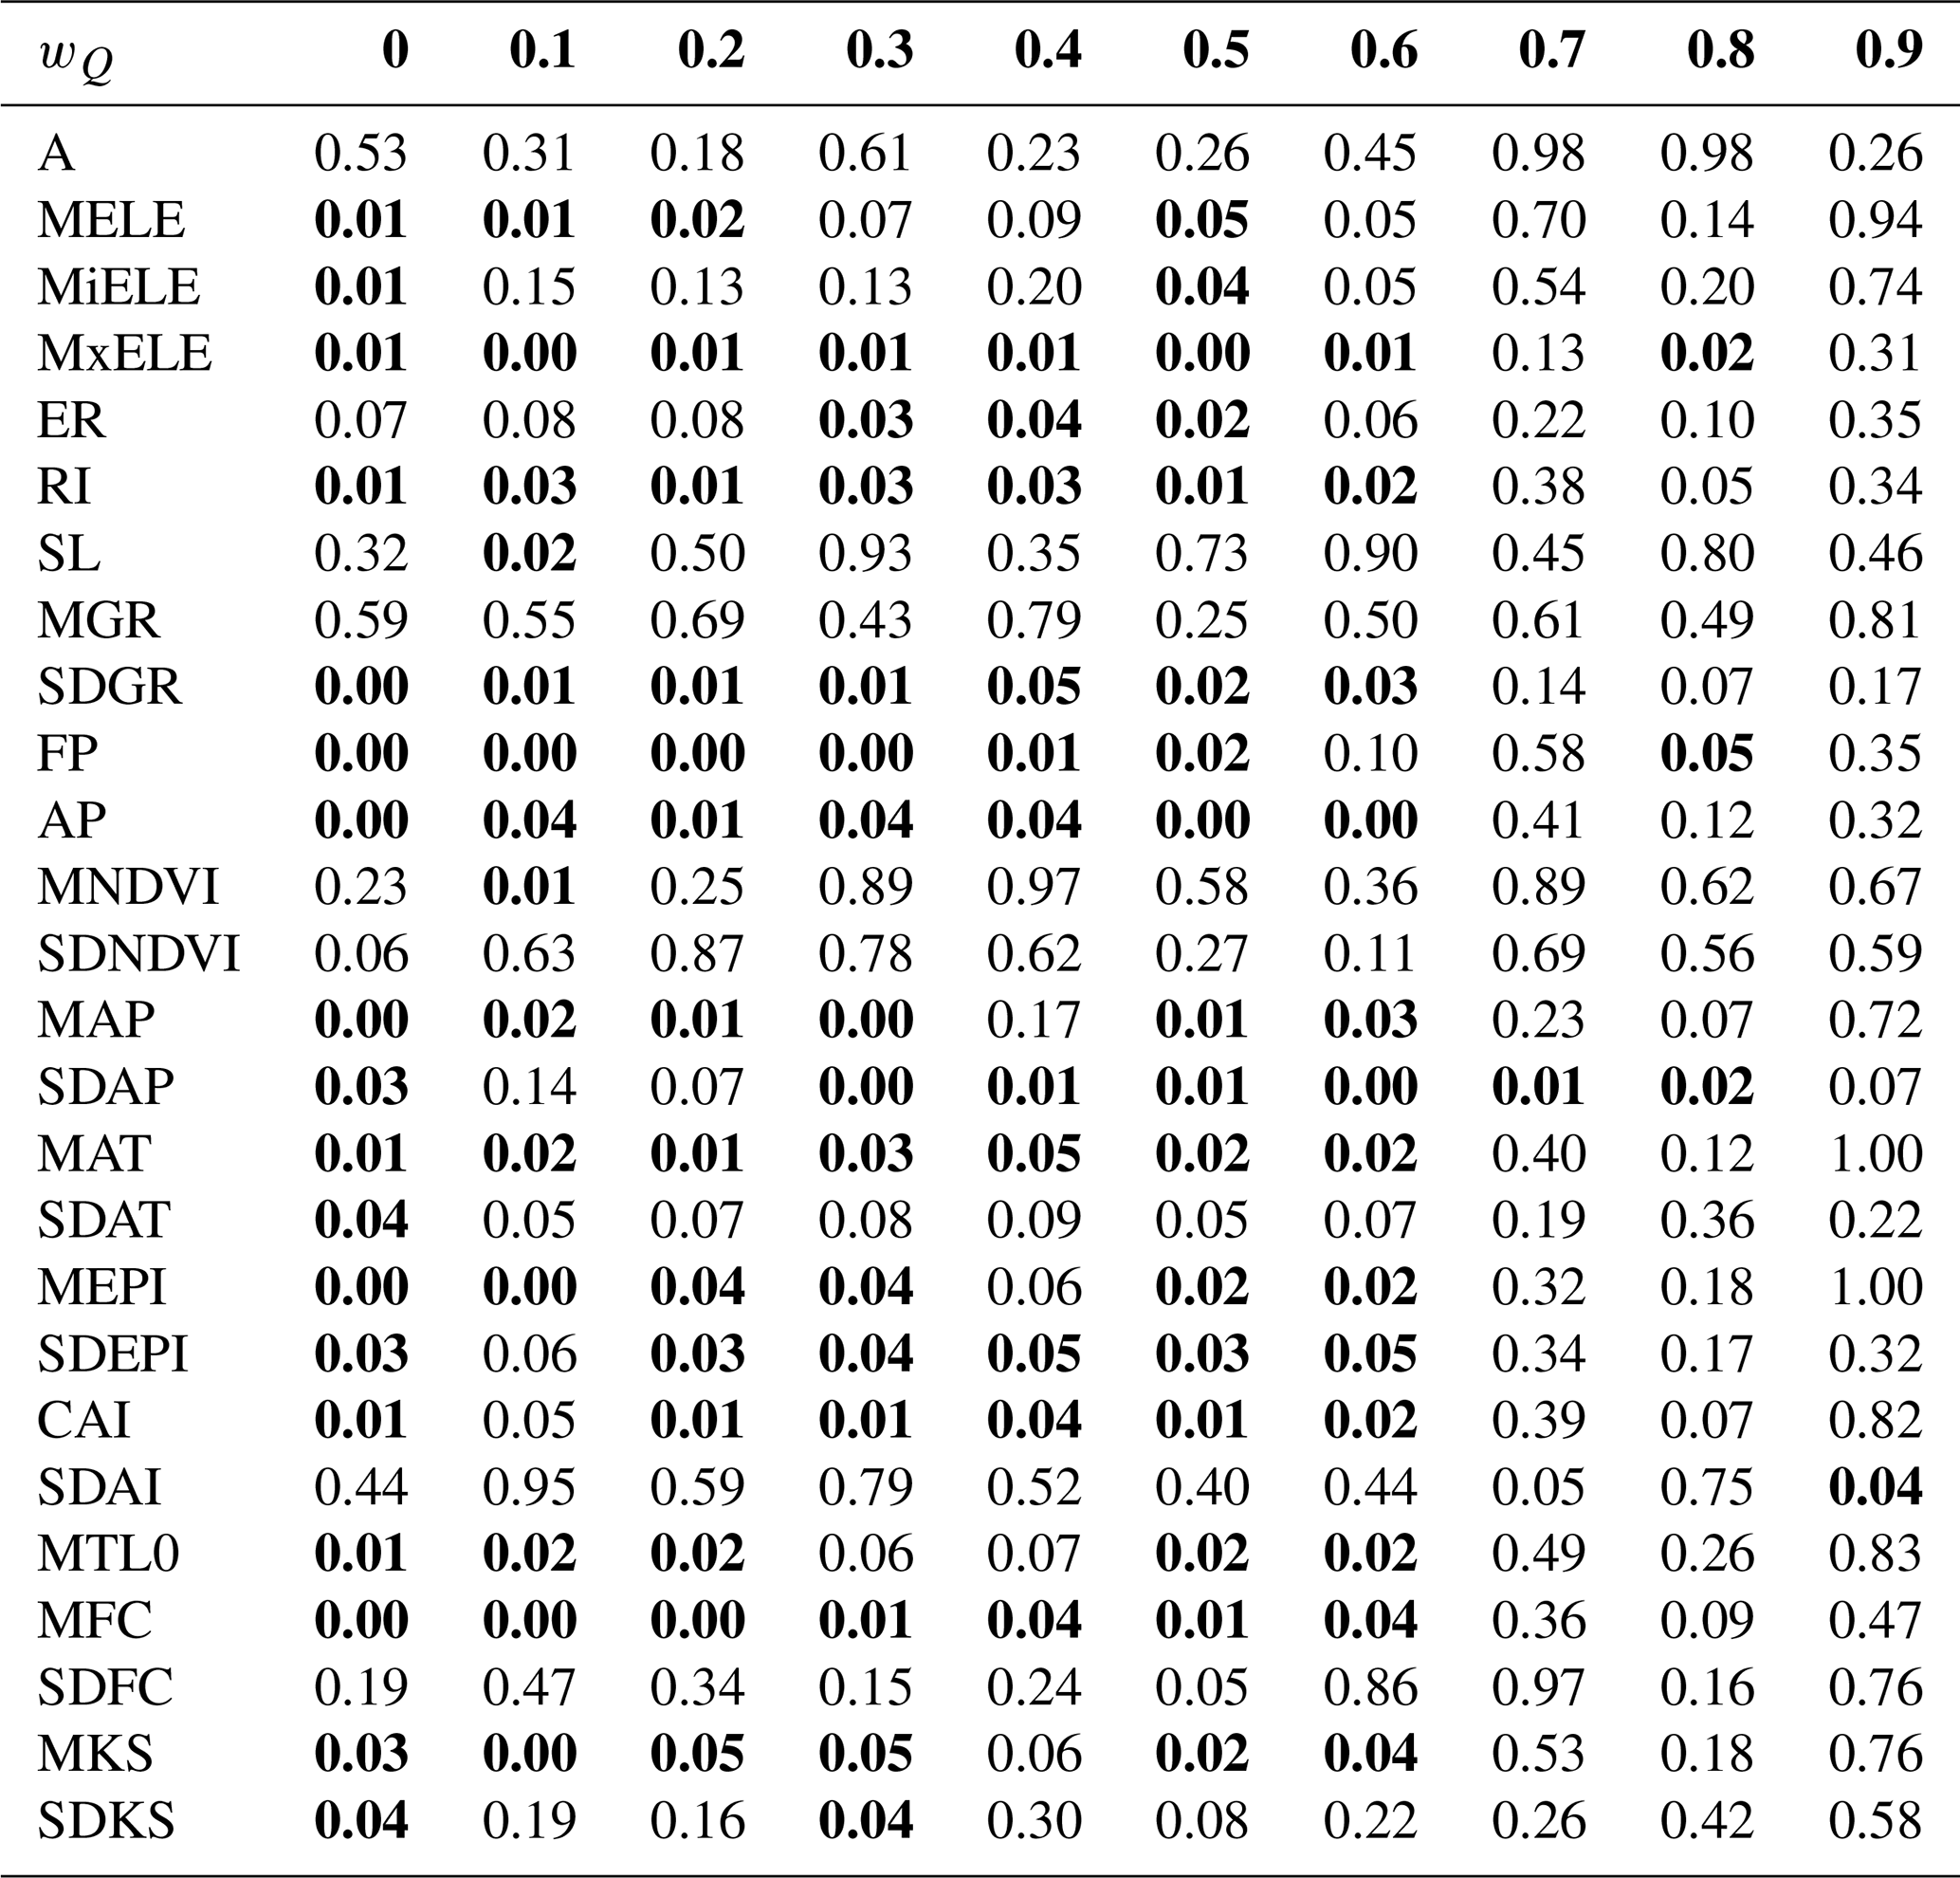
Since an improvement in soil moisture simulations is observed in 80 % of the catchments (Fig. 10), their attributes are particularly interesting. The factors controlling the improvement include topographical (MELE, SL, ER, and SDGR), land cover (FP and AP), climate (MAP, SDAP, MAT, CAI, and MTLT0), and soil (MKS) attributes, similar to improvement in runoff. This is illustrated in Fig. S8, which indicates that improvement in soil moisture simulations occurs particularly in catchments with low mean catchment elevation and a large proportion of agricultural land. In contrast to the runoff improvements, the results for the improvement in soil moisture are not related to the runoff weight wQ used in the model calibration.
In this study, we tested three multiple calibration variants, using runoff data along with ASCAT SWI soil moisture and MODIS snow cover data. The calibration runoff model efficiency is similar to previous studies (Parajka et al., 2008, 2009; Sleziak et al., 2018) that used only runoff for model calibration. For example, the median of runoff model efficiency ranges between 0.77 and 0.79 (for runoff weights larger than 0.4), which is similar than the medians of 0.80 and 0.84 found in Parajka et al. (2008, 2009) for 148 Austrian catchments and better than the median of 0.76 found for 320 Austrian catchments in Parajka et al. (2006) and the range 0.70–0.73 found for the same set of catchments as in this paper but from using a lumped model (Sleziak et al., 2018).
Results show that the inclusion of satellite soil moisture data in the calibration mainly improves the soil moisture simulations. The median soil moisture correlation between hydrologic model outputs and ASCAT SWI is 0.4 to 0.52 (depending on the weight wQ), which is significantly larger than the median of 0.26 found by using the coarser ERS scatterometer data in model calibration in Parajka et al. (2006). This reflects improvements, both in the instrument specifications (better temporal and spatial sampling, higher radiometric accuracy, etc.) and the retrieval algorithm (Naeimi et al., 2009, Hahn et al., 2020).
The inclusion of satellite snow data mainly improves the snow simulations. Using MODIS snow cover data to constrain the model parameters shows a strong ability to improve the accuracy of representing the snow accumulating and melting processes from the model. When giving weights wQ<0.5 to snow, almost all the catchments showed improvements in snow cover simulations. In terms of the improvement in snow model efficiency, our results are better than the results from Parajka et al. (2008). In their study only 3 years of MODIS snow cover data was used, and the improvement of snow mapping even depended on the data availability.
The satellite snow data are more efficient at improving snow simulations than the satellite soil moisture data are at improving soil moisture simulations. Part of the reason may be related to problems in mapping soil moisture in the alpine region while MODIS snow cover is very accurate both in the lowlands and in the mountains. For example, Parajka and Blöschl (2006) and Tong et al. (2020) showed the classification accuracy of the MODIS snow cover range from 95 % to over 97 % in Austria. Furthermore, it is interesting that including both soil moisture and snow cover data improves both soil moisture and snow simulations to almost the same extent as including them individually does, without any significant deterioration in the other variable. This gives the possibility to consistently improve the simulations of snow and soil moisture in future model applications. Our validation results indicate that snow simulations are improved in almost all simulations, with soil moisture correlation in about 80 % and runoff in up to 40 % of the catchments. Overall, the runoff performance changes very little when including soil moisture and snow data in the calibration.
The calibrated snow-related parameters are strongly affected by including snow data and, to a lesser extent, by including soil moisture data, while the soil-related parameters are only affected by soil moisture data. This separation is a welcome property as it facilitates parameter calibration. The soil moisture data also have some effect on the snow-related parameters; this is consistent with Nijzink et al. (2018). As the melting changes the soil moisture directly, the soil moisture data provide additional constraints on the parameters controlling snowmelt. This can be helpful in understanding hydrological processes, especially for the variation in snow water equivalent.
Our results indicate that the runoff and soil moisture simulation improvement when including soil moisture data in the calibration is found mainly in catchments with lower mean catchment elevation and a larger proportion of agricultural land. While, overall, in 40 % of the catchments, the validation runoff efficiency is improved by the inclusion of soil moisture (Fig. 10a); these are about 50 % of the catchments if only those with elevation lower than the median (1011 m a.s.l) and agricultural area larger than the median (16.3 %) are considered. Similarly, while, overall, in 80 % of the catchments the validation of soil moisture efficiency is improved by the inclusion of soil moisture (Fig. 10b), these are about 90 % of the catchments if only those which low elevation and agricultural use are considered. The higher efficiency for improving the hydrologic model in the lowlands can be explained by the better quality of the ASCAT soil moisture retrievals (compared to the alpine regions), but it is likely also due to the higher spatial consistency in soil texture and land cover type and also lower slope and elevation variation. In contrast to a previous assessment of ERS assimilation into model calibration (Parajka et al., 2006), we found soil moisture improvement not only in lowland catchments with lower topographical variability but also in catchments with smaller sizes (Fig. 5), which may be related to the higher spatial and temporal resolution of ASCAT as compared to ERS. Over flatlands, ASCAT retrievals have improved a lot compared to the ERS retrievals from 15 years back, but in alpine regions, the rugged topography, dense alpine vegetation, and presence of snow and ice even during the summer still makes using the data challenging, given the higher retrieval errors and invalid measurements when the ground is snow covered or frozen. Additionally, the large heterogeneity in temperature and snow cover in mountainous regions can lead to insufficient masking for frozen soil and snow cover. In future studies, the use of soil moisture products with much finer spatial resolution may help in reducing these errors and deficiencies for calibrating hydrological models (e.g., Bauer-Marschallinger et al., 2019; Long et al., 2019; Vergopolan et al., 2020; Abowarda et al., 2021).
This study has evaluated the potential of assimilating the soil water index (representing root zone soil moisture) into hydrologic model calibration. It would be useful to extend this study to assimilate other variables, such as surface soil moisture estimates by using a dual soil moisture conceptual hydrologic model (Parajka et al., 2009), and also to compare the role of the spatial resolution of soil moisture and snow data with respect to their value in the assimilation.
The discharge data from the HZB can be accessed through https://ehyd.gv.at/ (BMLRT, 2020). The meteorological data from the ZAMG are currently not freely available; requests should be directed to klima@zamg.ac.at. The original ASCAT soil water index data set is available via the Copernicus Global Land Service (CGLS; https://land.copernicus.eu/global/products/swi/; TU Wien, 2018). MODIS C6 snow cover products are from NASA National Snow and Ice Data Center (https://nsidc.org/, NASA National Snow and Ice Data Center, 2021; Hall and Riggs, 2016a; https://doi.org/10.5067/MODIS/MOD10A1.006; Hall and Riggs, 2016b, https://doi.org/10.5067/MODIS/MYD10A1.006). Processed ASCAT SWI and MODIS snow cover maps used in this study are available upon request. The maps of soil hydraulic properties are from Zhang and Schaap (2018, https://doi.org/10.7910/DVN/UI5LCE). MODIS C6 Normalized Difference Vegetation Index (MOD13A3v006) is from NASA Earth Observing System Data and Information System (EOSDIS) Land Processes Distributed Active Archive Center (LP DAAC; https://doi.org/10.5067/MODIS/MOD13A3.006; Didan, 2015). The R package of TUWmodel can be downloaded from CRAN (https://CRAN.R-project.org/package=TUWmodel; Viglione and Parajka, 2020).
The supplement related to this article is available online at: https://doi.org/10.5194/hess-25-1389-2021-supplement.
RT and JP conceived and designed the study, wrote the codes, performed the analyses, and prepared the paper. AS and IP prepared the ASCAT soil moisture SWI data used in this study. JK, BS, MK, and PV were responsible for the data management, including quality control, processing, and validating. MV and WW provided the analyses related to soil moisture and prepared part of the paper. GB supervised the study and contributed to the study design and interpretation of the results. All authors took part in the discussion of the results and revisions of the paper.
The authors declare that they have no conflict of interest.
The authors would like to thank the editor, Fuqiang Tian, and two anonymous reviewers for their helpful and insightful comments on the paper. Rui Tong is grateful for the scholarship from the China Scholarship Council (CSC).
This research has been supported by the Austrian Science Funds (FWF; grant no. DK W1219-N28), the Slovak Academic Information Agency (SAIA; project no. 2019-10-15-002), Vedecká Grantová Agentúra (VEGA Scientific Grant Agency; grant no. 1/0632/19), and the Austrian Research Promotion Agency (FFG; grant no. 866031).
This paper was edited by Fuqiang Tian and reviewed by two anonymous referees.
Abowarda, A. S., Bai, L., Zhang, C., Long, D., Li, X., Huang, Q., and Sun, Z.: Generating surface soil moisture at 30 m spatial resolution using both data fusion and machine learning toward better water resources management at the field scale, Remote Sens. Environ., 255, 112301, https://doi.org/10.1016/j.rse.2021.112301, 2021.
Albergel, C., Rüdiger, C., Pellarin, T., Calvet, J.-C., Fritz, N., Froissard, F., Suquia, D., Petitpa, A., Piguet, B., and Martin, E.: From near-surface to root-zone soil moisture using an exponential filter: an assessment of the method based on in-situ observations and model simulations, Hydrol. Earth Syst. Sci., 12, 1323–1337, https://doi.org/10.5194/hess-12-1323-2008, 2008.
Babaeian, E., Sadeghi, M., Jones, S. B., Montzka, C., Vereecken, H., and Tuller, M.: Ground, Proximal, and Satellite Remote Sensing of Soil Moisture, Rev. Geophys., 57, 530–616, https://doi.org/10.1029/2018rg000618, 2019.
Bai, P., Liu, X., and Liu, C.: Improving hydrological simulations by incorporating GRACE data for model calibration, J. Hydrol., 557, 291–304, https://doi.org/10.1016/j.jhydrol.2017.12.025, 2018.
Bauer-Marschallinger, B., Freeman, V., Cao, S., Paulik, C., Schaufler, S., Stachl, T., Modanesi, S., Massari, C., Ciabatta, L., Brocca, L., and Wagner, W.: Toward Global Soil Moisture Monitoring With Sentinel-1: Harnessing Assets and Overcoming Obstacles, IEEE T. Geosci. Remote, 57, 520–539, https://doi.org/10.1109/TGRS.2018.2858004, 2019.
Bergström, S.: The HBV model – its structure and applications, SMHI Reports RH 4, Swedish Meteorological and Hydrological Institute (SMHI), Norrköping, Sweden, 1992.
BMLRT: ehyd – Hydrographic data and analyses, available at: https://ehyd.gv.at/, last access: 20 August 2020.
Brocca, L., Tarpanelli, A., Moramarco, T., Melone, F., Ratto, S. M., Cauduro, M., Ferraris, S., Berni, N., Ponziani, F., Wagner, W., and Melzer, T.: Soil Moisture Estimation in Alpine Catchments through Modeling and Satellite Observations, Vadose Zone J., 12, 1–10, https://doi.org/10.2136/vzj2012.0102, 2013.
Brocca, L., Crow, W. T., Ciabatta, L., Massari, C., Rosnay, P. d., Enenkel, M., Hahn, S., Amarnath, G., Camici, S., Tarpanelli, A., and Wagner, W.: A Review of the Applications of ASCAT Soil Moisture Products, IEEE J. Sel. Top. Appl., 10, 2285–2306, https://doi.org/10.1109/JSTARS.2017.2651140, 2017.
Chen, F., Crow, W. T., Bindlish, R., Colliander, A., Burgin, M. S., Asanuma, J., and Aida, K.: Global-scale evaluation of SMAP, SMOS and ASCAT soil moisture products using triple collocation, Remote Sens. Environ., 214, 1–13, https://doi.org/10.1016/j.rse.2018.05.008, 2018.
Chu, W., Gao, X., and Sorooshian, S.: A new evolutionary search strategy for global optimization of high-dimensional problems, Inform. Sciences, 181, 4909–4927, https://doi.org/10.1016/j.ins.2011.06.024, 2011.
Demirel, M. C., Özen, A., Orta, S., Toker, E., Demir, H. K., Ekmekcioğlu, Ö., Tayşi, H., Eruçar, S., Sağ, A. B., and Sarı, Ö.: Additional value of using satellite-based soil moisture and two sources of groundwater data for hydrological model calibration, Water-Sui., 11, 2083, https://doi.org/10.3390/w11102083, 2019.
Didan, K.: MOD13A3 MODIS/Terra vegetation Indices Monthly L3 Global 1 km SIN Grid V006 [September 2002 to August 2014], [Dataset], NASA EOSDIS Land Processes DAAC, https://doi.org/10.5067/MODIS/MOD13A3.006, 2015.
Dorigo, W., Wagner, W., Albergel, C., Albrecht, F., Balsamo, G., Brocca, L., Chung, D., Ertl, M., Forkel, M., Gruber, A., Haas, E., Hamer, P. D., Hirschi, M., Ikonen, J., de Jeu, R., Kidd, R., Lahoz, W., Liu, Y. Y., Miralles, D., Mistelbauer, T., Nicolai-Shaw, N., Parinussa, R., Pratola, C., Reimer, C., van der Schalie, R., Seneviratne, S. I., Smolander, T., and Lecomte, P.: ESA CCI Soil Moisture for improved Earth system understanding: State-of-the art and future directions, Remote Sens. Environ., 203, 185–215, https://doi.org/10.1016/j.rse.2017.07.001, 2017.
Duethmann, D., Peters, J., Blume, T., Vorogushyn, S., and Güntner, A.: The value of satellite – snow cover images for calibrating a hydrological model in snow – catchments in Central Asia, Water Resour. Res., 50, 2002–2021, https://doi.org/10.1002/2013WR014382, 2014.
Duethmann, D., Blöschl, G., and Parajka, J.: Why does a conceptual hydrological model fail to correctly predict discharge changes in response to climate change?, Hydrol. Earth Syst. Sci., 24, 3493–3511, https://doi.org/10.5194/hess-24-3493-2020, 2020.
Efstratiadis, A. and Koutsoyiannis, D.: One decade of multi-objective calibration approaches in hydrological modelling: a review, Hydrol. Sci. J., 55, 58–78, https://doi.org/10.1080/02626660903526292, 2010.
El Hajj, M., Baghdadi, N., Zribi, M., Rodríguez-Fernández, N., Wigneron, J. P., Al-Yaari, A., Al Bitar, A., Albergel, C., and Calvet, J.-C.: Evaluation of SMOS, SMAP, ASCAT and Sentinel-1 soil moisture products at sites in Southwestern France, Remote Sens., 10, 569, https://doi.org/10.3390/rs10040569, 2018.
Finger, D., Vis, M., Huss, M., and Seibert, J.: The value of multiple data set calibration versus model complexity for improving the performance of hydrological models in mountain catchments, Water Resour. Res., 51, 1939–1958, https://doi.org/10.1002/2014wr015712, 2015.
Franz, K. J. and Karsten, L. R.: Calibration of a distributed snow model using MODIS snow covered area data, J. Hydrol., 494, 160–175, https://doi.org/10.1016/j.jhydrol.2013.04.026, 2013.
Hall, D. K. and Riggs, G. A.: MODIS/Terra Snow Cover Daily L3 Global 500 m Grid, Version 6, [September 2002 to August 2014], [Dataset], Boulder, Colorado USA, NASA National Snow and Ice Data Center Distributed Active Archive Center, https://doi.org/10.5067/MODIS/MOD10A1.006, 2016a.
Hall, D. K. and Riggs, G. A.: MODIS/Aqua Snow Cover Daily L3 Global 500m Grid, Version 6, [September 2002 to August 2014], [Dataset], Boulder, Colorado USA, NASA National Snow and Ice Data Center Distributed Active Archive Center, https://doi.org/10.5067/MODIS/MYD10A1.006, 2016b.
Hahn, S., Wagner, W., Steele-Dunne, S. C., Vreugdenhil, M., and Melzer, T.: Improving ASCAT Soil Moisture Retrievals With an Enhanced Spatially Variable Vegetation Parameterization, IEEE T. Geosci. Remote, 1–16, https://doi.org/10.1109/TGRS.2020.3041340, 2020.
Han, P., Long, D., Han, Z., Du, M., Dai, L., and Hao, X.: Improved understanding of snowmelt runoff from the headwaters of China's Yangtze River using remotely sensed snow products and hydrological modeling, Remote Sens. Environ., 224, 44–59, https://doi.org/10.1016/j.rse.2019.01.041, 2019.
Hiebl, J. and Frei, C.: Daily temperature grids for Austria since 1961–concept, creation and applicability, Theor. Appl. Climatol., 124, 161–178, https://doi.org/10.1007/s00704-015-1411-4, 2016.
Hiebl, J. and Frei, C.: Daily precipitation grids for Austria since 1961–Development and evaluation of a spatial dataset for hydroclimatic monitoring and modelling, Theor. Appl. Climatol., 132, 327–345, https://doi.org/10.1007/s00704-017-2093-x, 2018.
Immerzeel, W. and Droogers, P.: Calibration of a distributed hydrological model based on satellite evapotranspiration, J. Hydrol., 349, 411–424, https://doi.org/10.1016/j.jhydrol.2007.11.017, 2008.
Kim, H., Wigneron, J.-P., Kumar, S., Dong, J., Wagner, W., Cosh, M. H., Bosch, D. D., Collins, C. H., Starks, P. J., Seyfried, M., and Lakshmi, V.: Global scale error assessments of soil moisture estimates from microwave-based active and passive satellites and land surface models over forest and mixed irrigated/dryland agriculture regions, Remote Sens. Environ., 251, 112052, https://doi.org/10.1016/j.rse.2020.112052, 2020.
Kavetski, D., Kuczera, G., and Franks, S. W.: Bayesian analysis of input uncertainty in hydrological modeling: 1. Theory, Water Resour. Res., 42, W03408, https://doi.org/10.1029/2005WR004368, 2006.
Kosugi, K.: Three-parameter lognormal distribution model for soil water retention, Water Resour. Res., 30, 891–901, https://doi.org/10.1029/93wr02931, 1994.
Kosugi, K.: Lognormal Distribution Model for Unsaturated Soil Hydraulic Properties, Water Resour. Res., 32, 2697–2703, https://doi.org/10.1029/96wr01776, 1996.
Kundu, D., Vervoort, R. W., and van Ogtrop, F. F.: The value of remotely sensed surface soil moisture for model calibration using SWAT, Hydrol. Process., 31, 2764–2780, https://doi.org/10.1002/hyp.11219, 2017.
Kunnath-Poovakka, A., Ryu, D., Renzullo, L., and George, B.: The efficacy of calibrating hydrologic model using remotely sensed evapotranspiration and soil moisture for streamflow prediction, J. Hydrol., 535, 509–524, https://doi.org/10.1016/j.jhydrol.2016.02.018, 2016.
Li, Y., Grimaldi, S., Pauwels, V. R., and Walker, J. P.: Hydrologic model calibration using remotely sensed soil moisture and discharge measurements: The impact on predictions at gauged and ungauged locations, J. Hydrol., 557, 897–909, https://doi.org/10.1016/j.jhydrol.2018.01.013, 2018.
Lo, M. H., Famiglietti, J. S., Yeh, P. F., and Syed, T.: Improving parameter estimation and water table depth simulation in a land surface model using GRACE water storage and estimated base flow data, Water Resour. Res., 46, W05517, https://doi.org/10.1029/2009WR007855, 2010.
Long, D., Bai, L., Yan, L., Zhang, C., Yang, W., Lei, H., Quan, J., Meng, X., and Shi, C.: Generation of spatially complete and daily continuous surface soil moisture of high spatial resolution, Remote Sens. Environ., 233, 111364, https://doi.org/10.1016/j.rse.2019.111364, 2019.
López López, P., Sutanudjaja, E. H., Schellekens, J., Sterk, G., and Bierkens, M. F. P.: Calibration of a large-scale hydrological model using satellite-based soil moisture and evapotranspiration products, Hydrol. Earth Syst. Sci., 21, 3125–3144, https://doi.org/10.5194/hess-21-3125-2017, 2017.
Merz, R. and Blöschl, G.: A regional analysis of event runoff coefficients with respect to climate and catchment characteristics in Austria, Water Resour. Res., 45, W01405, https://doi.org/10.1029/2008wr007163, 2009.
Merz, R., Parajka, J., and Blöschl, G.: Time stability of catchment model parameters: Implications for climate impact analyses, Water Resour. Res., 47, W02531, https://doi.org/10.1029/2010wr009505, 2011.
Milzow, C., Krogh, P. E., and Bauer-Gottwein, P.: Combining satellite radar altimetry, SAR surface soil moisture and GRACE total storage changes for hydrological model calibration in a large poorly gauged catchment, Hydrol. Earth Syst. Sci., 15, 1729–1743, https://doi.org/10.5194/hess-15-1729-2011, 2011.
Mousa, B. G. and Shu, H.: Spatial Evaluation and Assimilation of SMAP, SMOS, and ASCAT Satellite Soil Moisture Products Over Africa Using Statistical Techniques, Earth Space Sci., 7, e2019EA000841, https://doi.org/10.1029/2019ea000841, 2020.
Muñoz Sabater, J.: ERA5-Land hourly data from 1981 to present, [Dataset], Copernicus Climate Change Service (C3S) Climate Data Store (CDS), https://doi.org/10.24381/cds.e2161bac, 2019.
Naeimi, V., Scipal, K., Bartalis, Z., Hasenauer, S., and Wagner, W.: An Improved Soil Moisture Retrieval Algorithm for ERS and METOP Scatterometer Observations, IEEE T. Geosci. Remote, 47, 1999–2013, https://doi.org/10.1109/TGRS.2008.2011617, 2009.
Naeini, M. R., Yang, T., Sadegh, M., AghaKouchak, A., Hsu, K.-l., Sorooshian, S., Duan, Q., and Lei, X.: Shuffled complex-self adaptive hybrid evolution (SC-SAHEL) optimization framework, Environ. Modell. Softw., 104, 215–235, https://doi.org/10.1016/j.envsoft.2018.03.019, 2018.
NASA National Snow and Ice Data Center: available at: https://nsidc.org/, last access: 22 March 2021.
Nash, J. E. and Sutcliffe, J. V.: River flow forecasting through conceptual models part I–A discussion of principles, J. Hydrol., 10, 282–290, https://doi.org/10.1016/0022-1694(70)90255-6, 1970.
Nijzink, R. C., Almeida, S., Pechlivanidis, I. G., Capell, R., Gustafssons, D., Arheimer, B., Parajka, J., Freer, J., Han, D., Wagener, T., van Nooijen, R. R. P., Savenije, H. H. G., and Hrachowitz, M.: Constraining Conceptual Hydrological Models With Multiple Information Sources, Water Resour. Res., 54, 8332–8362, https://doi.org/10.1029/2017wr021895, 2018.
Parajka, J. and Blöschl, G.: Validation of MODIS snow cover images over Austria, Hydrol. Earth Syst. Sci., 10, 679–689, https://doi.org/10.5194/hess-10-679-2006, 2006.
Parajka, J. and Blöschl, G.: The value of MODIS snow cover data in validating and calibrating conceptual hydrologic models, J. Hydrol., 358, 240–258, https://doi.org/10.1016/j.jhydrol.2008.06.006, 2008.
Parajka, J., Merz, R., and Blöschl, G.: Estimation of daily potential evapotranspiration for regional water balance modeling in Austria, in: 11th International Poster Day and Institute of Hydrology Open Day “Transport of Water, Chemicals and Energy in the Soil – Crop Canopy – Atmosphere System”, Slovak Academy of Sciences, 20 November 2003, Bratislava, 299–306, 2003.
Parajka, J., Naeimi, V., Blöschl, G., Wagner, W., Merz, R., and Scipal, K.: Assimilating scatterometer soil moisture data into conceptual hydrologic models at the regional scale, Hydrol. Earth Syst. Sci., 10, 353–368, https://doi.org/10.5194/hess-10-353-2006, 2006.
Parajka, J., Merz, R., and Blöschl, G.: Uncertainty and multiple objective calibration in regional water balance modelling: case study in 320 Austrian catchments, Hydrol. Proc., 21, 435–446, https://doi.org/10.1002/hyp.6253, 2007.
Parajka, J., Naeimi, V., Blöschl, G., and Komma, J.: Matching ERS scatterometer based soil moisture patterns with simulations of a conceptual dual layer hydrologic model over Austria, Hydrol. Earth Syst. Sci., 13, 259–271, https://doi.org/10.5194/hess-13-259-2009, 2009.
Pfeil, I., Vreugdenhil, M., Hahn, S., Wagner, W., Strauss, P., and Blöschl, G.: Improving the seasonal representation of ASCAT soil moisture and vegetation dynamics in a temperate climate, Remote Sens., 10, 1788, https://doi.org/10.3390/rs10111788, 2018.
Rajib, M. A., Merwade, V., and Yu, Z.: Multi-objective calibration of a hydrologic model using spatially distributed remotely sensed/in-situ soil moisture, J. Hydrol., 536, 192–207, https://doi.org/10.1016/j.jhydrol.2016.02.037, 2016.
Rakovec, O., Kumar, R., Attinger, S., and Samaniego, L.: Improving the realism of hydrologic model functioning through multivariate parameter estimation, Water Resour. Res., 52, 7779–7792, https://doi.org/10.1002/2016WR019430, 2016.
Seibert, J.: Multi-criteria calibration of a conceptual runoff model using a genetic algorithm, Hydrol. Earth Syst. Sci., 4, 215–224, https://doi.org/10.5194/hess-4-215-2000, 2000.
Sleziak, P., Szolgay, J., Hlavčová, K., Duethmann, D., Parajka, J., and Danko, M.: Factors controlling alterations in the performance of a runoff model in changing climate conditions, J. Hydrol. Hydromech., 66, 381, https://doi.org/10.2478/johh-2018-0031, 2018.
Sleziak, P., Szolgay, J., Hlavčová, K., Danko, M., and Parajka, J.: The effect of the snow weighting on the temporal stability of hydrologic model efficiency and parameters, J. Hydrol., 583, 124639, https://doi.org/10.1016/j.jhydrol.2020.124639, 2020.
Sutanudjaja, E. H., van Beek, L. P. H., de Jong, S. M., van Geer, F. C., and Bierkens, M. F. P.: Calibrating a large-extent high-resolution coupled groundwater-land surface model using soil moisture and discharge data, Water Resour. Res., 50, 687–705, https://doi.org/10.1002/2013wr013807, 2014.
Széles, B., Parajka, J., Hogan, P., Silasari, R., Pavlin, L., Strauss, P., and Blöschl, G.: The Added Value of Different Data Types for Calibrating and Testing a Hydrologic Model in a Small Catchment, Water Resour. Res., 56, e2019WR026153, https://doi.org/10.1029/2019WR026153, 2020.
Széles, B., Parajka, J., Hogan, P., Silasari, R., Pavlin, L., Strauss, P., and Blöschl, G.: Stepwise prediction of runoff using proxy data in a small agricultural catchment, J. Hydrol. Hydromech., 69, 691–711, https://doi.org/10.2478/johh-2020-0029, 2021.
Tong, R., Parajka, J., Komma, J., and Blöschl, G.: Mapping snow cover from daily Collection 6 MODIS products over Austria, J. Hydrol., 590, 125548, https://doi.org/10.1016/j.jhydrol.2020.125548, 2020.
Trautmann, T., Koirala, S., Carvalhais, N., Eicker, A., Fink, M., Niemann, C., and Jung, M.: Understanding terrestrial water storage variations in northern latitudes across scales, Hydrol. Earth Syst. Sci., 22, 4061–4082, https://doi.org/10.5194/hess-22-4061-2018, 2018.
TU Wien: Soil Water Index (SWI) V3, available at: https://land.copernicus.eu/global/products/swi/, Copernicus Global Land Service, last access: 17 March 2021.
Udnæs, H.-C., Alfnes, E., and Andreassen, L. M.: Improving runoff modelling using satellite-derived snow covered area?, Hydrol. Res., 38, 21–32, https://doi.org/10.2166/nh.2007.032, 2007.
Vergopolan, N., Chaney, N. W., Beck, H. E., Pan, M., Sheffield, J., Chan, S., and Wood, E. F.: Combining hyper-resolution land surface modeling with SMAP brightness temperatures to obtain 30-m soil moisture estimates, Remote Sens. Environ., 242, 111740, https://doi.org/10.1016/j.rse.2020.111740, 2020.
Viglione, A., Parajka, J., Rogger, M., Salinas, J. L., Laaha, G., Sivapalan, M., and Blöschl, G.: Comparative assessment of predictions in ungauged basins – Part 3: Runoff signatures in Austria, Hydrol. Earth Syst. Sci., 17, 2263–2279, https://doi.org/10.5194/hess-17-2263-2013, 2013.
Viglione, A. and Parajka, J.: TUWmodel: Lumped/Semi-Distributed Hydrological Model for Education Purposes, R package version 1.1-1, available at: https://CRAN.R-project.org/package=TUWmodel (last access: 17 March 2021), 2020.
Wagener, T. and Montanari, A.: Convergence of approaches toward reducing uncertainty in predictions in ungauged basins, Water Resour. Res., 47, https://doi.org/10.1029/2010WR009469, 2011.
Wagner, W., Lemoine, G., Borgeaud, M., and Rott, H.: A study of vegetation cover effects on ERS scatterometer data, IEEE T. Geosci. Remote, 37, 938–948, https://doi.org/10.1109/36.752212, 1999.
Wagner, W., Hahn, S., Kidd, R., Melzer, T., Bartalis, Z., Hasenauer, S., Figa-Saldaña, J., De Rosnay, P., Jann, A., and Schneider, S.: The ASCAT soil moisture product: A review of its specifications, validation results, and emerging applications, Meteorol. Z., 22, 5–33, https://doi.org/10.1127/0941-2948/2013/0399, 2013.
Wagner, W., Brocca, L., Naeimi, V., Reichle, R., Draper, C., Jeu, R. d., Ryu, D., Su, C., Western, A., Calvet, J., Kerr, Y. H., Leroux, D. J., Drusch, M., Jackson, T. J., Hahn, S., Dorigo, W., and Paulik, C.: Clarifications on the “Comparison Between SMOS, VUA, ASCAT, and ECMWF Soil Moisture Products Over Four Watersheds in U.S.”, IEEE T. Geosci. Remote, 52, 1901–1906, https://doi.org/10.1109/TGRS.2013.2282172, 2014.
Wanders, N., Bierkens, M. F. P., de Jong, S. M., de Roo, A., and Karssenberg, D.: The benefits of using remotely sensed soil moisture in parameter identification of large-scale hydrological models, Water Resour. Res., 50, 6874–6891, https://doi.org/10.1002/2013wr014639, 2014.
Werth, S. and Güntner, A.: Calibration analysis for water storage variability of the global hydrological model WGHM, Hydrol. Earth Syst. Sci., 14, 59–78, https://doi.org/10.5194/hess-14-59-2010, 2010.
Zhang, Y., Chiew, F. H., Zhang, L., and Li, H.: Use of remotely sensed actual evapotranspiration to improve rainfall–runoff modeling in Southeast Australia, J. Hydrometeorol., 10, 969–980, https://doi.org/10.1175/2009JHM1061.1, 2009.
Zhang, Y., Schaap, M. G., and Zha, Y.: A High-Resolution Global Map of Soil Hydraulic Properties Produced by a Hierarchical Parameterization of a Physically Based Water Retention Model, Water Resour. Res., 54, 9774–9790, https://doi.org/10.1029/2018wr023539, 2018.
Zhang, Y. and Schaap, M. G.: A High-Resolution Global Map of Soil Hydraulic Properties Produced by a Hierarchical Parameterization of a Physically-Based Water Retention Model, Harvard Dataverse, https://doi.org/10.7910/DVN/UI5LCE, 2018.