the Creative Commons Attribution 4.0 License.
the Creative Commons Attribution 4.0 License.
 | 21 Dec 2020
Anatomy of the 2018 agricultural drought in the Netherlands using in situ soil moisture and satellite vegetation indices
Joost Buitink
Anne M. Swank
Martine van der Ploeg
Naomi E. Smith
Harm-Jan F. Benninga
Frank van der Bolt
Coleen D. U. Carranza
Gerbrand Koren
Rogier van der Velde
The soil moisture status near the land surface is a key determinant of vegetation productivity. The critical soil moisture content determines the transition from an energy-limited to a water-limited evapotranspiration regime. This study quantifies the critical soil moisture content by comparison of in situ soil moisture profile measurements of the Raam and Twente networks in the Netherlands, with two satellite-derived vegetation indices (near-infrared reflectance of terrestrial vegetation, NIRv, and vegetation optical depth, VOD) during the 2018 summer drought. The critical soil moisture content is obtained through a piece-wise linear correlation of the NIRv and VOD anomalies with soil moisture on different depths of the profile. This non-linear relation reflects the observation that negative soil moisture anomalies develop weeks before the first reduction in vegetation indices: 2–3 weeks in this case. Furthermore, the inferred critical soil moisture content was found to increase with observation depth, and this relationship is shown to be linear and distinctive per area, reflecting the tendency of roots to take up water from deeper layers when drought progresses. The relations of non-stressed towards water-stressed vegetation conditions on distinct depths are derived using remote sensing, enabling the parameterization of reduced evapotranspiration and its effect on gross primary productivity in models to study the impact of a drought on the carbon cycle.
- Article
(2983 KB) - Full-text XML
- BibTeX
- EndNote


Droughts can have wide environmental and socio-economic impacts, ranging from their effects on climate, the carbon cycle, and food security to water availability. Droughts are typically induced by a lack of precipitation and/or an above-average atmospheric demand for evapotranspiration (ET), which leads to an associated reduced availability of soil moisture in the root zone (Seneviratne et al., 2010; Teuling, 2018). The former is typically referred to as meteorological drought, whereas the latter is referred to as agricultural drought. Reduced soil moisture limits water uptake and ET from the plant, which leads to an increase in sensible heat flux relative to latent heat flux. This establishes a positive feedback, by further increasing temperature and vapour pressure deficit (Seneviratne et al., 2010; Miralles et al., 2019; Lansu et al., 2020). Furthermore, reduction in ET through the closing of plants' stomata also affects the carbon cycle by reducing gross primary productivity (GPP) (van der Molen et al., 2011; Reichstein et al., 2013). This can turn ecosystems from carbon sinks to sources, such as during the 2003 European summer drought and heatwave in which GPP was reduced by as much as 30 % (Ciais et al., 2005). While meteorological droughts are generally well understood since they can be monitored by routine meteorological observations, quantifying the links between soil moisture, ET, and vegetation during agricultural droughts is more challenging. This is the aim of the current study, in which we focus on the record-breaking drought of 2018 in Europe (Bakke et al., 2020).
Typically, two ET regimes are distinguished: an energy-limited and a water-limited regime. This is often conceptualized and parameterized as a bilinear function of soil moisture, separating the regimes at the so-called critical soil moisture content (Seneviratne et al., 2010). There is considerable evidence that a strong non-linearity is typical for most regions and conditions. This makes it key to (i) predict the onset of drought impact on ET and (ii) predict the timescale of ET decay during drought (Teuling et al., 2006; Boese et al., 2019). In early field experiments, it was already observed that the actual ET fell below the potential only at lower levels of soil moisture and that the value at which this occurred depended on the potential ET (Denmead and Shaw, 1962). In more recent studies at larger scales, it has been observed that ET over the summer increased rather than decreased in parts of central-western Europe during drought (Teuling et al., 2013) and that vegetation productivity in Alpine regions also increased during the 2003 summer drought (Jolly et al., 2005). In a recent study on vegetation–soil moisture coupling using satellite observation products (Denissen et al., 2020), it was found that the critical soil moisture is located at the lower rather than higher part of the soil moisture range. However, the remote sensing products used in this study are subject to significant limitations, mainly caused by the limited penetration depth of the sensors. Since vegetation may take up water from much deeper soil layers, it makes critical soil moisture estimations using remote sensing highly uncertain.
The impact of drought has been studied extensively using ecosystem-level information obtained from eddy covariance sensors (i.e. FLUXNET), satellite-derived observations (van der Molen et al., 2011), or terrestrial biosphere modelling (van Schaik et al., 2018). This has provided valuable insight into the timing and impact of drought on GPP (Sippel et al., 2018; Stocker et al., 2019). Several studies have shown that spatio-temporal patterns of GPP are correlated with solar-induced chlorophyll fluorescence (SIF), a satellite product which measures the re-emission of light by chloroplasts during photosynthesis (Frankenberg et al., 2011; Koren et al., 2018; Li et al., 2018). Badgley et al. (2017, 2019) found that SIF correlates strongly with satellite-obtained near-infrared reflectance of terrestrial vegetation (NIRv) and proposes to use this as a proxy for GPP. Another satellite-derived observation of GPP is vegetation optical depth (VOD) (Konings et al., 2016; Teubner et al., 2018, 2019; Moesinger et al., 2020). Both NIRv and VOD have a high temporal resolution, in contrast to SIF data. This allows for a more precise analysis of how plant productivity is related to soil moisture.
Ecosystem flux observations and satellite observations of vegetation can provide valuable insight into the ecosystem response to drought. However, they do not provide direct insight into processes that occur below the surface, in particular the timing, location, and strategy of plant water uptake in the root zone. The parameterization of root water uptake during drought is thus a major source of uncertainty in models (Braud et al., 2005; Teuling et al., 2006; Kumar et al., 2015; Combe et al., 2016). For example, a recent study showed how different vegetation types employ different strategies during the drought of 2018 (Kleine et al., 2020). It is well known that, generally, plants take up water from the upper soil layers first. They can compensate for a developing lack of moisture near the surface by increasing their uptake deeper in the profile to values much higher than can be expected based on the root density (Sharp and Davies, 1985; Green and Clothier, 1995). Currently, many studies rely on the use of surface soil moisture to diagnose drought processes. This is problematic because surface soil moisture that can be measured by satellite-derived observations might become decoupled from soil moisture deeper in the profile where it is taken up by plants (Capehart and Carlson, 1997; Carranza et al., 2018), and they might not represent the dynamics of processes deeper in the root zone (Bassiouni et al., 2020).
The availability of a growing number of relatively accurate low-cost soil moisture sensors (Mittelbach et al., 2011) has led to an increasing number of regional soil moisture networks, where soil moisture is measured at a large number of sites and at several depths in the profile. Such networks, in combination with satellite-derived observations, can provide a unique insight into the link between vegetation stress, root water uptake, and soil moisture profiles. Two of those networks, the Twente and Raam networks in the Netherlands, are located in the region that suffered from the 2018 European summer drought.
High-impact extreme events such as flash floods are often associated with sloping or upland terrain (Marchi et al., 2010). However floods and droughts can have considerable impact in lowland areas as well, even though the main hydrological processes can differ. For the 1976 summer drought in the Hupsel Brook catchment (Brauer et al., 2018), it was found that soil moisture anomalies develop progressively deeper over the course of the drought, reflecting a strong link to the presence of a relatively shallow groundwater table (Teuling et al., 2013). For the same catchment, it was found that the link between soil moisture and the groundwater table at near-saturated conditions played an equally important role in determining the onset of saturation excess runoff and flash flood response following the August 2010 extreme precipitation (Brauer et al., 2011). In larger lowland rivers, low topographic and hydraulic gradients can induce flooding due to backwater effects (Geertsema et al., 2018). Due to the strong human influence of hydrological processes on, for instance, changes in drainage density and/or land use, lowland areas might also be sensitive to changes in hydrological extremes (Pijl et al., 2018).
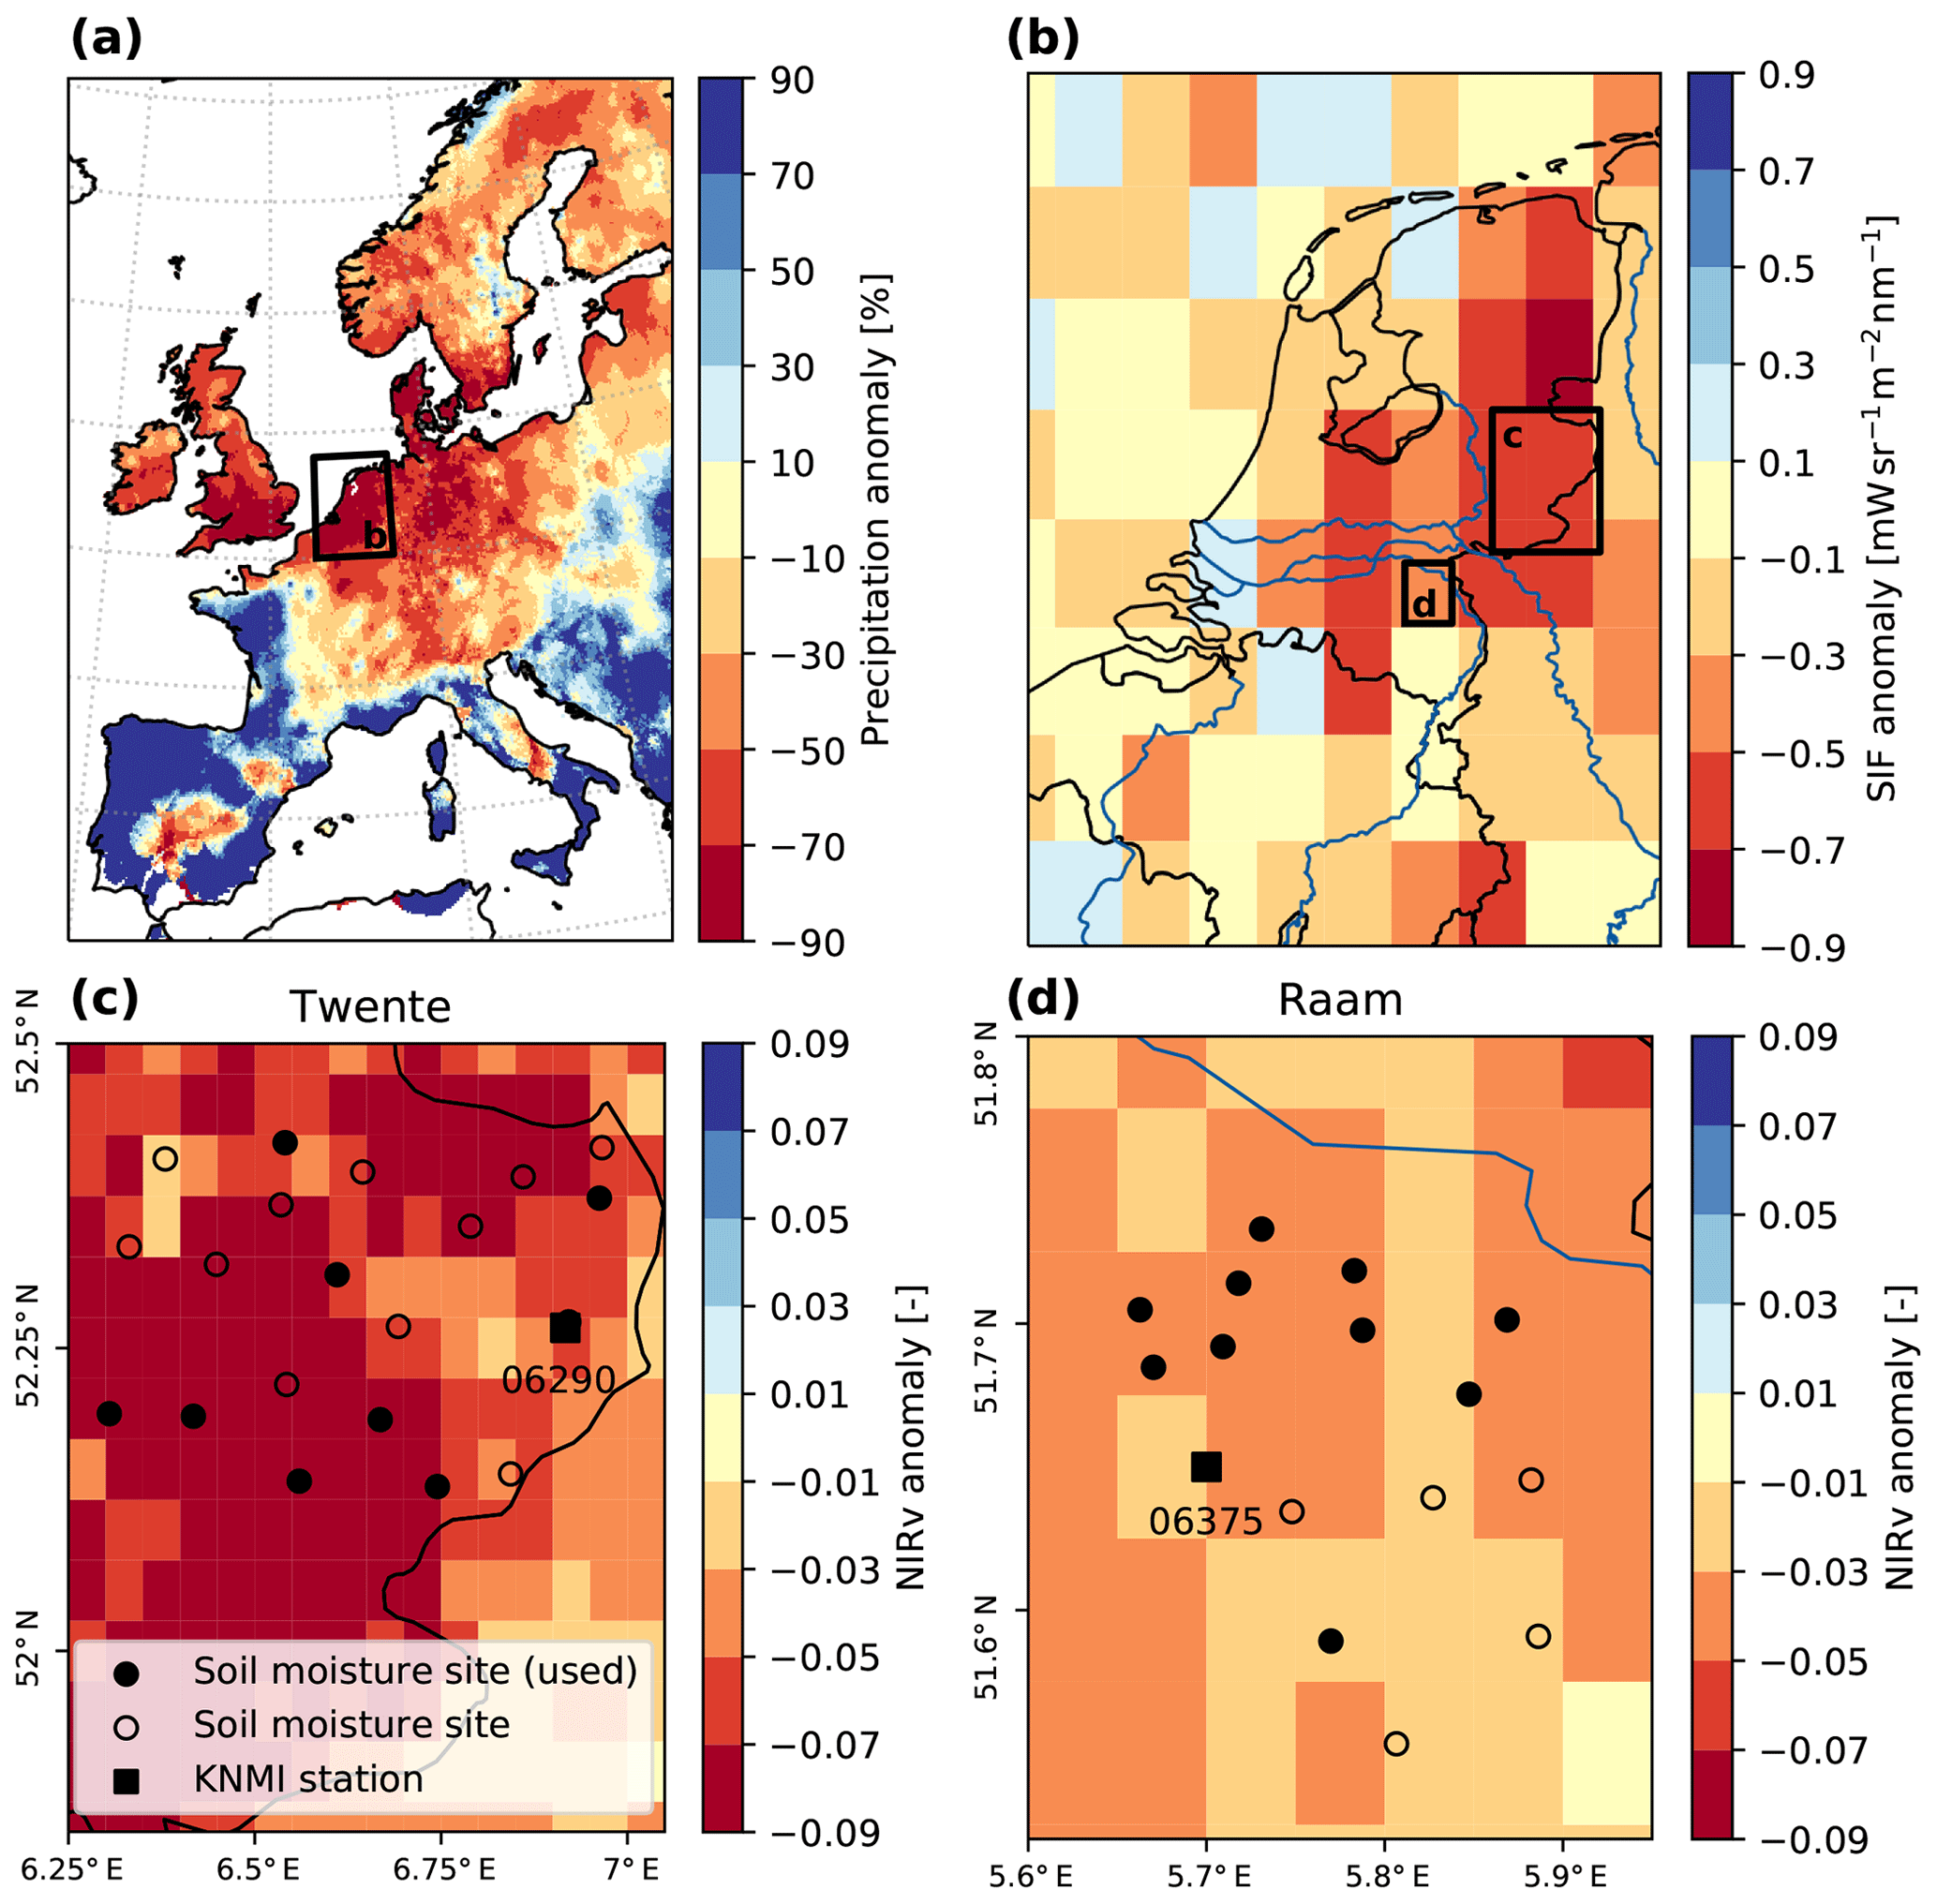
Figure 1Distribution of the 2018 summer drought and vegetation productivity with respect to 2016 and 2017. Drought distribution in western Europe (a) is expressed by the relative June–July precipitation anomaly (E-OBS), showing that the eastern part of the Netherlands was one of the worst hit areas. This is confirmed by a similar pattern in GOME-2 SIF anomalies (b). MODIS NIRv (c, d) shows a similar distribution but at much higher spatial resolution, for Twente (c) and Raam (d). The circles indicate in situ soil moisture measurement sites with (filled) and without data of sufficient availability (open); when filled these are included in the analyses. KNMI stations Twenthe (06290) and Volkel (06375) are indicated by black squares.
In this study, we combine data from the Twente and Raam soil moisture networks located in the Netherlands with satellite-derived vegetation indices (NIRv and VOD). Using these datasets, we study the regional-scale development of the 2018 agricultural drought in a lowland area during the summer months June, July, and August. Specifically, we aim to (i) analyse the temporal evolution of drought in the unsaturated zone in relation to the non-drought years of 2016 and 2017, (ii) link dynamics of vegetation productivity to soil moisture, and (iii) infer the critical soil moisture content and its dependency on depth.
The Raam and Twente soil moisture networks in the Netherlands (see Fig. 1) were originally installed as validation sites for satellite-derived data products (Benninga et al., 2018; Dente et al., 2011). The Raam network faces – by Dutch standards and in comparison to the Twente network – substantial water shortages during normal summers (Benninga et al., 2018). This can be mainly attributed to the mostly sandy soils in the Raam network, whereas the Twente network is located in an area with sandy to more loamy soils. Both areas have a land cover consisting of cultivated or natural grassland, agricultural fields (maize, onion, chicory, sugar beets), and some forested sites (though these are not instrumented). Both networks are positioned between 10–30 m a.s.l. (above sea level). The average spacing between the soil moisture sensors is 6.2 km for Twente and 3.5 km for Raam. For further details on the network and sites, we refer to the relevant papers (Benninga et al., 2018; Dente et al., 2011).
Soil moisture observations for both networks were available for 2016–2018 at discrete depths below the soil surface (5, 10, 20, 40 cm for Raam and Twente and additionally 80 cm for Raam), from which daily averaged volumetric soil moisture (θ (m m)) was obtained. The 31 d moving means of 2016 and 2017 were averaged to represent baseline conditions (referred to as climatology hereafter). The anomaly is defined as the difference between 2018 and the climatology. We assumed that measurements at 5, 10, 20, 40, and 80 cm represent the soil column between 2.5–7.5, 7.5–12.5, 12.5–27.5, 27.5–52.5, and 52.5–107.5 cm depth respectively. Stations were selected based on maximum available daily averaged data between May 2016 and September 2018 (filled circles in Fig. 1c and d).
For the meteorological conditions, daily precipitation and potential ET (calculated by the Royal Netherlands Meteorological Institute (KNMI) with Makkink, 1960) were obtained from the KNMI stations in Volkel (06375) and Twenthe (06290; see locations in Fig. 1c and d). Gridded precipitation was obtained from E-OBS, at 0.1×0.1∘ and daily resolution (v20.0e; Cornes et al., 2018). Comparing yearly average values of 2016 and 2017 with the mean over 1990–2019 shows that temperature, precipitation, and potential evaporation were all close to the long-term mean values (in brackets): temperatures were 10.4 ∘C (10.1 ∘C), precipitation 791 mm (782 mm), and potential ET 584 mm (573 mm). This supports the years 2016 and 2017 being used as baseline conditions.
Photosynthetically active radiation normalized solar-induced fluorescence (SIF; v27) was used as a proxy for GPP and obtained from the GOME-2B instrument on board the MetOp-B satellite as described in Joiner et al. (2013, 2016) on a monthly average and with 0.5×0.5∘ spatial resolution. Daily NIRv was obtained using the following calculation:
where NDVI represents the normalized difference vegetation index, and NIRT represents the total scene near-infrared reflectance (Badgley et al., 2017). Both are obtained from the merged MODIS Aqua and Terra satellites' product, available at a 0.05×0.05∘ spatial resolution (Schaaf and Wang, 2015). The NIRT was BRDF-adjusted (bidirectional reflectance distribution function), and all values below 0 were removed.
The NIRv product has a higher spatial and temporal resolution than the SIF dataset. Although the NIRv product is relatively new, several studies have highlighted the usability of this dataset. Badgley et al. (2019) showed that the relationship between NIRv and GPP was consistently linear across all values of GPP, both during drought events and during acute stress events at short timescales. Additionally, Baldocchi et al. (2020) concluded that NIRv is able to correctly represent photosynthesis across different temporal scales.
Vegetation optical depth (VOD) values were obtained from Moesinger et al. (2019). VOD is a measure for above-ground vegetation water content (Konings et al., 2016; Moesinger et al., 2020), derived from space-borne microwave sensors (SSM/I, TMI, AMSR-E, WindSat, and AMSR2). VOD is available at a spatial resolution of 0.25×0.25∘ and at a daily time step (though not every day has 100 % coverage). VOD is used for comparison with NIRv values and to test the robustness of our analysis. For our analysis, we selected the C band to calculate the anomalies. The climatology and anomaly of precipitation, SIF, NIRv, and VOD were calculated similarly to θ.
To infer the critical soil moisture (θcritical), the NIRv anomaly as a function of θ was fitted by employing a piece-wise linear function, which renders an inflection point indicating the transition from an energy-limited to a water-limited evapotranspiration regime (Seneviratne et al., 2010). We focus on the period during which the soil moisture anomalies show a downward trend (June and July, highlighted in Fig. 2). Using bootstrapping, we determined the 5 %–95 % uncertainty range of the inferred critical soil moisture value at each integration depth.

Figure 2Temporal evolution of the 2018 agricultural drought over the study regions. Panels (a, b) show NIRv (solid) and VOD (dashed), and (c, d) the soil moisture conditions over the growing season for Twente (a, c) and Raam (b, d). Soil moisture is the average observed at 40 cm depth. Horizontal lines in panels a and b indicate the non-stressed NIRv (black) and VOD (grey) values used in Fig. 3. Coloured shaded areas represent spatial variability within the regions and are calculated in the 20 %–80 % range. Grey shading highlights the period used in Fig. 3.
The strong reduction in precipitation over June and July that was centred around the Netherlands (Fig. 1a) coincided with strong negative anomalies in vegetation productivity. Coarse-scale estimates of productivity based on solar-induced fluorescence (Fig. 1b) show large negative anomalies, in particular in the eastern part of the country where soils are more sandy and groundwater tables are deeper. Higher resolution NIRv imagery shows a similar pattern, including slightly larger negative anomalies in Twente compared to more moderate anomalies in the Raam (Fig. 1c and d). This shows that the soil moisture networks were located at a prime location to monitor the impact of the 2018 drought.
The temporal dynamics of the vegetation productivity and soil moisture reveals considerable complexity in the response to the drought. During initial stages of the drought, NIRv kept pace with, or even sometimes exceeded, the climatological values in both networks (Fig. 2a and b). In the beginning of summer, the NIRv anomalies are around zero for Twente and slightly positive for Raam and are followed by a sharp decline in productivity in late June. At the end of July, maximum NIRv anomalies correspond to −30 % (Twente) and −25 % (Raam). In contrast to the NIRv anomalies, soil moisture observations reveal a steady decline from the beginning of summer up to the end of July. Anomalies are found to be largest at the end of July. NIRv and soil moisture anomalies remain strongly negative in Twente until the beginning of October, whereas the Raam shows a faster recovery. VOD shows a similar response to NIRv; yet the VOD anomalies exceed the climatological values during the start of the summer. The moment at which the anomalies decline matches NIRv; yet the VOD anomalies recover later in the year than the NIRv anomalies.
When the dynamics of the vegetation indices during the 2018 drought are evaluated against soil moisture averaged over different depths, a strong non-linear response becomes apparent (Fig. 3). The response is described by a piecewise linear model with a right-hand part with zero slope (i.e. assuming no stress). This three-parameter model describes the response better than a two-parameter linear model, as indicated by consistently higher values for the adjusted R2 (average R2 of 0.82 versus 0.63; see Table 1). Due to the difference in dynamics in VOD, we removed the first days of June, as the VOD anomalies were still increasing over this period (see Fig. 2). Over the selected period, VOD anomalies show no clear trend, and the average value (and period) can be found in Fig. 2. Initially, NIRv and VOD anomalies remain roughly at a constant level, while soil moisture decreases considerably. It took 3 weeks before NIRv anomalies showed a decrease and 2 weeks for VOD. Next, this constant phase is followed by a second phase in which NIRv and VOD anomalies decrease approximately linearly with soil moisture, indicating a strong drought impact on vegetation productivity. The non-linearity is present when soil moisture is evaluated over different depths ranging from a shallow top layer (0–5 cm) to most of the root zone (0–80 cm), using the representative soil column thickness (see Methods) to correct the soil moisture values. However, soil moisture values, including the transitional point marking the start of the drought impact on vegetation productivity, are generally lower, with a difference in volumetric water content between 0.05 and 0.10 for both sites. The point separating the two phases of non-stressed and water-stressed conditions can be interpreted as the critical soil moisture content.
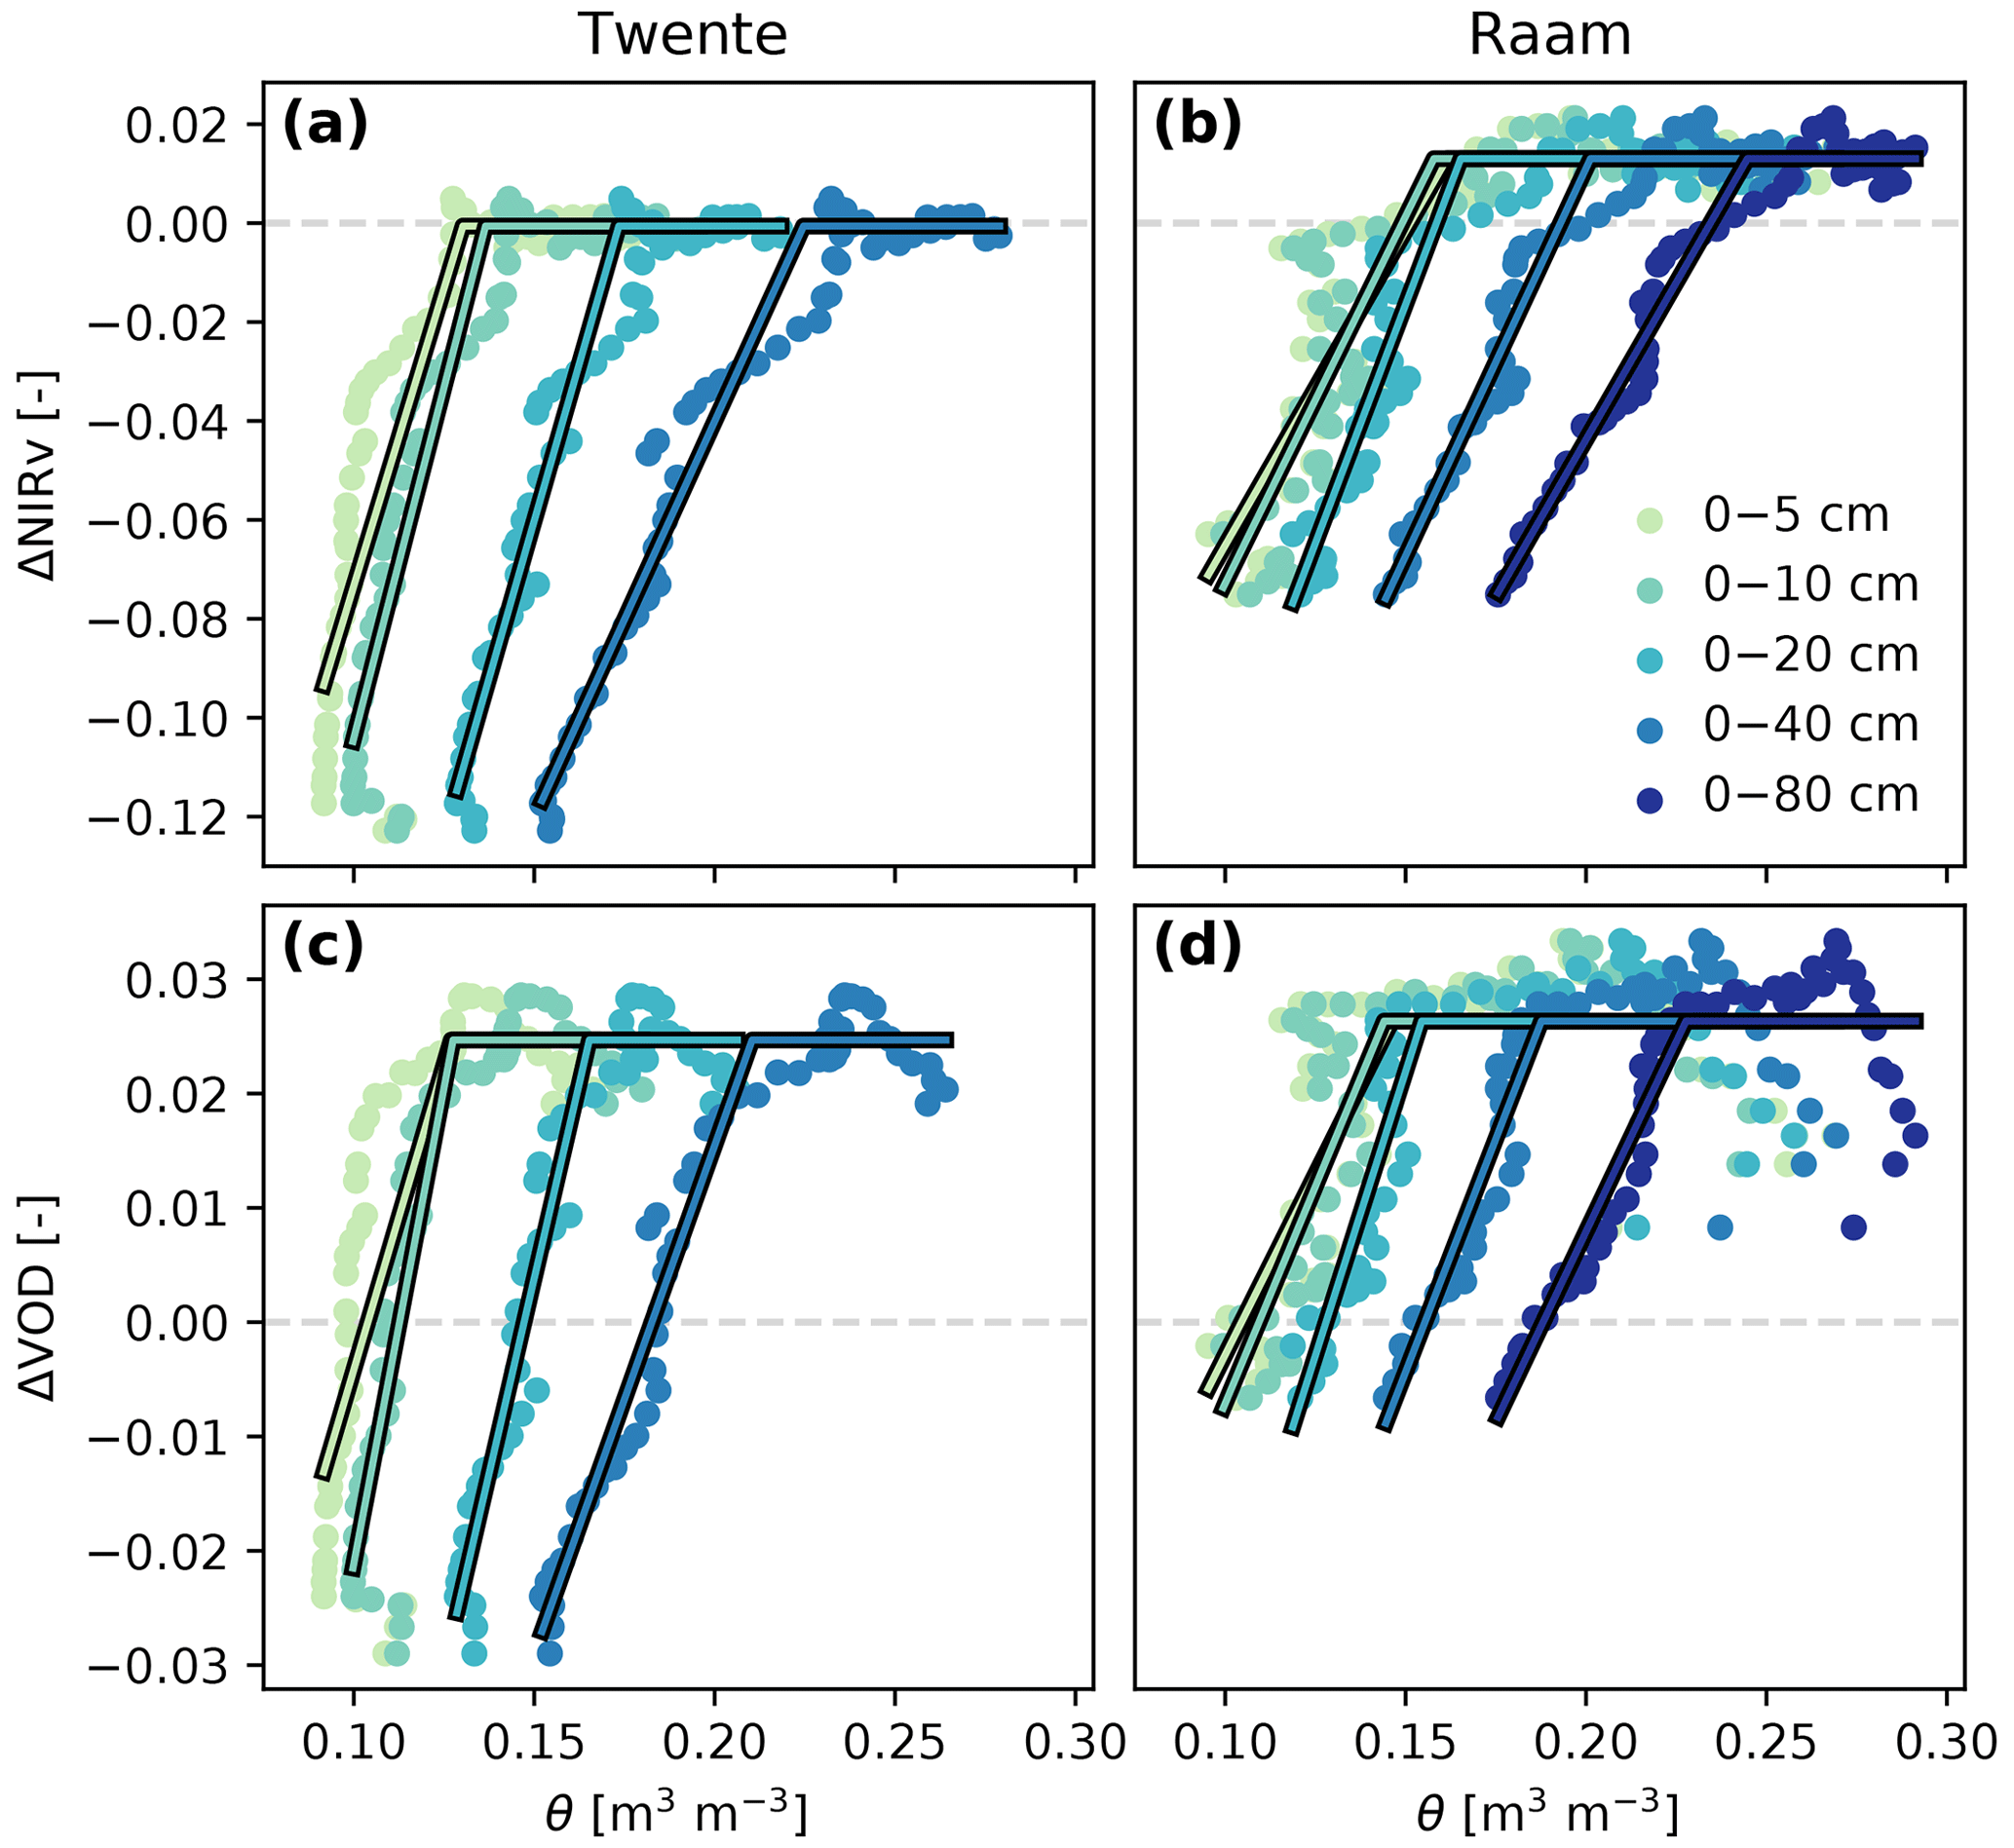
Figure 3Relation between regional anomalies in vegetation indices and soil moisture (dots) and the piecewise linear fit (lines) for Twente (a, c) and Raam (b, d), for both NIRv (a, b) and VOD (c, d). The horizontal part of the piecewise fit was set at the average vegetation index anomaly value in the first part of the summer period (corresponding to the horizontal line in Fig. 2a and b). Note that all values represent average values over the regions, as shown in Fig. 2.
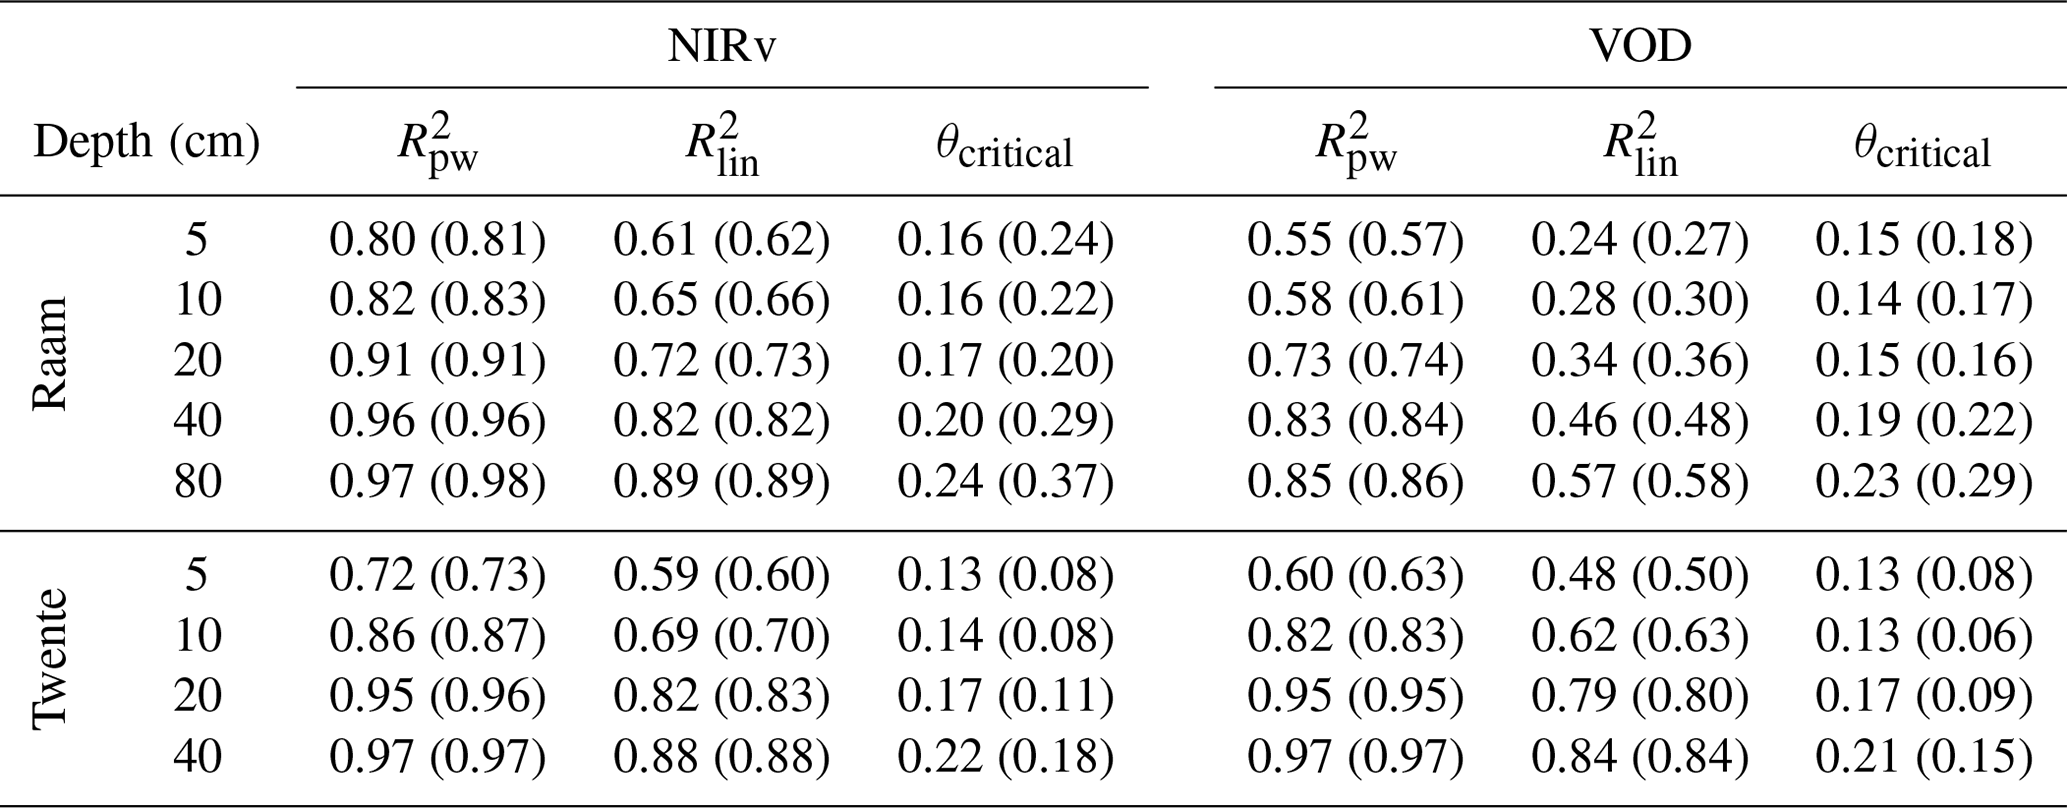
Table 1Fit statistics and resulting critical soil moisture content based on both NIRv and VOD data. values are shown for both the piecewise (pw) and linear (lin) fits, adjusted for the number of parameters used in the fit; the value in brackets shows the standard R2 value. The critical soil moisture content in brackets is the value normalized between minimum and maximum moisture content values at each integration depth.
Further analysis of the evolution of regional-scale average soil moisture profiles (Fig. 4) reveals the origin of the differences found in Fig. 3. In normal years, soil moisture dries out considerably in the upper layers (down to values in the range 0.15–0.20) but much less in the lower layers, where values stay around 0.30. This is partly due to the fact that in a normal summer, JJA potential evapotranspiration according to Makkink's method (2.9–3.1 mm d−1) is nearly balanced by precipitation with 2.3–2.8 mm d−1. This likely allows vegetation to take up most of the water in the upper part of the root zone. In 2018, the increased atmospheric demand for evaporation, as reflected in a higher potential evapotranspiration (3.6–3.7 mm d−1, so a 20 % increase), combined with a strong reduction in precipitation (1.3–1.4 mm d−1, so a nearly 50 % reduction), led to a strong initial drying of the surface layer. This is reflected in the negative anomalies which peak around the start of July (DOY 184 and 192 for Raam and Twente, respectively). Only later did strong negative anomalies develop deeper in the root zone (DOY 220 and 221 for Raam and Twente, respectively), potentially due to enhanced root water uptake to (partly) compensate for the reduced uptake in the surface layers. This contrasts sharply with normal summer conditions under which most of the uptake takes place in the surface layers. The anomalies at 40 and 80 cm depth reach their maximum only at the end of the main drought or even later. This explains the large discrepancy between surface and root zone soil moisture at the early stages of the drought.
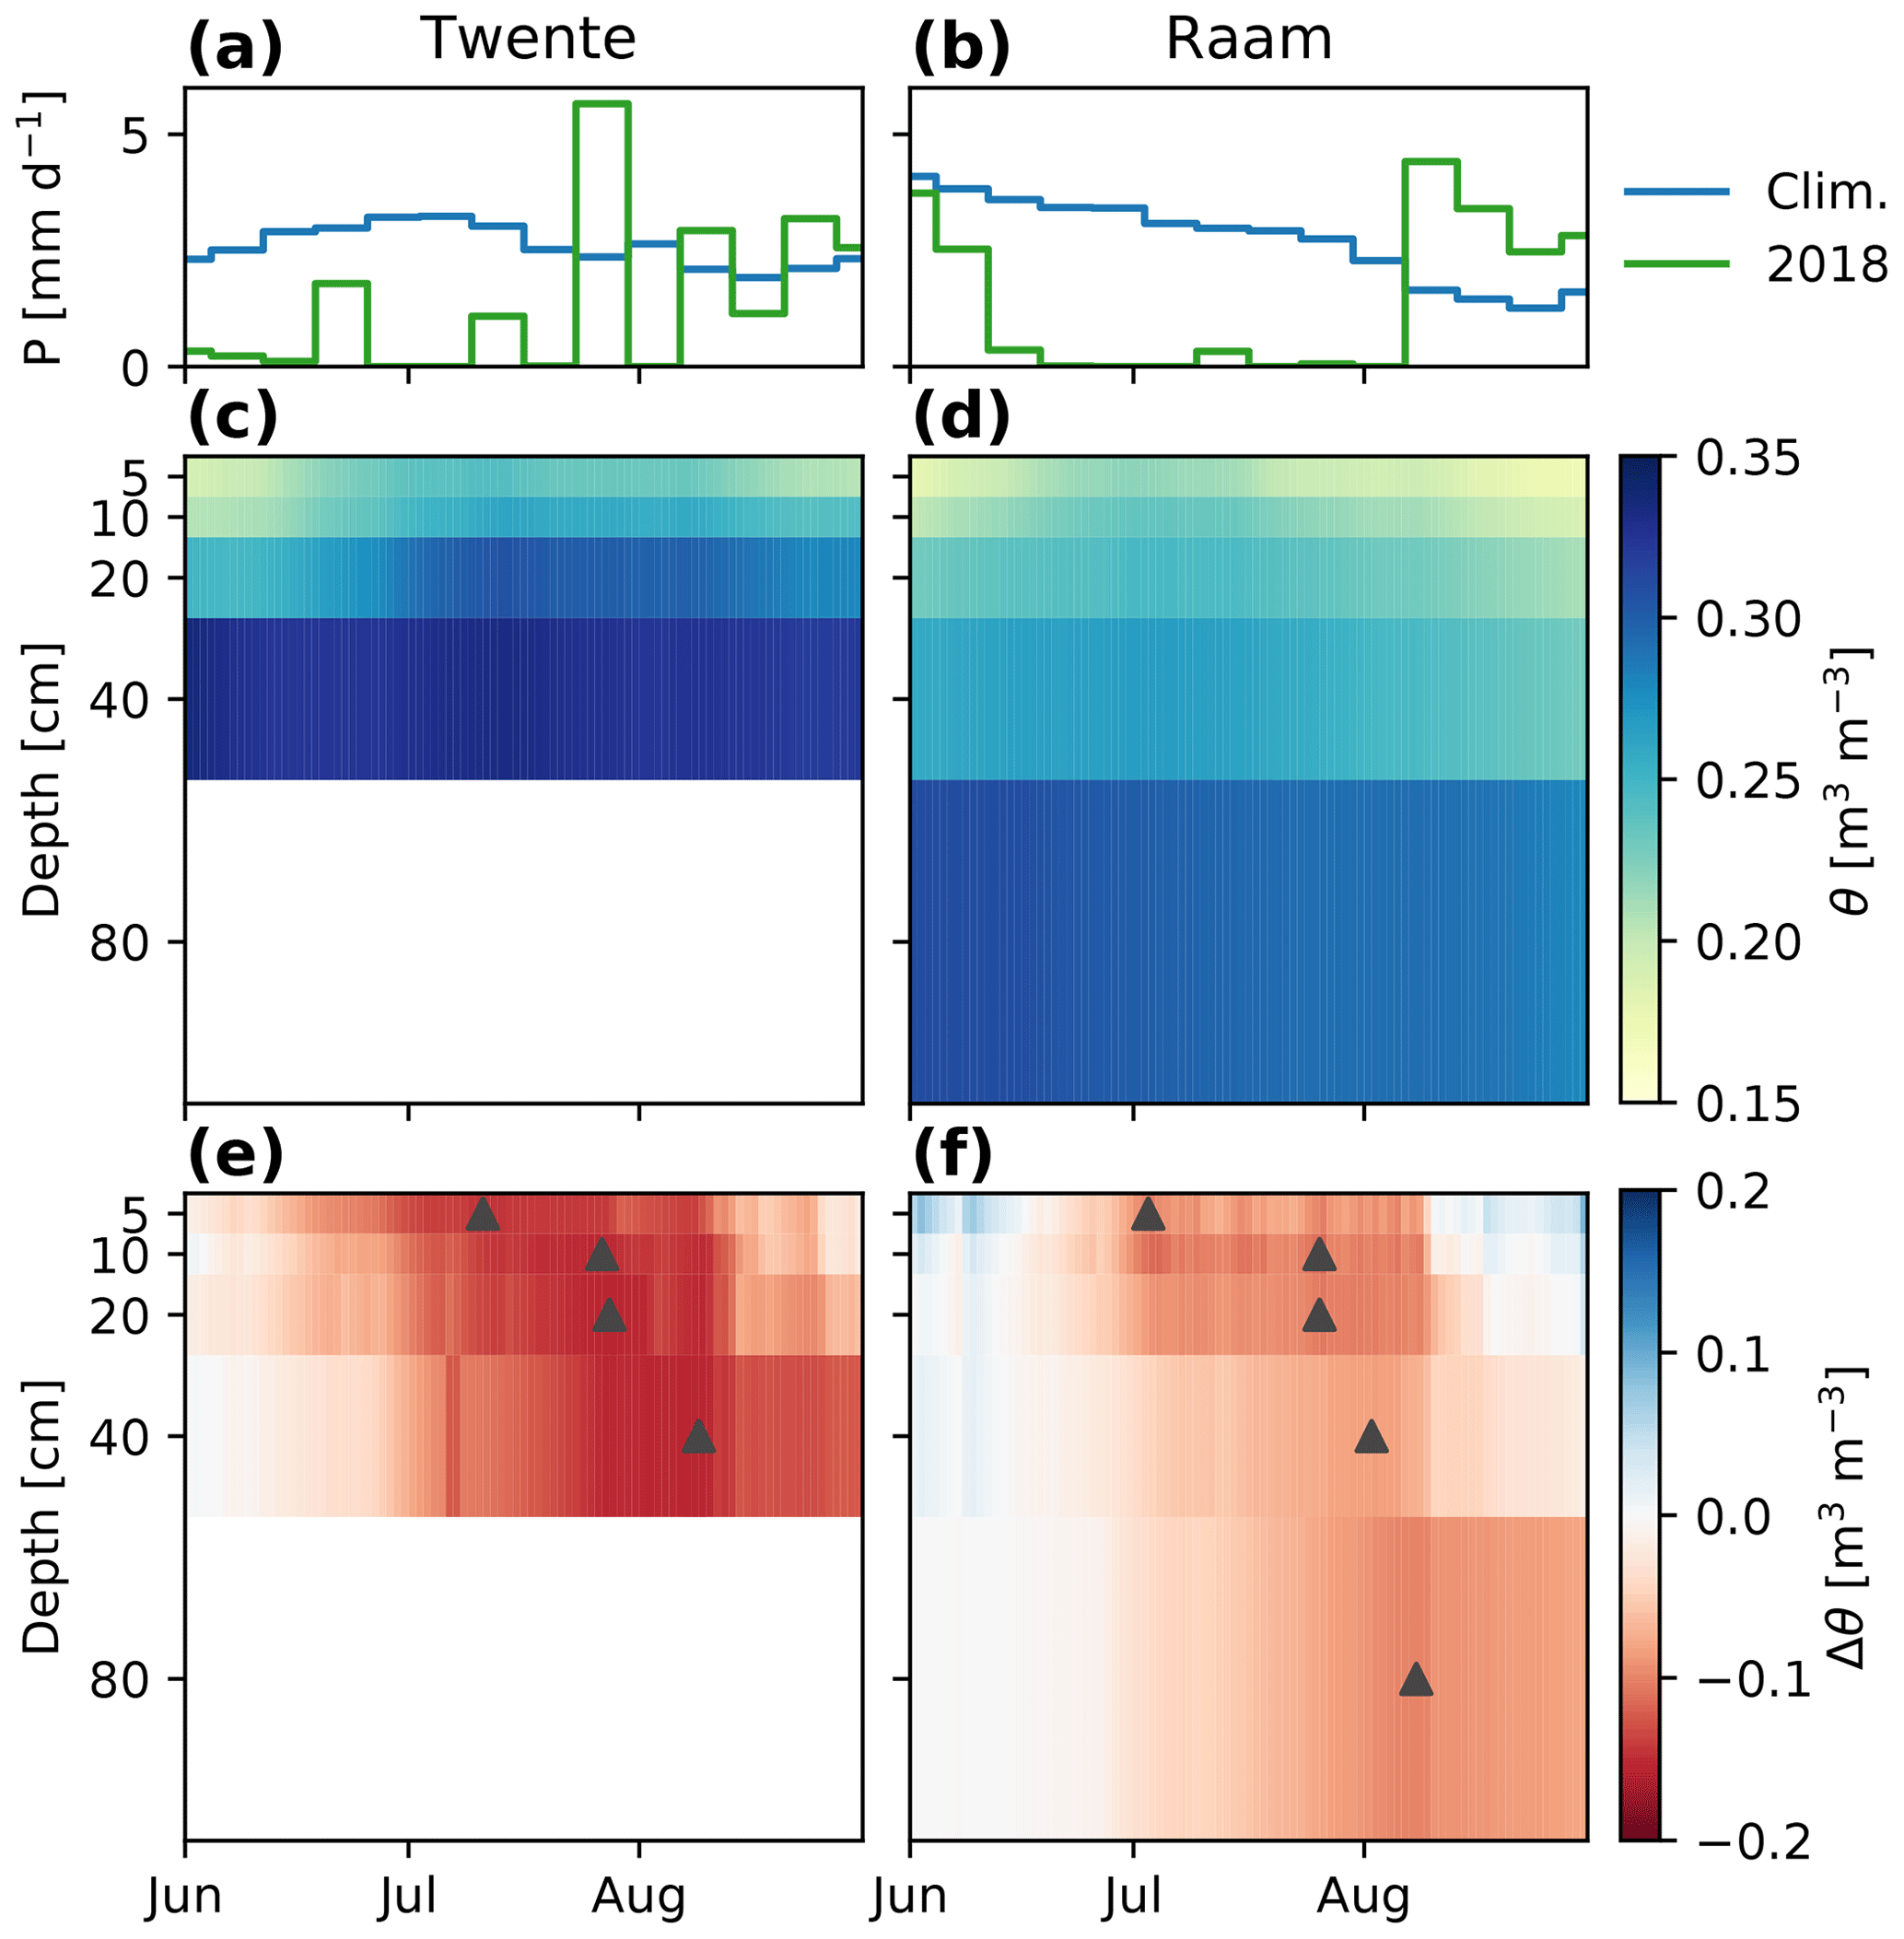
Figure 4Temporal evolution of observed precipitation and soil moisture profiles during the 2018 drought. For precipitation, (a, b) show the precipitation recorded at the KNMI stations of Twenthe and Volkel (see location in Fig. 1c and d). For soil moisture, the climatology (mean 2016–2017, panels c and d) and the 2018 anomalies (e, f) are shown for Twente (a, c, e) and Raam (b, d, f). The triangles in (e) and (f) indicate the moment of maximum negative anomaly at each depth.
When the critical moisture contents inferred in Fig. 3 are evaluated against the integration depth of the soil moisture observations, we find the results in Fig. 5. Ideally, there should be no dependency of the critical moisture content on depth because this would facilitate the identification and use of the critical moisture content in models. However both networks show a similar, strong dependency with depth, with the inferred critical moisture content ranging from 0.13–0.16 m m for shallow soil moisture observations to over 0.20 m m when observations over most of the root zone are used. The inferred relations between critical soil moisture and depth are found to be roughly equal for the fits based on NIRv and VOD data. The uncertainty bars resulting from bootstrapping show larger uncertainty at shallower integration depths; yet the values found at shallower depths are lower than values at deeper integration depths. Given the increasing relation of critical soil moisture with depth, and since the root zone is presumably deeper than 1 m, it is possible that observations over the entire root zone will lead to even higher values. The critical soil moisture values can be found in Table 1. This table also shows the relative θcritical determined using the minimum and maximum soil moisture values over the period 2016–2018.
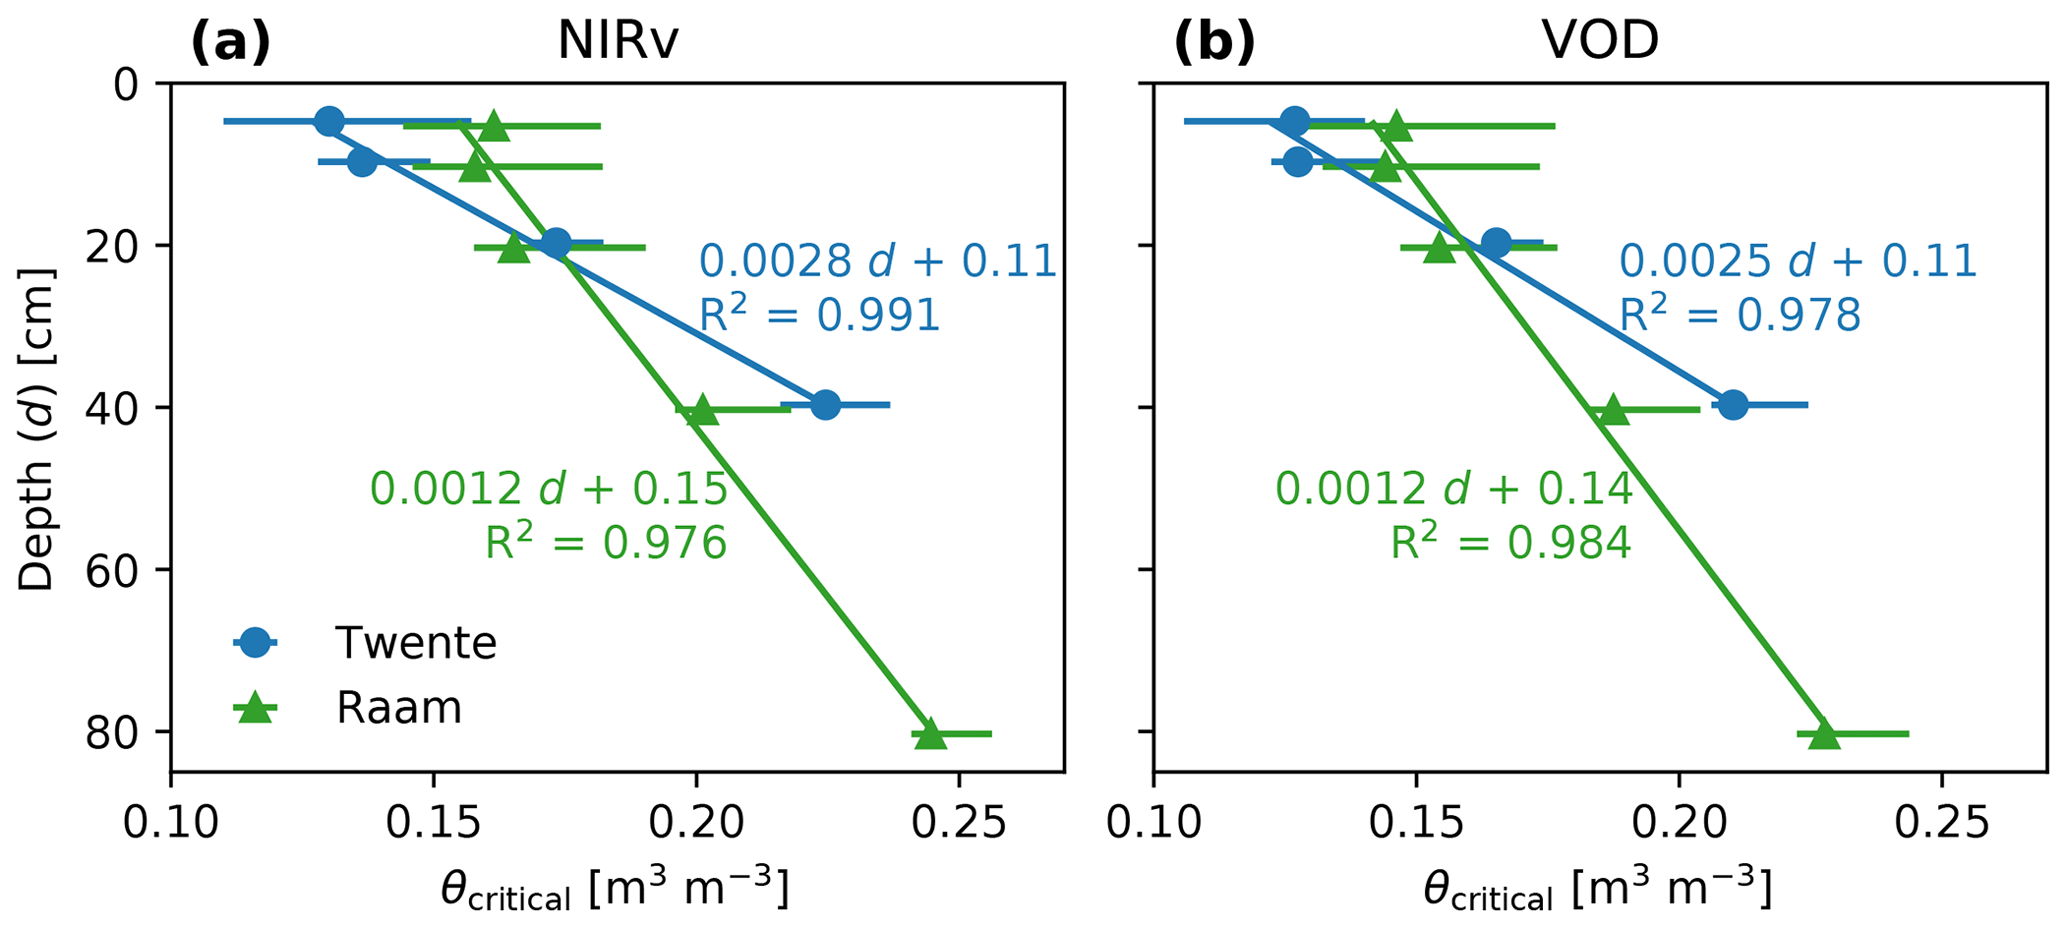
Figure 5Relation between critical soil moisture and the integration depth (denoted as d in the equation) of soil moisture used in the inference. Panel (a) shows the relation based on the NIRv data, and (b) shows the relation based on the VOD data. Horizontal lines indicate the 5 %–95 % range of critical soil moisture values.
This study combined data from two Dutch soil moisture networks with high-resolution satellite vegetation indices as a novel approach to quantify agricultural drought conditions and impact. The 2018 summer drought had considerable impact in the areas where the networks were situated.
The inferred θcritical – marking the transition between non-stressed (energy-limited ET) and stressed (water-limited ET) soil moisture regimes – is found to be dependent on monitoring depth. Accurate determination of the θcritical is essential for describing the relation between vegetation's response to water stress and carbon flux predictions during drought events (Boese et al., 2019; Green et al., 2019; Stocker et al., 2019) as current parametric expressions are unsuitable under droughts (Madi et al., 2018). This study highlights the particular value of in situ soil moisture networks, besides their purpose to calibrate and validate satellite-derived observations (Dorigo et al., 2011), to inform about θcritical, as root water uptake dynamics and ET rates cannot easily be derived from satellite observations (Purdy et al., 2018).
We found a decline in NIRv and VOD to occur only once surface soil moisture had already reached its lowest level. Satellite-derived observations of the soil's subsurface can certainly serve as early predictors for drought onset (Ford et al., 2015; Otkin et al., 2018); yet drought also leads to decoupling of the soil moisture signal over depth (Carranza et al., 2018), rendering satellite-derived soil moisture or in situ surface soil moisture observations uninformative about root water uptake and drought impact status. This effect, in combination with the sandy texture of the soils in both networks, can also explain why we find values for θcritical that are lower than those from recent estimates based on satellite soil moisture (Denissen et al., 2020). Assessment of vegetation response to profile soil moisture requires observations both at multiple depths and at multiple profiles to average out small-scale heterogeneities (Teuling et al., 2006).
This study determined the θcritical with data that were already available. The method would in principle allow root water uptake regimes to be identified during droughts without the need for (difficult to obtain) vegetation-driven biophysical landscape interactions (for example (Prentice et al., 2014; Warren et al., 2015; v. d. Ploeg et al., 2018)). However, within the Raam and Twente networks, the maximum measurement depth of θ (80 and 40 cm respectively) may have been insufficient to capture the complete propagation of soil moisture anomalies in the root zone and their possible link to root water uptake dynamics. Were the measurement setups of both networks harmonized by covering the entire root zone, it would have provided a more accurate comparison of drought impacts and variability in soil moisture (Dorigo et al., 2011). When the focus of establishing a soil moisture network is not to validate satellite-derived observations – as was the case for these two networks – but to quantify drought effects on root water uptake, the maximum rooting depth of the vegetation near soil moisture stations should be considered, even though temporal dynamics of soil moisture and root water uptake under non-drought conditions predominantly occur in the upper 70 cm of the soil profile (Teuling et al., 2006).
Ideally, the values for θcritical are considered with respect to the wilting point and field capacity because these, in concert with the rooting depth, determine the soil moisture dynamics (Albertson and Kiely, 2001). However these values themselves are highly variable spatially but also vertically over the soil profile. For sandy (Raam) to more loamy (Twente) soils, these characteristic soil moisture values are generally assumed to be in the range of a few vol % (wilting point) and between 15 and 25 vol % (field capacity). However, differences between various pedotransfer methods can be large (Teuling et al., 2009). Based on the length of the time before a reduction in NIRv and VOD anomalies was first observed, it can be inferred that even in these coarse soils, a significant storage exists between field capacity and the critical moisture content that can be utilized by plants during drought onset.
This study also provides realistic environmental conditions of drought at relevant scales. In a recent meta-analysis of studies on drought impacts on ecosystems, Slette et al. (2019) concluded that drought is often poorly defined, and many supposed drought experiments take place within the normal range of climate variability rather than an extreme drought. This is problematic because drought impact is not proportional to drought severity but increases rapidly once a critical threshold has been exceeded. More research is therefore needed to identify and quantify drought thresholds and impacts across ecosystems and climate regions, especially in light of co-evolution in soil–vegetation–fauna–microbial relations, particularly the different strategies with which these relationships are adopted, modified, or adapted (Robinson et al., 2019). Failure to represent such ecosystem strategies in Earth system models might affect our ability to make reliable projections of future drought impact. The methodology presented here informs to better constrain drought-relevant parameters, such as the critical moisture content, in models.
A prolonged period of no (or very low) precipitation during the summer of 2018 caused profound negative soil moisture anomalies compared to the 2 prior years in the Raam and Twente. The decrease in soil moisture proceeded into deeper layers with time as a consequence of root water uptake shifting predominantly to those layers. Subsequently, ET decreased, which is in line with the low 2018 GPP proxies SIF, NIRv, and VOD obtained via satellites throughout the growing season. Root water uptake was observed to shift to deeper layers after the first reduction in NIRv and VOD, indicating that changing root water uptake patterns can help to reduce drought impact but not to avoid it in the case of the drought of 2018. Soil moisture, ET, and GPP remained low until the end of summer.
Using a novel approach, the critical soil moisture content (θcritical) was derived from NIRv and VOD anomalies and soil moisture measurements at multiple depths. This non-linear relation reflects the observation that negative soil moisture anomalies develop 2–3 weeks before the first reduction in vegetation indices. The critical soil moisture content in the Raam network at 40 cm depth is found to be 0.19 and in the Twente network 0.22 (m m). The apparent critical soil moisture content increased with depth, and this relationship was shown to be linear. The critical soil moisture content can serve as an indicator to mark the transition between non-stressed and stressed conditions to examine the impact on the gross primary productivity of vegetation and effect on the carbon cycle in models during droughts.
Daily precipitation, potential evaporation, NIRv, VOD, and average soil moisture data for the different depths over the period 2016–2018 for Raam and Twente can be obtained from Buitink et al. (2020) (https://doi.org/10.6084/m9.figshare.12090591.v2). E-OBS gridded precipitation (v20.0e) was obtained from Cornes et al. (2018) (https://doi.org/10.1029/2017JD028200).The MODIS NDVI and NIRT were obtained from Schaaf and Wang (2015) (https://doi.org/10.5067/MODIS/MCD43A1.006).
AMS carried out the original study under supervision of AJT, MvdP, and NES. AJT conceived and coordinated the study. CDUC, FvdB, HJFB, and RvdV assisted with the collection and interpretation of the soil moisture data. GK helped with the processing and interpretation of the satellite data. JB verified and extended the analysis with VOD data and produced the final figures and results. AJT and MvdP drafted the paper, an JB critically revised the paper. All authors gave final approval for publication and agree to be held accountable for the work performed in this study.
The authors declare that they have no conflict of interest.
We acknowledge the E-OBS dataset from the EU-FP6 project UERRA (http://www.uerra.eu, last access: 18 December 2020) and the Copernicus Climate Change Service and the data providers in the ECA & D project (https://www.ecad.eu, last access: 18 December 2020).
This paper was edited by Nunzio Romano and reviewed by two anonymous referees.
Albertson, J. D. and Kiely, G.: On the structure of soil moisture time series in the context of land surface models, J. Hydrol., 243, 101–119, https://doi.org/10.1016/S0022-1694(00)00405-4, 2001. a
Badgley, G., Field, C. B., and Berry, J. A.: Canopy near-infrared reflectance and terrestrial photosynthesis, Sci. Adv., 3, e1602244, https://doi.org/10.1126/sciadv.1602244, 2017. a, b
Badgley, G., Anderegg, L. D. L., Berry, J. A., and Field, C. B.: Terrestrial gross primary production: Using NIRV to scale from site to globe, Global Change Biol., 25, 3731–3740, https://doi.org/10.1111/gcb.14729, 2019. a, b
Bakke, S. J., Ionita, M., and Tallaksen, L. M.: The 2018 northern European hydrological drought and its drivers in a historical perspective, Hydrol. Earth Syst. Sci., 24, 5621–5653, https://doi.org/10.5194/hess-24-5621-2020, 2020. a
Baldocchi, D. D., Ryu, Y., Dechant, B., Eichelmann, E., Hemes, K., Ma, S., Sanchez, C. R., Shortt, R., Szutu, D., Valach, A., Verfaillie, J., Badgley, G., Zeng, Y., and Berry, J. A.: Outgoing Near Infrared Radiation from Vegetation Scales with Canopy Photosynthesis Across a Spectrum of Function, Structure, Physiological Capacity and Weather, J. Geophys. Res.-Biogeo., 125, e2019JG005534, https://doi.org/10.1029/2019JG005534, 2020. a
Bassiouni, M., Good, S. P., Still, C. J., and Higgins, C. W.: Plant Water Uptake Thresholds Inferred From Satellite Soil Moisture, Geophys. Res. Lett., 47, e2020GL087077, https://doi.org/10.1029/2020GL087077, 2020. a
Benninga, H.-J. F., Carranza, C. D. U., Pezij, M., van Santen, P., van der Ploeg, M. J., Augustijn, D. C. M., and van der Velde, R.: The Raam regional soil moisture monitoring network in the Netherlands, Earth Syst. Sci. Data, 10, 61–79, https://doi.org/10.5194/essd-10-61-2018, 2018. a, b, c
Boese, S., Jung, M., Carvalhais, N., Teuling, A. J., and Reichstein, M.: Carbon–water flux coupling under progressive drought, Biogeosciences, 16, 2557–2572, https://doi.org/10.5194/bg-16-2557-2019, 2019. a, b
Braud, I., Varado, N., and Olioso, A.: Comparison of root water uptake modules using either the surface energy balance or potential transpiration, J. Hydrol., 301, 267–286, https://doi.org/10.1016/j.jhydrol.2004.06.033, 2005. a
Brauer, C. C., Teuling, A. J., Overeem, A., van der Velde, Y., Hazenberg, P., Warmerdam, P. M. M., and Uijlenhoet, R.: Anatomy of extraordinary rainfall and flash flood in a Dutch lowland catchment, Hydrol. Earth Syst. Sci., 15, 1991–2005, https://doi.org/10.5194/hess-15-1991-2011, 2011. a
Brauer, C. C., v. d. Velde, Y., Teuling, A. J., and Uijlenhoet, R.: The Hupsel Brook Catchment: Insights from Five Decades of Lowland Observations, Vadose Zone J., 17, 180056, https://doi.org/10.2136/vzj2018.03.0056, 2018. a
Buitink, J., Swank, A. M., van der Ploeg, M., Smith, N. E., Benninga, H.-J. F., van der Bolt, F., Carranza, C. D. U., Koren, G., van der Velde, R., and Teuling, A. J.: Evolution of NIRv, VOD and soil moisture content during the summers of 2016–2018 in Raam and Twenthe, the Netherlands (Version 2), figshare, https://doi.org/10.6084/m9.figshare.12090591.v2, 2020. a
Capehart, W. J. and Carlson, T. N.: Decoupling of surface and near-surface soil water content: A remote sensing perspective, Water Resour. Res., 33, 1383–1395, https://doi.org/10.1029/97WR00617, 1997. a
Carranza, C. D. U., van der Ploeg, M. J., and Torfs, P. J. J. F.: Using lagged dependence to identify (de)coupled surface and subsurface soil moisture values, Hydrol. Earth Syst. Sci., 22, 2255–2267, https://doi.org/10.5194/hess-22-2255-2018, 2018. a, b
Ciais, P., Reichstein, M., Viovy, N., Granier, A., Ogée, J., Allard, V., Aubinet, M., Buchmann, N., Bernhofer, C., Carrara, A., Chevallier, F., De Noblet, N., Friend, A. D., Friedlingstein, P., Grünwald, T., Heinesch, B., Keronen, P., Knohl, A., Krinner, G., Loustau, D., Manca, G., Matteucci, G., Miglietta, F., Ourcival, J. M., Papale, D., Pilegaard, K., Rambal, S., Seufert, G., Soussana, J. F., Sanz, M. J., Schulze, E. D., Vesala, T., and Valentini, R.: Europe-wide reduction in primary productivity caused by the heat and drought in 2003, Nature, 437, 529–533, https://doi.org/10.1038/nature03972, 2005. a
Combe, M., de Arellano, J. V.-G., Ouwersloot, H. G., and Peters, W.: Plant water-stress parameterization determines the strength of land–atmosphere coupling, Agr. Forest Meteorol., 217, 61–73, https://doi.org/10.1016/j.agrformet.2015.11.006, 2016. a
Cornes, R. C., van der Schrier, G., van den Besselaar, E. J. M., and Jones, P. D.: An Ensemble Version of the E-OBS Temperature and Precipitation Data Sets, J. Geophys. Res.-Atmos., 123, 9391–9409, https://doi.org/10.1029/2017JD028200, 2018. a, b
Denissen, J. M. C., Teuling, A. J., Reichstein, M., and Orth, R.: Critical Soil Moisture Derived From Satellite Observations Over Europe, J. Geophys. Res.-Atmos., 125, e2019JD031672, https://doi.org/10.1029/2019JD031672, 2020. a, b
Denmead, O. T. and Shaw, R. H.: Availability of Soil Water to Plants as Affected by Soil Moisture Content and Meteorological Conditions 1, Agron. J., 54, 385–390, https://doi.org/10.2134/agronj1962.00021962005400050005x, 1962. a
Dente, L., Vekerdy, Z., Su, Z., and Ucer, M.: Twente soil moisture and soil temperature monitoring network, University of Twente, available at: https://research.utwente.nl/en/publications/twente-soil-moisture-and-soil-temperature-monitoring-network (last access: 18 December 2020), 2011. a, b
Dorigo, W. A., Wagner, W., Hohensinn, R., Hahn, S., Paulik, C., Xaver, A., Gruber, A., Drusch, M., Mecklenburg, S., van Oevelen, P., Robock, A., and Jackson, T.: The International Soil Moisture Network: a data hosting facility for global in situ soil moisture measurements, Hydrol. Earth Syst. Sci., 15, 1675–1698, https://doi.org/10.5194/hess-15-1675-2011, 2011. a, b
Ford, T. W., McRoberts, D. B., Quiring, S. M., and Hall, R. E.: On the utility of in situ soil moisture observations for flash drought early warning in Oklahoma, USA, Geophys. Res. Lett., 42, 9790–9798, https://doi.org/10.1002/2015GL066600, 2015. a
Frankenberg, C., Fisher, J. B., Worden, J., Badgley, G., Saatchi, S. S., Lee, J.-E., Toon, G. C., Butz, A., Jung, M., Kuze, A., and Yokota, T.: New global observations of the terrestrial carbon cycle from GOSAT: Patterns of plant fluorescence with gross primary productivity, Geophys. Res. Lett., 38, L17706, https://doi.org/10.1029/2011GL048738, 2011. a
Geertsema, T. J., Teuling, A. J., Uijlenhoet, R., Torfs, P. J. J. F., and Hoitink, A. J. F.: Anatomy of simultaneous flood peaks at a lowland confluence, Hydrol. Earth Syst. Sci., 22, 5599–5613, https://doi.org/10.5194/hess-22-5599-2018, 2018. a
Green, J. K., Seneviratne, S. I., Berg, A. M., Findell, K. L., Hagemann, S., Lawrence, D. M., and Gentine, P.: Large influence of soil moisture on long-term terrestrial carbon uptake, Nature, 565, 476–479, https://doi.org/10.1038/s41586-018-0848-x, 2019. a
Green, S. R. and Clothier, B. E.: Root water uptake by kiwifruit vines following partial wetting of the root zone, Plant Soil, 173, 317–328, https://doi.org/10.1007/BF00011470, 1995. a
Joiner, J., Guanter, L., Lindstrot, R., Voigt, M., Vasilkov, A. P., Middleton, E. M., Huemmrich, K. F., Yoshida, Y., and Frankenberg, C.: Global monitoring of terrestrial chlorophyll fluorescence from moderate-spectral-resolution near-infrared satellite measurements: methodology, simulations, and application to GOME-2, Atmos. Meas. Tech., 6, 2803–2823, https://doi.org/10.5194/amt-6-2803-2013, 2013. a
Joiner, J., Yoshida, Y., Guanter, L., and Middleton, E. M.: New methods for the retrieval of chlorophyll red fluorescence from hyperspectral satellite instruments: simulations and application to GOME-2 and SCIAMACHY, Atmos. Meas. Tech., 9, 3939–3967, https://doi.org/10.5194/amt-9-3939-2016, 2016. a
Jolly, W. M., Dobbertin, M., Zimmermann, N. E., and Reichstein, M.: Divergent vegetation growth responses to the 2003 heat wave in the Swiss Alps, Geophys. Res. Lett., 32, L18409, https://doi.org/10.1029/2005GL023252, 2005. a
Kleine, L., Tetzlaff, D., Smith, A., Wang, H., and Soulsby, C.: Using water stable isotopes to understand evaporation, moisture stress, and re-wetting in catchment forest and grassland soils of the summer drought of 2018, Hydrol. Earth Syst. Sci., 24, 3737–3752, https://doi.org/10.5194/hess-24-3737-2020, 2020. a
Konings, A. G., Piles, M., Rötzer, K., McColl, K. A., Chan, S. K., and Entekhabi, D.: Vegetation optical depth and scattering albedo retrieval using time series of dual-polarized L-band radiometer observations, Remote Sens. Environ., 172, 178–189, https://doi.org/10.1016/j.rse.2015.11.009, 2016. a, b
Koren, G., van Schaik, E., Araújo, A. C., Boersma, K. F., Gärtner, A., Killaars, L., Kooreman, M. L., Kruijt, B., van der Laan-Luijkx, I. T., von Randow, C., Smith, N. E., and Peters, W.: Widespread reduction in sun-induced fluorescence from the Amazon during the 2015/2016 El Niño, Philos. T. Roy. Soc. B, 373, 20170408, https://doi.org/10.1098/rstb.2017.0408, 2018. a
Kumar, R., Shankar, V., and Jat, M. K.: Evaluation of root water uptake models – a review, ISH J. Hydraul. Eng., 21, 115–124, https://doi.org/10.1080/09715010.2014.981955, 2015. a
Lansu, E. M., v. Heerwaarden, C. C., Stegehuis, A. I., and Teuling, A. J.: Atmospheric Aridity and Apparent Soil Moisture Drought in European Forest During Heat Waves, Geophys. Res. Lett., 47, e2020GL087091, https://doi.org/10.1029/2020GL087091, 2020. a
Li, X., Xiao, J., He, B., Arain, M. A., Beringer, J., Desai, A. R., Emmel, C., Hollinger, D. Y., Krasnova, A., Mammarella, I., Noe, S. M., Ortiz, P. S., Rey-Sanchez, A. C., Rocha, A. V., and Varlagin, A.: Solar-induced chlorophyll fluorescence is strongly correlated with terrestrial photosynthesis for a wide variety of biomes: First global analysis based on OCO-2 and flux tower observations, Global Change Biol., 24, 3990–4008, https://doi.org/10.1111/gcb.14297, 2018. a
Madi, R., de Rooij, G. H., Mielenz, H., and Mai, J.: Parametric soil water retention models: a critical evaluation of expressions for the full moisture range, Hydrol. Earth Syst. Sci., 22, 1193–1219, https://doi.org/10.5194/hess-22-1193-2018, 2018. a
Makkink, G. F.: Evaporation from vegetations in relation with the formula of Penman, in: Verdampingssymposium agrohydrologisch colloquium COLN en rapport inzake de lysimeters in Nederland (II), Commision for Hydrological Research TNO, the Hague, the Netherlands, 90–115, 1960. a
Marchi, L., Borga, M., Preciso, E., and Gaume, E.: Characterisation of selected extreme flash floods in Europe and implications for flood risk management, J. Hydrol., 394, 118–133, https://doi.org/10.1016/j.jhydrol.2010.07.017, 2010. a
Miralles, D. G., Gentine, P., Seneviratne, S. I., and Teuling, A. J.: Land–atmospheric feedbacks during droughts and heatwaves: state of the science and current challenges, Ann. NY Acad. Sci., 1436, 19–35, https://doi.org/10.1111/nyas.13912, 2019. a
Mittelbach, H., Casini, F., Lehner, I., Teuling, A. J., and Seneviratne, S. I.: Soil moisture monitoring for climate research: Evaluation of a low-cost sensor in the framework of the Swiss Soil Moisture Experiment (SwissSMEX) campaign, J. Geophys. Res.-Atmos., 116, D05111, https://doi.org/10.1029/2010JD014907, 2011. a
Moesinger, L., Dorigo, W., De Jeu, R., Van der Schalie, R., Scanlon, T., Teubner, I., and Forkel, M.: The Global Long-term Microwave Vegetation Optical Depth Climate Archive VODCA, Zenodo, https://doi.org/10.5281/zenodo.2575599, 2019. a
Moesinger, L., Dorigo, W., de Jeu, R., van der Schalie, R., Scanlon, T., Teubner, I., and Forkel, M.: The global long-term microwave Vegetation Optical Depth Climate Archive (VODCA), Earth Syst. Sci. Data, 12, 177–196, https://doi.org/10.5194/essd-12-177-2020, 2020. a, b
Otkin, J. A., Svoboda, M., Hunt, E. D., Ford, T. W., Anderson, M. C., Hain, C., and Basara, J. B.: Flash Droughts: A Review and Assessment of the Challenges Imposed by Rapid-Onset Droughts in the United States, B. Am. Meteorol. Soc., 99, 911–919, https://doi.org/10.1175/BAMS-D-17-0149.1, 2018. a
Pijl, A., Brauer, C. C., Sofia, G., Teuling, A. J., and Tarolli, P.: Hydrologic impacts of changing land use and climate in the Veneto lowlands of Italy, Anthropocene, 22, 20–30, https://doi.org/10.1016/j.ancene.2018.04.001, 2018. a
Prentice, I. C., Dong, N., Gleason, S. M., Maire, V., and Wright, I. J.: Balancing the costs of carbon gain and water transport: testing a new theoretical framework for plant functional ecology, Ecol. Lett., 17, 82–91, https://doi.org/10.1111/ele.12211, 2014. a
Purdy, A. J., Fisher, J. B., Goulden, M. L., Colliander, A., Halverson, G., Tu, K., and Famiglietti, J. S.: SMAP soil moisture improves global evapotranspiration, Remote Sens. Environ., 219, 1–14, https://doi.org/10.1016/j.rse.2018.09.023, 2018. a
Reichstein, M., Bahn, M., Ciais, P., Frank, D., Mahecha, M. D., Seneviratne, S. I., Zscheischler, J., Beer, C., Buchmann, N., Frank, D. C., Papale, D., Rammig, A., Smith, P., Thonicke, K., van der Velde, M., Vicca, S., Walz, A., and Wattenbach, M.: Climate extremes and the carbon cycle, Nature, 500, 287–295, https://doi.org/10.1038/nature12350, 2013. a
Robinson, D. A., Hopmans, J. W., Filipovic, V., v. d. Ploeg, M., Lebron, I., Jones, S. B., Reinsch, S., Jarvis, N., and Tuller, M.: Global environmental changes impact soil hydraulic functions through biophysical feedbacks, Global Change Biol., 25, 1895–1904, https://doi.org/10.1111/gcb.14626, 2019. a
Schaaf, C. and Wang, Z.: MCD43A4 MODIS/Terra+ Aqua BRDF/Albedo Nadir BRDF Adjusted RefDaily L3 Global-500 m V006 [Data set], NASA EOSDIS Land Processes DAAC, https://doi.org/10.5067/MODIS/MCD43A4.006, 2015. a, b
Seneviratne, S. I., Corti, T., Davin, E. L., Hirschi, M., Jaeger, E. B., Lehner, I., Orlowsky, B., and Teuling, A. J.: Investigating soil moisture–climate interactions in a changing climate: A review, Earth-Sci. Rev., 99, 125–161, https://doi.org/10.1016/j.earscirev.2010.02.004,, 2010. a, b, c, d
Sharp, R. E. and Davies, W. J.: Root Growth and Water Uptake by Maize Plants in Drying Soil, J. Exp. Bot., 36, 1441–1456, https://doi.org/10.1093/jxb/36.9.1441, 1985. a
Sippel, S., Reichstein, M., Ma, X., Mahecha, M. D., Lange, H., Flach, M., and Frank, D.: Drought, Heat, and the Carbon Cycle: a Review, Curr. Clim. Change Rep., 4, 266–286, https://doi.org/10.1007/s40641-018-0103-4, 2018. a
Slette, I. J., Post, A. K., Awad, M., Even, T., Punzalan, A., Williams, S., Smith, M. D., and Knapp, A. K.: How ecologists define drought, and why we should do better, Global Change Biol., 25, 3193–3200, https://doi.org/10.1111/gcb.14747, 2019. a
Stocker, B. D., Zscheischler, J., Keenan, T. F., Prentice, I. C., Seneviratne, S.I., and Peñuelas, J.: Drought impacts on terrestrial primary production underestimated by satellite monitoring, Nat. Geosci., 12, 264–270, https://doi.org/10.1038/s41561-019-0318-6, 2019. a, b
Teubner, I. E., Forkel, M., Jung, M., Liu, Y. Y., Miralles, D. G., Parinussa, R., van der Schalie, R., Vreugdenhil, M., Schwalm, C. R., Tramontana, G., Camps-Valls, G., and Dorigo, W. A.: Assessing the relationship between microwave vegetation optical depth and gross primary production, Int. J. Appl. Earth Obs. Geoinf., 65, 79–91, https://doi.org/10.1016/j.jag.2017.10.006, 2018. a
Teubner, I. E., Forkel, M., Camps-Valls, G., Jung, M., Miralles, D. G., Tramontana, G., van der Schalie, R., Vreugdenhil, M., Mösinger, L., and Dorigo, W. A.: A carbon sink-driven approach to estimate gross primary production from microwave satellite observations, Remote Sens. Environ., 229, 100–113, https://doi.org/10.1016/j.rse.2019.04.022, 2019. a
Teuling, A. J.: A hot future for European droughts, Nat. Clim. Change, 8, 364–365, https://doi.org/10.1038/s41558-018-0154-5, 2018. a
Teuling, A. J., Uijlenhoet, R., Hupet, F., and Troch, P. A.: Impact of plant water uptake strategy on soil moisture and evapotranspiration dynamics during drydown, Geophys. Res. Lett., 33, L03401, https://doi.org/10.1029/2005GL025019, 2006. a, b, c, d
Teuling, A. J., Uijlenhoet, R., van den Hurk, B., and Seneviratne, S. I.: Parameter Sensitivity in LSMs: An Analysis Using Stochastic Soil Moisture Models and ELDAS Soil Parameters, Jo. Hydrometeorol., 10, 751–765, https://doi.org/10.1175/2008JHM1033.1, 2009. a
Teuling, A. J., van Loon, A. F., Seneviratne, S. I., Lehner, I., Aubinet, M., Heinesch, B., Bernhofer, C., Grünwald, T., Prasse, H., and Spank, U.: Evapotranspiration amplifies European summer drought, Geophys. Res. Lett., 40, 2071–2075, https://doi.org/10.1002/grl.50495, 2013. a, b
van der Molen, M. K., Dolman, A. J., Ciais, P., Eglin, T., Gobron, N., Law, B. E., Meir, P., Peters, W., Phillips, O. L., Reichstein, M., Chen, T., Dekker, S. C., Doubková, M., Friedl, M. A., Jung, M., van den Hurk, B. J. J. M., de Jeu, R. A. M., Kruijt, B., Ohta, T., Rebel, K. T., Plummer, S., Seneviratne, S. I., Sitch, S., Teuling, A. J., van der Werf, G. R., and Wang, G.: Drought and ecosystem carbon cycling, Agr. Forest Meteorol., 151, 765–773, https://doi.org/10.1016/j.agrformet.2011.01.018, 2011. a, b
van Schaik, E., Killaars, L., Smith, N. E., Koren, G., van Beek, L. P. H., Peters, W., and van der Laan-Luijkx, I. T.: Changes in surface hydrology, soil moisture and gross primary production in the Amazon during the 2015/2016 El Niño, Philos. T. Roy. Soc. B, 373, 20180 084, https://doi.org/10.1098/rstb.2018.0084, 2018. a
v. d. Ploeg, M. J., Baartman, J. E. M., and Robinson, D. A.: Biophysical landscape interactions: Bridging disciplines and scale with connectivity, Land Degrad. Dev., 29, 1167–1175, https://doi.org/10.1002/ldr.2820, 2018. a
Warren, J. M., Hanson, P. J., Iversen, C. M., Kumar, J., Walker, A. P., and Wullschleger, S. D.: Root structural and functional dynamics in terrestrial biosphere models – evaluation and recommendations, New Phytol., 205, 59–78, https://doi.org/10.1111/nph.13034, 2015. a