the Creative Commons Attribution 4.0 License.
the Creative Commons Attribution 4.0 License.
 | 16 Dec 2020
Simulation analysis of local land atmosphere coupling in rainy season over a typical underlying surface in the Tibetan Plateau
Zeyong Hu
Zhipeng Xie
Jiemin Wang
Song Yang
The local land–atmosphere coupling (LoCo) investigates the interactions between soil conditions, surface fluxes, planetary boundary layer (PBL) growth, and the formations of convective clouds and precipitation. Studying LoCo over the Tibetan Plateau (TP) is of great significance for understanding the TP's role in the Asian water tower. A series of real-case simulations, using the Weather Research and Forecasting (WRF) model with different combinations of land surface model (LSM) schemes and PBL schemes, has been carried out to investigate the LoCo characteristics over a typical underlying surface in the central TP in the rainy season. The LoCo characteristics in the study area are analyzed by applying a mixing diagram to the simulation results. The analysis indicates that the WRF simulations, using the Noah with BouLac, Mellor-Yamada Nakanishi and Niino Level-2.5 PBL (MYNN), and Yonsei University (YSU) produce closer results to the observation in terms of curves of Cp⋅θ and Lv⋅q, surface fluxes (Hsfc and LEsfc), entrainment fluxes (Hent, and LEent) at site BJ of Nagqu Station (BJ/Nagqu) than those using the Community Land Model (CLM) with BouLac, MYNN, and YSU. The frequency distributions of Hsfc, LEsfc, Hent, and LEent in the study area confirm this result. The spatial distributions of simulated Hsfc, LEsfc, Hent, and LEent, using WRF with Noah and BouLac, suggest that the spatial distributions of Hsfc and LEsfc in the study area are consistent with that of soil moisture, but the spatial distributions of Hent and LEent are quite different from that of soil moisture. A close examination of the relationship between entrainment fluxes and cloud water content (QCloud) reveals that the grids with small Hent and large LEent tend to have high QCloud and Hsfc, suggesting that high Hsfc is conducive to convective cloud formation, which leads to small Hent and large LEent. A sensitivity analysis of LoCo to the soil moisture at site BJ/Nagqu indicates that, on a sunny day, an increase in soil moisture leads to an increase in LEsfc but decreases in Hsfc, Hent, and LEent. The sensitivity of the relationship between simulated maximum daytime PBL height (PBLH) and mean daytime evapotranspiration (ET) in the study area to soil moisture indicates the rate at which the maximum daytime PBLH decreases with the mean ET increase as the initial soil moisture goes up. The analysis of simulated Hsfc, LEsfc, Hent, and LEent under different soil moisture conditions reveals that the frequency of Hent ranging from 80 to 240 W m−2 and the frequency of LEent ranging from −240 to −90 W m−2 both increase as the initial soil moisture increases. Coupled with the changes in QCloud, the changes in Hent and LEent as the initial soil moisture increases indicate that the rise in soil moisture leads to an increase in the cloud amount but a decrease in QCloud.
- Article
(4778 KB) - Full-text XML
- BibTeX
- EndNote


With an average altitude of over 4000 m, the Tibetan Plateau (TP) is also known as the Asian water tower because it is home to many well-known rivers like the Yangtze, Yellow, Mekong, Yalung Tsangpo, Indian, and Ganges rivers (Lu et al., 2005; Immerzeel et al., 2010; Pithan, 2010). Local land–atmosphere coupling (LoCo; Santanello et al., 2009, 2011, 2018) explores the interactions between land surface states, surface fluxes, planetary boundary layer (PBL) development, and the formations of convective clouds and precipitation, which are closely linked to the relevant processes of the water tower. Therefore, studying the LoCo over the TP is of great significance for understanding the characteristics of Asian water tower.
LoCo is defined by Santanello et al. (2011) as the interactions among the land surface state, surface fluxes, PBL development, and the developments of convective clouds and precipitation. The processes of LoCo can be simplified into four individual processes, namely (1) the responses of surface fluxes to land surface states, (2) the responses of PBL evolutions to surface fluxes, (3) the responses of entrainment fluxes, and (4) the collective feedback of the free atmosphere on PBL thermodynamics. Therefore, LoCo analysis can help us understand land–atmospheric interactions from meteorological and climatological perspectives. These processes are highly nonlinear, making it difficult to quantitatively understand LoCo in a reliable way. Therefore, a pair of metrics, which try to produce quantitative understanding of LoCo, have been developed (Santanello et al., 2018). A framework called “mixing diagram” is one of the metrics (Santanello et al., 2009, 2011, 2018) which analyzes PBL thermodynamics using the 2 m potential temperature and humidity, surface fluxes, and PBL height (PBLH). Santanello et al. (2009) constructed a diagnostic framework called a mixing diagram to quantitatively investigate the relationship between soil moisture and the PBL evolution and the PBL energy budget. Then, they furthered this study in Santanello et al. (2011) by combining the mixing diagram with the equivalent potential temperature and the level of lifting condensation to examine the possible role of soil moisture in the formation and development of convective clouds in the Southern Great Plains. The positive and negative feedbacks of LoCo on the formations of convective clouds and precipitation were identified. Santanello et al. (2019) investigated the possible impact of initial soil impact on the numerical weather prediction (NWP) and stated that both initial soil moisture and spatial resolution may have profound impacts on the spread of the NWP. The LoCo analysis, using the mixing diagram, shows great potential to advance our understanding of the interactions between soil conditions and surface fluxes, PBL growth, and the formations of convective clouds.
In the last few decades, our understanding of the individual processes of LoCo in TP has been greatly advanced because a series of scientific programs have been carried out in the TP. Based on the observed data sets from the stations established in the TP, the spatiotemporal distribution of soil temperature and soil moisture in TP has been obtained (Yang et al., 2013; Su et al., 2013; Qin et al., 2013; Zhao et al., 2014), and the temporal variations in surface fluxes over different underlying surfaces have been quantitatively analyzed (Yao et al., 2008; Sun et al., 2016, 2018; Wang et al., 2017; Xin et al., 2018). The spatial distribution of surface fluxes over the whole TP has been gained based on in situ measurements and satellite images (Ma et al., 2005, 2009, 2014b), and long-term variations in surface fluxes have been investigated (Yang et al., 2011, 2014; Han et al., 2017). The profiles of temperature, humidity, and wind speed obtained using radiosonde in Nagqu (Li et al., 2004), NamCo (Lve et al., 2008), Madoi (Li et al., 2017), and Qomulangma (Chen et al., 2008; Li et al., 2011) were used to investigate the PBL evolution at different stations in seasons over the TP. These studies suggested that the PBL in the rainy and dry seasons exhibited distinct daily evolutions and seasonal variations due to the diurnal and seasonal variations in strong surface heating. The simulation analysis of the PBL over Namtso (Yang et al., 2015) reveals that the Namtso lake enhanced the circulation between the lake and land. A study of the reason for the extremely high PBL in the dry season (Chen et al., 2016) reveals that the PBL growth in the dry season is influenced by the surface heating, weak stability of atmosphere, and high upper-level potential vorticity. Xu et al. (2018) assessed the performance of eight PBL schemes in producing reliable PBL characteristics over Nagqu area and found that all the PBL schemes produce warm lower troposphere and higher PBL. Properties of clouds and precipitation have been gained thanks to the radar and lidar measurements over the TP. Liu et al. (2015) studied the clouds and precipitation at Nagqu using 1 year of radar and lidar observations; they stated that the cloud amount and depth in the rainy season exhibited distinct diurnal variation and that strong updrafts existed during the formation of cumuli. Chang and Guo (2016) studied the characteristics of convective clouds in summer, based on radar and lidar measurements, and found that surface heating played an important role in diurnal variations of convective clouds and precipitation. The simulation analysis of mechanism convective precipitation events in TP (Chen et al., 2019) stressed the important role of surface heating in the formation of convective precipitation in the eastern and western part of TP in summer. These studies have greatly advanced our understanding of the relevant processes of LoCo in the TP based on in situ measurements, remote sensing images, and radar and lidar measurements; they highlighted possible connections among these individual processes. However, the underlying mechanisms are still unclear. In this study, we will investigate the possible roles of land surface conditions in convective cloud formation on a sunny day of the rainy reason in terms of LoCo characteristics.
Site BJ of the Nagqu Station of Plateau Climate and Environment, Chinese Academy of Sciences (site BJ/Nagqu; 31.37∘ N, 91.90∘ E; 4509 m), is located in the central TP and has been chosen by a series of scientific programs as being the key station for carrying out their field measurements (Ma et al., 2009, 2014a; Zhao et al., 2018, 2019). In this study, an area of 150 km × 150 km with site BJ/Nagqu in the center was chosen as our study area. One important reason for taking this region as our study area is that there was an intense observation period for a scientific program in 2011 at site BJ/Nagqu (Ma et al., 2014a). Those observation data will be used in this study. Another reason is that the vegetation types in the study area are alpine grassland and alpine wetland, which are very common in the TP. The analysis based on the measurements at site BJ/Nagqu can thus provide valuable information for understanding the land–atmosphere coupling over the TP. The paper is organized as follows. Section 2 introduces the study area, the observation data, and setups of simulations in this study. Section 3 presents the LoCo characteristics in the study area on a sunny day in terms of the PBL energy budget and the possible impact of soil condition on shallow convective clouds. Section 4 presents a discussion based on the analysis above. Section 5 shows the conclusions and the future plans.
2.1 Study area
Simulations using three nested domains (Fig. 1) are carried out. The innermost domain is a region of 150 km × 150 km, with site BJ/Nagqu in the center (Fig. 1b). The altitude in the study area varies from 4400 to 5800 m. The central area is relatively flat, but there are mountains in the southern and western parts of the study area. Based on the observation results of the Nagqu Meteorological Station of the Chinese Meteorological Administration (http://data.cma.cn/, last access: 10 December 2020) from 1980 to 2016, the multiyear monthly mean temperature varies from −11.81 to 9.59 ∘C, and the multiyear monthly mean rainfall varies from 2.16 to 109.69 mm. The climate from July to September is wet and warm, with frequent convective clouds and precipitation due to the strong surface heating and the abundant water vapor brought in by the south Asian monsoon.

Figure 1(a) The three nesting domains in the simulations. (b) Altitude in the study area. The triangle indicates the location of site BJ/Nagqu.
A scientific experiment was carried out at site BJ/Nagqu in July and August 2011. The measurement instruments of this experiment included one automatic weather station (AWS), which provided the measurements of air temperature and humidity at both 1.0 and 8.4 m, wind direction and speed at 10.0 m, surface pressure, the instruments for the four-layer soil temperature and moisture (5, 10, 20, and 40 cm), one eddy covariance system for surface fluxes, and radiosonde measurements for the profiles of temperature, humidity, and wind. Profile data of temperature, humidity, and wind in the daytime were collected in this campaign. The profile data, coupled with surface measurements, make it possible to carry out LoCo simulation analysis in the central TP in the rainy season.
2.2 WRF model setup
The WRF is a state-of-the-art mesoscale numerical simulation system and has been widely used in atmospheric research and forecasting applications. Developed based on the fifth-generation Mesoscale Model (MM5), WRF has a Eulerian mass dynamic core and offers a flexible platform which can combine various schemes of radiation, land surface processes, PBL, and microphysics. The system can produce simulations based on real or idealized atmospheric conditions.
WRF 3.6.1 is used in this study to simulate LoCo interactions in the rainy season in the TP. There are 99×99 grid cells, with a grid resolution of in the outermost domain, and 99×99 grid cells with a grid resolution of in the innermost domain. The vertical levels in the simulations are 39 from the surface to 200 hPa. The forcing data for the simulations are the ERA-Interim (Dee et al., 2011), with a spatial resolution of and a temporal resolution of 6 h. To carry out the real-case simulations, the initial soil moisture was modified based on in situ measurements at site BJ/Nagqu and the leaf area index (LAI) of the Moderate Resolution Imaging Spectroradiometer (MODIS). This is based on the fact that the soil moisture and LAI show similar variation in the rainy season and that the soil moisture in the study from the ERA-Interim is too homogeneous, which is far from the reality. First, the relationship between LAI and soil moisture at 5 cm was derived based on the observed 5 cm soil moisture data at site BJ/Nagqu and LAI product in the rainy season in 2011 (Fig. 2a). The derived relationship between LAI and soil moisture was applied to the LAI product of the study area to obtain a realistic soil moisture for the simulations. Note that there are four layers of soil moisture in Noah (10, 40, 100, and 160 cm) and 10 layers of soil moisture in CLM (1.8, 4.5, 9.06, 16.6, 28.9, 49.3, 82.9, 138.3, 229.6, and 343.3 cm). The variation in soil moisture in the ERA-Interim from 40 cm depth to the top shows very small changes, and we assume that the soil moisture from top to 40 cm depth is the same. We thus modified the soil from 40 cm depth to the top by applying the relationship between soil moisture at 5 cm and LAI (Fig. 2b).
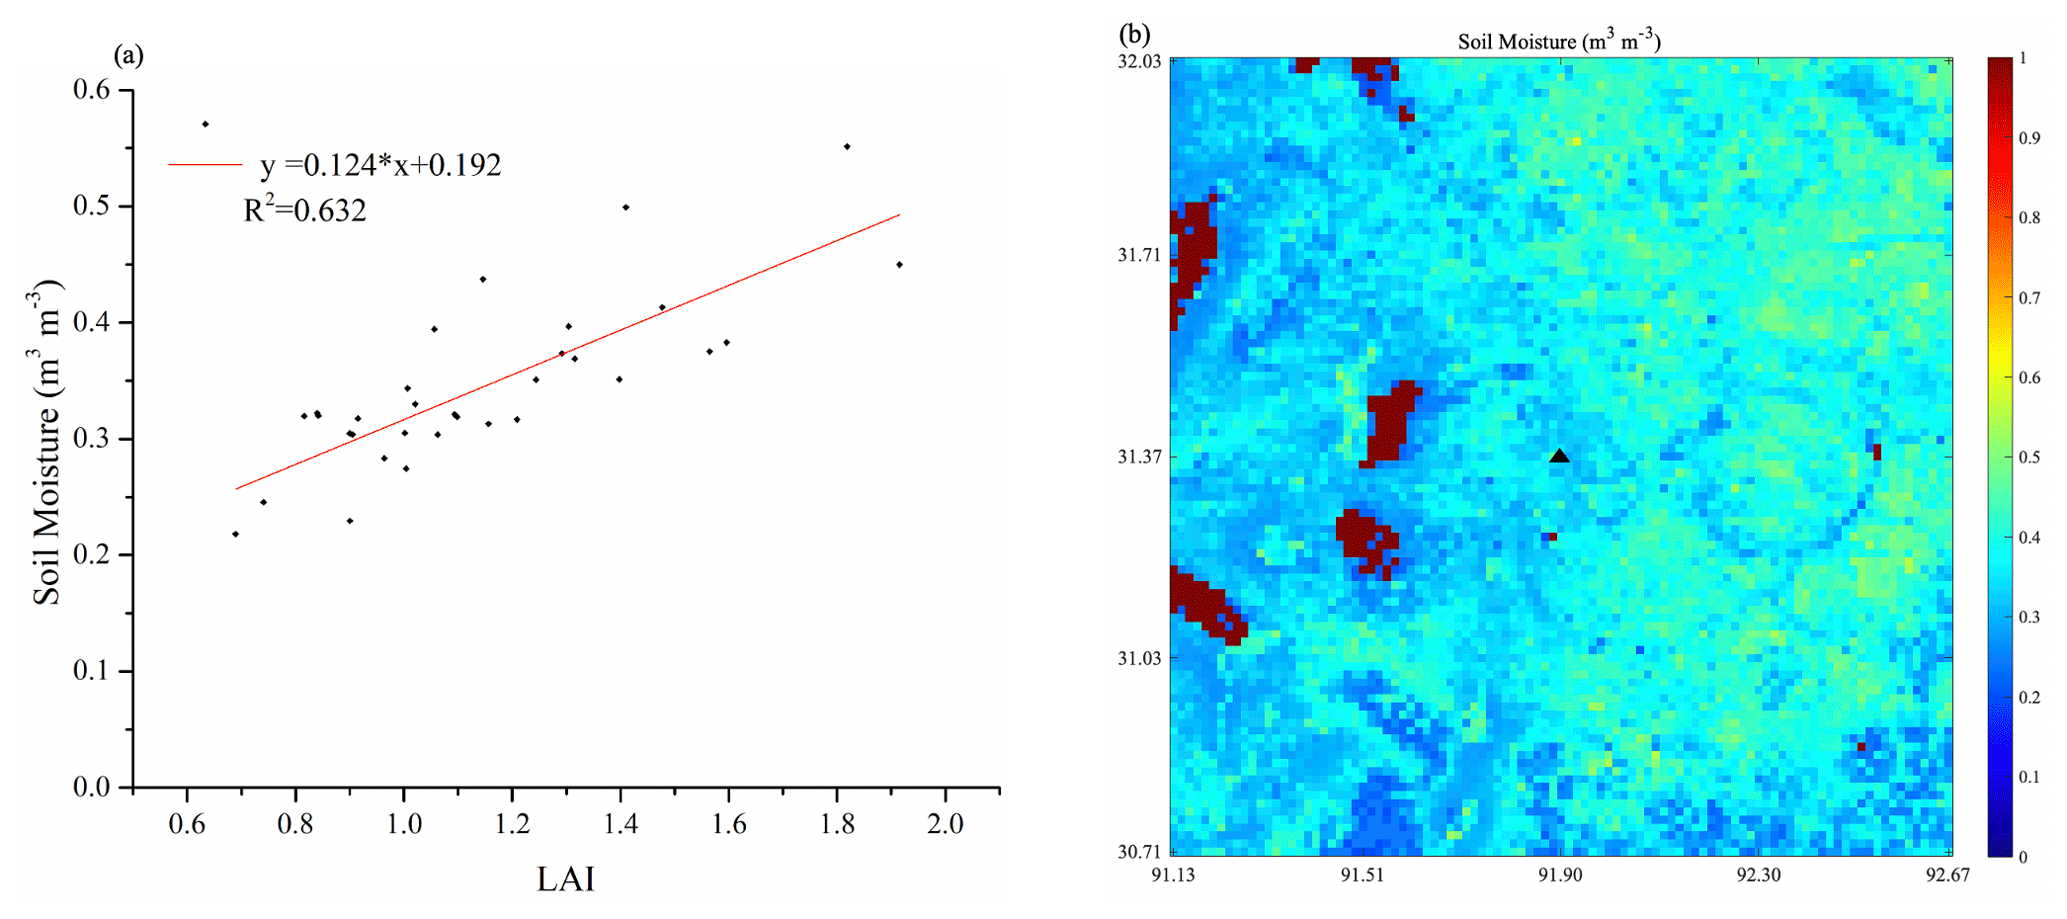
Figure 2(a) Relationship between leaf area index (LAI) from Moderate Resolution Imaging Spectroradiometer (MODIS) and the observed soil moisture at 5 cm. (b) Modified soil moisture in the innermost layer of wrfinput. The triangle indicates the location of site BJ/Nagqu. The 5 cm soil moisture of the land surface in the study area varies from 0.2 to 0.5 m3 m−3. The red grid in (b) represents the lakes in the study area, where the soil moisture is close to 1.0 m m3 m−3.
The setups of WRF simulation in this study are as follows: WRF single-moment (WSM) five-class scheme for microphysics, rapid radiative transfer model (RRTM) scheme for shortwave, Duhia scheme for longwave radiation, and Kain–Fritsch (new Eta) scheme for convective cloud parameterization only in the outermost domain. The land surface process schemes used here are Noah (Ek et al., 2003) and Community Land Model version 4 (CLM4; Oleson et al., 2010; Lawrence et al., 2011). The PBL schemes used in this study are Yonsei University (YSU; Hong et al., 2006), Mellor-Yamada Nakanishi and Niino Level-2.5 PBL (MYNN; Nakanishi, 2001; Nakanishi and Niino, 2004), and BouLac (Bougeault and Lacarrere, 1989). Simulations using WRF with different combinations of LSMs and PBL schemes are carried out to study LoCo characteristics over a typical underlying surface in the central TP.
To investigate the sensitivity of LoCo characteristics to soil moisture, the simulations using WRF Noah-BouLac with different initial soil moisture conditions are carried out. The initial soil moisture conditions in the study area for the sensitivity simulations are set to real soil moisture minus 0.05 (real SM − 0.05), real soil moisture (real SM), real soil moisture plus 0.05 (real SM + 0.05), and real soil moisture plus 0.1 (real SM + 0.1).
All the simulations start from 02:00 Beijing time (universal coordinated time – UTC+8; hereinafter all times refer to Beijing time) on 7 August 2011, and run for 36 h. The first 6 h of the simulation is for the spin-up, and the simulation results from 08:00 to 17:00 7 August 2011 of domain three are used for the following analysis.
2.2.1 Land surface models
Both Noah and CLM4 can simulate surface sensible heat fluxes, latent heat fluxes, and soil states, but they are different in specific parameterizations and representations of soil and vegetation properties and of physics. Noah calculates moisture and heat transports using four layers of soil temperature and moisture in each grid cell. CLM4 calculates the water and heat transports in the soil using 10 layers of soil temperature and soil moisture in each grid cell. A static vegetation data set based on the monthly Normalized Differential Vegetation Index (NDVI) is used for Noah LSM, while a look-up table of vegetation conditions is used for CLM4.
2.2.2 PBL schemes
There are several options for the PBL schemes in WRF 3.6.1. We choose YSU, MYNN, and BouLac schemes in this study. YSU is a nonlocal PBL scheme, which uses the K-profile method to parameterize the turbulent mixing in the convective boundary layer and takes the nonlocal mixing by convective large eddies into consideration. In addition, YSU has an explicit treatment of entrainment fluxes at the top of the PBL. PBLH in the YSU scheme is determined using the bulk Richardson number. MYNN is a one-and-a-half order local closure scheme, and the turbulent fluxes of any adiabatically conserved variable are calculated based on the gradients of their mean values at adjacent levels only. BouLac is also a one-and-a-half order local closure scheme and needs one additional prognostic option to predict turbulence kinetic energy (TKE).
2.3 Mixing diagram
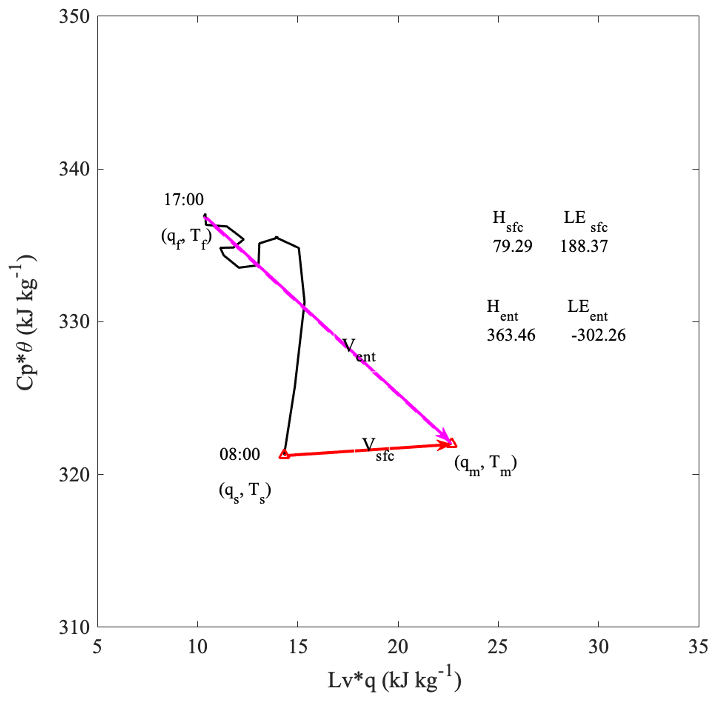
The mixing diagram was first proposed by Betts (1984, 1992) in order to quantify the heat and moisture fluxes transported into the PBL in the daytime. The mixing diagram quantifies the heat and water into the PBL from the surface and from the entrainment based on the daytime evolutions of 2 m potential temperature and humidity, PBLH, and surface sensible and latent heat fluxes (Hsfc and LEsfc). Then Santanello et al. (2009, 2011) furthered this method by investigating the PBL thermodynamics and the possible influence of surface heating on cloud formations. In this study, the mixing diagram was used to explore the PBL thermodynamics and the role of surface heating in convective cloud formations. The observed and simulated T2, q2 m, Hsfc, LEsfc, and PBLH from 08:00 to 17:00 on 7 August 2011 were used in this study. The reasons for why the data from 08:00 to 17:00 were used in the analysis are because the underlying surface starts to influence the PBL at 08:00, and the PBLH usually reaches its maximum at 17:00. The mixing diagram analysis based on observed T2, q2 m, Hsfc, LEsfc, and PBLH on 7 August 2011 is shown in Fig. 3. The black line is the evolution of Cp⋅θ and Lv⋅q in the daytime, and the red and purple lines are vectors for surface fluxes and entrainment fluxes. The point (qm, Tm) in Fig. 3 is the PBL condition caused by the heat and water vapor from the surface only. The equations for qm, Tm, Hent, and LEent are listed as follows:
where Ts and qs are the potential temperature and specific humidity at 08:00, respectively. Tf and qf are the potential temperature and specific humidity at 17:00, respectively. Cp is the air-specific heat capacity constant (1004.7 kg−1 K−1). Lv is the constant for latent heat of vaporization (2.5 × 10⁶ kg−1 K−1). ρm is air density (kg m−3), and Δt is the seconds from 08:00 to 17:00.
2.4 Other variables
PBLH is an important variable for the mixing diagram. The observed PBLH in this study was determined using a potential temperature gradient method from the profiles of temperature obtained by radiosonde measurements.
Equivalent potential temperature (θe) is the temperature a sample of air would have if all its moisture was condensed by a pseudo-adiabatic process and the sample was then brought dry adiabatically back to 10 000 hPa. θe can be calculated using the following equation:
where T is absolute temperature (K), P0 is pressure at sea level (1000 hPa), P is surface pressure (hPa), r is the mixing ratio of water vapor (kg kg−1), Cpd is specific heat of dry air at constant pressure (1005.7 J kg−1 K−1), and Rd is specific gas constant for air (287.04 J kg−1 K−1).
3.1 Mixing analysis at site BJ/Nagqu
The mixing diagrams of 7 August 2011 based on the simulations at site BJ/Nagqu, using Noah with BouLac, MYNN, or YSU, are shown in Fig. 4. The curves of simulated Cp⋅θ and Lv⋅q, using Noah with different PBL schemes, show similar variations with differences in values. The simulated increases in Cp⋅θ, using Noah with the three PBL schemes are similar, from about 320 to 335 kJ kg−1. The changes in Lv⋅q, using Noah with the three PBL schemes, are different. The increases in simulated Lv⋅q, using Noah with BouLac, MYNN, and YSU, are 0.94, 0.50, and 2.48 kJ kg−1, respectively. The Hsfc simulated using Noah with BouLac, MYNN, and YSU are 144.12, 162.95, and 145.83 W m−2, respectively. The LEsfc, simulated using Noah with BouLac, MYNN, and YSU, are 235.86, 218.98, and 236.44 W m−2, respectively. The simulated fluxes using Noah are close to the simulation results in the previous studies (Xue et al., 2013; Gao et al., 2015; Ma and Ma, 2019). The simulated Hent is positive and larger than Hsfc, and the simulated LEent values are negative. This suggests that significant heat and dry air are entrained into the PBL. The simulated Hsfc by Noah-MYNN is larger than those by Noah-BouLac and Noah-YSU, while the simulated LEsfc by Noah-MYNN is smaller. This indicates that there is more heat and less vapor into the PBL in the Noah-MYNN than in the Noah-BouLac and Noah-YSU. According to the Hent and LEent, there is less heat and drier air entrained into the PBL in the Noah-MYNN than that in the Noah-BouLac and Noah-YSU. The differences in Hent and LEent could be attributed to the relatively small PBLH (1418 m) in Noah-MYNN than those (1566 and 1468 m) in Noah-BouLac and Noah-YSU. Compared to the observed fluxes, the simulations using Noah with different PBL schemes produce larger Hsfc and similar LEsfc, and also produce smaller Hent and similar LEent.
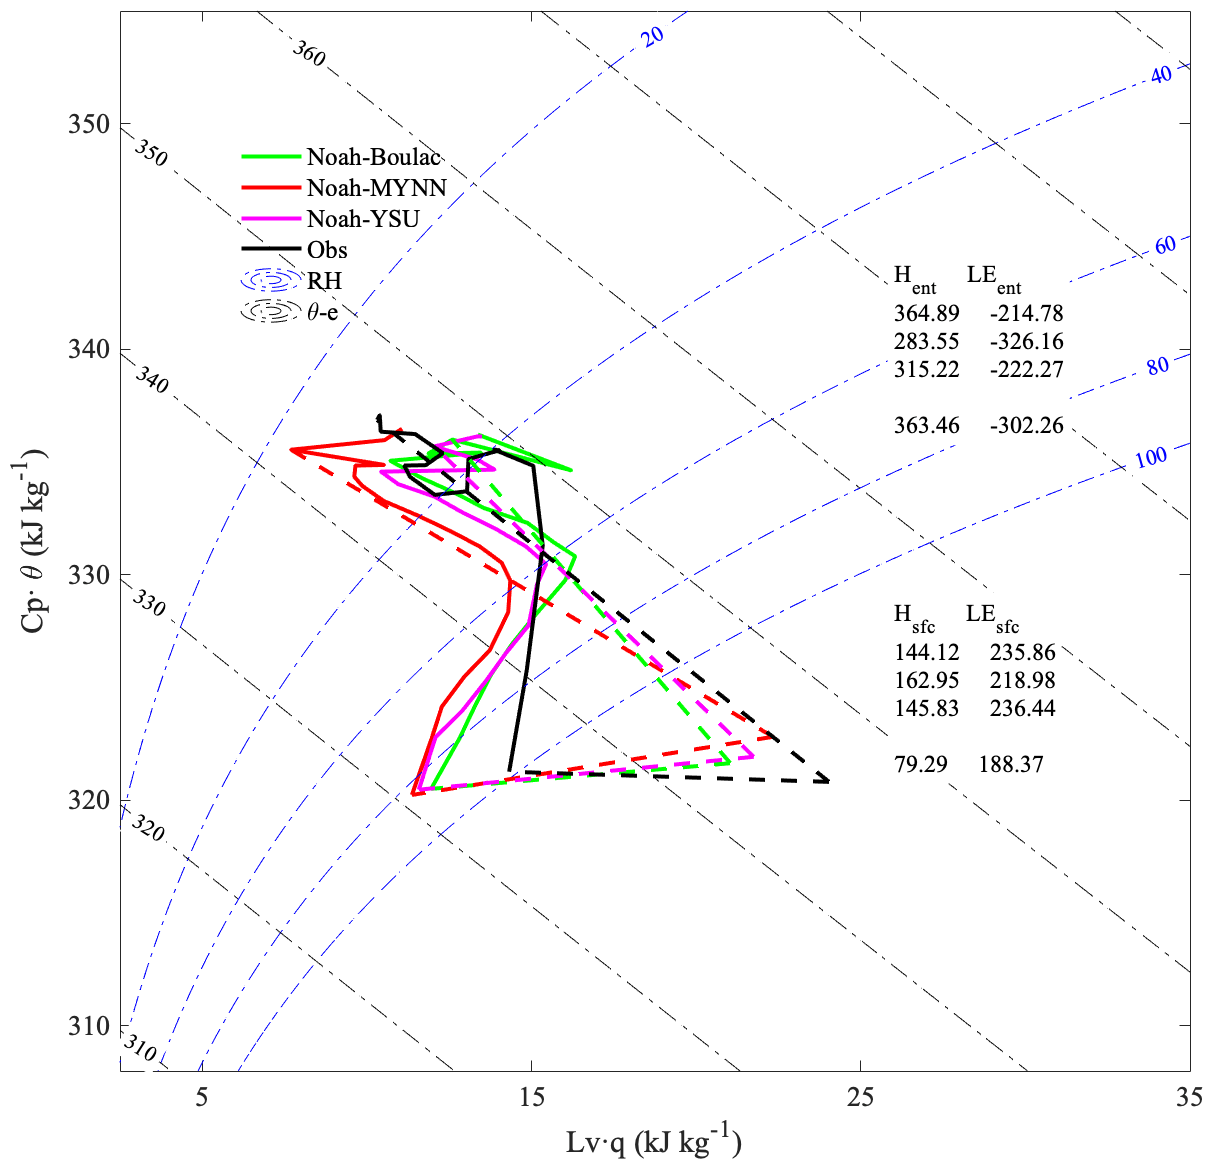
Figure 4Mixing diagram at site BJ/Nagqu on 7 August 2011. Simulated using Noah with different PBL schemes.
θe is a thermal conservative variable, which is useful for quantifying the changes in thermodynamics in the PBL due to surface heating. The increases in simulated θe, using Noah with BouLac, MYNN, and YSU are similar, indicating that the atmosphere becomes unstable due to the surface heating. The simulated relative humidity (RH) in the three cases decreases first from 80 % to 60 % at a slow rate, then decreases to below 40 % at a fast rate. Therefore, the PBL becomes wetter before noon, and drier and more unstable on the sunny days.
The mixing diagrams at site BJ/Nagqu on 7 August 2011, based on simulations using CLM with BouLac, MYNN, and YSU, are shown in Fig. 5. The simulated curves using CLM with the three PBL schemes are different from those simulated using Noah because of the large variation in Cp⋅θ. The Cp⋅θ simulated using CLM with different PBL schemes increases from 315.0 to about 337.0 kJ kg−1. The Lv⋅q values simulated using CLM-BouLac and CLM-YSU increase from 10.0 to about 12.3 kJ kg−1, while the Lv⋅q simulated using CLM with MYNN decreases from 10.13 to 9.5 kJ kg−1. Compared to the surface fluxes in previous studies (Xue et al., 2013; Gao et al., 2015; Ma and Ma, 2019), the Hsfc simulated using CLM are similar, but the LEsfc are too small. The simulated Hsfc and LEsfc by CLM with different PBL schemes are similar, which may be one of the reasons for the similarity in these curves. The simulated Hent and LEent values using CLM with BouLac and YSU are much larger than the observed values, while indicating that more heat and less dry air is entrained into the PBL than the observed values. The Hent, using CLM-MYNN, is close to the observed values, while the LEent is larger than the observed values, indicating that similar heat and less dry air is entrained into the PBL than the observation.
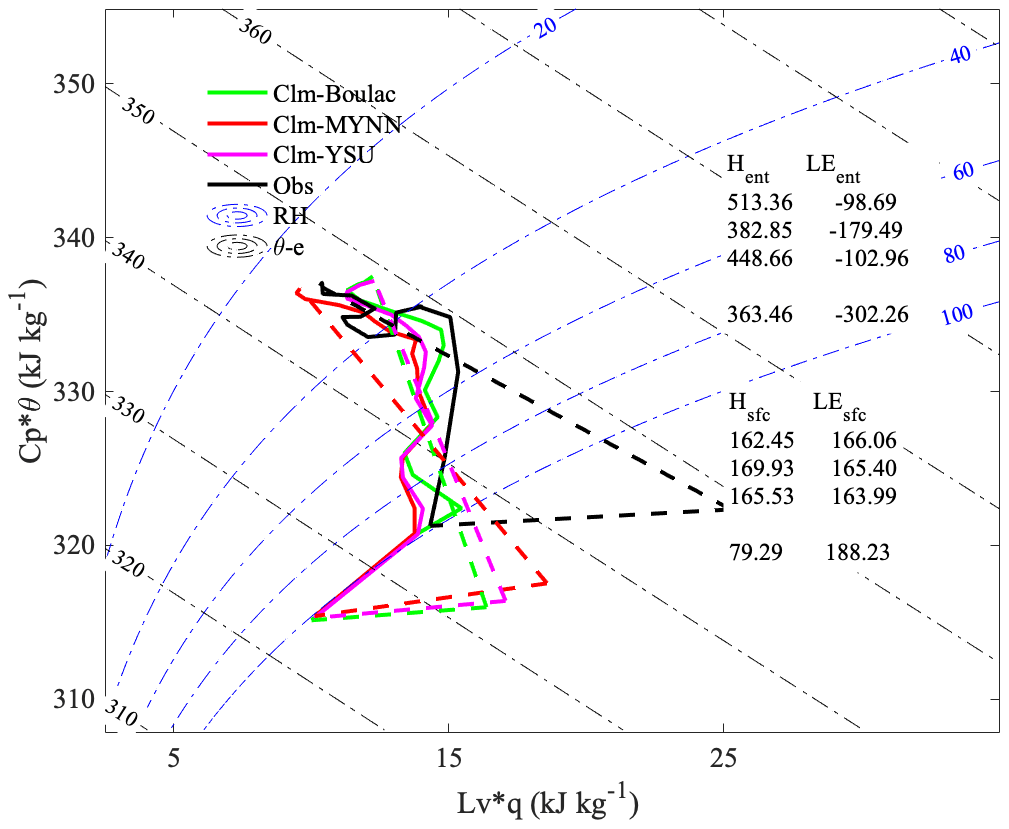
Figure 5Mixing diagram at site BJ/Nagqu on 7 August 2011. Simulated using CLM with different PBL schemes.
The simulated θe increases from about 324.83 to 345.21 K for CLM-MYNN and from 324.56 to 348.80 K for CLM-BouLac and CLM-YSU. This indicates that the simulated PBL becomes more unstable in the CLM cases than it does in the Noah cases. The RH in the PBL, simulated using CLM, decreases from about 100 % to about 30 %. The simulated PBL, using CLM, is warmer and drier than that simulated by Noah.
3.2 PBL energy budget analysis at site BJ/Nagqu
The PBL energy budgets at site BJ/Nagqu, simulated using different LSMs and PBL schemes, are shown in Fig. 6. The simulated surface fluxes by Noah and CLM are different, which leads to differences in entrainment fluxes and the total fluxes (Htot and LEtot). Both Hent and Htot, simulated using CLM with BouLac, MYNN, and YSU, are higher than those simulated by Noah, which means more warm air is entrained into the PBL in the CLM simulations than it does in the Noah simulations. Both LEent and LEtot, simulated using Noah with BouLac, MYNN, and YSU, are smaller than those simulated by CLM, suggesting that there is more dry air entrained into the PBL in the Noah simulations. The Noah simulations with BouLac, MYNN, and YSU produce much larger Hsfc and slightly larger LEsfc than the observed values. The CLM simulations with BouLac, MYNN, and YSU produce larger Hsfc but smaller LEsfc than the observed values. The Hent simulated using Noah is smaller than the observed values, while the Hent values simulated using CLM with BouLac and YSU are larger than the observed values. Compared to the observation, most simulated LEent values are larger than the observed values, indicating that less dry air is entrained into the PBL in the simulations.

Figure 6PBL energy balance at BJ/Nagqu. Simulated using CLM and Noah with different PBL schemes.
3.3 PBL energy budget analysis in the study area
The frequencies of the PBL energy budget components in the study area, simulated using WRF with different combinations of LSMs and PBL schemes, are shown in Fig. 7. There are apparent differences in the frequencies of simulated PBL budget components, suggesting discrepancies in simulated LoCo characteristics in the rainy season in the TP when using WRF with different combinations of LSMs and PBL schemes.
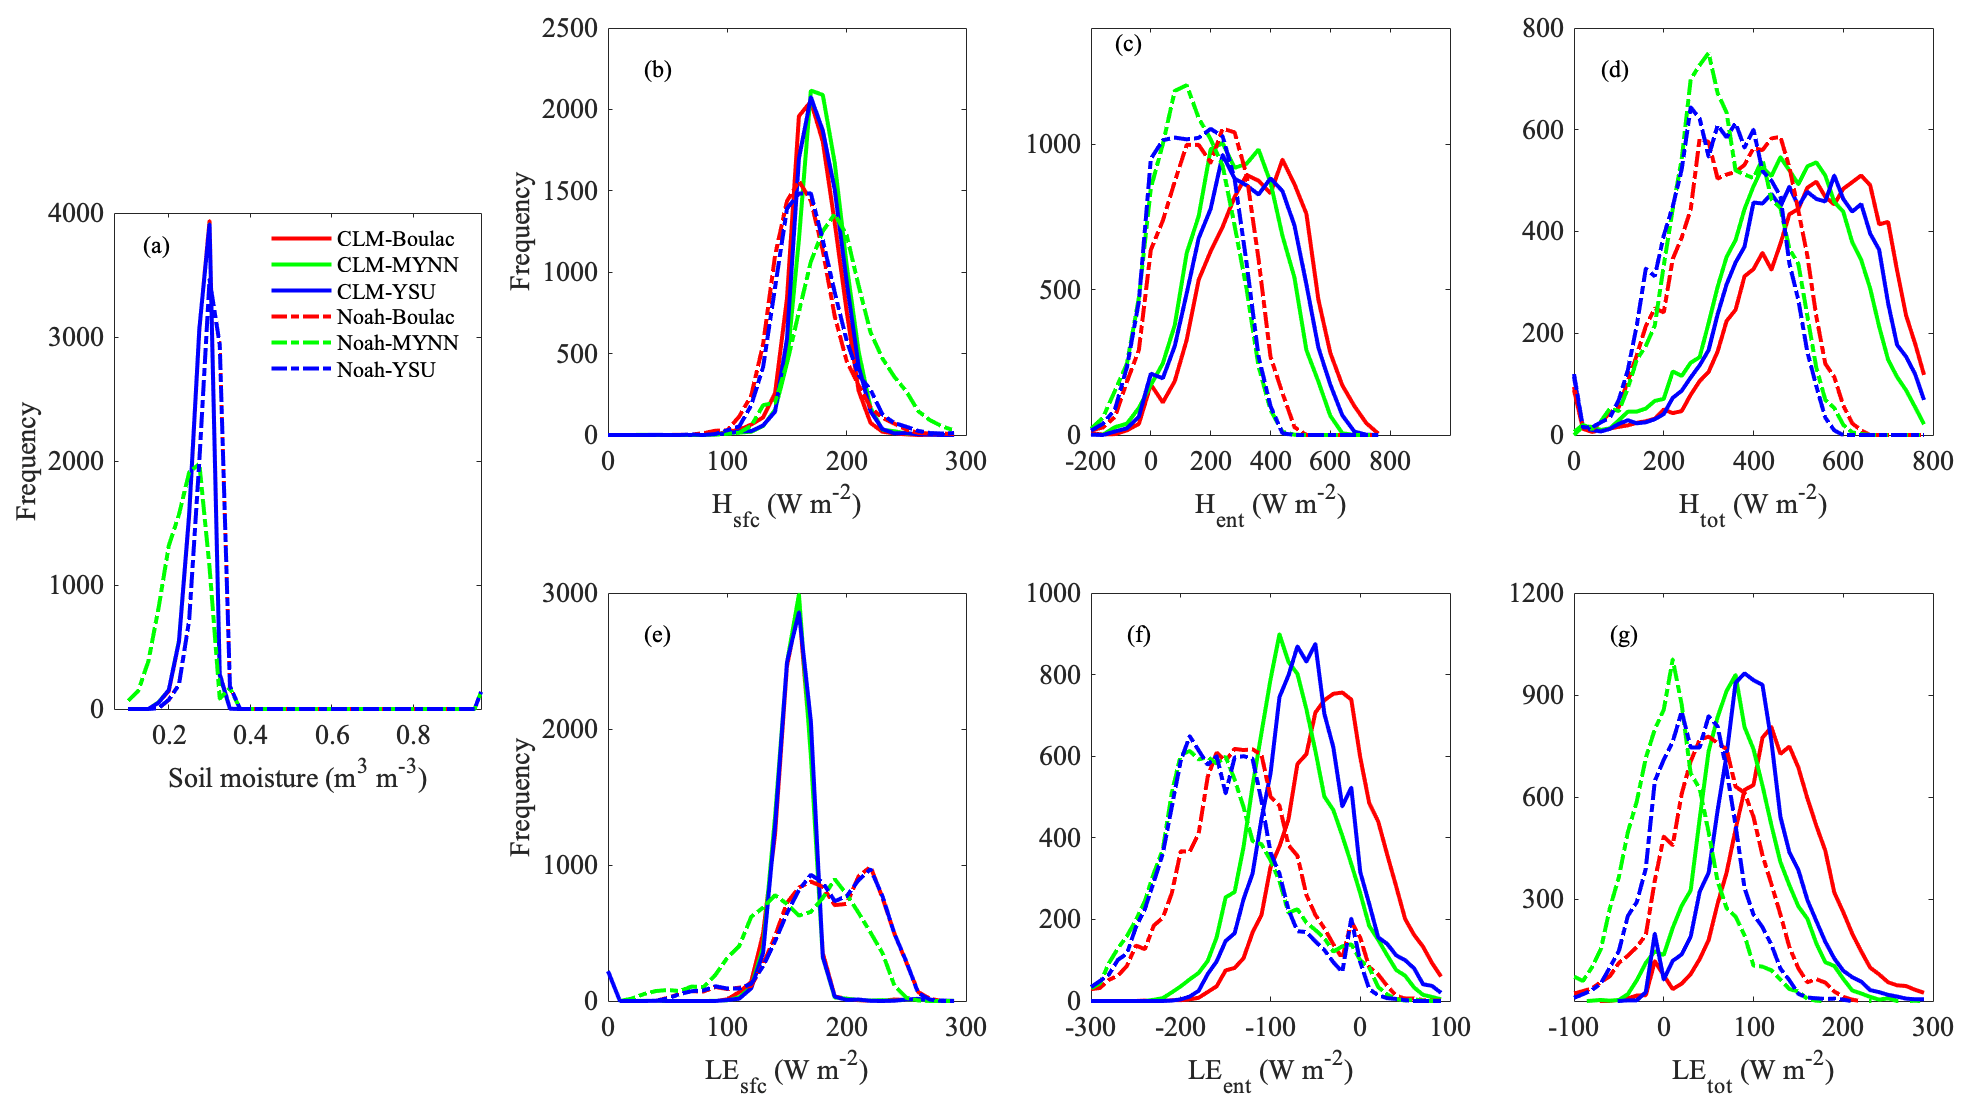
Figure 7Frequency distribution of (a) mean soil moisture at 0–10 cm. (b–g) PBL energy budgets on 7 August 2011. Simulated using different combinations of LSM and PBL schemes.
The Hsfc values simulated using CLM with BouLac, MYNN, and YSU vary in narrow ranges. The mean Hsfc, simulated using CLM, is larger than that using Noah with BouLac and YSU but smaller than that using Noah with MYNN. The simulated LEsfc, using CLM with BouLac, MYNN, and YSU, show little differences and vary in narrower ranges than those simulated using Noah. CLM with BouLac, MYNN, or YSU produces stronger Hent and LEent than Noah does. This suggests that more warm air and less dry air are entrained into the PBL in the CLM simulations than in the Noah simulations. Consequently, CLM produces stronger Htot and LEtot than Noah does.
Here, we take the spatial distributions of the PBL energy budget components simulated, using Noah with BouLac as an example to investigate the possible relationship between soil moisture and LoCo characteristics in the study area. The spatial distribution of the PBL energy budget simulated using Noah with BouLac is shown in Fig. 8. The heterogeneity in the spatial distributions of Hsfc, LEsfc, Hent, LEent, Htot, and LEtot is strong. The spatial distributions of simulated Hsfc and LEsfc are consistent with that of soil moisture. The area with small soil moisture shows large Hsfc and small LEsfc because soil moisture plays a critical role in partitioning the available energy into Hsfc and LEsfc. However, the spatial distributions of Hent and LEent are not consistent with that of soil moisture. It seems that the area with strong Hsfc has weak Hent and large LEent, which contradicts the analysis above. A possible explanation can be found in the relationship between entrainment fluxes and cloud liquid water content (QCloud; Fig. 9). Hent and LEent at the grid, with the maximum sum of QCloud, are about 100 and −50 W m−2, respectively. The Hent at the grid, with the maximum sum of QCloud, is much smaller than that at site BJ/Nagqu, and the LEent of the same grid is larger than that at site BJ/Nagqu. Note that both Hent and LEent at site BJ/Nagqu are the entrainment fluxes on a sunny day. It is reasonable to deduce that the area with large LEent (over −100 W m−2) and small Hent (below 200 W m−2) is the area with cloud formation. Therefore, high Hsfc in the study area is very likely to lead to the convective cloud formation and to result in small Hent and large LEent. This is why the spatial distributions of Hent and LEent are not consistent with that of soil moisture.
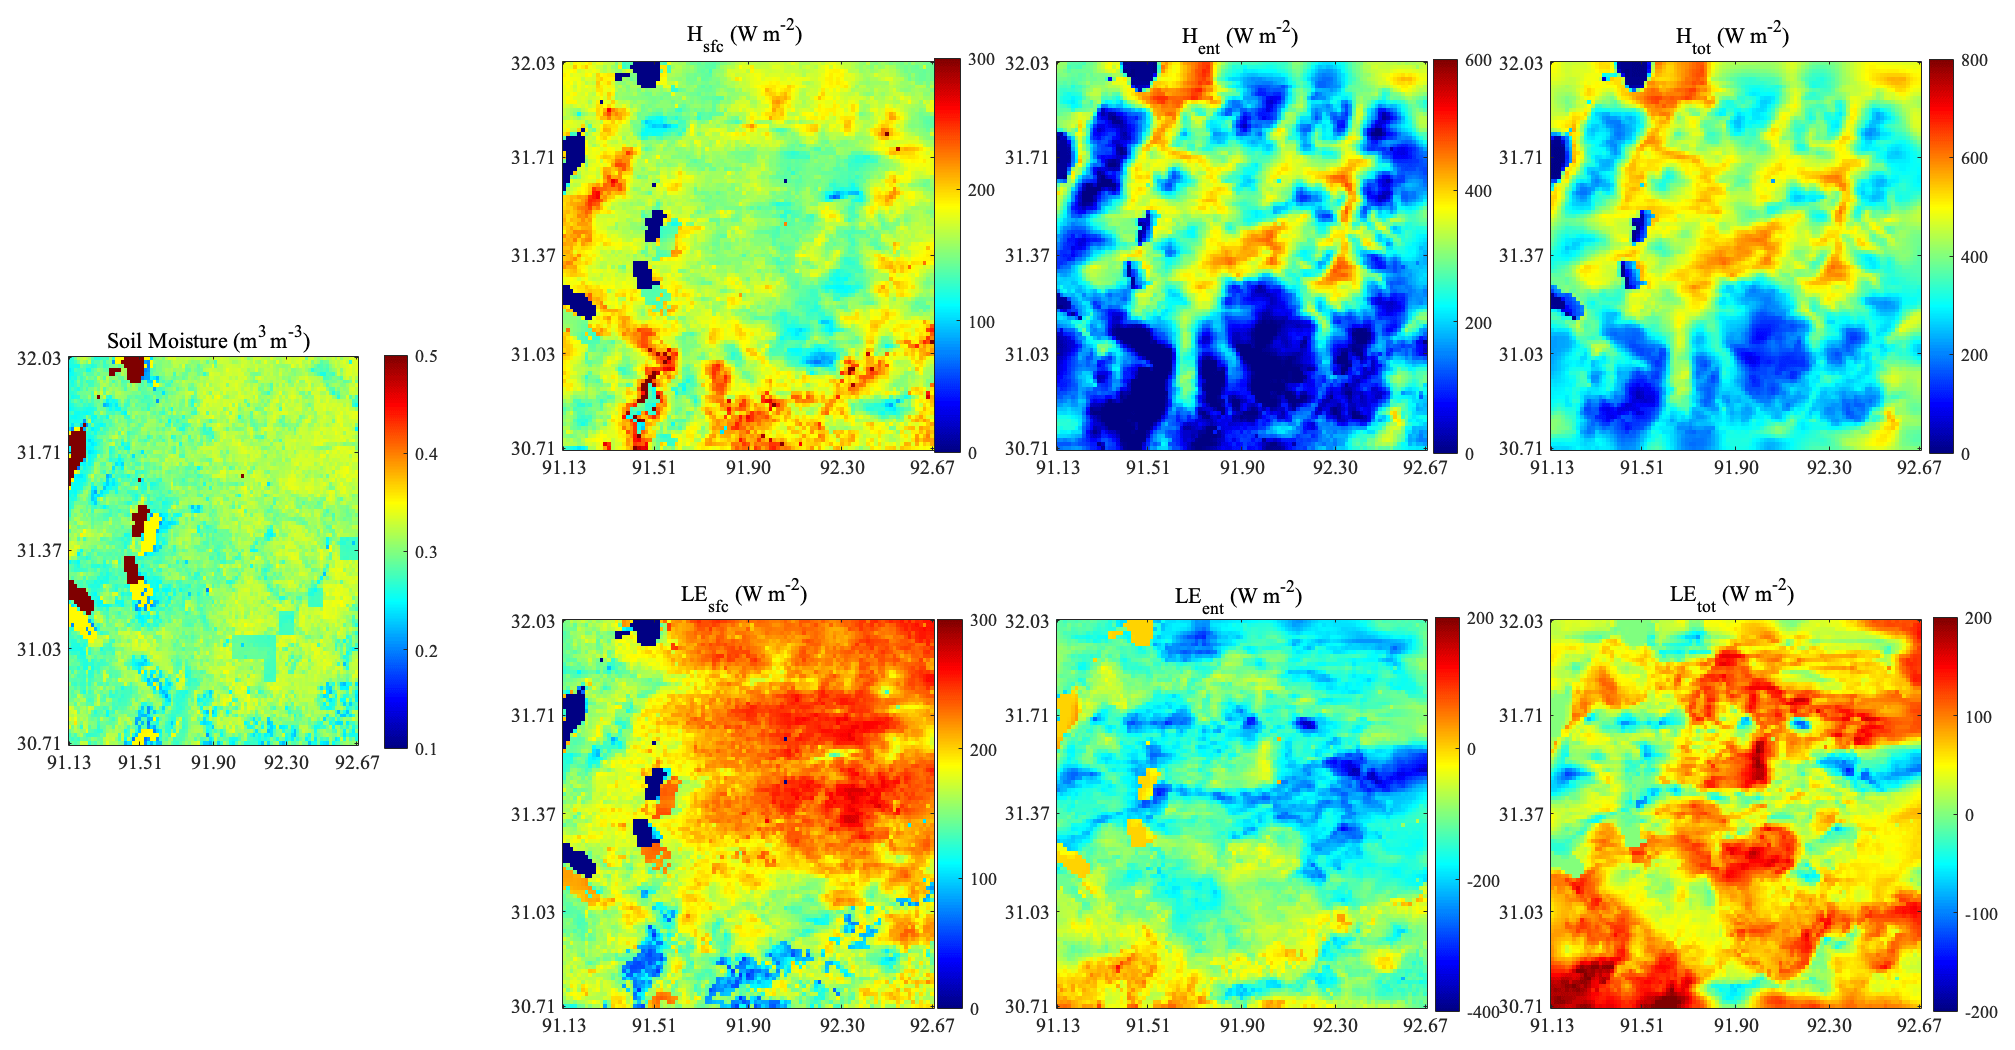
Figure 8Spatial distributions of mean soil moisture at 0–10 cm and the PBL energy budgets on 7 August 2011. Simulated using WRF with Noah-BouLac. The scale of the color map for the soil moisture is 0–0.6 m3 m−3 in order to highlight the spatial variability in soil moisture. The soil moisture in dark red is 1.0 m3 m−3.
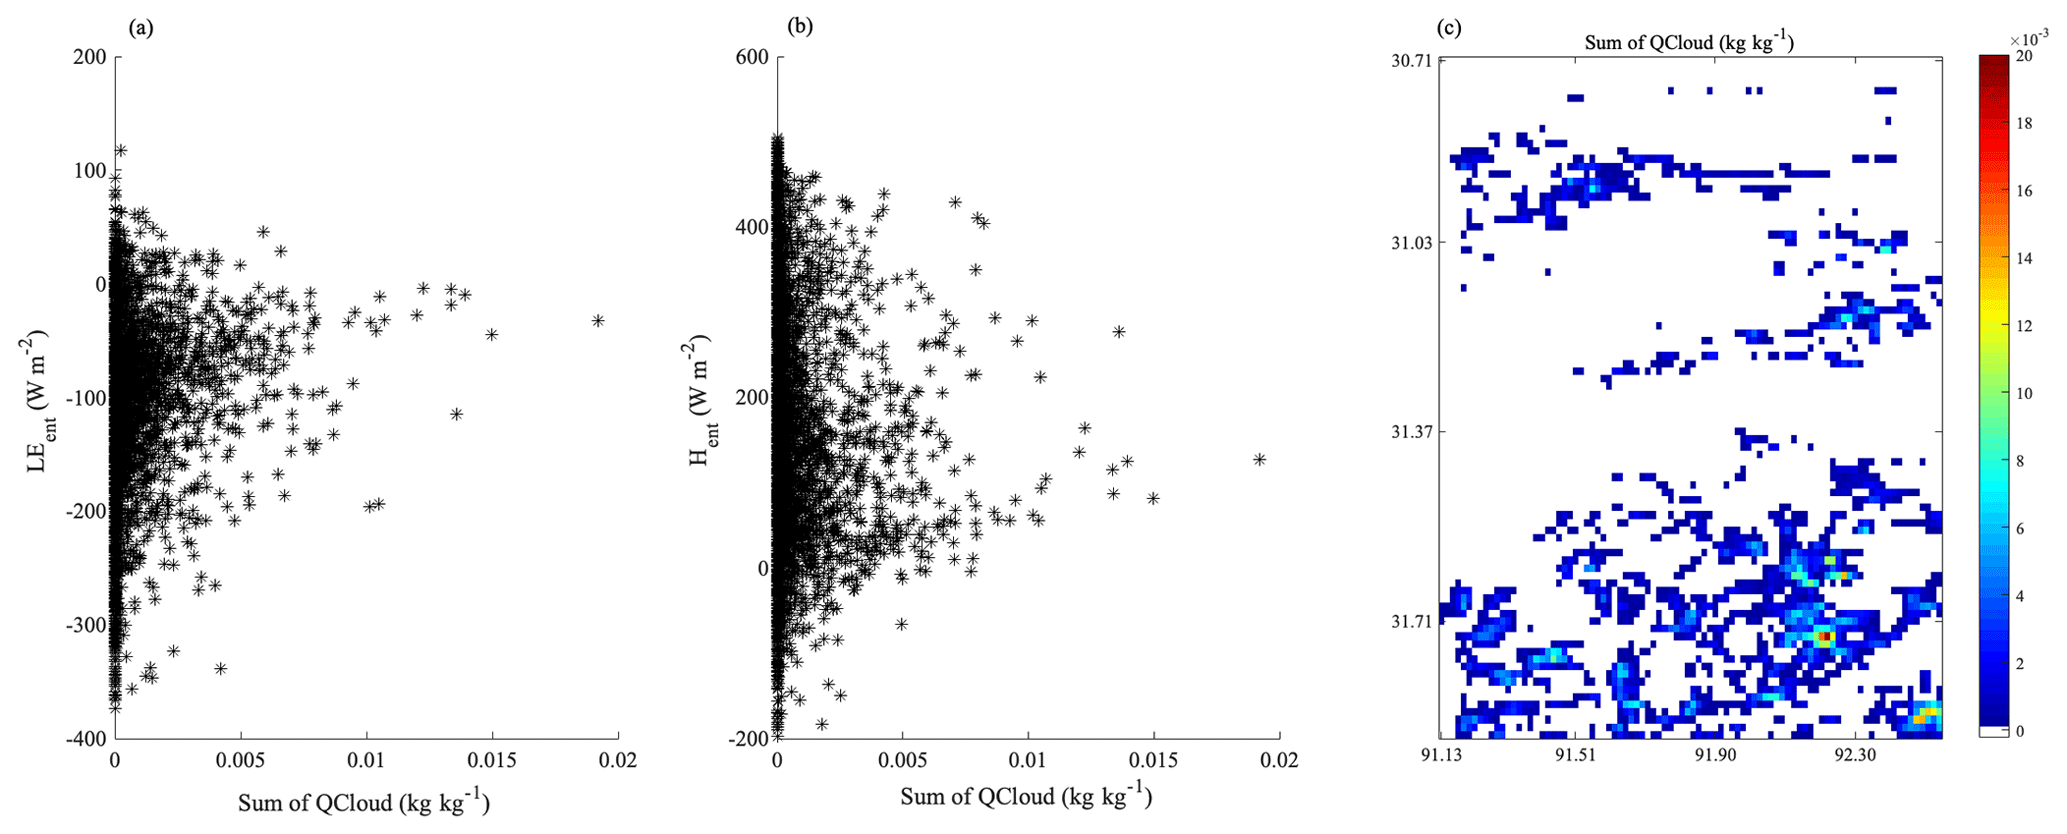
Figure 9(a) Relationship between LEent and the sum of QCloud. (b) Relationship between Hent and QCloud. Simulated using WRF with Noah-BouLac. (c) Spatial distribution of the sum of QCloud.
3.4 Relationship between ET and PBLH
LoCo characteristics, using WRF with different combinations of LSMs and PBL schemes, can be thoroughly investigated by studying the relationship between the mean daytime ET and maximum daytime PBLH since the PBL growth is a direct response to surface heating. The possible impact of lakes is excluded by dismissing the grids in which the mean daytime soil moisture is 1.0. The relationships between daily mean ET and maximum daytime PBLH by different simulations are shown in Fig. 10.
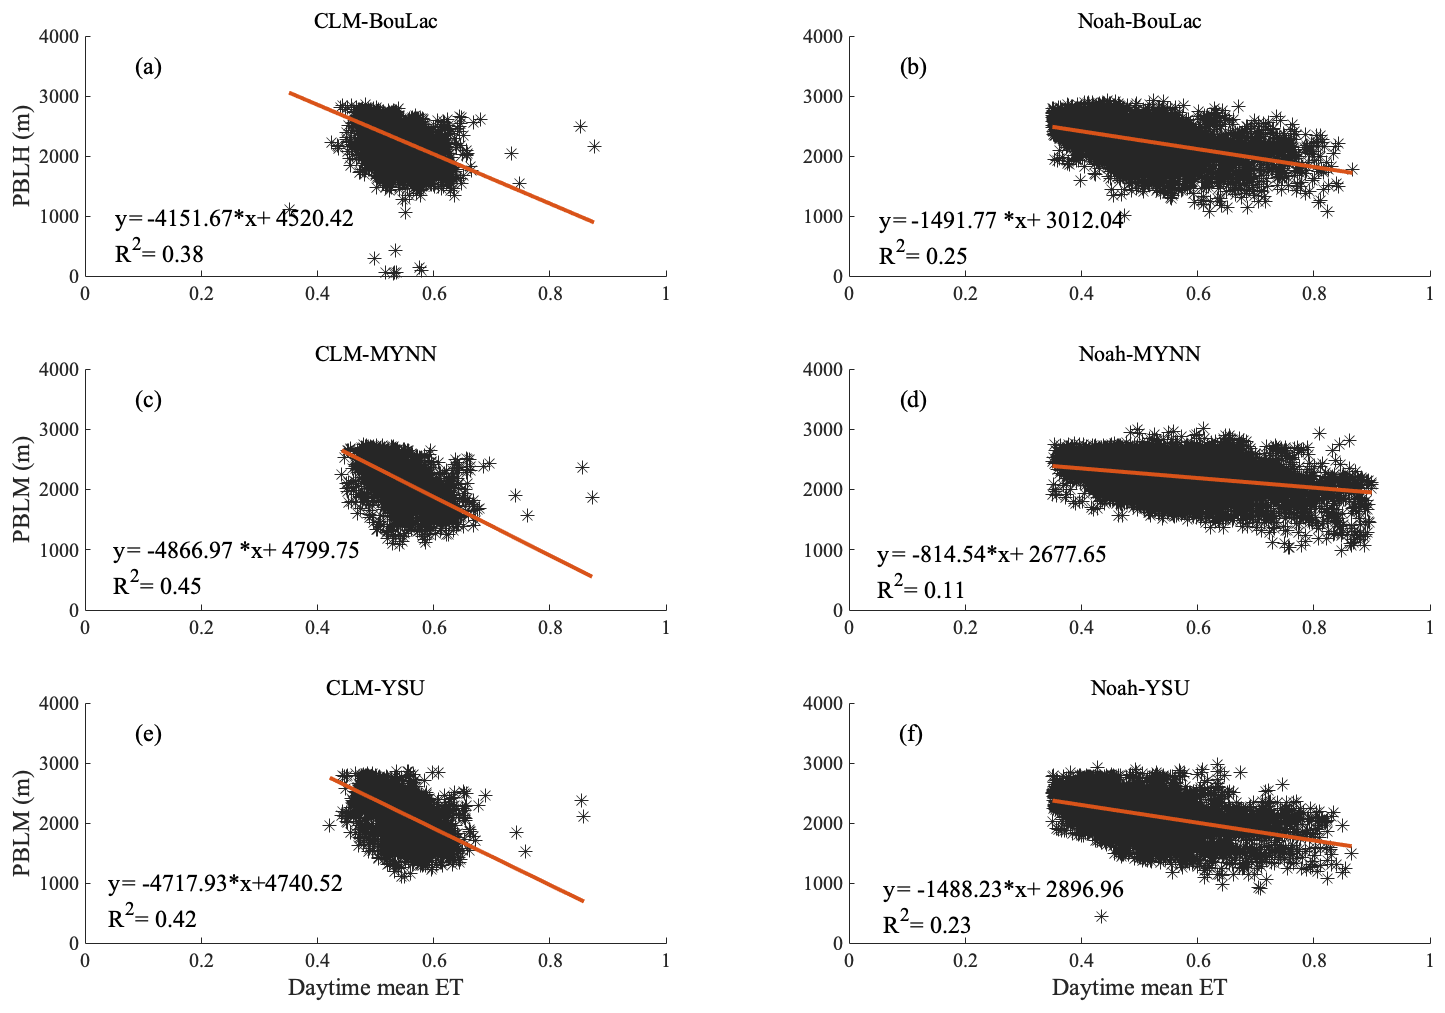
Figure 10Relationship between mean daytime ET and the maximum daytime PBLH. Simulated by CLM and Noah with different PBL schemes. The grid in which the mean soil moisture is 1.0 is excluded to avoid the possible influence of lakes in the study area. The t test indicates that the fitting relationships of the four subplots pass 0.05 significance level test.
The relationships between mean daily ET and maximum daytime PBLH in the six simulations are similar but differ in terms of linear-fitting slopes. It seems that the maximum daytime PBLH decreases faster with mean daily ET in the CLM cases than it does in the Noah cases. This is mainly caused by the fact that the mean daytime ET simulated using CLM varies in a much smaller range, which is much narrower than that simulated using Noah. The slope in the relationship between mean daytime ET and maximum daytime ET, simulated using Noah with MYNN, is gentler than the slopes simulated by Noah with BouLac and YSU. But the slope simulated using CLM with MYNN is steeper than those simulated using CLM with BouLac and YSU. This can be explained by the frequency distributions of Hsfc and LEent in Fig. 7.
The similarities and differences in the relationships between simulated mean daytime ET and maximum daytime PBLH, using the six simulations, indicate that the LoCo characteristics simulated by Noah may be more plausible, regardless of which PBL scheme is used.
3.5 Sensitivity of LoCo to soil moisture
Sensitivity of LoCo characteristics to different soil moisture conditions in the study area in the rainy season is investigated, based on the simulation results using WRF Noah-BouLac with different initial soil moisture. The frequency distributions of the PBL energy budget in the study area reveals that the Noah-BouLac could produce more reliable surface fluxes in the study area (Fig. 7). This agrees with Xu et al. (2018), which indicates that the simulation using BouLac produces closest result to the observation.
The curves of the mixing diagram at site BJ/Nagqu, with different initial soil moisture conditions, are shown in Fig. 11. The simulated curves of Cp⋅θ and Lv⋅q, with different initial soil moisture conditions, show similar variation but with different magnitude. As the initial soil moisture at site BJ/Nagqu increases from 0.32 to 0.47 m3 m−3, the simulated LEsfc increases from 220.40 to 245.46 W m−2 and the simulated Hsfc decreases from 153.19 to 134.28 W m−2. As a consequence, the simulated Lv⋅q in the daytime shows a clear gradient as the initial soil moisture increases. Similarly, as the initial soil moisture at site BJ/Nagqu increases, the simulated Hent decreases from 368.34 to 361.95 W m−2, while the simulated LEent increases from −222.27 to −170.63 W m−2. This indicates that as the initial soil moisture increases, less heat and dry air are entrained into the PBL at site BJ/Nagqu. The results at site BJ/Nagqu indicate the sensitivity of LoCo to soil moisture under no-cloud conditions because the sum of QCloud in each of the four cases is 0.00 kg m−2 as the initial soil moisture increases.
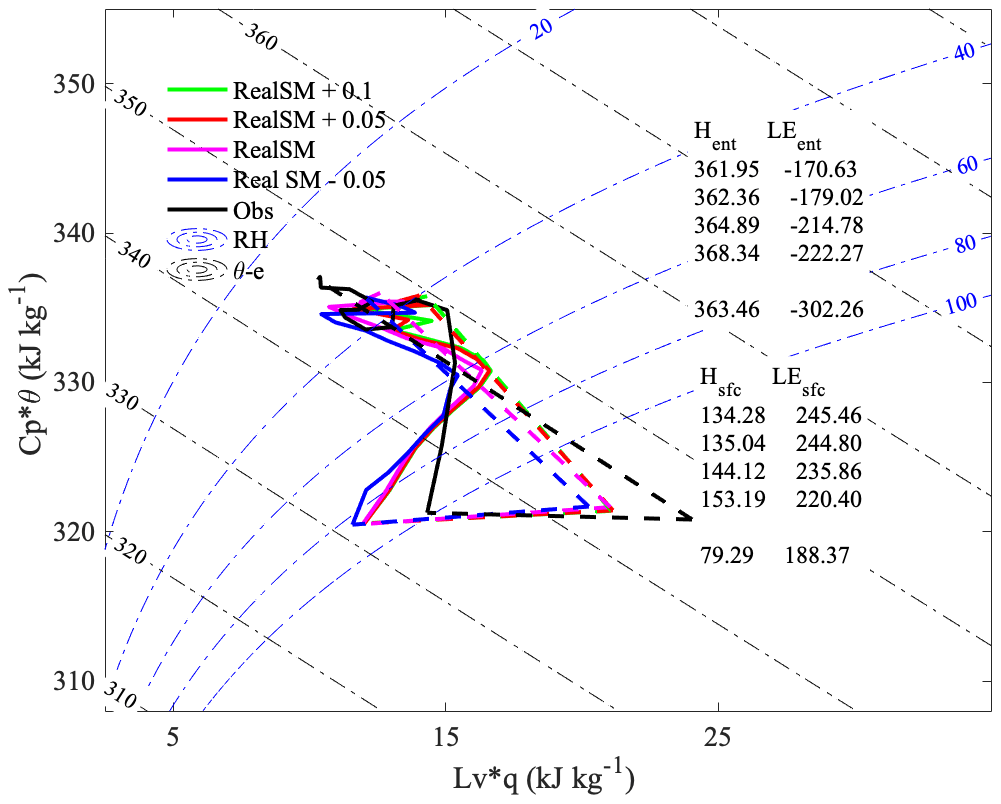
Figure 11Mixing diagram under different soil moisture at site BJ/Nagqu. Simulated using WRF with Noah-BouLac under different initial soil moisture conditions.
The frequency distributions of the mean soil moisture at 5 cm and the PBL energy budgets in the study area are shown in Fig. 12. As initial soil moisture in the sensitivity experiments increases, the simulated PBL energy budget components change differently. The simulated Hsfc decreases and LEsfc increases as the initial soil moisture increases because soil moisture plays a critical role in the surface-available energy partitioning. But the changes in the simulated Hent and LEent as the initial soil moisture increases are complex. As the initial soil moisture increases, there is an increase in the frequency of Hent, ranging from 80 to 240 W m−2, but a decrease in the frequency of Hent below 80 and over 240 W m−2. Similarly, as the initial soil moisture increases, there is an increase in the frequency of LEent, ranging from −240 to −90 W m−2, and a decrease in the frequency of LEent below −90 and over −240 W m−2. Based on the analysis of the relationship between the entrainment fluxes and QCloud in Sect. 3.3, the increases in the frequency of Hent, ranging from 80 to 240 W m−2, and LEent, ranging from −240 to −90 W m−2, indicate an increase in the convective cloud amount. The relationship between the sum of QCloud and entrainment fluxes in different initial soil moisture conditions are shown in Fig. 13. The maximum values of the sum of QCloud in the sensitivity simulations are 0.0192, 0.019, 0.0162, and 0.0150 kg g−1 as the initial soil moisture increases. The decrease in the maximum values of the sum of QCloud may indicate that a decrease in deep cumulus has occurred. Therefore, the changes in Hent, LEent, and the sum of QCloud may indicate that an increase in the soil moisture is conducive to an increase in the shallow cumulus amount, which is not favorable for the formation of deep cumuli.

Figure 12Frequency distribution of (a) mean soil moisture. (b–g) PBL energy budget components. Simulated using Noah-BouLac with different initial soil moisture conditions.
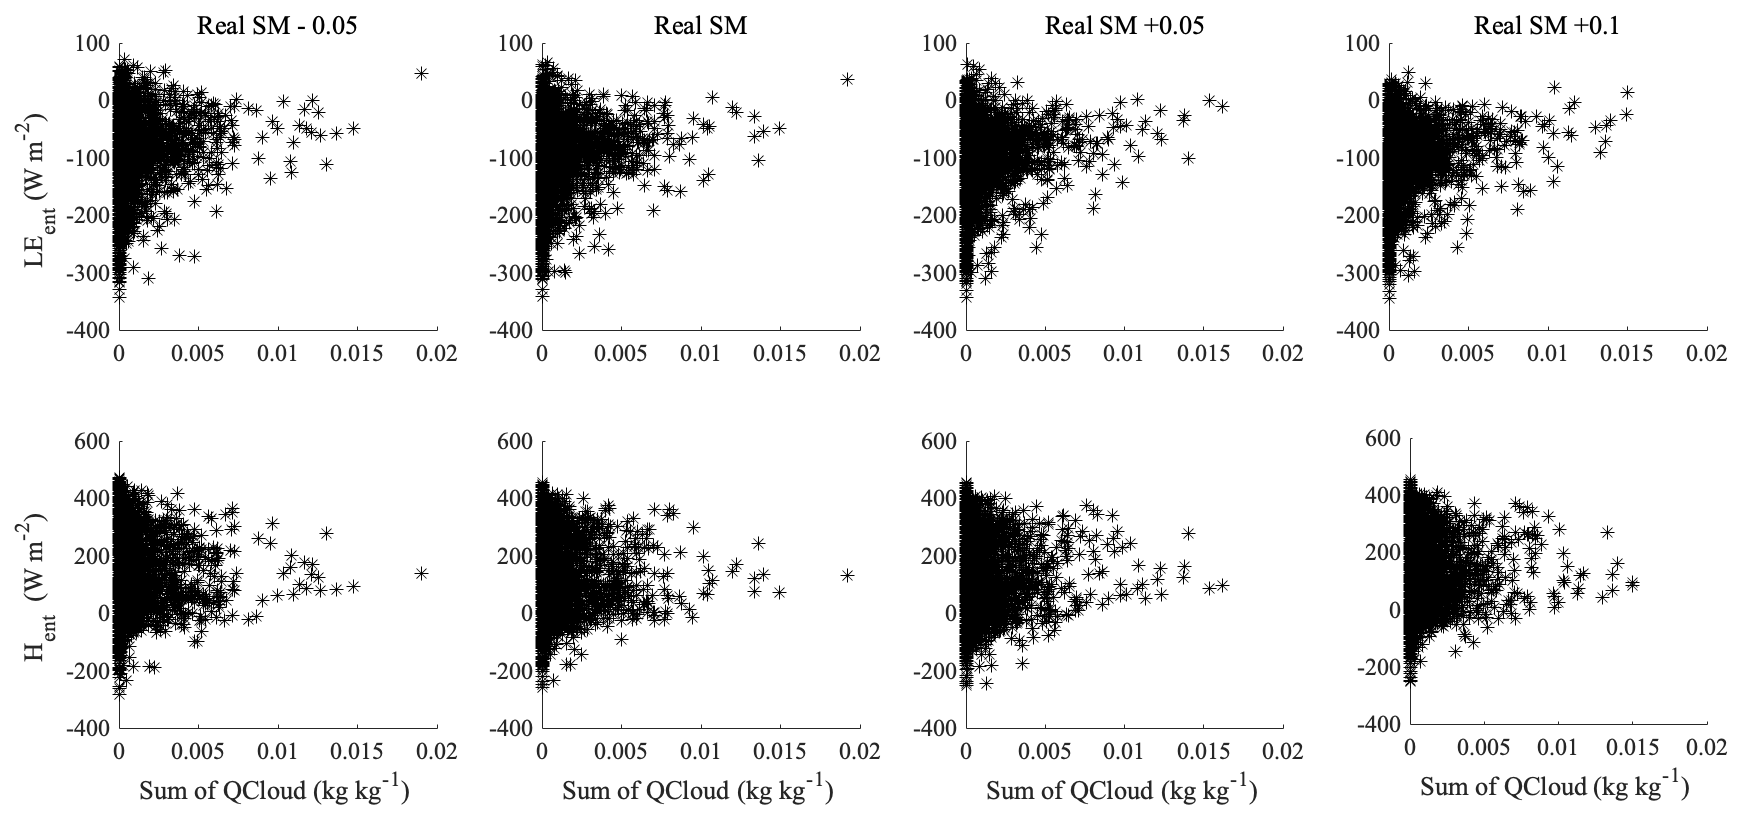
Figure 13Relationship between the sum of QCloud and entrainment fluxes in the study area. Simulated using WRF with Noah-BouLac under different initial soil moisture conditions.
As the initial soil moisture increases, the medians of Hsfc and Hent decrease from 181.80 to 154.74 W m−2 and from 181.16 to 177.16 W m−2, respectively. The median of LEsfc increases from 169.18 to 201.97 W m−2, while the median of LEent decreases from −122.37 to −131.96 W m−2. The median Htot in the study area decreases from 363.91 to 335.95 W m−2. The decrease in Htot is mainly caused by Hsfc. The median LEtot increase from 44.63 to 66.57 W m−2 and the increase in LEtot is mainly caused by LEsfc. It is safe to say that the change in the initial soil moisture has a strong impact on surface fluxes and entrainment fluxes.
The relationship between mean ET and maximum PBLH at daytime in the study area, simulated by Noah-BouLac with different initial soil moisture values, is shown in Fig. 14. The maximum daytime PBLH decreases as the daytime mean ET increases, but the slope between maximum PBLH and mean ET at daytime becomes steep as the initial soil moisture increases. This can be attributed to the fact that the number of grids with high ET increases as the initial soil moisture increases, and the maximum PBLH decreases due to the increase in shallow convective clouds.
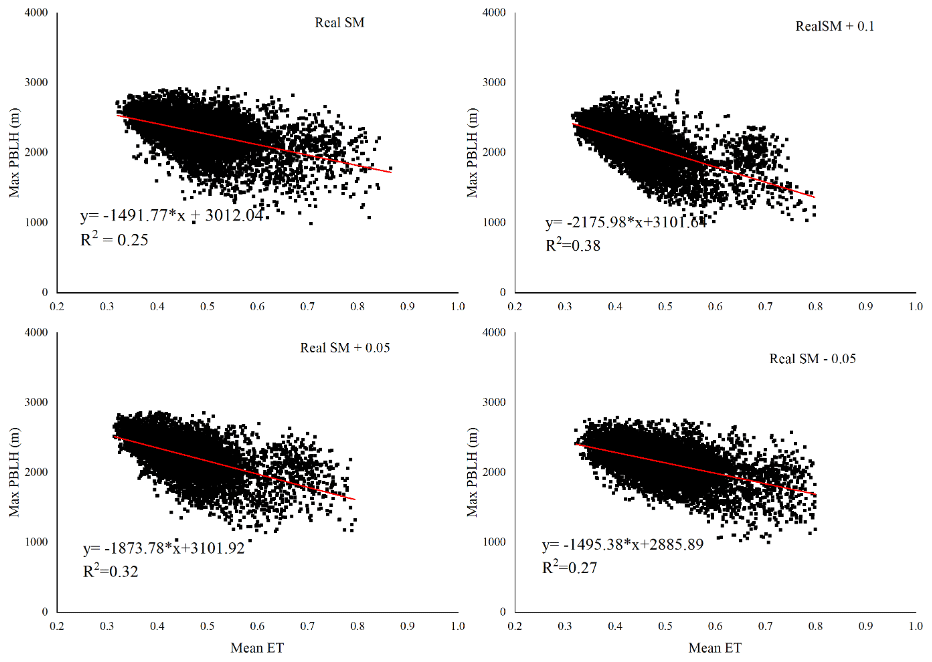
Figure 14Relationship between mean daytime ET and the max daytime PBLH. Simulated using Noah-BouLac with different initial soil moisture. The grid with mean soil moisture over 0.9 m3 m−3 is excluded to avoid the possible influence of lakes in the study area. The t test indicates that the fitting relationships of the four subplots pass 0.05 significance level test.
LoCo contains a series of nonlinear processes, which include the interactions among soil states, surface fluxes, PBL development, entrainment, and the formations of convective clouds and precipitation. Accurately modeling these processes is not easy, especially in the TP. In this study, we investigate the LoCo characteristics based on a series of real-case simulations, using WRF with different combinations of LSMs and PBL schemes. The simulations using Noah with BouLac, MYNN, and YSU produce better results than those using CLM. The analysis indicates that, as the initial soil moisture increases from real SM − 0.05 to real SM + 0.1, the domain-averaged Hsfc decrease from 261.45 to 219.57 W m−2, and the domain-averaged LEsfc increase from 251.93 to 307.51 W m−2. Due to the weakening of surface heating, the max domain-averaged PBLH decrease from 2045.0 to 1910.2 m, and the max domain-averaged convective inhabitation (CIN) increase from 2.5 to 4.23 W m−2. The analysis also reveals the specific influence of surface heating on entrainments and cloud formations at the top of the PBL. It seems that there is a certain critical value for Hsfc. When Hsfc is below the critical value, there is an increase in Hent and a decrease in LEent as Hsfc increases, which means that more warm and dry air is entrained into the PBL as Hsfc increases. When Hsfc is over the critical value, there is a decrease in Hent and an increase in LEent as Hsfc increases, which means that less warm and dry air is entrained into the PBL. This is because the formation of convective clouds at the top of the PBL weakens the intensity of the entrainments. The is a direct evidence of the impact of the surface heating on the formation of convective clouds.
Another interesting fact is the sensitivity of convective clouds formations to soil moisture in the study area on the sunny day in the rainy season. The temporal evolution of domain-averaged cloud water content (the sum of ice water and liquid water) under different initial soil moisture conditions indicates that the cloud forms at 11:00 in all the cases and that domain-averaged cloud water content in the real SM − 0.05 case is larger than that in the real SM + 0.1 case until 16:00 (which is not shown here). The analysis shows that the simulated QCloud over a dry soil case is larger than that over a wet soil. Therefore, the impact of relatively strong surface heating over a dry soil on the cloud formations is not that straightforward. More observation data, including sunny days, cloudy days and days with convective rain events, will be collected in the future. With these data, we will study the LoCo characteristics and the underlying mechanism of how the soil state influences the formation of convective clouds and precipitation over a complex surface in the rainy season in TP.
In this study, the LoCo characteristics over a typical underlying surface in the rainy season over the TP were simulated and discussed using different combinations of LSMs and PBL schemes. The sensitivity of LoCo to soil moisture over a typical underlying surface was investigated via simulations with different initial soil moisture conditions.
The simulated LoCo characteristics, using different combinations of LSMs and PBL schemes, behave differently in this study. In terms of the curves of mixing diagrams, surface fluxes, and entrainment fluxes, Noah with different PBL schemes produces more realistic curves, Hsfc, LEsfc, and LEent and smaller Hent than CLM with different PBL schemes does. The frequency distributions of Hsfc, LEsfc, Hent, and LEent in the study area confirmed the differences in the simulation results. It was also found that the spatial distributions of Hsfc and LEsfc in the study area were consistent with that of soil moisture, but the spatial distributions of Hent and LEent were quite different from that of soil moisture. The reason for the disagreement is that high Hsfc may lead to cloud formation, which decreases Hent and increases LEent. The simulations using Noah produce a reasonable relationship between the maximum PBLH and mean daytime ET because the simulations using Noah can produce reasonable mean daytime ET in the study area.
Sensitivity analysis of LoCo characteristics to soil moisture reveals that the changes in entrainment fluxes and surface fluxes to soil moisture are not the same with soil moisture increase. The changes in entrainment fluxes may be complex due to the possible presence of convective clouds. The results also show that the increase in initial soil moisture may cause an increase in shallow cumuli and a decrease in QCloud
This study investigated the LoCo characteristics on a sunny day over a typical underlying surface in the central TP in terms of the role of the soil moisture in the PBL energy growth and convective clouds, based on in situ measurements and numerical simulations. It is the first part of our LoCo analysis in the TP. More observation data, including sunny days, cloudy days and days with convective rain events, will be collected. We will focus on the basic fact and the possible underlying mechanisms of LoCo over complex surfaces in TP by exploring the possible influence of the heterogeneity of land surface conditions on LoCo characteristics.
The simulations presented in this study were conducted using the WRF model, which can be download from its official website (https://www.mmm.ucar.edu/weather-research-and-forecasting-model; Skamarock et al., 2008) free of charge. The forcing data of the ERA-Interim are available from its official website https://www.ecmwf.int/en/forecasts/datasets/reanalysis-datasets/era-interim (ECMWF, 2020). The simulation results presented in this paper are available from the corresponding author upon request. The observational data at Site BJ/Nagqu are available from Zeyong Hu and Yaoming Ma upon request.
GS conceived the initial idea for this work and completed the simulation analysis and wrote the paper. ZH and YM produced the valuable observation data for this work. ZX offered valuable suggestions and helped with the modeling work. SY and JW provided ideas to improve analyses used in this study.
The authors declare that they have no conflict of interest.
This article is part of the special issue “Data acquisition and modeling of hydrological, hydrogeological and ecohydrological processes in arid and semi-arid regions”. It is not associated with a conference.
The authors thank the National Supercomputer Center in Guangzhou and the Zhuhai Joint Innovative Center for Climate, Environment and Ecosystem, China for their support.
This research has been supported by the National Key Research and Development Program of China (grant no. 2018YFC1505701) and the National Scientific Foundation of China (grant nos. 41805009, 41675106, 91637208 and 91837208).
This paper was edited by Insa Neuweiler and reviewed by two anonymous referees.
Betts A. K.: Boundary Layer Thermodynamics of a High Plains Severe Storm, Mon. Weather Rev., 112, 2199–2211, 1984.
Betts, A. K.: FIFE atmospheric boundary layer budget methods, J. Geophys. Res., 97D, 18523–18532, 1992.
Bougeault, P. and Lacarrere, P.: Parameterization of orography-induced turbulence in a mesobeta – scale model, Mon. Weather Rev., 117, 1872–1890, 1989.
Chang, Y. and Guo, X.: Characteristics of convective cloud and precipitation during summertime at Nagqu over Tibetan Plateau, Chinese Sci. Bull., 61, 1706–1720, 2016.
Chen, J., Wu, X., and Yin, Y.: Thermal effects of the surface heat flux on cloud systems over the Tibetan Plateau in boreal summer, J. Climate, 32, 4699–4714, 2019.
Chen, X., Ma, Y., Sun, F., Li, M., and Wang, S.: The Rainy season character of Troposphere at Mt. Qomolangma Region, Plateau Meteorol., 26, 1280–1286, 2008.
Chen, X., Škerlak, B., Rotach, W., Anel, A., Su, Z., Ma, Y., and Li, M.: Reasons for the extremely high-ranging planetary boundary layer over the western Tibetan Plateau in winter, J. Atmos. Sci., 73, 2021–2038, 2016.
Dee, D. P., Uppala, S. M., Simmons, A. J., Berrisford, P., Poli, P., Kobayashi, S., Andrae, U., Balmaseda, M. A., Balsamo, G., Bauer, P., Bechtold, P., Beljaars, A. C. M., van de Berg, L., Bidlot, J., Bormann, N., Delsol, C., Dragani, R., Fuentes, M., Geer, A. J., Haimberger, L., Healy, S. B., Hersbach, H., Hålm, E. V., Isaksen, L., Kållberg, P., Köhler, M., Matricardi, M., McNally, A. P., Monge-Sanz, B. M., Morcrette, J.-J., Park, B.-K., Peubey, C., de Rosnay, P., Tavolato, C., Thépaut, J.-N., and Vitart, F.: The ERA-Interim reanal ysis: configuration and performance of the data assimilation system, Q. J. Roy. Meteorol. Soc., 137, 553–597, https://doi.org/10.1002/qj.828, 2011.
ECMWF: ERA-Interim, available at: https://www.ecmwf.int/en/forecasts/datasets/reanalysis-datasets/era-interim, last 385 access: 10 December 2020.
Ek, M. B., Mitchell, K. E., Lin, Y., Rogers, E., Grunmann, P., Koren, V., Gayno, G., and Tarpley, J. D.: Implementation of Noah land surface model advances in the National Centers for Environmental Prediction operational mesoscale Eta model, J. Geophys. Res.-Atmos., 108, 8851, https://doi.org/10.1029/2002JD003296, 2003.
Gao, Y., Li, K., Chen, F., Jiang, Y., and Lu, C.: Assessing and improving Noah-MP land model simulations for the central Tibetan Plateau, J. Geophys. Res.-Atmos., 120, 9258–9278, https://doi.org/10.1002/2015JD023404, 2015.
Han, C., Ma, Y., Chen, X., and Su, Z.: Trends of land surface heat fluxes on the Tibetan Plateau from 2001 to 2012, Int. J. Climatol., 37, 4757–4767, https://doi.org/10.1002/joc.5119, 2017.
Hong, S. Y., Noh, Y., and Dudhia, J.: A new vertical diffusion package with an explicit treatment of entrainment processes, Mon. Weather Rev., 134, 2318–2341, 2006.
Immerzeel, W. W., Van Beek, L. P., and Bierkens, M. F.: Climate change will affect the Asian water towers, Science, 328, 1382–1385, 2010.
Lawrence, D. M., Oleson, K. W., Flanner, M. G., Thornton, P. E., Swenson, S. C., Lawrence, P. J., Zeng, X., Yang, Z., Levis, S., Sakaguchi, K., and Bonan, G. B.: Parameterization improvements and functional and structural advances in version 4 of the Community Land Model, J. Adv. Model. Earth Syst., 3, 2011MS000045, https://doi.org/10.1029/2011MS00045, 2011.
Li, M., Ma, Y., Hu, Z., Ma, W., and Wang, J.: Study on Characteristics of Atmospheric Boundary Layer over Nagqu Region of Northern Tibetan Plateau, Plateau Meteorol., 23, 728–733, 2004.
Li, M., Ma, Y., Ma, W., and Sun, F.: Structure Difference of Atmospheric Boundary Layer Between Dry and Rainy Seasons over the Central Tibetan Plateau, Journal of Glaciology and Geocryology, 33 , 72–79, 2011.
Li, Z., Lve, S., Wen, L., Zhao, L., Ao, Y., and Wang, S.: Effect of a cold, dry air incursion on atmospheric boundary layer processes over a high-altitude lake in the Tibetan Plateau, Atmos. Res., 185, 32–43, 2017.
Liu, L., Zheng, J., Ruan, Z., Cui, Z., Hu, Z., Wu, S., Dai, G., and Wu, Y.: Comprehensive radar observations of clouds and precipitation over the Tibetan Plateau and preliminary analysis of cloud properties, J. Meteorol. Res-PRC, 29, 546–561, 2015.
Lu, C., Yu, G., and Xie, G.: Tibetan plateau serves as a water tower, in: Proceedings 2005 IEEE International Geoscience and Remote Sensing Symposium, IGARSS'05. 5, 2120–3123, 2005.
Lve, Y., Ma, Y., Li, M., and Sun, F.: Study on Characteristic of Atmospheric Boundary Layer over Lake Namco Region, Tibetan Plateau, Plateau Meteorol., 27, 1205–1210, 2008.
Ma, W. and Ma, Y.: The evaluation of AMSR-E soil moisture data in atmospheric modeling using a suitable time series iteration to derive land surface fluxes over the Tibetan Plateau, PLoS ONE, 14, e0226373, https://doi.org/10.1371/journal.pone.0226373, 2019.
Ma, Y., Fan, S., Ishikawa, H., Tsukamoto, O., Yao, T., Koike, T., Zuo, H., Hu, Z., and Su, Z.: Diurnal and inter-monthly variation of land surface heat fluxes over the central Tibetan Plateau area, Theor. Appl. Climatol., 80, 259–273, 2005.
Ma, Y., Wang, Y., Wu, R., Hu, Z., Yang, K., Li, M., Ma, W., Zhong, L., Sun, F., Chen, X., Zhu, Z., Wang, S., and Ishikawa, H.: Recent advances on the study of atmosphere-land interaction observations on the Tibetan Plateau, Hydrol. Earth Syst. Sci., 13, 1103–1111, https://doi.org/10.5194/hess-13-1103-2009, 2009.
Ma, Y., Hu, Z., and Tian, L.: Study process of the Tibet Plateau climate system change and mechanism of its impact on East Asia, Adv. Earth Sci., 29, 207–215, 2014a.
Ma, Y., Zhu, Z., Zhong, L., Wang, B., Han, C., Wang, Z., Wang, Y., Lu, L., Amatya, P. M., Ma, W., and Hu, Z.: Combining MODIS, AVHRR and in situ data for evapotranspiration estimation over heterogeneous landscape of the Tibetan Plateau, Atmos. Chem. Phys., 14, 1507–1515, https://doi.org/10.5194/acp-14-1507-2014, 2014b.
Nakanish, M.: Improvement of the Mellor–Yamada turbulence closure model based on large-eddy simulation data, Bound.-Lay. Meteorol., 99, 349–378, 2001.
Nakanishi, M. and Niino, H.: An improved Mellor–Yamada level-3 model with condensation physics, Its design and verification, Bound.-Lay. Meteorol., 112, 1–31, 2004.
Oleson, K. W., Lawrence, D. M., Bonan, G. B., Flanner, M. G., Kluzek, E., Lawrence, P. J., Levis, S., Swenson, S. C., and Thornton, P. E.: Technical description of version 4.0 of the Community Land Model (CLM), NCAR/TN-478+STR, Natl. Cent. for Atmos. Res., Boulder, Colo, 2010.
Pithan, F.: Asian water towers: More on monsoons, Science, 330, 584–585, 2010.
Qin, J., Yang, K., Lu, N., Chen, Y., Zhao, L., and Han, M.: Spatial upscaling of in-situ soil moisture measurements based on MODIS-derived apparent thermal inertia, Remote Sens. Environ., 138, 1–9, 2013.
Santanello Jr., J. A., Peters-Lidard, C. D., Kumar, S. V., Alonge, C., and Tao, W. K.: A modeling and observational framework for diagnosing local land–atmosphere coupling on diurnal time scales, J. Hydrometeorol., 10, 577–599, 2009.
Santanello Jr., J. A., Peters-Lidard, C. D., and Kumar, S. V.: Diagnosing the sensitivity of local land–atmosphere coupling via the soil moisture–boundary layer interaction, J. Hydrometeorol., 12, 766–786, 2011.
Santanello Jr., J. A., Dirmeyer, P. A., Ferguson, C. R., Findell, K. L., Tawfik, A. B., Berg, A., Ek, M., Gentine, P., Guillod, B. P., van Heerwaarden, C., and Roundy, J.: Land–atmosphere interactions: the LoCo perspective, B. Am. Meteorol. Soc., 99, 1253–1272, 2018.
Santanello Jr., J. A., Lawston, P., Kumar, S., and Dennis, E.: Understanding the Impacts of Soil Moisture Initial Conditions on NWP in the Context of Land–Atmosphere Coupling, J. Hydrometeorol., 20, 793–819, 2019.
Skamarock, W. C., Klemp, J., Dudhia, J., Gill, D., Barker, D., Wang, W., and Powers, J.: A Description of the Advanced Research WRF Version 3, NCAR Tech Notes-475+ STR, National Center for Atmospheric Research (NCAR), Boulder, CO, USA, available at: https://www.mmm.ucar.edu/weather-research-and-forecasting-model (last access: 10 December 2020), 2008.
Su, Z., De Rosnay, P., Wen, J., Wang, L., and Zeng, Y.: Evaluation of ECMWF's soil moisture analyses using observations on the Tibetan Plateau, J. Geophys. Res.-Atmos., 118, 5304–5318, 2013.
Sun, G., Hu, Z., Sun, F., Wang, J., Xie, Z., Lin, Y., and Huang, F.: An Analysis of the Influence of Spatial Scales on Surface Fluxes in North Tibetan Plateau Based on Eddy Covariance and Large Aperture Scintillometer Data, Theor. Appl. Climatol., 129, 965–976, https://doi.org/10.1007/s00704-016-1809-7, 2016.
Sun, G., Hu, Z., Wang, J., Ma, W., Gu, L., Sun, F., and Xie, Z.: The Spatial Heterogeneity of Land Surface Conditions and Its Influence on Surface Fluxes over a Typical Underlying Surface in the Tibetan Plateau, Theor. Appl. Climatol., 135, 221–235, https://doi.org/10.1007/s00704-018-2369-9, 2018.
Wang, B., Yaoming, M., Ma, W., and Su, Z.: Physical controls on half-hourly, daily, and monthly turbulent flux and energy budget over a high-altitude small lake on the Tibetan Plateau, J. Geophys. Res.-Atmos., 122, 2289–2303, https://doi.org/10.1002/2016JD026109, 2017.
Xin, Y., Chen, F., Zhao, P., Barlage, M., Blanken, P., Chen, Y., Chen, B., and Wang, Y.: Surface energy balance closure at ten sites over the Tibetan plateau, Agr. Forest Meteorol., 259, 317–328, 2018.
Xu, L., Liu, H., Xu, X., Du, J., and Wang, L.: Evaluation of WRF model to simulation atmospheric boundary layer over Nagqu area in Tibetan Plateau, Acta Meteorol. Sin., 76, 955–967, 2018.
Xue, B. L., Wang, L., Yang, K., Tian, L., Qin, J., Chen, Y., Zhao, L., Ma, Y., Koike, T., Hu, Z., and Li, X.: Modeling the land surface water and energy cycles of a mesoscale watershed in the central Tibetan Plateau during summer with a distributed hydrological model, J. Geophys. Res.-Atmos., 118, 8857–8868, 2013.
Yao, J., Zhao, L., Ding, Y., Gu, L., Jiao, K., Qiao, Y., and Wang, Y.: The surface energy budget and evapotranspiration in the Tanggula region on the Tibetan Plateau, Cold Reg. Sci. Technol., 52, 326–340, 2008.
Yang, K., Ye, B., Zhou, D., Wu, B., Foken, T., Qin, J., and Zhou, Z.: Response of hydrological cycle to recent climate changes in the Tibetan Plateau, Clim. Chang., 109, 517–534, 2011.
Yang, K., Qin, J., Zhao, L., Chen, Y., Tang, W., Han, M., Chen, Z., Lv, N., Ding, B., Wu, H., and Lin, C.: A multiscale soil moisture and freeze–thaw monitoring network on the third pole, B. Am. Meteor. Soc., 94, 1907–1916, 2013.
Yang, K., Wu, H., Qin, J., Lin, C., Tang, W., and Chen, Y.: Recent climate changes over the Tibetan Plateau and their impacts on energy and water cycle: A review, Global Planet. Change, 112, 79–91, 2014.
Yang, X., Lu, Y., Ma, Y., and Wen, J.: Summertime thermally-induced circulations over the Lake Nam Co region of the Tibetan Plateau, J. Meteor. Res., 29, 305–314, https://doi.org/10.1007/s13351-015-4024-z, 2015.
Zhao, L., Yang, K., Qin, J., Chen, Y., Tang, W., Lu, H., and Yang, Z. L.: The scale-dependence of SMOS soil moisture accuracy and its improvement through land data assimilation in the central Tibetan Plateau, Remote Sens. Environ., 152, 345–355, 2014.
Zhao, P., Xu, X., Chen, F., Guo, X., Zheng, X., Liu, L., Hong, Y., Li, Y., La, Z., Peng, H., and Zhong, L.: The third atmospheric scientific experiment for understanding the earth–atmosphere coupled system over the Tibetan Plateau and its effects, B. Am. Meteor. Soc., 99, 757–776, 2018.
Zhao, P., Li, Y., Guo, X., Xu, X., Liu, Y., Tang, S., Xiao, W., Shi, C., Ma, Y., Yu, X., and Liu, H.: The Tibetan Plateau Surface-Atmosphere Coupling System and Its Weather and Climate Effects: The Third Tibetan Plateau Atmospheric Science Experiment, J. Meteorol. Res.-PRC, 33, 375–399, 2019.