the Creative Commons Attribution 4.0 License.
the Creative Commons Attribution 4.0 License.
 | 15 Dec 2020
Diverging hydrological drought traits over Europe with global warming
Carmelo Cammalleri
Gustavo Naumann
Lorenzo Mentaschi
Bernard Bisselink
Emiliano Gelati
Ad De Roo
Luc Feyen
Climate change is anticipated to alter the demand and supply of water at the earth's surface. Since many societal impacts from a lack of water happen under drought conditions, it is important to understand how droughts may develop with climate change. This study shows how hydrological droughts will change across Europe with increasing global warming levels (GWLs of 1.5, 2, and 3 K above pre-industrial temperature). We employed a low-flow analysis based on river discharge simulations of the LISFLOOD (De Roo et al., 2000) spatially distributed physically based hydrological and water use model, which was forced with a large ensemble of regional climate model projections under high emissions (RCP8.5) and moderate mitigation (RCP4.5) Representative Concentration Pathways. Different traits of drought, including severity, duration, and frequency, were investigated using the threshold level method. The projected changes in these traits identify four main sub-regions in Europe that are characterized by somehow homogeneous and distinct behaviours with a clear south-west–north-east contrast. The Mediterranean and Boreal sub-regions (defined in Sect. 3.1.1) of Europe show strong but opposite changes at all three GWLs, with the former area mostly characterized by stronger droughts (with larger differences at 3 K), while the latter is expected to experience a reduction in all drought traits. In the Atlantic and Continental sub-regions, the changes are expected to be less marked and characterized by a larger uncertainty, especially at the 1.5 and 2 K GWLs. Combining the projections in drought hazard with population and agricultural information shows that with 3 K global warming an additional 11 million people and 4.5 ×10⁶ ha of agricultural land are projected to be exposed to droughts every year, on average, with the most affected areas located in the Mediterranean and Atlantic regions of Europe.
- Article
(4534 KB) - Full-text XML
- BibTeX
- EndNote


As a natural phenomenon, drought occurs in all climates due to a temporary lack of precipitation, which can propagate through the different compartments of the water cycle (Van Loon and Van Lanen, 2012). Drought conditions can be exacerbated by high temperatures, causing an increase in evapotranspiration demand and soil water content draining (e.g. Teuling et al., 2013), and their impacts can be further intensified in areas with an overexploitation of available water resources (Van Loon and Van Lanen, 2013). The strong dependency of drought conditions on the key meteorological forcing suggests likely effects of climate change on future drought severity, duration, and frequency, mainly through an alteration of the water balance dynamics (Stagl et al., 2014).
Depending on the degree of penetration of the water deficit into the hydrological cycle, drought is commonly classified into meteorological (e.g. precipitation), agricultural (e.g. soil moisture), and hydrological (e.g. river discharge) drought (Wilhite, 2000). Each drought type may be perceived most relevant for a specific application, and different indicators may capture different effects of climate change (Feng, 2017). In spite of the strong connection between the socio-economic impacts of droughts and negative soil moisture and river discharge anomalies, fewer studies (e.g. Samaniego et al., 2018; Forzieri et al., 2014) have focused on the impact of climate change on agricultural and hydrological droughts at the European scale compared to meteorological events (e.g. Heinrich and Gobiet, 2012; Spinoni et al., 2018). This focus on meteorological drought mainly relates to the relative simplicity and lower input data requirements of calculating meteorological drought indicators (i.e. Standardized Precipitation Index, SPI) compared to agricultural and hydrological drought indices, whose analysis usually requires simulations from hydrological models, as also highlighted by the larger emphasis placed on meteorological drought hazard in operational monitoring systems (Barker et al., 2016). Scientific and practical interest in hydrological drought is motivated by the direct and indirect impacts on several socio-economic sectors, such as energy production, inland water transportation (Meyer et al., 2013), irrigated agriculture, and public water supply (see the European Drought Impact Inventory, https://www.geo.uio.no/edc/droughtdb/, last access: 9 December 2020), as well as causing losses of ecosystem and biodiversity (Crausbay and Ramirez, 2017). In particular, streamflow drought complements meteorological and soil moisture droughts thanks to its more rapid response to precipitation aberrations compared to groundwater (Tallaksen and van Lanen, 2004).
With the raising awareness of climate change, a number of local and regional studies assessed the potential impacts of climate change on hydrological drought in recent years (e.g. Brunner et al., 2019; Cervi et al., 2018; Hellwig and Stahl, 2018; Nerantzaki et al., 2019; Rudd et al., 2019; Van Tiel et al., 2018). These studies provided highly detailed insights into the local processes, but the limited extent of their spatial domain and lack of homogeneity in the adopted drought indicators, modelling framework, and climate scenarios complicated the understanding of large-scale patterns of changes. In spite of the value of continental-scale analyses, few studies have looked at how hydrological droughts could develop across Europe with climate change. They are typically based on pan-European hydrological models forced by climate projections (Feyen and Dankers, 2009; Forzieri et al., 2014; Lehner et al., 2006; Marx et al., 2018; Roudier et al., 2016), with ever improved representation of processes in the hydrological models. These improvements included accounting for the effects of water use, more detail in the climate projections (by the use of higher-resolution regional climate models), and better accounting for climate uncertainty through multi-model ensembles.
Most past studies portrayed how drought conditions across Europe could look at future points in time (mid or end of century) for alternative scenarios of greenhouse gas emissions. However, following the UNFCCC (United Nations Framework Convention on Climate Change) Paris Agreement (UNFCCC, 2015) and the focus on limiting the increase in global average temperature to well below 2 K above the pre-industrial level, the paradigm in climate change studies has started to shift from analysing the effects at specific future time windows to evaluating the effect at specific global warming levels (GWLs). To date, there are only few studies that provide insights into how hydrological droughts could change at different GWLs. Roudier et al. (2016) used three hydrological models forced with high-resolution regional climate projections to evaluate changes in 10- and 100-year streamflow drought events, with a focus solely on the 2 K scenario. Marx et al. (2018) used three different hydrological models forced by coarse-resolution global climate projections that were downscaled, accounting for altitude effects in temperature and precipitation. They used a simple 90th percentile of exceedance of river discharge as index, which is representative of the low-flow spectrum. Both studies did not consider water consumption, which is key to represent feedback loops between droughts and human activities (Van Loon et al., 2016).
The daily streamflow simulations for the pan-European river network obtained with the LISFLOOD (De Roo et al., 2000) spatially distributed hydrological model, forced with an ensemble of 11 bias-corrected regional climate projections for RCP4.5 and RCP8.5 (Moss et al., 2010), were used to further deepen the understanding of the influence of climate change and water use on future droughts. The model incorporates water use modules to reproduce the major sectorial water demands, accounting for the human impact on streamflow propagation and resulting in a streamflow deficit that represents the integrated deficiency in water availability over the entire upstream catchment.
These streamflow simulations were analysed with the following two goals: (i) evaluate changes in hydrological droughts across Europe between present climate and climate corresponding to different GWLs and (ii) quantify the effects of the projected changes on two of the main exposed compartments, such as population and agricultural land. Specifically, we look at 1.5, 2, and 3 K global warming, which represent the different Paris Agreement climate change mitigation targets, and we exploited the threshold level method for event extraction, which allows for a detailed extreme-value analysis of different streamflow drought traits, including severity, duration, and frequency. The effects of the projected changes on two key exposed quantities is also evaluated through a drought exposure analysis, with a specific focus on the changes between the present and future exposed population and agricultural land, which are representative quantities in the major social and economic sectors impacted by drought in Europe (e.g. agriculture and livestock farming and public water supply).
2.1 Climate forcing
In this study, we used projections from 11 combinations of global and regional climate models under two Representative Concentration Pathways (RCP4.5 and RCP8.5) obtained from the EURO-CORDEX initiative (Jacob et al., 2014). The climate projections used in this study were produced by Dosio (2020) by applying a bias-correction quantile mapping approach (Dosio et al., 2012) using the observational dataset EOBSv10 (Haylock et al., 2008). The analysis focused on 30-year time windows centred on the year when the global models project an increase in global average temperature of 1.5, 2, and 3 K above pre-industrial (1881–1910) temperature. For these periods, drought characteristics were contrasted against those derived for the baseline reference period (1981–2010), which has a 0.7 K temperature increase compared to the pre-industrial period.
Across all models, the two RCPs reach the 1.5 and 2 K GWLs around the years 2030 and 2053 (RCP4.5) and 2025 and 2040 (RCP8.5), respectively, on average. The RCP8.5 simulations reach the 3 K GWL in 2063 on average, whereas only one model reaches 3 K warming for RCP4.5. According to the independence of the projected river flow changes from the adopted pathway observed in Mentaschi et al. (2020) for annual minimum (drought), average, and maximum (flood) flows, we assumed that a single multi-model ensemble can be obtained by merging the outputs from both RCPs. Given that only one model reaches 3 K warming for RCP4.5, the model ensemble was composed of a total of 22 members for the 1.5 and 2 K GWLs and only 12 members for the 3 K GWL.
2.2 Hydrological modelling
Simulations of daily river discharge (Q) were produced at a 5 km × 5 km spatial resolution over Europe by forcing the LISFLOOD model (De Roo, 2000) with the bias-corrected climate projections. LISFLOOD is a spatially distributed physically based hydrological model that simulates all the main hydrological processes occurring in the land–atmosphere system, including evapotranspiration fluxes (separately for crop transpiration and direct evaporation), infiltration (Xinanjiang model), soil water redistribution in the vadose zone (Darcy 1D vertical flow model), groundwater dynamics (two parallel linear reservoirs), snow accumulation and melt (degree-day factor method), and surface runoff (for further details on each module, see Burek et al., 2013). The surface runoff generated in each cell is channelled to the nearest river network cell by means of a routing component based on a four-point implicit finite-difference solution of the kinematic wave (Chow et al., 1988).
The water abstractions component in LISFLOOD consists of five modules: (manufacturing) industrial, energy, livestock, domestic, and irrigation water demand. While irrigation water demand is modelled dynamically within LISFLOOD, the other four components are downscaled to the model grid cells from country-level data obtained from EUROSTAT (https://ec.europa.eu/eurostat/home, last access: 09/12/2020) and AQUASTAT (http://www.fao.org/aquastat/en/, last access: 09/12/2020). High-resolution data from the Land-Use based Integrated Sustainability Assessment (LUISA) territorial modelling platform (Jacobs-Crisioni et al., 2017) were used for the spatial downscaling.
Specifically, irrigation was estimated dynamically at the model time step (daily in this study) based on two distinct methods for crop irrigation and rice paddy irrigation, as defined from land use maps. In the former, the demanded water amount by the crop (transpiration) is compared to the available water in the soil and the irrigation is modelled to keep the soil water content at field capacity (also accounting for the different efficiency of the irrigation systems). In the rice paddy irrigation instead, a defined water level is maintained during the whole irrigation season (also accounting for soil percolation).
Livestock water demand at grid scale was modelled as described in Mubareka et al. (2013), by computing the water demand of each livestock category (e.g. cattle, pigs, sheep) from livestock density maps and literature water requirements. Public water withdrawal was downscaled to model resolution using a land use proxy approach (Vandecasteele et al., 2014), assuming that public water withdrawal is the total water withdrawn in populated areas (i.e. water usage from the commercial/service class is negligible). Similarly, industrial water demand was disaggregated using the industry/commerce land use class in the LUISA platform (Bisselink et al., 2018). Water demand for energy and cooling was computed with a relatively similar approach, with national data downscaled to the locations of large thermal power stations registered in the European Pollutant Release and Transfer Register database (E-PRTR).
Future projections of the main socio-economic drivers of water use are based on the EU economic, budgetary, and demographic projections (EC, 2015), as well as the European energy reference scenario (Capros et al., 2013) available in the LUISA platform. Irrigation demand was modelled based on projected agriculture land use changes and the dynamic climate-dependent water requirements. Projections of future industrial water demand were based on the gross value added of the industrial sector available from the GEM-E3 model (Capros et al., 2013). Future changes in energy water use were simulated according to the electricity consumption projections from the POLES model (Prospective Outlook on Long-term Energy Systems; Keramidas et al., 2017). Future domestic water demand was estimated based on spatially detailed (100 m × 100 m) projected population maps. Due to the absence of information on future livestock in LUISA, the corresponding water demand was kept constant. Considering the relatively limited extent of area with high livestock water demand (Mubareka et al., 2013), only small effects are expected due to this assumption. As the EU projections do not go up to the end of the century, projections of water use are dynamic only up to 2050 and were kept constant afterwards.
The LISFLOOD modelling framework has been extensively tested in various studies focused on both floods and droughts. Details on the calibration and validation procedure of the model are summarized in Appendix A.
2.3 Drought modelling
The hydrological drought modelling approach used in this study is analogous to the methodology used to estimate the low-flow indicator developed as part of the European Drought Observatory (EDO) (Cammalleri et al., 2017). The key quantity is the water deficit computed from an unbroken sequence of discharge (Q) values below a defined low-flow threshold. We used the 85th percentile of exceedance, Q85, derived for the present climate as a threshold both in the present and future scenarios, with the aim to estimate how droughts under present climate conditions will be projected under climate change.
According to the theory of runs (Yevjevich, 1967), a continuous period with river flow values below the defined low-flow threshold was considered a drought event, of which the severity was quantified by the total deficit (D, represented by the area enclosed between the threshold and the streamflow time series). Other key traits of drought derived from the analysis were the duration, quantified by the length of the drought in days (N), and the frequency of the events, which can be expressed as return period (T).
In order to avoid potential bias in the analysis with the inclusion of minor events and to ensure the independence among events, two post-processing corrections were applied after selection of the events below the threshold: (1) small isolated events (of duration less than 5 d) were removed from the analysis (Jakubowski and Radczuk, 2004), and (2) consecutive events with an inter-event time smaller than 10 d were pooled together (Zelenhasić and Salvai, 1987).
Following this drought definition, a sequence of events for both the baseline period and the three GWLs was derived. Given the large variability of D values across the European domain due to differences in hydrological regimes and size of river basins, the changes in drought severity were expressed as relative differences (%) from the values in the baseline period (1981–2010). The series of D events was fitted according to the Pareto Type II distribution (also known as a Lomax distribution, a special case of the generalized Pareto distribution), formally expressed as (Lomax, 1987)
where α and λ are the strictly positive shape and scale parameters, respectively, derived from the sample according to the maximum likelihood method. The fitted distributions allowed for computing the return period associated with a specific D value (T, the average occurrence interval which refers to the expected value of the number of realizations to be awaited before observing an event whose magnitude exceeds D; Serinaldi, 2015), or it could be used in reverse to estimate the D value associated with a specific return period.
The same drought modelling approach was previously tested in Cammalleri et al. (2017, 2020) for the development of a low-flow indicator as part of the European Drought Observatory and Global Drought Observatory (EDO and GDO, respectively; https://edo.jrc.ec.europa.eu, last access: 9 December 2020). These tests included assessments for some major past drought events, as well as a goodness-of-fit test for the Lomax distribution for both European and global river basins. Within EDO and GDO, regular monthly drought reports are also produced in the case of significant drought events (https://edo.jrc.ec.europa.eu/edov2/php/index.php?id=1051, last access: 9 December 2020), which also systematically evaluate the capability of the low-flow index to capture the dynamics of hydrological droughts.
2.4 Population and agricultural land exposed to streamflow drought
In order to quantify how global warming could change exposure to streamflow drought in Europe, different exposed quantities can be analysed depending on the impacted sector. Among the 15 impact categories available in the European Drought Impact Inventory (EDII, https://www.geo.uio.no/edc/droughtdb/, last access: 9 December 2020), agriculture and livestock farming (category 1) and public water supply (category 7) are the two most reported sectors. As a consequence, we decided to focus the exposure analysis on population and agricultural land, which are quantities strongly related to these two categories. For the baseline, we used the map of agricultural areas from the CORINE Land Cover (EEA, 2016) and the population density from the LUISA territorial modelling platform (Batista e Silva et al., 2013). Consistent with the water use simulations with socio-economic dynamics up to 2050, for future exposure the LUISA land use and population projections of 2050 were used.
The spatial data of population and agricultural land were summed over the NUTS 2 statistical regions (or equivalent for EU neighbour countries according to EUROSTAT, https://ec.europa.eu/eurostat/web/nuts/statistical-regions-outside-eu, last access: 9 December 2020). Similarly, the median change in drought frequency of an event with a 10-year return period in the baseline was computed from all the cells within a NUTS 2 region. These quantities allowed for computing the expected changes in exposed population and agricultural land, which were then equally divided over the 10-year period to obtain a standardized year-average quantity. Finally, changes over NUTS 2 regions were further aggregated to country scale.
3.1 Evaluation of the changes in main drought traits
3.1.1 Drought severity
Figure 1 shows the ensemble-median relative change in severity of a 10-year drought between the baseline and the GWLs, with positive (negative) values indicating a higher (lower) drought severity with warming compared to the reference. In order to assess the robustness of the ensemble-median values, the projected changes are considered robust only if at least 2∕3 of the ensemble members agree on the sign of change (no agreement otherwise), which is a simplification of the approach proposed by Tebaldi et al. (2011) and applied over Europe by Dosio and Fischer (2018).
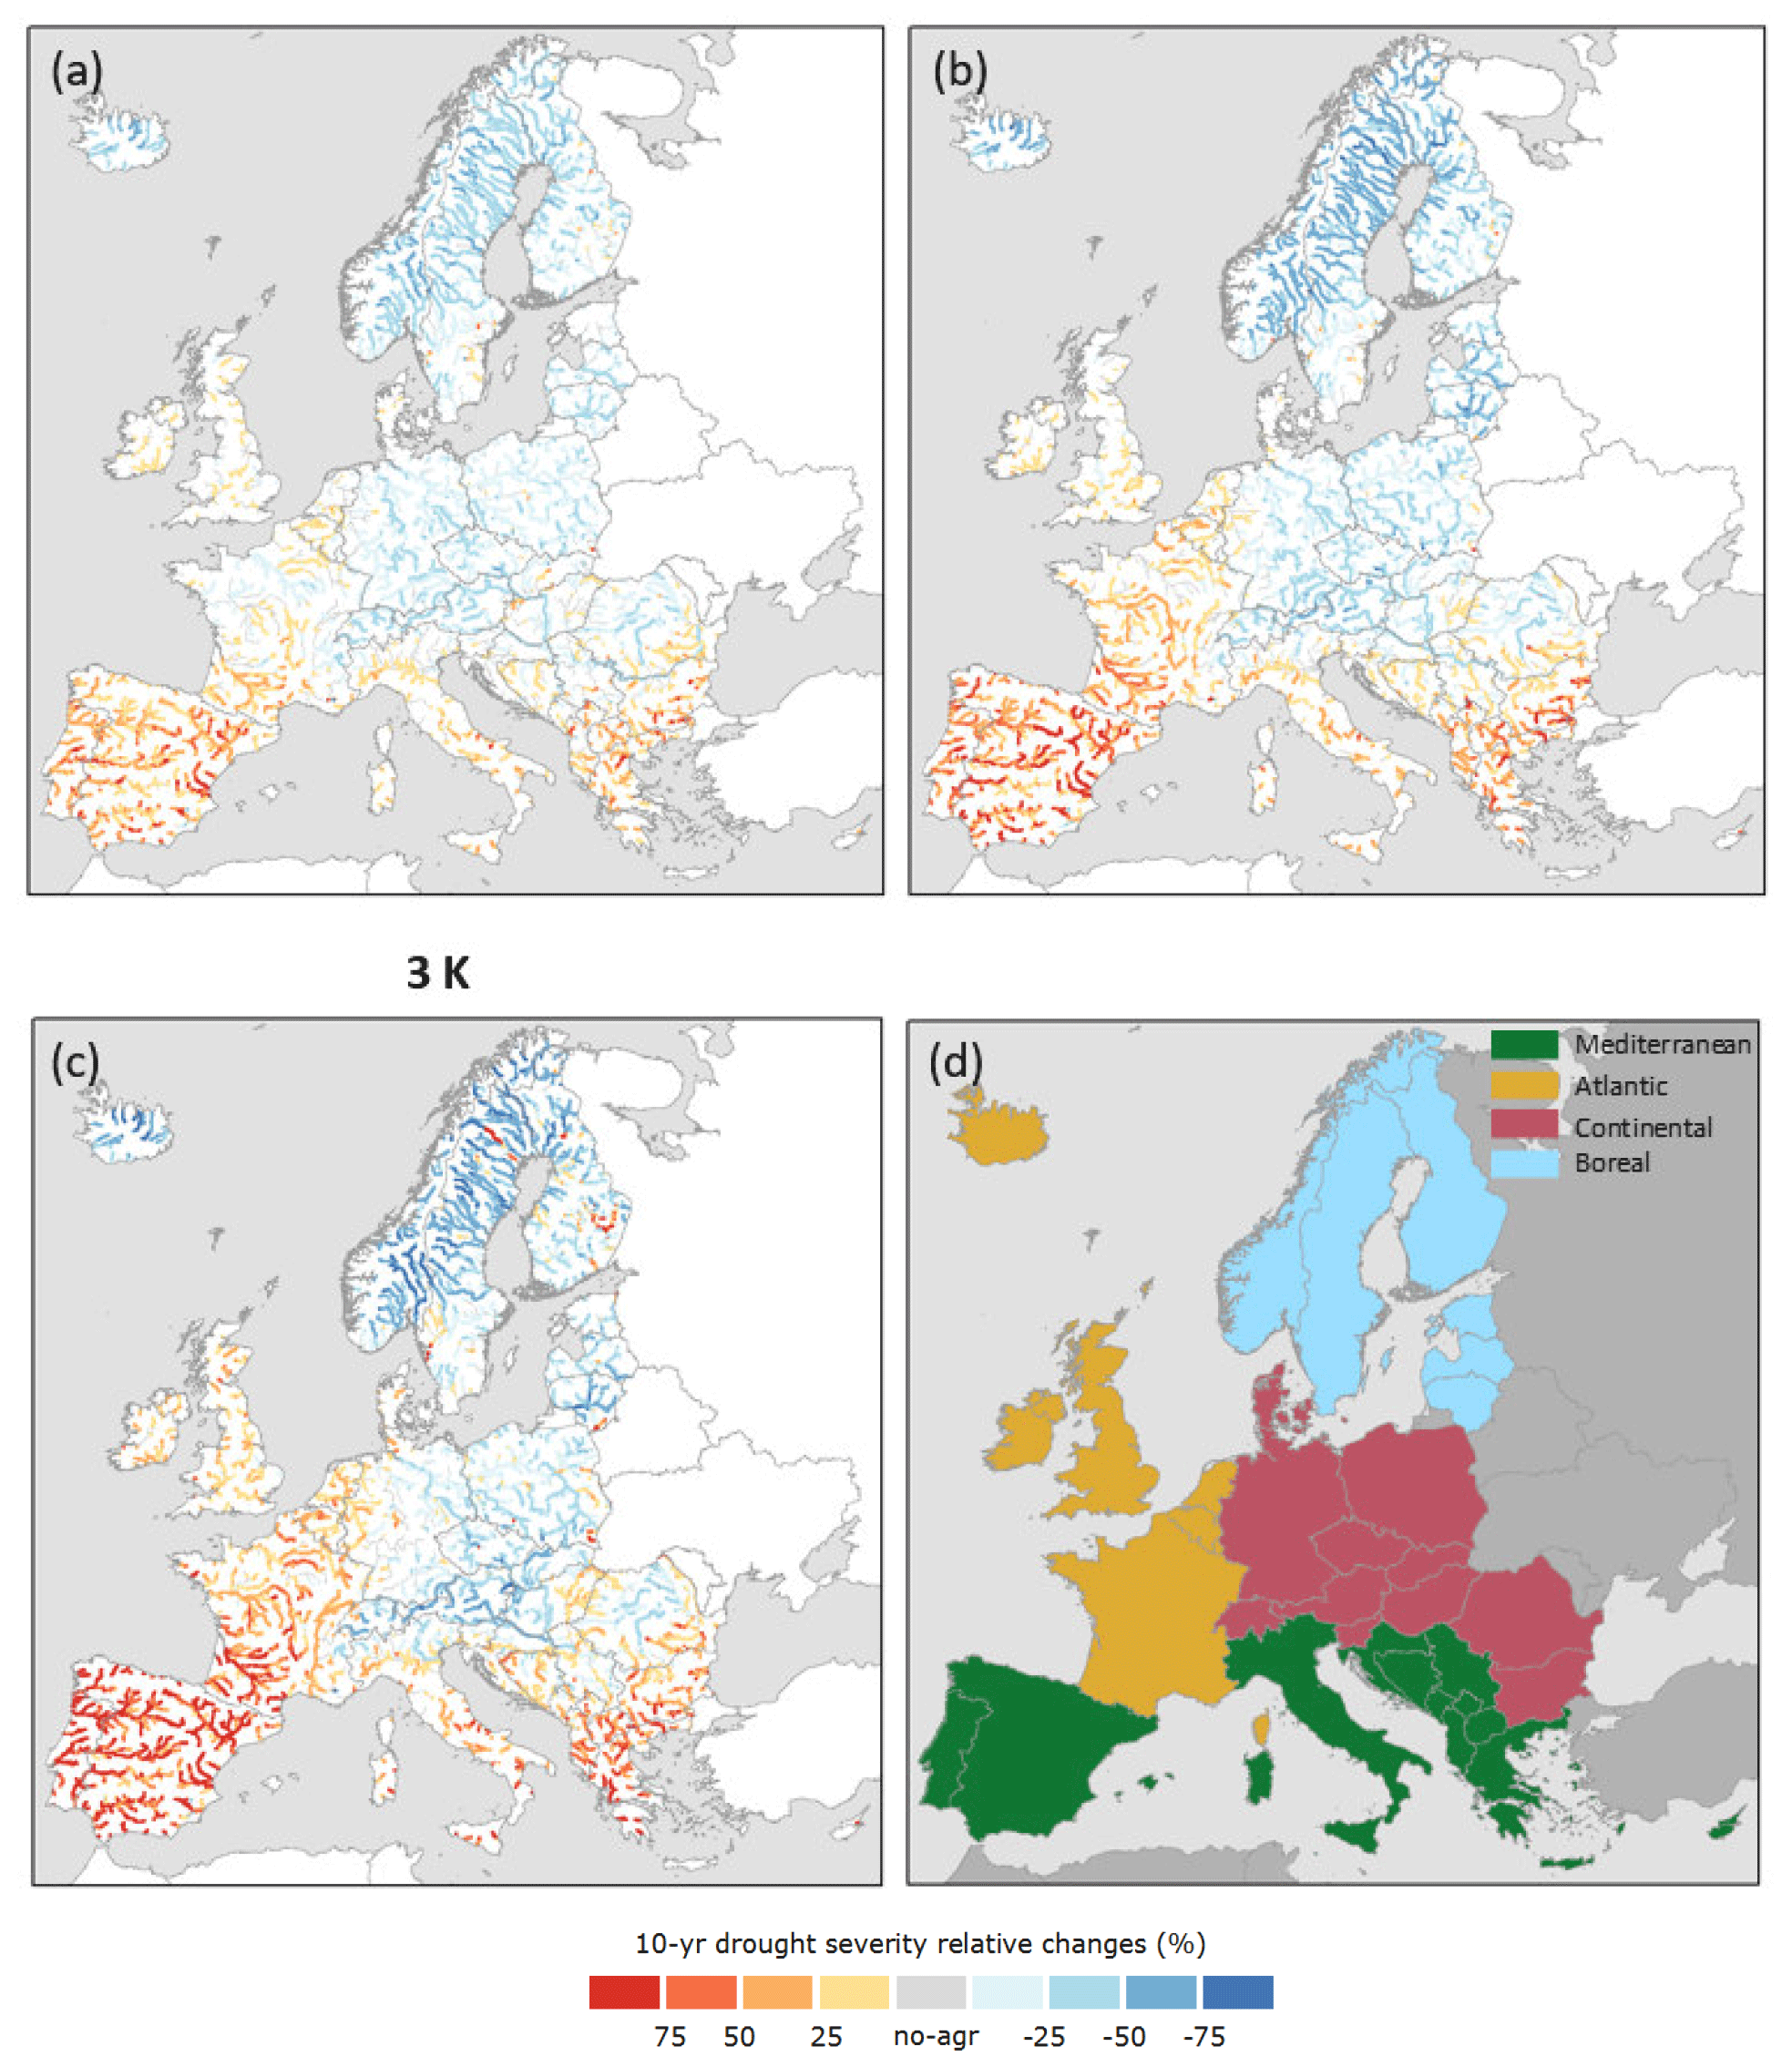
Figure 1Spatial distribution of the ensemble-median relative changes in drought severity of a 10-year drought (%) between reference period and the three GWLs: (a) 1.5 K, (b) 2 K, and (c) 3 K. Positive values represent an increase in drought severity with warming. The no-agreement (no-agr) class identifies the cells where less than 2∕3 of the climate ensemble members agree on the sign of the change. Panel (d) represents the four sub-regions used for aggregation, which are in line with the IPCC AR5 European macro-regions (Kovats et al., 2014).
The spatial maps depicted in Fig. 1 highlight a strong divergence in the projected changes of drought severity with warming over Europe, with four macro-regions (delimited in Fig. 1d) displaying somewhat homogeneous behaviour. The four macro-regions were derived by computing for each country the predominant change for the three GWLs and then by combining the countries with similar features. These macro-regions are in line with the ones defined in the IPCC AR5 (Intergovernmental Panel on Climate Change Fifth Assessment Report) subdivision for Europe (Kovats et al., 2014; Metzeger et al., 2005), and they have been already used in previous early studies at the continental scale (i.e. Feyen and Dankers, 2009; Lehner et al., 2006). These four macro-regions are adopted in all the subsequent analyses.
In the Mediterranean sub-region (i.e. Iberian Peninsula, Italy, Greece, and the Balkans) generally more-severe droughts are projected, whereas in the Boreal sub-area (i.e. Scandinavian Peninsula and Baltic countries) drought severity is expected to reduce almost everywhere. The projected changes are less marked in two transition regions, but, in general, they point towards more-severe droughts in the Atlantic sub-region (i.e. British Isles, France, Belgium, and the Netherlands) and less-severe droughts over the Continental sub-area (Germany, Poland, and eastern European countries). Overall, these patterns of change become stronger and more robust with increasing warming.
The strongest increase in drought severity is projected for Portugal, Spain, and Greece, where the fractions of rivers with an increase in deficit of more than 50 % at 3 K are 99 %, 80 %, and 75 %, respectively (Fig. 1c). If the climate stabilizes at 2 K, streamflow drought severity is lower than at 3 K but still at least 50 % higher than in the baseline for half of the rivers of Portugal and Spain and 35 % of Greece (Fig. 1b). Capping global warming at 1.5 K would further limit the increase in severity, with only 21 %, 20 %, and 14 % of the rivers of Portugal, Spain, and Greece, respectively, expected to experience an increase in drought severity of more than 50 % (Fig. 1a).
Over the Atlantic region (apart from Iceland), streamflow droughts are generally projected to also become more severe with global warming. The south of France shows a pattern towards more-severe flow deficits with warming that is similar to that projected for most of the Mediterranean. For the other parts of the Atlantic sub-region, the changes are less pronounced. Keeping warming to 2 K or below would limit the increase in severity for most of the region to below 25 % compared to the baseline (Fig. 1b). At 3 K warming (Fig. 1c), the increase in severity could reach up to 50 %. In some parts of the Atlantic sub-region, such as the Seine river catchment in France (northern France), at lower levels of warming the climate models do not agree on the sign of the change, or they show a small trend towards less-severe droughts. Yet, with stronger warming the signal of change reverses towards more-severe droughts.
Over most of the Continental sub-region there is a trend towards less-severe droughts with global warming. On the one hand, this trend is somewhat more pronounced in upstream Danube tributaries that drain the Alps to the east. In many downstream Danube tributaries in Hungary, Romania, and Bulgaria, on the other hand, streamflow droughts are projected to become more severe (in agreement with the results reported in Stagl and Hattermann, 2015). At low levels of global warming (1.5 and 2 K) most of Germany is expected to experience less-severe droughts (Fig. 1a and b). At high levels of warming (3 K, Fig. 1c), however, western parts of Germany are projected to experience an inverse trend, while the rest of the region shows a large uncertainty in the projected changes. In contrast to most of the Continental sub-area, projections of streamflow drought severity show an increase with global warming over the main rivers in Denmark.
Finally, in most of the Boreal region, streamflow drought deficits are expected to become progressively less severe with warming. At 3 K warming, streamflow droughts could be half as severe compared to the baseline, with few notable exceptions in southern Sweden (Fig. 1c).
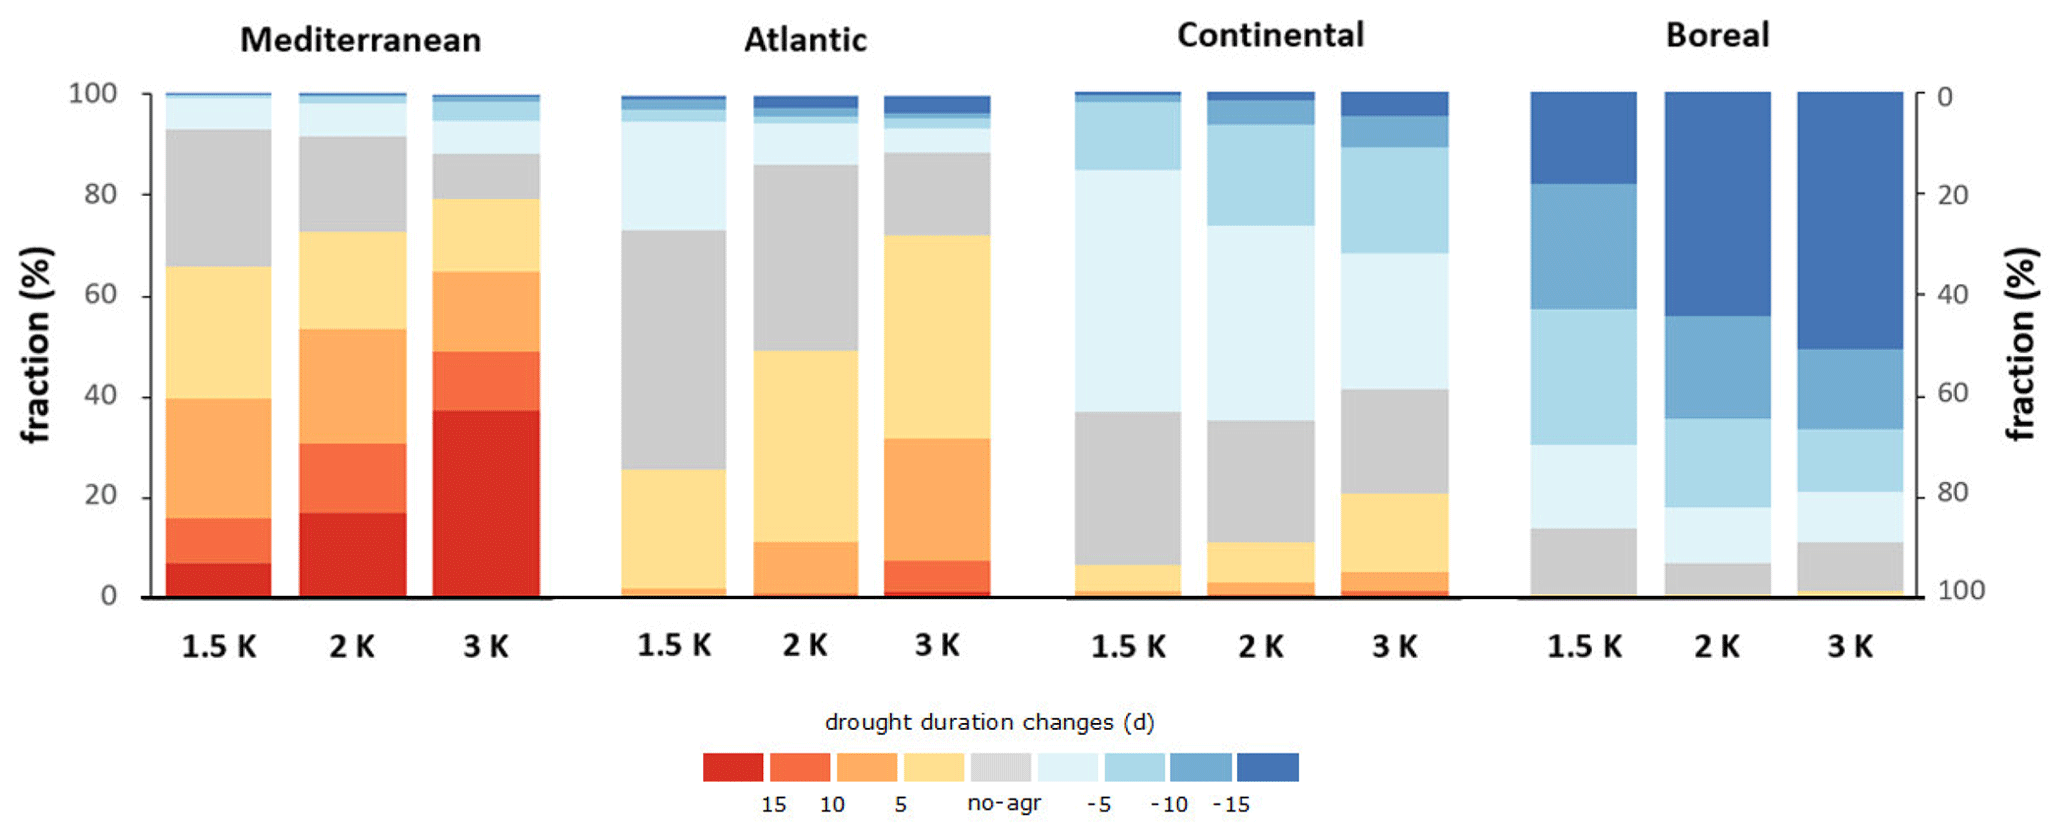
Figure 2Fraction of each sub-region within ranges of change in drought duration (days) for different GWLs. Note that two y axes are added to the figure only to facilitate the interpretation of the positive (left axis) and negative (right axis) fraction values.
3.1.2 Drought duration
Figure 2 shows the fraction of each sub-region (presented in Fig. 1d) for which a certain degree of change in drought duration (compared to the reference period) is projected for the different warming levels. There is a clear upward climate-change-induced trend in the fraction of the Mediterranean sub-region that will be exposed to longer droughts with increasing GWL. When keeping global warming limited to 1.5 K, droughts are projected to last more than 5 d longer in about 40 % of the Mediterranean, with a prolongation above 15 d in slightly more than 5 % of the area. At 3 K warming, however, streamflow droughts will last longer than in the reference period in 80 % of the area and nearly half of the sub-region could face an increase in drought duration of at least 10 d.
An upward but less pronounced trend in drought duration with global warming is also projected for most of the Atlantic sub-region. At 1.5 K GWL and the area with negative changes in drought duration (about 30 %) is comparable to the area with positive changes, with no clear signal in about 40 % of the domain. With higher levels of warming, the area with a shorter drought duration compared to the reference shrinks, while the fraction of land that is expected to face longer droughts steadily expands. Compared to 1981–2010, droughts are projected to last longer in about 75 % of the sub-region at 3 K GWL, hence similar to what can be observed for the Mediterranean. Yet, for only 10 % of the area, drought duration is expected to increase by more than 10 d.
In the Continental sub-region, the area that shows a decrease in drought duration compared to the reference period is around 65 % at 1.5 K, which slightly reduces in extent with increasing warming. Yet, over this area droughts are expected to progressively shorten with further warming. At 3 K warming, there are positive changes of at least 10 and 15 d over more than 30 % and 10 % of the region, respectively. Drought duration is projected to increase over a small part (20 % at 3 K) of the domain compared to the reference period, mainly corresponding to Bulgaria.
Over the Boreal sub-region, droughts are projected to become shorter with global warming over practically the whole domain. At 1.5 K warming, drought duration is expected to be at least 15 d shorter than in 1981–2010 in 20 % of the area, which grows to 50 % of the area at 3 K warming. For all sub-regions, the fraction of area with no agreement in future drought duration changes tends to reduce with increasing global warming, and this signal is very consistent among all the climate projections. At 3 K warming, projections show that less than 15 % of the domain under study have no agreement in the direction of change in drought duration.
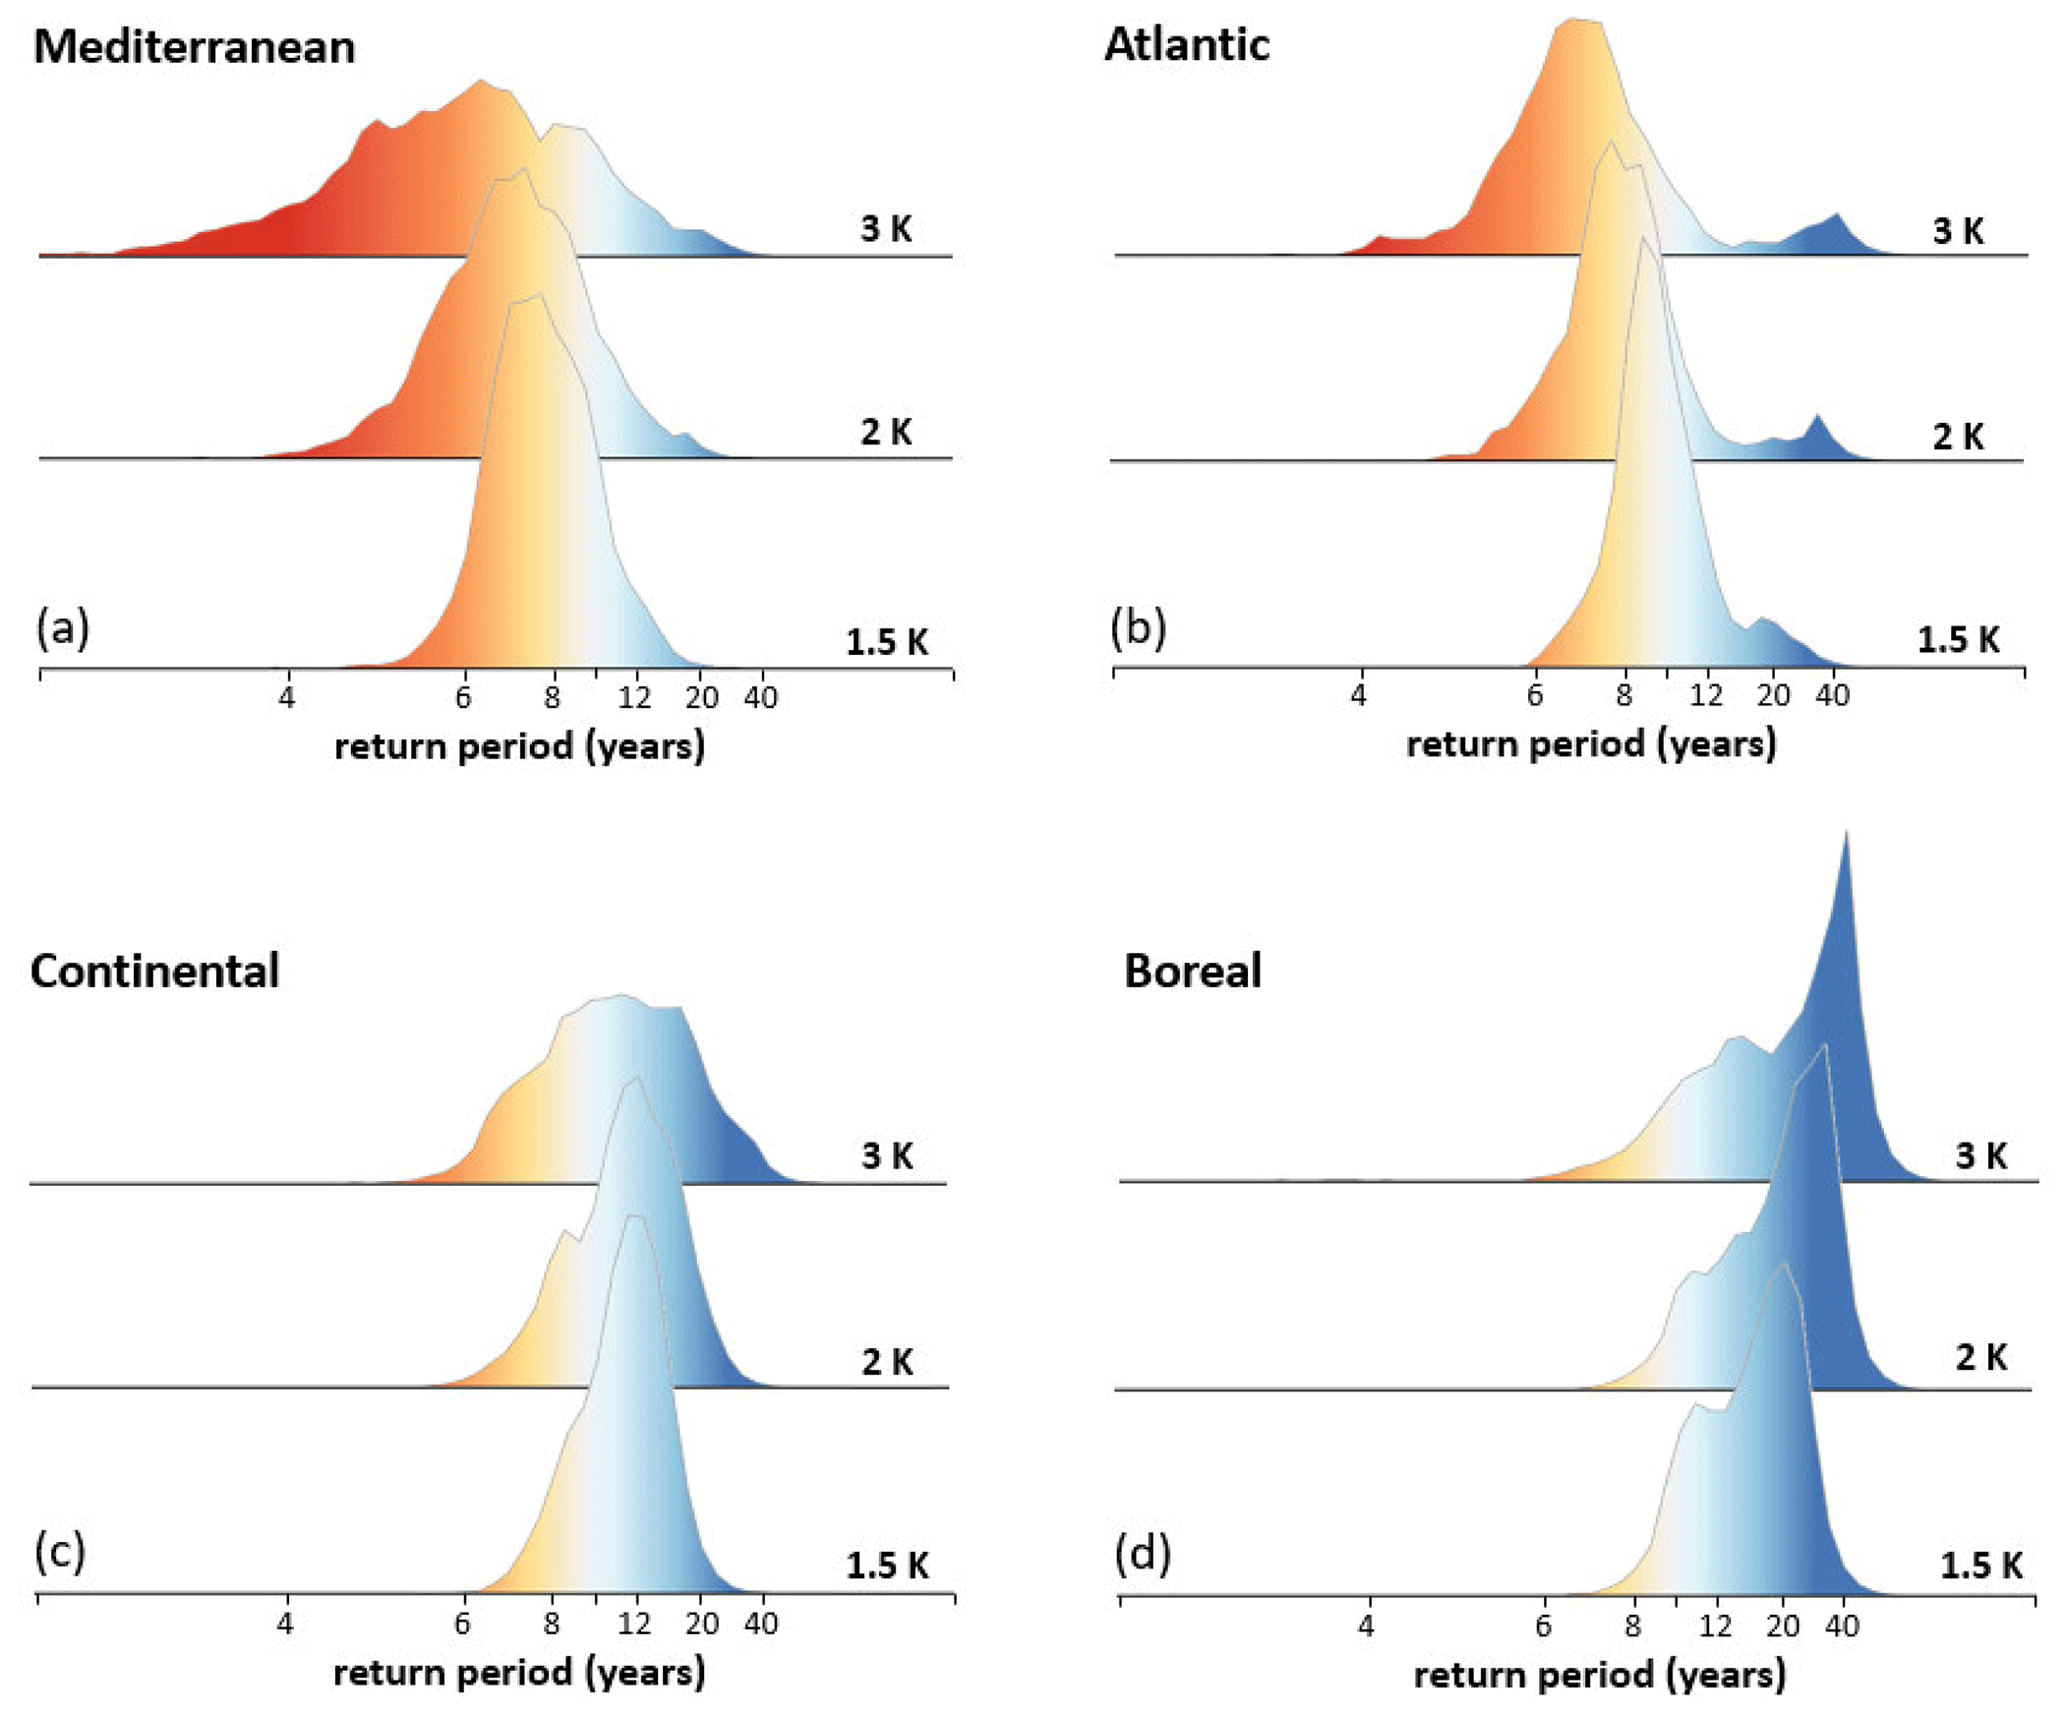
Figure 3Frequency distribution of the return period (years) for different GWLs corresponding to an event with a return period of 10 years in the reference baseline for the sub-regions: (a) Mediterranean, (b) Atlantic, (c) Continental, and (d) Boreal. Values lower (higher) than 10 represent an increase (reduction) in drought frequency. The vertical grey lines demark the 10-year return period, and the tick marks are uniformly spaced in frequency.
3.1.3 Drought frequency
Figure 3 shows the frequency density of drought return periods for the three GWLs corresponding to an event with a return period (T) of 10 years under baseline climate. In these plots, values greater than 10 can be interpreted as a reduction in drought frequency (an event with T=10 years in the baseline will become rarer), whereas values lower than 10 represent an increase in drought frequency (an event with T=10 years in the baseline will become more common).
The frequency distributions of T values for the Mediterranean (Fig. 3a) show a clear shift towards more recurrent droughts. At 1.5 K warming, the peak value is around 8 years, which further reduces to 7 and 6 years at 2 and 3 K warming, respectively. At 3 K warming, the lower tail of the distribution falls below 4 years. In nearly 10 % of the rivers, drought deficits that in baseline climate happen once in 10 years are expected to occur at least 2.5 times more frequent with 3 K warming. In the Atlantic sub-region, the central value also reduces with warming (Fig. 3b), yet the overall reduction is less pronounced than in the Mediterranean sub-area, with a median value around 7 years at 3 K warming. In the Continental region (Fig. 3c), droughts will in general become less frequent with a central value between 12 and 13 years at all warming levels, even if the fraction of river cells with an increase in frequency (around 28 % at 3 K) is larger than that with an increase in drought duration (less than 20 % at 3 K, see Fig. 2). In the Boreal sub-area the shift towards less-frequent droughts is much more pronounced, with projected return periods concentrated around 20, 30, and 40 years for 1.5, 2, and 3 K warming, respectively (Fig. 3d).
Changes in the frequency density plots can be observed not only in the central tendency values but also in the spread, which increases with warming for all regions. Additionally, changes opposite to the general trend can be observed in all regions. For example, over very few locations in the Mediterranean sub-region, such as some Alpine mountain drainage basins in northern Italy, drought conditions could become less severe and frequent (see also drought severity changes in Fig. 1). In the Atlantic region, the small secondary peak of T values > 20 years corresponds to areas where droughts are projected to occur less frequently with global warming, such as Iceland and a few tributaries from the Rhône that originate in the Alps (similarly to what was observed for drought severity in Fig. 1). Even in the Boreal region a small fraction of the sub-domain shows an increase in drought frequency, while drought duration is projected to reduce practically everywhere. Over this region, the presence of small areas with an increase in frequency causes a slight reduction in the frequency median value at 3 K GWL (26 years, compared to 27 years at 2 K) even if the peak shifts to the right with warming (i.e. less-frequent droughts).
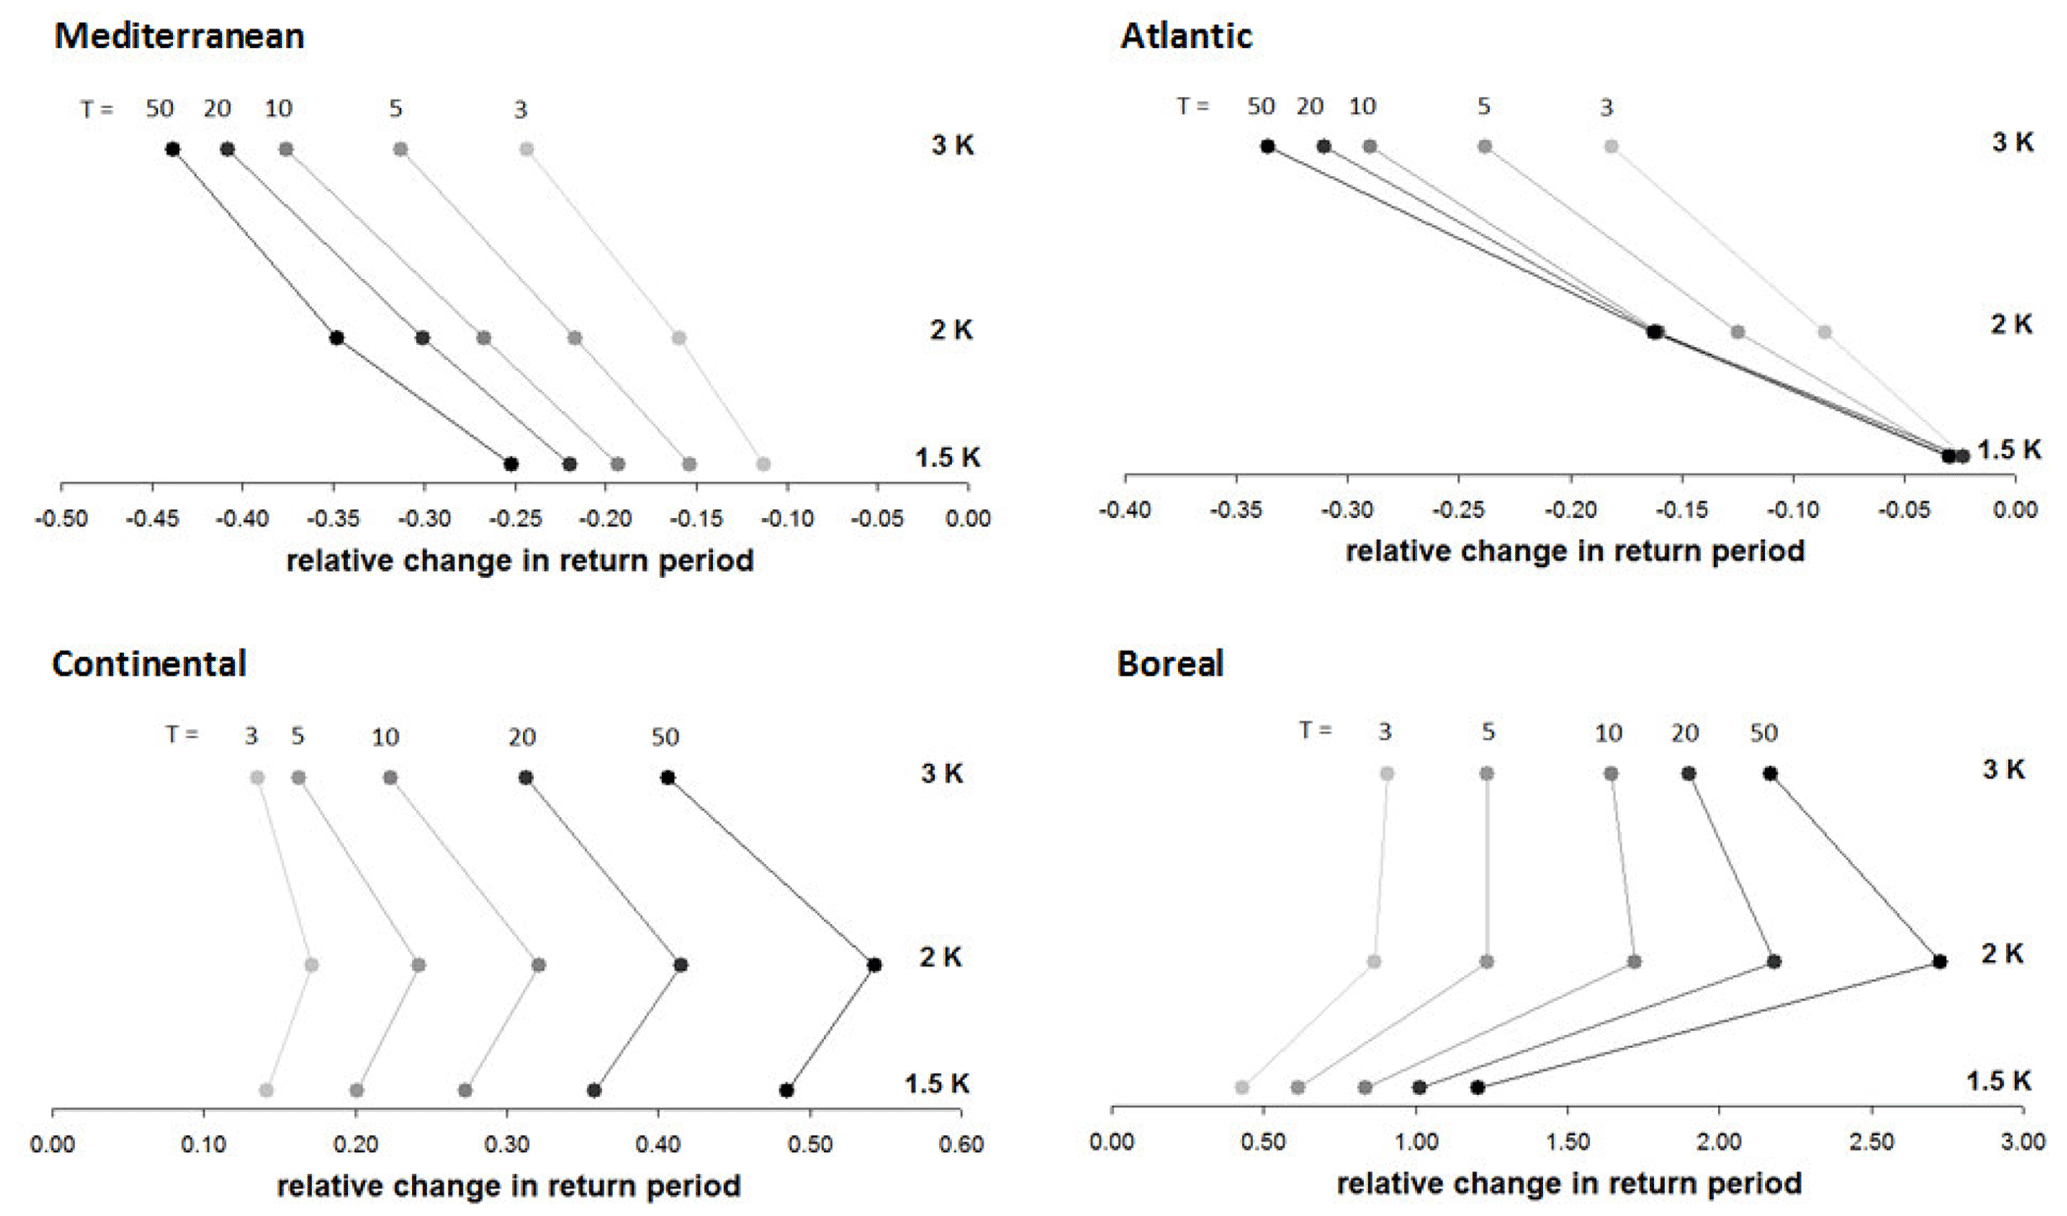
Figure 4Relative changes in sub-regional median return period (years) for different GWLs corresponding to events with a return period of 3, 5, 10, 20, and 50 years in the reference baseline. Negative (positive) values represent an increase (reduction) in drought frequency. Note that the x axis scale is different for each plot.
The results reported in Fig. 3 for the 10-year return period can be seen as representative of the behaviour at other return periods as well. To support this consideration, the data in Fig. 4 report the sub-region median relative changes at the three GWLs for events with a baseline return period of 3, 5, 10, 20, and 50 years. The plots clearly show how all the return periods have similar dynamics, with the only notable exception represented by the more marked reduction in median relative change of high return periods for the 3 K GWL in the Boreal sub-region (i.e. 20 and 50 years). It is also worth to point out how even if the dynamics are comparable among the different return periods, the magnitude of the relative changes is higher for the longer return periods (i.e. the rarer events).
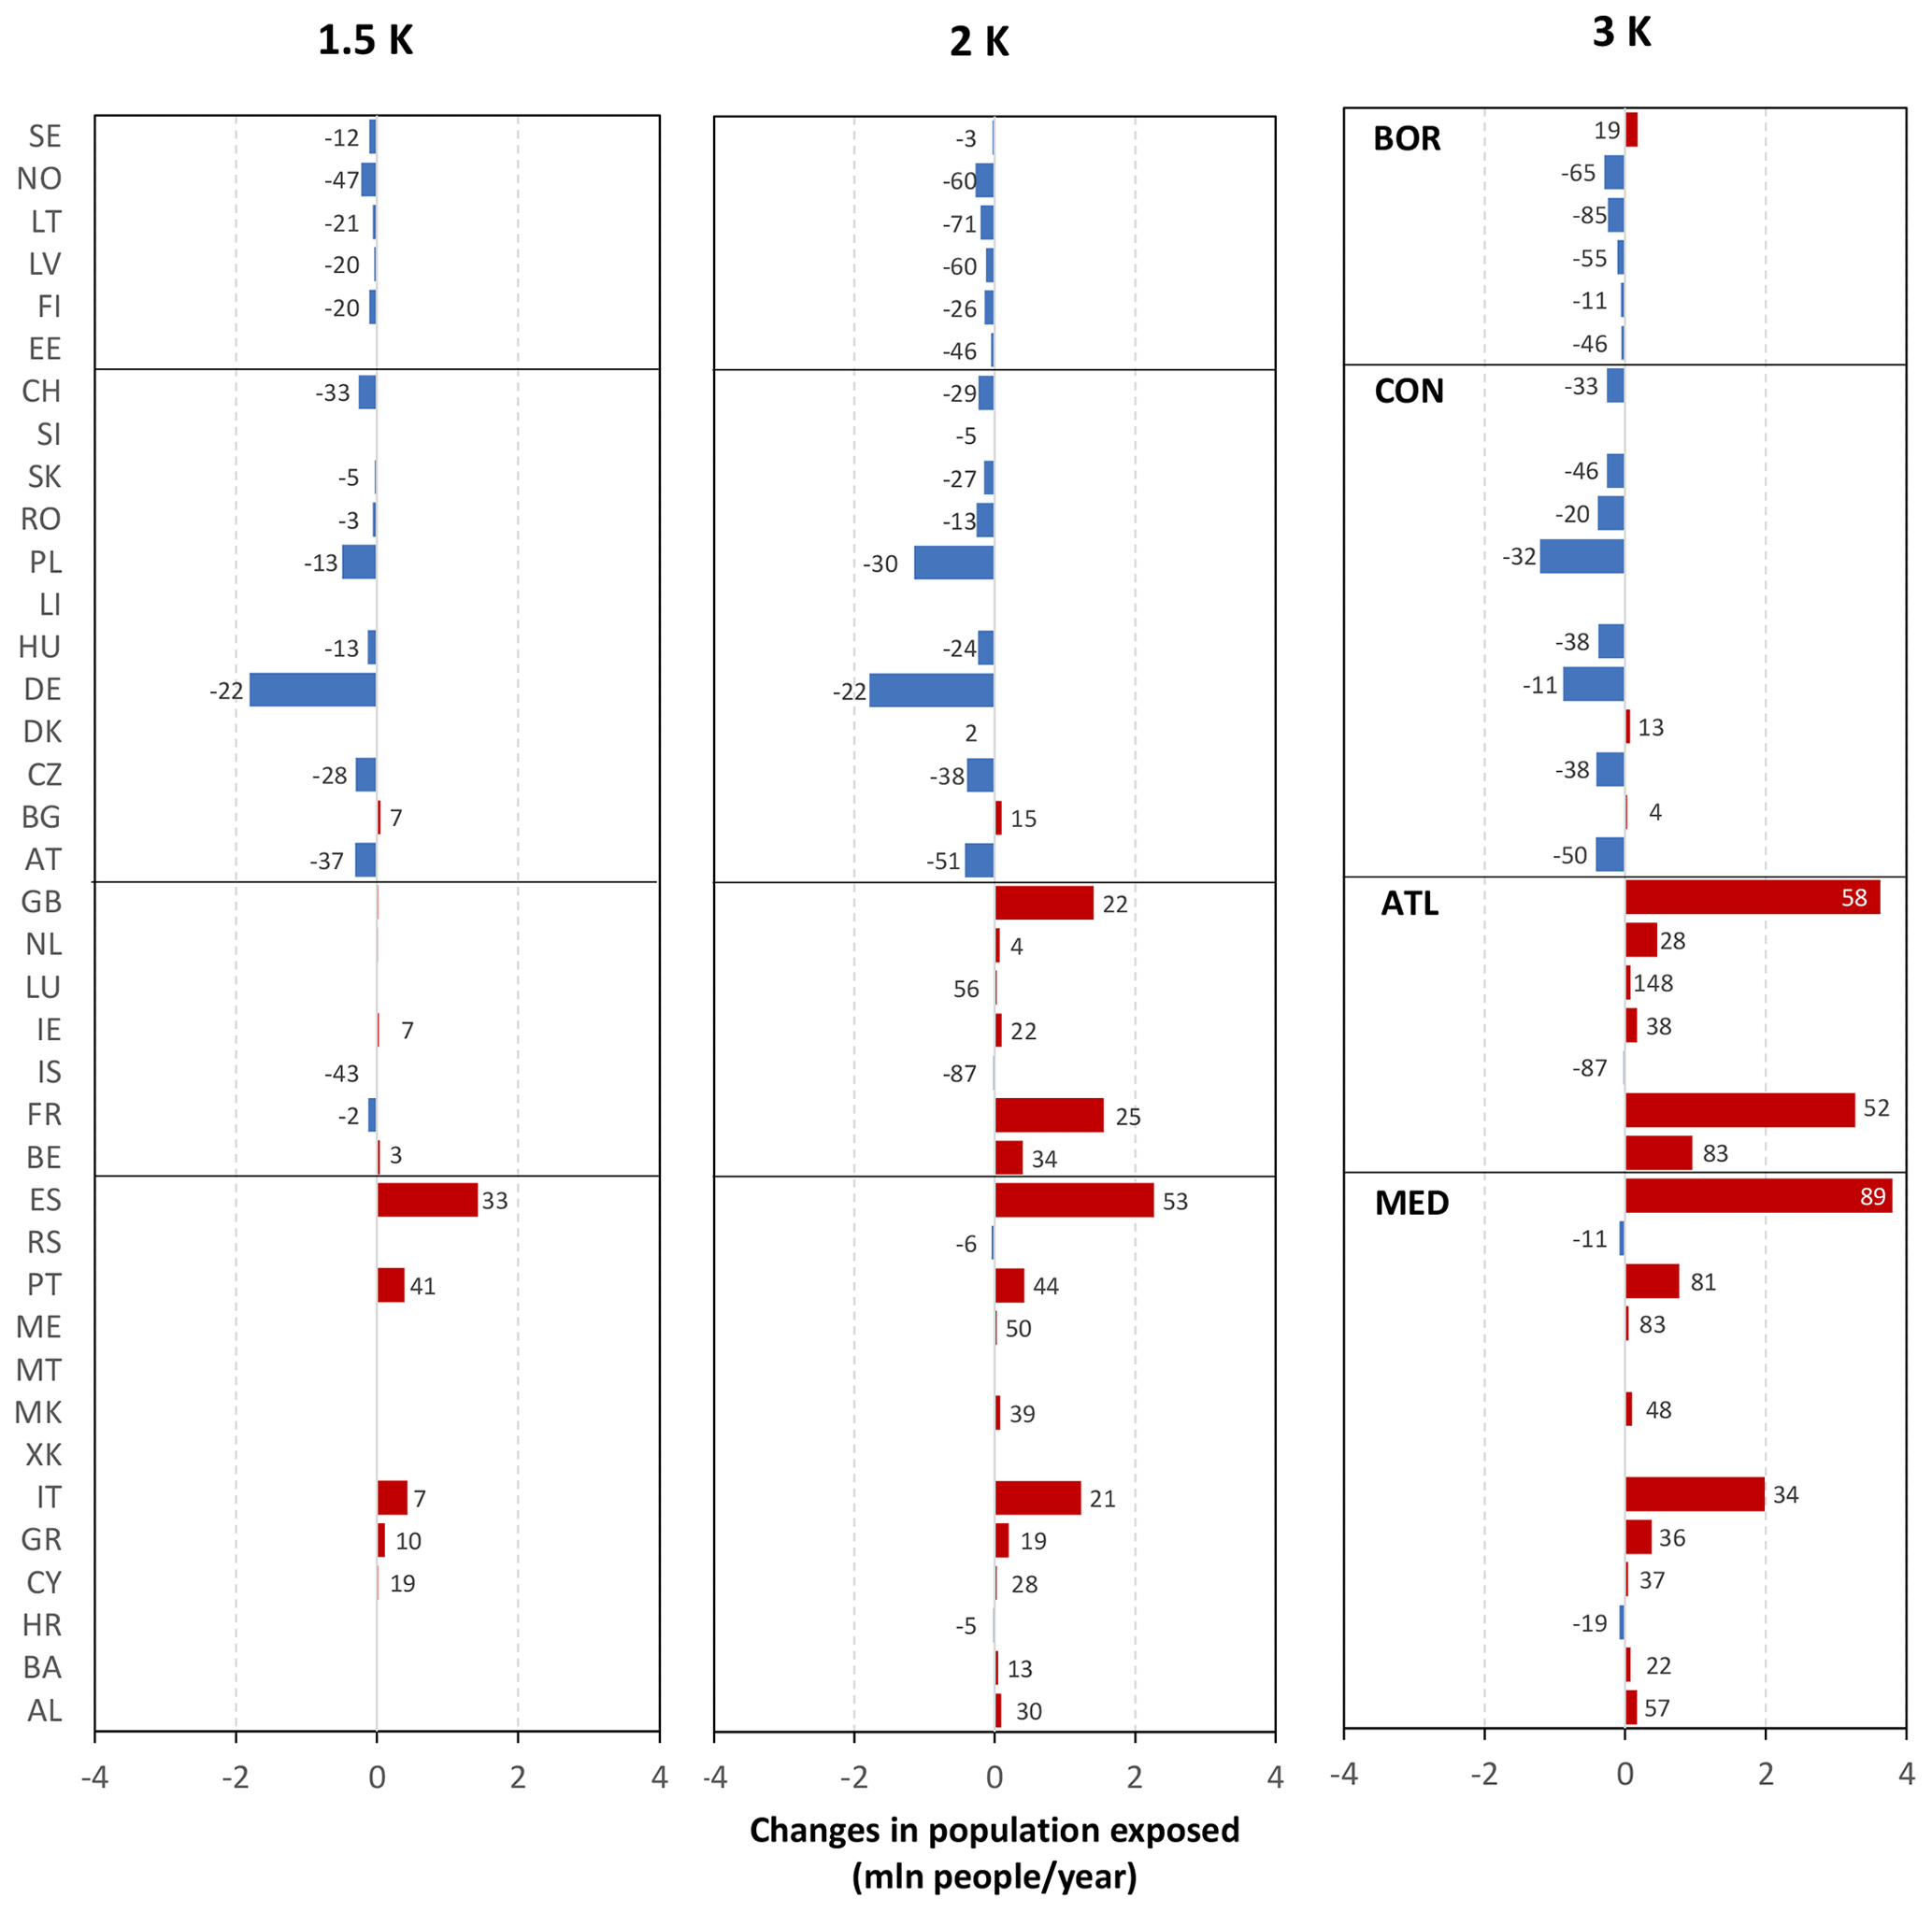
Figure 5Changes in population exposed per country (million people per year). Positive values indicate an increase in the population exposed. The numbers near the bars represent the percentage changes relative to the baseline (only if greater than 1 %).
3.2 Population and agricultural land exposed to drought
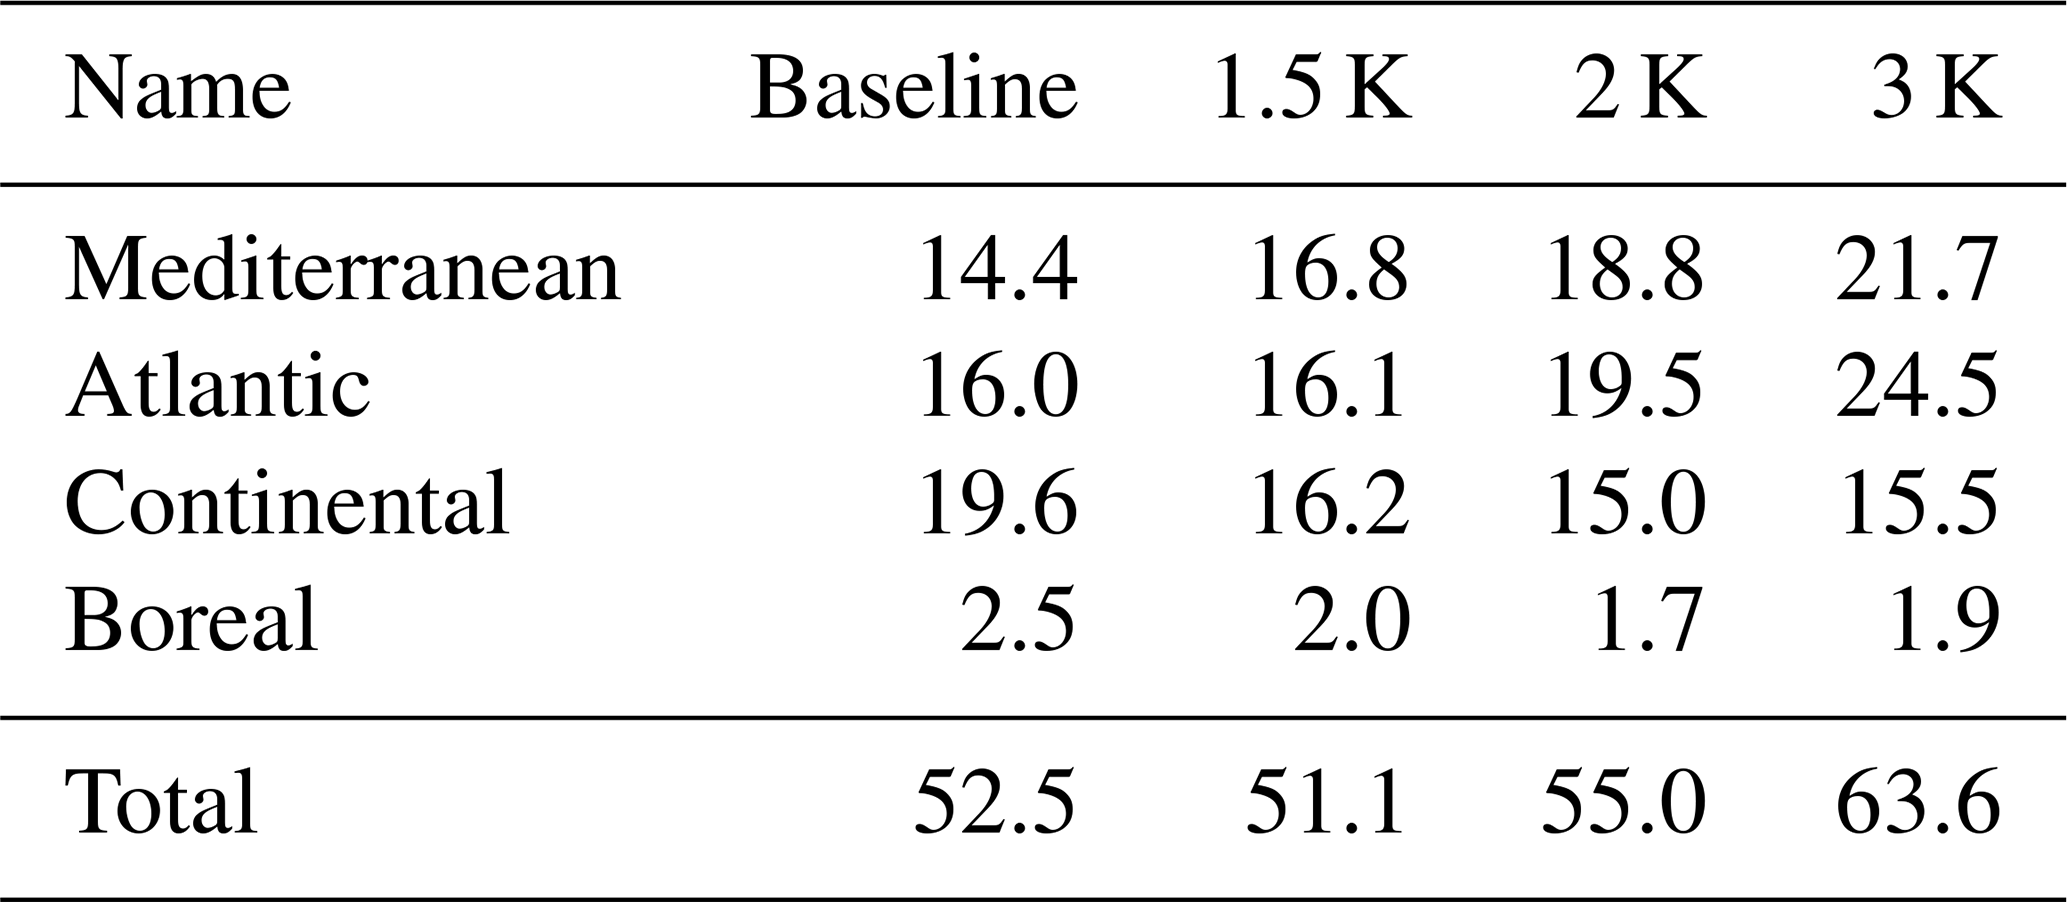
Figure 5 shows the changes with respect to the baseline in population projected to be exposed to streamflow drought at the country scale (percentage relative changes are also reported as numbers next to the bars). Total changes for the four macro-regions and the entire domain (Total) are summarized in Table 1. Aggregated over the whole domain, about 1.5 million fewer people are expected to be annually exposed to drought at 1.5 K GWL compared to the baseline period, which reverses to an increase of about 2.5 and 11 million people per year compared to baseline human exposure at 2 and 3 K GWLs, respectively. This shift in the sign of the changes is caused by the fact that at 1.5 K the increase in population exposed annually in the Mediterranean (2.4 million) and Atlantic (less than 0.1 million) sub-regions is outweighed by the reduction in exposure in the Boreal (−0.6 million) and, most importantly, Continental (−3.4 million) sub-regions. Projections in the Mediterranean and Atlantic sub-regions show a progressive increase in population exposed (up to a total of 15.8 million people per year for 3 K GWL over the two regions), while in the Boreal and Continental combined human exposure to droughts is expected to remain roughly the same for all three GWLs (i.e. −3.9, −5.4, and −4.7 million per year at 1.5, 2, and 3 K, respectively).
Table 1Total population exposed per sub-regions (million people per year).
Spain is projected to have the largest absolute increase in population exposed to drought with global warming, with an almost doubling (+3.8 million per year) of the number of people exposed to drought each year at 3 K GWL. In relative terms, the relative increase in population exposure at 3 K is also high in Portugal (+81 %), the United Kingdom (+58 %), and France (+52 %). The largest absolute decrease in population exposed is expected for Germany at 1.5 and 2 K GWL (−1.8 and −1.7 million people per year, respectively) and Poland at 3 K GWL. The transition of several areas in Germany from a decrease in drought to uncertain conditions (see as an example western Germany in Fig. 1) explains the lower number of exposed people at 3 K (−0.9 million people per year) compared to Poland (−1.2 million people per year). The strongest reduction in population exposure in relative terms is expected for Norway, Iceland, and Lithuania (up to 65 %, 87 %, and 85 %, respectively).

Figure 6Changes in agricultural land exposed per country (×106 ha per year). Positive values indicate an increase in the area exposed. The numbers near the bars represent the percentage changes relative to the baseline (only if greater than 1 %).
Table 2Total agricultural land exposed per sub-regions (×106 ha per year).
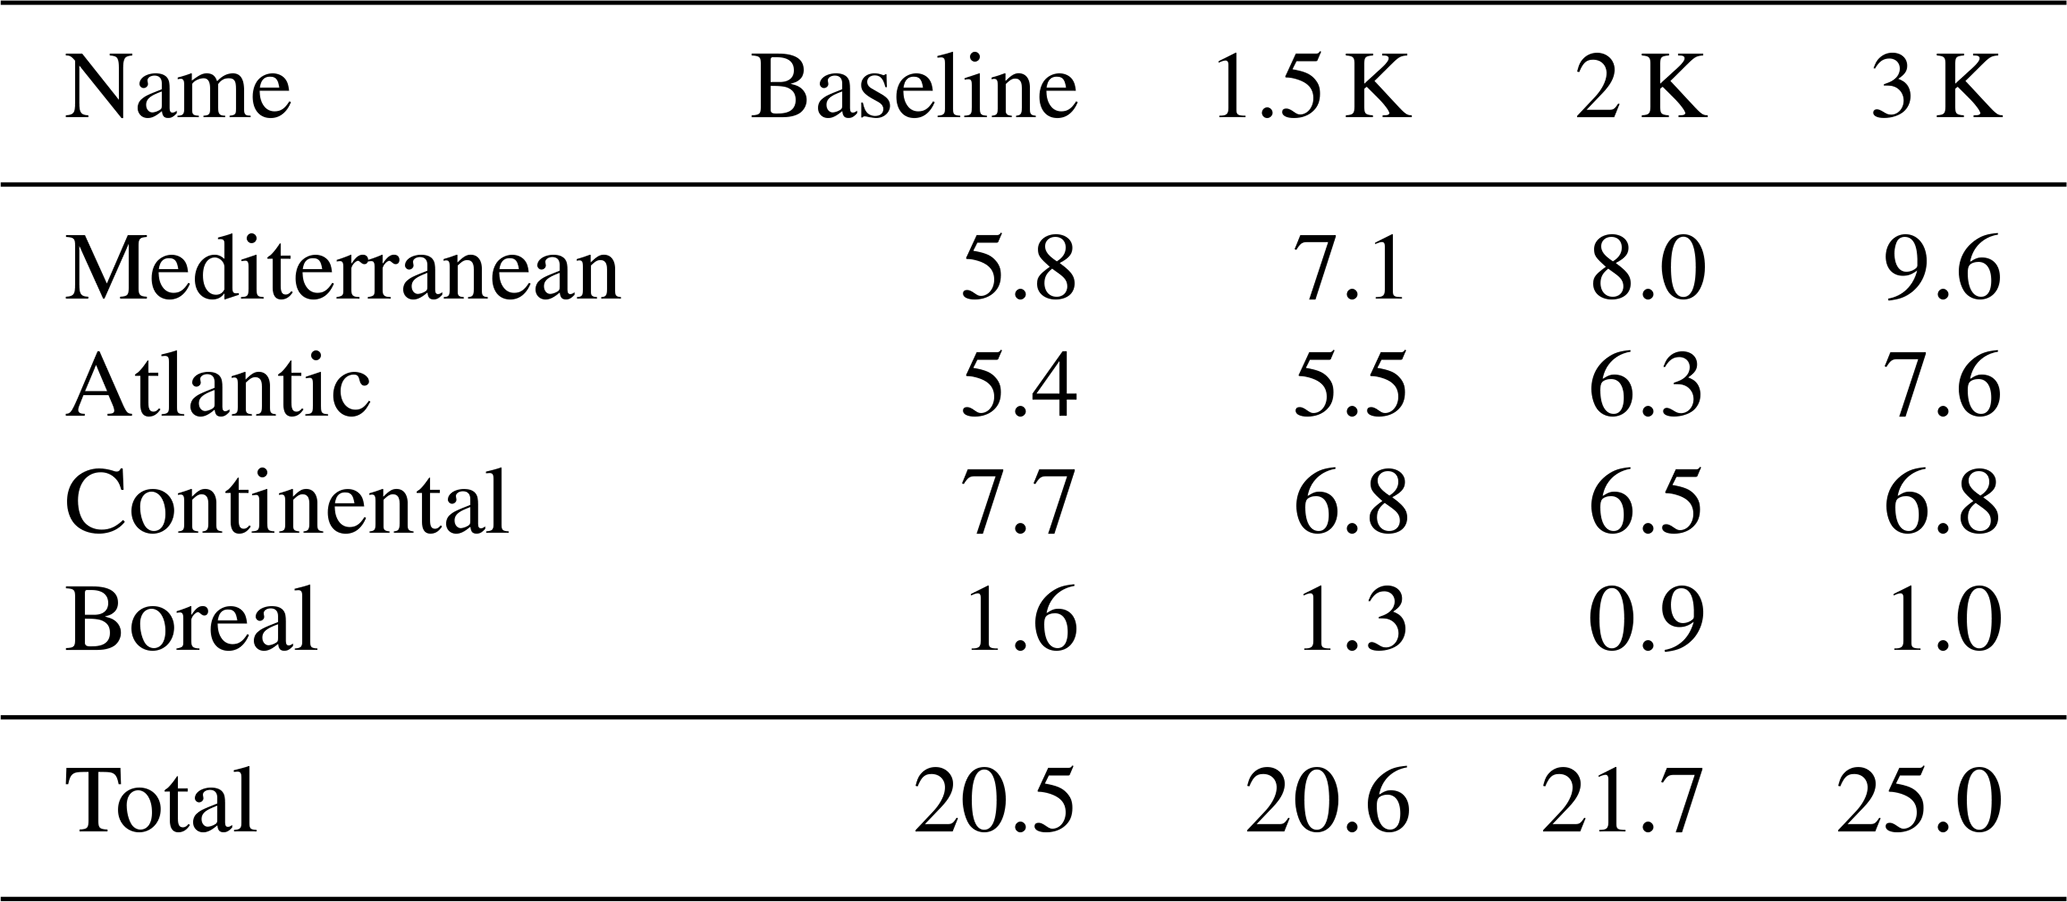
Exposure of agricultural land (Fig. 6 and Table 2) shows similar trends as for population. Aggregated over Europe, the change in exposure is projected to be balanced in the exposed agricultural land at 1.5 K GWL (net increase of 0.1×10⁶ ha per year), whereas at higher warming levels exposure of agricultural land increases to 1.2 and 4.5×10⁶ ha per year at 2 and 3 K, respectively. This increasing trend in the Europe-average changes can be explained by the expected steady increase in agricultural land exposed to drought in the Mediterranean and Atlantic sub-regions (up to 6×10⁶ ha per year combined at 3 K), which is not counterbalanced at the highest warming by the agricultural land being less exposed to drought in the Boreal and the Continental sub-regions ( ha per year at 1.5 K and ha per year at 3 K). In absolute numbers, Spain shows the largest projected increase in the agricultural land exposed at all GWLs, with an additional 0.9×10⁶ ha per year at 1.5 K to 2.6×10⁶ ha per year at 3 K (corresponding to a relative increase of about 35 % and 97 %, respectively). Relative changes are expected to be quite notable for other Mediterranean countries as well, such as Portugal and Greece, reaching almost 120 % and 77 % at 3 K, respectively.
The projections of severity, duration, and frequency underline some common features in future streamflow drought in Europe. The uncertainty in the projections is more marked at the 1.5 and 2 K GWLs, whereas change patterns are more statistically robust at higher warming, as also observed by Marx et al. (2018) for minimum flows. Overall, the magnitude of the projected changes increases with warming for all the drought traits, with only limited areas interested by an inversion in the trend. The main pattern is a strengthening of the dichotomy between south-western and north-eastern Europe, with the already drought-prone south-west becoming even more prone to droughts, while the north-east will experience a further wetting. This result suggests a continuation of a trend that is already ongoing according to Stagge et al. (2017), and it is also in line with other studies that projected streamflow droughts focusing on specific time periods instead of GWLs (Lehner et al., 2006; Feyen and Dankers, 2009; Stahl et al., 2012; Forzieri et al., 2014) or on agricultural (e.g. Samaniego et al., 2018) and meteorological (e.g. Gudmundsson and Seneviratne, 2016; Spinoni et al., 2018) droughts. Hence, there is growing consensus in the community on the main patterns of climate-induced changes on drought conditions in Europe.
Overall, the Mediterranean sub-region shows the strongest increase in drought traits, with droughts projected to become more severe, last longer, and happen more frequently already at 1.5 K GWL. The combined effects of increasing temperature and decreasing summer precipitation (Dubrovský et al., 2014; Vautard et al., 2014) are expected to result in a further exacerbation of water deficits in an area already prone to limited water resources. This is particularly true during summer, because of high water abstraction for irrigation (about 60 % of the current water demand; Vandecasteele et al., 2014). Studies that present future scenarios in agricultural water demand (i.e. Chaturvedi et al., 2015; Schmitz et al., 2013) suggest that improvements in irrigation efficiency could mitigate these impacts. Overall, the increasing pressure of drought on this region agrees with global studies that identify the Mediterranean as a hot spot for climate change, even if the targets set by the Paris Agreement will be met (Gu et al., 2020), and also with the study of Guerreiro et al. (2017) on the potential occurrence of multi-year droughts in major Iberian water resource regions.
In contrast, the Boreal sub-region is projected to experience a general reduction in all drought traits, as the increase in precipitation will likely outweigh the increase in evaporative demand due to elevated temperatures (Jacob et al., 2018). Over this region, similarly to the Alps (Donnelly et al., 2017), increasing winter precipitation and higher temperatures are expected to result in higher winter flows, when river flows are typically at their lowest (Gobiet et al., 2014). This result is obtained in spite of the projected general increase in public water demand (the highest share of total withdraws in northern Europe) and business-as-usual per capita water use (Vandecasteele et al., 2014).
In the other two sub-regions the projections are less uniform, with more variation in the signal and robustness of the projections with global warming. In the Atlantic sub-region the increase in droughts at 3 K is expected to be less pronounced compared to the Mediterranean but similarly robust, while at lower warming levels there is large uncertainty in the projections. In some river basins, such as the Seine in northern France, a decrease in droughts or uncertain trend is projected for low levels of global warming, while at higher levels of warming drought conditions are projected to worsen. This shift in the sign of the changes is likely related to the fact that at higher levels of warming the atmospheric demand (evapotranspiration) rises faster than supply (precipitation) due to the combination of a strong rise in temperature and a slight or uncertain increase in annual precipitation and a decline in summer precipitation (Kotlarski et al., 2014). In the Atlantic sub-region, areas with projected strong increase in population (e.g. southern UK; EUROSTAT, 2019) are the ones with a clear increase in droughts for all warming levels. Given the role of population in domestic water demand, changes over these regions seem to further exacerbate the climate effects.
In the Continental sub-region the projected overall decrease in droughts is rather inhomogeneous in strength. In upstream Danube tributaries draining the Alps, there is a strong trend towards less-severe droughts as winter flows increase due to changes in snow accumulation and melt caused by increased winter precipitation and higher temperatures (Forzieri et al., 2014; Marx et al., 2018). In downstream reaches of the Danube, more-severe droughts are projected due to a reduction in summer flows caused by an increased evaporative demand and less precipitation, as well as the reduced snowmelt contribution from the Alps (Jenicek et al., 2018). Also, in Germany, the trend towards less-severe droughts is reversed at higher warming as the increasing natural and human demand in drier summers outbalances higher annual supply. The reversion to an increase in droughts at 3 K GWL is the case especially in western parts of Germany such as downstream reaches of the Rhine (Bosshard and Kotlarski, 2014).
The heterogeneity in the strength of the outcomes obtained over the Continental sub-region further stresses how the complex interplay between supply (precipitation), atmospheric demand (evapotranspiration), and human water use can result in different projected trends. Dosio and Fischer (2018) showed that precipitation will increase over most continental and northern parts of Europe (by +10 %–25 % at 3 K) but to a lesser extent in summer (changes with 3 K between −5 % at middle latitudes of the Continental region to +10 %–15 % at higher latitudes in the Boreal region), when natural and human demand are highest. As a result, short duration droughts could happen more frequently in some eastern European catchments during summer even when supply does not change drastically due to the growth in natural demand (because of rising temperatures) and the contextual steady increase in human water demand for several socio-economic scenarios (Ercin and Hoekstra, 2016). In the case of longer drought events, the imbalances between supply and demand over summer may be mitigated by the increase in subsurface storages at the start of the summer season due to elevated precipitation amounts during the previous seasons but also potentially exacerbated in the case of multi-annual summer droughts. In this context, human-induced factors may influence drought propagation even further in highly regulated European basins (Van Loon et al., 2016).
This study analysed how the main characteristics of hydrological droughts are expected to change over Europe due to global warming. Projections in drought severity, duration, and frequency based on river water deficits highlight some common features and spatial patterns in future drought conditions across Europe. The Mediterranean sub-region, which already suffers most from water scarcity, is projected to experience the strongest effects of climate change on drought conditions. With increasing global warming, streamflow deficits in this region are expected to happen more frequently, become more severe, and last longer. In contrast, the Boreal sub-area is projected to face a consistent decrease in drought severity, duration, and frequency.
In the Atlantic and Continental sub-regions the projections are less uniform, although over most of the Atlantic region drought conditions are projected to worsen, while they generally will become less intense over Continental Europe. Despite the use of a large ensemble of climate models, there is still a substantial uncertainty in the projections in these regions, even if changes at 3 K are mostly statistically robust. The uncertainty is bigger for the 1.5 and 2 K GWLs, which suggests that there is still large disagreement among the models in possible changes in drought conditions in these areas when warming could be stabilized at the targets set in the Paris Agreement. Since the climate signal is less marked over these two sub-regions, projected water demand may play a more relevant role in the direction of the future changes here. While in this study we considered water use projections consistent with EU demographic, economic, and energy projections, global and regional water use studies show the large variability in future water use depending on the socio-economic scenario and water use model (Graham et al., 2018; Wada et al., 2016). Hence, apart from the effects of warming on the hydrological cycle and natural water availability, socio-economic dynamics and consequent demand for water could also locally affect drought conditions.
Overall, the general patterns observed in this study are in line with the patterns observed in studies that focused on specific temporal horizons rather than warming levels (Forzieri et al., 2014; Spinoni et al., 2018; Stahl et al., 2012). Our study shows that with higher warming the changes in drought traits are expected to be more marked, even if the spatial patterns of the areas with increasing or decreasing drought conditions are rather similar for the three GWLs analysed here. The outcomes obtained for different traits of streamflow droughts (i.e. severity, duration, and frequency) are in agreement with the results of Marx et al. (2018) based on the simple daily streamflow percentile, suggesting again a strong coherence in streamflow climate projections.
The exposure analysis with population density and agricultural land highlights how at lower warming levels positive and negative changes in exposure are expected to be balanced across Europe. However, at higher GWLs the increase in population and agricultural land exposed in the southern and western parts of Europe is projected to outweigh the effects of less-severe droughts in the less populated north and most of continental and eastern Europe. At 3 K warming this unbalance between south-west and north-east could result in an additional 11 million people and 4.5×10⁶ ha exposed each year to drought conditions that currently are expected to happen once every 10 years or less frequently. The projected changes in exposure to drought will pose considerable challenges for agriculture and water provision in densely populated and economically pivotal areas, especially in southern Europe, making the findings of this study relevant to provide information that can be used as a basis to evaluate the implications at the European scale of climate mitigation policies.
As part of the EFAS (https://www.efas.eu/, last access: 9 December 2020) flood early-warning systems, the LISFLOOD model is maintained and updated regularly. The most recent calibration and validation exercise of the model over the European domain has been performed over more than 700 stations (Arnal et al., 2019). The calibration procedure is based on the Evolutionary Algorithm described in Hirpa et al. (2018), and it adopted the Kling–Gupta efficiency (KGE; Gupta et al., 2009) as the objective function in order to target an optimization of three quantities: total volume, the spread of the flow (e.g. flow duration curve), and the timing and shape of the hydrograph (Yilmaz et al., 2008).
The LISFLOOD modelling framework have been successfully applied in Feyen and Dankers (2009) and Forzieri et al. (2014) in previous studies on drought future projections. In these analyses, model simulations were validated against long records (more than 30 years) of streamflow data from several gauging stations (209 and 446 stations, respectively), obtaining satisfactory results on quantities such as annual minima and deficit. Gauging stations were mostly located in western and central Europe, where both studies highlighted less reliable performances during the frost season.
Following the latest calibration, a validation exercise of the model version used in this study has been performed analogously to the above-mentioned two studies. Focusing on drought, the LISFLOOD performance has been evaluated in terms of annual minima (Qmin) and total deficit (D) over 437 stations with minimum data gaps in the period 1995–2016. The outcomes of the validation exercise are summarized in Fig. A1, where the data for the average annual minima (panel a) and deficit (panel b) are reported. These results show an overall good performance of the model, with high efficiency (Nash–Sutcliffe efficiency, NSE) and small negative percentage bias (PBIAS) for both quantities.
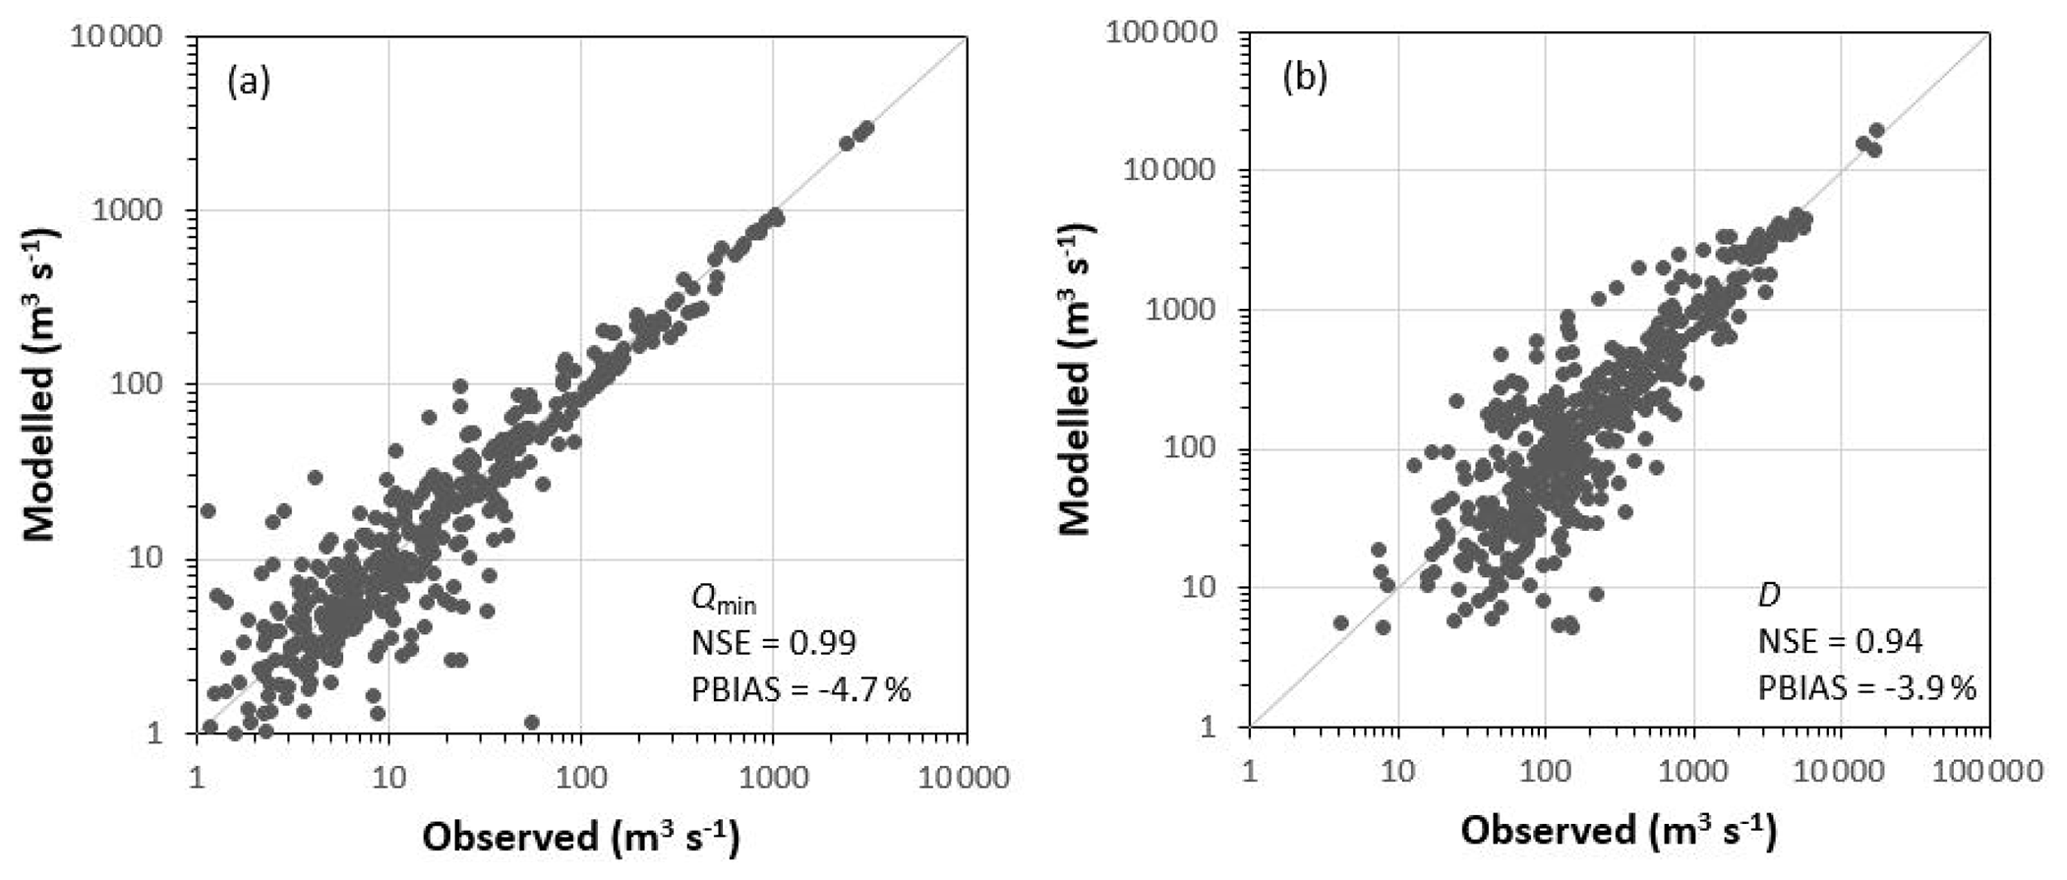
Figure A1Observed vs. modelled average annual minima (a) and total deficit (b) during the period 1990–2016 at the 437 stations distributed across Europe.
All data are freely available to the public via the EDO web portal (https://edo.jrc.ec.europa.eu/, European Commision, 2020) upon request. The main output data of the study will be made available through the JRC Data Catalogue (http://data.europa.eu/89h/20247f06-469c-4607-8af1-a5a670082471, Alfieri et al., 2020).
The study was conceived by CC, GN, and LF. LM ran the hydrological simulations, with BB, EG. and ADR providing model input data and support. CC and GN carried out the analysis. CC, GN, and LF interpreted the results and drafted the article. All the authors provided suggestions and reviewed the final version of the article.
The authors declare that they have no conflict of interest.
This paper was edited by Kerstin Stahl and reviewed by two anonymous referees.
Alfieri, L., Feyen, L., Dottori, F., Mentaschi, L., Cammalleri, C., Bisselink, B., and De Roo, A.: Hazards: floods, drought and water resources, European Commission, Joint Research Centre (JRC) [Dataset] PID, http://data.europa.eu/89h/20247f06-469c-4607-8af1-a5a670082471, 2020.
Arnal, L., Asp, S.-S., Baugh, C., de Roo, A., Disperati, J., Dottori, F., Garcia, R., GarciaPadilla, M., Gelati, E., Gomes, G., Kalas, M., Krzeminski, B., Latini, M., Lorini, V., Mazzetti, C., Mikulickova, M., Muraro, D., Prudhomme, C., Rauthe-Schöch, A., Rehfeldt, K., Salamon, P., Schweim, C., Skoien, J. O., Smith, P., Sprokkereef, E., Thiemig, V., Wetterhall, F., and Ziese, M.: EFAS upgrade for the extended model domain – technical documentation, JRC Technical Reports, EUR 29323 EN, Publications Office of the European Union, Luxembourg, 58 pp., https://doi.org/10.2760/806324, 2019.
Barker, L. J., Hannaford, J., Chiverton, A., and Svensson, C.: From meteorological to hydrological drought using standardised indicators, Hydrol. Earth Syst. Sci., 20, 2483–2505, https://doi.org/10.5194/hess-20-2483-2016, 2016.
Batista e Silva, F., Gallego, J., and Lavalle, C.: A high-resolution population grid map for Europe, J. Maps, 9, 16–28, https://doi.org/10.1080/17445647.2013.764830, 2013.
Bisselink, B., Bernhard, J., Gelati, E., Adamovic, M., Guenther, S., Mentaschi, L., and De Roo, A.: Impact of a changing climate, land use, and water usage on Europe's water resources, JRC Technical Reports, EUR 29130 EN, Publications Office of the European Union, Luxembourg, 86 pp., https://doi.org/10.2760/847068, 2018.
Bosshard, T. and Kotlarski, S.: Hydrological climate-impact projections for the Rhine river: GCM–RCM uncertainty and separate temperature and precipitation effects, J Hydrometeorol., 15, 697–713, https://doi.org/10.1175/JHM-D-12-098.1, 2014.
Brunner, M. I., Liechti, K., and Zappa, M.: Extremeness of recent drought events in Switzerland: dependence on variable and return period choice, Nat. Hazards Earth Syst. Sci., 19, 2311–2323, https://doi.org/10.5194/nhess-19-2311-2019, 2019.
Burek, P., van der Knijff, J. M., and De Roo, A.: LISFLOOD: Distributed Water Balance and Flood Simulation Model, JRC Technical Reports, EUR 26162 EN, Publications Office of the European Union, Luxembourg, 142 pp., https://doi.org/10.2788/24719, 2013.
Cammalleri, C., Vogt, J., and Salamon, P.: Development of an operational low-flow index for hydrological drought monitoring over Europe, Hydrol. Sci. J., 62, 346–358, https://doi.org/10.1080/02626667.2016.1240869, 2017.
Cammalleri, C., Barbosa, P., and Vogt, J. V.: Evaluating simulated daily discharge for operational hydrological drought monitoring in the Global Drought Observatory (GDO), Hydrolog. Sci. J., 65(8), 1316–1325, https://doi.org/10.1080/02626667.2020.1747623, 2020.
Capros, P., Van Regemorter, D., Paroussos, L., and Karkatsoulis, P.: GEM-E3 model documentation, JRC Technical Reports, EUR 26034 EN, Publications Office of the European Union, Luxembourg, 158 pp., https://doi.org/10.2788/47872, 2013.
Cervi, F., Petronici, F., Castellarin, A., Marcaccio, M., Bertolini, A., and Borgatti, L.: Climate-change potential effects on the hydrological regime of freshwater springs in the Italian northern Apennines, Sci. Total Environ., 622–623, 337–348, https://doi.org/10.1016/j.scitotenv.2017.11.231, 2018.
Chaturvedi, V., Hejazi, M., Edmonds, J., Clarke, L., Kyle, P., Davies, E., and Wise, M.: Climate mitigation policy implications for global irrigation water demand, Mitig. Adapt. Strat. Gl., 20, 389–407, https://doi.org/10.1007/s11027-013-9497-4, 2015.
Chow, V. T., Maidment, D., and Mays, L. W.: Applied Hydrology, McGraw-Hill, New York, 1988.
Crausbay, S. D. and Ramirez, A. R.: Defining ecological drought for the twenty-first century, B. Am. Meteorol. Soc., 2543–2550, https://doi.org/10.1175/BAMS-D-16-0292.1, 2017.
De Roo, A., Wesseling, C., and Van Deursen , W.: Physically based river basin modelling within a GIS: the LISFLOOD model, Hydrol. Process., 14, 1981–1992, https://doi.org/10.1002/1099-1085(20000815/30)14:11/12<1981::AID-HYP49>3.0.CO;2-F, 2000.
Donnelly, C., Greuell, W., Andersson, J., Gerten, D., Pisacane, G., Roudier, P., and Ludwig, F.: Impacts of climate change on European hydrology at 1.5, 2 and 3 degrees mean global warming above preindustrial level, Climatic Change, 143, 13–26, https://doi.org/10.1007/s10584-017-1971-7, 2017.
Dosio, A.: Mean and extreme climate in Europe under 1.5, 2, and 3 ∘C global warming, EUR 30194 EN, Publications Office of the European Union, Luxembourg, ISBN 978-92-76-18430-0, https://doi.org/10.2760/826427, JRC120574, 2020.
Dosio, A. and Fischer, E. M.: Will half a degree make a difference? Robust projections of indices of mean and extreme climate in Europe under 1.5 ∘C, 2 ∘C, and 3 ∘C global warming, Geophys. Res. Lett., 45, 935–944, https://doi.org/10.1002/2017GL076222, 2018.
Dosio, A., Paruolo, P., and Rojas, R.: Bias correction of the ENSEMBLES high resolution climate change projections for use by impact models: Analysis of the climate change signal, J. Geophys. Res.-Atmos., 117, https://doi.org/10.1029/2012JD017968, 2012.
Dubrovský, M., Hayes, M., Duce, P., Trnka, M., Svoboda, M., and Zara, P.: Multi-GCM projections of future drought and climate variability indicators for the Mediterranean region, Reg. Environ. Change, 14, 1907–1919, https://doi.org/10.1007/s10113-013-0562-z, 2014.
EC: The 2015 Ageing Report – Economic and budgetary projections for the 28 EU Member States (2013–2060), European Commission, https://doi.org/10.2765/877631, 2015.
EEA: Corine Land Cover (CLC), Version 18.5.1, Release Date: 19-09-2016, European Environment Agency, available at: https://land.copernicus.eu/pan-european/corine-land-cover (last access: 9 December 2020), 2016.
Ercin, A. E. and Hoekstra, A. Y.: European Water Footprint Scenarios for 2050, Water, 8, 226, https://doi.org/10.3390/w8060226, 2016.
European Commision: European Drought Observeratory, https://edo.jrc.ec.europa.eu/, last access: 14 December 2020.
EUROSTAT: Archive: Statistics on regional population projections, availbale at: https://ec.europa.eu/eurostat/statistics-explained/index.php?title=Archive:Statistics_on_regional_population_projections#Projected_changes_in_regional_populations (last access: 11 September 2020), 2019.
Feng, S.: Why do different drought indices show distinct future drought risk outcomes in the U.S. Great Plains?, J. Climate, 30, 265–278, https://doi.org/10.1175/JCLI-D-15-0590.1, 2017.
Feyen, L. and Dankers, R.: Impact of global warming on streamflow drought in Europe, J. Geophys. Res., 114, D17116, https://doi.org/10.1029/2008JD011438, 2009.
Forzieri, G., Feyen, L., Rojas, R., Flörke, M., Wimmer, F., and Bianchi, A.: Ensemble projections of future streamflow droughts in Europe, Hydrol. Earth Syst. Sci., 18, 85–108, https://doi.org/10.5194/hess-18-85-2014, 2014.
Gobiet, A., Kotlarski, S., Beniston, M., Heinrich, G., Rajczak, J., and Stoffel, M.: 21st century climate change in the European Alps – A review, Sci. Total Environ., 493, 1138–1151, https://doi.org/10.1016/j.scitotenv.2013.07.050, 2014.
Graham, N. T., Davies, E. G. R., Hajazi, M. I., Calvin, K., Kim, S. H., Helinski, L., Miralles-Wilhelm, F. R., Clarke, L., Kyle, P., Patel, P., Wise, M. A., and Vernon, C. R.: Water sector assumptions for the Shared Socioeconomic Pathways in an integrated modeling framework, Water Resour. Res., 54, 6423–6440, https://doi.org/10.1029/2018WR023452, 2018.
Gu, L., Chen, J., Yin, J., Sullivan, S. C., Wang, H.-M., Guo, S., Zhang, L., and Kim, J.-S.: Projected increases in magnitude and socioeconomic exposure of global droughts in 1.5 and 2 ∘C warmer climates, Hydrol. Earth Syst. Sci., 24, 451–472, https://doi.org/10.5194/hess-24-451-2020, 2020.
Gudmundsson, L. and Seneviratne, S. I.: Anthropogenic climate change affects meteorological drought risk in Europe, Environ. Res. Lett., 11, 044005, https://doi.org/10.1088/1748-9326/11/4/044005, 2016.
Guerreiro, S. B., Birkinshaw, S., Kilsby, C., Fowler, H. J., and Lewis, E.: Dry getting drier – The future of transnational river basins in Iberia, J. Hydrol.-Regional Studies, 12, 238–252, https://doi.org/10.1016/j.ejrh.2017.05.009, 2017.
Gupta, H. V., Kling, H., Yilmaz, K. K., and Martinez, G. F.: Decomposition of the mean squared error and NSE performance criteria: Implications for improving hydrological modelling, J. Hydrol., 377, 80–91, https://doi.org/10.1016/j.jhydrol.2009.08.003, 2009.
Haylock, M. R., Hofstra, N., Klein Tank, A. M. G., Klok, E. J., Jones, P. D., and New, M.: A European daily high-resolution gridded data set of surface temperature and precipitation for 1950–2006, J. Geophys. Res., 113, D20119, https://doi.org/10.1029/2008JD010201, 2008.
Heinrich, G. and Gobiet, A.: The future of dry and wet spells in Europe: a comprehensive study based on the ENSEMBLES regional climate models, Int. J. Climatol., 32, 1951–1970, https://doi.org/10.1002/joc.2421, 2012.
Hellwig, J. and Stahl, K.: An assessment of trends and potential future changes in groundwater-baseflow drought based on catchment response times, Hydrol. Earth Syst. Sci., 22, 6209–6224, https://doi.org/10.5194/hess-22-6209-2018, 2018.
Hirpa, F. A., Salamon, P., Beck, H. E., Lorini, V., Alfieri, L., Zsoter, E., and Dadson, S. J.: Calibration of the Global Flood Awareness System (GloFAS) using daily streamflow data, J. Hydrol., 566, 595–606, https://doi.org/10.1016/j.jhydrol.2018.09.052, 2018.
Jacob, D., Petersen, J., Eggert, B., Alias, A., Christensen, O. B., Bouwer, L. M., Braun, A., Colette, A., Déqué, M., Georgievski, G., Georgopoulou, E., Gobiet, A., Menut, L., Nikukin, G., Haensler, A., Hempelmann, N., Jones, C., Keuler, K., Kovats, S., Kröner, N., Kotlarski, S., Kriegsmann, A., Martin, E., Van Meijgaard, E., Moseley, C., Pfeifer, S., Preuschmann, S., Radermacher, C., Radtke, K., Rechid, D., Rounsevell, M., Samuelsson, P., Somot, S., Soussana, J.-F., Teichmann, C., Valentini, R., Vautard, R., Weber, B., and Yiou, P.: EURO-CORDEX: New high-resolution climate change projections for European impact research, Reg. Environ. Change, 14, 563–578, https://doi.org/10.1007/s10113-013-0499-2, 2014.
Jacob, D., Kotova, L., Teichmann, C., Sobolowski, S. P., Vautard, R., Donnelly, C., Koutroulis, A. G., Grillakis, M. G., Tsanis, I. K., Damm, A., Sakalli, A., and Van Vliet, M. T. H.: Climate Impacts in Europe Under +1.5 ∘C Global Warming, Earths Future, 6, 264–285, https://doi.org/10.1002/2017EF000710, 2018.
Jacobs-Crisioni, C., Diogo, V., Perpiña Castillo, C., Baranzelli, C., Batista e Silva, F., Rosina, K., Kavalov, B., and Lavalle, C.: The LUISA Territorial Reference Scenario 2017: A technical description, JRC Technical Reports, EUR 28800 EN, Publications Office of the European Union, Luxembourg, 46 pp., https://doi.org/10.2760/902121, 2017.
Jakubowski, W. and Radczuk, L.: Estimation of hydrological drought characteristics NIZOWKA2003 – Software Manual, in: Hydrological Drought – Processes and estimation methods for Streamflow and groundwater, edited by: Tallaksen, L. M. and van Lanen, H. A. J., Elsevier Sciences B.V., Amsterdam, [CD-ROM], 2004.
Jenicek, M., Seibert, J., and Staudinger, M.: Modeling of future changes in seasonal snowpack and impacts on summer low flows in Alpine catchments, Water Resour. Res., 54, 538–556, https://doi.org/10.1002/2017WR021648, 2018.
Keramidas, K., Kitous, A., Després, J., and Schmitz, A.: POLES-JRC model documentation, EUR 28728 EN, Publications Office of the European Union, Luxembourg, ISBN 978-92-79-71801-4, https://doi.org/10.2760/225347, JRC107387, 2017.
Kotlarski, S., Keuler, K., Christensen, O. B., Colette, A., Déqué, M., Gobiet, A., Goergen, K., Jacob, D., Lüthi, D., van Meijgaard, E., Nikulin, G., Schär, C., Teichmann, C., Vautard, R., Warrach-Sagi, K., and Wulfmeyer, V.: Regional climate modeling on European scales: a joint standard evaluation of the EURO-CORDEX RCM ensemble, Geosci. Model Dev., 7, 1297–1333, https://doi.org/10.5194/gmd-7-1297-2014, 2014.
Kovats, R., Valentini, R., Bouwer, L., Georgopoulou, E., Jacob, D., Martin, E., Rounsevell, M., and Soussana, J.-F.: Europe, in: ClimateChange 2014: Impacts, Adaptation, and Vulnerability. Part B: Regional Aspects. Contribution of Working Group II to the Fifth Assessment Report of the Intergovernmental Panel on Climate Change, edited by: Barros, V. R., Field, C. B., Dokken, D. J., Mastrandrea, M. D., Mach, K. J., Bilir, T. E., Chatterjee, M., Ebi, K. L., Estrada, Y. O., Genova, R. C., Girma, B., Kissel, E. S., Levy, A. N., MacCracken, S., Mastrandrea, P. R., and White, L. L., Cambridge University Press, New York, NY, USA, 1267–1326, 2014.
Lehner, B., Döll, P., Alcamo, J., Henrichs, T., and Kaspar, F.: Estimating the impact of global change on flood and drought risks in Europe: a continental integrated analysis, Climatic Change, 75, 273–299, https://doi.org/10.1007/s10584-006-6338-4, 2006.
Lomax, K.: Business failures: another example of the analysis of failure data, J. Am. Stat. Assoc., 49, 847–852, https://doi.org/10.2307/2281544, 1987.
Marx, A., Kumar, R., Thober, S., Rakovec, O., Wanders, N., Zink, M., Wood, E. F., Pan, M., Sheffield, J., and Samaniego, L.: Climate change alters low flows in Europe under global warming of 1.5, 2, and 3 ∘C, Hydrol. Earth Syst. Sci., 22, 1017–1032, https://doi.org/10.5194/hess-22-1017-2018, 2018.
Mentaschi, L., Alfieri, L., Dottori, F., Cammalleri, C., Bisselink, B., De Roo, A., and Feyen, L.: Independence of future changes of river runoff in Europe from the pathway to global warming, Climate, 8, 22, https://doi.org/10.3390/cli8020022, 2020.
Metzger, M. J., Bunce, R. G. H., Jongman, R. H. G., Mücher, C. A., and Watkins, J. W.: A climatic stratification of the environment of Europe, Global Ecol. Biogeogr., 14, 549–563, https://doi.org/10.1111/j.1466-822X.2005.00190.x, 2005.
Meyer, V., Becker, N., Markantonis, V., Schwarze, R., van den Bergh, J. C. J. M., Bouwer, L. M., Bubeck, P., Ciavola, P., Genovese, E., Green, C., Hallegatte, S., Kreibich, H., Lequeux, Q., Logar, I., Papyrakis, E., Pfurtscheller, C., Poussin, J., Przyluski, V., Thieken, A. H., and Viavattene, C.: Review article: Assessing the costs of natural hazards – state of the art and knowledge gaps, Nat. Hazards Earth Syst. Sci., 13, 1351–1373, https://doi.org/10.5194/nhess-13-1351-2013, 2013.
Moss, R. H., Edmonds, J. A., Hibbard, K. A., Manning, M. R., Rose, S. K., van Vuuren, D. P., Carter, T. R., Emori, S., Kainuma, M., Kram, T., Meehl, G. A., Mitchell, J. F. B., Nakicenovic, N., Riahi, K., Smith, S. J., Stouffer, R. J., Thomson, A. M., Weyant, J. P., and Wilbanks, T. J.: The next generation of scenarios for climate change research and assessment, Nature, 463, 747–756, https://doi.org/10.1038/nature08823, 2010.
Mubareka, S., Maes, J., Lavalle, C., and De Roo, A.: Estimation of water requirements by livestock in Europe, Ecosyst. Serv., 4, 139–145, https://doi.org/10.1016/j.ecoser.2013.03.001, 2013.
Nerantzaki, S. D., Efstathiou, D., Giannakis, G. V., Kritsotakis, M., Grillakis, M. G., Koutroulis, A. G., Tsanis, I. K., and Nikolaidis, N. P.: Climate change impact on the hydrological budget of a large Mediterranean island, Hydrolog. Sci. J., 64, 1190–1203, https://doi.org/10.1080/02626667.2019.1630741, 2019.
Roudier, P., Andersson, J. C. M., Donnelly, C., Feyen, L., Greuell, W., and Ludwig, F.: Projections of future floods and hydrological droughts in Europe under a +2 ∘C global warming, Climatic Change, 135, 341–355, https://doi.org/10.1007/s10584-015-1570-4, 2016.
Rudd, A. C., Kay, A. L., and Bell, V. A.: National-scale analysis of future river flow and soil moisture droughts: Potential changes in drought characteristics, Climatic Change, 156, 323–340, https://doi.org/10.1007/s10584-019-02528-0, 2019.
Samaniego, L., Thober, S., Kumar, R., Wanders, N., Rakovec, O., Pan, M., Zink, M., Sheffield, J., Wood, E. F., and Marx, A.: Anthropogenic warming exacerbates European soil moisture droughts, Nat. Clim. Change, 8, 421–426, https://doi.org/10.1038/s41558-018-0138-5, 2018.
Schmitz, C., Lotze-Campen, H., Gerten, D., Dietrich, J. P., Bodirsky, B., Biewald, A., and Popp, A.: Blue water scarcity and the economic impacts of future agricultural trade and demand, Water Resour. Res., 49, 3601-3617, https://doi.org/10.1002/wrcr.20188, 2013.
Serinaldi, F.: Dismissing return periods!, Stoch. Env. Res. Risk A., 29, 1179–1189, https://doi.org/10.1007/s00477-014-0916-1, 2015.
Spinoni, J., Vogt, J. V., Naumann, G., Barbosa, P., and Dosio, A.: Will drought events become more frequent and severe in Europe?, Int. J. Climatol., 38, 1718–1736, https://doi.org/10.1002/joc.5291, 2018.
Stagge, J. H., Kingston, D. G., Tallaksen, L. M., and Hannah, D. M.: Observed drought indices show increasing divergence across Europe, Sci. Rep.-UK, 7, 14045, https://doi.org/10.1038/s41598-017-14283-2, 2017.
Stagl, J. and Hattermann, F. F.: Impacts of climate change on the hydrological regime of the Danube river and its tributaries using an ensemble of climate scenarios, Water, 7, 6139–6172, https://doi.org/10.3390/w7116139, 2015.
Stagl, J., Mayr, E., Koch, H., Hattermann, F. F., and Huang, S.: Effects of climate change on the hydrological cycle in Central and Eastern Europe, in: Managing Protected Areas in Central and Eastern Europe Under Climate Change, Advances in Global Change Research 58, edited by: Rannow, S. and Neubert, M., Springer, Dordrecht, 2014.
Stahl, K., Tallaksen, L. M., Hannaford, J., and van Lanen, H. A. J.: Filling the white space on maps of European runoff trends: estimates from a multi-model ensemble, Hydrol. Earth Syst. Sci., 16, 2035–2047, https://doi.org/10.5194/hess-16-2035-2012, 2012.
Tallaksen, L. M. and Van Lanen, H. A. J.: Drought as natural hazard: Introduction, in: Hydrological Drought – Processes and estimation methods for streamflow and groundwater, edited by: Tallaksen, L. M. and Van Lanen, H. A. J., Elsevier Sciences B.V., Amsterdam, 3-17, 2004.
Tebaldi, C., Arblaster, J. M., and Knutti, R.: Mapping model agreement on future climate projections, Geophys. Res. Lett., 38, L23701, https://doi.org/10.1029/2011GL049863, 2011.
Teuling, A. J., Van Loon, A. F., Seneviratne, S. I., Lehner, I., Aubinet, M., Heinesch, B., Bernhofer, C., Grünwald, T., Prasse, H., and Spank, U.: Evapotranspiration amplifies European summer drought, Geophys. Res. Lett., 40, 2071–2075, https://doi.org/10.1002/grl.50495, 2013.
UNFCCC: The Paris Agreement, United Nations Framework Convention on Climate Change, available at: https://unfccc.int/process-and-meetings/the-paris-agreement/the-paris-agreement (last access: 9 December 2020), 2015.
Vandecasteele, I., Bianchi, A., Batista e Silva, F., Lavalle, C., and Batelaan, O.: Mapping current and future European public water withdrawals and consumption, Hydrol. Earth Syst. Sci., 18, 407–416, https://doi.org/10.5194/hess-18-407-2014, 2014.
Van Loon, A. F. and Van Lanen, H. A. J.: A process-based typology of hydrological drought, Hydrol. Earth Syst. Sci., 16, 1915–1946, https://doi.org/10.5194/hess-16-1915-2012, 2012.
Van Loon, A. F. and Van Lanen, H. A. J.: Making the distinction between water scarcity and drought using an observation-modeling framework, Water Resour. Res., 49, 1483–1502, https://doi.org/10.1002/wrcr.20147, 2013.
Van Loon, A., Gleeson, T., Clark, J., Van Dijk, A. I. J. M., Stahl, K., Hannaford, J., Di Baldassarre, G., Teuling, A. J., Tallaksen, L. M., Uijlenhoet, R., Hannah, D. M., Sheffield, J., Svoboda, M., Verdeiren, B., Wagener, T., Rangecroft, S., Wanders, N., and Van Lanen, H. A. J.: Drought in the Anthropocene, Nat. Geosci., 9, 89–91, https://doi.org/10.1038/ngeo2646, 2016.
Van Tiel, M., Teuling, A. J., Wanders, N., Vis, M. J. P., Stahl, K., and Van Loon, A. F.: The role of glacier changes and threshold definition in the characterisation of future streamflow droughts in glacierised catchments, Hydrol. Earth Syst. Sci., 22, 463–485, https://doi.org/10.5194/hess-22-463-2018, 2018.
Vautard, R., Gobiet, A., Sobolowski, S., Kjellström, E., Stegehuis, A., Watkiss, P., Mendlik, T., Landgren, O., Nikulin, G., Teichmann, C., and Jacob, D.: The European climate under a 2 ∘C global warming, Environ. Res. Lett., 9, 034006, https://doi.org/10.1088/1748-9326/9/3/034006, 2014.
Wada, Y., Flörke, M., Hanasaki, N., Eisner, S., Fischer, G., Tramberend, S., Satoh, Y., van Vliet, M. T. H., Yillia, P., Ringler, C., Burek, P., and Wiberg, D.: Modeling global water use for the 21st century: the Water Futures and Solutions (WFaS) initiative and its approaches, Geosci. Model Dev., 9, 175–222, https://doi.org/10.5194/gmd-9-175-2016, 2016.
Wilhite, D. A.: Drought as a natural hazard: concepts and definitions, in: Droughts: Global Assessment, edited by: Wilhite, D. A., Routledge, London, 3–18, 2000.
Yevjevich, V.: An objective approach to definitions and investigations of continental hydrological droughts, Hydrology Paper 23, Colorado State University, Fort Collins, 1967.
Yilmaz, K. K., Gupta, H. V., and Wagener, T.: A process-based diagnostic approach to model evaluation: Application to the NWS distributed hydrological model, Water Resour. Res., 44, W09417, https://doi.org/10.1029/2007WR006716, 2008.
Zelenhasić, E. and Salvai, A.: A method of streamflow drought analysis, Water Resour. Res., 23, 156–168, https://doi.org/10.1029/WR023i001p00156, 1987.