the Creative Commons Attribution 4.0 License.
the Creative Commons Attribution 4.0 License.
 | 15 Dec 2020
A new criterion for determining the representative elementary volume of translucent porous media and inner contaminant
Ming Wu
Jichun Wu
Bill X. Hu
Representative elementary volume (REV) is essential for measuring and quantifying the effective parameters of a complex heterogeneous medium. To overcome the limitations of the existing REV estimation criteria, a new REV estimation criterion (χi) based on dimensionless range and gradient calculation is proposed in this study to estimate the REV of a translucent material based on light transmission techniques. Three sandbox experiments are performed to estimate REVs of porosity, density, tortuosity, and perchloroethylene (PCE) plume using multiple REV estimation criteria. In comparison with χi, previous REV estimation criteria based on the coefficient of variation (), the entropy dimension (DIi) and the relative gradient error () are tested in REV quantification of translucent silica and the inner PCE plume to achieve their corresponding effects. Results suggest that the new criterion (χi) can effectively identify the REV in the materials, whereas the coefficient of variation and entropy dimension () are not effective. The relative gradient error can make the REV plateau obvious, while random fluctuations make the REV plateau difficult to identify accurately. Therefore, the new criterion is appropriate for REV estimation of the translucent materials and inner contaminant. Models are built based on a Gaussian equation to simulate the distribution of REVs for media properties, whose frequency of REV is dense in the middle and sparse on both sides. REV estimation of the PCE plume indicates that a high level of porosity leads to a large value of mean and standard deviation for REVs of PCE saturation (So) and PCE–water interfacial area (AOW). Fitted equations are derived from distribution of REVs for the PCE plume related to dm (distances from mass center to considered point) and dI (distances from injection position to considered point). Moreover, relationships between REVs of the PCE plume and So are fitted using regression analysis. Results suggest a decreasing trend appears for So-REV when So increases, while AOW-REV increases with increasing So.
- Article
(13451 KB) - Full-text XML
- BibTeX
- EndNote


Modelling groundwater and contaminant (such as hazardous ions) transport in a subsurface environment is based on the premise that the micro-structure of an aquifer has a representative elementary volume (REV) (Wang et al., 2016; Lei and Shi, 2019). REV acts as a micro-scale characteristic, which is important for improving our understanding of materials, inner fluid flow, and other processes (Brown and Hsieh, 2000; Costanza-Robinson et al., 2011; Wu et al., 2017). Previous studies (Bai et al., 2016; Esfandiar et al., 2017) suggested that even the platinum-nanoparticle-catalyzed hydrogenation reactions and ion transport through Angström-scale slits in cell activity had apparent size effects, implying size effect is a common characteristic for many processes and materials. With the help of REV, a porous medium can be treated as a continuum medium (Brown and Hsieh, 2000; Kang et al., 2003; Müller and Siegesmund, 2010; Teruel and Rizwan-uddin, 2010; Hendrick et al., 2012; Wang et al., 2012; Ukrainczyk and Koenders, 2014; Kim and Mohanty, 2016; Gilevska et al., 2019). A conceptual representation of an “REV curve” (Brown and Hsieh, 2000), characterizing porosity (θ) change with measured scale (L) increment, is presented in Fig. 1a. Based on the characteristic of the REV curve in Fig. 1a, the REV curve can be divided into three regions. When the measured scale (Fig. 1b) is in region I, the porosity fluctuates drastically at small scales. As the measured scale size ranges between Lmin and Lmax, a flat plateau with a constant and steady value is encountered and the property is factored into its average value. Material property in spatial scales less than Lmin is spatially varied in portions with a small scale, which can be easily influenced by individual pores in micro-structure such as region I (Fig. 1a). Likewise, material property is allowed to drift to new values in the spatial scale above Lmax due to additional morphological structures of large field heterogeneity (region III). As a matter of fact, the REV scale of region II can be derived between the small and spatially varied property in region I and large field variability in region III. However, the lower and upper boundaries Lmin and Lmax of the REV plateau are hard to identify in reality (Brown and Hsieh, 2000; Costanza-Robinson et al., 2011).
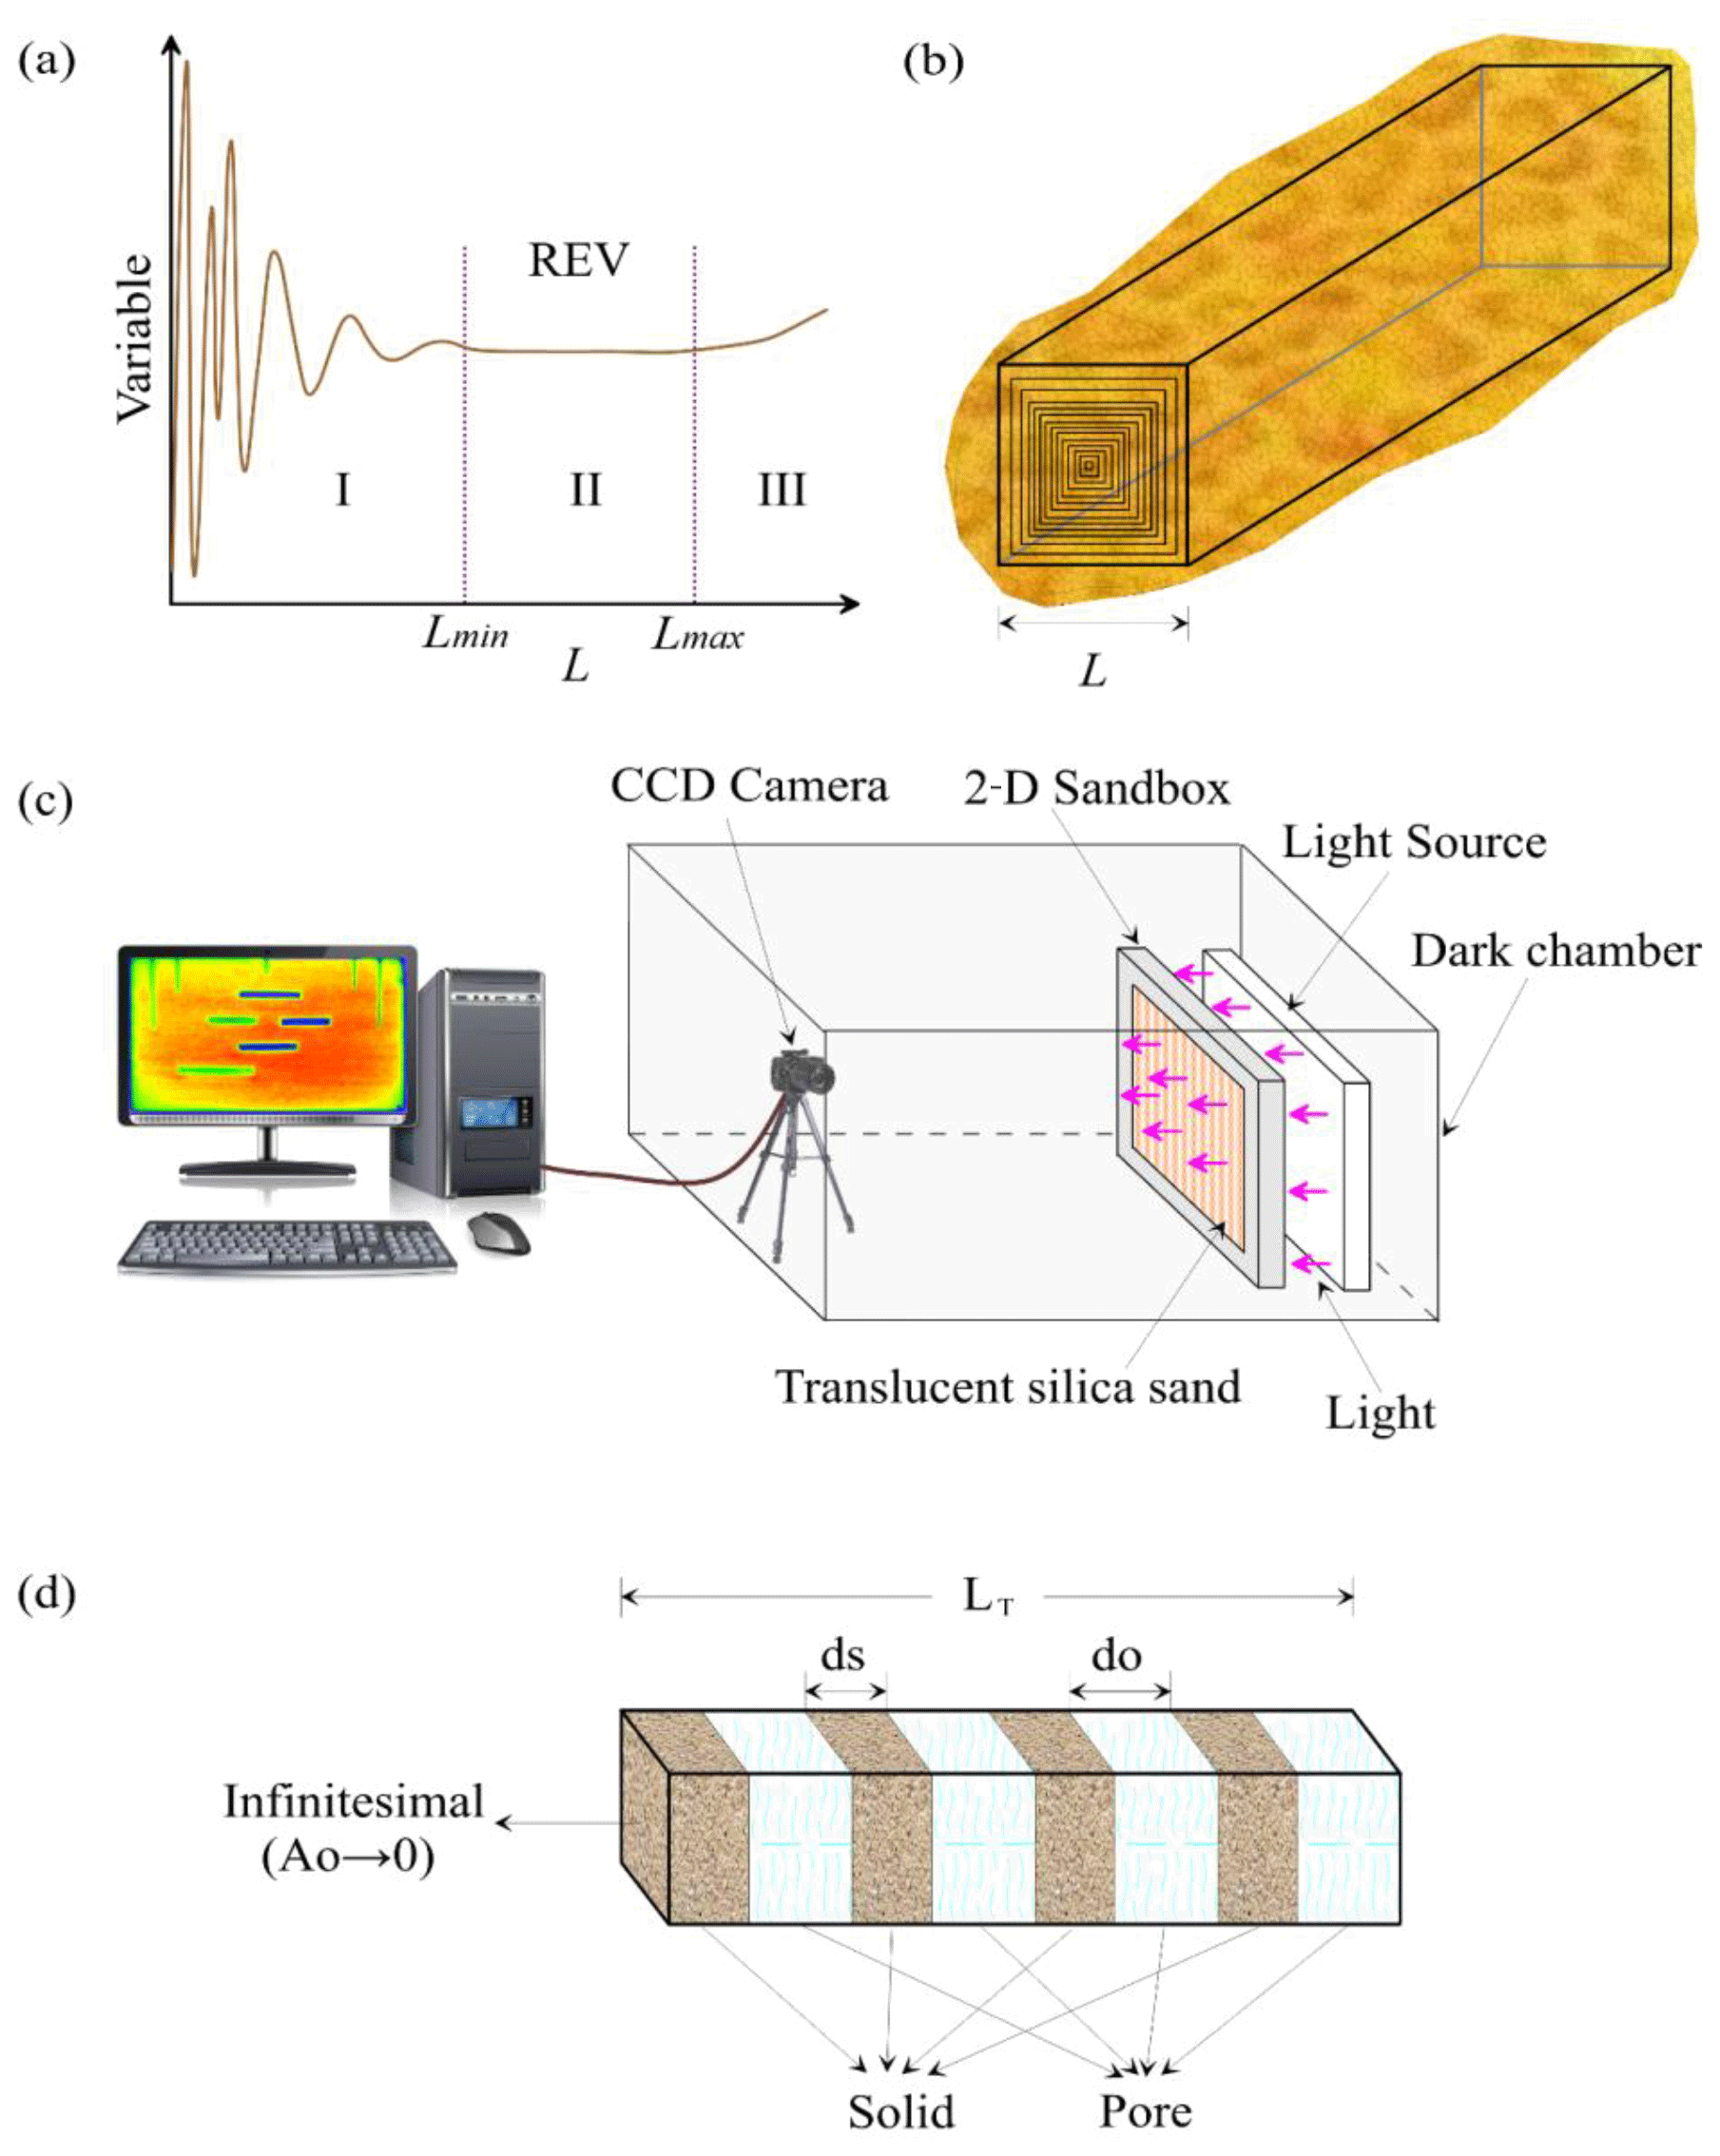
Figure 1(a) Variable changes as a measured scale (L) increment in the conceptual curve (Costanza-Robinson et al., 2011); (b) scale effect and the cuboid image window geometry; (c) system device for acquisition of parameters (porosity and density, etc.) of translucent material; (d) the infinitesimal selected from translucent porous media packed in a 2D sandbox.
As technology advanced and progressed, non-destructive and non-invasive techniques of X-ray and gamma ray micro-tomography were utilized for micro-structure characteristic measurement in materials (Ghilardi, 1993; Brown and Hsieh, 2000; Niemet and Selker, 2001; Bob et al., 2008; Al-Raoush and Papadopoulos, 2010; Costanza-Robinson et al., 2011; Al-Raoush, 2012; Borges and Pires, 2012; Fernandes et al., 2012; Rozenbaum and Roscoat, 2014; Pereira Nunes et al., 2016; Piccoli et al., 2019). Generally, REV estimation for material properties, inner gas and fluid was also usually implemented by micro-visualization and scanning of X-rays and gamma rays in the laboratory (Brown and Hsieh, 2000; Razavi et al., 2007; Nordahl and Ringrose, 2008; Al-Raoush and Papadopoulos, 2010; Costanza-Robinson et al., 2011; Rozenbaum and Roscoat, 2014; Borges et al., 2018), while different criteria were utilized to quantify REV (Brown and Hsieh, 2000; San José Martínez et al., 2007; Nordahl and Ringrose, 2008; Costanza-Robinson et al., 2011). A lower boundary scale Lmin of REV was identified by means of entropy dimension (DIi) for eight soil samples (San José Martínez et al., 2007). Further, the REV scale of permeability for ripple-laminated sandstone intercalated with mudstone was estimated using the coefficient of variation (), where the REV scale is identified by the variability among the 10 samples to achieve an average REV scale (Nordahl and Ringrose, 2008). As a result, only one REV boundary was identified, and not every sample can be estimated effectively (Nordahl and Ringrose, 2008). More interestingly, REVs of material property (porosity), moisture saturation, and air–water interfacial areas in porous media were estimated by a criterion named the relative gradient error () (Costanza-Robinson et al., 2011). REVs of permeability of translucent material, perchloroethylene (PCE) saturation, and PCE–water interfacial area also can be estimated using the relative gradient error (Wu et al., 2017). In summary, the REV estimation was made up of multiple kinds of criteria, while the REV identification effects of these criteria were not clear. What is more, these previous criteria estimate REV scale unsatisfactorily in that the beginning and end of the REV plateau cannot be identified simultaneously for translucent porous media based on the light transmission technique. Therefore, a new criterion which can identify the REV plateau accurately is needed.
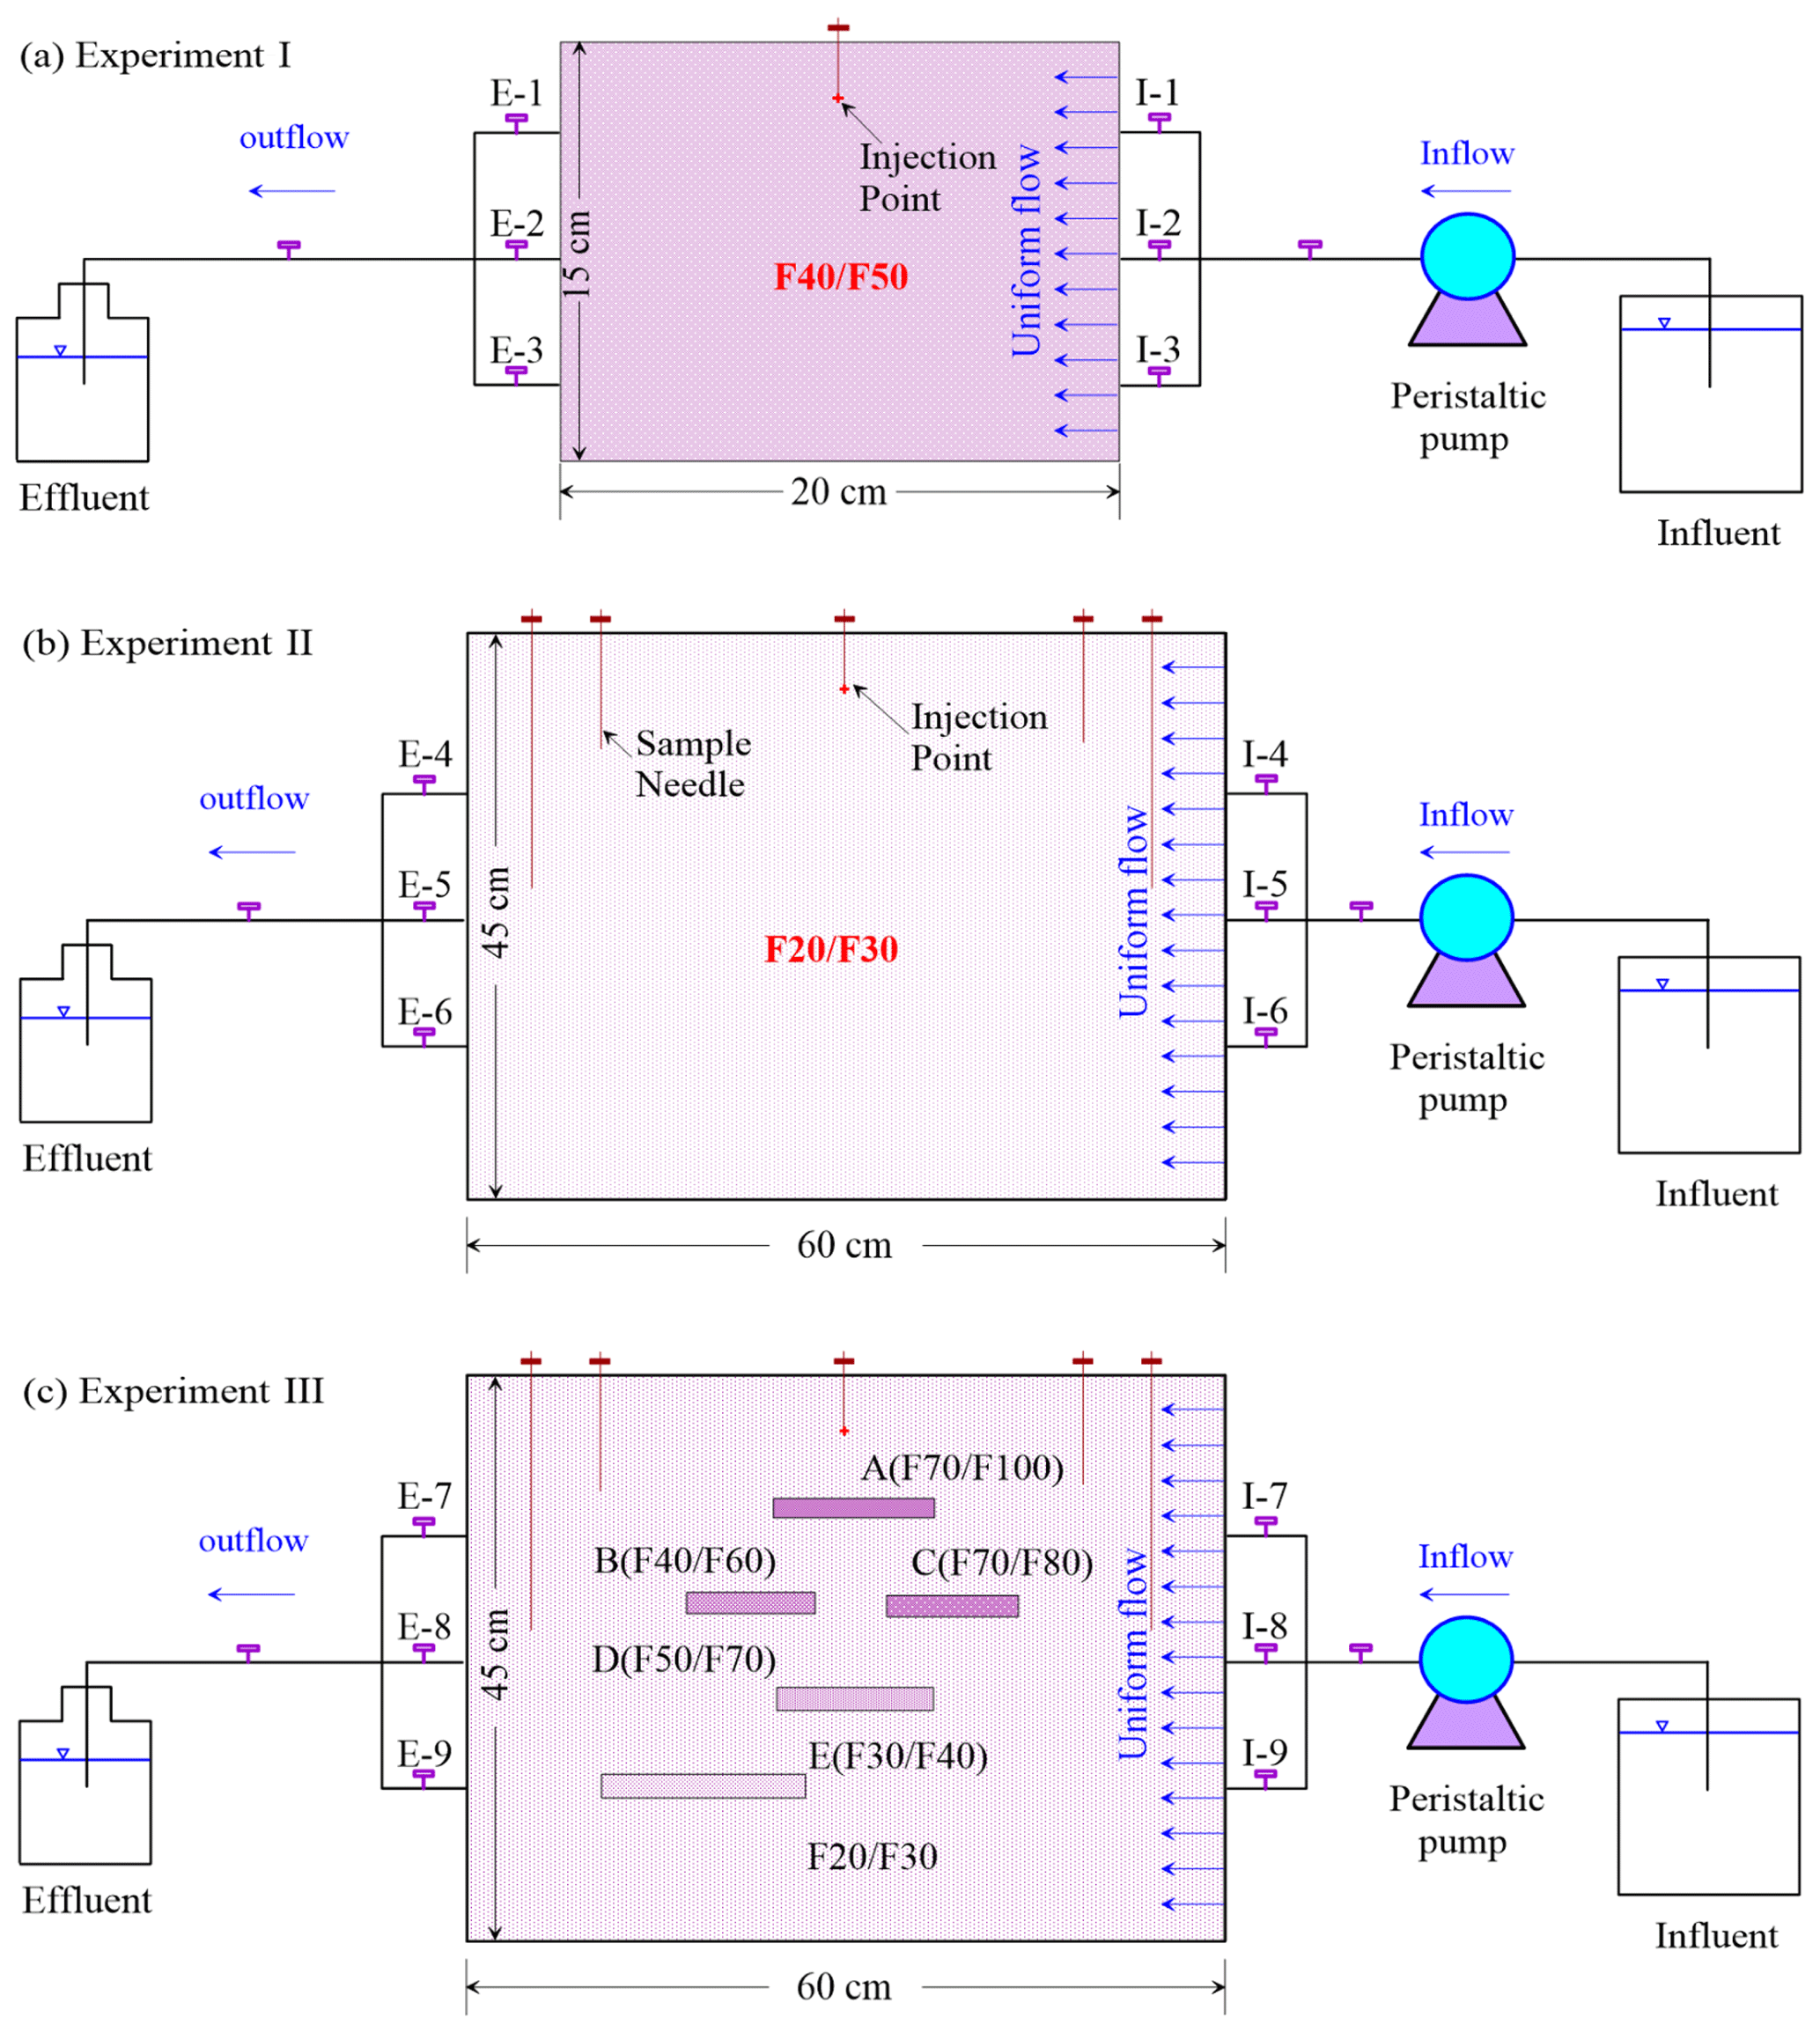
Figure 2(a) The system sandbox equipment of Experiment I; (b) the system sandbox equipment of Experiment II; (c) the system sandbox equipment of Experiment III.
In this study, a new criterion (χi) for REV estimation is proposed to identify the REV scale of the translucent silica and inner contaminant. Three PCE transport experiments are conducted in two-dimensional (2D) sandboxes to test the effect of different REV estimation criteria. Translucent silica is selected for associated REV analysis due to its extensive utilization in laboratory experiments for exploring groundwater flow and contaminant migration behavior in the micro-structure of a sandy aquifer (Niemet and Selker, 2001; Bob et al., 2008; Costanza-Robinson et al., 2011). Moreover, translucent silica is also an important material applied in numerous industries (Bouvry et al., 2016). In laboratory experiments, translucent silica is packed in 2D sandboxes where porosity, density, tortuosity, and PCE saturation are derived by the light transmission technique (Fig. 1c). Porosity and PCE saturation are selected as the representative variables to explore corresponding REV estimation by different criteria, which is very essential and significant for REV identification. Previous criteria such as the coefficient of variation (), entropy dimension (DIi), the relative gradient error (), and the new criterion-χi are tested in REV estimation. Associated effects are analyzed to achieve the best criterion of effective and appropriate quantification of REV.
2.1 Experiment
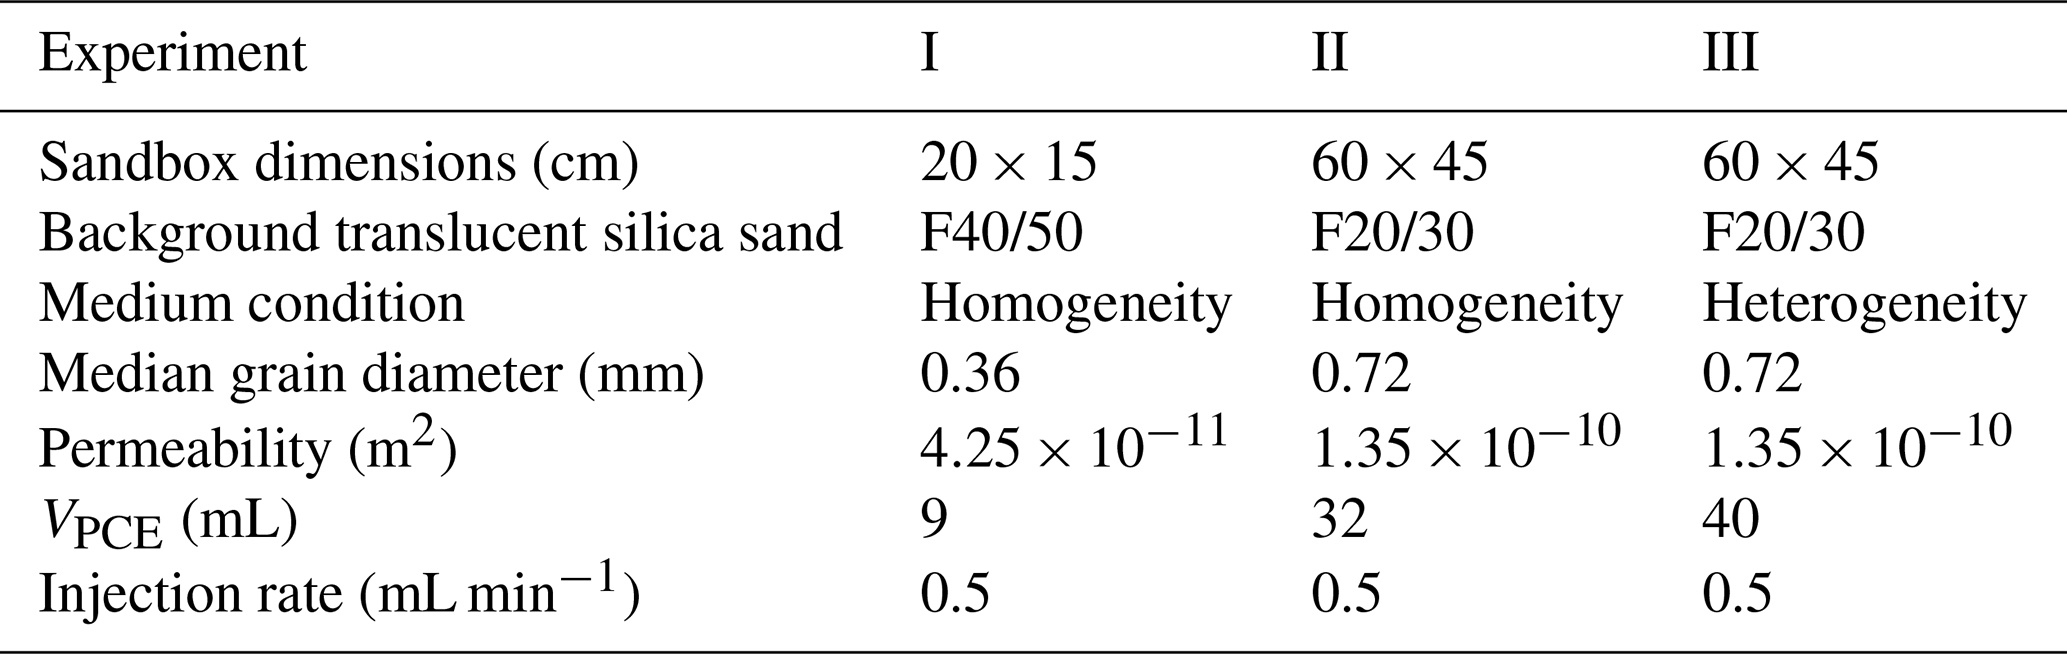
Three sandboxes (Fig. 2a–c) packed by a translucent silica medium are prepared in the laboratory to test different criteria of REV quantification. PCE is selected as a typical dense nonaqueous-phase liquid (DNAPL) contaminant used in experiments. A 2D sandbox is composed of three aluminum interior frames and two glass walls whose thickness is 1.6 cm. The dimensions of sandboxes used in Experiment I are 20 cm (width) × 15 cm (height), and the dimensions of Experiments II and III are 60 cm (width) × 45 cm (height). F40/50 and F20/30 mesh translucent silica sands are used for background material for Experiments I and II, while heterogeneous translucent silica with low porosity and permeability are packed in a sandbox for Experiment III. To make the translucent silica fully saturated by water in a flow field close to a natural groundwater environment (Erning et al., 2012), water flow at a flow velocity of 0.5 m d−1 is set from left to right in laboratory sandbox experiments (Fig. 2a–c). Water is restricted in a sandbox to the top and bottom layers of the sandbox packed with F70/80 mesh translucent silica as capillary barriers. A light source is placed behind the sandbox to make light penetrate through translucent media and capture emergent light intensity using a thermoelectrically air-cooled charge-coupled device (CCD) camera (Fig. 1c). Afterward, PCE is injected into sandboxes from the injection needle at a constant rate of 0.5 mL min−1 for the three experiments. Detailed experimental conditions are listed in Table 1.
2.2 Light transmission technique
By means of the light transmission technique (Fig. 1c), DNAPL and water saturation can be obtained rapidly and in real time, which greatly helps to explore the mechanism of groundwater flow and contaminant migration in porous media. When light passes through translucent materials of a given thickness, the emergent light intensity after the absorptive and interfacial losses can be expressed as (Niemet and Selker, 2001; Bob et al., 2008; Wu et al., 2017)
where a represents the phase number; b represents the number of the interface between phase a and a+1; I0 is the original light intensity; C is a constant of correction for light emission and light observation; τb is the transmittance when light penetrates from phase a to a+1; αa is the absorption coefficient when light penetrates in phase a; da is the length of the light penetration path in phase a.
To derive the porosity, the 2D translucent porous medium should be only saturated by water. Consequently, the emergent light intensity can be expressed as (Niemet and Selker, 2001; Bob et al., 2008; Wu et al., 2017)
where is the transmittance of the solid–water interface; αs is the solid particle absorption coefficient; ds is the median diameter of the solid particles; ko is the number of pores across the light penetration path; and ks is the number of solid particles across the light penetration path.
If we arbitrarily select an infinitesimal element, its area Ao approaches zero (Ao→0) from the 2D translucent porous media (Fig. 1d), and suppose the infinitesimal element with thickness LT containing solid particles and pores can be regarded as being of lamellar structure (Fig. 1d), we can obtain the following relationships (Wu et al., 2017):
where do is the median diameter of pores; θ is porosity.
Substituting Eqs. (3) and (4) into Eq. (2), the relationship between emergent light intensity and porosity can be achieved (Wu et al., 2017):
where and ). β and γ can be determined from experimental data, and then porosity can be obtained.
The density and tortuosity are derived as (Wu et al., 2018)
where ρ is the density of translucent porous media; ρw is the density of water; ρs is the density of solid particles; and τ is tortuosity.
The saturation of DNAPL was quantified by the light transmission technique based on light passing through translucent materials (Niemet and Selker, 2001; Bob et al., 2008):
where So is the saturation of DNAPL; Is is the light intensity after light penetration through translucent pores when all pores are fully saturated by water; Ioil is the light intensity when all pores are fully saturated by DNAPL; and IT is the light intensity after penetration through translucent materials. After quantification of PCE saturation, the PCE–water interfacial area (AOW) can be obtained based on the method proposed by Wu et al. (2017), where the unit of AOW is cm−1.
Emergent light intensity for the three experiments is captured by a thermoelectrically air-cooled CCD camera (Niemet and Selker, 2001; Bob et al., 2008). Every pixel with a small scale could be approximated as an infinitesimal element in a high-resolution image to apply light transmission techniques. As a consequence, porosity of translucent silica was derived using light transmission techniques through Eq. (5). The whole 2D translucent silica area was numerically discretized so that every cell had the uniform dimensions of 0.015 m × 0.015 m. The cuboid window (Fig. 1b) was utilized to quantify the variables (porosity, density, tortuosity, PCE saturation, PCE–water interfacial area) of every cell as the measured scale was increased. In detail, the measured cuboid window scale was increased from the center of each cell, and the associated value of the variable was calculated from the high-resolution porosity of 2D translucent silica derived by the light transmission technique. Observation cells were selected from the discretized cells (Fig. 3b), of which cells I-1–2, II-1–2, and III-1–2 belong to Experiments I–III, respectively.
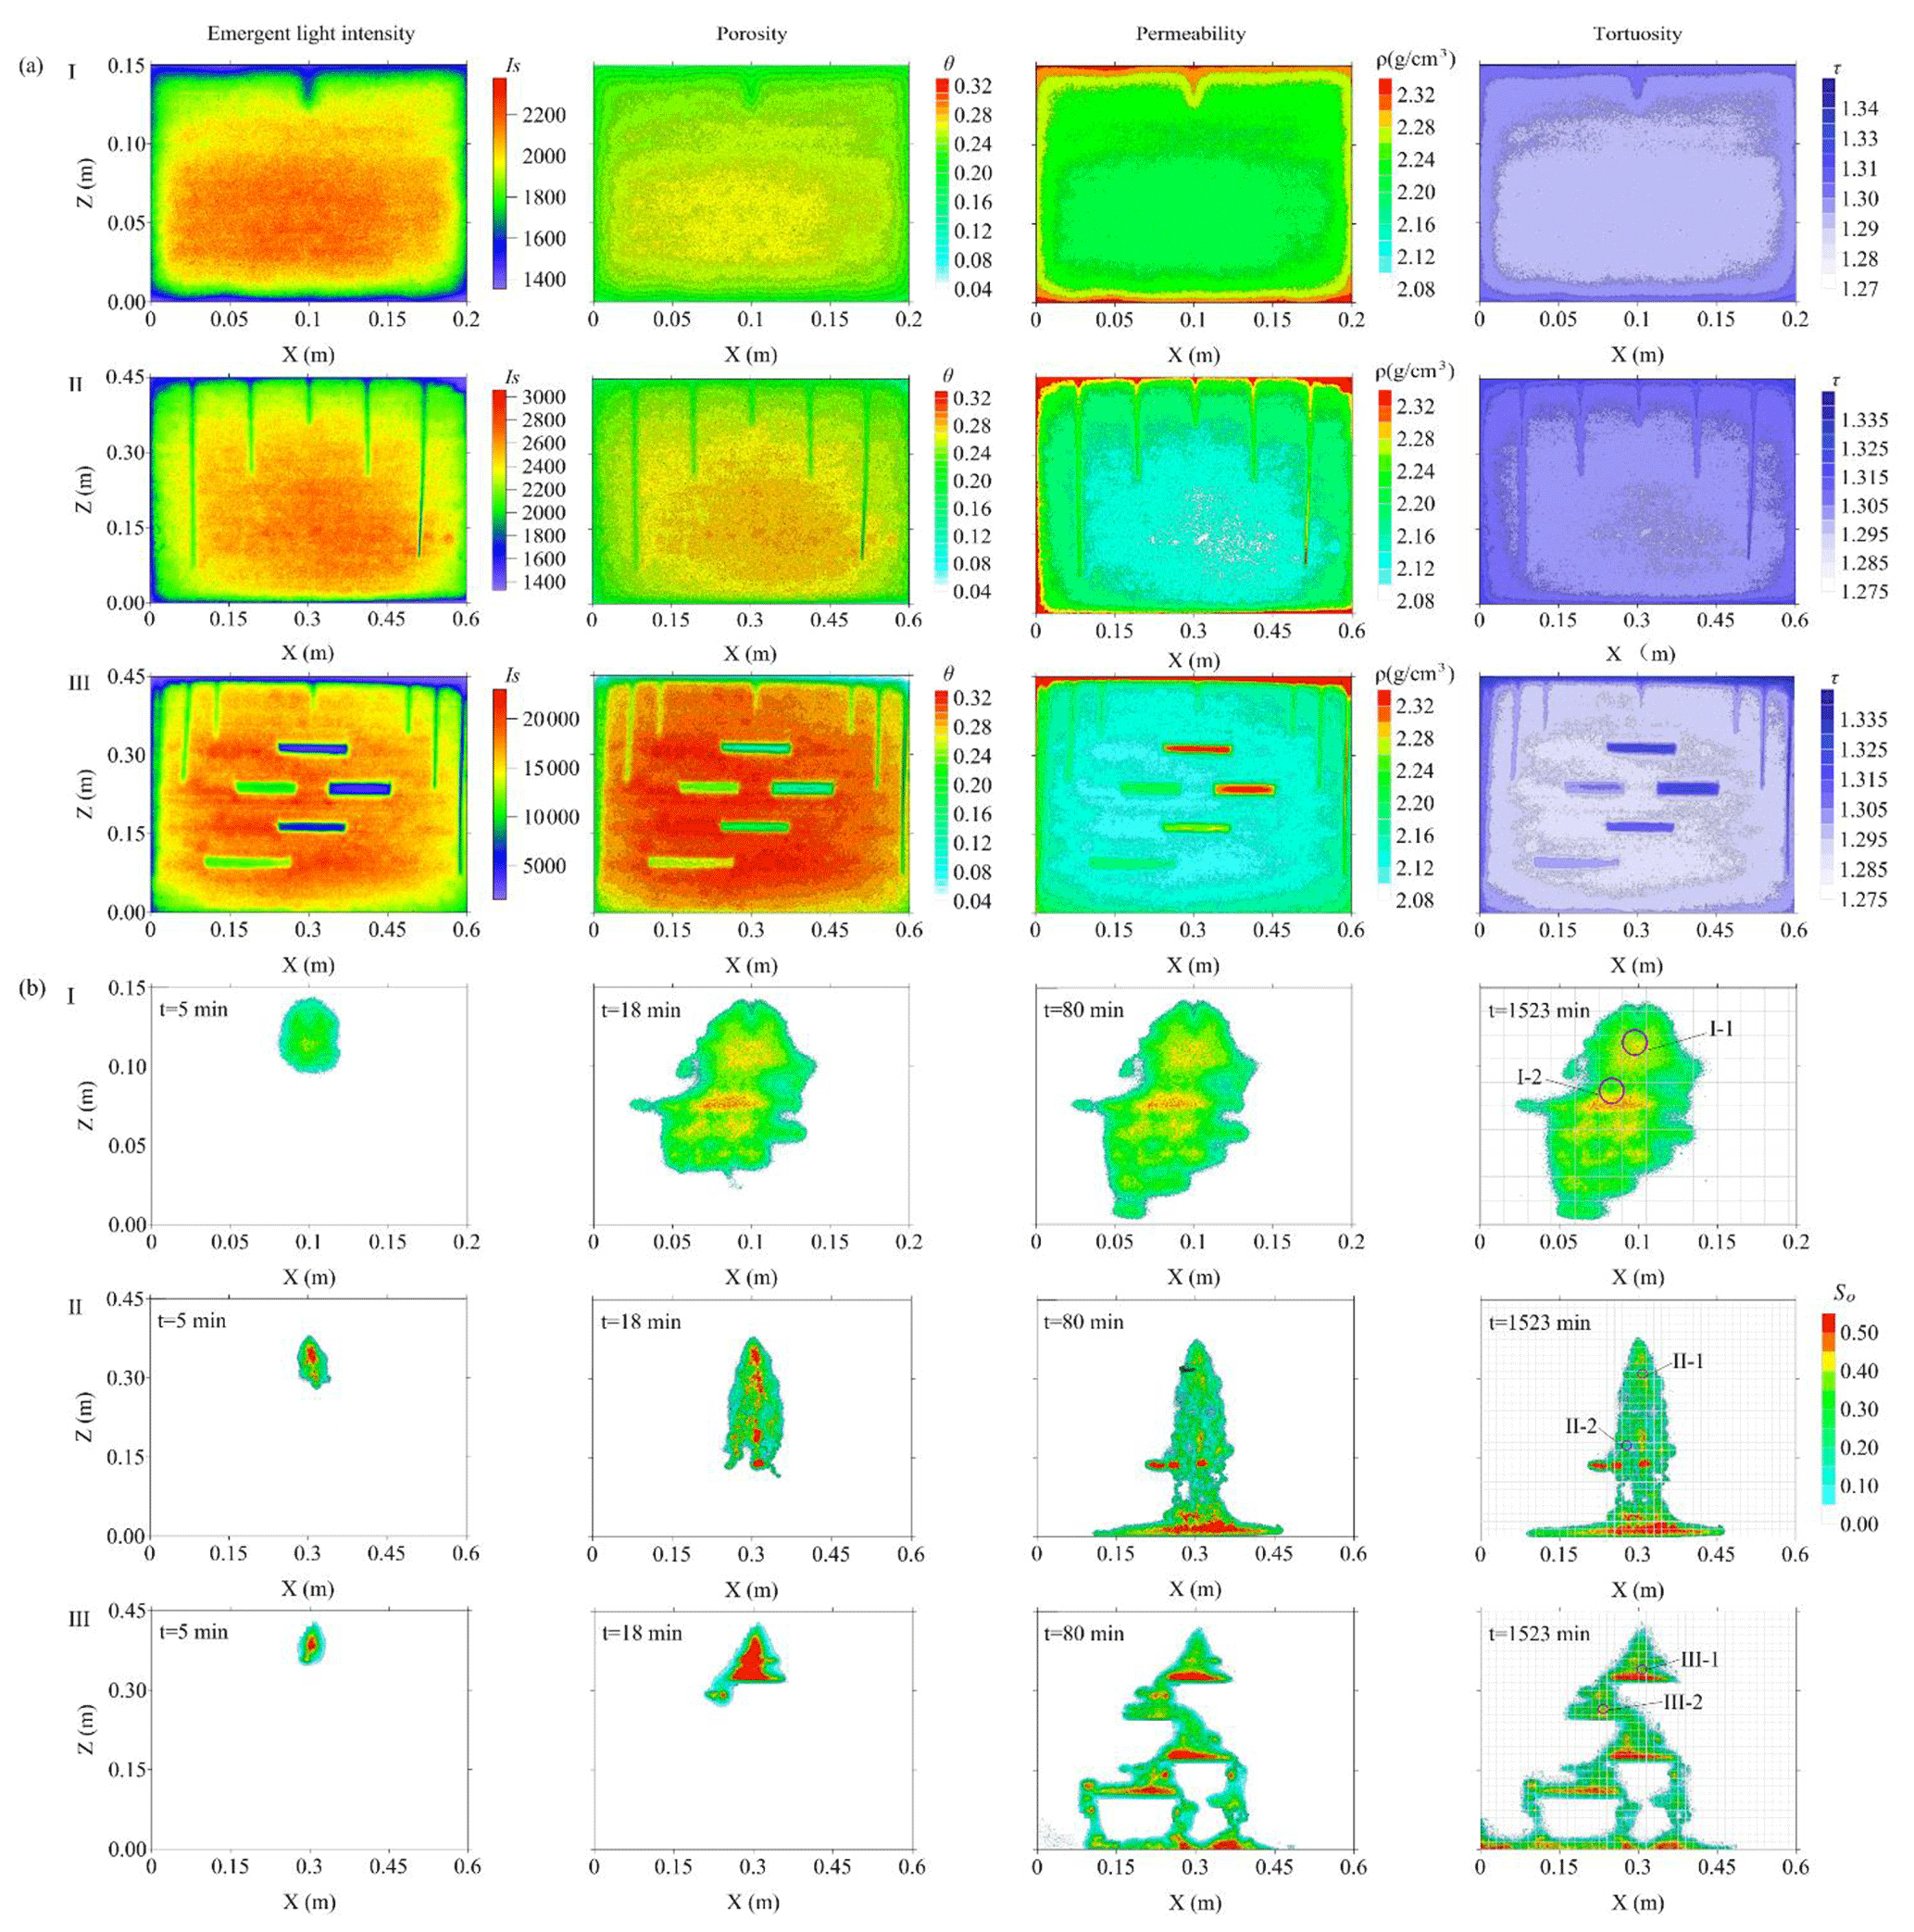
Figure 3(a) The emergent light intensity, porosity, permeability, and tortuosity of 2D translucent silica sand for Experiments I–III; (b) the PCE saturation of Experiments I–III during 0–1523 min and observation cells.
To analyze the regularity of the REV distribution for the PCE plume, the mass center coordinate and the ganglia-to-pool ratio (GTP) of the PCE plume are quantified for Experiments I–III. The mass center coordinate and GTP are calculated as
where Xm is the x coordinate of the mass center for the PCE plume; Zm is the z coordinate of the mass center for the PCE plume; GTP is the ganglia-to-pool ratio, which equals the ratio of Vganglia to Vpool; Vganglia is the PCE volume under ganglia state; Vpool is the PCE volume under pool state; M00, M10, and M01 are computed using the definition of the spatial moment (Mij), ; x0 and z0 are minimum limits of the x axis and z axis; x1 and z1 are maximum limits of the x axis and z axis; θ(x,z) is the porosity at point (x,z); is PCE saturation of point (x,z) at time t.
2.3 Criteria of REV quantification
The REV is defined as the volume range in which all material characteristics are factored into the average and associated values approach single and constant (Brown and Hsieh, 2000). In the range of REV, the value of one associated property will meet the condition
where Y(Li) is the value of an associated property when the system scale is Li; Li is the value of the system scale; Lo is the scale range of REV, ; Lmax is the upper boundary of REV; Lmin is the lower boundary of the REV scale. According to Eq. (12), when the measured scale (Li) reaches the REV range, . As a matter of fact, most previously used criteria were applied to estimate REV based on this requirement (Brown and Hsieh, 2000; San José Martínez et al., 2007; Nordahl and Ringrose, 2008; Costanza-Robinson et al., 2011).
To evaluate the REV of porosity, the coefficient of variation () is utilized to estimate the variability (Nordahl and Ringrose, 2008):
where i is the cuboid window (Fig. 1b) increment number; φ is the measured variable, such as porosity; is the standard deviation of sub-grid variables in different measured volumes or scales; is the arithmetic average of the variable values in the sub-grids. When the number of sub-grids (N) is less than 10, a correction is utilized to replace Eq. (13). According to Nordahl and Ringrose (2008), is defined as homogeneous and can be used as a criterion to identify the REV scale.
Similarly, for porosity of translucent silica, entropy dimension (DIi) is utilized for REV analysis and estimation (San José Martínez et al., 2007), which is defined as
where Lε is the scale of the sub-grid; “≈” indicates the asymptotic equivalence as Lε→0 (San José Martínez et al., 2007); j is the ordinal number of sub-grids in measured cuboid windows (Fig. 1b) of increment number i; m(i) is the total number of sub-grids in measured cuboid windows (Fig. 1b) of increment number i; μj(ε) is the proportion of the variable of sub-grid j in the whole measured cuboid window i. The right-hand side of Eq. (14) is the simplification of Shannon entropy of all sub-grids, in which DIi can be considered the average of logarithmic values of the variable distribution weighted by μj(Lε) to quantify the degree of medium heterogeneity. Using Eq. (14), a series of values of DIi (i=1, 2, 3 …) are obtained for each measured cuboid window (Fig. 1b) of increment number i. For estimation of the REV in a porous medium, the relative increment of entropy dimension and associated criterion of REV identification are, respectively, expressed as
where CVDI is the coefficient of variation of DIi series (i=1, 2, 3 …), which is calculated through ; is the mean value of the DIi series; is the standard deviation of the DIi series.
To achieve the REV for multiple system variables, such as porosity, moisture saturation and air–water interfacial areas in an unsaturated porous medium, a criterion named the relative gradient error was applied (Costanza-Robinson et al., 2011):
where is relative gradient error; ΔL is the measured cuboid window size increment length for REV estimation. Usually, less than 0.2 (Costanza-Robinson et al., 2011) is utilized to identify REV sizes.
According to the requirement in Eq. (12), a new criterion based on the required condition of REV is proposed to estimate the REV range of the translucent silica in this study:
where δi is the dimensionless range, ; φ(Li)max is the maximum value of the variable on the volume scale Li; φ(Li)min is the minimum value of the variable on the volume scale Li; and is the mean value of the variable on the volume scale Li. Brown and Hsieh (2000) suggested can be used for REV estimation. In fact, the calculated value of δi mostly is less than 1, while δi≪1 is hard to use to identify the REV scale for realistic materials, such as the translucent silica used in this study. The value limit of χi used for REV estimation also is explored in this study.
In this study, criteria for the coefficient of variation (), entropy dimension (DIi), the relative gradient error () and the new criterion (χi) are all applied to REV estimation for porosity and PCE saturation. Corresponding REV plateau identification effects are compared to select the best criterion for REV quantification.
3.1 REV identification effect of different criteria
3.1.1 The coefficient of variation
Emergent light intensity distributions of translucent silica for the three experiments, which had been fully saturated by water, were obtained by a thermoelectrically air-cooled CCD camera (Niemet and Selker, 2001; Bob et al., 2008). The porosity, density, tortuosity and PCE saturation for the three experiments are derived by the light transmission technique as shown in Fig. 3a and b. The PCE spreads from the injecting point shaped like a drop of water at t=5 min (Fig. 3b). In 2D sandboxes for the three experiments, the PCE plume infiltrates translucent silica sands and reaches the bottom after t=80 min.
Porosity and PCE saturation variation curves of all observation cells with increasing measured cuboid window scale are shown in Fig. 4a and b. However, for all observation cells from translucent silica, the REV plateaus were not certain to be objectively judged visually, which made REV plateaus hard to identify effectively by original variation curves for porosity and PCE saturation (Fig. 4a and b).
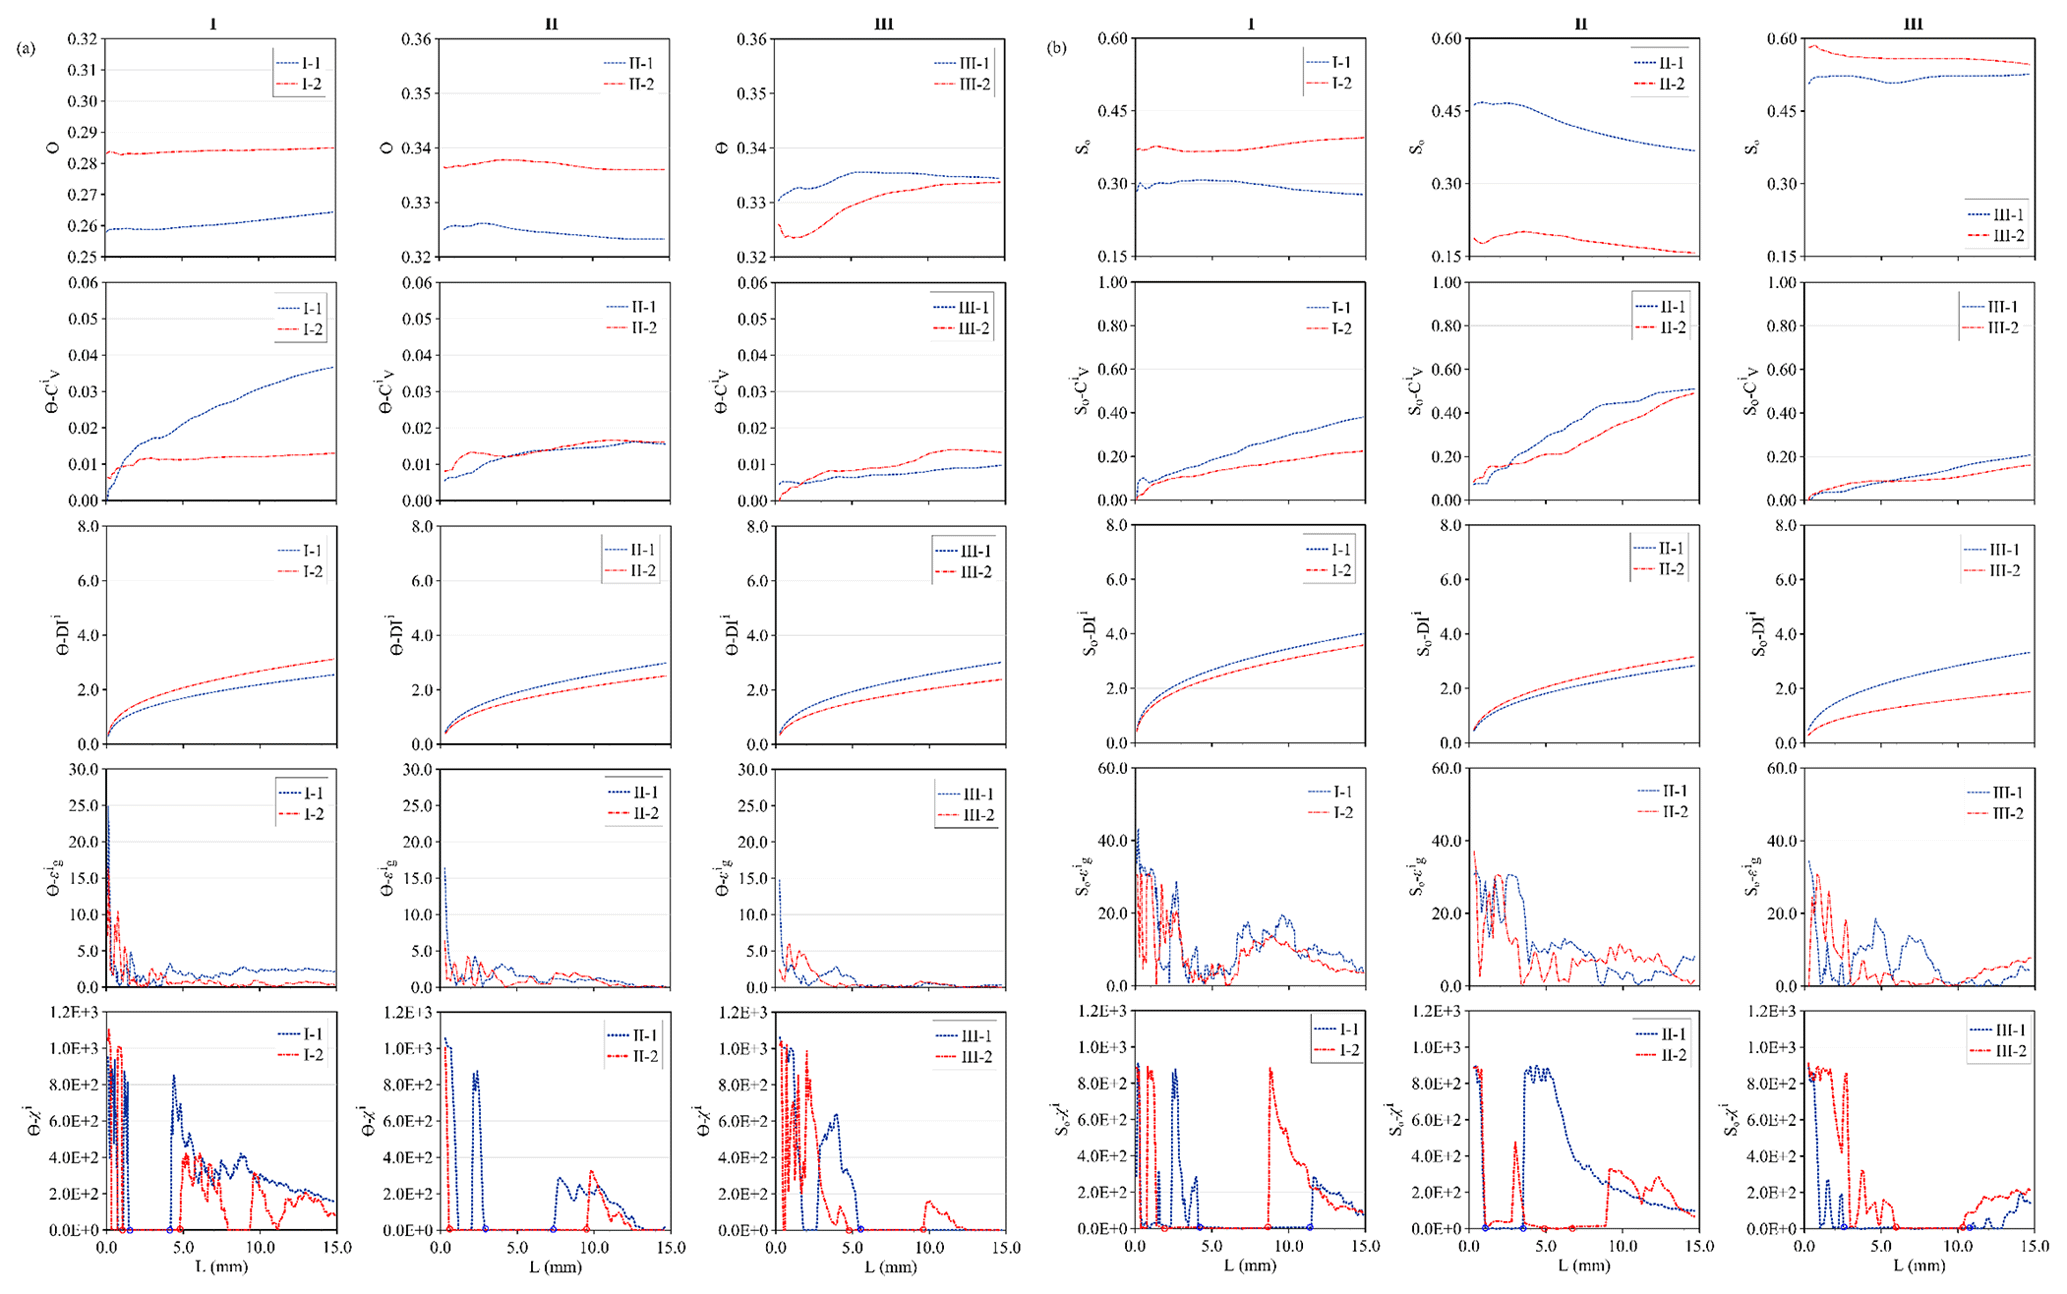
Figure 4(a) The change in porosity (θ), associated coefficient of variation (), entropy dimension (DIi), relative gradient error (), and new criterion-χi for observation cells as the cuboid window scale (L) increases; (b) the change in PCE saturation (So), associated , DIi, , and χi for observation cells as the cuboid window scale (L) increases.
To make the REV plateau more explicit, different criteria of REV quantification are utilized. The coefficient of variation () of porosity and PCE saturation fluctuating with increasing measured cuboid window size is shown in Fig. 4. The measured cuboid window scale is limited to the dimensions of cells in discretization of 2D translucent silica. The observation cells show various characteristics of variation tendency for the coefficient of variation (). The θ and So variation curves of the coefficient of variation () for all observation cells do not reach stable values like those shown in Fig. 4a and b; the beginning of the REV flat plateau is not easy to identify, and the coefficient of variation () is not suitable for REV estimation. According to the heterogeneity definition by Corbett and Jensen (1992), the heterogeneity of materials is defined by magnitude such that is classed as a homogeneous medium, is classed as a heterogeneous medium and is classed as a strong heterogeneous medium. For the coefficient of variation () magnitude in Fig. 4a and b, the values are all below 0.5, so that the criterion is unable to identify the REV scale for translucent silica.
3.1.2 Entropy dimension
Entropy dimension (DIi) is utilized by San José Martínez et al. (2007) for multifractal analysis of a porous medium porosity and REV estimation. In this study, entropy dimension (DIi) is tested to avoid an unclear REV plateau in porosity curves. The entropy dimension (DIi) of porosity is calculated by Eq. (14). Variation curves of entropy dimension (DIi) for all observation cells (Fig. 2a) are presented in Fig. 4. The curves of entropy dimension (DIi) of porosity and PCE saturation generally result in the increasing trend curves, which makes REV estimates become very difficult and invalid. Entropy dimension (DIi) was quickly increased with increasing measured cuboid window size. Compared to the coefficient of variation () of porosity and PCE saturation, entropy dimension (DIi) increased step by step without opposite fluctuation tendency in the variation curves as the length scale of the measured cuboid window increased simultaneously. In general, the REV plateau in region II (Fig. 1a) of porosity is not obvious for the entropy dimension (DIi) curves of all observation cells from the three experiments, which suggests REV scales are difficult to identify for translucent silica using entropy dimension (DIi) by the light transmission technique.
3.1.3 The relative gradient error
The relative gradient error () of porosity and PCE saturation is calculated by Eq. (17). The variation of at different measured cuboid window scales is shown in Fig. 4 for all observation cells in the 2D translucent silica. For all curves at observation cells from experiments, the REV plateaus in region II (Fig. 1a) are clearer than the variation curves based on the criteria of and DIi. Apparently, erratic variations of the relative gradient error () at small measured cuboid window scales are observed for all curves as the characteristic of REV region I in Fig. 1a. When the measured cuboid window scale further increases for all observation cells, the variability and magnitude of the relative gradient error () decrease well and factor into the average, which can be identified as the REV plateau in region II (Fig. 1a). The relative gradient error () makes the REV plateau quantification convenient for all observation cells. At the measured cuboid window size above the REV plateau, curves result in large variability for observation cells I-1–2. These findings suggest that the relative gradient error () can make the REV plateau more obvious, which greatly contributes to convenient and applicable REV quantification for translucent silica by the light transmission technique. However, random fluctuations exist in curves visually, which makes the REV plateau difficult to identify accurately.
3.1.4 The new criterion (χi)
χi of porosity and PCE saturation changing with measured cuboid window size is shown in Fig. 4. Like region I (Fig. 1a), erratic and random fluctuations appear at small measured cuboid window sizes, and χi increases with the increase in the measured cuboid window size. When the measured scale increases, the values of χi for all observation cells appear to decrease quickly and tend to steady rapidly, which exhibits the characteristic of the REV plateau as the measured scale reaches region II. The χi for observation cells restores the erratic variation state of the increasing trend after the measured cuboid window size exceeds the REV plateau. As shown in the variation curves of χi for all observation cells, the beginning of the REV flat plateaus can be identified easily, suggesting χi is more convenient and reliable than other methods for REV estimation. All observation cells show similar variation curves of χi that low value intervals are quite apparent, indicating that χi is very effective at making the REV plateau obvious for the translucent silica used in this study. Using the criterion of χi, the REV plateau of region II is flat, which is easily identified compared with other criteria for observation cells (Fig. 4a and b).
3.2 REVs of material properties
Based on the REV plateau identifications using the coefficient of variation (), entropy dimension (DIi), the relative gradient error (), and the proposed new criterion χi in Fig. 4a and b, the new criterion χi appears to be the most appropriate criterion for REV plateau identification. Even though the relative gradient error () can also make the REV plateau obvious, various random fluctuations weaken the method and reduce the associated accuracy. Therefore, REVs of porosity, density, tortuosity and the PCE plume are estimated using the new criterion χi in the following study.
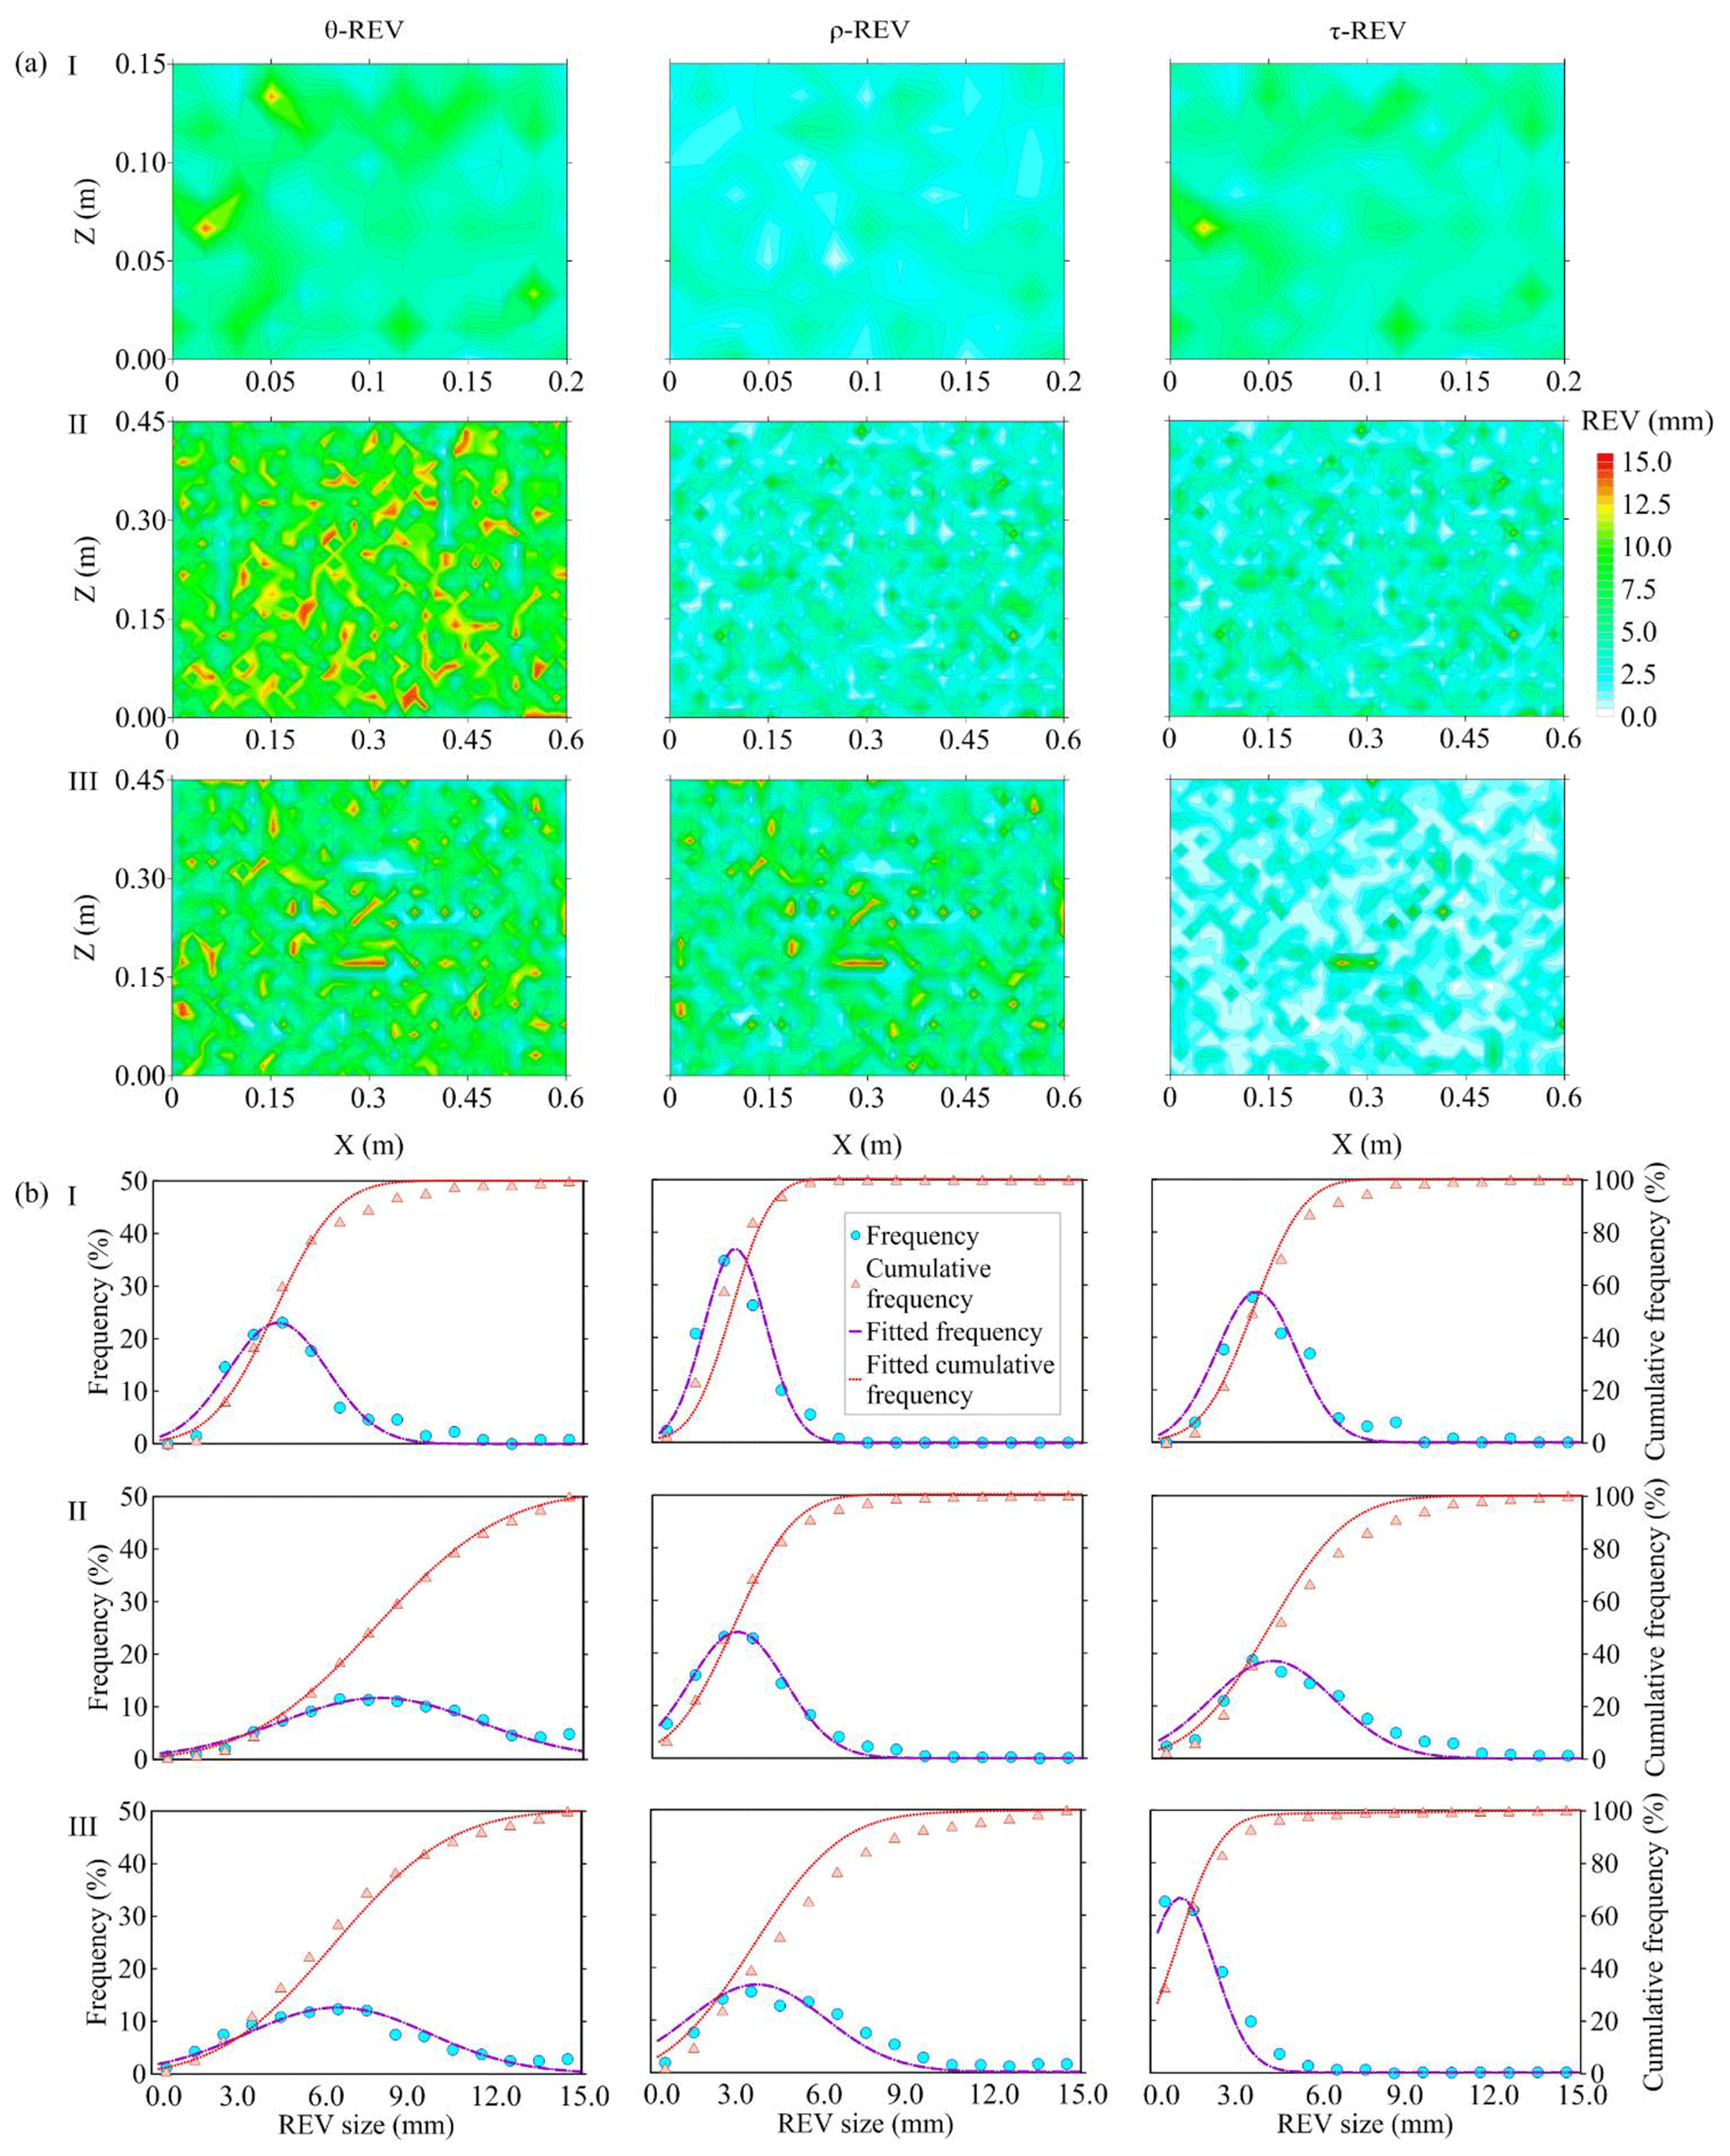
Figure 5(a) The distributions of minimum REV sizes of porosity, sand density, and tortuosity for Experiments I–III; (b) the frequency of minimum REV sizes of experiments and fitted models.
In fact, a large number of discretized cells in the 2D translucent silica for the three experiments are quantified using the new criterion χi, which is convenient for examining the regularities for REV sizes and related factors. Using the new criterion χi, the REV estimation is conducted based on Eq. (18). Figure 5a shows minimum REV sizes of porosity, density and tortuosity quantified by χi for all cells of the three experiments. Associated statistical analysis for REVs is illustrated in Fig. 5b, where circular points represent frequency and triangular points represent cumulative frequency. Frequency of REVs is dense in the middle and sparse on both sides, so the distribution of REVs can be fitted by a Gaussian equation:
where F is the frequency of REV; ω, ϵ and ν are fitted parameters of the model.
After regression analysis, the derived models for REV frequency are listed in Table 2. The coefficients of determination (R2) of models for REVs of porosity and density for the three experiments all exceed 0.85. R2 for the REV of tortuosity for the three experiments exceeds 0.76. Moreover, the computed cumulative frequency based on models fits cumulative frequency from experimental results well in Fig. 5b.
Table 2The fitted parameters of the models of frequency for REVs of porosity, density, and tortuosity.

θ represents porosity, ρ represents density, and τ represents tortuosity; ω, ϵ, and ν are fitted parameters of the model.
The minimum REV size frequency of porosity appears as a peak between 4.0 and 5.0 mm for Experiment I. As the minimum REV size of porosity increases, the corresponding frequency continuously decreases. Further, a smooth convex shape of cumulative frequency is observed for the minimum REV size of porosity (Fig. 5b). Most minimum REV sizes of translucent silica are distributed within 0.0–7.0 mm. For density of translucent silica sand, the associated REV frequency has high values between 2.0 and 3.0 mm. For the REV sizes of tortuosity, minimum REV sizes are distributed within 0.0–6.0 mm. Compared with Experiment I (F40/50 mesh translucent silica sand), the frequency of REVs for Experiment II (F20/30 mesh translucent silica sand with larger porosity) shows a flat shape and has a larger value of standard deviation, especially for REVs of porosity. Figure 5b shows that translucent silica with larger porosity will achieve a border distribution of minimum REV size distribution compared to translucent silica with a relatively lower porosity. Moreover, the frequency of REVs of porosity and permeability for Experiment III (background material is F20/30 mesh translucent silica sand with larger porosity; five lenses with lower porosity are packed in a sandbox to create heterogeneity) is similar to the frequency of REVs for Experiment II. However, the frequency of τ-REV for Experiment III is different from the frequency of τ-REV for Experiment II under a homogeneous condition. The mean REV sizes of porosity, density and tortuosity for Experiment I are 4.35, 2.89 and 3.65 mm, respectively. All mean REV sizes of these variables for Experiment II are larger than REVs of Experiment I, whose corresponding mean REV sizes are 8.05, 2.97 and 4.30 mm. These results suggest translucent porous media with higher porosity lead to larger values of mean and standard deviation for REV sizes.
3.3 REVs of So and AOW for the PCE plume
Based on the new criterion χi and the light transmission technique, the real-time distributions of So-REV and AOW-REV for the PCE plume can be obtained over the entire experimental period. The minimum REV sizes of So and AOW obtained using the new criterion χi are shown in Fig. 6a and b. When PCE migrates in the sandbox, the REV of the PCE plume is changed over time (Fig. 6). The REVs of the PCE plume for Experiment I mostly are lower than the REVs of the PCE plume for Experiments II and III. Moreover, when heterogeneous porous media are packed in the sandbox, the REV distribution of Experiment III becomes more heterogeneous compared with the REV distribution of Experiment II under a homogeneous condition. Based on REV distributions of the PCE plume for the three experiments, statistical analysis is conducted to explore the regularity of the REV distribution for the PCE plume.
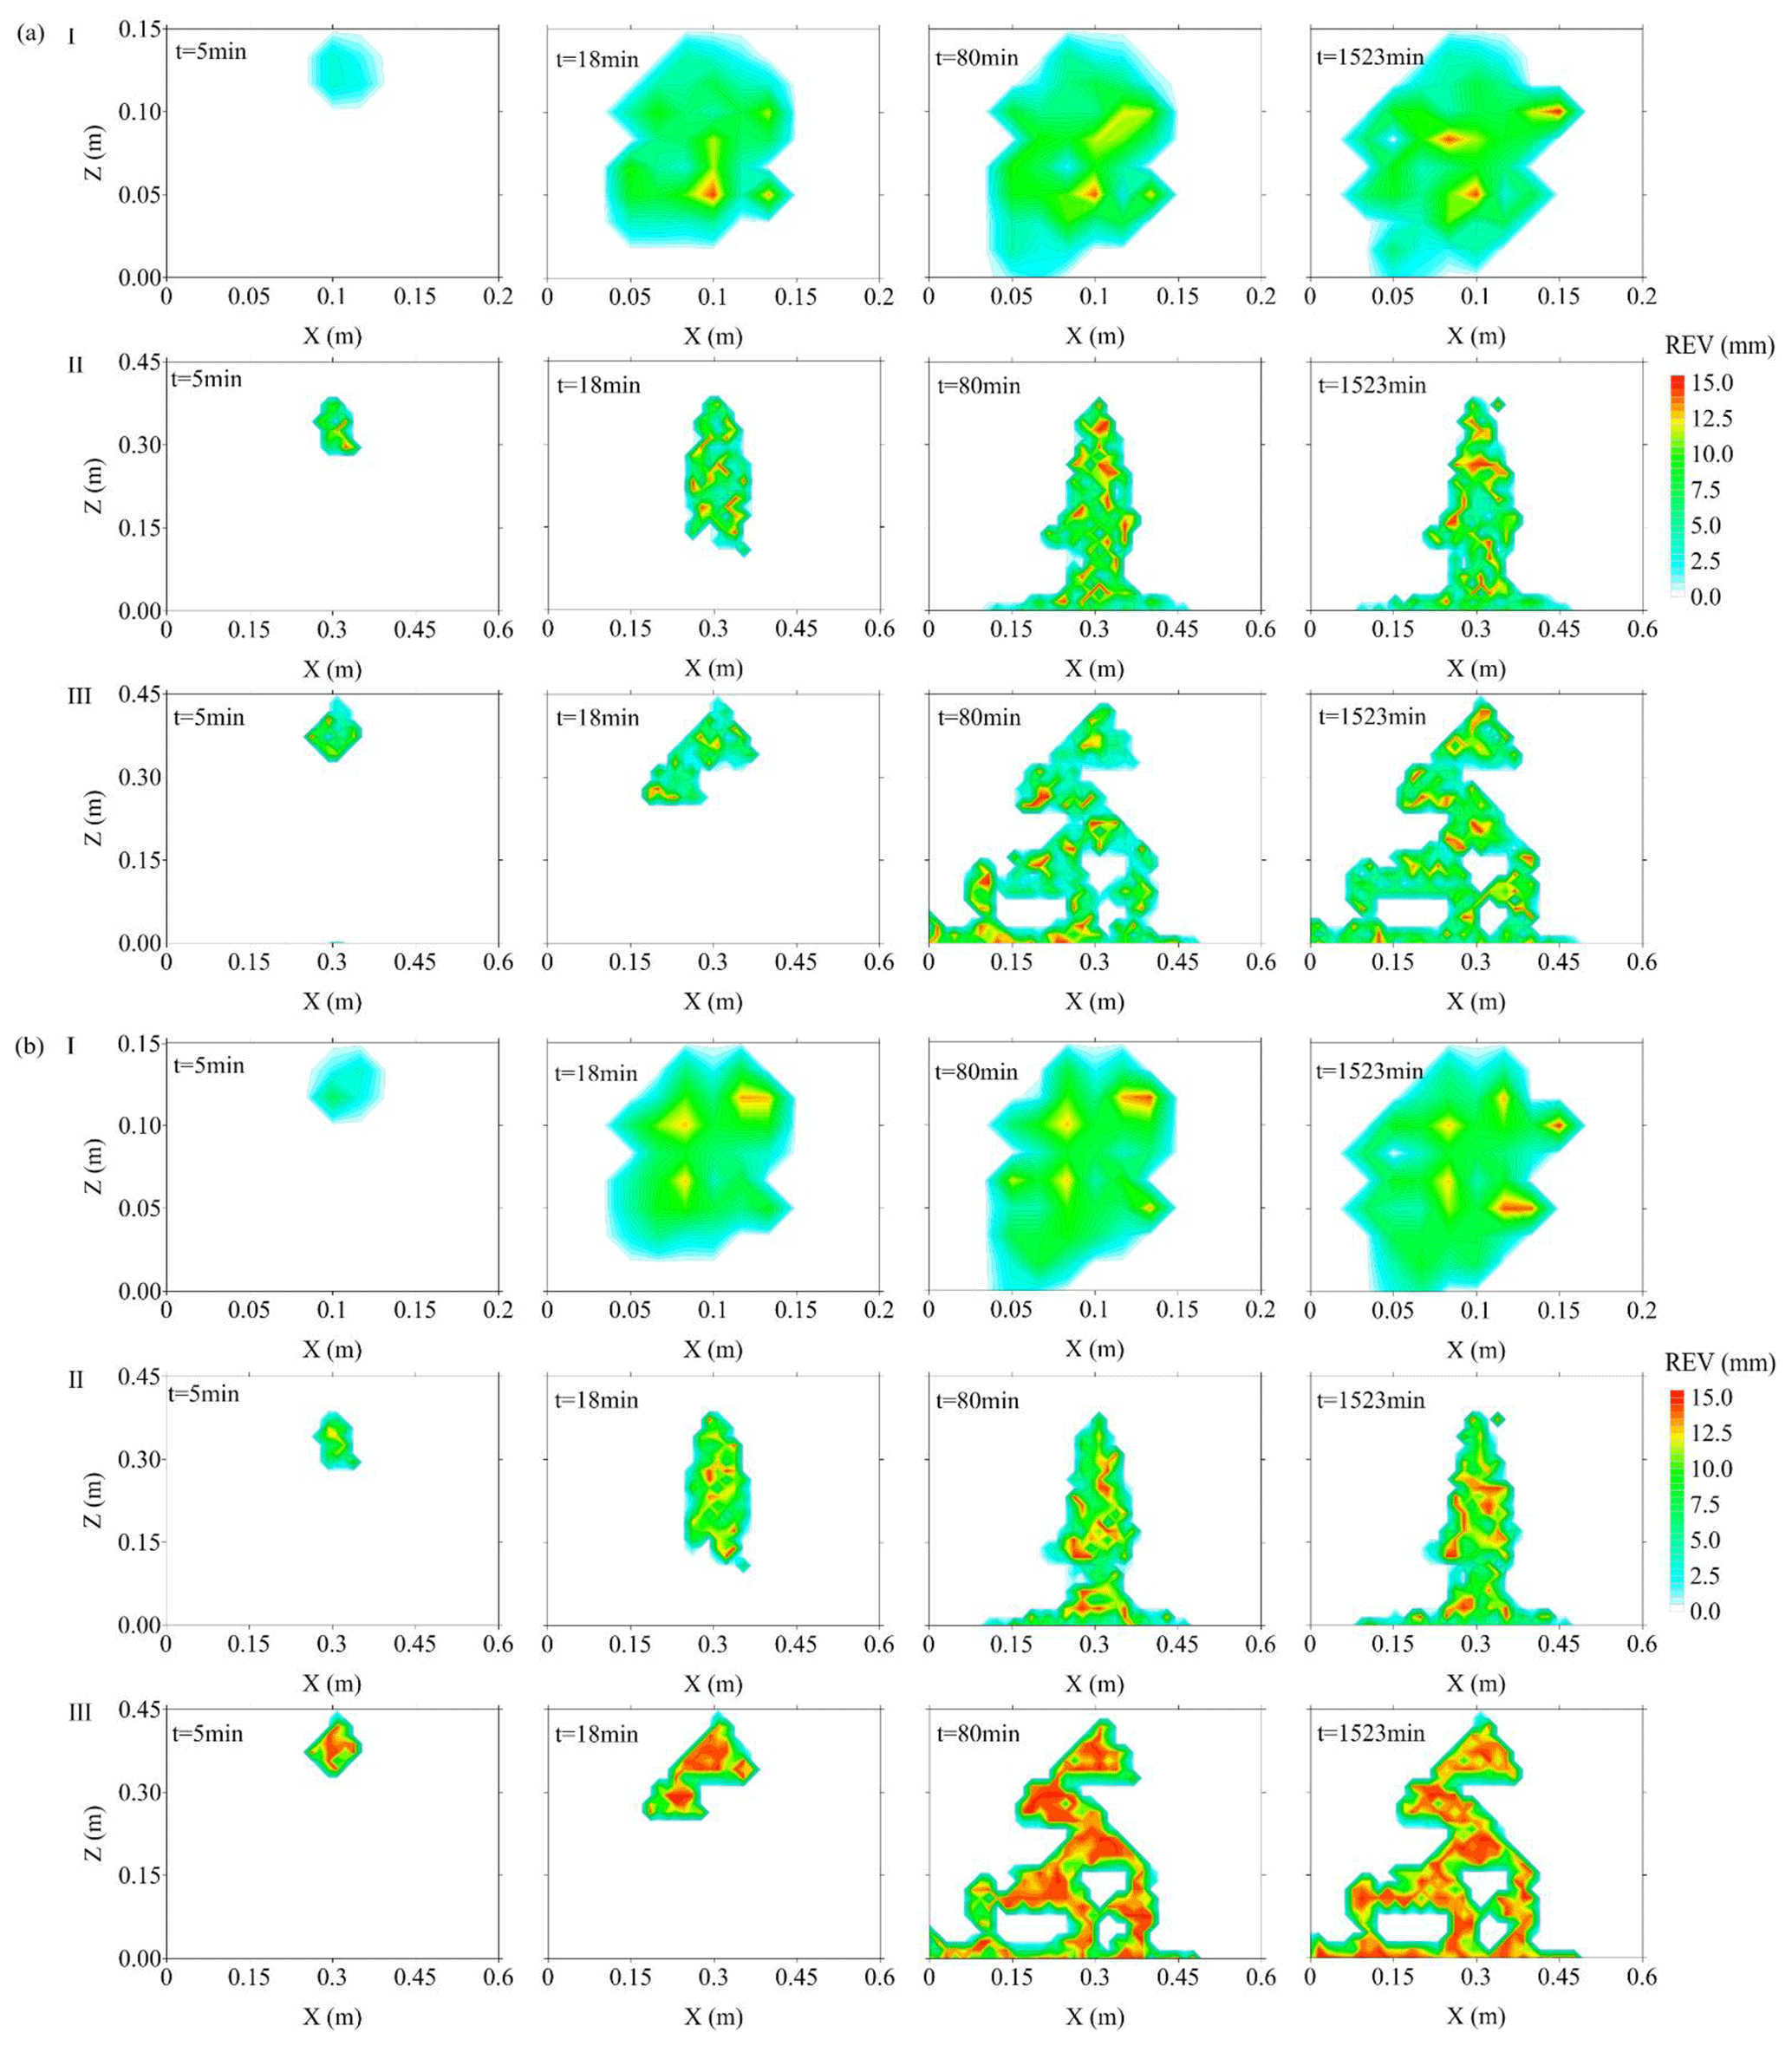
Figure 6(a) The distributions of So-REV sizes during 0–1523 min for Experiments I–III; (b) the distributions of AOW-REV sizes during 0–1523 min for Experiments I–III.
The mass center coordinates of the PCE plume, GTP and plume area are shown in Fig. 7a. The values of Xm, Zm and GTP for Experiments II and III are higher than the Xm, Zm and GTP of Experiment I (lower porosity). Moreover, the plume area of Experiment II is larger than the plume of Experiment I. When packed material is heterogeneous, the plume area of PCE is increased further for Experiment III. Besides, the mean and standard deviation of REVs of the PCE plume during 0–1523 min are derived by statistical analysis (Fig. 7a). Compared with REVs of the PCE plume for Experiment I, Experiment II (F20/30 mesh translucent silica sand with higher porosity) has larger values of the mean and standard deviation of REVs. The mean value of AOW-REV for Experiment III is much higher than AOW-REV for Experiments I and II.

Figure 7(a) The mass center coordinate of the PCE plume, GTP, plume area and the mean and standard deviation of So-REV and AOW-REV during 0–1523 min; (b) the change in average REV size as the distance dI, dm increases and the fitted relationship between REV sizes and So for Experiments I and II.
The average value of REVs () and the associated distance (dm) from the mass center to the corresponding cells contained in the PCE plume at t=1523 min are presented in Fig. 7b. Regression analysis is performed for average REVs of the PCE plume and dm, where fitted models and the associated R2 for Experiments I–III are listed in Table 3. Simultaneously, the fitted equations between and dI (the distance from injection point to cell contained in the PCE plume) are also derived by regression analysis. From the results in Fig. 7a, of So and AOW appear as a peak and then decrease with increasing dm and dI for Experiment I. of So and AOW for Experiment I all firstly increase and then decrease with the increasing dm and dI. However, of So presents an apparent decreasing tendency as dm and dI increase for Experiment II, and of AOW just slightly increases first and then decreases for Experiment II. In addition, the value of AOW-REV mostly is higher than the value of So-REV for the three experiments. Compared with the R2 of the fitted relationship between average REVs of the PCE plume and dm, dI for Experiments I and II, the values of R2 achieved by Experiment III are much lower (Table 3).
Table 3The fitted equations between average values of REV and dI, dm.
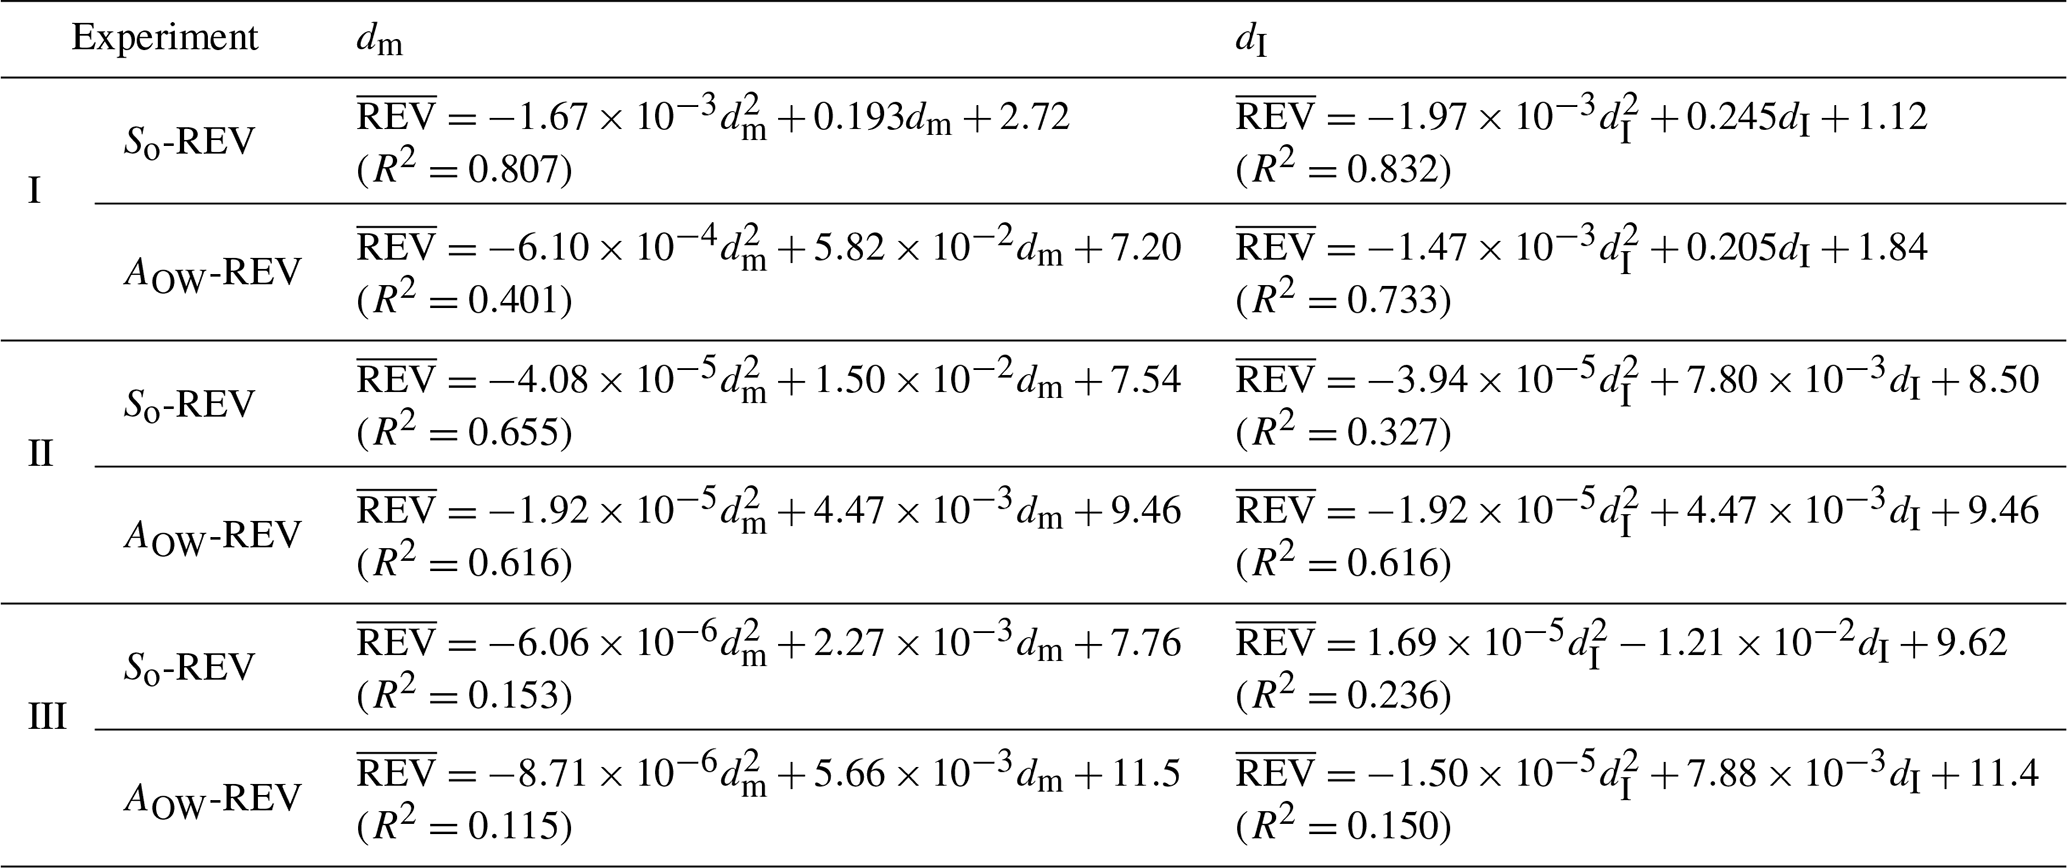
is the average value of REV size, dm is the distance from the mass center of the PCE plume to the cell contained in the PCE plume, and dI is the distance from the injection point to the cell contained in the PCE plume.
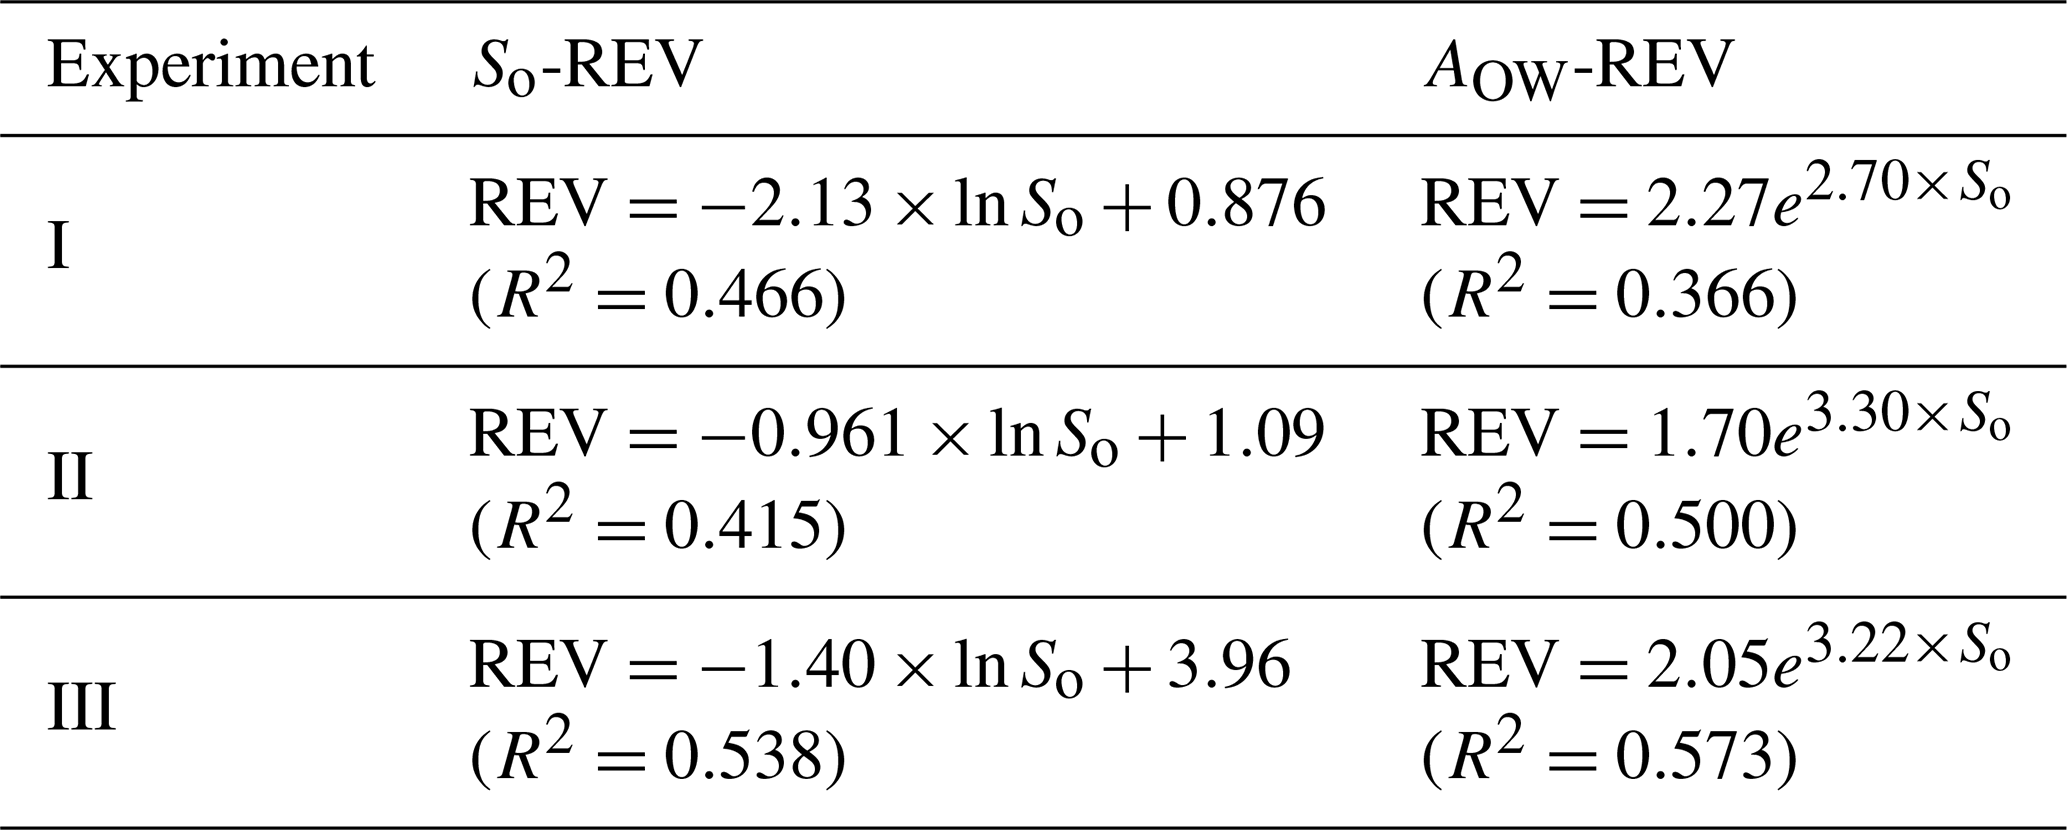
Besides, the relationship between REVs and PCE saturation is fitted by regression analysis, where the fitted equation and R2 for the three experiments are listed in Table 4 and Fig. 7b. With increasing PCE saturation, REVs of So show a declining trend for the three experiments. However, the REV of AOW increases when So increases for all three experiments (Fig. 7b). On the other hand, the REV of So for Experiment II is higher than the corresponding REV for Experiment I, while Experiments I and II have similar values of AOW-REV (Fig. 7b). Moreover, the REVs of So and AOW for Experiment III are higher than the REVs of So and AOW for Experiments I and II. These results suggest higher porosity will lead to a high value of So-REV and the relationship between REVs of the PCE plume and dm, dI. So-REV and AOW-REV are increased under heterogeneous conditions.
In this study, a new criterion χi is proposed to identify the REVs of translucent porous media and inner contaminant transformation based on previous criteria. The REV plateaus of observation cells selected from the three experiments of PCE transport are hard to judge visually from the porosity and PCE saturation curves. From the REV identification effects of different criteria, the REV flat plateau is difficult to identify by the coefficient of variation () and entropy dimension (DIi), indicating the coefficient of variation () and entropy dimension (DIi) are not suitable for REV estimation of translucent porous media. The relative gradient error () can make REV plateaus of all kinds of translucent silica explicit in variation curves, but random fluctuations weaken REV plateau identification. In comparison with these previous criteria, the beginning and ending of the REV flat plateaus could be easily and directly identified in the curves based on the new criterion χi, suggesting the new criterion χi is more convenient and effective for REV estimation. In this study, REVs of porosity, density, tortuosity, and the PCE plume are estimated using the new criterion χi.
Statistical results of minimum REV scales quantified by the new criterion χi reveal that cumulative frequencies of porosity, density and tortuosity all have smooth convex shapes. Models based on the Gaussian equation are built for the distribution of REVs of porosity, density and tortuosity, whose porous media with larger porosity lead to larger values of mean and standard deviation for REV sizes of media properties. For REVs of the PCE plume, the result suggested larger porosity leads to a larger value of mean and standard deviation. Regression analysis is performed to study the regularity for distribution of REVs, where the fitted relationship between REVs and dm, dI is derived for the PCE plume. of So and AOW firstly increases and then decreases with the increasing dm and dI for Experiment I, whose sandbox is packed with translucent porous media with relatively lower porosity. However, of So and AOW directly decreases with the increment of dm and dI when porosity becomes larger for Experiment II. The values of R2 of the fitted relationship between average REVs of the PCE plume and dm, dI for Experiment III are much lower under heterogeneous conditions. Significantly, the REV size of So presented a decreasing trend as So increases, while an increasing tendency appeared for an REV size of AOW. Through regression analysis, the fitted equations between REVs of the PCE plume and PCE saturation are derived for the three experiments. Implications of these findings are essential for quantitative investigation of the scale effect of porous media and contaminant transformation. The fluid migration and transform in porous media can be simulated accurately according to the REV estimation results using the light transmission technique and the appropriate criterion χi.
The codes and data for this paper are available by contacting the corresponding author at jfwu@nju.edu.cn.
MW and JiaW were responsible for the conceptualization, methodology, and writing of the paper. JicW was responsible for its conceptualization. BXH was responsible for the conceptualization and writing of the paper.
The authors declare that they have no conflict of interest.
The authors are profoundly grateful to the editor Zhongbo Yu and three anonymous referees, whose constructive comments led to significant improvement of the manuscript.
This research has been supported by the National Key Research and Development Plan of China (grant nos. 2019YFC1805302 and 2016YFC0402800), the National Natural Science Foundation of China (grant nos. 41730856, 41902246 and 41772254), the Natural Science Foundation of Guangdong Province (grant no. 2020A1515010447), and the Fundamental Research Funds for the Central Universities (grant no. 14380105).
This paper was edited by Zhongbo Yu and reviewed by three anonymous referees.
Al-Raoush, R.: Change in Microstructure Parameters of Porous Media Over Representative Elementary Volume for Porosity, Part. Sci. Technol., 30, 1–16, 2012.
Al-Raoush, R. and Papadopoulos, A.: Representative elementary volume analysis of porous media using X-ray computed tomography, Power Technol., 200, 60–77, 2010.
Bai, L., Wang, X., Chen, Q., Ye, Y., Zheng, H., Guo, J., Yin, Y., and Gao, C.: Explaining the Size Dependence in Platinum-Nanoparticle-Catalyzed Hydrogenation Reactions, Angew. Chem. Int. Ed., 55, 15656–15661, 2016.
Bob, M. M., Brooks, M. C., Mravik, S. C., and Wood, A. L.: A modified light transmission visualization method for DNAPL saturation measurements in 2-D models, Adv. Water Resour., 31, 727–742, 2008.
Borges, J. A. R. and Pires, L. F.: Representative elementary area (REA) in soil bulk density measurements through gamma ray computed tomography, Soil Till. Res., 123, 43–49, 2012.
Borges, J. A. R., Pires, L. F., Cássaro, F. A. M., Roque, W. L., Heck, R. J., Rosa, J. A., and Wolf, F. G.: X-ray microtomography analysis of representative elementary volume (REV) of soil morphological and geometrical properties, Soil Till. Res., 182, 112–122, 2018.
Bouvry, B., del Campo, L., Meneses, D. D. S., Rozenbaum, O., Echegut, R., Lechevalier, D., Gaubil, M., and Echegut, P.: Hybrid methodology for retrieving thermal radiative properties of semi-transparent ceramics, J. Phys. Chem. C, 120, 3267–3274, 2016.
Brown, G. O. and Hsieh, H. T.: Evaluation of laboratory dolomite core sample size using representative elementary volume concepts, Water Resour. Res., 36, 1199–1207, 2000.
Corbett, P. W. M. and Jensen, J. L.: Estimating the mean permeability: how many measurement do we need?, First Break, 10, 89–94, 1992.
Costanza-Robinson, M. S., Estabrook, B. D., and Fouhey, D. F.: Representative elementary volume estimation for porosity, moisture saturation, and air-water interfacial areas in unsaturated porous media: Data quality implication, Water Resour. Res., 47, W07513, https://doi.org/10.1029/2010WR009655, 2011.
Erning, K., Grandel, S., Dahmke, A., and Schäfe, D.: Simulation of DNAPL infiltration and spreading behavior in the saturated zone at varying flow velocities and alternating subsurface geometries, Environ. Earth Sci., 65, 1119–1131, 2012.
Esfandiar, A., Radha, B., Wang, F. C., Yang, Q., Hu, S., Garaj, S., Nair, R. R., Geim, A. K., and Gopinadhan, K.: Size effect in ion transport through angstrom-scale slits, Science, 358, 511–513, 2017.
Fernandes, J. S., Appoloni, C. R., and Fernandes, C. P.: Determination of the Representative Elementary Volume for the study of sandstones and siltstones by X-Ray microtomography, Mater. Res., 15, 662–670, 2012.
Ghilardi, P., Kai, A. K., and Menduni, G.: Self-similar heterogeneity in granular porous media at the representative elementary volume scale, Water Resour. Res., 29, 1205–1214, 1993.
Gilevska, T., Passeport, E., Shayan, M., Seger, E., Lutz, E. J., West, K. A., Morgan, S. A., Mack, E. E., and Lollar, B. S.: Determination of in situ biodegradation rates via a novel high resolution isotopic approach in contaminated sediments, Water Res., 149, 632–639, 2019.
Hendrick, A. G., Erdmann, R. G., and Goodman, M. R.: Practical Considerations for Selection of Representative Elementary Volumes for Fluid Permeability in Fibrous Porous Media, Transp. Porous Med., 95, 389–405, 2012.
Kang, Q. J., Zhang, D. X., and Chen, S. Y.: Simulation of dissolution and precipitation in porous media, J. Geophys. Res., 108, 2505, https://doi.org/10.1029/2003JB002504, 2003.
Kim, J. and Mohanty, B. P.: Influence of lateral subsurface flow and connectivity on soil water storage in land surface modeling, J. Geophys. Res.-Atmos., 121, 704–721, 2016.
Lei, S., and Shi, Y.: Separate-phase model and its lattice Boltzmann algorithm for liquid-vapor two-phase flows in porous media, Phys. Rev. E, 99, 053302, https://doi.org/10.1103/PhysRevE.99.053302, 2019.
San José Martínez, F., Caniego, F. J., García-Gutiérrez, C., and Espejo, R.: Representative elementary area for multifractal analysis of soil porosity using entropy dimension, Nonlin. Processes Geophys., 14, 503–511, https://doi.org/10.5194/npg-14-503-2007, 2007.
Müller, C. and Siegesmund, S.: Evaluation of the representative elementary volume (REV) of a fractured geothermal sandstone reservoir, Environ. Earth Sci., 61, 1713–1724, 2010.
Niemet, M. R. and Selker, J. S.: A new method for quantification of liquid saturation in 2D translucent porous media systems using light transmission, Adv. Water Resour., 24, 651–666, 2001.
Nordahl, K. and Ringrose, P. S.: Identifying the Representative Elementary Volume for permeability in heterolithic deposits using numerical rock models, Math. Geosci., 40, 753–771, 2008.
Pereira Nunes, J. P., Blunt, M. J., and Bijeljic, B.: Pore-scale simulation of carbonate dissolution in micro-CT images, J. Geophys. Res.-Solid, 121, 558–576, 2016.
Piccoli, I, Schjønning, P., Lamandé, M., Zanini, F., and Morari, F.: Coupling gas transport measurements and X-ray tomography scans for multiscale analysis in silty soils, Geoderma, 338, 576–584, 2019.
Razavi, M. R., Muhunthan, B., and Al Hattamleh, O.: Representative elementary volume analysis of sands using x-ray computed tomography, Geotech. Test J., 30, 212–219, 2007.
Rozenbaum, O. and du Roscoat, S. R.: Representative elementary volume assessment of three-dimensional x-ray microtomography images of heterogeneous materials:Application to limestones, Phys. Rev. E, 89, 053304, https://doi.org/10.1103/PhysRevE.89.053304, 2014.
Teruel, F. E. and Rizwan-uddin: Numerical computation of macroscopic turbulence quantities in representative elementary volumes of the porous medium, Int. J. Heat Mass Transfer., 53, 5190–5198, 2010.
Ukrainczyk, N. and Koenders, E. A. B.: Representative elementary volumes for 3D modeling of mass transport in cementitious materials, Model. Simul. Mater. Sci. Eng., 22, 035001, https://doi.org/10.1088/0965-0393/22/3/035001, 2014.
Wang, L., Mi, J., and Guo, Z.: A modified lattice Bhatnagar–Gross–Krook model for convection heat transfer in porous media, Int. J. Heat Mass Transfer., 94, 269–291, 2016.
Wang, S., Elsworth, D., and Liu, J.: A mechanistic model for permeability evolution in fractured sorbing media, J. Geophys. Res., 117, B06205, https://doi.org/10.1029/2011JB008855, 2012.
Wu, M., Wu, J. F., and Wu, J. C.: Simulation of DNAPL migration in heterogeneous translucent porous media based on estimation of representative elementary volume, J. Hydrol., 553, 276–288, 2017.
Wu, M., Wu, J., Wu, J., and Hu, B. X.: Effects of microarrangement of solid particles on PCE migration and its remediation in porous media, Hydrol. Earth Syst. Sci., 22, 1001–1015, https://doi.org/10.5194/hess-22-1001-2018, 2018.