the Creative Commons Attribution 4.0 License.
the Creative Commons Attribution 4.0 License.
 | 11 Dec 2020
New measures of deep soil water recharge during the vegetation restoration process in semi-arid regions of northern China
Xinle Li
Yunqi Wang
Hongbin Zhan
Wenbin Yang
Qunou Jiang
Desertification in semi-arid regions is currently a global environmental and societal problem. This research attempts to understand whether a 40-year-old rain-fed Artemisia sphaerocephala Krasch sand-fixing land as part of the Three North Shelterbelt Program (3NSP) of China can be developed sustainably or not using a newly designed lysimeter to monitor the precipitation-induced deep soil recharge (DSR) at 220 cm of depth. Evapotranspiration is calculated through a water balance equation when precipitation and soil moisture data are collected. A comparison of soil particle sizes and soil moisture distributions in artificial sand-fixing land and neighboring bare land is made to assess the impact of sand-fixing reforestation. Results show that such a sand-fixing reforestation results in a root system being mainly developed in the horizontal direction and a changed soil particle distribution. Specifically, the sandy soil with 50.53 % medium sand has been transformed into a sandy soil with 68.53 % fine sand. Within the Artemisia sphaerocephala Krasch sand-fixing experimental area, the DSR values in the bare sand plot and Artemisia sphaerocephala Krasch plot are respectively 283.6 and 90.6 mm in wet years, reflecting a difference of more than 3 times. The deep soil layer moisture in semi-arid sandy land is largely replenished by precipitation-induced infiltration. The DSR values of the bare sandy land plot and Artemisia sphaerocephala Krasch plot are respectively 51.6 and 2 mm in dry years, a difference of more than 25 times. The proportions of DSR reduced by Artemisia sphaerocephala Krasch are 68.06 % and 96.12 % in wet and dry years, respectively. This research shows that Artemisia sphaerocephala Krasch in semi-arid regions can continue to grow and has the capacity to fix sand. It consumes a large amount of precipitated water and reduces the amount of DSR considerably.
- Article
(1767 KB) - Full-text XML
- BibTeX
- EndNote


Desertification is currently a global environmental and societal concern (Reynolds et al., 2007b). Arid regions cover about 41 % of the Earth's surface and support more than 38 % of the world's population. A total of 20 % of these areas have experienced serious land degradation, which is expected to affect the survival of 250 million people (Reynolds et al., 2007a; Dregne and Chou, 1992; D'Odorico et al., 2013). In 1992, the United Nations adopted the International Convention to Combat Desertification in order to focus on desertification issues (Bestelmeyer et al., 2015). With no exception, China is also facing severe desertification problems (Liu and Diamond, 2005). Up to 2010, the total desertification area in China was 2 623 700 km2, which is 27.33 % of the country's entire land area. Within this percentage, the arid region desertification area is 1 158 600 km2 (44.16 % of the total desertification area of China), the semi-arid region desertification area is 971 600 km2 (37.03 % of the total desertification area of China), and the sub-humid arid region desertification area is 493 500 km2 (18.81 % of the total desertification area of China). To battle desertification, an effective prevention and control measure is to build shelterbelts using artificial sand-fixing vegetation (Tao, 2014).
The Three North Shelterbelt Program (3NSP), a reforestation program initiated in 1978 in northeast, northwest, and northern China, is the largest shelterbelt project in China (Wang et al., 2004, 2010b). It has been constructed for 40 years and plays a key role in desertification prevention in northeast, northwest, and northern China (Li et al., 2004). The shelterbelts of 3NSP have slowed down, halted, and even reversed the desertification process in northern China (Zha and Gao, 1997; Wang et al., 2012). According to NASA's latest observations, the restoration of vegetation has shown some signs of reversing the trend of desertification in China, accounting for a quarter of the Earth's new green areas (Chen et al., 2019).
It is unquestionable that the implementation of 3NSP in China has reduced aeolian erosion and improved the overall living environment in the impacted regions (Hanjie and Hao, 2003). However, it is undeniable that poor choices of vegetation species in some areas of 3NSP have resulted in consumption of a large amount of water resources, causing a shortage of water supply to meet other needs and thus threatening the sustainable development of the regions (Wang et al., 2010a). Furthermore, a high planting density in some areas resulted in the death and/or malfunction of a large number of trees (Duan et al., 2011). In contrast, shrubs and herb sand-fixing vegetation appear to grow healthily, thus receiving great interest to become proper choices of vegetation species for desertification prevention (Tao, 2014). The infiltration process is also closely related to the development of plant roots; the distribution depth and development direction of roots in the soil are related to precipitation infiltration (Fan et al., 2017).
To understand the impact of afforestation on the ecohydrological system is thus to assess long-term sustainability, especially after vegetation reconstruction (Cheng et al., 2020a). Soil water is the most important factor in this system, and thus we need to know how the soil moisture changes in these areas (Cheng et al., 2020b). Evapotranspiration (ET) is also an important ecological indicator in semi-arid regions, and methods of directly measuring ET include a lysimeter, the eddy correlation method, the Bowen ratio method, and the large-aperture scintillation method (Billesbach and Meteorology, 2011; Maes et al., 2019). Taking the most advanced eddy correlation method as an example, the measurement error may be 20 % or higher, and the required monitoring conditions are quite demanding (Burba and Anderson, 2005). Furthermore, it is difficult to avoid the influence of human factors on the experimental results. In this research, we try to solve these problems; we select a typical semi-arid area in 3NSP for this research. Artemisia sphaerocephala Krasch (ASK) is a unique Chinese native sand-fixing shrub plant with strong adaptability (Wang et al., 2013). ASK sand-fixing land developed on top of bare sandy land has increased evapotranspiration. Meanwhile, because of an organic-rich biofilm commonly seen in ASK forest, the near-surface soil permeability has been reduced (Su and Lin Zhao, 2003). This will reduce the soil infiltration capacity, resulting in the concentration of soil moisture in shallow soils and reducing the replenishment of soil moisture in deep soils. In order to understand the soil moisture variation and deep soil recharge (DSR) changes resulting from ASK sand-fixing forest, this research uses a 40-year-old ASK sand-fixing land as the experimental site and a newly designed lysimeter to directly measure the DSR. We have also conducted comparative research using a bare sandy land 400 m away from the ASK sand-fixing land site. This research focuses on monitoring precipitation-induced infiltration, soil moisture distribution, and DSR changes in ASK sand-fixing land. We then calculate the annual change in ET on a small scale according to the principle of water balance. We try to answer the following questions through in situ measured results: (1) does the vegetation reconstruction block the mutual conversion of atmospheric water, surface water, soil water, and groundwater? (2) How much influence does vegetation reconstruction have on precipitation infiltration and DSR? (3) Is this kind of vegetation reconstruction sustainable in northern China?
2.1 Research area description
Figure 1 shows the research site, which is located in Ejin Horo Banner on the eastern margin of the Mu Us sandy land in the Ordos basin of China, with a geographic location of 39∘05′02.8 N, 109∘35′37.9 E and an altitude of 1303 m a.m.s.l. (above mean sea level). The groundwater table between sand dunes is 5.3–6.8 m below the ground surface. The climate is within the semi-arid continental monsoon climate zone. Annual precipitation is concentrated from July to September and is highly sporadic. The average annual precipitation from 1960 to 2010 is 358.2 mm (Li et al., 2009). The average annual temperature of this area is 6.5∘, with about 151 d of frost-free season, and the lowest temperature is −31.4∘. The average annual potential evapotranspiration is 1809 mm, the average annual sunshine is 2900 h, and the average annual wind speed is 3.24 m s−1. The research area is located in relatively gentle mobile dunes, and the soil type is aeolian sandy soil (Liu et al., 2015).

Figure 1Overview of the experimental field.
The experimental site was flat sandy land before ASK was planted for sand control 40 years ago. After 40 years of development, the region is dominated by ASK, scattered Rhamnus parvifolia, Chenopodium glaucum, and Setaria viridis, and the field average vegetation coverage has reached 80 %. The site is relatively homogeneous, which brings convenience to the experiment so we can use one experimental observation result to represent the entire homogeneous site.
2.2 Experimental design
2.2.1 Root system distribution survey, soil moisture, and DSR monitoring
This research uses five ASK plants with similar heights and crown widths, for which the heights are around 60 cm above the ground. Using the whole root system excavation method, the plant soil is excavated layer by layer with a 20 cm vertical interval until there are no observable roots. As the deepest root is at a depth of 120 cm (the root system will be discussed in detail later in this section), the deepest soil moisture that the plant can utilize is 180 cm (120 cm root depth plus 60 cm capillary rise; the capillary rise is calculated based on the soil texture from the experimental plot) (Cheng et al., 2017). The 180 cm depth can be regarded as the maximal depth of evapotranspiration. A new lysimeter is used to measure the deep infiltration, or deep soil recharge (DSR), at a depth of 220 cm (to avoid root water absorption), 40 cm below the maximal depth of surface evapotranspiration. The newly designed lysimeter is improved on the basis of the traditional lysimeter, but it has a reduced size and a new water balance part to improve the measurement accuracy. As shown in Fig. 2, the measurement surface is transferred from the soil surface to soil layer at any designated depth. A detailed explanation of such a lysimeter has been documented in previous research by Cheng et al. (2017) and will not be repeated here. To understand the soil conditions at the research site, sandy soil samples were collected using a ring cut method, layer by layer with a 20 cm vertical interval, until reaching a 220 cm depth. Soil samples from five ASK plots were collected and mixed together, and soil particle size distribution measurements were conducted using a laser particle size analyzer (Mastersizer 2000, Salver, UK). We use an EC-5 soil moisture probe to measure every 20 cm soil layer of the first 100 cm of depth and every 40 cm of soil after the first 100 cm of depth until reaching 220 cm of depth. The reason for doing so is because the shallow soil layer has roots and is thus monitored more closely, while the deep soil is relatively uniform and has fewer roots, so it can be monitored more sparsely.

To study the soil water dynamics of the ASK plot, we selected a typical ASK plot in the Mu Us sandy land and an adjacent bare sandy plot for a comparison study to quantify the differences in the characteristics of soil water dynamics in the bare sandy plot and ASK plot. The experimental design is shown in Figs. 2 and 3 and explained sequentially as follows.
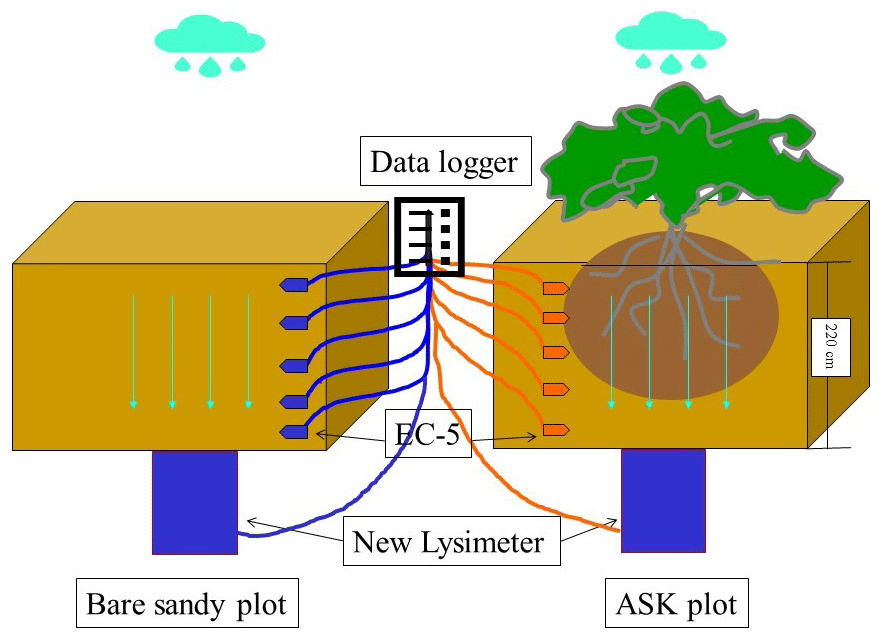
The conventional lysimeter uses an impermeable container (constructed all the way from the ground surface downward) to wrap the soil column, blocking the horizontal flow of the soil layer in the root zones. Meanwhile, if a conventional lysimeter is used, the vegetation needs to be transplanted into the container, so the soil structure and the vegetation root system will be disturbed. If the roots of the vegetation are too long, it is impossible to measure the DSR with a conventional lysimeter. The new lysimeter has an upper water balance part and a lower measurement part that can directly measure the water flux (Cheng et al., 2017b, 2018b). The height of the balance part is equal to the capillary water rising height of this sandy soil. After irrigation and standing still, the balance part will reach a balanced state in which the soil at the bottom is saturated, and the top is the highest distance that the capillary water can rise. Specifically, the flux infiltrating into the balance part at the depth of the measurement face should equal the flux exiting the balance part and entering the measurement part. There is no need to build an impervious container to wrap the vegetation tested for the new lysimeter above the measurement face. The plot is relatively homogeneous, so we can use one experimental observation result to represent the entire homogeneous field. The conventional lysimeter can measure the DSR of a plant, but the new lysimeter measures the DSR of a certain soil layer. For a relatively uniform plot, this measured DSR will be more accurate.
In order to minimize the disturbance of the original soil structure, we need to water both plots in advance before installing the instruments. Firstly, watering the soil in the test area makes the relatively dry sandy soil stable and easy to excavate, as the native dry sandy soil is relatively loose. Secondly, after watering the ASK plot, we started to excavate a soil profile vertically downward at a distance of 1 m from the main branch of ASK, reaching a depth of 3.2 m. After this, at the depth of 3.2 m, we excavated horizontally toward the location of the main branch of ASK to a distance about 1.3 m. Eventually, an area with a height of 1 m and a length and width of 0.3 m was excavated to install the lysimeter right below the main branch of ASK. By doing so, the distance from the ground surface to the top of the lysimeter was 220 cm, and the root system (which is less than 220 cm deep) was not disturbed. Meanwhile, as the plot had been watered to make the soil stable, no collapse of soil occurred during the installation of the lysimeter. Thirdly, after putting the lysimeter in place, we used in situ soil to backfill. During this process, one needs to continuously water each layer of backfill to ensure that the soil is relatively compact. For the installation of the lysimeter in the bare sand plot, it is straightforward as one does not need to worry about disturbance to the integrity of the root system. For such a plot, as shown in Fig. 3, one can water the soil first, then excavate a square of 1 m by 0.3 m to a depth of 3.2 m to install the lysimeter. After the installation of the lysimeter, one can backfill using native soil, making sure to continuously water each layer of backfill to ensure soil compaction. Soil moisture probes were installed at different depths for both plots. Finally, it is important to wait for the watered plots to stabilize to their pre-excavation status, since a pre-watered sandy plot and excavated sand layer will take 6 months to settle down and meet the requirements of the experiment. Then one can start the experiments. There is a notable limitation of this new lysimeter that should be improved in the future. When measuring DSR, a gauge with a measurement accuracy of 0.2 mm was used to automatically record the amount of DSR. The measuring mechanism of this gauge requires the accumulated amount of DSR to reach a certain amount (0.2 mm), which is the downward volumetric flux over a unit area over a certain time lapse, then a data point will be recorded. When the amount of DSR is large or there is continuous DSR, there will be no measurement problem, but when DSR is very small (less than 0.2 mm), it is impossible to precisely know the DSR variation over that time lapse. In the future, we need a more sensitive measuring apparatus that can precisely record the DSR variation with time at a higher precision.
2.2.2 Water balance of rain-fed ASK forest land
When precipitation reaches the ground surface in semi-arid sandy land, the infiltration rate is usually unpredictable; it may evaporate, run away, or infiltrate. Years of observational records in the area show no occurrence of surface runoff (Cheng et al., 2020b). The water infiltrating into the soil goes through a redistribution process. Part of it is absorbed and utilized by plant root systems, and part of it is stored in soils as soil moisture. The rest will infiltrate, passing the maximal depth of evapotranspiration, and eventually recharge the groundwater system. This research uses the following water balance method to calculate moisture distribution at different depths:
where P is annual precipitation (mm) measured by a rain gauge as the volume per square meter, Cm is soil volumetric moisture content (m3 m−3), d is soil column depth to be measured (mm), DSR is annual deep soil recharge (mm) measured by the newly designed lysimeter as the volume per square meter, E is annual evapotranspiration (mm), which is the volume of water lost to the atmosphere due to evapotranspiration per square meter, and W is the annual soil moisture storage change per square meter (mm).
3.1 Root system distribution
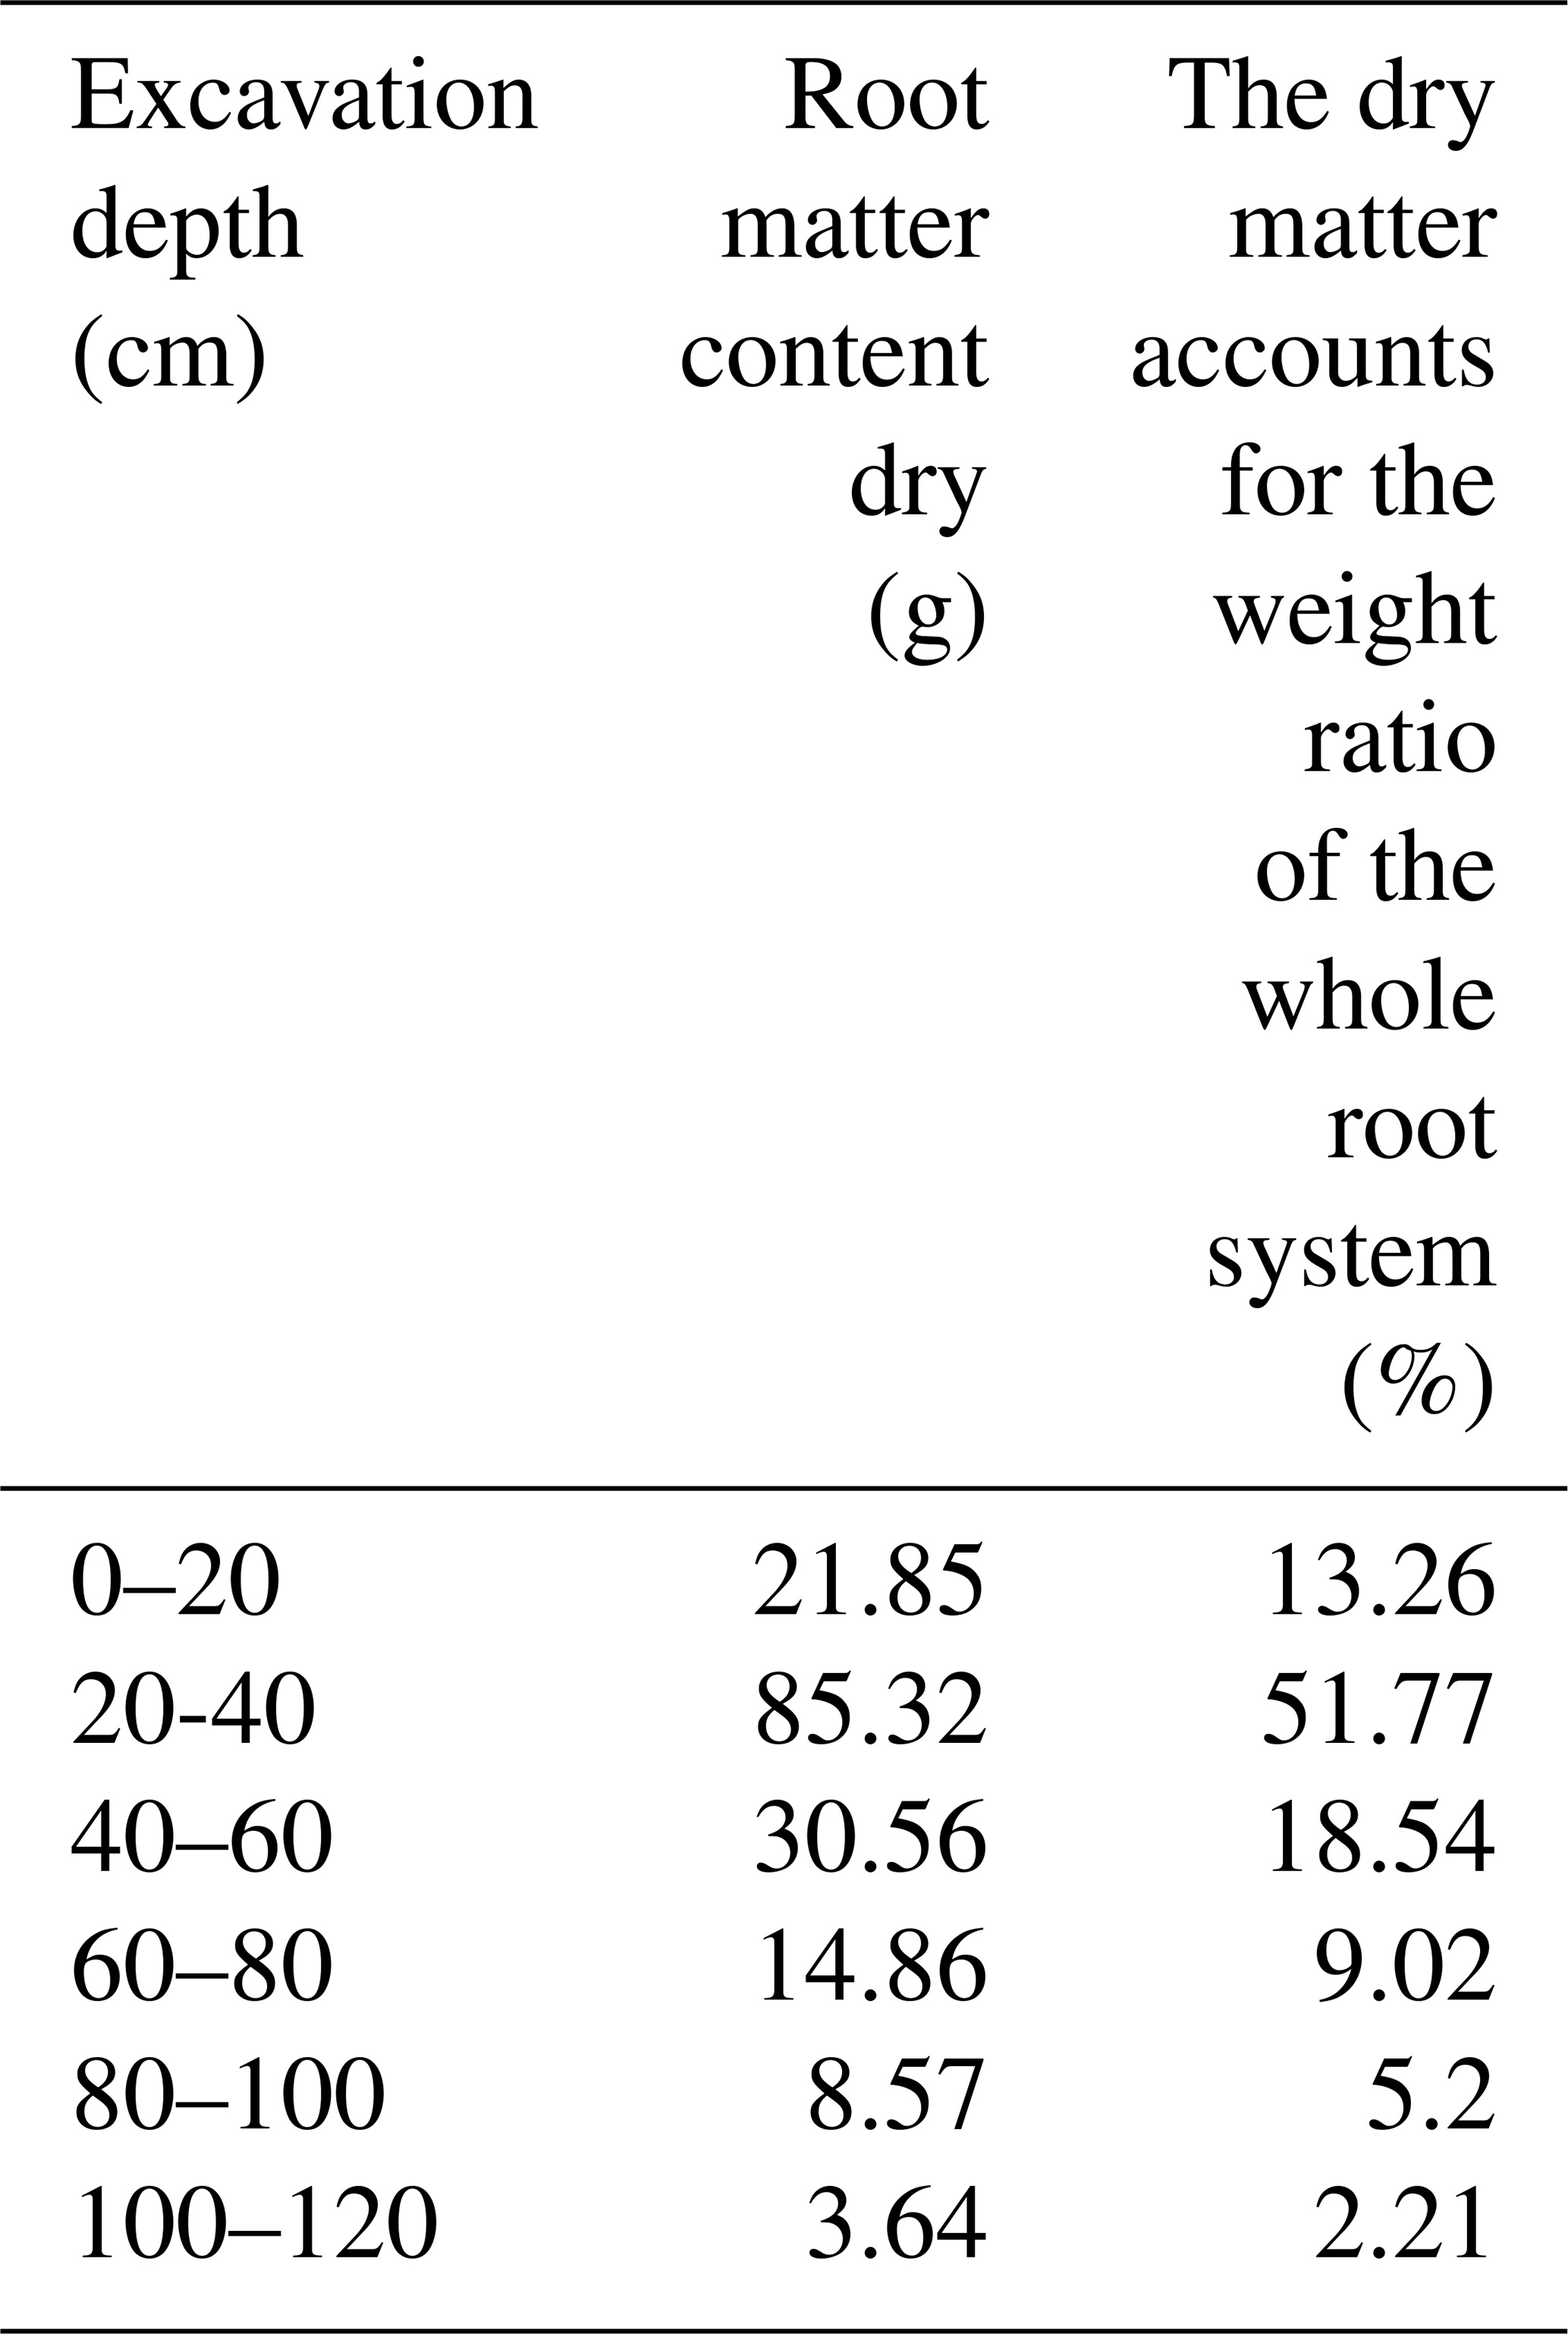
This research selects representative plants and excavates the soil profile to research the ASK root system growth range. The results show that the ASK root system distribution is umbrella-shaped, as shown in Table 1. The root system distribution range mainly concentrates within 0–60 cm of depth and can reach as deep as 120 cm. The main root grows through the entire depth. The lateral roots are distributed around the main root and can reach a 200 cm diameter horizontally. The density of lateral roots gradually decreases when moving away from the central main root. The lateral roots mainly concentrate within depths of 20–60 cm. From the ground surface to a depth of 40 cm, the root system gradually increases and reaches the maximum density at 40 cm of depth. The dry weight of roots between 20 and 40 cm is 51.77 % of the weight of the entire root system. The root system gradually decreases after depths of 40 cm, with the deepest root system depth at 120 cm. The results show that the ASK root system in this area is mainly developed in the horizontal direction, which confirms that rainfall is the main water supply for plants in the Mu Us sandy land. This conclusion is based on the following factors. The root development of plants is highly dependent on the source of water supply for the root system, and there are generally two sources of supply: (a) rainfall-induced downward infiltration and (b) uptake of groundwater from the underlying soil and aquifer. If the primary source of supply for the ASK root system comes from the deep groundwater table, then the root prefers to grow vertically in order to access the underlying groundwater. On the other hand, if the primary source of supply for the root system comes from rainfall-induced infiltration, the root system prefers to grow horizontally to maximize the intercept of such infiltrated water, and the field observation results confirm that this is the case in the Mu Us sandy land.
Table 1Root distribution of the ASK in the vertical direction.
3.2 Effect of ASK on soil development
There are many factors that affect the soil particle size, including soil crust, vegetation roots secreting acidic substances to decompose the parent material, ionic strength, flow rate, and surface vegetation fixed-sand dust (Yan et al., 2013; Yu et al., 2013; Zhang et al., 2011). The soil particle size of each layer is also different. It is necessary to analyze each soil layer one by one and it is not easy to see the main affecting factors. In this research, to understand the impact of ASK on the local soil, the ASK soil samples and bare land soil samples were collected and sorted based on the US Department of Agriculture's soil particle size grading scheme. We collected samples every 20 cm of depth, mixed them together, and treated the entire 220 cm thick soil layer as a homogenized system.
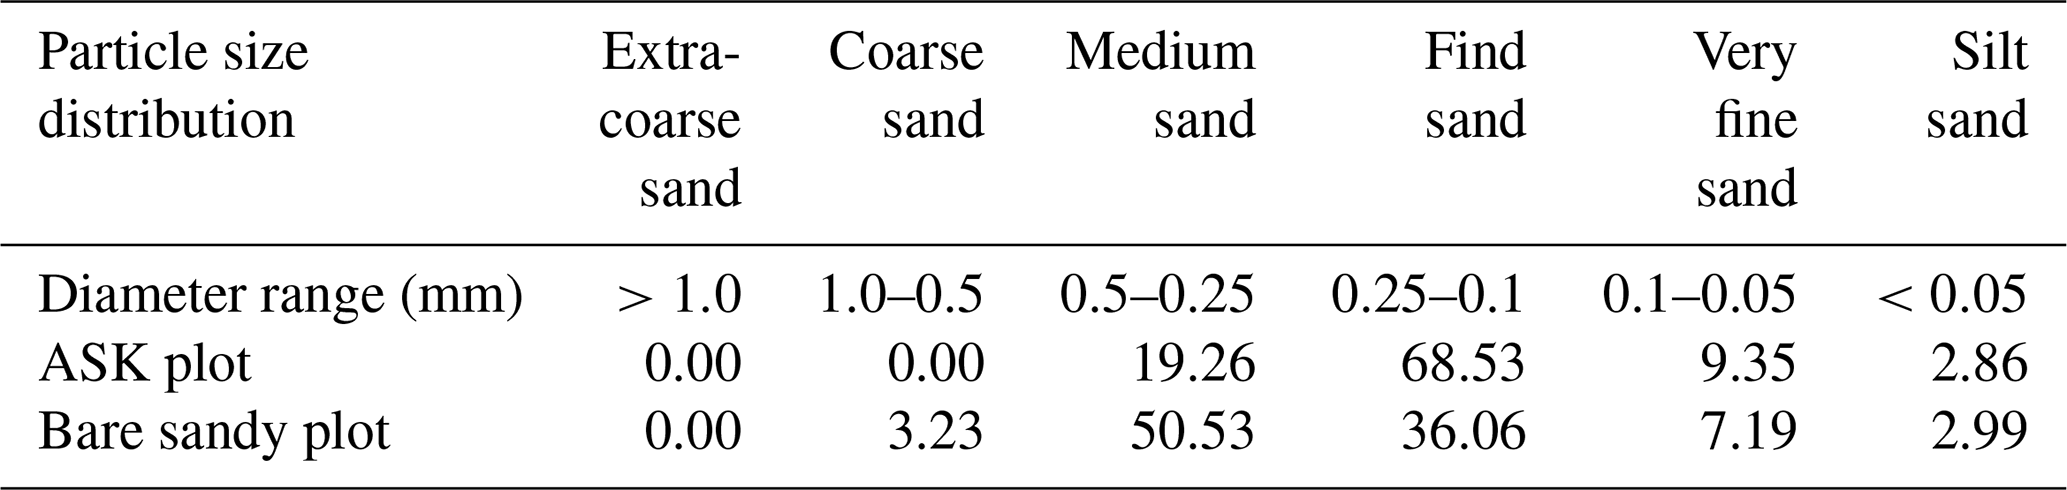
Table 2The distribution of soil particle size at the research site.
The soil particle size distribution was measured using the MS2000 soil particle size analyzer produced by Malvern, UK. Samples needed to be pretreated before the experiment. All soil samples passed through a 2 mm soil sieve, with 30 % H2O2 solution added to remove organic matter (including biological crust) from the sample. Then NaHMP solution was added to fully dissolve the samples, followed by shaking for 30 s to destroy the microaggregate structure of the soil particles.
Table 2 shows the particle size distributions in both the ASK plot and bare sandy plot. Overall, in the ASK plot, the medium sand is 19.26 %, the fine sand is 68.53 %, the very fine sand (or powder sand) is 9.35 %, and silt is 2.86 %. The soil particle size distributions of the bare sandy plot are as follows. The coarse sand is 3.23 %, the medium sand is 50.53 %, the fine sand is 36.06 %, the very fine soil is 7.19 %, and the silt is 2.99 %. Comparing the results in the ASK plot and bare sandy plot, one can see that the main soil type in the ASK plot is fine sand (68.53 %), and the main soil types in the bare sandy plot are medium (50.53 %) and fine sands (36.06 %). Another notable point is that there is 3.23 % coarse sand in the bare sandy plot but no coarse sand in the ASK plot.
There is clear evidence that sand-fixing vegetation changes the particle size distribution of the soil (Fearnehough et al., 1998; Pei et al., 2008). A few possible factors may be responsible for such a change. First, the fine sand in the 220 cm thick soil of the bare sandy land is easily removed or eroded from its original position under the force of wind, which initiates sand movement both horizontally and vertically (as suspended particles are carried away by wind). Consequently, the content of fine sand in the bare sandy land decreases, and the soil structure continuously coarsens. In contrast to this, the content of fine particles in the ASK plot is significantly higher than that in the bare sand. This is largely due to the presence of vegetation in the ASK plot, which has substantially subdued the eroding force of wind. In other words, ASK essentially protects the fine sands in the soil from being removed or eroded by wind force. This observation is direct evidence showing that vegetation has a positive role in improving soil particle size composition by maintaining the fine sand particles in the plot. However, one must also be aware that such a change in particle size distribution is a consequence of a complex interplay of aerodynamic force, sand mass movement mechanics, and root–soil interaction force, which are not completely understood and need further investigation. In summary, the sand-fixing vegetation in northern China not only fixes the quicksand, but also greatly improves the soil texture, which is far greater than traditional expectations.
3.3 Annual soil moisture variation of the rain-fed ASK plot
The experimental area is located in northern China, with more than 3 months of intermittent frozen soil in winter. Multiyear observations show that the frozen soil period is from December of the previous year to March of the following year. The annual soil moisture variation in 2015 is shown in Fig. 3. According to the change in soil volumetric water content and the influence of precipitation, the whole year is divided into five stages, which are the thawing recharge period, germination consumption period, rain season recharge period, and plant dormancy period. The freeze–thaw period refers to the topsoil at 2 m of depth from the beginning of freezing to the complete melting of the frozen soil. The germination period begins from the end of the freeze–thaw period to the period when branches of ASK are enlarged and one or two new leaves start to grow. The rainy season refers to a period of relatively concentrated precipitation experienced after the germination period of the ASK plot in this region. the frozen soil period is not shown in Fig. 4. From 2015 to 2018, the trend of soil moisture is basically the same, only the time of the rainy season and the amount of annual precipitation are different.
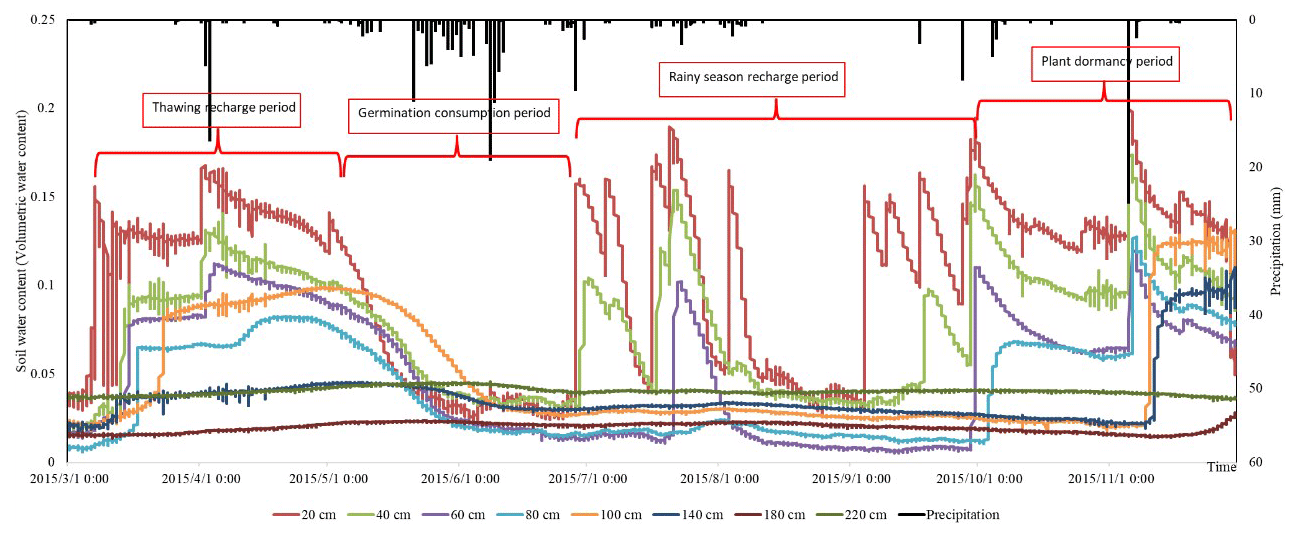
After 6 March, the melting snow in the ground surface leads to increased soil moisture contents. Around this time, ASK is still in winter dormancy and does not absorb soil moisture. As shown in Fig. 4, from 6 March to 5 May, soil moisture increases significantly. Soil moisture resulting from melting snow can infiltrate to depths of 100 to 140 cm. After 25 April, ASK starts germination, and soil moisture gradually decreases. From 25 April to 27 June, there are 31 observed precipitation events in total. The maximum precipitation is 18.8 mm, and the minimum precipitation is 0.2 mm. However, these precipitation events did not change the decreasing trend of soil moisture. This means that during the germination and early growth periods, the moisture-absorbing capacity of the ASK root system is extremely high. There is a 9.4 mm precipitation event on 28 June, and the infiltration associated with this event can reach a depth of 20 cm. This means that the growth of ASK starts to slow down around this time, and the shallow soil moisture starts to increase. In October, temperature drops and ASK starts to enter winter dormancy. There is a 4.2 mm precipitation event on 4 October, and the infiltration associated with this event can reach a depth of 60 cm. There is a 24.6 mm precipitation event on 7 November, and the infiltration associated with this event can reach a depth of 140 cm. Soil moisture at 220 cm of depth changes very mildly. The results show that though DSR occurs in all seasons, especially during the freeze–thaw period, due to vegetation consumption, the amount of DSR is relatively small.
3.4 Effects of annual precipitation on soil moisture and DSR
3.4.1 Comparison of DSR on rain-fed ASK land and bare sandy land
For deep soil moisture variation and distribution, this research uses a newly designed lysimeter to measure DSR on-site (Cheng et al., 2017). The soil layer may have been disturbed after the instrument was installed in 2015, so the 2015 precipitation–infiltration data are not used in this study. Results are shown in Table 3. From 2016–2018, the precipitation rates of bare sandy land are 464.8, 313.4, and 245.2 mm, and DSR values are 283.6, 67.6, and 51.6 mm, respectively. The ratios of DSR to annual precipitation are 60.02 %, 21.57 %, and 21.04 %, respectively. The experimental plot of Artemisia is less than 100 m away from the bare sandy land plot, the annual precipitation is basically the same, and DSR values are 90.6, 31.2, and 2 mm, respectively. The ratios of DSR to annual precipitation are 19.49 %, 9.96 %, and 0.82 %, respectively. According to the above data, the DSR of the bare sandy land is obviously higher than the Artemisia plot. On the Artemisia plot, the interception of the aboveground vegetation, root absorption, and evapotranspiration consumes a large amount of water resources, which affects the production of DSR.
Table 3Comparison of precipitation and DSR on the ASK land and bare sand field.
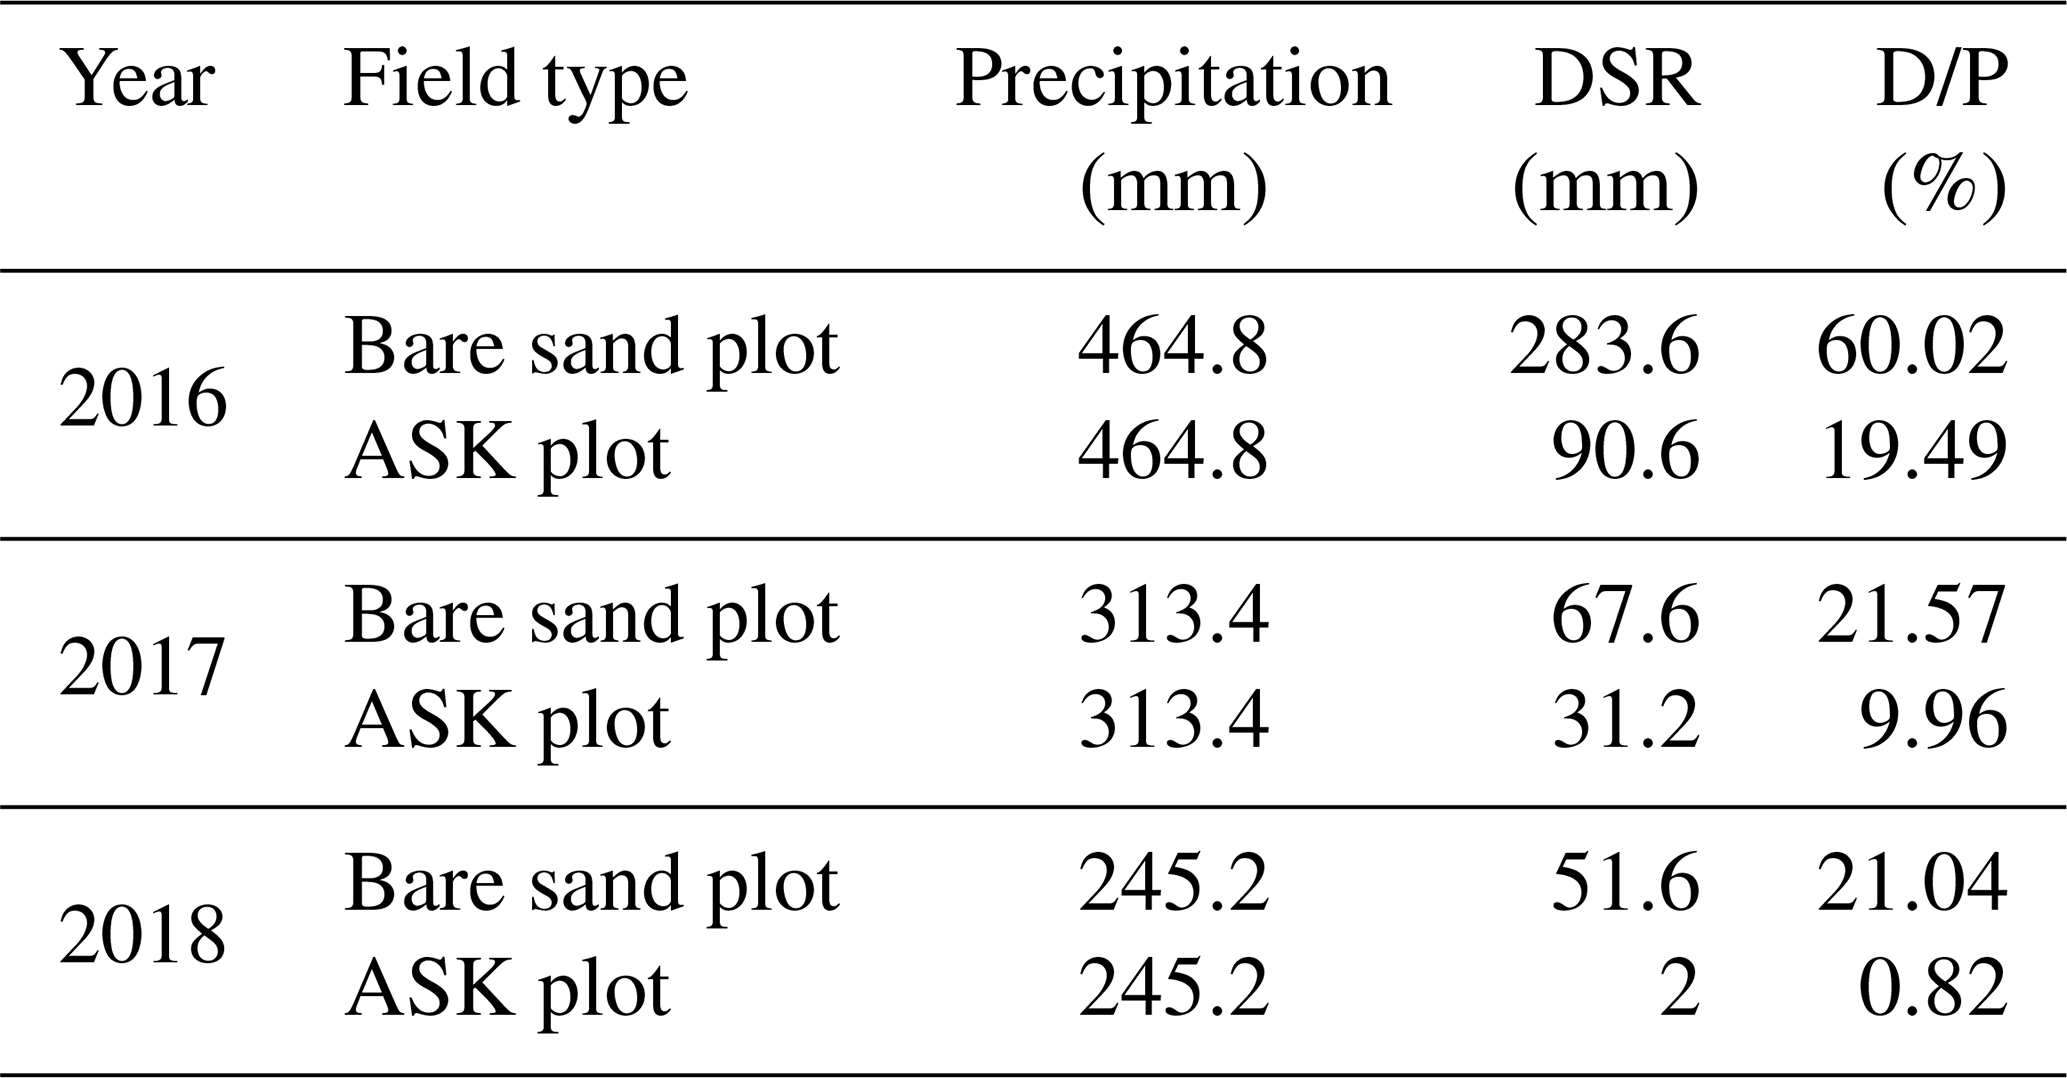
When the annual precipitation in a particular year is higher than 358.2 mm, it is considered a wet year; if the annual precipitation in a particular year is lower than 358.2 mm, it is considered a dry year. As shown in Table 3, 2016 is a wet year, 2017 is a normal year, and 2018 is a dry year. In the wet year, the deep soil moistures of the two experimental sites were greatly supplemented, and the effect of bare sand was more obvious. The amount of DSR in the dry years is significantly reduced on both plots, especially in the Artemisia plot, from 90.6 mm in wet years to 2 mm in dry year. Based on these values, one can conclude that in semi-arid areas, though vegetation cover can fix mobile sand dunes, it consumes a lot of water resources. Bare sandy land can transport large amounts of water resources to shallow groundwater.
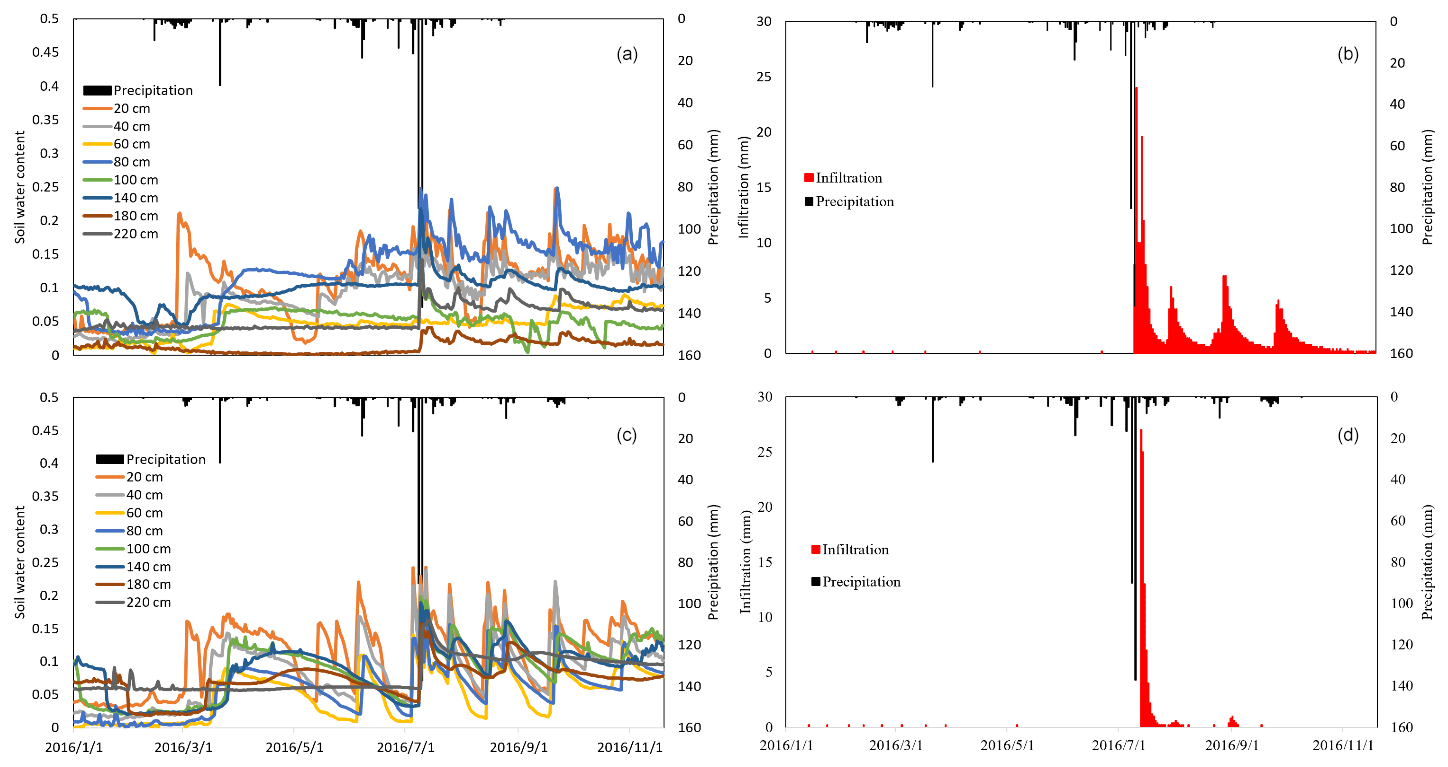
Figure 5Effects of precipitation on soil moisture (a) and DSR (b) in the bare sandy land plot; effects of precipitation on soil moisture (c) and DSR (d) on the ASK plot, 2016.
3.4.2 Precipitation response to soil moisture and DSR on two experiment plots
The relationship between precipitation, soil moisture content fluctuations, and DSR in 2016 is shown in Fig. 5a–d. There are 84 precipitation events throughout the year in 2016, with the maximum precipitation amount of 137.2 mm d−1 happening on 10 July. According to local weather station data, this is the second largest daily precipitation since 1950, and the minimum precipitation amount of 0.2 mm d−1 happened 11 times throughout the year. On bare sandy land, there are 138 infiltration events throughout the year in 2016, with the maximum DSR amount of 24 mm d−1 happening on 11 July, and the minimum DSR amount of 0.2 mm d−1 happened 25 times throughout the year. On the ASK plot, there are 42 infiltration events throughout the year in 2016, with the maximum DSR amount of 27 mm d−1 happening on 13 July, and the minimum DSR amount of 0.2 mm d−1 happened 22 times throughout the year. The comparison of these two sets of DSR data shows that ASK can substantially reduce the soil moisture infiltration, and the DSR of the Artemisia plot is reduced by 68.05 % compared to the bare sandy plot. Heavy precipitation completely wets the entire soil layer, forming a moisture transport channel that facilitates the transport of moisture throughout the soil layer. In bare sandy land, as the entire soil layer is wet, the subsequent small precipitation can also replenish the deep soil layer moisture, as shown in Fig. 3a. In the experimental area of the Artemisia plot, heavy rainfall wets the entire soil layer, but for the root system soil water consumption, the subsequent small precipitation cannot significantly replenish the deep soil moisture, as shown in Fig. 4d.
The relationship of precipitation with soil moisture and DSR in the bare sandy land plot and ASK plot for 2017 is shown in Fig. 6a–d. There are 94 precipitation events throughout the year in 2017, with the maximum precipitation amount of 18.8 mm d−1 happening on 29 June, and the minimum precipitation amount of 0.2 mm d−1 happened 24 times throughout the year. On bare sandy land, there are 178 infiltration events throughout the year in 2017, with the maximum DSR amount of 8 mm d−1 on 23 August and the minimum DSR amount of 0.2 mm d−1 happening 128 times throughout the year. On the ASK plot, there are 52 infiltration events throughout the year in 2017, with the maximum DSR amount of 1.6 mm d−1 on 5 September and the minimum DSR amount of 0.2 mm d−1 happening 21 times throughout the year. There were only 6 times of infiltration in the bare sand plot from January to April in 2016 and 50 times in 2017, as shown in Figs. 4 and 5. Since the surface was frozen at this time, there was no surface infiltration. The source of infiltration in the first 3 months is essentially from the soil layer reservoir of 2016. One can speculate that the accumulation of water in the soil in the previous year can continue to infiltrate to the second year. This also makes it difficult to subdivide which precipitation process induced how much soil water content. In 2017, there was less precipitation than the previous year, so the DSR was reduced in both plots, especially the ASK plot. Only after the vegetation had dried up on 9 September did a large infiltration process occur.
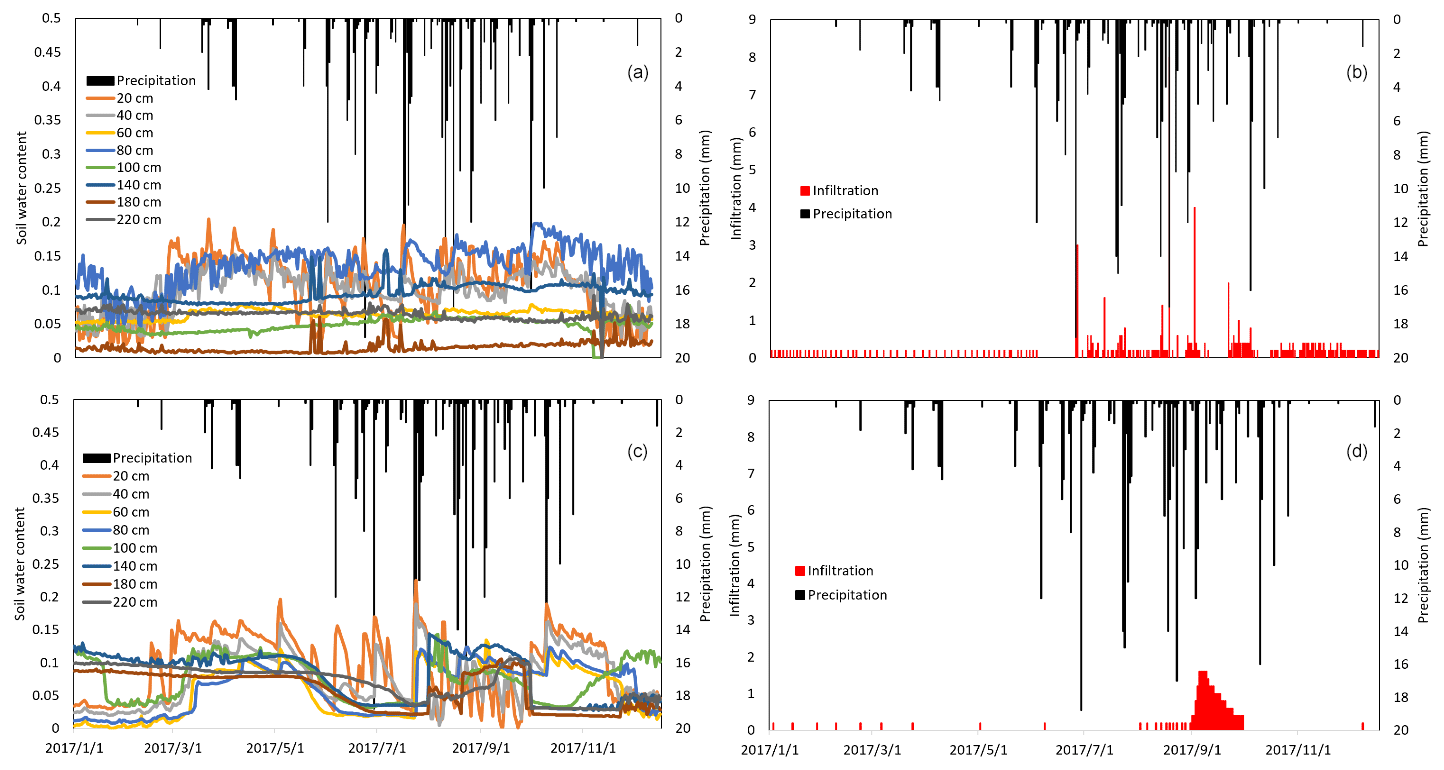
Figure 6Effects of precipitation on soil moisture (a) and DSR (b) in the bare sandy land plot; effects of rainfall on soil moisture (c) and DSR (d) on the ASK plot, 2017.
The results show that in the Mu Us sandy land, whether there is vegetation coverage or not, DSR occurs in all seasons of the year and there is a significant difference in terms of DSR characteristics in the bare sand plot and the ASK plot. More specifically, the annual DSR of the bare sandy lands reaches 3.13 times that of the ASK land. After the freeze–thaw period, the ASK root system begins to utilize the soil moisture, and soil moisture consequently decreases significantly.
The relationship between precipitation, soil moisture content fluctuations, and DSR for 2018 is shown in Fig. 7a–d. There are 71 precipitation events throughout the year in 2018, with the maximum precipitation amount of 30 mm d−1 happening on 31 August, and the minimum precipitation amount of 0.2 mm d−1 happened 15 times throughout the year. On bare sandy land, there are 122 infiltration events throughout the year in 2018, with the maximum DSR of 1.6 mm d−1 happened on 4 June, and the minimum DSR of 0.2 mm d−1 happened 74 times throughout the year. On the ASK plot, there are 10 infiltration events throughout the year in 2016, with the maximum and the minimum DSR at the same amount of 0.2 mm d−1 happening 10 times throughout the year.
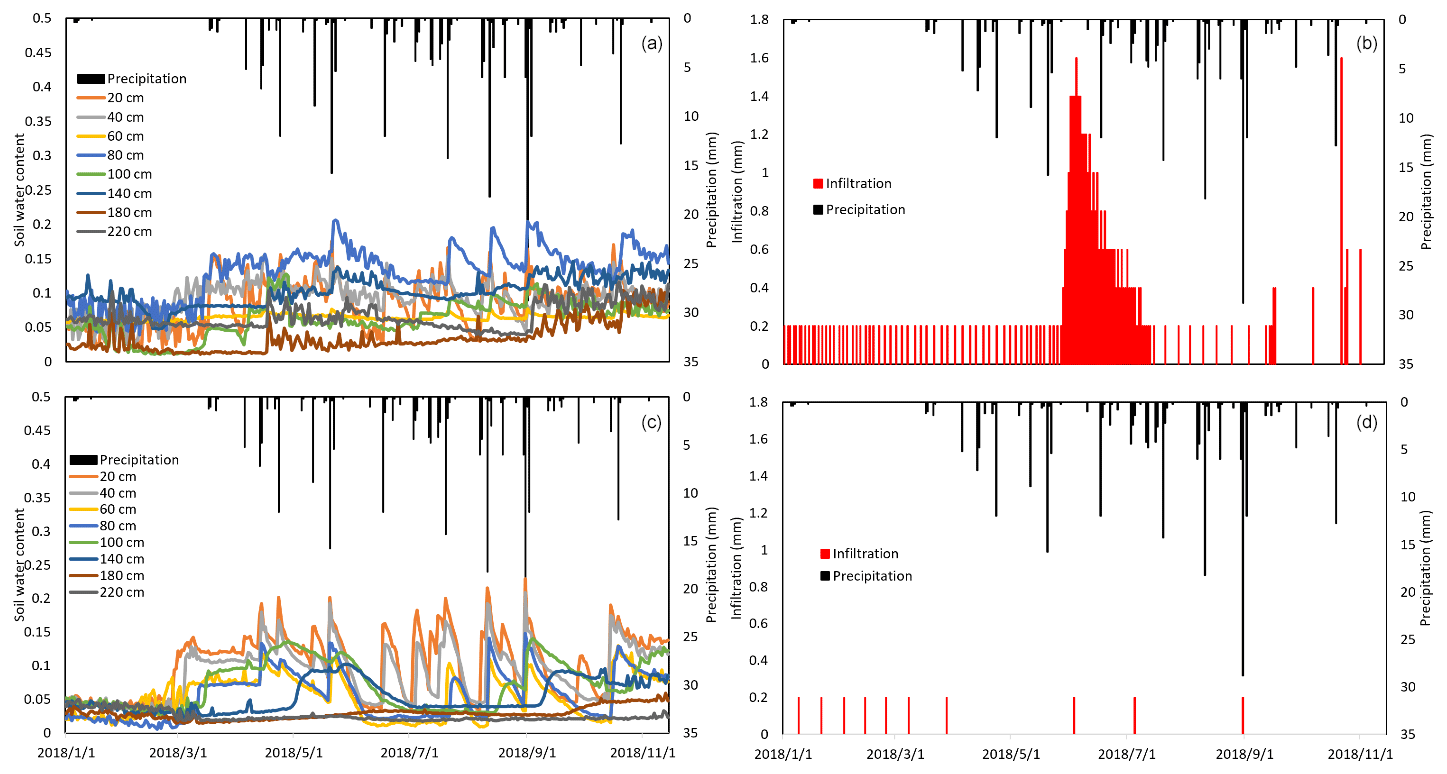
Figure 7Effects of precipitation on soil moisture (a) and DSR (b) in the bare sandy land plot; effects of rainfall on soil moisture (c) and DSR (d) on the ASK plot, 2018.
The results show that under the heavy precipitation event on 31 August 2018, DSR in the bare sandy land is obviously visible. The precipitation replenishes the deep soil layer and shallow groundwater. However, in the ASK plot, a large percentage of precipitation-induced infiltration is intercepted by vegetation coverage, meaning that the sand-fixing vegetation strongly affects the infiltration process and has a greater impact on groundwater recharge. At the same time, DSR can be found in both plots in all seasons throughout the year.
3.5 Research on rain-fed ASK land water distribution
There are many methods of measuring surface layer evapotranspiration, but all have poor precision because there are many factors that affect surface layer evapotranspiration and one cannot consider all impact factors; these factors include vegetation coverage, environmental factors, and temperature factors. This study treats shallow soil as a whole layer and measures the amount of surface rainfall recharge, soil water storage, and DSR directly. Based on the directly measured DSR and precipitation, the soil moisture storage change can be calculated using Eq. (1). During the 5-month intermittent frozen period, soil moisture sensors provide less reliable soil water content measurements as the soil moisture sensors are designed to detect liquid water instead of solid ice. Therefore, this research uses the unfrozen time period from 1 April to 30 November to investigate the water distribution. The average soil water contents in the first week of April and the first week of November are used as the initial and final values of annual soil water storage to calculate the change in soil water storage annually. Based on measured precipitation, DSR, soil water storage, and the water balance in Eq. (1), the evapotranspiration can be accurately calculated, and the results are shown in Table 4.
Table 4Annual water distribution on the ASK land and bare sand field.
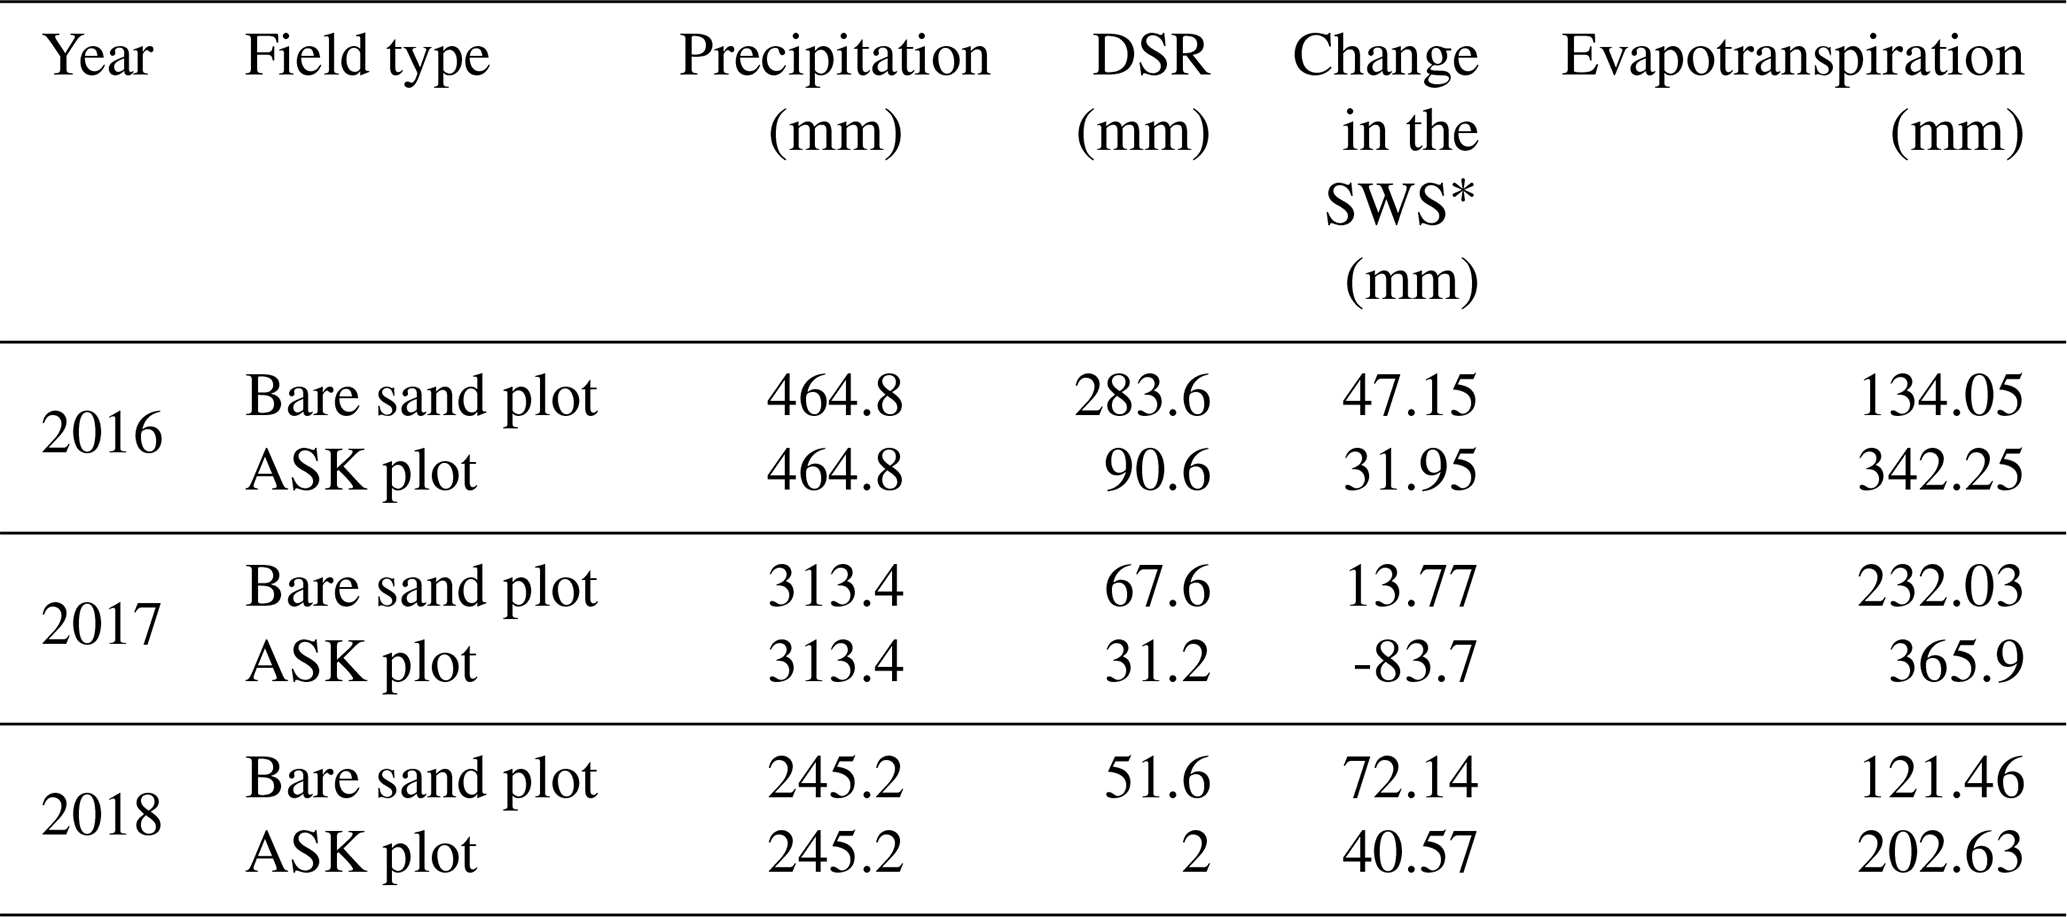
* Note: SWS stands for soil water storage.
In 2016, the soil moisture reserve in the 220 cm soil layer of bare sand increased by 47.15 mm, and the annual evaporation was 134.04 mm, while the soil water storage of the Artemisia plot increased by 31.95 mm, and the evapotranspiration was 342.25 mm. In 2017, the soil water storage of the bare sandy plot increased by 13.77 mm, and the annual evaporation was 232.03 mm, while the soil water storage of the Artemisia plot was reduced by 83.7 mm, and the evapotranspiration was 365.9 mm. In 2018, the soil water storage of the bare sandy plot increased by 72.14 mm, and the annual evaporation was 121.46 mm, while the soil water storage of the Artemisia plot increased by 2 mm, and the evapotranspiration was 202.63 mm. One should note that the change in soil water storage only represents the distribution of soil moisture from April to November, rather than the net increase of the whole year, because the water in the soil will continue to infiltrate to the deep soil layer when the surface soil layer is frozen. As shown in Fig. 3, there is no significant precipitation from January to June 2017, but deep infiltration has occurred. Comparing the data from 2016 to 2018 in Table 4, it can be found that when there is sufficient precipitation, for example in 2016, soil water storage increases and evapotranspiration increases as well. When the precipitation is low, the soil water storage decreases and the evapotranspiration decreases as well. The results show that after vegetation reconstruction in this area, the amount of DSR is significantly reduced, which may threaten the safety of groundwater recharge. The precipitation water is concentrated in the shallow soil layer, and vegetation gets sufficient moisture; then evaporation increases, and the regional microclimate environment will be improved. Evapotranspiration of plants in drought years is significantly reduced, which shows that vegetation will adapt to the environment by increasing or decreasing water consumption according to the amount of precipitation.
3.6 Influence of vegetation coverage on infiltration rate
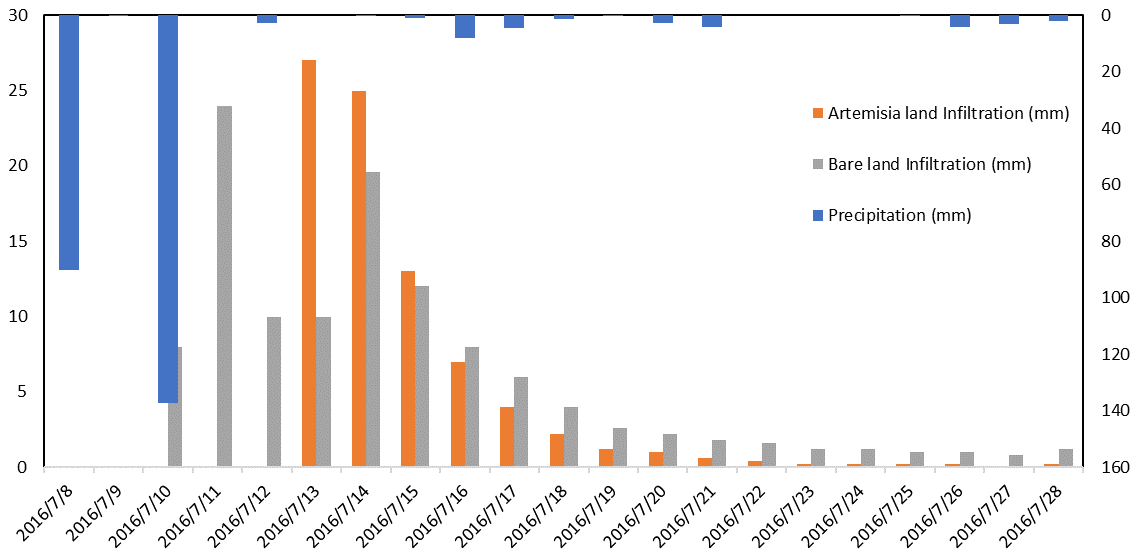
In many aspects one can find the influence of vegetation on infiltration, the interception of precipitation by the aboveground part of vegetation, the interception and absorption of surface soil layer moisture by vegetation, the absorption and utilization of soil water by vegetation roots, the root system occupying soil voids to reduce infiltration speed, and the conduction effect of the catheter formed by dead roots on the infiltration ability. In this study, we consider the aboveground and underground parts of vegetation to be a whole system and compare the bare sand plot and ASK plot in terms of infiltration speed. During the observation period, the precipitation–DSR interaction occurred alternatively. In order to show the characteristics of the two types of infiltration, we selected a typical infiltration process, and the result is shown in Fig. 8. Precipitation of 90.2 mm d−1 was generated at 23:00 UTC+8 on 7 July 2016, and a DSR event was observed at 21:00 UTC+8 on 9 July on the bare sand plot. From the surface soil layer to the 220 cm depth soil layer, the infiltration process took 46 h. The DSR of the ASK plot was observed at 08:00 UTC+8 on 12 July, and the infiltration process from the surface layer to the depth of the 220 cm soil layer took 107 h. The infiltration rate of the ASK plot is 2.33 times that of the bare sandy land. One can see that vegetation cover significantly affects the infiltration rate. However, under natural conditions, multiple precipitation processes occur in a short period, so it is difficult to distinguish the DSR event caused by certain precipitation under different land coverage types with sufficient precipitation.
The results show that the characteristics of precipitation-induced DSR in the sandy land plot and the ASK plot are different. The two precipitation events leave marks on the bare sandy plot, leading to two spikes of DSR. In contrast, such spikes do not appear in the ASK plot because water is mostly utilized by the root system and only a very small portion of the precipitation-induced infiltration can reach as far as 220 cm to be detected by the lysimeter. ASK not only delays the infiltration rate but also reduces the total amount of DSR.
4.1 Insights gained from this study
Monitoring and quantifying the precipitation-induced shallow groundwater recharge process are long-lasting challenges in the hydrological community, and it is especially difficult to do so in arid and semi-arid regions because of the spatiotemporally highly variable precipitation and complex soil moisture dynamics during the infiltration process (Newman et al., 2006). Studies of the interrelationship of precipitation and shallow groundwater are very important for local vegetation reconstruction, with or without anthropogenic mitigation (Ramier et al., 2009; Scibek et al., 2007). The difficulty of attempting to establish a relationship between precipitation and groundwater recharge is mainly reflected in the following aspects. Firstly, there are fewer instruments for direct long-term, large-scale measurements (Krishnaswamy et al., 2013). The commonly used methods, such as the double ring filter method, a lysimeter, the rainfall simulation method, the water flux method, and stable-isotope-based tracking methods, all have certain specific restrictions (Sprenger et al., 2015; Groh et al., 2018). For instance, the heterogeneous nature of soil and point observations made with most of the abovementioned methods will make it difficult to conduct a basin-scale analysis (Mousavi and Shourian, 2010). Secondly, ecological elements (such as ASK root systems in this study) are always changing, and thus any monitoring methods that cannot continuously accommodate the ecological elements will miss a significant piece of the machinery of understanding the precipitation–recharge relationship. Our research here is an attempt to utilize a low-cost, field-based lysimeter method to monitor DSR for 4 years in the Mu Us sandy land; a task that measures DSR without disturbing the horizontal flow of soil moisture has never been reported before.
The improvement of soil texture takes hundreds of years. It also takes a long time to improve soil texture with the participation of vegetation roots. In the Mu Us sandy land, due to the participation of the sand-fixing vegetation, a large number of dust particles are fixed by the sand-fixing vegetation. When rainfall happens, water infiltrates into the deep soil with these dust particles. Over the 40 years, the texture of the soil in this plot has undergone significant changes. From this one can infer that the speed of soil improvement in this area far exceeds our expectations.
In semi-arid areas, with the Mu Us sandy land as an example, the main limiting factor for trees is available water resources (Gao et al., 2014; Skarpe, 1991). Therefore, the key to understanding the vegetation ecosystem in semi-arid areas is to study the supply of water resources (Cheng et al., 2017a, 2018a). The ASK has been in existence in the study area for more than 40 years, so the purpose of this study is to find out whether there are sufficient water resources available in the region to support the vegetation ecosystem through the measurement of DSR. The “sustainable” growth of plants in this study means that water resources from precipitation can meet the growth needs of ASK, with a sufficient excess amount of water to replenish the deep soil layer. In this study, the soil moisture distribution has been studied by using the newly designed lysimeter to determine whether the soil layer below the root layer could produce DSR or not.
In the dry years, the differences in soil water storage and DSR between the two plots are significant, taking 2018 as an example. At the beginning of the experiment, the soil moisture storage in the ASK plot is 126.16 mm, and the soil moisture storage of the bare sandy land is 147.22 mm. At the end of the experiment, the soil moisture storage in the ASK plot is 166.72 mm, which is 40.56 mm less than that at the beginning of the experiment. The soil moisture storage of the bare sandy plot at the end of the experiment is 219.37 mm, which is 72.15 mm more than its counterpart at the beginning of the experiment. There is no significant difference in soil water storage, but the DSR difference is obvious. The DSR of bare sand is 51.6 mm, and that of the ASK plot is only 2 mm. Although the DSR is significantly reduced, even in the dry years, there is still a small amount of DSR, indicating that the selection of ASK as sand-fixing vegetation in this area is a suitable plant species. Another interesting point to note is that ASK is capable of adjusting its own growth conditions based on the available moisture recharge, and a larger moisture recharge will result in a faster growth rate of such plants. When the rainfall is insufficient, the evapotranspiration of ASK is reduced from 342.25 mm in 2016 to 202.63 mm in 2018.
As surface soil is frozen and ASK enters dormancy during winter at the research site, snow can only accumulate on the surface and cannot recharge soil moisture. However, moisture in deep soil continues to infiltrate downwards because of the driving force of gravity. This is particularly true in bare sandy land as a large amount of soil moisture has been accumulated at the start of the frozen period. A portion of this accumulated soil moisture will slowly infiltrate downwards and recharge the groundwater reservoir. Because the amount of snowfall in winter is difficult to calculate, the amount of frozen water accumulated in winter cannot be obtained.
Traditional lysimeters have impervious containers for loading plants. The air in the container will cause increased DSR when it expands and contracts. Some researchers believe that it is condensed water generated by soil water vapor. The newly designed lysimeter has an improved design and no longer has interference from condensate because there is no container. But it should also be mentioned that condensed water does exist in the sandy soil layer and it is not easy to measure. We also need to mention that although vegetation in arid areas grows slowly, the amount of water that becomes plant tissue during growth is relatively small, and most of the water is consumed by evapotranspiration. The tissue water consumed by vegetation is not calculated separately in this research but is counted as evapotranspiration.
4.2 Limitations and future work
We need to point out that airflow and vapor transport have not been considered in this experimental investigation and should be incorporated in future studies because of two considerations.
Firstly, it has been reported that airflow may play an important role for mass and energy transport in arid and semi-arid areas (e.g., Scanlon, 1994; Scanlon and Milly, 1994; Zeng et al., 2009a, b, 2011a, b; Yu et al., 2018, 2020); this is particularly true when discussing the evaporation process. For instance, Zeng et al. (2011a) established a one-dimensional (vertical) two-phase heat and mass flow model to explain the field measurements of soil moisture content and temperature in the Badain Jaran Desert of China for both low- and high-permeability soils. They reported that the evaporation was underestimated when the airflow was neglected, and such underestimations were more evident in the low-permeability soil (6.4 %) than in the high-permeability soil (8.85 %). Zeng et al. (2011a) concluded that such underestimations of evaporation were mainly caused by underestimation of isothermal hydraulic conductivity by neglecting airflow. Mohanty and Yang (2013) agreed with Zeng et al. (2011a) that the underestimation of evaporation was caused by underestimation of isothermal hydraulic conductivity, but they disagreed with Zeng et al. (2011a) that negligence of airflow was responsible for the underestimation of isothermal hydraulic conductivity. The critical comment made by Mohanty and Yang (2013) was disputed by Zeng and Su (2013), who upheld the conclusions of Zeng et al. (2011a), but at the same time Zeng and Su (2013) recognized that some other mechanisms, such as the absorption component of soil water retention (which has been pointed out by Mohanty and Yang, 2013), can be important and should be included in addition to diffusion, advection, and dispersion when discussing the balance equations of water (liquid and vapor), dry air, and heat. In summary, there is a general consensus that airflow is relevant when discussing the mass and energy transport in the unsaturated zone, particularly near the land–atmosphere surface. However, it is still not fully understood to what degree the airflow has contributed to the land–atmosphere interaction.
Secondly, this study mostly concerns liquid water movement below the shallow soil zones (such as 2.2 m below the ground surface) with a water table as deep as 7 m in a semi-arid region. How important vapor transport is at the study site is an open question that should be answered when new experiments are conducted in the future. It is speculated that even for a groundwater table as deep as hundreds of meters, continuous upward vapor transport driven by the thermal gradient, soil matrix potential, or diffusion and dispersion processes may still exist and can be an important source of water in desert areas like the site of this study (Scanlon, 1994; Scanlon and Milly, 1994). In past decades, relevant studies in the Badain Jaran Desert of China have indicated that vapor transport plays an important role in regulating infiltration and land surface evaporation (Zeng et al., 2009a, b, 2011a, b; Zeng and Su, 2013). In addition, vapor transport is also important for freeze–thaw cycles in the Badain Jaran Desert (Yu et al., 2018, 2020). In summary, further research is needed to quantify the importance of airflow, vapor transport, and the source of condensation at the study site.
This research uses a newly designed lysimeter to monitor shallow soil layer infiltration, and results show that in order to absorb more precipitation moisture, ASK develops a horizontal root system and retains more water in the shallow soil layer. ASK been has shown to be effective in fixing the mobile sand and increasing the proportion of fine particles in the sandy land. ASK changes its own evapotranspiration amount to adapt to annual precipitation changes. Under the existing precipitation conditions, the ASK community can develop healthily, as a small amount of precipitation can recharge the groundwater, even in a dry year. This indicates that precipitation in the area is sufficient to meet the needs of vegetation water consumption. However, with unforeseeable global warming and abnormal precipitation events, semi-arid regions may become drier and the ASK community may be seriously affected. Therefore, continuous monitoring of the key controlling factors associated with the ecological system in semi-arid regions is needed.
The following conclusions can be drawn from this research.
-
In the Mu Us sandy land, the ASK root system develops horizontally to absorb more precipitation-induced infiltration. The root system reaches 120 cm of depth and is mainly concentrated within the upper 40 cm deep soil layer.
-
After 40 years of vegetation reconstruction, the soil particle size distribution has significantly changed; soil texture improvement in semi-arid sandy land far exceeds expectations. Specifically, the sandy soil mainly consisting of medium sand (50.53 %) has grown into a sandy soil mainly consisting of fine sand (60.53 %). Vegetation is particularly important in semi-arid areas since it directly changes the composition of soil.
-
The yearly DSR in the ASK sand-fixing experimental plot is from 2 to 90.6 mm. In contrast, the yearly DSR in the bare sand plot is from 51.6 to 283.6 mm. This shows that the rain-fed vegetation has reduced DSR substantially, but there is still a small amount of recharge left to replenish the deep soil moisture, implying that the current ASK community is still hydrologically self-sustainable because it does not consume all the water moisture replenished by precipitation and the DSR has not been reduced to zero.
-
With the coverage of ASK at this stage, the sand-fixing forest in the Mu Us sandy land can still achieve connectivity between atmospheric water, surface water, and groundwater. During the observation period, the infiltration of bare sandy land can reach 25.8 times that of ASK land, and during a single precipitation process, the infiltration rate of the ASK plot can reach 2.33 times that of the bare sandy land.
The airflow and vapor transport have not been considered in this study and should be incorporated in future experimental and theoretical investigations at the site.
The data used to support the findings of this study are available from the corresponding author upon request.
YC and XL were responsible for data curation. YC, XL, YW, and HZ conducted the formal analysis. WY and QJ were responsible for funding acquisition. HZ conducted the investigation, and YC and HZ were responsible for writing, review, and editing. All authors have read and agreed to the published version of the paper.
The authors declare that they have no conflict of interest.
We gratefully acknowledge the Beijing Municipal Education Commission for their financial support through the Innovative Transdisciplinary Program “Ecological Restoration Engineering”. Thanks to the experimental site provided by the Inner Mongolia Dengkou Desert Ecosystem National Observation Research Station, the Experimental Center of Desert Forestry, and the Chinese Academy of Forestry. The authors thank two anonymous reviewers for their constructive comments, which helped improve the quality of the paper.
This research was supported by the following: the National Key R&D Program of China (2016YFE0202900); Fundamental Research Funds of CAF (CAFYBB2020MB007); the Open Project Program of the Ministry of Education Key Laboratory of Ecology and Resource Use of the Mongolian Plateau (KF2020004); the Major Program of the National Natural Science Foundation of China, the National Science and Technology Major Project, and the Ministry of Science and Technology of China (nos. 2017ZX07101004, 2018YFC0507100, 2019ZD003, 31971726); the National Non-profit Institute Research Grant of the Chinese Academy of Forestry (grant number CAFYBB2018ZA004); and research grants from the Fundamental Research Funds for the Central Universities (BLX201814, no. 2015ZCQ-SB-01).
This paper was edited by Bob Su and reviewed by two anonymous referees.
Bestelmeyer, B. T., Okin, G. S., Duniway, M. C., Archer, S. R., Sayre, N. F., Williamson, J. C., and Herrick, J. E.: Desertification, land use, and the transformation of global drylands, Front. Ecol. Environ., 13, 28–36, 2015.
Billesbach, D. J. A. and Meteorology, F.: Estimating uncertainties in individual eddy covariance flux measurements: A comparison of methods and a proposed new method, Agr. Forest Meteorol., 151, 394–405, 2011.
Burba, G. and Anderson, D.: A brief practical guide to eddy covariance flux measurements: principles and workflow examples for scientific and industrial applications, LI-COR Biosciences, Lincoln, USA, ISBN 978-0615430133, January 2005.
Chen, C., Park, T., Wang, X., Piao, S., Xu, B., Chaturvedi, R. K., Fuchs, R., Brovkin, V., Ciais, P., and Fensholt, R.: China and India lead in greening of the world through land-use management, Nat. Sustain., 2, 122–129, https://doi.org/10.1038/s41893-019-0220-7, 2019.
Cheng, Y., Zhan, H., Yang, W., Dang, H., and Li, W.: Is annual recharge coefficient a valid concept in arid and semi-arid regions?, Hydrol. Earth Syst. Sci., 21, 5031–5042, https://doi.org/10.5194/hess-21-5031-2017, 2017.
Cheng, Y., Li, Y., Zhan, H., Liang, H., Yang, W., Zhao, Y., and Li, T.: New comparative experiments of different soil types for farmland water conservation in arid regions, Water, 10, 298, https://doi.org/10.3390/w10030298, 2018a.
Cheng, Y., Li, Y., Zhan, H., Liang, H., Yang, W., Zhao, Y., and Li, T. J. W.: New comparative experiments of different soil types for farmland water conservation in arid regions, Water, 10, 298, https://doi.org/10.3390/w10030298, 2018b.
Cheng, Y., Zhan, H., Yang, W., Guo, F., Jiang, Q., and Wang, Y.: On change of soil moisture distribution with vegetation reconstruction in Mu Us sandy land of China, with new designed Lysimeter, https://doi.org/10.21203/rs.3.rs-56806/v1, 2020a.
Cheng, Y., Zhan, H., Yang, W., Jiang, Q., Wang, Y., and Guo, F. J. A. W. M.: An ecohydrological perspective of reconstructed vegetation in the semi-arid region in drought seasons, Agr. Water Manage., 243, 106488, https://doi.org/10.1016/j.agwat.2020.106488, 2020b.
D'Odorico, P., Bhattachan, A., Davis, K. F., Ravi, S., and Runyan, C. W.: Global desertification: drivers and feedbacks, Adv. Water Resour., 51, 326–344, 2013.
Dregne, H. E. and Chou, N.-T.: Global desertification dimensions and costs, Degrad. Restor. Arid Lands, 73–92, 1992.
Duan, H., Yan, C., Tsunekawa, A., Song, X., Li, S., and Xie, J.: Assessing vegetation dynamics in the Three-North Shelter Forest region of China using AVHRR NDVI data, Environ. Earth Sci., 64, 1011–1020, 2011.
Fan, Y., Miguez-Macho, G., Jobbágy, E. G., Jackson, R. B., and Otero-Casal, C.: Hydrologic regulation of plant rooting depth, P. Natl. Acad. Sci. USA, 114, 10572–10577, 2017.
Fearnehough, W., Fullen, M., Mitchell, D., Trueman, I., and Zhang, J. J. G.: Aeolian deposition and its effect on soil and vegetation changes on stabilised desert dunes in northern China, Geomorphology, 23, 171–182, 1998.
Gao, Y., Zhu, X., Yu, G., He, N., Wang, Q., and Tian, J.: Water use efficiency threshold for terrestrial ecosystem carbon sequestration in China under afforestation, Agr. Forest Meteorol., 195, 32–37, 2014.
Groh, J., Stumpp, C., Lücke, A., Pütz, T., Vanderborght, J., and Vereecken, H.: Inverse estimation of soil hydraulic and transport parameters of layered soils from water stable isotope and lysimeter data, Vadose Zone J., 17, https://doi.org/10.2136/vzj2017.09.0168, 2018.
Hanjie, W. and Hao, Z.: A simulation study on the eco-environmental effects of 3N Shelterbelt in North China, Global Planet. Change, 37, 231–246, https://doi.org/10.1016/S0921-8181(02)00208-4, 2003.
Krishnaswamy, J., Bonell, M., Venkatesh, B., Purandara, B. K., Rakesh, K., Lele, S., Kiran, M., Reddy, V., and Badiger, S.: The groundwater recharge response and hydrologic services of tropical humid forest ecosystems to use and reforestation: Support for the “infiltration-evapotranspiration trade-off hypothesis”, J. Hydrol., 498, 191–209, 2013.
Li, H.-R., Liu, Q.-B., Wang, W.-Y., Yang, L.-S., Li, Y.-H., Feng, F.-J., Zhao, X.-Y., Hou, K., and Wang, G.: Fluoride in drinking water, brick tea infusion and human urine in two counties in Inner Mongolia, China, J. Hazard. Mater., 167, 892–895, https://doi.org/10.1016/j.jhazmat.2009.01.094, 2009.
Li, X. R., Ma, F. Y., Xiao, H. L., Wang, X. P., and Kim, K. C.: Long-term effects of revegetation on soil water content of sand dunes in arid region of Northern China, J. Arid Environ., 57, 1–16, https://doi.org/10.1016/S0140-1963(03)00089-2, 2004.
Liu, J. and Diamond, J.: China's environment in a globalizing world, Nature, 435, 1179, https://doi.org/10.1038/4351179a, 2005.
Liu, X., He, Y., Zhao, X., Zhang, T., Zhang, L., Ma, Y., Yao, S., Wang, S., and Wei, S.: Characteristics of deep drainage and soil water in the mobile sandy lands of Inner Mongolia, northern China, J. Arid Land, 7, 238–250, https://doi.org/10.1007/s40333-014-0095-4, 2015.
Maes, W. H., Gentine, P., Verhoest, N. E., Miralles, D. G. J. H., and Sciences, E. S.: Potential evaporation at eddy-covariance sites across the globe, Hydrol. Earth Syst. Sci., 23, 925–948, https://doi.org/10.5194/hess-23-925-2019, 2019.
Mohanty, B. P. and Yang, Z.: Comment on “A simulation analysis of the advective effect on evaporation using a two‐phase heat and mass flow model” by Yijian Zeng, Zhongbo Su, Li Wan, and Jun Wen, Water Resour. Res., 49, 7831–7835, https://doi.org/10.1002/2013WR013489, 2013.
Mousavi, S. J. and Shourian, M.: Adaptive sequentially space-filling metamodeling applied in optimal water quantity allocation at basin scale, Water Resour. Res., 46, W03520, https://doi.org/10.1029/2008wr007076, 2010.
Newman, B. D., Vivoni, E. R., and Groffman, A. R.: Surface water–groundwater interactions in semiarid drainages of the American southwest, Hydrol. Process., 20, 3371–3394, 2006.
Pei, S., Fu, H., and Wan, C. J. A.: Ecosystems, and Environment: Changes in soil properties and vegetation following exclosure and grazing in degraded Alxa desert steppe of Inner Mongolia, China, Agricult. Ecosyst. Environ., 124, 33–39, https://doi.org/10.1016/j.agee.2007.08.008, 2008.
Ramier, D., Boulain, N., Cappelaere, B., Timouk, F., Rabanit, M., Lloyd, C. R., Boubkraoui, S., Métayer, F., Descroix, L., and Wawrzyniak, V.: Towards an understanding of coupled physical and biological processes in the cultivated Sahel – 1. Energy and water, J. Hydrol., 375, 204–216, 2009.
Reynolds, J. F., Smith, D. M. S., Lambin, E. F., Turner, B., Mortimore, M., Batterbury, S. P., Downing, T. E., Dowlatabadi, H., Fernández, R. J., and Herrick, J. E.: Global desertification: building a science for dryland development, Science, 316, 847–851, 2007a.
Reynolds, J. F., Smith, D. M. S., Lambin, E. F., Turner, B. L., Mortimore, M., Batterbury, S. P. J., Downing, T. E., Dowlatabadi, H., Fernández, R. J., Herrick, J. E., Huber-Sannwald, E., Jiang, H., Leemans, R., Lynam, T., Maestre, F. T., Ayarza, M., and Walker, B.: Global Desertification: Building a Science for Dryland Development, Science, 316, 847–851, https://doi.org/10.1126/science.1131634, 2007b.
Scanlon, B. R.: Water and heat fluxes in desert soils 1 field studies, Water Resour. Res., 30, 709–719, 1994.
Scanlon, B. R. and Milly, P. C. D.: Water and heat fluxes in desert soils 2 numerical simulation, Water Resour. Res., 30, 721–733, 1994.
Scibek, J., Allen, D. M., Cannon, A. J., and Whitfield, P. H.: Groundwater–surface water interaction under scenarios of climate change using a high-resolution transient groundwater model, J. Hydrol., 333, 165–181, 2007.
Skarpe, C.: Spatial patterns and dynamics of woody vegetation in an arid savanna, J. Veg. Sci., 2, 565–572, 1991.
Sprenger, M., Volkmann, T. H. M., Blume, T., and Weiler, M.: Estimating flow and transport parameters in the unsaturated zone with pore water stable isotopes, Hydrol. Earth Syst. Sci., 19, 2617–2635, https://doi.org/10.5194/hess-19-2617-2015, 2015.
Su, Y. Z. and Lin Zhao, H.: Soil properties and plant species in an age sequence of Caragana microphylla plantations in the Horqin Sandy Land, north China, Ecol. Eng., 20, 223–235, 2003.
Tao, W.: Aeolian desertification and its control in Northern China, Int. Soil Water Conserv. Res., 2, 34–41, https://doi.org/10.1016/S2095-6339(15)30056-3, 2014.
Wang, S., Cornelis van Kooten, G., and Wilson, B.: Mosaic of reform: forest policy in post-1978 China, Forest Policy Econ., 6, 71–83, https://doi.org/10.1016/S1389-9341(02)00078-3, 2004.
Wang, T., Sun, J.-G., Han, H., and Yan, C.-Z.: The relative role of climate change and human activities in the desertification process in Yulin region of northwest China, Environ. Monit. Assess., 184, 7165–7173, https://doi.org/10.1007/s10661-011-2488-6, 2012.
Wang, X., Zhang, C., Hasi, E., and Dong, Z.: Has the Three Norths Forest Shelterbelt Program solved the desertification and dust storm problems in arid and semiarid China?, J. Arid Environ., 74, 13–22, 2010a.
Wang, X. M., Zhang, C. X., Hasi, E., and Dong, Z. B.: Has the Three Norths Forest Shelterbelt Program solved the desertification and dust storm problems in arid and semiarid China?, J. Arid Environ., 74, 13–22, https://doi.org/10.1016/j.jaridenv.2009.08.001, 2010b.
Wang, Y., Zhao, H.-L., and Zhao, X.-Y.: Effects of land use intensity on the restoration capacity of sandy land vegetation and soil moisture in fenced sandy land in desert area, Contemp. Probl. Ecol., 6, 128–136, 2013.
Yan, Y., Xin, X., Xu, X., Wang, X., Yang, G., Yan, R., Chen, B.: Quantitative effects of wind erosion on the soil texture and soil nutrients under different vegetation coverage in a semiarid steppe of northern China, Plant Soil, 369, 585–598, https://doi.org/10.1007/s11104-013-1606-3, 2013.
Yu, C., Muñoz-Carpena, R., Gao, B., and Perez-Ovilla, O.: Effects of ionic strength, particle size, flow rate, and vegetation type on colloid transport through a dense vegetation saturated soil system: Experiments and modeling, J. Hydrol., 499, 316–323, https://doi.org/10.1016/j.jhydrol.2013.07.004, 2013.
Yu, L., Zeng, Y., Wen, J., and Su, Z.: Liquid-Vapor-Air Flow in the Frozen Soil, J. Geophys. Res.-Atmos., 123, 7393–7415, 2018.
Yu, L., Zeng, Y., and Su, Z.: Understanding the mass, momentum, and energy transfer in the frozen soil with three levels of model complexities, Hydrol. Earth Syst. Sci., 24, 4813–4830, https://doi.org/10.5194/hess-24-4813-2020, 2020.
Zeng, Y. and Su, Z.: Reply to comment by Binayak P. Mohanty and Zhenlei Yang on “A simulation analysis of the advective effect on evaporation using a two-phase heat and mass flow model”, Water Resour. Res., 49, 7836–7840, 2013.
Zeng, Y., Su, Z., Wan, L., Yang, Z., Zhang, T., Tian, H., Shi, X., Wang, X., and Cao, W.: Diurnal pattern of the drying front in desert and its application for determining the effective infiltration, Hydrol. Earth Syst. Sci., 13, 703–714, https://doi.org/10.5194/hess-13-703-2009, 2009a.
Wan, L., Su, Z., Saito, H., Huang, K., and Wang, X.: Diurnal soil water dynamics in the shallow vadose zone (field site of China University of Geosciences, China), Environ. Geol., 58, 11–23, https://doi.org/10.1007/s00254-008-1485-8, 2009b.
Zeng, Y., Su, Z., Wan, L., and Wen, J.: A simulation analysis of the advective effect on evaporation using a two-phase heat and mass flow model, Water Resour. Res., 47, W10529, https://doi.org/10.1029/2011wr010701, 2011a.
Zeng, Y., Su, Z., Wan, L., and Wen, J. Numerical analysis of air-water-heat flow in unsaturated soil: Is it necessary to consider airflow in land surface models?, J. Geophys. Res.-Atmos., 116, D20107, https://doi.org/10.1029/2011jd015835, 2011b.
Zha, Y. and Gao, J.: Characteristics of desertification and its rehabilitation in China, J. Arid Environ., 37, 419–432, https://doi.org/10.1006/jare.1997.0290, 1997.
Zhang, G.-H., Liu, G. B., Wang, G. L., and Wang, Y. X.: Effects of vegetation cover and rainfall intensity on sediment-associated nitrogen and phosphorus losses and particle size composition on the Loess Plateau, J. Soil Water Conserv., 66, 192–200, https://doi.org/10.2489/jswc.66.3.192, 2011.