the Creative Commons Attribution 4.0 License.
the Creative Commons Attribution 4.0 License.
 | 20 Nov 2020
Accelerated hydrological cycle over the Sanjiangyuan region induces more streamflow extremes at different global warming levels
Feng Ma
Serving source water for the Yellow, Yangtze and Lancang-Mekong rivers, the Sanjiangyuan region affects 700 million people over its downstream areas. Recent research suggests that the Sanjiangyuan region will become wetter in a warming future, but future changes of streamflow extremes remain unclear due to the complex hydrological processes over high-land areas and limited knowledge of the influences of land cover change and CO2 physiological forcing. Based on high-resolution land surface modeling during 1979–2100 driven by the climate and ecological projections from 11 newly released Coupled Model Intercomparison Project Phase 6 (CMIP6) climate models, we show that different accelerating rates of precipitation and evapotranspiration at 1.5 ∘C global warming level induce 55 % more dry extremes over Yellow River and 138 % more wet extremes over Yangtze River headwaters compared with the reference period (1985–2014). An additional 0.5 ∘C warming leads to a further nonlinear and more significant increase for both dry extremes over Yellow River (22 %) and wet extremes over Yangtze River (64 %). The combined role of CO2 physiological forcing and vegetation greening, which used to be neglected in hydrological projections, is found to alleviate dry extremes at 1.5 and 2.0 ∘C warming levels but to intensify dry extremes at 3.0 ∘C warming level. Moreover, vegetation greening contributes half of the differences between 1.5 and 3.0 ∘C warming levels. This study emphasizes the importance of ecological processes in determining future changes in streamflow extremes and suggests a “dry gets drier, wet gets wetter” condition over the warming headwaters.
- Article
(8509 KB) - Full-text XML
- BibTeX
- EndNote


Global temperature has increased at a rate of 0.17∘C per decade since 1970, contrary to the cooling trend over the past 8000 years (Marcott et al., 2013). The temperature measurements suggest that 2015–2019 is the warmest 5 years and 2010–2019 is also the warmest decade since 1850 (WMO, 2020). To mitigate the impact of this unprecedented warming on the global environment and human society, 195 nations adopted the Paris Agreement, which commits to “hold the increase in the global average temperature to well below 2 ∘C above preindustrial levels and pursuing efforts to limit the temperature increase to 1.5 ∘C”.
The response of regional and global terrestrial hydrological processes (e.g., streamflow and its extremes) to different global warming levels has been investigated by numerous studies in recent years (Döll et al., 2018; Hoegh-Guldberg et al., 2018; Marx et al., 2018; Mohammed et al., 2017; Thober et al., 2018; Xu et al., 2019; Zhang et al., 2016). In addition to climate change, recent works reveal the importance of ecological factors (e.g., CO2 physiological forcing and land cover change) in modulating streamflow and its extremes. For example, increasing CO2 concentration is found to alleviate the decreasing trend of streamflow in the future at the global scale through decreasing the stomatal conductance and vegetation transpiration (known as CO2 physiological forcing) (Fowler et al., 2019; Wiltshire et al., 2013; Yang et al., 2019; Zhu et al., 2012). Contrary to CO2 physiological forcing, vegetation greening in a warming climate is found to play a significant role in exacerbating hydrological drought, as it enhances transpiration and dries up the land (Yuan et al., 2018b). However, the relative contributions of CO2 physiological forcing and vegetation greening to the changes in terrestrial hydrology, especially the streamflow extremes, are still unknown, and whether their combined impact differs among different warming levels needs to be investigated.
Hosting the headwaters of the Yellow River, the Yangtze River and the Lancang-Mekong River, the Sanjiangyuan region is known as the “Asian Water Tower” and affects 700 million people over its downstream areas. Changes of streamflow and its extremes over the Sanjiangyuan region not only influence local ecosystems, environment and water resources, but also the security of food, energy and water over the downstream areas. Both the regional climate and ecosystems show significant changes over the Sanjiangyuan region due to global warming (Bibi et al., 2018; Kuang and Jiao, 2016; Liang et al., 2013; Yang et al., 2013; Zhu et al., 2016). Historical changes of climate and ecology (e.g., land cover) are found to cause significant reduction in mean and high flows over the Yellow River headwaters during 1979–2005, which potentially increases drought risk over its downstream areas (Ji and Yuan, 2018). And CO2 physiological forcing is revealed to cause equally large changes in regional flood extremes as the precipitation over the Yangtze and Mekong rivers (Fowler et al., 2019). Thus the Sanjiangyuan region is a sound region to investigate the role of climate change and ecological change (e.g., land cover change and CO2 physiological forcing) in influencing the streamflow and its extremes (Cuo et al., 2014; Ji and Yuan, 2018; Zhu et al., 2013). Recent research suggests that the Sanjiangyuan region will become warmer and wetter in the future, and extreme precipitation will also increase at the 1.5 ∘C global warming level and further intensify with a 0.5 ∘C additional warming (Li et al., 2018; Zhao et al., 2019). However, how the streamflow extremes would respond to the 1.5 ∘C warming, what an additional 0.5 ∘C or even greater warming would cause and how much ecological factors (e.g., CO2 physiological forcing and land cover change) contribute are still unknown. Solving the above issues is essential for assessing the climate and ecological impact on this vital headwater region.
In this study, we investigated the future changes in the streamflow extremes over the Sanjiangyuan region from an integrated ecohydrological perspective by taking CO2 physiological forcing and land cover change into consideration. The combined impacts of the above two ecological factors at different global warming levels were also quantified and compared with the impact of climate change. The results will help understand the role of ecological factors in future terrestrial hydrological changes over the headwater regions like the Sanjiangyuan and provide guidance and support for the stakeholders to make relevant decisions and plans.
2.1 Study domain and observational data
The Sanjiangyuan region is located at the eastern part of the Tibetan Plateau (Fig. 1a), with the total area and mean elevation being 3.61 × 10⁵ km2 and 5000 m respectively. It plays a critical role in providing freshwater, by contributing 35 %, 20 % and 8 % to the total annual streamflow of the Yellow, Yangtze and Lancang-Mekong rivers (Li et al., 2017; Liang et al., 2013). The source regions of Yellow, Yangtze and Lancang-Mekong rivers each account for 46 %, 44 % and 10 % of the total area of the Sanjiangyuan, and the Yellow River source region has a warmer climate and sparser snow cover than the Yangtze River source region.
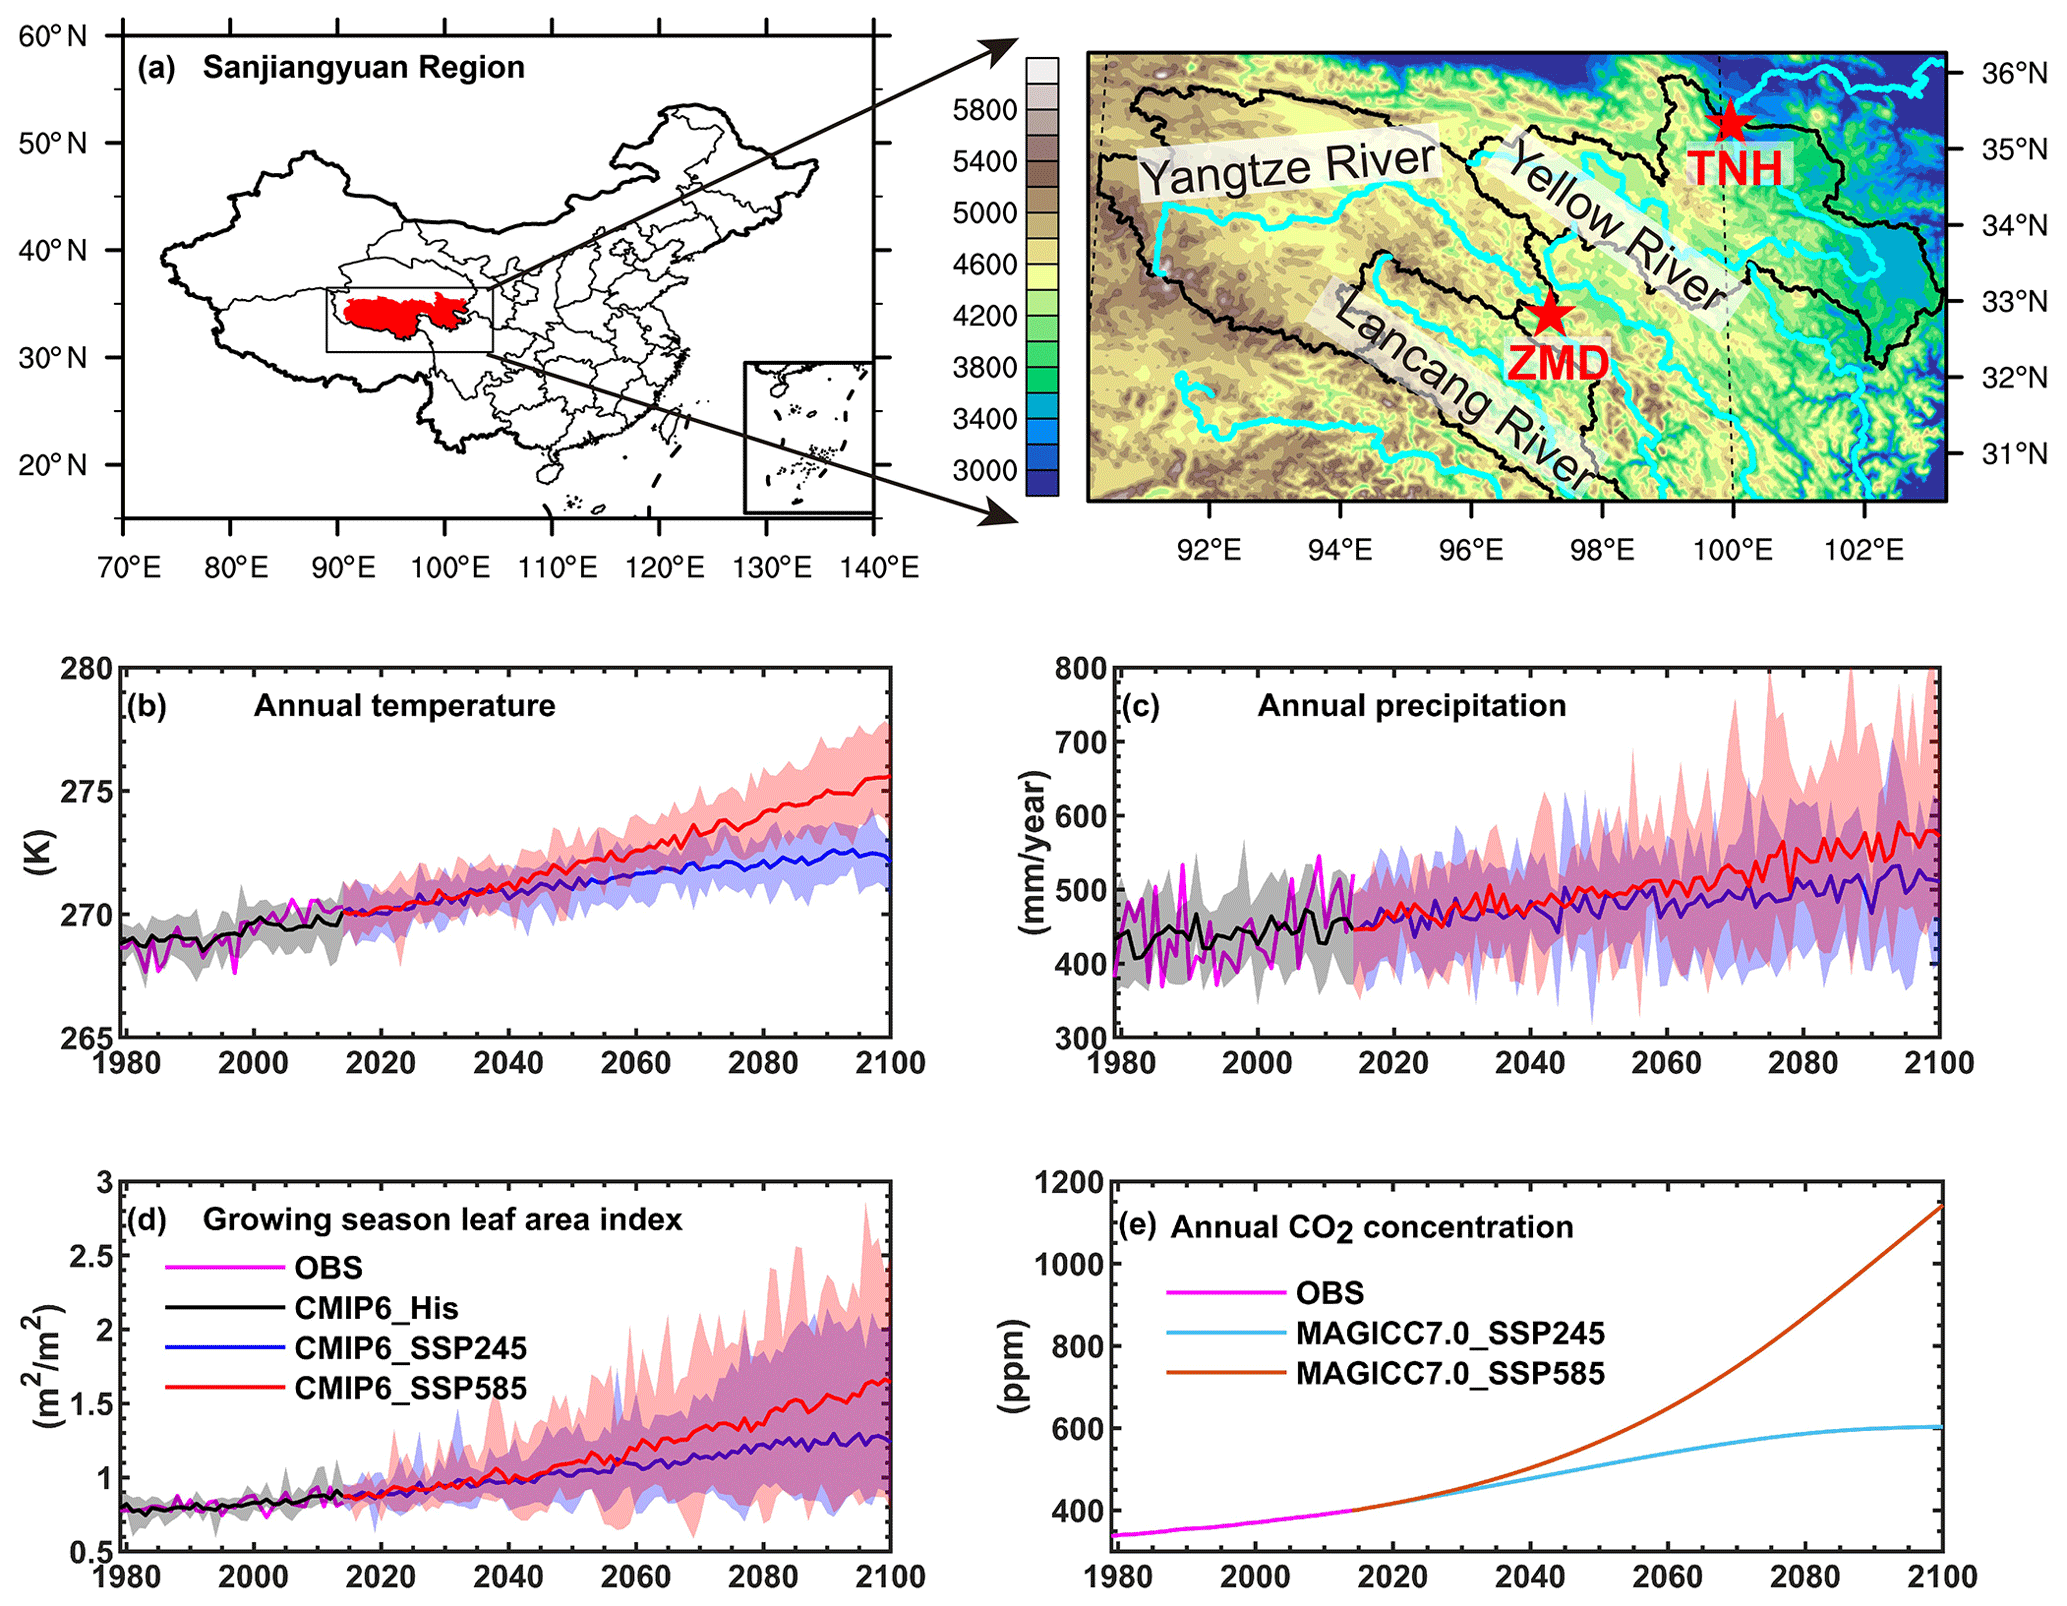
Figure 1(a) The locations of the Sanjiangyuan region and streamflow gauges. (b–d) The time series of annual temperature, precipitation and growing season leaf area index averaged over the Sanjiangyuan region during 1979–2100. (e) Observed and simulated annual CO2 concentration over the Sanjiangyuan region. Red stars on the right in (a) are two streamflow stations named Tangnaihai (TNH) and Zhimenda (ZMD). Black, blue and red lines in (b–d) are ensemble means of CMIP6 model simulations from the historical, SSP245 and SSP585 experiments. Shadings show the ranges of individual ensemble members. Cyan and brown lines in (e) are future CO2 concentration under SSP245 and SSP585 scenarios simulated by the MAGICC7.0 model.
Monthly streamflow observations from the Tangnaihai (TNH) and the Zhimenda (ZMD) hydrological stations (Fig. 1a), which were provided by the local authorities, were used to evaluate the streamflow simulations. Data periods are 1979–2011 and 1980–2008 for the Tangnaihai and Zhimenda stations, respectively. Estimations of monthly terrestrial water storage change and its uncertainty during 2003–2014 were provided by the Jet Propulsion Laboratory (JPL), which used the mass concentration blocks (mascons) as basis functions to fit the Gravity Recovery and Climate Experiment (GRACE) satellite's inter-satellite ranging observations (Watkins et al., 2015). The Model Tree Ensemble evapotranspiration (MTE_ET; Jung et al., 2009) and the Global Land Evaporation Amsterdam Model evapotranspiration (GLEAM_ET) version 3.3a (Martens et al., 2017) were used to evaluate the ET simulation.
2.2 CMIP6 data
Here, 19 Coupled Model Intercomparison Project Phase 6 (CMIP6; Eyring et al., 2016) models which provide precipitation, near-surface temperature, specific humidity, 10 m wind speed and surface downward shortwave and longwave radiation at a daily timescale were first selected for evaluation. Then, models were chosen for the analysis when the simulated meteorological forcings (e.g., precipitation, temperature, humidity, and shortwave radiation) averaged over the Sanjiangyuan region have the same trend signs as the observations during 1979–2014. Table 1 shows the 11 CMIP6 models that were finally chosen in this study. For the future projection (2015–2100), we chose two Shared Socioeconomic Pathway (SSP) experiments: SSP585 and SSP245. SSP585 combines the fossil-fueled development socioeconomic pathway and 8.5 W m−2 forcing pathway (RCP8.5), while SSP245 combines the moderate development socioeconomic pathway and 4.5 W m−2 forcing pathway (RCP4.5) (O'Neill et al., 2016). Land cover change is quantified by the leaf area index (LAI) as there is no significant transition between different vegetation types (not shown) according to the Land-use Harmonization 2 (LUH2) dataset (https://esgf-node.llnl.gov/search/input4mips/, last access: 1 April 2020). For the CNRM-CM6-1, FGOALS-g3 and CESM2, the ensemble mean of LAI simulations from the other 8 CMIP6 models was used because CNRM-CM6-1 and FGOALS-g3 do not provide dynamic LAI, while the CESM2 simulates an abnormally large LAI over the Sanjiangyuan region. To avoid systematic bias in meteorological forcing, the trend-preserved bias correction method suggested by ISI-MIP (Hempel et al., 2013) was applied to the CMIP6 model simulations at monthly scale. The China Meteorological Forcing Dataset (CMFD) was taken as meteorological observations (He et al., 2020). For each month, the temperature bias in CMIP6 simulations during 1979–2014 was directly deducted. Future temperature simulations in SSP245 and SSP585 experiments were also adjusted according to the historical bias. Other variables were corrected using a multiplicative factor, which was calculated using observations to divide simulation during 1979–2014. In addition, monthly leaf area index was also adjusted to be consistent with satellite observation using the same method as temperature. All variables were first interpolated to a 10 km resolution over the Sanjiangyuan region, and the bias correction was performed for each CMIP6 model at each grid. After bias correction, absolute changes of temperature and leaf area index and relative changes of other variables were preserved at a monthly timescale (Hempel et al., 2013). Then, the adjusted CMIP6 daily meteorological forcings were disaggregated into hourly time steps using the diurnal cycle ratios from the China Meteorological Forcing Dataset.
The historical CO2 concentration used here is the same as the CMIP6 historical experiment (Meinshausen et al., 2017), while future CO2 concentration in SSP245 and SSP585 scenarios came from simulations of a reduced-complexity carbon-cycle model, MAGICC7.0 (Meinshausen et al., 2020).
Table 1CMIP6 simulations used in this study. “His” means historical simulations during 1979–2014 with both anthropogenic and natural forcings; SSP245 and SSP585 represent two Shared Socioeconomic Pathways during 2015–2100. Note the CNRM-CM6-1 and CNRM-ESM2-1 do not provide r1i1p1f1 realization, so r1i1p1f2 was used instead.

2.3 Experimental design
The land surface model used in this study is the Conjunctive Surface-Subsurface Process model version 2 (CSSPv2), which has been proved to simulate the energy and water processes over the Sanjiangyuan region well (Yuan et al., 2018a). Figure 2 shows the structure and main ecohydrological processes in CSSPv2. The CSSPv2 is rooted in the Common Land Model (CoLM; Dai et al., 2003), with some improvements of hydrological processes. CSSPv2 has a volume-averaged soil moisture transport (VAST) model, which solves the quasi-three-dimensional transportation of the soil water and explicitly considers the variability of moisture flux due to subgrid topographic variations (Choi et al., 2007). Moreover, the Variable Infiltration Capacity runoff scheme (Liang et al., 1994) and the hydrological properties of soil organic matters were incorporated into the CSSPv2 by Yuan et al. (2018a), to improve its performance in simulating the terrestrial hydrology over the Sanjiangyuan region. Similar to CoLM and the Community Land Model (Oleson et al., 2013), vegetation transpiration in CSSPv2 is based on Monin–Obukhov similarity theory, and the transpiration rate is constrained by the leaf boundary layer and stomatal conductance. Parameterization of the stomatal conductance (gs) in CSSPv2 is
where m is a plant functional type-dependent parameter, An is leaf net photosynthesis (µ mol CO2 m−2 s−1), is the CO2 partial pressure at the leaf surface (Pa), Patm is the atmospheric pressure (Pa), hs is the leaf surface humidity and b is the minimum stomatal conductance (µ mol m−2 s−1), while βt is the soil water stress function. Generally, the stomatal conductance decreases with an increase in CO2 concentration.
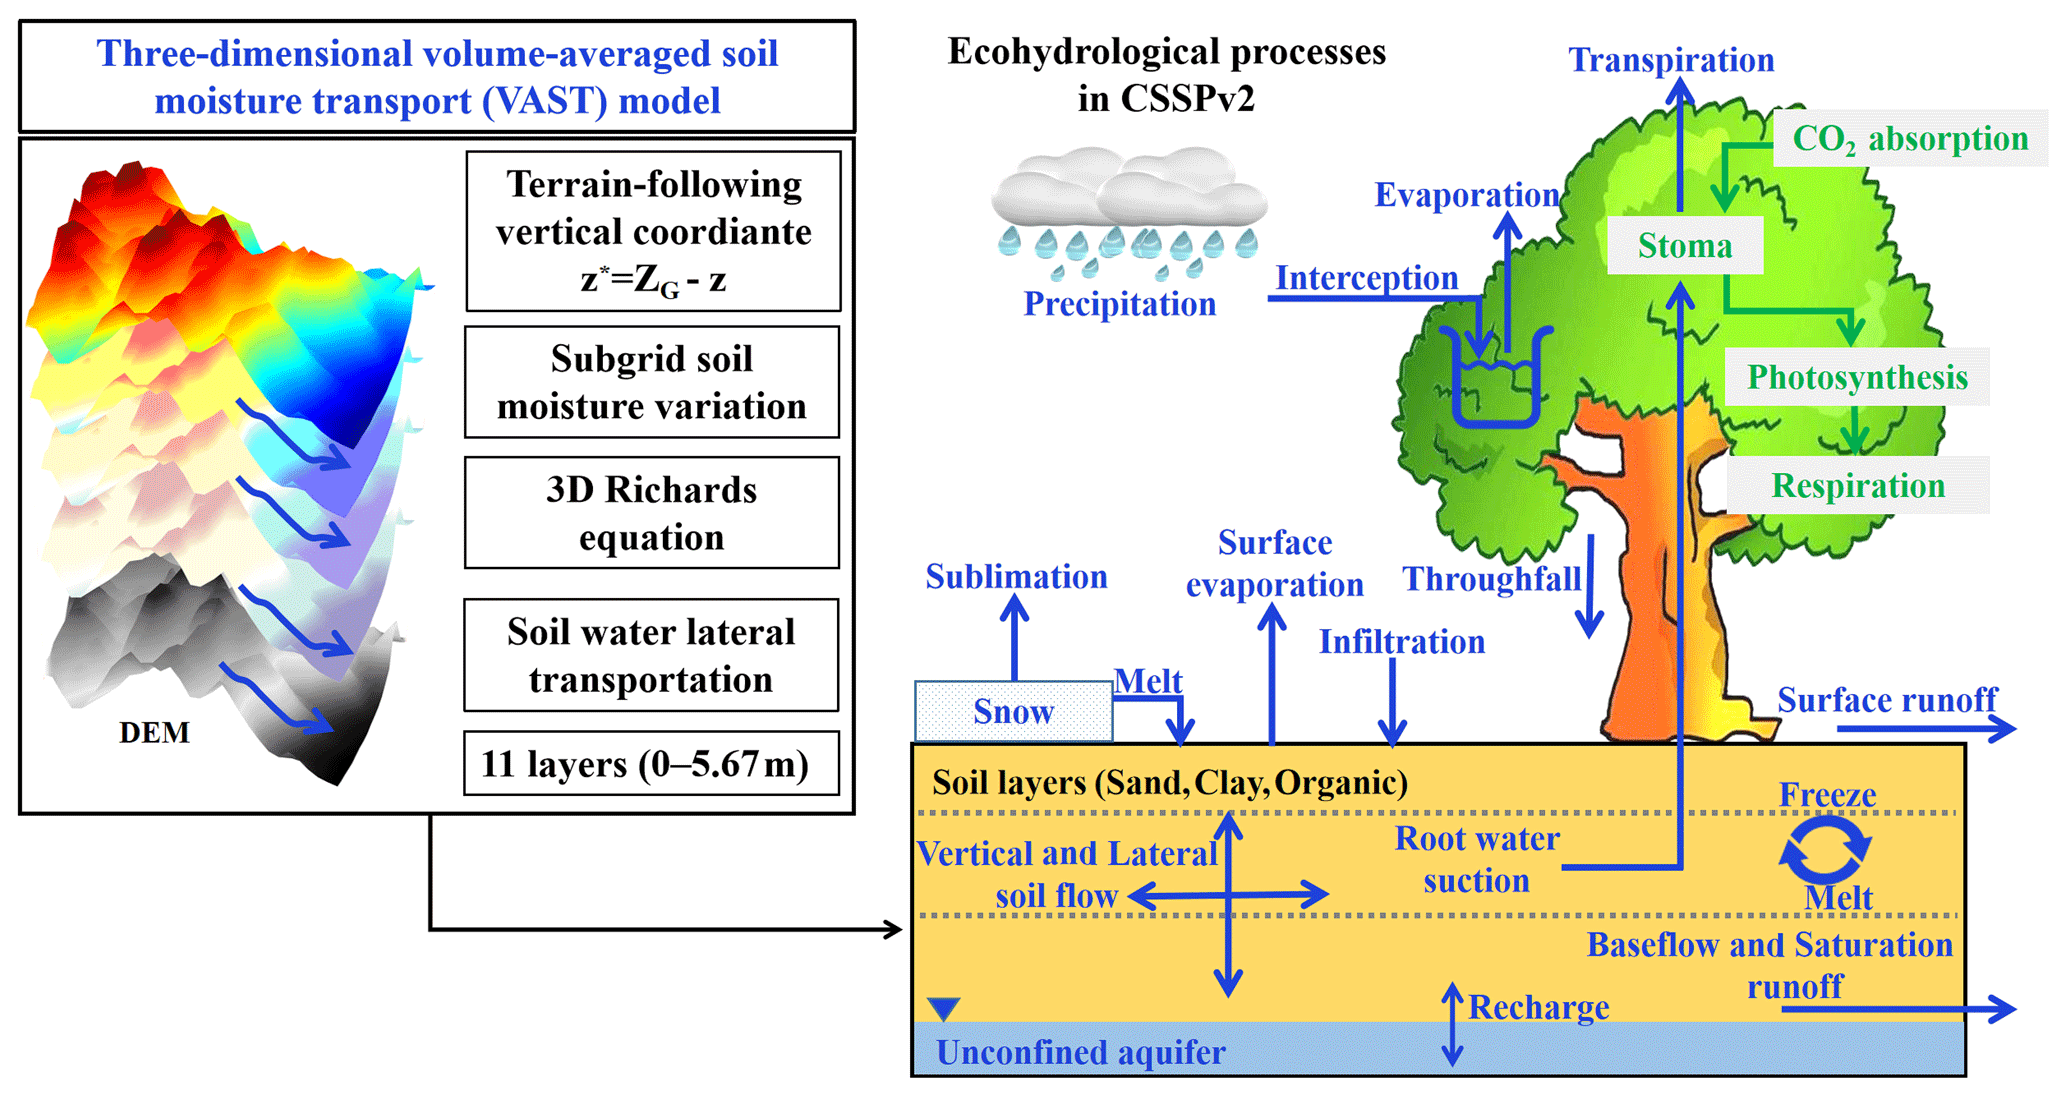
Figure 2Main ecohydrological processes in the Conjunctive Surface-Subsurface Process version 2 (CSSPv2) land surface model.
First, bias-corrected meteorological forcings from CMIP6 historical experiment were used to drive the CSSPv2 model (CMIP6_His/CSSPv2). All simulations were conducted for two cycles during 1979–2014 at a half-hourly time step and a 10 km spatial resolution, with the first cycle serving as the spin-up. The correlation coefficient (CC) and root mean square error (RMSE) were calculated for validating the simulated monthly streamflow, annual evapotranspiration and monthly terrestrial water storage. The Kling–Gupta efficiency (KGE; Gupta et al., 2009), which is widely used in streamflow evaluations, was also calculated. The above metrics were calculated as follows:
where xi and yi are observed and simulated variables in a specific month (or a specific year) i, respectively, and and are the corresponding monthly/annual means during the evaluation period n. The σx and σy are standard deviations for observed and simulated variables respectively. The correlation coefficient represents the correlation between simulation and observation, while the RMSE is the simulated error. The KGE ranges from negative infinity to 1, and model simulations can be regarded as satisfactory when the KGE is larger than 0.5 (Moriasi et al., 2007).
Second, bias-corrected meteorological forcings in SSP245 and SSP585 were used to drive CSSPv2 during 2015–2100 with dynamic LAI and CO2 concentration (CMIP6_SSP/CSSPv2). Initial conditions of CMIP6_SSP/CSSPv2 came from the last year in CMIP6_His/CSSPv2.
Then, the second step was repeated twice by fixing the monthly LAI (CMIP6_SSP/CSSPv2_FixLAI) and mean CO2 concentration (CMIP6_SSP/CSSPv2_FixCO2) at 2014 level. The difference between CMIP6_SSP/CSSPv2 and CMIP6_SSP/CSSPv2_FixLAI is regarded as the net effect of land cover change, and the difference between CMIP6_SSP/CSSPv2 and CMIP6_SSP/CSSPv2_FixCO2 is regarded as the net effect of CO2 physiological forcing.
2.4 Warming level determination
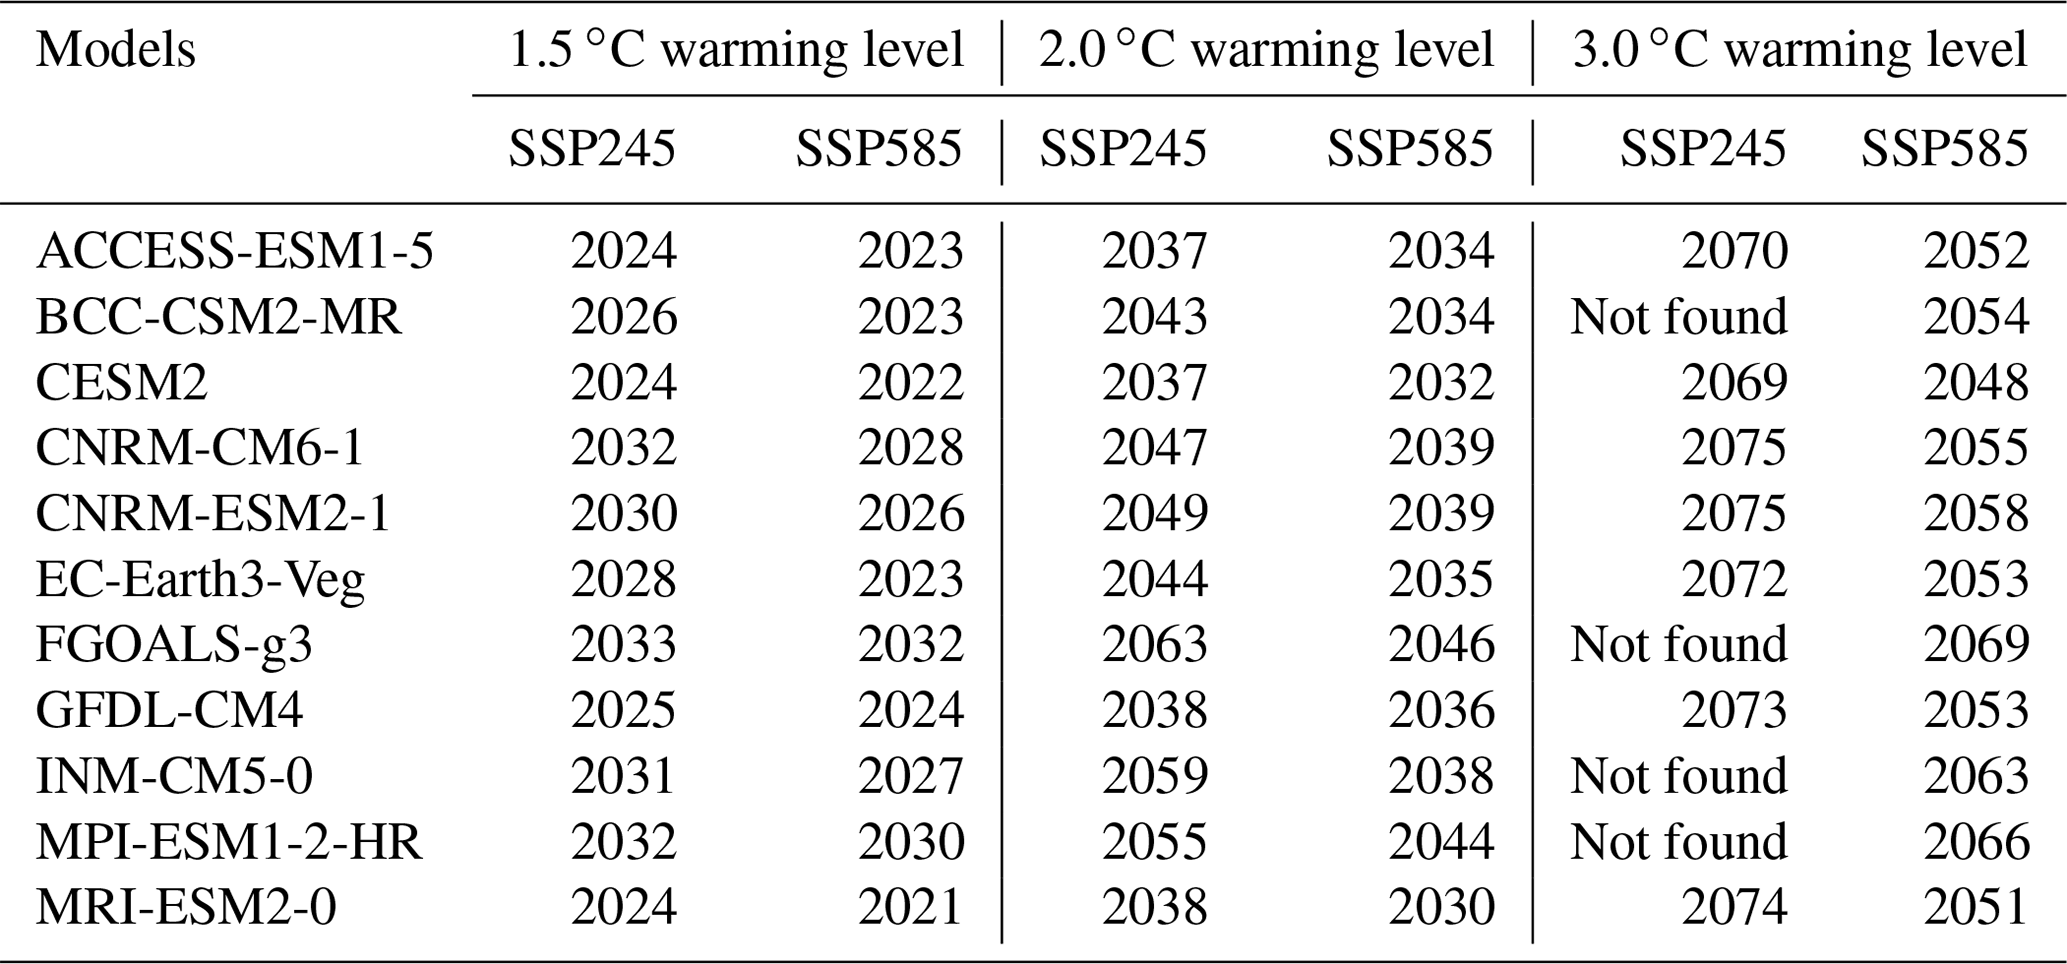
A widely used time-sampling method was adopted to determine the periods of different global warming levels (Chen et al., 2017; Döll et al., 2018; Marx et al., 2018; Mohammed et al., 2017; Thober et al., 2018). According to the HadCRUT4 dataset (Morice et al., 2012), the global mean surface temperature increased by 0.66 ∘C from the preindustrial era (1850–1900) to the reference period defined as 1985-2014. Then, starting from 2015, 30-year running mean global temperatures were compared to those of the 1985–2014 period for each global climate model (GCM) simulation. And the 1.5 ∘C/2.0 ∘C/3.0 ∘C warming period is defined as the 30-year period when the 0.84 ∘C/1.34 ∘C/2.34 ∘C global warming, compared with the reference period (1985–2014), is first reached. The median years of identified 30-year periods, referred to as “crossing years”, are shown in Table 2.
Table 2Determination of “crossing years” for the periods reaching 1.5, 2 and 3 ∘C warming levels for different GCM and SSP combinations.
2.5 Definition of dry and wet extremes and robustness assessment
In this research, the standardized streamflow index (SSI) was used to define dry and wet extremes (Vicente-Serrano et al., 2012; Yuan et al., 2017). The July–August–September (JAS) mean streamflow for each year of the reference period was first collected and used to fit a gamma distribution:
where x is the streamflow, and α and β are parameters. Then the fitted distribution was used to standardize the JAS mean streamflow in each year (i) during both the reference and projection periods as
where Z−1 is the inverse cumulative distribution function of the normal distribution, and F(x) is the cumulative distribution function of the gamma distribution. Here, dry and wet extremes were defined as SSIs smaller than −1.28 (a probability of 10 %) and larger than 1.28 respectively.
The relative changes in frequency of dry/wet extremes between the reference period and different warming periods were first calculated for each GCM under each SSP scenario, and the ensemble means were then determined for each warming level. To quantify the uncertainty, the above calculations were repeated using bootstrapping 10 000 times, and 11 GCMs were resampled with replacement during each bootstrap (Christopher et al., 2018). The 5 % and 95 % percentiles of the total 10 000 estimations were finally taken as the 5 %–95 % uncertainty ranges.
3.1 Terrestrial hydrological changes at different warming levels
As shown in Fig. 1b–e, observations (pink lines) show that the annual temperature, precipitation and growing season LAI increase at the rates of 0.63 ∘C per decade (p=0), 16.9 mm per decade (p=0.02) and 0.02 m2 m−2 per decade (p=0.001) during 1979–2014 respectively. The ensemble means of CMIP6 simulations (black lines) can generally capture the historical increasing trends of temperature (0.30 ∘C per decade, p=0), precipitation (7.1 mm per decade, p=0) and growing season LAI (0.029 m2 m−2 per decade, p=0), although the trends for precipitation and temperature are underestimated. In 2015–2100, the SSP245 scenario (blue lines) shows continued warming, wetting and greening trends, and the trends are larger in the SSP585 scenario (red lines). The CO2 concentration also keeps increasing during 2015–2100 and reaches 600 and 1150 ppm in 2100 for the SSP245 and SSP585 scenarios respectively. Although the SSP585 scenario reaches the same warming levels earlier than the SSP245 scenario (Table 2), there is no significant difference between them in the meteorological variables during the same warming period (not shown). Thus, we do not distinguish SSP245 and SSP585 scenarios at the same warming level in the following analysis.
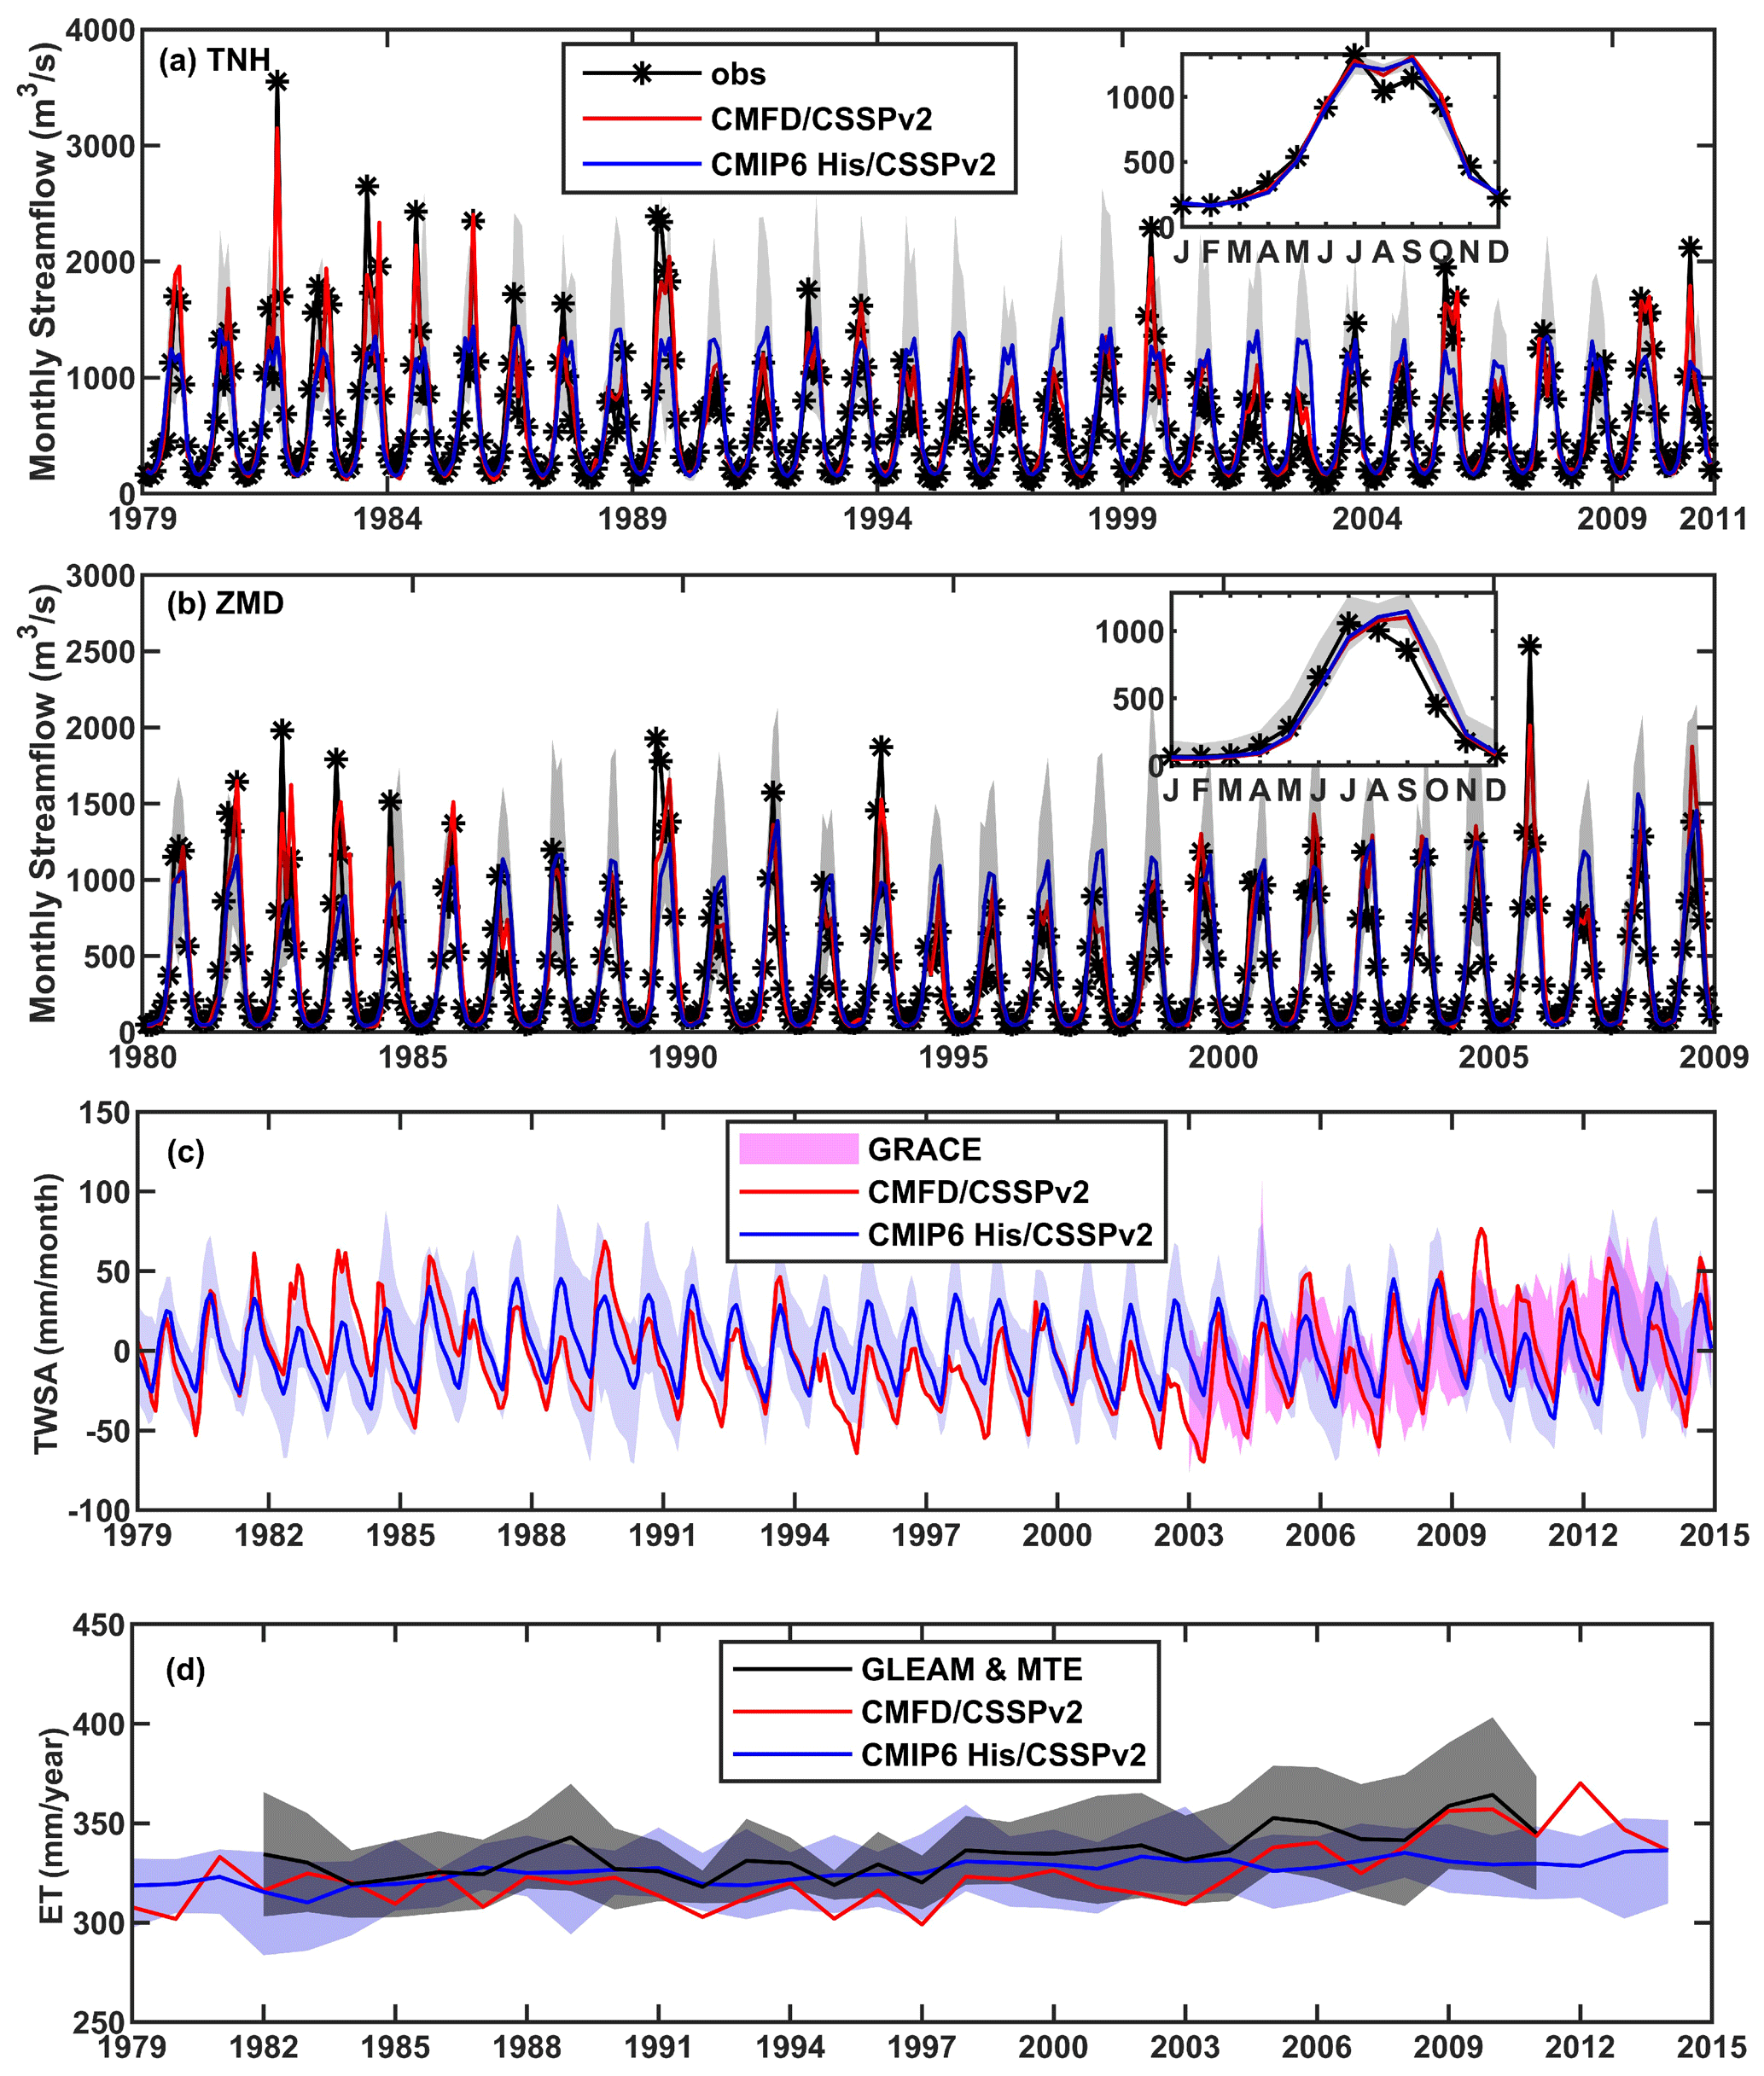
Figure 3Evaluation of model simulations. (a–b) Observed and simulated monthly streamflow at the Tangnaihai (TNH) and Zhimenda (ZMD) hydrological stations, with the climatology shown in the upper-right corner. (c–d) Evaluation of the simulated monthly terrestrial water storage anomaly (TWSA) and annual evapotranspiration (ET) averaged over the Sanjiangyuan region. Red lines are the CSSPv2 simulation forced by observed meteorological forcing. Blue lines represent ensemble means of 11 CMIP6_His/CSSPv2 simulations, while gray shadings in (a)–(b) and blue shadings in (c)–(d) are ranges of individual ensemble members. Pink shading in (c) is GRACE satellite observations. The black line and black shading in (d) are ensemble mean and ranges of GLEAM_ET and MTE_ET datasets.
Table 3Performance of CSSPv2 model simulations driven by the observed meteorological forcing (CMFD/CSSPv2) and the bias-corrected CMIP6 historical simulations (CMIP6_His/CSSPv2). The metrics include the correlation coefficient (CC), root mean square error (RMSE) and Kling–Gupta efficiency (KGE). The KGE is only used to evaluate streamflow.
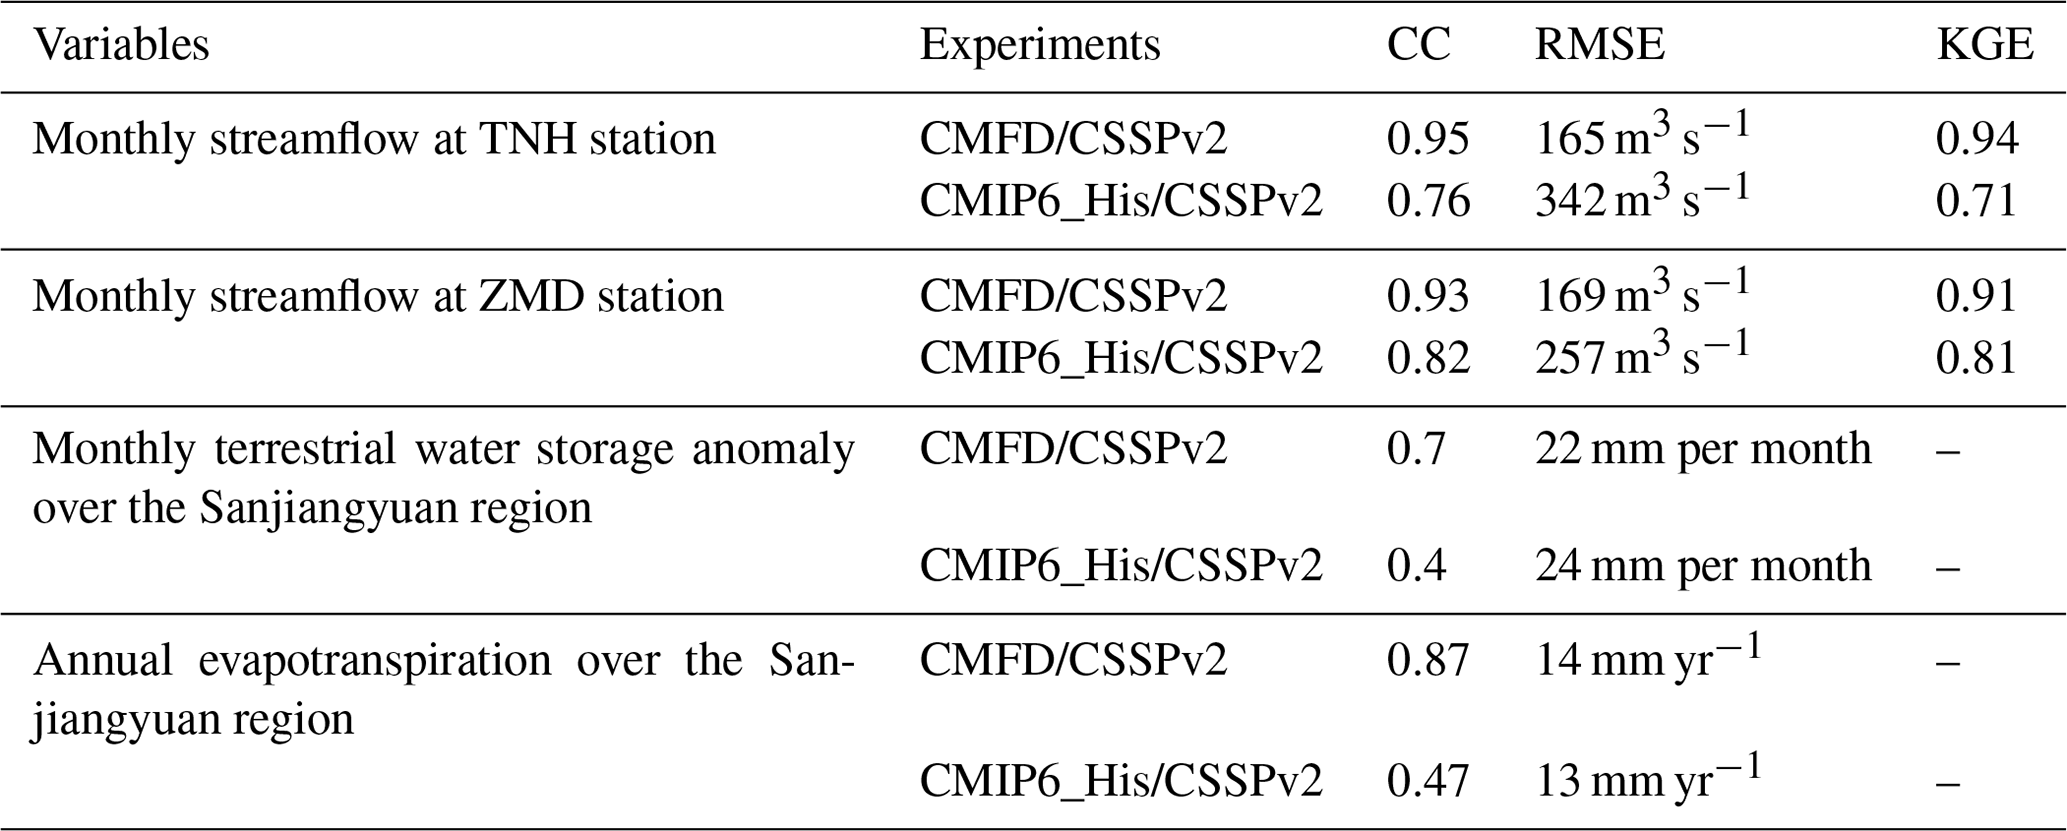
Figure 3 and Table 3 show the evaluation of model simulation. Driven by observed meteorological and ecological forcings, the CMFD/CSSPv2 simulates monthly streamflow over the Yellow and Yangtze River headwaters quite well. The Kling–Gupta efficiencies of CMFD/CSSPv2 simulated monthly streamflow are 0.94 and 0.91 over Tangnaihai (TNH) and Zhimenda (ZMD) stations, respectively. The simulated monthly terrestrial water storage anomaly (TWSA) during 2003–2014 in CMFD/CSSPv2 also agrees with the GRACE satellite observation and captures the increasing trend. For the interannual variations of evapotranspiration, CMFD/CSSPv2 is consistent with the ensemble mean of the GLEAM_ET and MTE_ET products, and the correlation coefficient and root mean square error (RMSE) during 1982–2011 are 0.87 (p < 0.01) and 14 mm yr−1 respectively. This suggests the good performance of the CSSPv2 in simulating the hydrological processes over the Sanjiangyuan region. Although meteorological and ecological outputs from CMIP6 models have coarse resolutions (∼ 100 km), the land surface simulation driven by bias-corrected CMIP6 results (CMIP6_His/CSSPv2) also captures the terrestrial hydrological variations reasonably well. The Kling–Gupta efficiency of the ensemble mean streamflow simulation reaches up to 0.71–0.81, and the ensemble mean monthly TWSA and annual evapotranspiration generally agree with observations and other reference data (Fig. 3c–d).
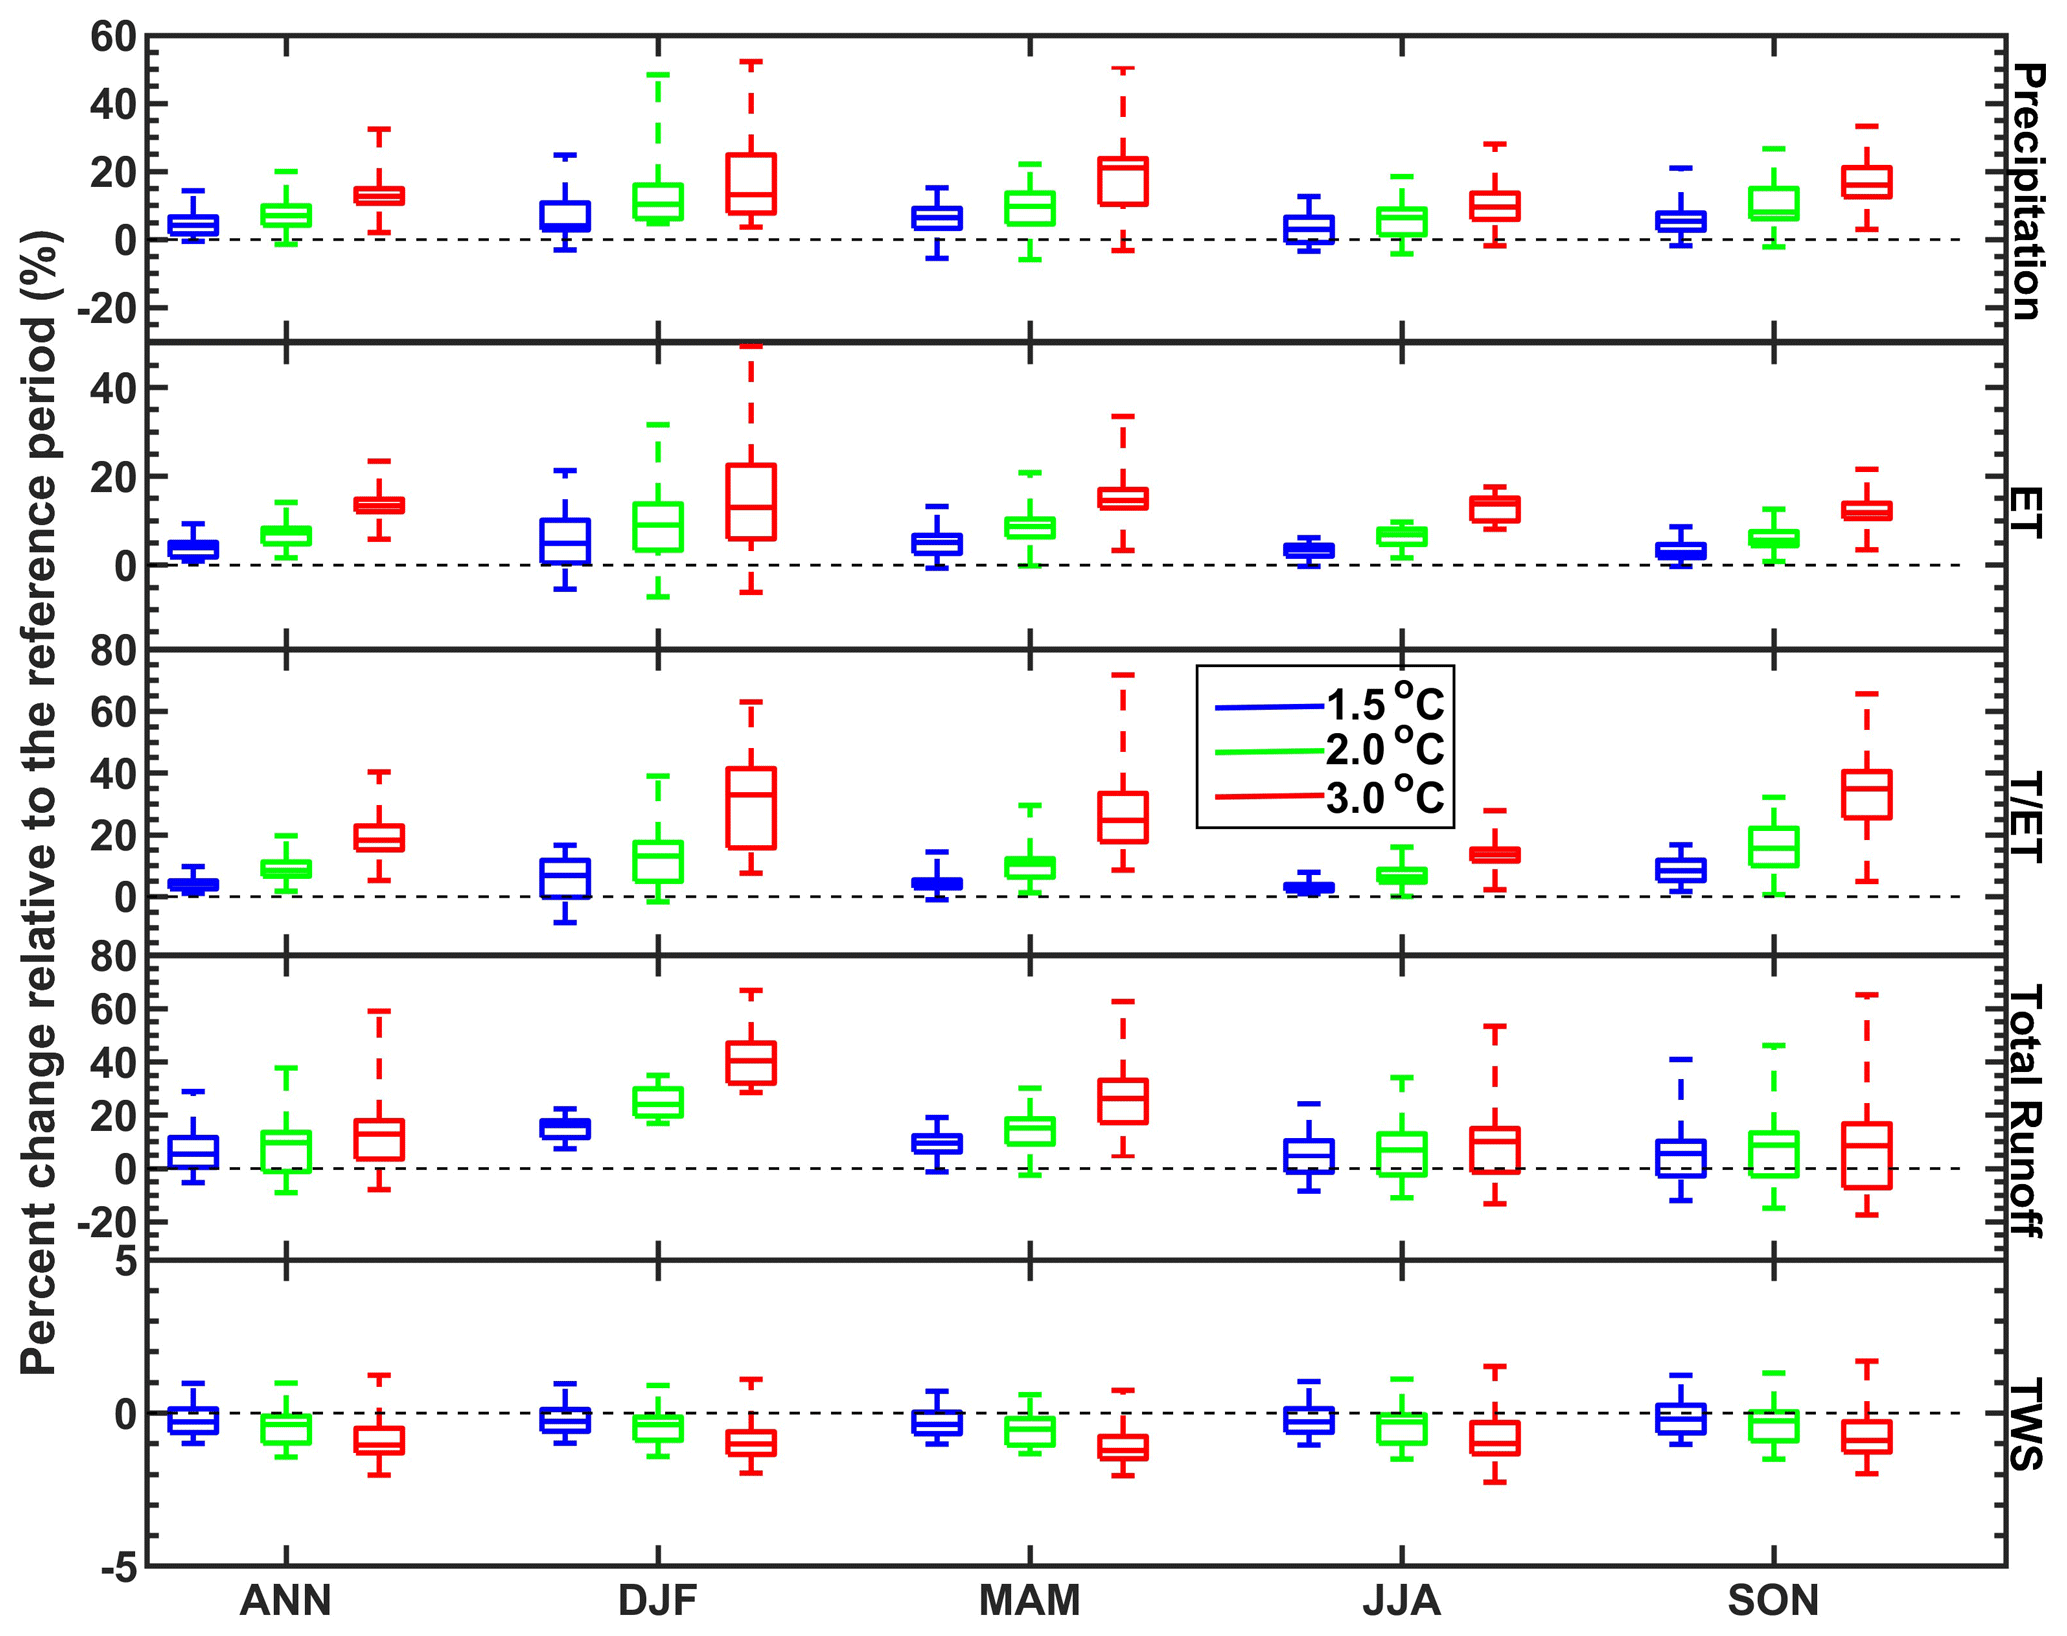
Figure 4Box plots of relative changes of regional mean precipitation, evapotranspiration (ET), ratio of transpiration to evapotranspiration (T ∕ ET), total runoff and terrestrial water storage (TWS) at different global warming levels. The reference period is 1985–2014, and annual (ANN) and seasonal (winter: DF, spring: MAM, summer: JJA and autumn: SON) results are all shown. Boxes show 25th to 75th ranges among 22 CMIP6_SSP/CSSPv2 simulations, while lines in the boxes are median values.
Figure 4 shows relative changes of terrestrial hydrological variables over the Sanjiangyuan region at different warming levels. The ensemble mean of the increase in annual precipitation is 5 % at 1.5 ∘C warming level, and additional 0.5 and 1.5 ∘C warming will further increase the wetting trends to 7 % and 13 % respectively. Annual evapotranspiration experiences significant increases at all warming levels, and the ensemble mean increases are 4 %, 7 % and 13 % at 1.5, 2.0 and 3.0 ∘C warming levels respectively. The ratio of transpiration to evapotranspiration also increases significantly, indicating that vegetation transpiration increases much larger than the soil evaporation and canopy evaporation. Although annual total runoff has larger relative changes than evapotranspiration (6 %, 9 % and 14 % at 1.5, 2.0 and 3.0 ∘C warming levels respectively), the uncertainty is large as only 75 % of the models show positive signals, which may be caused by large uncertain changes during summer and autumn seasons. The terrestrial water storage (TWS), which includes foliage water, surface water, soil moisture and groundwater, shows a slightly decreasing trend at the annual scale, suggesting that the increasing precipitation in the future becomes extra evapotranspiration and runoff instead of recharging the local water storage. The accelerated terrestrial hydrological cycle also exists at the seasonal scale, as the seasonal changes are consistent with the annual ones.
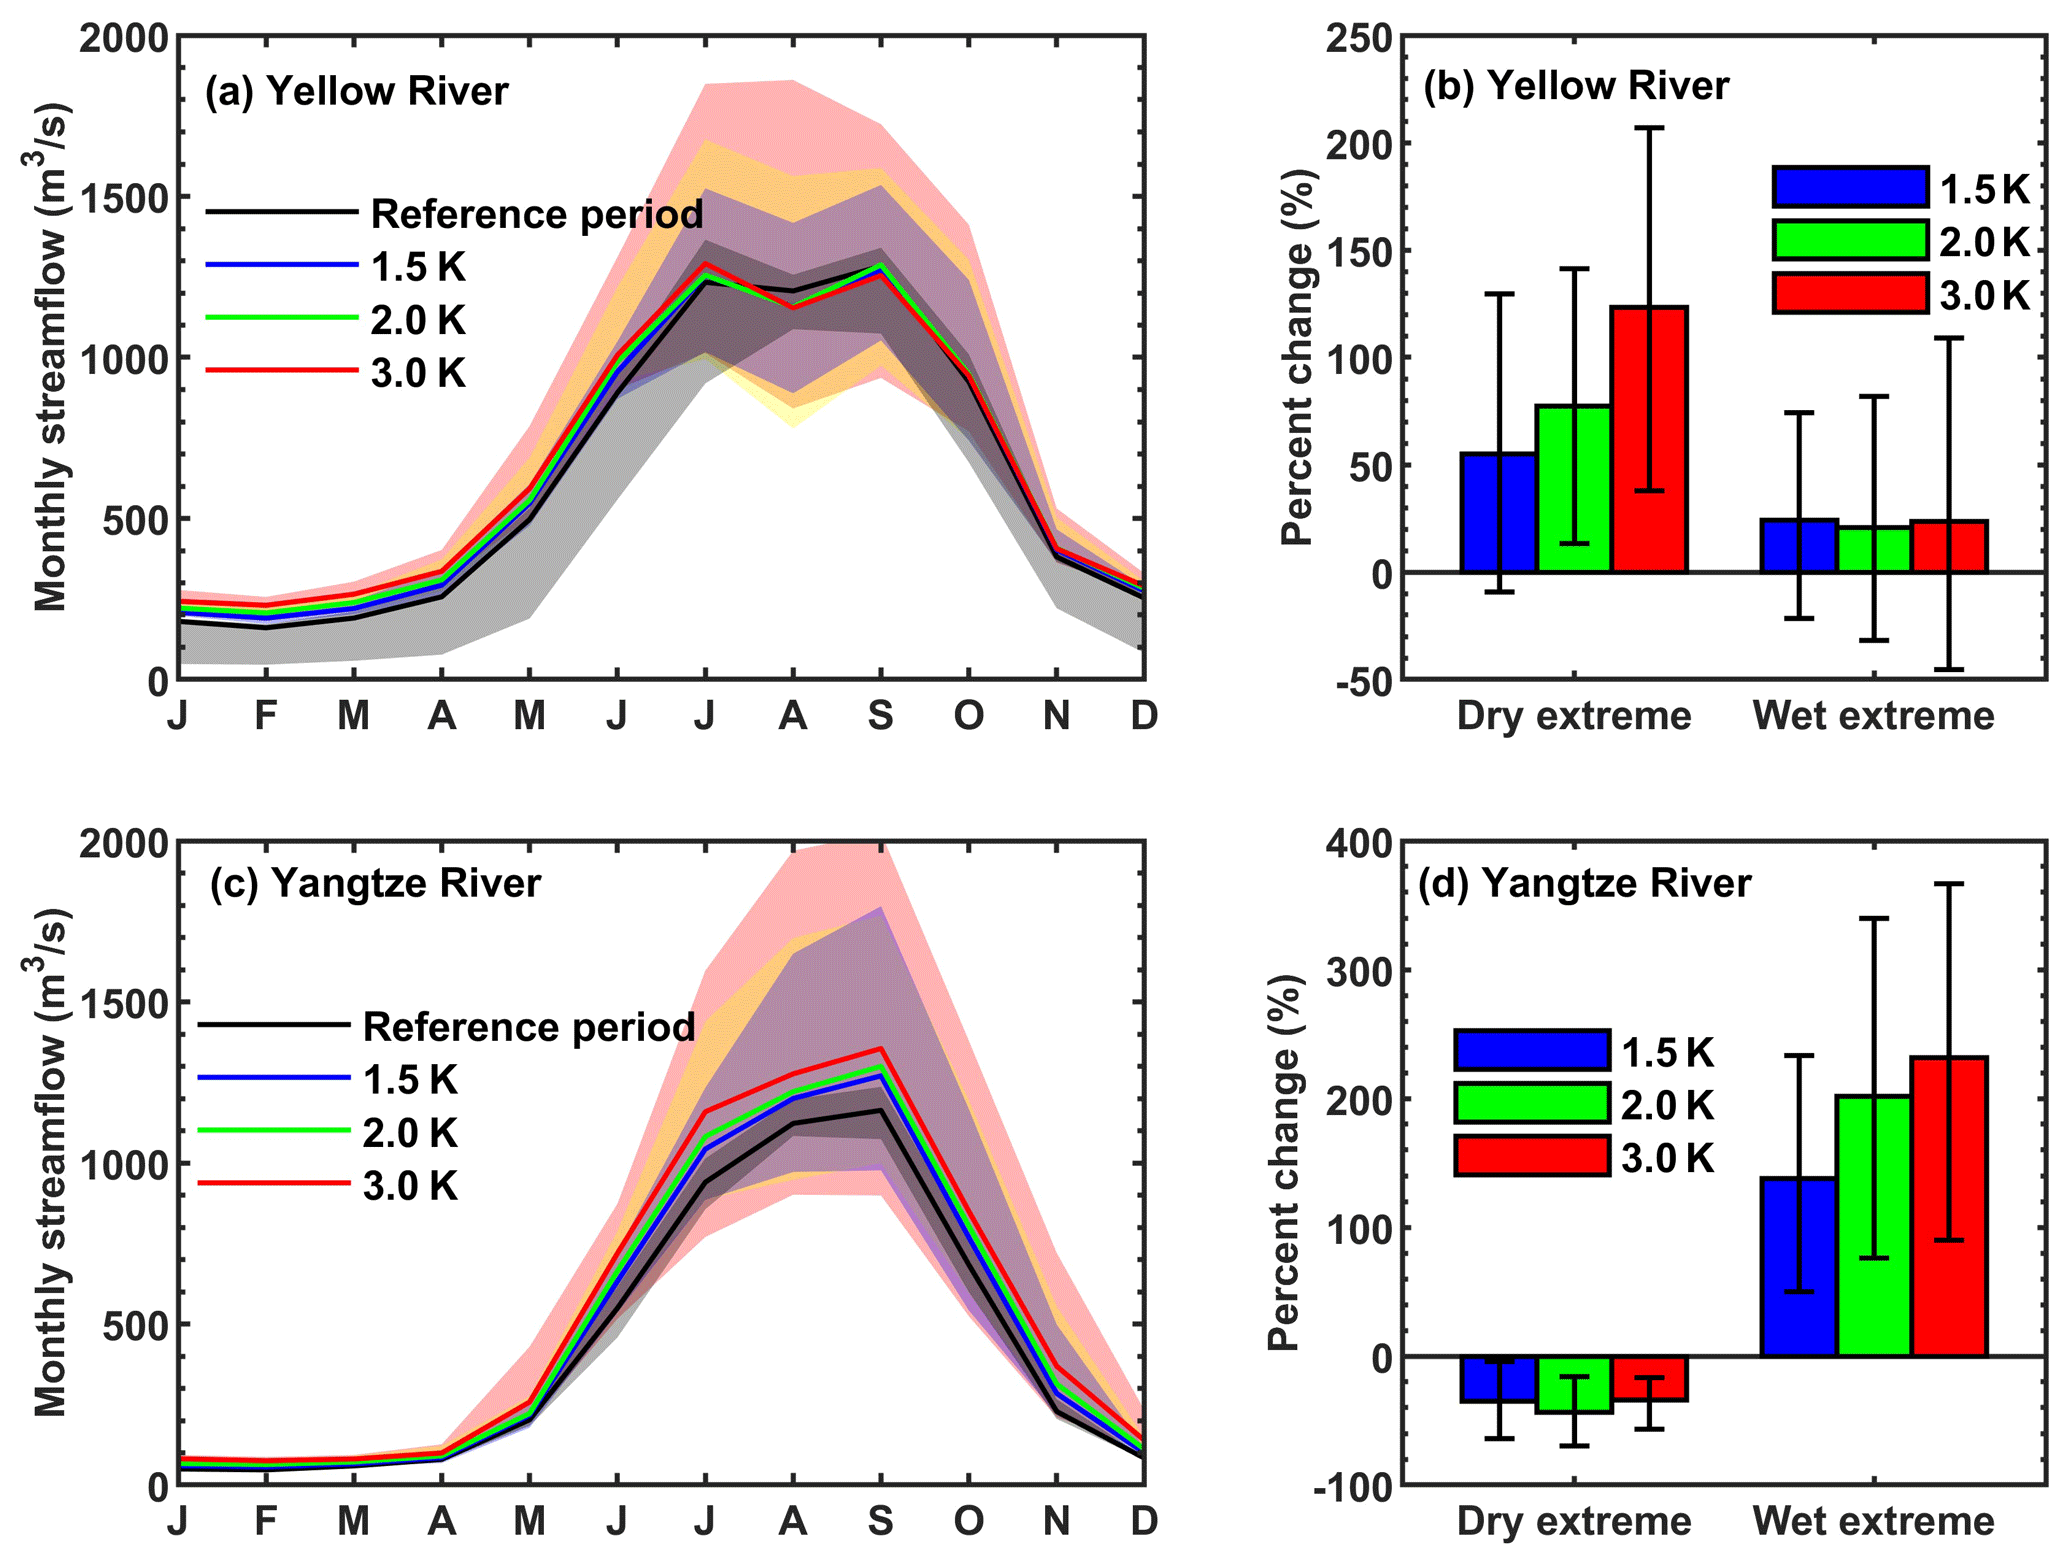
Figure 5Changes of streamflow and its extremes at the outlets of the headwater regions of the Yellow River and the Yangtze River, i.e., Tangnaihai gauge and Zhimenda gauge. (a) Simulated monthly streamflow over the Yellow River during the reference period (1985–2014) and the periods with different global warming levels. Solid lines represent ensemble means, while shadings are ranges of individual ensemble members. (b) Percent changes in the frequency of dry and wet extremes in July–September at different warming levels. Colored bars are ensemble means, while error bars are 5 %–95 % uncertainty ranges estimated using bootstrapping 10 000 times. Panels (c) and (d) are the same as (a) and (b) but for the Yangtze River.
3.2 Changes in streamflow extremes at different warming levels
Although the intensified terrestrial hydrology induces more streamflow over the headwater region of Yellow River during winter and spring months, streamflow does not increase and even decreases during the flood season (July–September; Fig. 5a). Figure 5b shows the changes of streamflow dry extremes over the Yellow River source region at different warming levels, with the error bars showing estimated uncertainties. The frequency of streamflow dry extremes over the Yellow River is found to increase by 55 % at 1.5 ∘C warming level (Fig. 5b), but the uncertainty is larger than the ensemble mean. However, the dry extreme frequency will further increase to 77 % and 125 % at the 2.0 and 3.0 ∘C warming levels, and the results become significant (Fig. 5b). No statistically significant changes are found for the wet extremes at all warming levels over the Yellow River headwater region, as the uncertainty ranges are larger than the ensemble means.
Over the Yangtze River headwater region, streamflow increases in all months at different warming levels (Fig. 5c). The frequency of wet extremes increases significantly by 138 %, 202 % and 232 % at 1.5, 2.0 and 3.0 ∘C warming levels (Fig. 5d), suggesting a higher risk of flooding. Although the frequency of dry extremes also tends to decrease significantly by 35 %, 44 % and 34 % at the three warming levels, the changes are much smaller than those of the wet extremes. Moreover, contributions from climate change and ecological change are both smaller than the uncertainty ranges (not shown), suggesting that their impacts on the changes of dry extremes over the Yangtze River headwater region are not distinguishable. Thus, we mainly focus on the dry extremes over the Yellow River and the wet extremes over the Yangtze River in the following analysis.
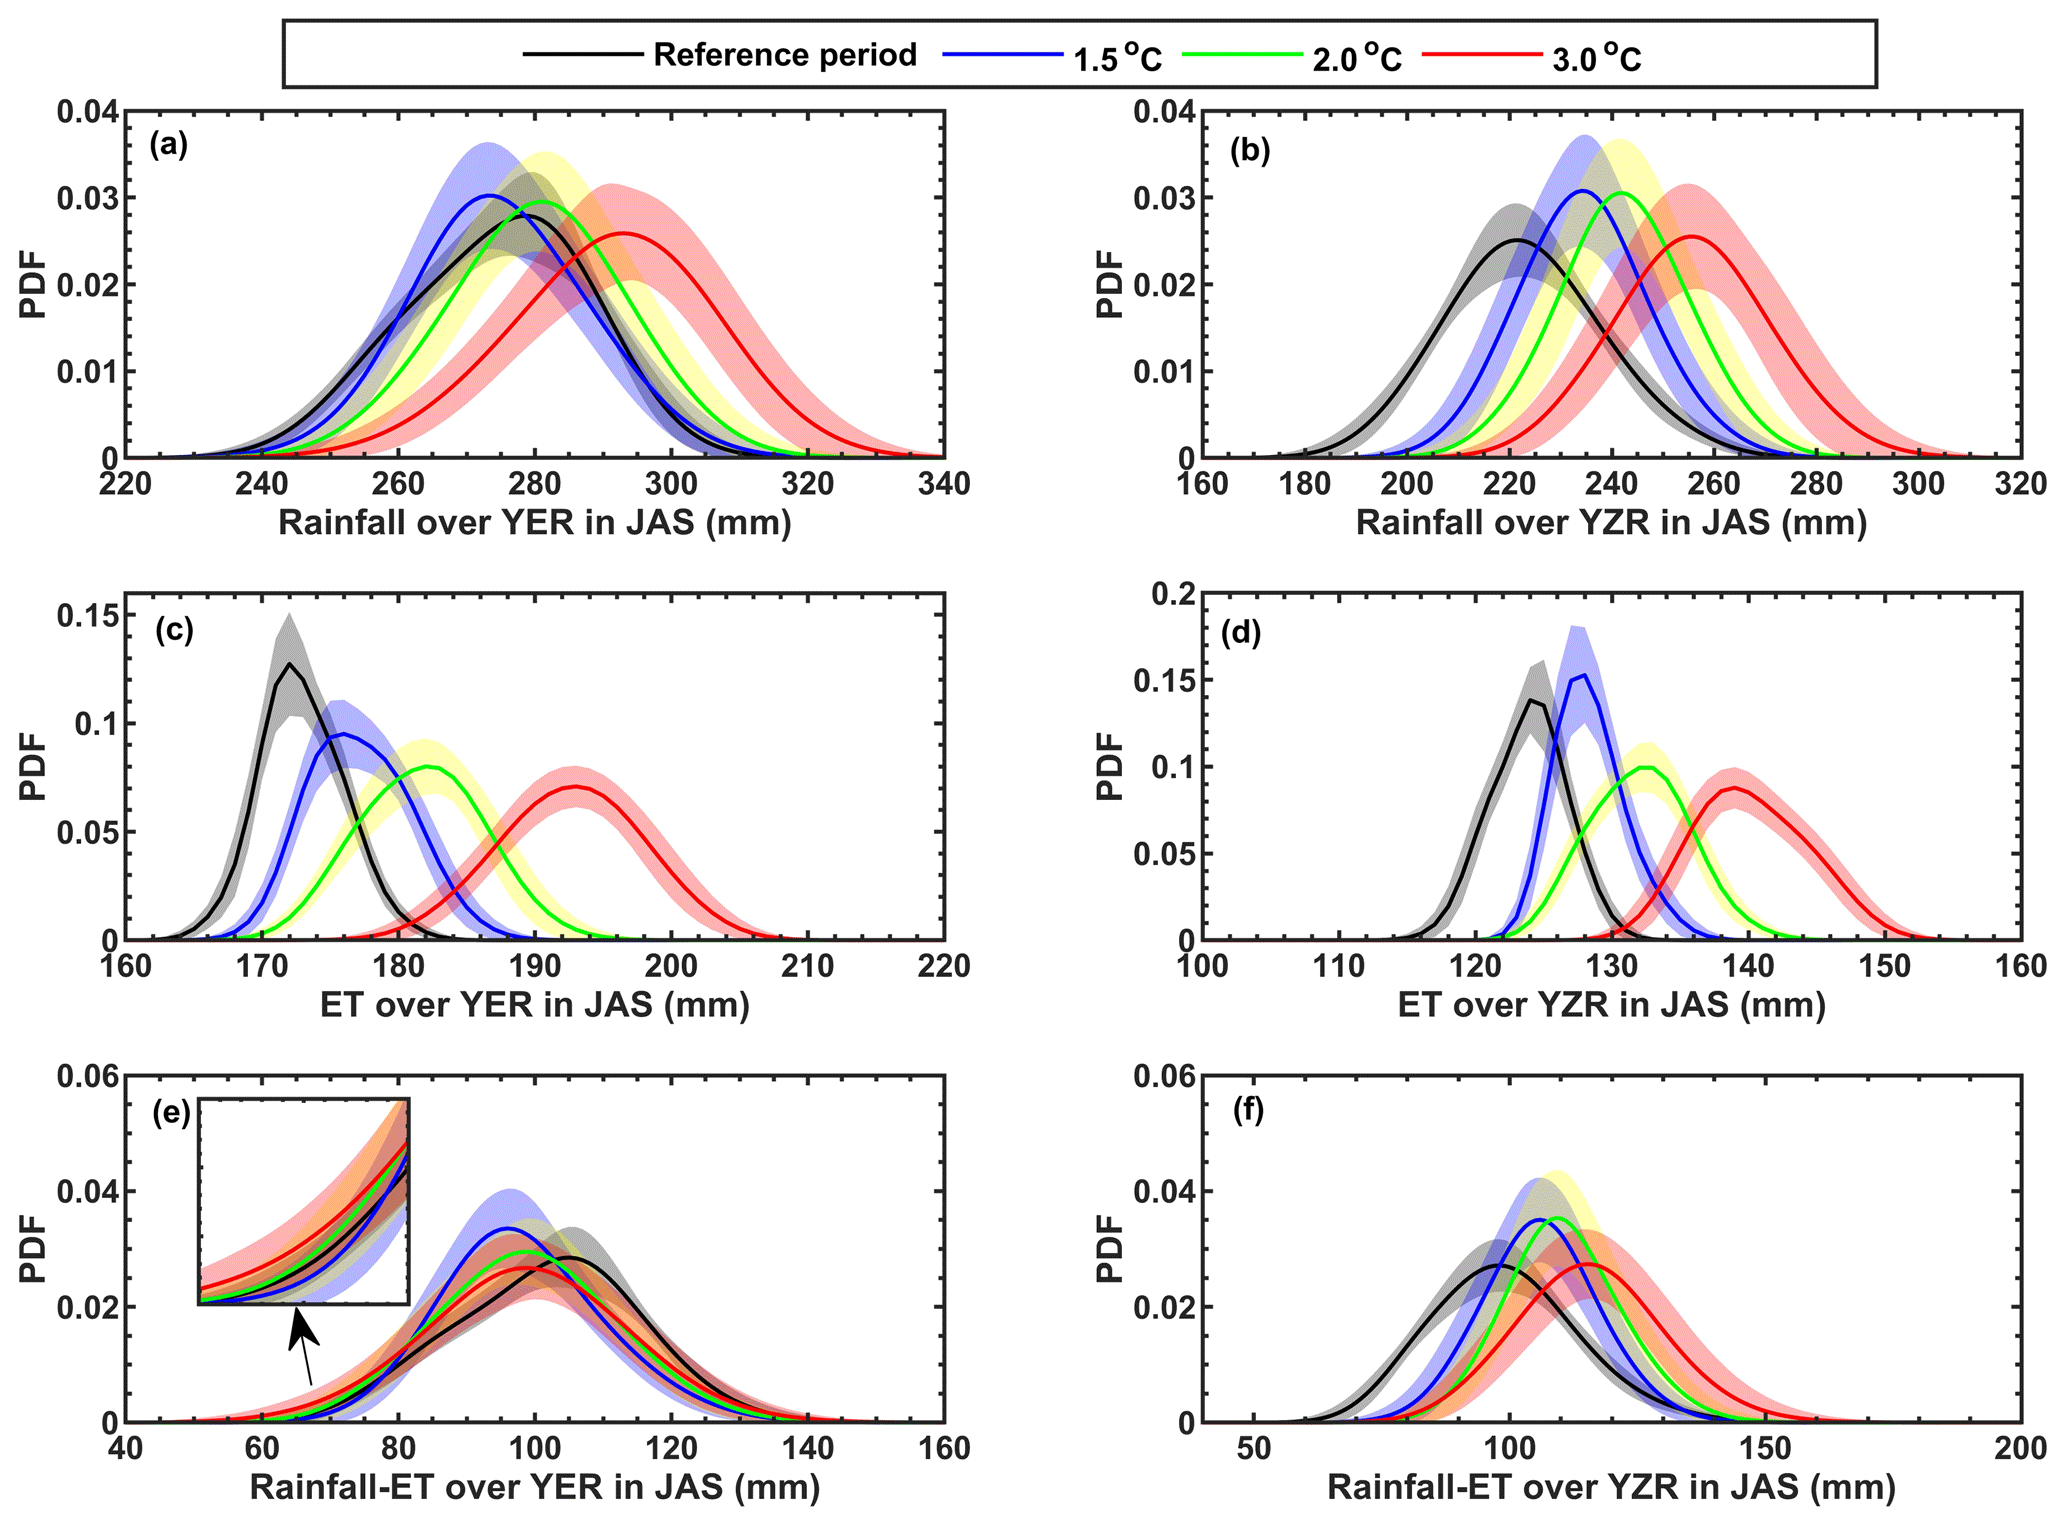
Figure 6Probability density functions (PDFs) of regional mean rainfall, evapotranspiration (ET) and their difference over the headwater regions of Yellow River (YER) and Yangtze River (YZR) during flooding seasons (July–September) for the reference period (1985–2014) and the periods with 1.5, 2.0 and 3.0 ∘C global warming levels. Shadings show the 5 %–95 % uncertainty ranges.
Different changes of streamflow extremes over the Yellow and Yangtze rivers can be interpreted from different accelerating rates of precipitation and evapotranspiration. Figure 6 shows probability density functions (PDFs) of precipitation, evapotranspiration and their difference (P −ET, i.e., residual water for runoff generation) during the flood season. Over the Yellow River, PDFs of precipitation and evapotranspiration both shift to the right against the reference period, except for the precipitation at 1.5 ∘C warming level. However, the increasing trend of evapotranspiration is stronger than that of precipitation, leading to a left shift for the PDF of P − ET. Moreover, increased variations of precipitation and evapotranspiration, as indicated by the increased spread of their PDFs, also lead to a larger spread of PDFs of P − ET. The above two factors together induce a heavier left tail in the PDF of P − ET for the warming future than the reference period (Fig. 6e). The probability of P − ET < 80 mm increases from 0.1 during the historical period to 0.11, 0.13 and 0.16 at 1.5, 2.0 and 3.0 ∘C warming levels, respectively. This indicates a higher probability of less water left for runoff generation at different warming levels, given little change in TWS (Sect. 3.1). Moreover, Fig. 6e also shows little change in the right tails of the PDF of P − ET as probability for P − ET > 130 mm stays around 0.1 at different warming levels, suggesting little change in the probability of high residual water. This is consistent with the insignificant wet extreme change over the Yellow River. Over the Yangtze River, however, intensified precipitation is much larger than the increased evapotranspiration, leading to a systematic rightward shift of the PDF of P − ET (Fig. 6b, d and f). Thus both the dry and wet extremes show significant changes over the Yangtze River.

Figure 7(a–b) Influences of climate change, CO2 physiological forcing and land cover change on relative changes in frequency of the dry and wet extremes in July–September at different global warming levels for the headwater regions of Yellow River and Yangtze River. (c–d) Changes of dry and wet extremes under additional warming of 0.5 and 1.5 ∘C with the consideration of different factors. All the changes are relative to the reference period (1985–2014). Ensemble means are shown by colored bars, while the 5 %–95 % uncertainty ranges estimated using bootstrapping 10 000 times are represented by error bars.
3.3 Influences of land cover change and CO2 physiological forcing
Figure 7a–b show the changes of streamflow extremes (compared with the reference period) induced by climate and ecological factors. Although the contribution from climate change (red bars in Fig. 7a–b) is greater than the ecological factors (blue and cyan bars in Fig. 7a–b), influences of CO2 physiological forcing and land cover change are nontrivial. CO2 physiological forcing tends to alleviate dry extremes (or increase wet extremes), while land cover change plays a contrary role. Over the Yellow River, the combined impact of the two ecological factors (sum of blue and cyan bars) reduces the increasing trend of dry extremes caused by climate change (red bars) by 18 %–22 % at 1.5 and 2.0 ∘C warming levels, while it intensifies the dry extremes by 9 % at 3.0 ∘C warming level. This can be interpreted from their contributions to the evapotranspiration, as the enhancement effect of the increased LAI on ET is weaker than the suppression effect of CO2 physiological forcing at 1.5 and 2.0 ∘C warming levels while stronger at 3.0 ∘C warming level (not shown). Over the Yangtze River, similarly, the combined effect of land cover and CO2 physiological forcing increases the wet extremes by 9 % at 1.5 ∘C warming level, while it decreases the wet extremes by 12 % at 3.0 ∘C warming level.
In addition, Fig. 7c and d show that the combined impact of CO2 physiological forcing and land cover change also influences the differences between different warming levels. Over the Yellow River, climate change increases dry extremes by 26 % from 1.5 to 2.0 ∘C warming level and by 40 % from 1.5 to 3.0 ∘C warming level (red bars in Fig. 7c). After considering the two ecological factors (pink bars in Fig. 7c), the above two values change to 22 % and 70 % respectively, and the difference between 1.5 and 3.0 ∘C warming levels becomes significant. For the wet extreme over the Yangtze River (Fig. 7d), the climate-change-induced difference between 1.5 and 2.0 ∘C warming levels is decreased by 16 % after accounting for the two ecological factors. And this decrease reaches up to 49 % for the difference between 1.5 and 3.0 ∘C warming levels. We also compared the scenarios when CO2 physiological forcing and land cover change are each combined with climate change (blue and cyan bars in Fig. 7c–d), and the results show land cover change dominates their combined influences on the difference between different warming levels.
This study investigates changes of streamflow extremes over the Sanjiangyuan region at different global warming levels through high-resolution land surface modeling driven by CMIP6 climate simulations. The terrestrial hydrological cycle under global warming of 1.5 ∘C is found to accelerate by 4%–6 % compared with the reference period of 1985–2014, according to the relative changes of precipitation, evapotranspiration and total runoff. The terrestrial water storage, however, shows a slight but significant decreasing trend as increased evapotranspiration and runoff are larger than the increased precipitation. This decreasing trend of terrestrial water storage in the warming future is also found in six major basins in China (Jia et al., 2020). Although streamflow changes during the flood season have a large uncertainty, the frequency of wet extremes over the Yangtze River will increase significantly by 138 % and that of dry extremes over the Yellow River will increase by 55 % compared with that during 1985–2014. With an additional 0.5 ∘C warming, the frequency of dry and wet extremes will increase further by 22 %–64 %. If global warming is not adequately managed (e.g., to reach 3.0 ∘C), wet extremes over the Yangtze River and dry extremes over the Yellow River will increase by 232 % and 125 %. The changes from 1.5 to 2.0 and 3.0 ∘C are nonlinear compared with those from the reference period to 1.5 ∘C, which are also found for some fixed-threshold climate indices over Europe (Dosio and Fischer, 2018). It is necessary to cap global warming at 2 ∘C or an even lower level to reduce the risk of wet and dry extremes over the Yangtze and Yellow rivers.
This study also shows the nontrivial contributions from land cover change and CO2 physiological forcing to the extreme streamflow changes, especially at 2.0 and 3.0 ∘C warming levels. CO2 physiological forcing is found to increase streamflow and reduce the dry extreme frequency by 14 %–24 %, which is consistent with previous findings that CO2 physiological forcing would increase available water and reduce water stress at the end of this century (Wiltshire et al., 2013). However, our results further show that the drying effect of increasing LAI on streamflow will exceed the wetting effect of CO2 physiological forcing at 3.0 ∘C warming level (during 2048–2075) over the Sanjiangyuan region, making a reversion in the combined impacts of CO2 physiological forcing and land cover. Thus it is vital to consider the impact of land cover change in the projection of future water stress, especially in high warming scenarios.
Moreover, about 43 %–52 % of the extreme streamflow changes between 1.5 and 3.0 ∘C warming levels are attributed to the increased LAI. Considering the LAI projections from different CMIP6 models are induced by climate change, it can be inferred that the indirect influence of climate change (e.g., through land cover change) has the same and even larger importance for the changes of streamflow extremes between 1.5 and 3.0 ∘C or even higher warming levels, compared with the direct influence (e.g., through precipitation and evapotranspiration). Thus, it is vital to investigate the hydrological cycle and its extreme changes among different warming levels from an ecohydrological perspective instead of focusing on climate change alone.
Although we used 11 CMIP6 models combined with two SSP scenarios to reduce the uncertainty of future projections caused by GCMs, using a single land surface model may result in uncertainties (Marx et al., 2018). However, considering the good performance of the CSSPv2 land surface model over the Sanjiangyuan region and the dominant role of GCMs' uncertainty (Zhao et al., 2019; Samaniego et al., 2017), uncertainty from the CSSPv2 model should have limited influence on the robustness of the result.
The CMIP6 data can be downloaded from the Earth System Grid Federation website at https://esgf-node.llnl.gov/search/cmip6/ (Cinquini et al., 2014). The CMFD data are provided by the National Tibetan Plateau Data Center (https://doi.org/10.11888/AtmosphericPhysics.tpe.249369.fle, He and Yang, 2018). The JPL GRACE mascons data can be found at https://grace.jpl.nasa.gov/ (Wiese et al., 2019). The land surface model simulation data are available upon request.
XY conceived and designed the study. PJ conducted the simulations and performed the analyses. PJ and XY wrote the paper. FM and MP provided critical insights into the results' interpretation and revised the paper.
The authors declare that they have no conflict of interest.
We thank the World Climate Research Programme's Working Group on Coupled Modelling and the National Tibetan Plateau Data Center for providing the data. We also thank the editor Fuqiang Tian and the two anonymous referees for their helpful comments.
This research has been supported by the Ministry of Science and Technology of the People's Republic of China (grant no. 2018YFA0606002) and the National Natural Science Foundation of China (grant nos. 41875105 and 91547103).
This paper was edited by Fuqiang Tian and reviewed by two anonymous referees.
Bibi, S., Wang, L., Li, X., Zhou, J., Chen, D., and Yao, T.: Climatic and associated cryospheric, biospheric, and hydrological changes on the Tibetan Plateau: a review, Int. J. Climatol., 38, e1–e17, https://doi.org/10.1002/joc.5411, 2018.
Chen, J., Gao, C., Zeng, X., Xiong, M., Wang, Y., Jing, C. Krysanova, V., Huang, J., Zhao, N., and Su, B.: Assessing changes of river discharge under global warming of 1.5 ∘C and 2 ∘C in the upper reaches of the Yangtze River Basin: Approach by using multiple-GCMs and hydrological models, Quatern. Int., 453, 1–11, https://doi.org/10.1016/j.quaint.2017.01.017, 2017.
Cinquini, L., Crichton, D., Mattmann, C., Harney, J., Shipman, G., Wang, F., Ananthakrishnan, R., Miller, N., Denvil, S., Morgan, M., Pobre, Z., Bell, G. M., Doutriaux, C., Drach, R., Williams, D., Kershaw, P., Pascoe S., Gonzalez, E., Fiore, S., and Schweitzer, R.: The Earth System Grid Federation: An open infrastructure for access to distributed geospatial data, Future Gener. Comp. Sy., 36, 400–417, https://doi.org/10.1016/j.future.2013.07.002, 2014 (data available at: https://esgf-node.llnl.gov/search/cmip6/, last access: 5 March 2020).
Cuo, L., Zhang, Y., Zhu, F., and Liang, L.: Characteristics and changes of streamflow on the Tibetan Plateau: A review, J. Hydrol.-Reg. Stud., 2, 49–68, https://doi.org/10.1016/j.ejrh.2014.08.004, 2014.
Dai, Y. J., Zeng, X. B., Dickinson, R. E., Baker, I., Bonan, G. B., Bosilovich, M. G., Denning, A. S., Dirmeyer, P. A., Houser, P. R., Niu, G. Y., Oleson, K. W., Schlosser, C. A., and Yang, Z. L.: The Common Land Model, B. Am. Meteorol. Soc., 84, 1013–1024, https://doi.org/10.1175/BAMS-84-8-1013, 2003.
Döll, P., Trautmann, T., Gerten, D., Schmied, H. M., Ostberg, S., Saaed, F., and Schleussner, C.: Risks for the global freshwater system at 1.5 ∘C and 2 ∘C global warming, Environ. Res. Lett., 13, 044038, https://doi.org/10.1088/1748-9326/aab792, 2018.
Dosio, A. and Fischer, E. M.: Will half a degree make a difference? Robust projections of indices of mean and extreme climate in Europe under 1.5 ∘C, 2 ∘C, and 3 ∘C global warming, Geophys. Res. Lett., 45, 935–944, https://doi.org/10.1002/2017GL076222, 2018.
Eyring, V., Bony, S., Meehl, G. A., Senior, C. A., Stevens, B., Stouffer, R. J., and Taylor, K. E.: Overview of the Coupled Model Intercomparison Project Phase 6 (CMIP6) experimental design and organization, Geosci. Model Dev., 9, 1937–1958, https://doi.org/10.5194/gmd-9-1937-2016, 2016.
Fowler, M. D., Kooperman, G. J., Randerson, J. T., and Pritchard, M. S.: The effect of plant physiological responses to rising CO2 on global streamflow, Nat. Clim. Change, 9, 873–879, https://doi.org/10.1038/s41558-019-0602-x, 2019.
He, J. and Yang, K.: China meteorological forcing dataset (1979–2018), National Tibetan Plateau Data Center, https://doi.org/10.11888/AtmosphericPhysics.tpe.249369.fle, 2018.
He, J., Yang, K., Tang, W., Lu, H., Qin, J., Chen, Y., and Li, X.: The first high-resolution meteorological forcing dataset for land process studies over China, Sci. Data, 7, 25, https://doi.org/10.1038/s41597-020-0369-y, 2020.
Hempel, S., Frieler, K., Warszawski, L., Schewe, J., and Piontek, F.: A trend-preserving bias correction – the ISI-MIP approach, Earth Syst. Dynam., 4, 219–236, https://doi.org/10.5194/esd-4-219-2013, 2013.
Hoegh-Guldberg, O., Jacob, D., Taylor, M., Bindi, M., Brown, S., Camilloni, I., Diedhiou, A., Djalante, R., Ebi, K. L., Engelbrecht, F., Guiot, J., Hijioka, Y., Mehrotra, S., Payne, A., Seneviratne, S. I., Thomas, A., Warren, R., and Zhou, G.: Impacts of 1.5 ∘C Global Warming on Natural and Human Systems, in: Global Warming of 1.5 ∘C. An IPCC Special Report on the impacts of global warming of 1.5 ∘C above pre-industrial levels and related global greenhouse gas emission pathways, in the context of strengthening the global response to the threat of climate change, sustainable development, and efforts to eradicate poverty, edited by: Masson Delmotte, V., Zhai, P., Pörtner, H.-O., Roberts, D., Skea, J., Shukla, P. R., Pirani, A., Moufouma-Okia, W., Péan, C., Pidcock, R., Connors, S., Matthews, J. B. R., Chen, Y., Zhou, X., Gomis, M. I., Lonnoy, E., Maycock, T., Tignor, M., and Waterfield, T., 186–203, available at: https://www.ipcc.ch/sr15/ (last access: 25 June 2020), 2018.
Ji, P. and Yuan, X.: High-resolution land surface modeling of hydrological changes over the Sanjiangyuan region in the eastern Tibetan Plateau: 2. Impact of climate and land cover change, J. Adv. Model. Earth. Sy., 10, 2829–2843, https://doi.org/10.1029/2018MS001413, 2018.
Jia, B., Cai, X., Zhao, F., Liu, J., Chen, S., Luo, X., Xie, Z., and Xu, J.: Potential future changes of terrestrial water storage based on climate projections by ensemble model simulations, Adv. Water Resour., 142, 103635, https://doi.org/10.1016/j.advwatres.2020.103635, 2020.
Jung, M., Reichstein, M., and Bondeau, A.: Towards global empirical upscaling of FLUXNET eddy covariance observations: validation of a model tree ensemble approach using a biosphere model, Biogeosciences, 6, 2001–2013, https://doi.org/10.5194/bg-6-2001-2009, 2009.
Kuang, X. and Jiao, J.: Review on climate change on the Tibetan Plateau during the last half century, J. Geophys. Res.-Atmos., 121, 3979–4007, https://doi.org/10.1002/2015JD024728, 2016.
Li, J., Liu, D., Li, Y., Wang, S., Yang, Y., Wang, X., Guo, H., Peng, S., Ding, J., Shen, M., and Wang, L.: Grassland restoration reduces water yield in the headstream region of Yangtze River, Sci. Rep.-UK, 7, 2162, https://doi.org/10.1038/s41598-017-02413-9, 2017.
Li, W., Jiang, Z., Zhang, X., Li, L., and Sun, Y.: Additional risk in extreme precipitation in China from 1.5 ∘C to 2.0 ∘C global warming levels, Sci. Bull., 63, 228, https://doi.org/10.1016/j.scib.2017.12.021, 2018.
Liang, L., Li, L., Liu, C., and Cuo, L.: Climate change in the Tibetan Plateau Three Rivers Source Region: 1960–2009, Int. J. Climatol., 33, 2900–2916, https://doi.org/10.1002/joc.3642, 2013.
Liang, X., Lettenmaier, D. P., Wood, E. F., and Burges, S. J.: A simple hydrologically based model of land surface water and energy fluxes for general circulation models, J. Geophys. Res., 99, 14415–14428, https://doi.org/10.1029/94JD00483, 1994.
Marcott, S. A., Shakun, J. D., Clark, P. U., and Mix, A. C.: A Reconstruction of Regional and Global Temperature for the Past 11,300 Years, Science, 339, 1198–1201, https://doi.org/10.1126/science.1228026, 2013.
Martens, B., Miralles, D. G., Lievens, H., van der Schalie, R., de Jeu, R. A. M., Fernández-Prieto, D., Beck, H. E., Dorigo, W. A., and Verhoest, N. E. C.: GLEAM v3: satellite-based land evaporation and root-zone soil moisture, Geosci. Model Dev., 10, 1903–1925, https://doi.org/10.5194/gmd-10-1903-2017, 2017.
Marx, A., Kumar, R., and Thober, S.: Climate change alters low flows in Europe under global warming of 1.5, 2, and 3∘C, Hydrol. Earth. Syst. Sc., 22, 1017–1032, https://doi.org/10.5194/hess-22-1017-2018, 2018.
Meinshausen, M., Vogel, E., Nauels, A., Lorbacher, K., Meinshausen, N., Etheridge, D. M., Fraser, P. J., Montzka, S. A., Rayner, P. J., Trudinger, C. M., Krummel, P. B., Beyerle, U., Canadell, J. G., Daniel, J. S., Enting, I. G., Law, R. M., Lunder, C. R., O'Doherty, S., Prinn, R. G., Reimann, S., Rubino, M., Velders, G. J. M., Vollmer, M. K., Wang, R. H. J., and Weiss, R.: Historical greenhouse gas concentrations for climate modelling (CMIP6), Geosci. Model Dev., 10, 2057–2116, https://doi.org/10.5194/gmd-10-2057-2017, 2017.
Meinshausen, M., Nicholls, Z. R. J., Lewis, J., Gidden, M. J., Vogel, E., Freund, M., Beyerle, U., Gessner, C., Nauels, A., Bauer, N., Canadell, J. G., Daniel, J. S., John, A., Krummel, P. B., Luderer, G., Meinshausen, N., Montzka, S. A., Rayner, P. J., Reimann, S., Smith, S. J., van den Berg, M., Velders, G. J. M., Vollmer, M. K., and Wang, R. H. J.: The shared socio-economic pathway (SSP) greenhouse gas concentrations and their extensions to 2500, Geosci. Model Dev., 13, 3571–3605, https://doi.org/10.5194/gmd-13-3571-2020, 2020.
Mohammed, K., Islam, A. S., Islam, G. M. T., Alfieri, L., Bala, S. K., and Khan, M. J. U.: Extreme flows and water availability of the Brahmaputra River under 1.5 and 2 ∘C global warming scenarios, Clim. Change, 145, 159–175, https://doi.org/10.1007/s10584-017-2073-2, 2017.
Morice, C. P., Kennedy, J. J., Rayner, N. A., and Jones, P. D.: Quantifying uncertainties in global and regional temperature change using an ensemble of observational estimates: The HadCRUT4 dataset, J. Geophys. Res., 117, D08101, https://doi.org/10.1029/2011JD017187, 2012.
Oleson, K. W., Lawrence, D. M., Bonan, G. B., Drewniak, B., Huang, M., Koven, C. D., Levis, S., Li, F., Riley, W. J., Subin, Z. M., Swenson, S. C., Thornton, P. E., Bozbiyik, A., Fisher, R., Heald, C. L., Kluzek, E., Lamarque, J. F., Lawrence, P. J., Leung, L. R., Lipscomb, W., Muszala, S., Ricciuto, D. M., Sacks, W., Sun, Y., Tang, J., and Yang, Z. L.: Technical description of version 4.5 of the Community Land Model (CLM) (Rep. NCAR/TN-503 + STR, 420), 420 pp., https://doi.org/10.5065/D6RR1W7M, 2013.
O'Neill, B. C., Tebaldi, C., van Vuuren, D. P., Eyring, V., Friedlingstein, P., Hurtt, G., Knutti, R., Kriegler, E., Lamarque, J.-F., Lowe, J., Meehl, G. A., Moss, R., Riahi, K., and Sanderson, B. M.: The Scenario Model Intercomparison Project (ScenarioMIP) for CMIP6, Geosci. Model Dev., 9, 3461–3482, https://doi.org/10.5194/gmd-9-3461-2016, 2016.
Samaniego, L., Kumar, R., Breuer, L., Chamorro, A., Flörke, M., Pechlivanidis, I. G., Schäfer, D., Shah, H., Vetter, T., Wortmann, M., and Zeng, X.: Propagation of forcing and model uncertainties on to hydrological drought characteristics in a multi-model century-long experiment in large river basins, Clim. Change, 141, 435–449, https://doi.org/10.1007/s10584-016-1778-y, 2017.
Thober, T., Kumar, R., and Waders, N.: Multi-model ensemble projections of European river floods and high flows at 1.5, 2, and 3 degrees global warming, Environ. Res. Lett., 13, 014003, https://doi.org/10.1088/1748-9326/aa9e35, 2018.
Vicente-Serrano, S. M., Lopez-Moreno, J. I., Begueria, S., Lorenzo-Lacruz, J., Azorin-Molina, C., and Moran-Tejeda, E.: Accurate computation of a streamflow drought index, J. Hydrol. Eng., 17, 318–332, https://doi.org/10.1061/(Asce)He.1943-5584.0000433, 2012.
Watkins, M. M., Wiese, D. N., Yuan, D. N., Boening, C., and Landerer, F. W.: Improved methods for observing Earth's time variable mass distribution with GRACE using spherical cap mascons, J. Geophys. Res.-Sol. Ea., 120, 2648–2671, https://doi.org/10.1002/2014JB011547, 2015.
Wiese, D. N., Yuan, D. N., Boening, C., Landerer, F. W., and Watkins., M. M.: JPL GRACE Mascon Ocean, Ice, and Hydrology Equivalent Water Height Release 06 Coastal Resolution Improvement (CRI) Filtered Version 1.0. Ver. 1.0. PO.DAAC, CA, USA, https://doi.org/10.5067/TEMSC-3MJC6, 2018 (data available at https://grace.jpl.nasa.gov/, last access: 7 August 2019).
Wiltshire, A., Gornall, J., Booth, B., Dennis, E., Falloon, P., Kay, G., McNeall, D., McSweeney, C., and Betts, R.: The importance of population, climate change and CO2 plant physiological forcing in determining future global water stress, Global Environ. Change, 23, 1083–1097, https://doi.org/10.1016/j.gloenvcha.2013.06.005, 2013.
WMO: WMO Statement on the State of the Global Climate in 2019, https://library.wmo.int/index.php?lvl=notice_display&id=21700#.X7PmmjPm6jg (last access: 5 July 2020), 2020.
Xu, R., Hu, H., Tian, F., Li, C., and Khan, M. Y. A.,: Projected climate change impacts on future streamflow of the Yarlung Tsangpo-Brahmaputra River, Global Planet. Change, 175, 144–159, https://doi.org/10.1016/j.gloplacha.2019.01.012, 2019.
Yang, K., Wu, H., Qin, J., Lin, C., Tang, W., and Chen, Y.: Recent climate changes over the Tibetan plateau and their impacts on energy and water cycle: A review, Global Planet. Change, 112, 79–91, https://doi.org/10.1016/j.gloplacha.2013.12.001, 2013.
Yang, Y., Rodericj, M. L., Zhang, S., McVicar, T. R., and Donohue, R. J.: Hydrologic implications of vegetation response to elevated CO2 in climate projections, Nat. Clim. Change, 9, 44–48, https://doi.org/10.1038/s41558-018-0361-0, 2019.
Yuan, X., Zhang, M., Wang, L., and Zhou, T.: Understanding and seasonal forecasting of hydrological drought in the Anthropocene, Hydrol. Earth. Syst. Sc., 21, 5477–5492, https://doi.org/10.5194/hess-21-5477-2017, 2017.
Yuan, X., Ji, P., Wang, L., Liang, X., Yang, K., Ye, A., Su, Z., and Wen, J.: High resolution land surface modeling of hydrological changes over the Sanjiangyuan region in the eastern Tibetan Plateau: 1. Model development and evaluation, J. Adv. Model. Earth. Sy., 10, 2806–2828, https://doi.org/10.1029/2018MS001413, 2018a.
Yuan, X., Jiao, Y., Yang, D., and Lei, H.: Reconciling the attribution of changes in streamflow extremes from a hydroclimate perspective, Water Resour. Res., 54, 3886–3895, https://doi.org/10.1029/2018WR022714, 2018b.
Zhang, Y., You, Q., Chen, C., and Ge, J.: Impacts of climate change on streamflows under RCP scenarios: A case study in Xin River Basin, China, Atmos. Res., 178–179, 521–534, https://doi.org/10.1016/j.atmosres.2016.04.018, 2016.
Zhao, Q., Ding, Y., Wang, J., Gao, H., Zhang, S., Zhao, C., Xu, J. Han, H., and Shangguan, D.: Projecting climate change impacts on hydrological processes on the Tibetan Plateau with model calibration against the glacier inventory data and observed streamflow, J. Hydrol., 573, 60–81, https://doi.org/10.1016/j.jhydrol.2019.03.043, 2019.
Zhu, Q., Jiang, H., Peng, C., Liu, J., Fang, X., Wei, X., Liu, S., and Zhou, G.: Effects of future climate change, CO2 enrichment, and vegetation structure variation on hydrological processes in China, Global Planet. Change, 80–81, 123–135, https://doi.org/10.1016/j.gloplacha.2011.10.010, 2012.
Zhu, Z. C., Piao, S. L., Myneni, R. B., Huang, M. T., Zeng, Z. Z., Canadell, J. G., Ciais, P., Sitch, S., Friedlingstein, P., Arneth, A., Cao, C. X., Cheng, L., Kato, E., Koven, C., Li, Y., Lian, X., Liu, Y. W., Liu, R. G., Mao, J. F., Pan, Y. Z., Peng, S. S., Penuelas, J., Poulter, B., Pugh, T. A. M., Stocker, B. D., Viovy, N., Wang, X. H., Wang, Y. P., Xiao, Z. Q., Yang, H., Zaehle, S., and Zeng, N.: Greening of the Earth and its drivers, Nat. Clim. Change, 6, 791–795, https://doi.org/10.1038/Nclimate3004, 2016.