the Creative Commons Attribution 4.0 License.
the Creative Commons Attribution 4.0 License.
 | 19 Nov 2020
Effects of climate anomalies on warm-season low flows in Switzerland
Marius G. Floriancic
Wouter R. Berghuijs
Tobias Jonas
James W. Kirchner
Peter Molnar
Switzerland has faced extended periods of low river flows in recent years (2003, 2011, 2015 and 2018), with major economic and environmental consequences. Understanding the origins of events like these is important for water resources management. In this work, we provide data illustrating the individual and joint contributions of precipitation and evapotranspiration to low flows in both typical and dry years. To quantify how weather drives low flows, we explore how deviations from mean seasonal climate conditions (i.e., climate anomalies) of precipitation and potential evapotranspiration correlate with the occurrence and magnitude of annual 7 d lowest flows (Qmin) during the warm season (May through November) across 380 Swiss catchments from 2000 through 2018. Most warm-season low flows followed periods of below-average precipitation and above-average potential evapotranspiration, and the lowest low flows resulted from both of these drivers acting together. Low-flow timing was spatially variable across Switzerland in all years, including the driest (2003, 2011, 2015 and 2018). Low flows in these driest years were associated with much longer-lasting climate anomalies than the ≤2 month anomalies which preceded typical warm-season low flows in other years. We found that snow water equivalent and winter precipitation totals only slightly influenced the magnitude and timing of warm-season low flows in low-elevation catchments across Switzerland. Our results provide insight into how precipitation and potential evapotranspiration jointly shape warm-season low flows across Switzerland and potentially aid in assessing low-flow risks in similar mountain regions using seasonal weather forecasts.
- Article
(7309 KB) - Full-text XML
-
Supplement
(1196 KB) - BibTeX
- EndNote


In recent decades, Europe has experienced several severe droughts (Van Lanen et al., 2016). Their impacts, such as dry river reaches and high water temperatures, have a range of adverse effects on society and river ecology (e.g., Poff et al., 1997; Bradford and Heinonen, 2008; Price et al., 2011; Rolls et al., 2012; van Vliet et al., 2012). Severe low flows in the years 2003, 2011, 2015 and 2018 led to substantial economic losses by limiting water availability for households, industry, irrigation and hydropower as well as impacting river transportation (Stahl et al., 2016; Munich Re, 2019). Such effects are expected to become more severe and frequent as water demand rises and as droughts are anticipated to increase in frequency and intensity in the future (e.g., De Stefano et al., 2012; Wada et al., 2013), leading to calls for improved understanding and management of droughts and their effects on low flows across Europe (e.g., Seneviratne et al., 2012a; Van Lanen et al., 2016; WMO, 2008).
In temperate climates, annual low flows typically occur in two distinct seasons, i.e., during late summer and autumn in warmer regions and during winter in colder regions (Fiala et al., 2010; Smakhtin, 2001). This typical low-flow seasonality has been reported for many regions of the world, including, for example, Austria (Laaha and Blöschl, 2006; Van Loon and Laaha, 2015), the Rhine river basin (Demirel et al., 2013; Tongal et al., 2013) and North America (Cooper et al., 2018; Dierauer et al., 2018; Wang, 2019). Switzerland also has two low-flow seasons in which the distinction between warm-season low flows and winter low flows is strongly connected to elevation (Wehren et al., 2010; Weingartner and Aschwanden, 1992). Low flows tend to occur in late summer and early autumn (August through October) in low-elevation Swiss catchments and during the winter (January through March) in high-elevation catchments.
Catchment properties shape low flows by controlling the storage and release of water (e.g., Stoelzle et al., 2014; Van Lanen et al., 2013; Van Loon and Laaha, 2015; Staudinger et al., 2017), but the landscape itself does not cause low flows. Instead, the drivers of low flows are meteorological conditions that dry out catchments (e.g., Fleig et al., 2006; Haslinger et al., 2014; Smakhtin, 2001). Warm-season low flows are typically caused by sustained periods of high evapotranspiration and low precipitation, whereas winter low flows often follow sustained periods of subfreezing temperatures (e.g., Laaha et al., 2017; Van Loon, 2015). The duration of these anomalous weather conditions is critical in shaping the annual lowest flows. Their timing varies between years and is largely driven by climate seasonality. In this paper we refer to weather conditions that deviate from the seasonal norm as “climate anomalies”, regardless of the magnitude of this departure.
The two main climatic factors controlling water storage and release in a catchment are precipitation and temperature (through its influence on snow processes and evapotranspiration). Therefore, precipitation (P) and potential evapotranspiration (Ep) anomalies are expected to be important drivers of warm-season low flows across Switzerland. Precipitation controls the amount of water that is available for runoff in a catchment, and sustained periods with little precipitation will inevitably reduce storage and, thereby, limit streamflow. Because there is a time lag between low precipitation and low streamflow, meteorological droughts (i.e., precipitation deficits) result in hydrological droughts and/or low flows if they persist for long enough (e.g., Peters et al., 2006; Tallaksen and Van Lanen, 2004; Van Loon, 2015). In Switzerland, there is limited precipitation seasonality, but precipitation can still vary substantially within seasons or from year to year. However, precipitation is expected to become increasingly seasonal with changing climatic conditions in the future, with less precipitation during summer and more precipitation in winter. In addition, anticipated changes in snowfall and snowpacks may also alter river flows (CH2018, 2018).
High temperatures can be an indicator of high Ep and, thus, high potential for depletion of soil moisture storage, reducing aquifer recharge and streamflow (e.g., Jaeger and Seneviratne, 2011; Vidal et al., 2010). Temperature extremes can be amplified when low soil moisture limits evapotranspiration, leading to lower relative humidity and higher air temperatures, which further increase Ep (Granger, 1989). Furthermore, vegetation decreases the amount of water available for streamflow by increasing transpiration during periods of high vapor pressure deficits. Although these mechanisms are known, the effects of evapotranspiration on river low flows have received relatively little attention compared to precipitation effects. Seneviratne et al. (2012b) reported that low flows across Switzerland in 2003 more likely resulted from excess evapotranspiration than from spring precipitation deficits, and Teuling et al. (2013) documented the depletion of soil water storage by high evapotranspiration during past European low flows. Woodhouse et al. (2016) reported that temperatures, rather than precipitation, explained the interannual streamflow variations of the Colorado River. More recently, Cooper et al. (2018) reported that summer low flows in the maritime western US are largely driven by summer Ep rather than by winter precipitation or snow water equivalent (SWE). Mastrotheodoros et al. (2020) modeled how increasing evapotranspiration strongly reduced streamflow across the European Alps during the summer of 2003. Future Ep is projected to increase along with increases in incoming longwave radiation (Roderick et al., 2014), with uncertain consequences for future low flows. In Switzerland, temperatures are expected to rise even quicker than the global average in the next decades (CH2018, 2018), potentially influencing low-flow dynamics.
Future climate changes will also affect low flows in mountain regions by altering snow accumulation and melt. Multiple studies have examined how winter precipitation and SWE affect summer low flows in high-elevation catchments. For example, Godsey et al. (2014) found that shrinking snowpacks in the Sierra Nevada of California led to smaller low flows in the following summers. Jenicek et al. (2016) reported that maximum snow accumulation strongly affected summer low flows across several Swiss mountainous catchments. Dierauer et al. (2018) found that warmer winters with less snow accumulation led to lower summer low flows in mountainous catchments of the western US. Recently, Wang (2019) reported that climate warming might increase aquifer conductivity and, thereby, streamflow in cold-region catchments. Future climate warming in both warm and cold seasons will most likely impact summer low flows through different mechanisms. In summer, higher temperatures increase potential evapotranspiration, whereas in winter they reduce snowpacks (e.g., Déry et al., 2009; Diffenbaugh et al., 2015; Musselman et al., 2017).
The effects of precipitation, temperature and evapotranspiration on low flows have been investigated for individual events or individual catchments and regions in the literature. Previous studies have largely focused on how signatures of low flows (averaged across many events) relate to catchment and climate characteristics (e.g., Fangmann and Haberlandt, 2019; Hannaford, 2015; Laaha and Blöschl, 2006; Van Loon and Laaha, 2015). To our knowledge, however, no study has systematically assessed the direct impact of temperature and precipitation during periods immediately preceding individual annual low-flow events across many catchments in a topographically diverse region.
Here we explore how precipitation and Ep deviations from their seasonal norms (here termed climate anomalies) jointly shape the occurrence and magnitude of annual warm-season low flows across a network of 380 Swiss catchments. Annual low flows vary in both timing and magnitude, potentially reflecting both climate seasonality and anomalous weather conditions (i.e., conditions that deviate from the seasonal norm). Here we investigate the linkages between low flows and weather anomalies. Understanding how anomalous weather drives low flows may help to reveal the processes at work and also support low-flow forecasting. Switzerland is an interesting study region because gauging and climate data are available from a dense station network spanning a wide range of elevations, climates and topographies. We investigate (a) how precipitation and Ep anomalies separately and jointly shape the occurrence and magnitude of warm-season low flows across Switzerland, (b) which durations of these anomalies have the strongest impact on low-flow occurrence and magnitude, both in typical and in exceptionally dry years, and (c) how winter precipitation and snowpacks influence the magnitude and timing of warm-season low flows. Understanding these connections is important for anticipating how streamflows are likely to respond, as the exceptionally dry years of today are expected to become more typical in a future warmer climate.
2.1 Streamflow and climate data
We compiled daily streamflows for 380 gauging stations across Switzerland for a 19-year period (2000–2018), using data collected by the Swiss Federal Office of the Environment (FOEN) and the Swiss Cantonal authorities. This data set excludes catchments with obvious anthropogenic influences on the hydrograph, e.g., from major dams or hydropeaking operations. Low flows were defined as the lowest 7 d average streamflow for each year (Qmin). We calculated the magnitude and timing of Qmin in each catchment for each year from 2000 to 2018. Not all catchments had continuous data for all 19 years; in total, we could calculate low-flow magnitude and timing for 6237 station years. This data set included years when the lowest annual flows were much higher than typical low flows (e.g., in especially wet years and years without distinct dry periods). We removed all annual low flows above the threshold of 2.5 mm d−1, which is the 25th percentile of daily discharges across all catchments, because flows above this threshold cannot be considered truly low flows. This resulted in the removal of approximately 2 % of all low flows, leaving a total of 6124 station years for our analysis. We split the data set of annual low flows into cold-season low flows occurring between December and April and warm-season low flows occurring between May and November. In total, we observed 2122 cold-season low flows and 4002 warm-season low flows across the 380 catchments within the 19-year time period.
We determined the catchment area and mean catchment elevation for each gauging station based on a 2 m digital elevation model (DEM; SwissAlti3D 2016, Swisstopo), using functions provided in the ArcGIS Spatial Analyst toolbox. The catchments range in size from 1 to 519 km2, vary in mean elevation from 309 to 2930 m and have diverse land covers and climates. Daily gridded precipitation and temperature data ( km cells; MeteoSwiss products RhiresD and TabsD) were used to derive catchment-averaged weather and climate conditions. Daily potential evapotranspiration (Ep) was estimated following the method of Hargreaves and Samani (1985). A gridded data set of SWE on 1 March of each year was used to estimate the catchment-averaged SWE. The SWE product was based on data from 320 Swiss snow monitoring stations that were assimilated into a distributed snow cover model (Magnusson et al., 2014; Griessinger et al., 2016). We use SWE on 1 March instead of 1 April because our focus is on warm-season low flows in lower-elevation catchments, most of which have no substantial snow left by 1 April (Winstral et al., 2019; Lüthi et al., 2019).
2.2 Anomalies of climate variables
To infer climate conditions preceding annual low flows, we selected the annual 7 d minimum streamflow events (Qmin) in each catchment for each year from 2000 to 2018. We then calculated precipitation and potential evapotranspiration for time windows of different lengths prior to each annual low flow. We hypothesize that severe low flows will usually follow periods in which precipitation and potential evapotranspiration significantly deviate from their seasonal averages. Thus, we define climate anomalies as deviations in precipitation and potential evapotranspiration from their climatic norms, defined as their long-term averages on the same day of the year. For example, we quantify precipitation anomalies (in millimeters) as follows:
where P(t) is daily precipitation (in millimeters) at day t, is the climatic mean precipitation on day t averaged across all of the years on record, dt is the time period over which anomalies are calculated for each annual low flow, and dl is the day of the low flow. We vary the time period dt from 1 week to half a year (7, 14, 30, 60, 90, 120 and 182 d), with the endpoint always being the date of the low flow. For example, the 30 d precipitation anomaly for a low flow that happened on 30 September 2018 is calculated using the sum of precipitation from 1 to 30 September 2018 minus the mean of precipitation for all 1 to 30 September periods from 2000 to 2018. We calculate Ep anomalies in the same way.
2.3 Statistical tests and quantification of process importance
We first report the spatial distribution of the timing of the annual lowest flows across Switzerland for 2000 until 2018. We then show the magnitude of the 30 d climate anomalies before each annual low flow as a function of elevation. The mechanisms involved in generating annual cold-season low flows and warm-season low flows are different; thus, we split our data set into cold-season and warm-season low flows. From this point on, we report results only for warm-season low flows. To quantify the relationship between the magnitudes of climate anomalies and the magnitudes of warm-season annual low flows, we use Spearman rank correlation coefficients (rS) as a robust estimator (Legates and McCabe, 1999). We report these rank correlations across all catchments in a histogram. To test the regional significance of the rS coefficients, we use the sign test.
We assess the impact of the length of climate anomalies preceding the annual warm-season low flows by comparing the magnitude of P and Ep anomalies for the different time windows (7, 14, 30, 60, 90, 120 and 182 d) between the 4 driest years and the more typical years. We also correlate the magnitude of warm-season Qmin with the number of days that P and Ep exceed certain thresholds. The threshold that defines low precipitation is the 20th percentile of 10 d running averages of precipitation over the entire period of record. Similarly, the threshold that defines high Ep is the 80th percentile of 10 d running averages of Ep over the entire period of record. We report the distribution of rank correlations calculated for each catchment based on the 19 years of data in histograms. The magnitudes of the annual low flows are shown as box plots for each individual year. The horizontal line in the box plots indicates the median, the box represents the interquartile range and the whiskers extend to 1.5 times the interquartile range above and below the box; the dots are outliers.
To quantify the individual and joint importance of the magnitude of P and Ep anomalies, we first calculated the Spearman rank correlation between the individual anomalies and Qmin for the different time windows (30, 60, 90, 120 and 182 d) for all years (2000–2018) and for the years with the lowest low flows (2003, 2011, 2015 and 2018). For this analysis, we reduced the original data set to only those catchments where at least 5 years of Qmin data were available, as suggested in WMO (2008). In a next step, we used the joint anomalies of P and Ep for all durations 30, 60, 90, 120 and 182 d to predict Qmin with a multivariate stepwise generalized linear model (GLM) fitted by minimizing the root mean square error (RMSE). We then computed the fraction of the GLMs R2 attributable to the individual precipitation and Ep anomalies for each duration to assess the relative contribution of each anomaly for the prediction of Qmin. We compared the results for all years to those for the lowest flow years (2003, 2011, 2015 and 2018) to assess whether the relations between climate anomalies and Qmin differed during the driest years.
To test how warm-season low flows are influenced by precipitation and snow processes in the preceding winter, we calculated the Spearman rank correlations between the total precipitation sum from December to March and the following warm-season Qmin and between SWE on 1 March and the following warm-season Qmin. We again report these rank correlations across multiple catchments in histograms and test the significance of these distributions of correlations by the sign test.
Finally, we assess whether the correlations we obtained between P and Ep anomalies and warm-season Qmin are influenced by the extent of human impact in each catchment. We quantify human impact by the fraction of human-affected land cover in each catchment. As a proxy for human activity, we use the Corine land cover data set (CLC, 2018) and calculate the fraction of catchment area with “artificial surfaces”. We then show histograms of the rank correlations between P, Ep and Qmin in the 20 % of catchments with the most human-influenced land use and the 20 % of catchments with the least human-influenced land use, compared to the distribution across all catchments. We assessed the significance of the differences between the obtained distributions with Student's t test.
3.1 Spatial patterns of low-flow timing
During the dry years of 2003, 2011, 2015 and 2018, low-flow conditions occurred across large parts of Europe (Laaha et al., 2017; Van Lanen et al., 2016). Annual low flows did not occur simultaneously across Switzerland but instead occurred primarily during winter in the Alpine regions and in summer and autumn across the Swiss Plateau (Fig. 1). In addition, within these two subregions, the timing of low flows was still spatially variable, indicating that annual low flows may be surprisingly asynchronous across Switzerland, even in unusually dry years. Within the Swiss Plateau, low-flow timing is more spatially consistent during some years without severe low flows (e.g., 2009, 2013 and 2016) than during others (e.g., 2000, 2002, 2004, 2010 and 2017).
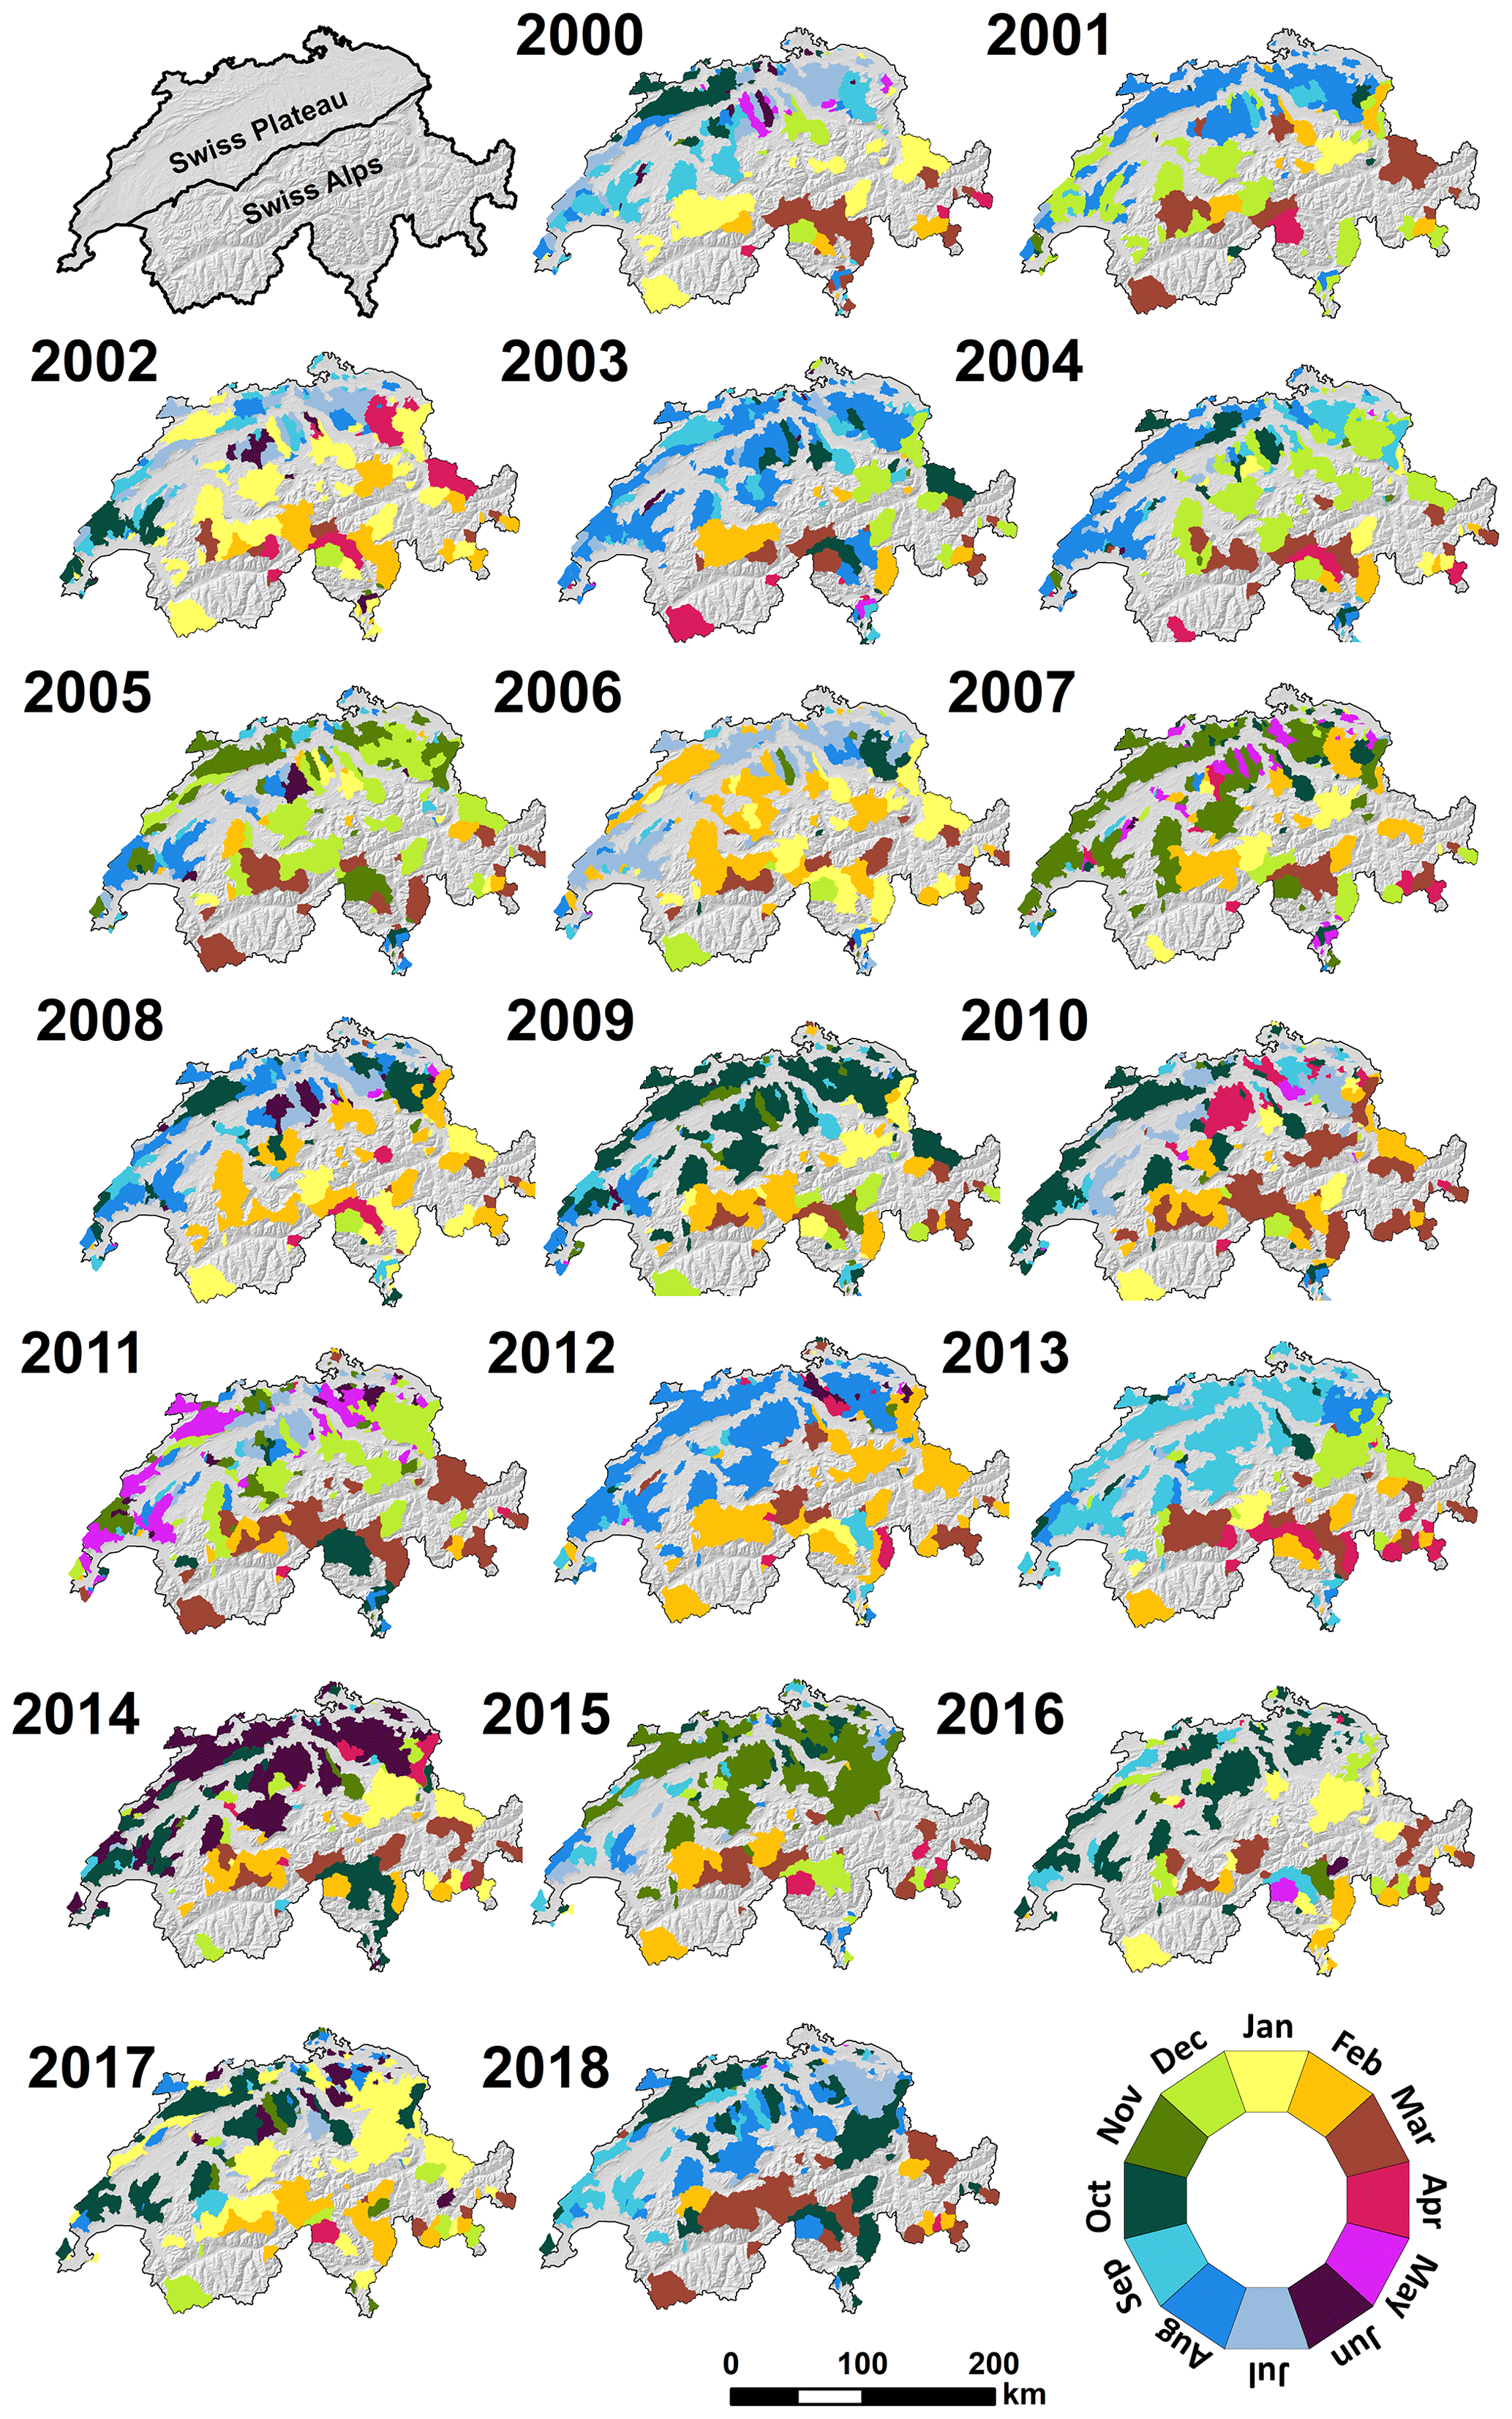
Figure 1The timing of the occurrence of annual low flows across Switzerland for the years 2000 to 2018 in the two main regions, namely the Swiss Plateau and Swiss Alps (roughly the northern and southern halves of the country, respectively). Low-flow timing tended to be spatially heterogeneous – even in years when large parts of Europe simultaneously experienced severe low flows (2003, 2011, 2015 and 2018).
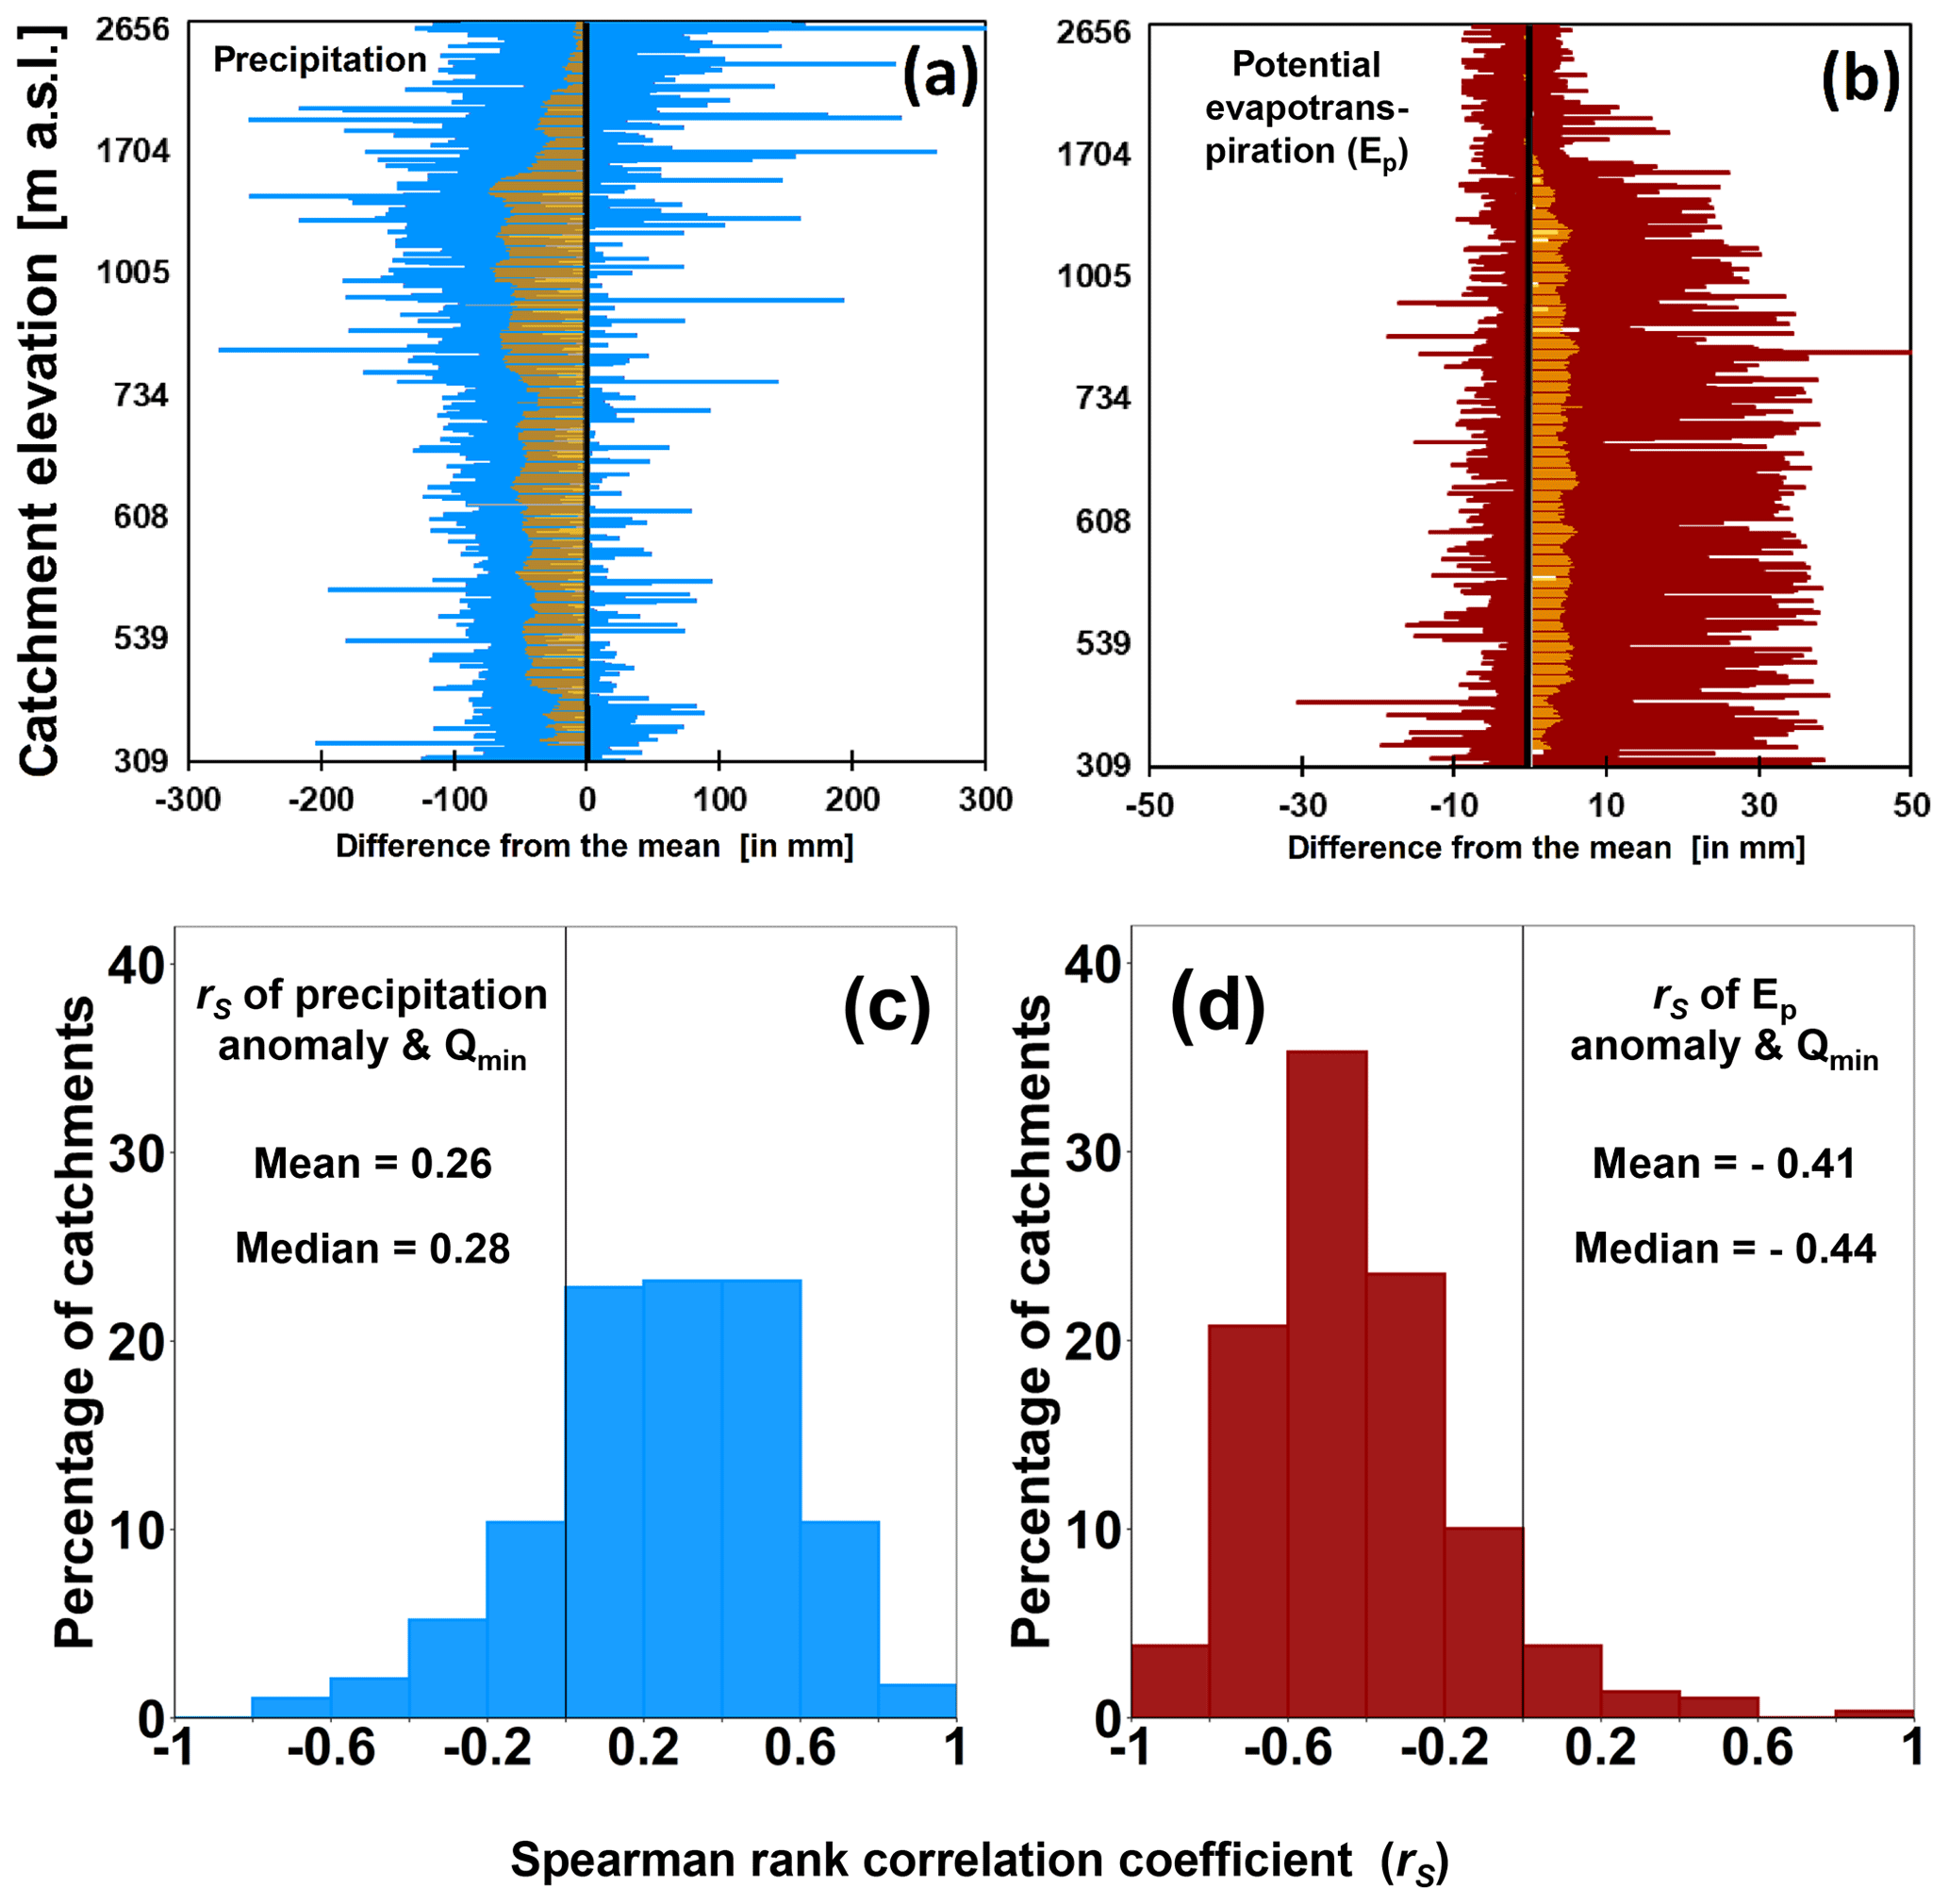
Figure 2Elevational variation in 30 d anomalies of precipitation (a) and potential evapotranspiration (b) preceding (warm- and cold-season) annual low flows from 2000 through 2018. Blue and red horizontal bars indicate the range between the minima and maxima of these anomalies at each catchment across the 19 years of this study. Yellow bars show moving averages of these climate anomalies for bins of 10 catchments ordered by elevation. Note that the elevation scale is not linear. Low flows are associated with below-average precipitation (a) and above-average potential evapotranspiration (b). Histograms of rank correlations between anomalies of precipitation (c) and potential evapotranspiration (d) and low-flow magnitudes for warm-season (May through November) low flows across Swiss catchments. Results for cold-season low flows can be found in Fig. S2.
3.2 Climate anomalies control low-flow timing and magnitude
The occurrence of low flows is linked to periods of below-average P and above-average Ep (Fig. 2a and b). However, distinct site-to-site differences exist; at elevations below approximately 1500 m above sea level (a.s.l.), almost all annual low flows occur after periods of anomalously high potential evapotranspiration and anomalously low precipitation (Fig. 2a and b). At higher elevations, by contrast, Ep anomalies have no systematic effect, and precipitation anomalies become less important with increasing elevation. This reduced importance of anomalies at these higher elevations is probably because low flows here result primarily from freezing temperatures (or periods of snow accumulation) rather than precipitation or Ep patterns. Low flows at higher elevations occur during the winter months when there is a lack of liquid water input to catchments due to precipitation mostly accumulating as snow and little snowmelt. These processes are mainly driven by sustained below-zero temperatures. Thus, the main determining factor in winter low flows at high elevations (or in cold environments) will likely be the length of the snow accumulation period, rather than what the exact temperatures were or how much precipitation occurred.
More severe climate anomalies lead to lower low flows (Fig. 2c and d). Spearman rank correlations of magnitudes of the climate anomalies to magnitudes of Qmin (shown for the months May through November) indicate that lower precipitation in the 30 d prior to Qmin usually results in smaller Qmin (median rS=0.28). Similarly, higher potential evapotranspiration usually results in smaller Qmin (median ). This indicates that the magnitudes of both precipitation and Ep anomalies affect low-flow magnitudes (p values < 0.001 according to the sign test) but with substantial site-to-site variability. The rS between 30 d climate anomalies and Qmin does not show distinct spatial patterns across Switzerland (see Fig. S3). The rS between the 30 d precipitation anomaly and Qmin is not correlated with mean catchment elevation (R2=0.08), and the rS between the 30 d Ep anomaly and Qmin is weakly correlated with mean catchment elevation (R2=0.33).
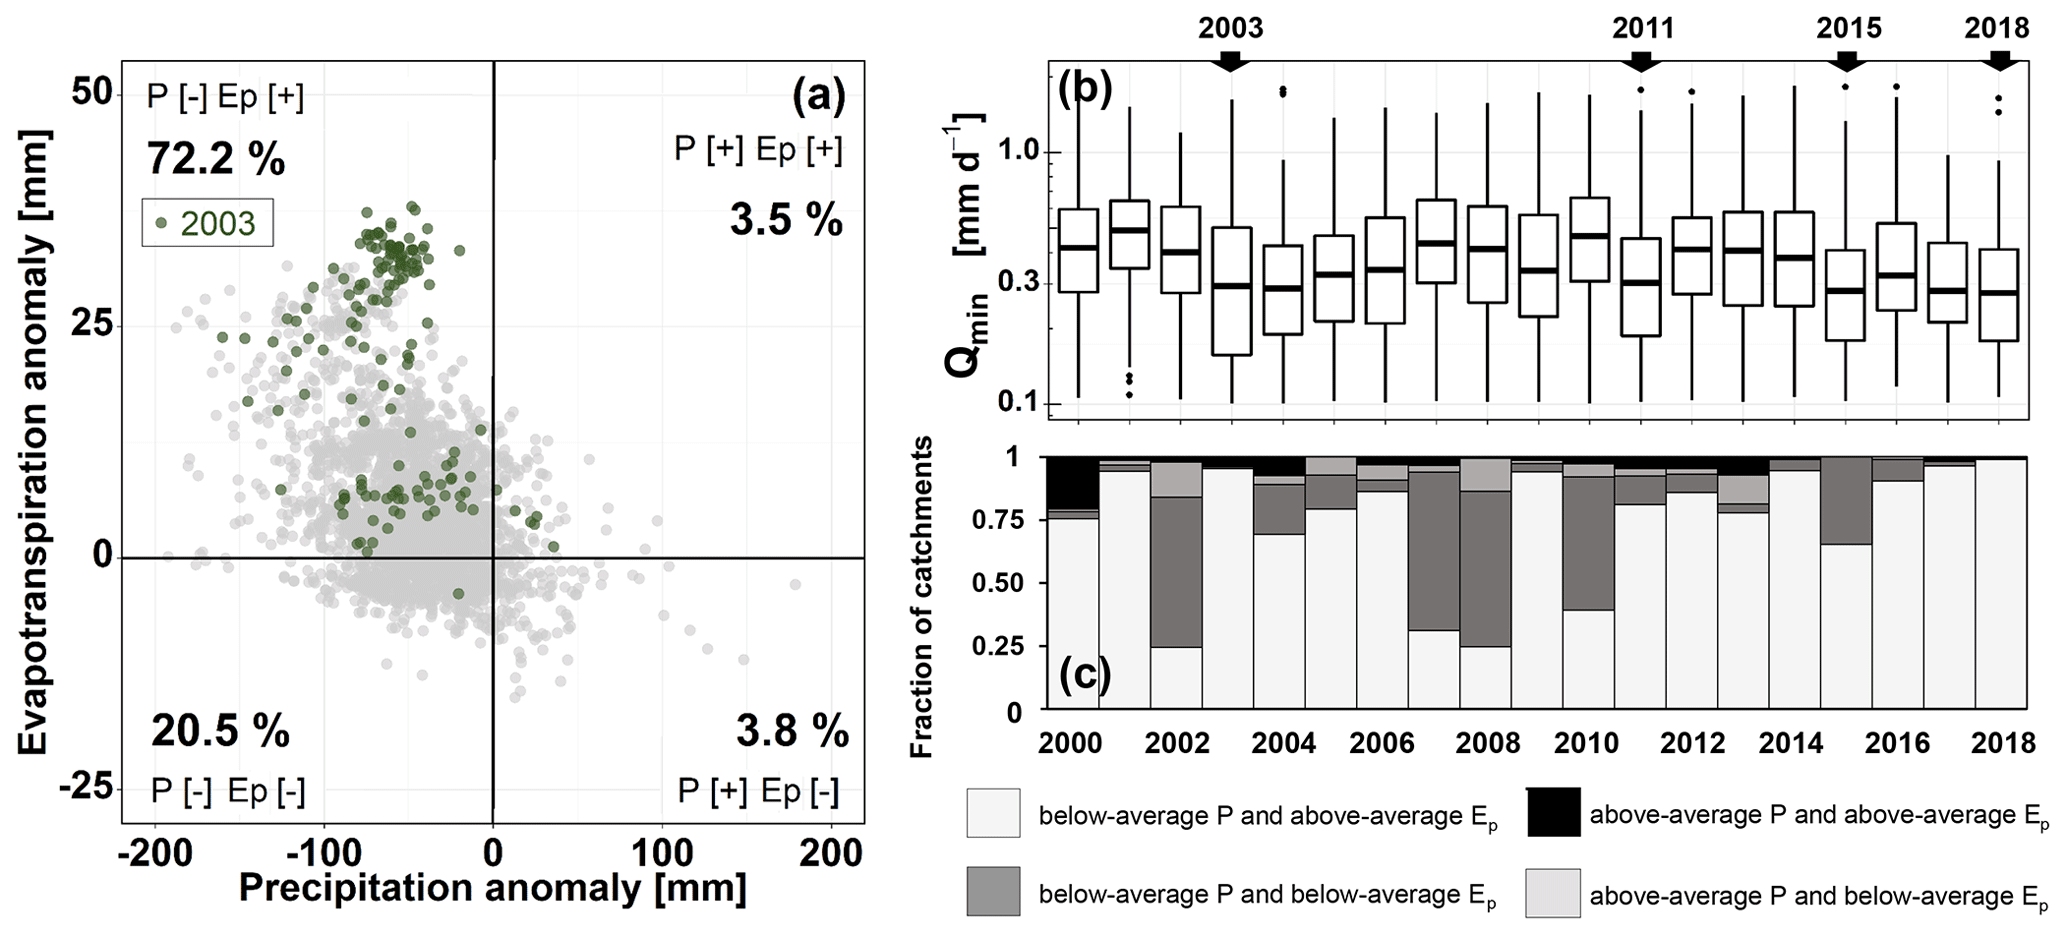
Figure 3Anomalies in precipitation and potential evapotranspiration 30 d prior to each annual warm-season (May through November) low-flow period in each catchment (gray dots); annual cold-season low flows were excluded (a). The most severe low-flow year during the study (2003) is highlighted in green. Almost all (92.7 %) annual low flows occurred following below-average precipitation; see the left half of panel (a). A total of 72.2 % of all low flows occurred following a combination of below-average precipitation and above-average potential evapotranspiration; see the upper left quadrant of panel (a). Box plots of warm-season 7 d minimum flows for the Swiss study catchments (b), and the catchment distribution of the signs of precipitation and evapotranspiration anomalies that preceded these low flows (c). The most severe low-flow years (2003, 2011, 2015 and 2018) were characterized by negative precipitation anomalies and positive Ep anomalies for the vast majority of catchments, as indicated by the light gray bars in (c).
3.3 Combined effects of climate anomalies on warm-season low flows
The results shown in Fig. 2 indicate that both P and Ep can affect low flows. However, most low flows are not caused by only one driver but instead result from the combined effects of below-average P and above-average Ep during the same time period. Warm-season low flows usually follow periods of below-average precipitation and above-average potential evapotranspiration (72.2 % of low flows occur in the top left quadrant of Fig. 3a). Less than a quarter of the annual low flows occur after periods of below-average precipitation and below-average potential evapotranspiration (20.5 %; lower left quadrant in Fig. 3a). Only very few annual low flows (7.3 %) occur after periods of above-average precipitation. Thus, precipitation anomalies appear to be the most important driver for warm-season low flows in Switzerland and potentially also in other regions with distinct warm-season low flows. While potential evapotranspiration appears to be less important than precipitation, more than 70 % of low flows are caused by a combination of both drivers. The combined effect of above-average Ep thus more than triples the chance of an annual low flow compared to when precipitation is below average (but there is below-average Ep).
In particular, the most severe low flows occur through the combined effects of low precipitation and high potential evapotranspiration. For example, 96 % of low flows during the most severe low-flow year (2003; shown by green markers in Fig. 3a) follow periods of both below-average precipitation and above-average potential evapotranspiration. This behavior is not unique to the 2003 event but was also observed for other years with severe annual low flows, such as 2011, 2015 and 2018 (Fig. 3b and c).
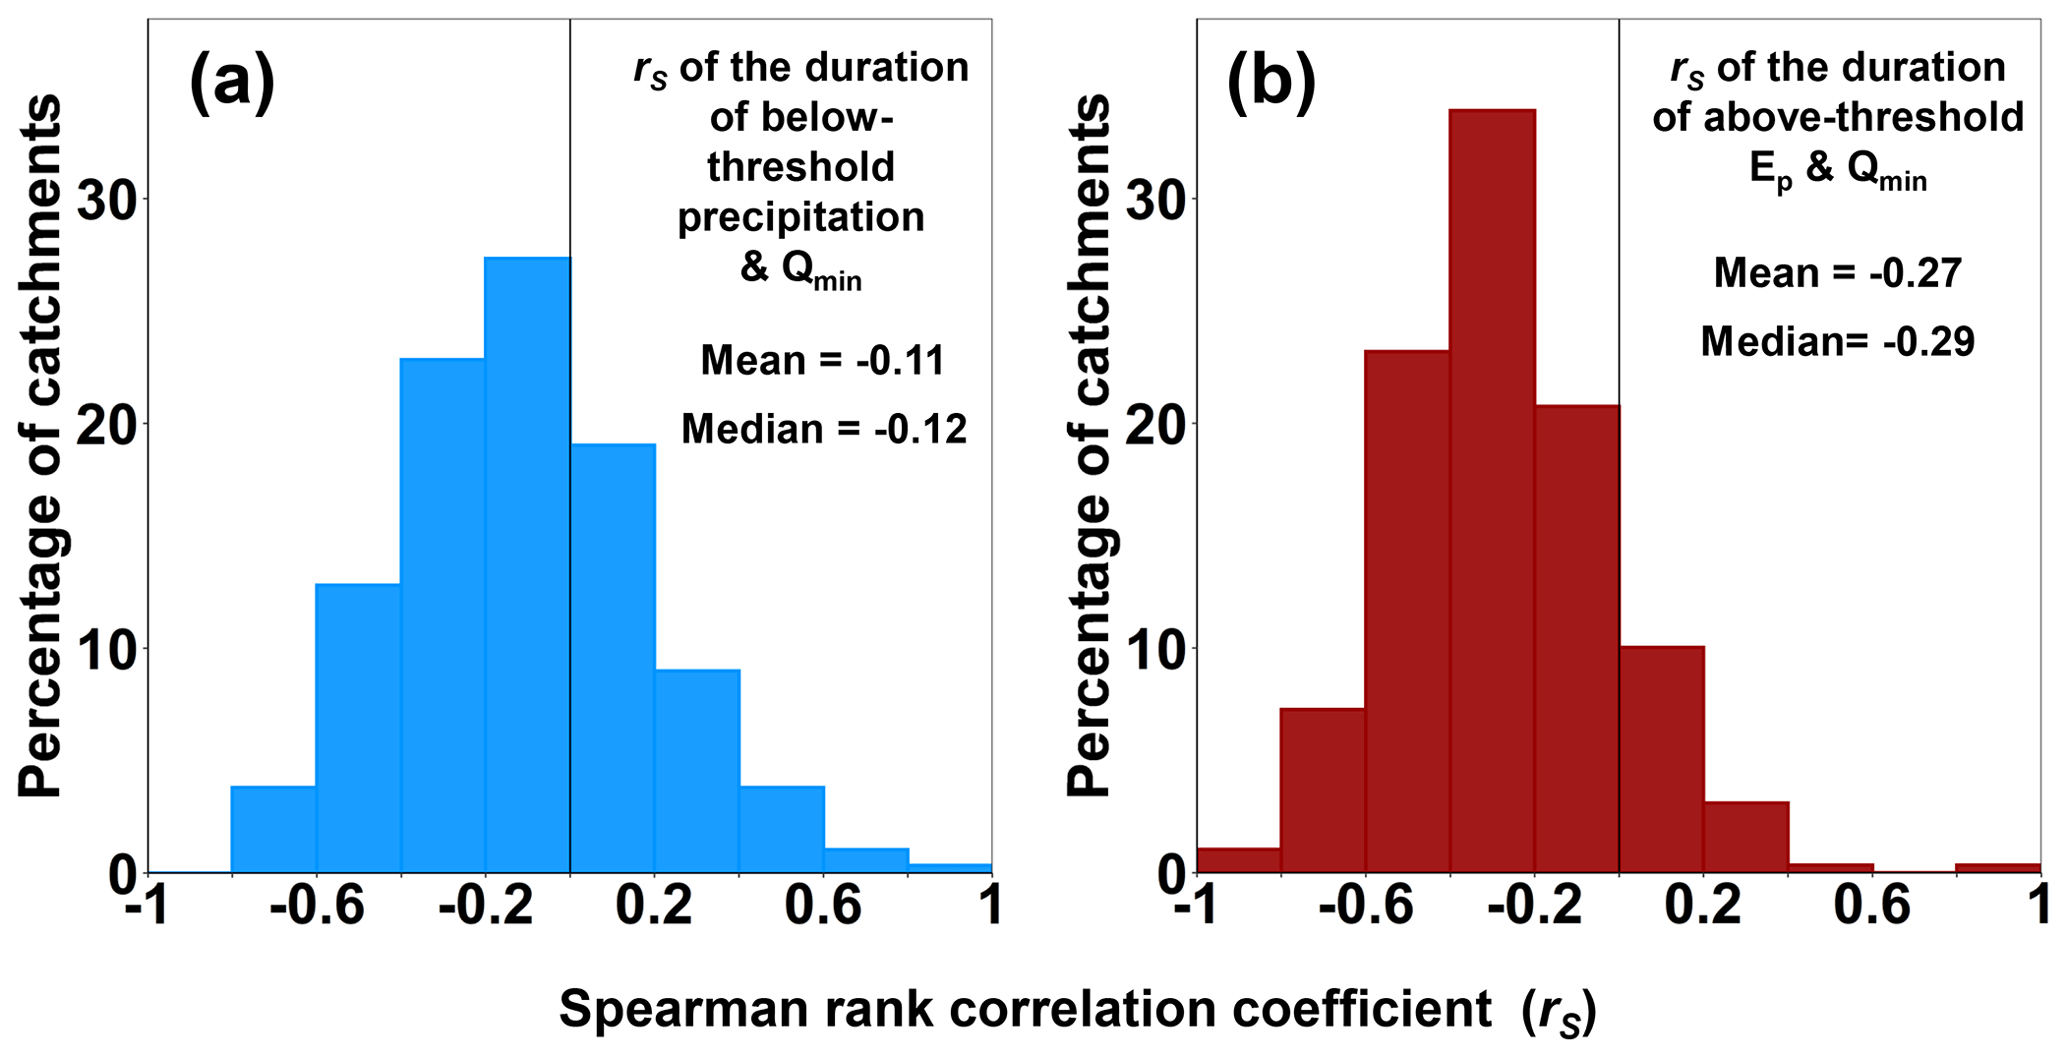
Figure 4Histograms of rank correlations between the magnitudes of warm-season low flows and the lengths of the preceding intervals with below-threshold precipitation (a) or above-threshold Ep (b). Longer periods of high Ep are associated with lower low flows, whereas a weaker association is seen between lower low flows and longer periods with low precipitation.
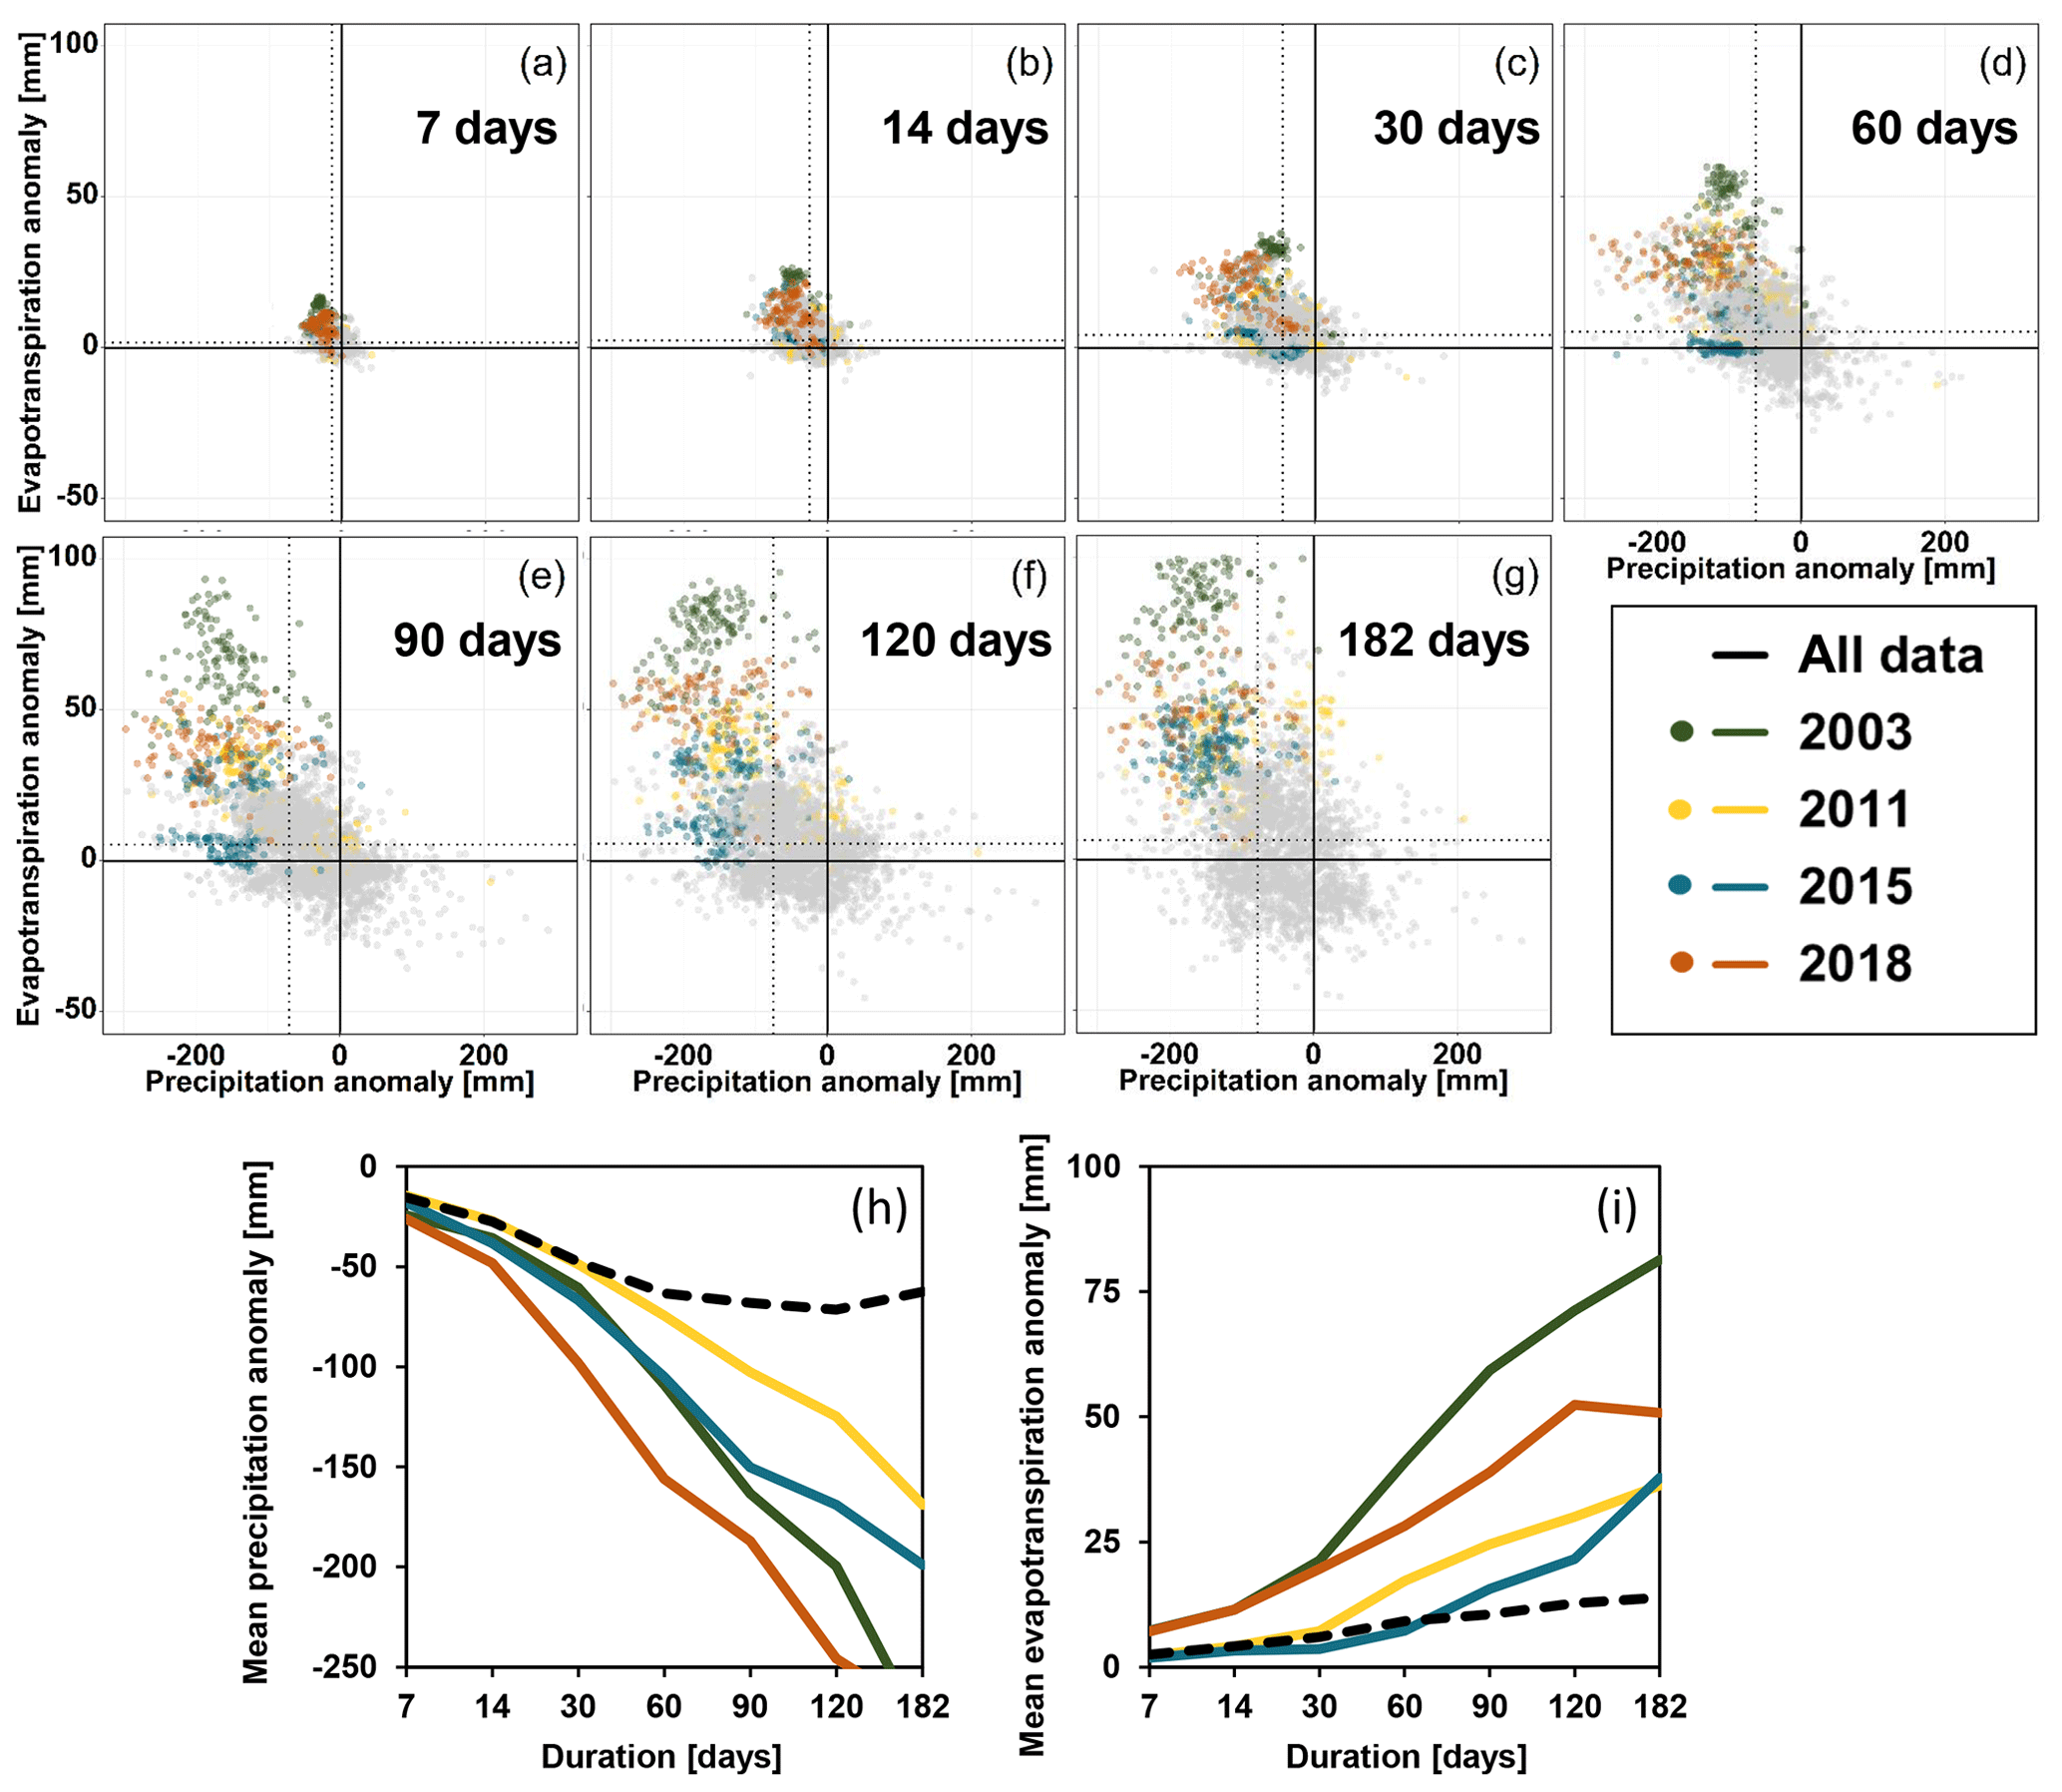
Figure 5Cumulative anomalies of precipitation and potential evapotranspiration over 7, 14, 30, 60, 90, 120 and 182 d prior to every annual warm-season low flow in each catchment (a–g), and the evolution of the mean anomalies over the different time windows (h, i). Each gray dot represents the combination of precipitation and Ep anomalies before one low-flow event at one site. Low-flow anomalies in the most severe low-flow years are indicated by different colors (2003 in green, 2011 in yellow, 2015 in cyan and 2018 in orange). The dotted lines indicate the mean precipitation and Ep anomalies. The mean anomalies (dotted lines in all panels) clearly increase within the first 60 d prior to low flows but show no clear trend over longer time windows. During the most severe low-flow years, however, the mean anomalies continue to increase across all of the time windows examined here. In particular, the Ep anomalies during the severe low-flow years grow well beyond the range that is observed during more typical years.
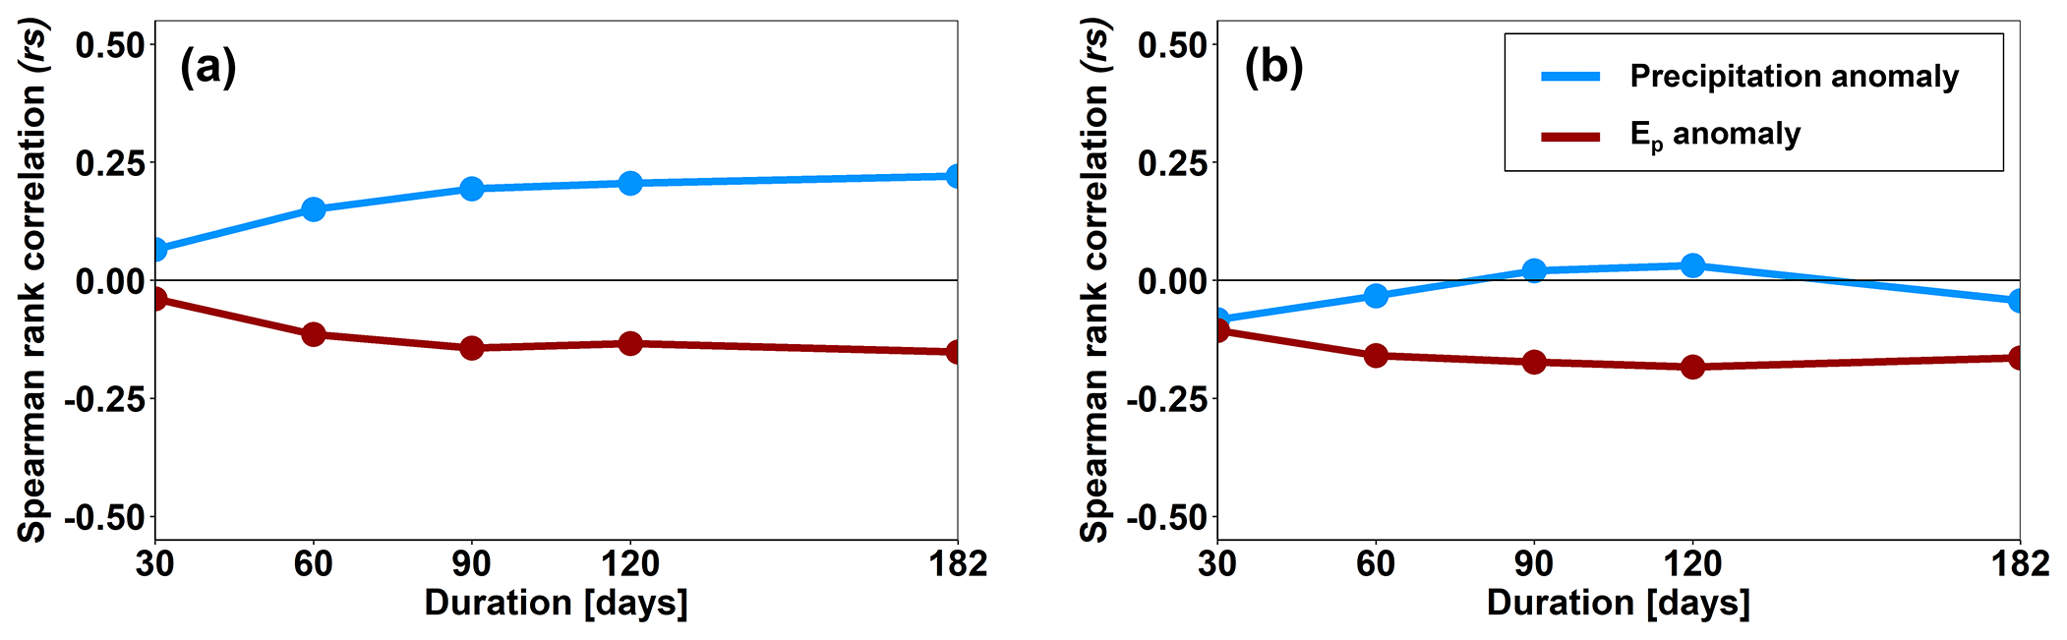
Figure 6Spearman rank correlation coefficients between precipitation (blue) and Ep anomalies (red) and Qmin of warm-season (May to November) low flows for durations of 30 to 182 d across all stations and years. The overall explanatory power of the climate anomalies in a bivariate regression framework is low, although precipitation anomalies are slightly better correlated to Qmin than Ep anomalies in the whole data set (a). In the 4 driest years (b), the overall explanatory power of precipitation anomalies is much smaller, and the explanatory power of Ep anomalies is slightly greater than in all years combined.
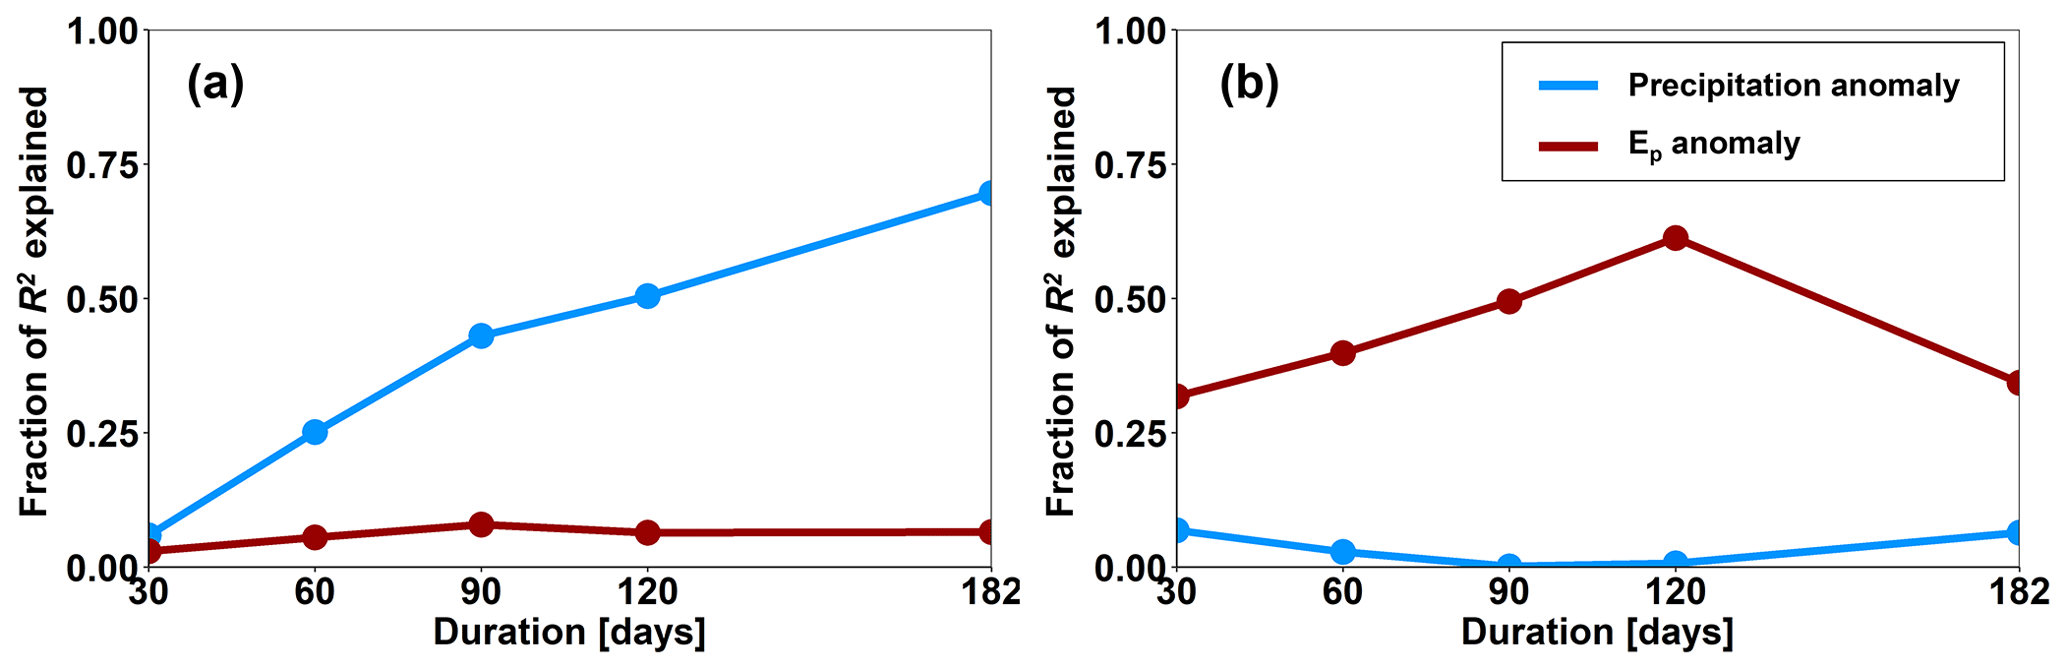
Figure 7The fraction of multivariate R2 (calculated by a stepwise generalized linear regression model that explains warm-season low-flow magnitudes, using all climate variables and durations) that can be explained by a precipitation (blue) or Ep (red) anomaly of the specified duration. Precipitation anomalies explain most of the variation in Qmin when looking at all stations and all years (a). However, precipitation anomalies are not good predictors of low flows that occurred in the driest years (2003, 2011, 2015 and 2018), while Ep anomalies are instead much better predictors of Qmin variability (b).
3.4 Duration of climate anomalies
The magnitudes of low flows are also related to the durations of the preceding precipitation and evapotranspiration anomalies. Longer periods of below-threshold P and above-threshold Ep tend to lead to lower low flows in most of our catchments (Fig. 4). The duration of high Ep is more strongly correlated with low-flow magnitudes than the duration of low precipitation (mean Spearman correlations rS of −0.27 and −0.11, respectively; median rS values differ from 0 at p<0.001 by the sign test; Fig. 4). The weaker correlation with the duration of below-threshold precipitation probably arises because precipitation is more erratic through the years than Ep. A single precipitation event may exceed the precipitation threshold (according to the criterion outlined in Sect. 2.3) but be insufficient to end the low flow in the stream. Low-flow magnitudes are less strongly correlated with the duration of below-threshold precipitation than with the intensity of 30 d precipitation anomalies (compare Fig. 4 with Fig. 1; mean rS of −0.11 and 0.26, respectively). Similarly, low-flow magnitudes are less strongly correlated with the duration of above-threshold Ep than with the intensity of 30 d Ep anomalies (compare Fig. 4 with Fig. 1; mean rS of −0.27 and −0.41, respectively).
Summing P and Ep anomalies over time windows ranging from 1 week to half a year indicates that most low flows can be well explained by anomalies of up to 60 d (Fig. 5h). This is because, in the typical Swiss climate, precipitation and Ep anomalies usually last for 60 d or less. This is depicted by the gray cloud of points in Fig. 5 and the mean anomalies (indicated by the dotted lines in Fig. 5a–g) which remain approximately stable for periods exceeding 60 d. Thus, while longer precipitation and Ep anomalies would lead to lower flows, most low flows result from anomalies of up to 60 d. This is because most anomalies peak at around that 60 d timescale, which is also indicated by the means of the precipitation and Ep anomalies as functions of timescale (dashed lines in Fig. 5h and i).
The severe low flows in 2003, 2011, 2015 and 2018, however, are associated with P and Ep anomalies that grow for much longer and, thus, become much larger than the roughly 60 d anomalies that are typical in this climate (colored symbols in Fig. 5). Long periods of above-average Ep appear to be an important factor for these severe low flows; the colored points in Fig. 5e–g expand more on the y axis than the x axis for timescales > 60 d. Thus, severe low flows result from longer-lasting (and thus larger) P and Ep anomalies, whereas more typical low flows result from climate anomalies that end after roughly 60 d, as illustrated by Fig. 5h and i.

Figure 8Histograms of the rank correlations between winter precipitation (December through March; gray bars), the 1 March snow water equivalent (SWE; green bars) and the magnitude (a) and timing (b) of warm-season low flows. Winter precipitation is weakly associated with higher, and later, warm-season low flows, as indicated by the positive rS for the majority of catchments; however, correlations are weak overall, with considerable site-to-site variability.
3.5 The relative importance of P and Ep anomalies for warm-season low-flow magnitudes
We further assessed the relative importance of each of the climate drivers and their duration in predicting the magnitude of annual low flows by calculating the Spearman rank correlation between each climate driver and Qmin as one value for all stations and years together (Fig. 6). The results also include the site-to-site variability in Qmin; thus, the overall rS correlations are weaker than those shown in Fig. 1c and d. Typical low flows across all years of the observation period (2000–2018) are more strongly correlated to precipitation anomalies than to Ep anomalies (see also Fig. 1), and this correlation becomes slightly stronger at longer durations. However, during the driest years of our data set (2003, 2011, 2015 and 2018), the correlation between precipitation anomalies and Qmin drops to roughly zero, suggesting that, under these extreme conditions, low precipitation alone cannot explain the variation in annual low-flow magnitudes. Instead, in these dry years, Ep anomalies retain their predictive power for Qmin, suggesting a relatively more important role of Ep in dry years.
To quantify how much of the maximum predictive power lies in individual anomalies, we first used a multivariate stepwise generalized linear model (GLM) to predict Qmin as a function of all precipitation and Ep anomalies for all durations of 30, 60, 90, 120 and 182 d. In Fig. 7 we show the fraction of the model R2 explained by individual P and Ep anomalies for the different durations. Across all stations and years of the observation period (2000–2018), warm-season Qmin is best predicted by precipitation anomalies with an increasing duration (Fig. 7a), which shows the cumulative effect of low precipitation. However, in the years with the lowest annual warm-season low flows (2003, 2011, 2015 and 2018), the picture reverses and instead Ep explains most of the variability in Qmin. This is true across a wider range of durations, starting even at 30 d. Thus, although precipitation anomalies are a good predictor for typical low flows, low-flow magnitudes in the driest years are more strongly related to Ep anomalies when precipitation is also very low. However, please note that the overall predictive power of the GLM, like the correlations in Fig. 6, is rather low.
3.6 The impact of winter precipitation and snow on warm-season low flows
Previous studies indicate that winter snowpack and snowfall can influence the timing and magnitude of summer low flows in some regions (e.g., Dierauer et al., 2018; Jenicek et al., 2016; Godsey et al., 2014). If this holds true for our study catchments, more winter precipitation (December through March), or higher SWE on 1 March, should lead to larger and later warm-season low flows. To test for this effect, we calculated Spearman rank correlations between winter precipitation totals and the subsequent warm-season low-flow magnitudes and timings. The correlations between winter precipitation and the magnitude and timing of Qmin (mean absolute rS<0.11 for both; gray bars in Fig. 8) are weaker than those between low-flow magnitudes and climate anomalies directly preceding low flows (Fig. 2c and d), and they do not vary systematically with elevation. We also calculated the Spearman rank correlations between 1 March SWE and subsequent low-flow magnitudes and timing and found no strong relationship (Fig. 8, green bars; mean absolute rS<0.17 for both).
4.1 Climate anomalies control low-flow timing and magnitude
Anomalies of precipitation and potential evapotranspiration affect the magnitude of low flows, but their influence decreases with elevation (Fig. 2a and b). This pattern is probably not unique to Switzerland, and we expect precipitation and Ep anomalies to also be relatively unimportant in other cold regions where low flows primarily occur in winter (e.g., Dierauer et al., 2018; Laaha and Blöschl, 2006; Van Loon et al., 2015; Wang, 2019) and are driven by extended freezing periods. However, warm-season low flows are common globally (e.g., Dettinger and Diaz, 2000; Eisner et al., 2017), suggesting that summer climate anomalies are likely to be important not only for the lower-elevation catchments in Switzerland but also across many other regions in the world.
We found that the combined effects of P and Ep anomalies shape the occurrence and magnitude of low flows, with the more extreme low flows being driven by longer-duration anomalies. Typical warm-season low flows result from climate anomalies of up to 60 d (Fig. 5). In Switzerland, typical low flows result from relatively short climate anomalies, probably because precipitation does not have a strong seasonal signature. In climates that typically have frequent precipitation events, short periods (e.g., one to two months) with less precipitation than normal will most likely precede the annual low flow. Similarly, short Ep deviations from the norm often precede typical annual low flows. In the years with the lowest low flows (2003, 2011, 2015 and 2018), the durations of climate anomalies were significantly longer and especially the impacts of Ep anomalies were larger (Fig. 5). This highlights precipitation and evapotranspiration as combined drivers of severe low flows, consistent with findings in several experimental catchments during the 2003 low-flow year (Teuling et al., 2013). Our results suggest that the magnitude and duration of these precipitation and Ep anomalies are generally important controls on low flows in a large, diverse sample of mesoscale catchments across Switzerland. These compound effects of Ep and precipitation anomalies might also be important for low flows across larger regions (e.g., Stahl et al., 2010), as the climate conditions in Switzerland are comparable to those in other densely populated regions in the world. However, we only analyze these processes on timescales of up to half a year, so long-term memory effects in low-flow generation may not be fully captured by this approach.
The pronounced effect of Ep in the years with the lowest low flows might also reflect the coupling of P and Ep during dry and warm periods. Low precipitation and high air temperature lead to soil moisture depletion, forcing plants to reduce transpiration. Lower latent heat fluxes and greater sensible heat fluxes from the surface increase air temperature and, thus, increase Ep while reducing actual evapotranspiration. This complementary relationship between actual evapotranspiration and Ep can amplify the apparent effect of Ep during (extended) dry periods (Granger, 1989). Conversely, in locations where transpiration is not limited by water availability (e.g., at higher elevations), high temperatures and larger vapor pressure deficits (i.e., high Ep) may drive increases in transpiration rates, accelerating the depletion of catchment water stores and, thereby, reducing runoff. For example, Mastrotheodoros et al. (2020) showed how increased evapotranspiration at higher elevations systematically amplified runoff deficits during severe low flows in 2003 across the European Alps. These processes are especially relevant in view of potential future climatic changes. In Switzerland, climate change is expected to increase temperatures by more than the global average, resulting in warmer summers with less warm-season precipitation (CH2018, 2018). Similar trends are also expected in many other regions. This highlights the effects of water removal through evapotranspiration, especially during extended dry periods, which are expected to become more severe with changing climate conditions.
A small fraction of all warm-season low flows in the period 2000 to 2018 followed periods of above-average precipitation and below-average Ep (4 %; lower right quadrant of Fig. 3a). These anomalies are expected to lead to above-average flow conditions but can nonetheless lead to annual low flows for at least two reasons. First, these low flows occur in years that are relatively wet, with relatively high annual low flows (Fig. 3b). Second, flow conditions in most Swiss catchments are highly seasonal (Wehren et al., 2010; Weingartner and Aschwanden, 1992), meaning that the seasonality of the flow regime can, in some years, outweigh the effects of shorter term weather.
4.2 The influence of winter precipitation and snow on warm-season low flows
Previous work in several Swiss catchments has suggested that the snow water equivalent (SWE) accumulated in the winter snowpack strongly affects summer low-flow magnitudes (Jenicek et al., 2016). Our more complete data set of Swiss catchments indicates that winter precipitation and SWE (on 1 March) are only weakly related to the magnitude and timing of the following warm-season low flows. In addition, these weak correlations did not significantly increase at higher-elevation catchments, suggesting that, even at the higher-elevation sites, SWE is not a major control of warm-season low flows. We caution, however, that this analysis excludes many of the highest elevation catchments in which the annual low flow occurs during the winter. Thus, the discrepancy between our results and those of Jenicek et al. (2016) probably arises from differences between our respective definitions of low flows. We studied annual 7 d minima and included only the annual low flows that occur between May and November (thus excluding many high-elevation sites where annual low flows occur in the winter instead), whereas Jenicek et al. (2016) studied 7 d summer minima regardless of whether they were annual minima. Thus, winter precipitation and SWE do affect summer streamflow in Alpine catchments (Jenicek et al., 2016), but our results suggest that, for most of the rest of Switzerland, projected changes in winter snowpacks (e.g., Harpold et al., 2017; Mote et al., 2018) might only slightly affect the magnitude and timing of annual low flows that occur during the warm season.
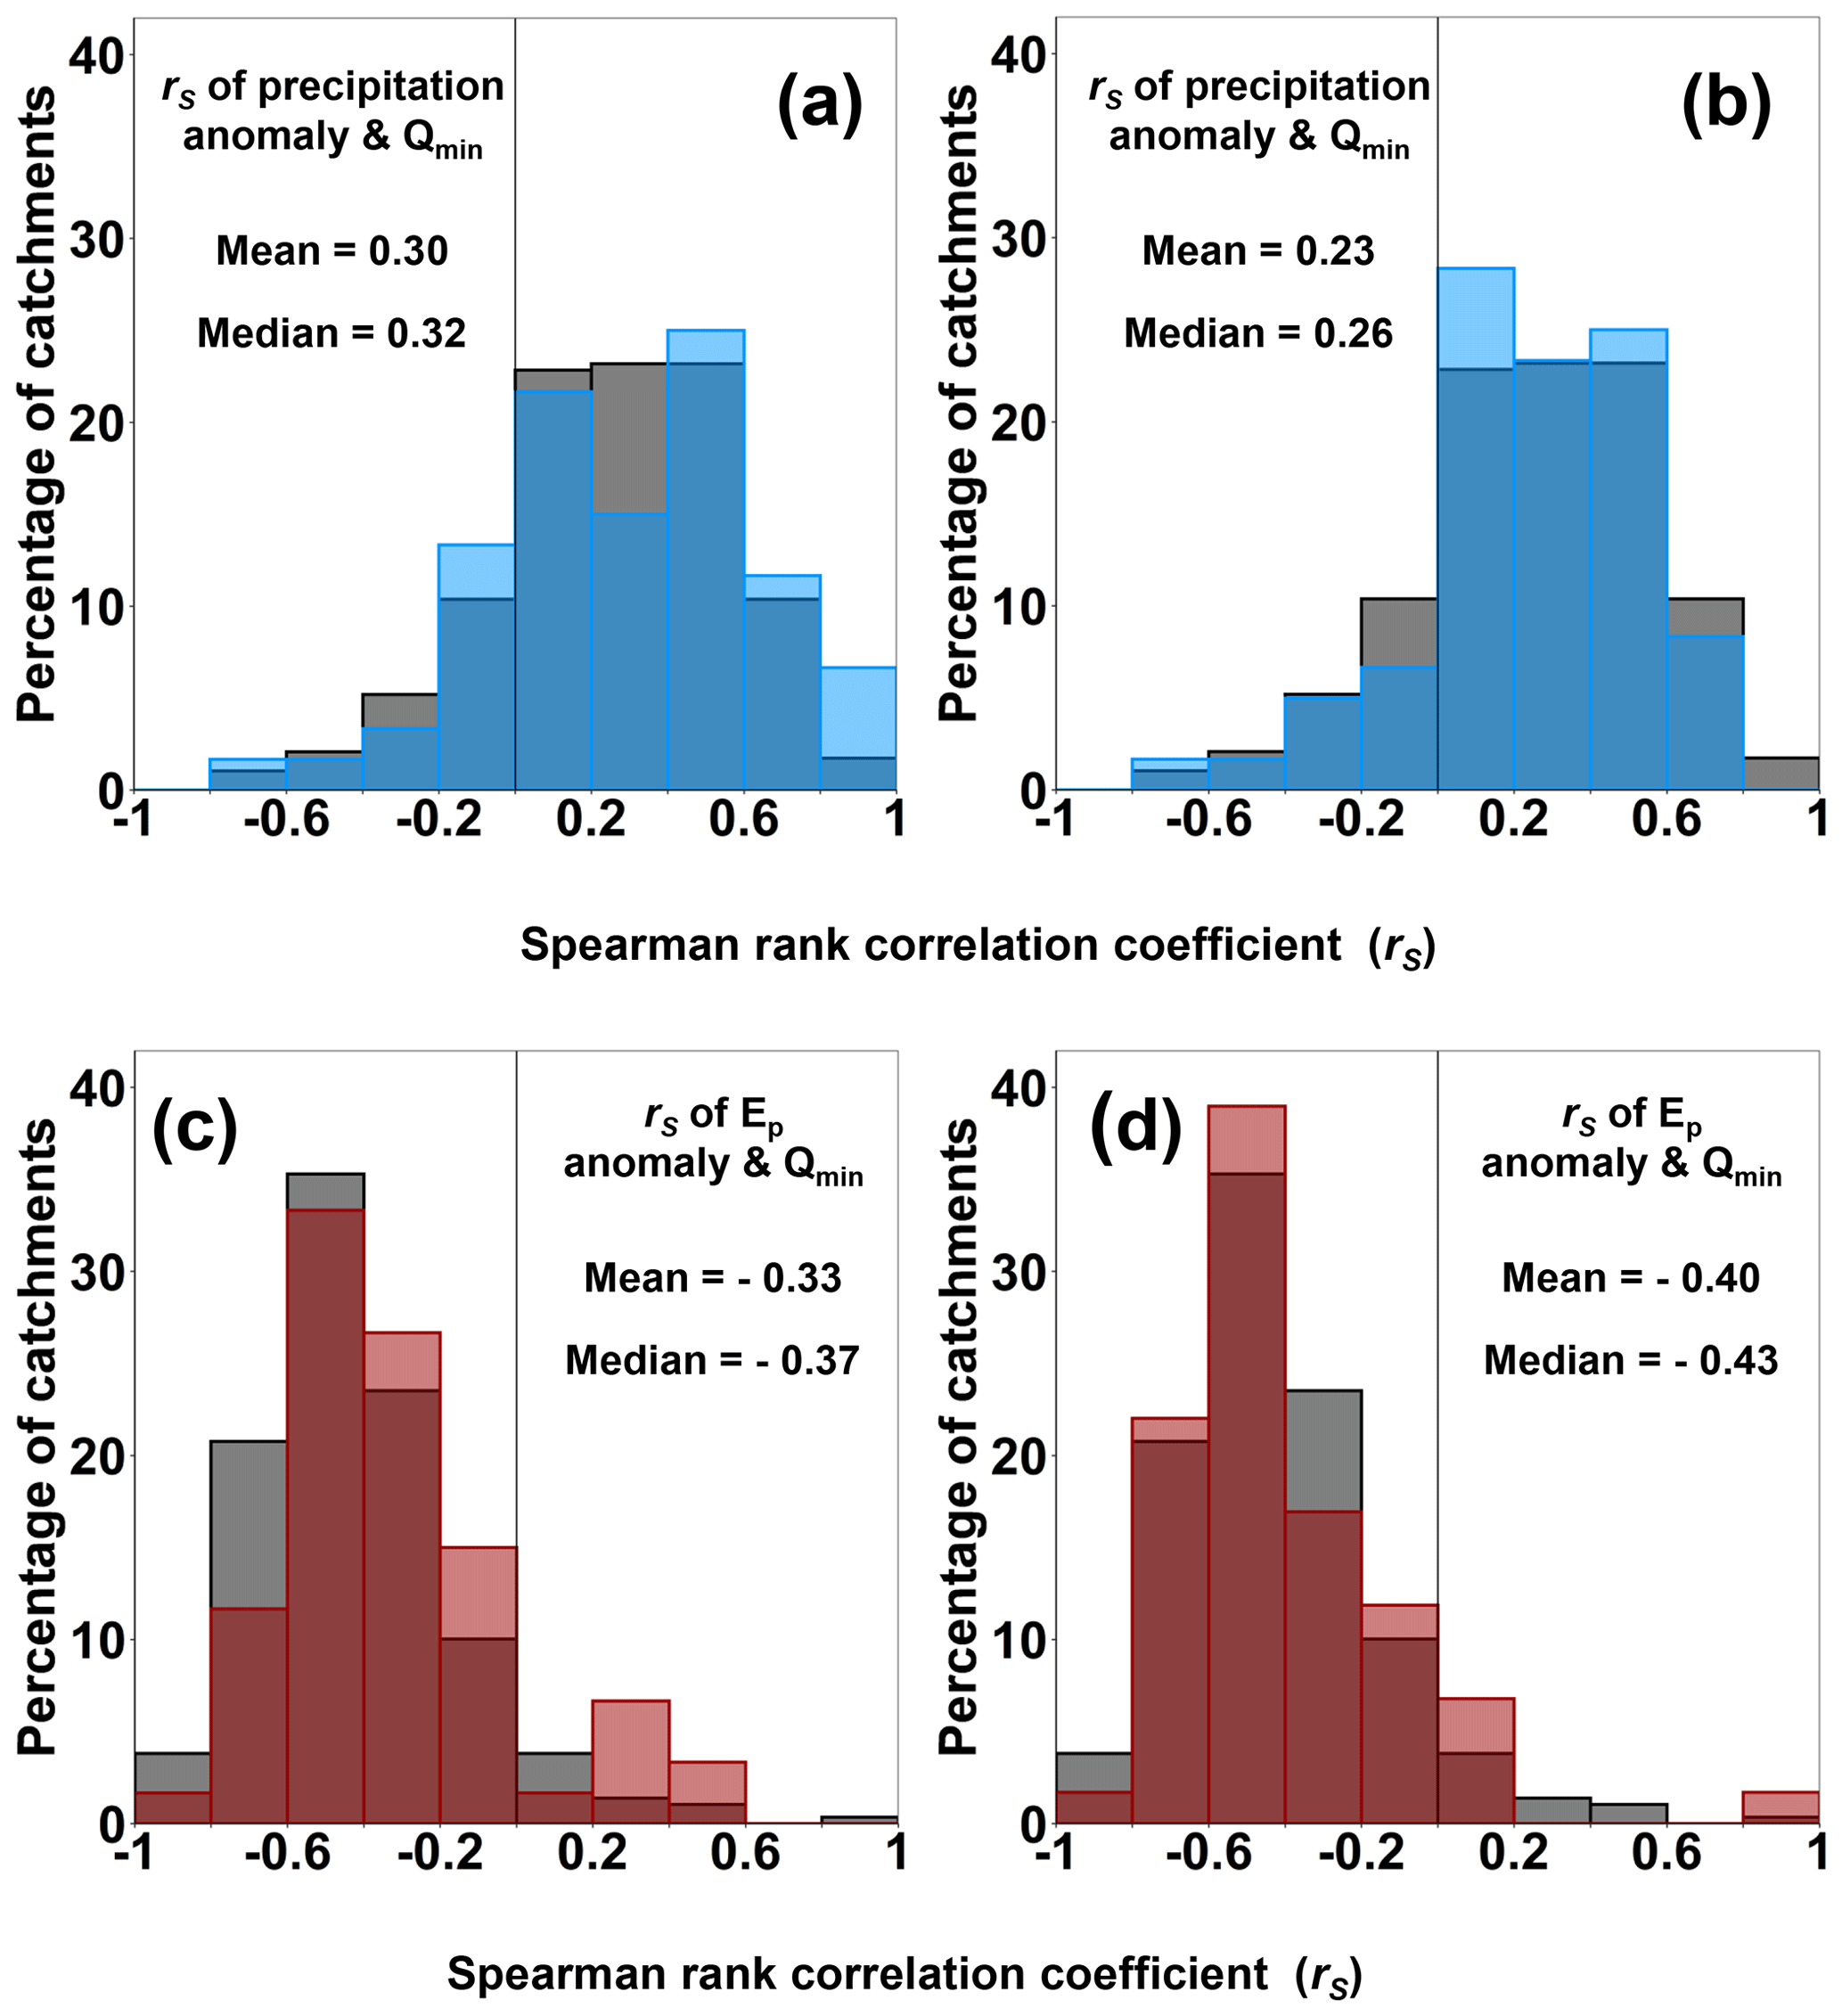
Figure 9Histograms of rank correlations between low-flow magnitudes and anomalies of precipitation (a, b) and potential evapotranspiration (c, d) for warm-season low flows across Swiss catchments. The left side (a, c) shows the distributions for the 20 % of catchments with the least human impact (blue and red) on top of the distributions for all data (gray). The right side (b, d) shows the distributions for the 20 % of catchments with the most human impact (blue and red), again plotted on top of the distributions for all data (gray). The observed distributions of correlations between the 30 d climate anomalies and the magnitudes of low flows are similar in catchments with the most and the least human activity.
4.3 Human impacts on warm-season low-flow statistics
Almost every catchment in Switzerland, and elsewhere where dense gauging data exist, is to some extent affected by human activity (e.g., Grill et al., 2019; Lehner et al., 2011). This could be through, for example, water management operations, water abstractions, hydropower operations and wastewater treatment plant return flows. Especially in central Europe, almost no pristine catchments exist, and quantitative information capturing all potential human influences on streamflow at catchment scale is unavailable. As described in Sect. 2.1, we removed any catchments with any obvious anthropogenic influences on streamflow (e.g., from hydropeaking or dams); however, some regulation effects may still be present in the data set.
To assess the impact of human influence on the results, we recalculated Fig. 2c and d for the 20 % of catchments with the largest fraction of human-affected land use and the 20 % of catchments with the smallest fraction of human-affected land use. We thereby tested whether the relationships between the 30 d anomalies of precipitation and Ep and the magnitude of warm-season Qmin are significantly different in catchments with a lot of human activity compared to catchments with relatively little human activity (Fig. 9). The results were broadly similar, with no significant differences between the strongly affected and weakly affected catchments (p>0.2 by Student's t test).
The consistency of the results may be due to the fact that, although human water use during low flows will change their absolute magnitudes (and thus may affect site-to-site differences in low flows, which are not considered here), it may have a smaller effect on their relative magnitudes from year to year at any given site. Thus, human influences may not greatly alter the rankings of annual low flows throughout the observation period; drier years are still expected to have lower low flows and wetter years are still expected to have higher low flows, and this is largely independent of human influences. Therefore, the Spearman rank correlation coefficient is likely to be a relatively robust index for assessing the effects of climate anomalies on the timing and magnitude of annual low flows. Recent studies across US catchments have also found limited effects of human influence on low flows compared to climate drivers (Ferrazzi et al., 2019; Sadri et al., 2016). Nevertheless, the unexplained variance in our established relationships suggests that human-induced shifts in the Qmin ranking may have an effect on low-flow behaviors in some catchments.
4.4 Broader implications
Our overall results are largely consistent with previously discussed drivers of low flows (e.g., Teuling et al., 2013; Woodhouse et al., 2016; Hannaford, 2015). Our work builds upon past research by studying a large data set which shows the variability and consistency in low-flow–climate relationships among many catchments. We also quantify the effect of the duration of climate anomalies and analyze the interplay of P and Ep as drivers. Our work thereby emphasizes how both precipitation and Ep anomalies are important drivers of low flows, especially during severe low flows. This is in line with a growing literature on severe events arising from the interplay of multiple drivers (e.g., Zscheischler et al., 2018). Our study also highlights that the relevant properties of low-flow drivers are multidimensional; their magnitudes, timings and durations all matter. For example, in a lower-elevation catchment, a precipitation anomaly in spring will not have the same impact as a similar anomaly in autumn. Likewise, periods of above-average Ep will have different implications for streamflow in May than they would in September. Thus, antecedent catchment conditions matter. It is not sufficient to look at climate anomalies alone as drivers of low flows since they may have different implications at different times of the year. Although our study is based on a network of Swiss catchments, we expect our findings to be more broadly applicable to climatically similar regions as well. We see similar patterns in low-flow seasonality in other regions of the world (e.g., Laaha and Blöschl, 2006; Demirel et al., 2013; Dettinger and Diaz, 2000), suggesting that the effects of climate anomalies in these other regions may also be largely similar. For example, the severe summer low flows in California in recent years have been driven by below-average precipitation magnified by above-average temperatures and, thus, potential evapotranspiration (Diffenbaugh et al., 2015). Van Loon et al. (2015) and Van Loon and Laaha (2015) reported similar driving mechanisms for low flows in Austria and Norway. Thus, our approach for assessing the effects of multiple dimensions of climate impacts (i.e., timing, duration and magnitude) on low flows could potentially be used to derive insight into low flows in other regions.
Annual low flows in Switzerland typically occur in two distinct seasons, namely in winter at higher elevations due to subfreezing temperatures and in summer and autumn at lower elevations, following periods of above-average potential evapotranspiration and below-average precipitation (Fig. 2a and b). The magnitudes of these climate anomalies strongly affect the magnitudes of annual low flows across our network of catchments (Fig. 2c and d). Almost all (about 92 %) of our catchments' annual low flows follow periods of unusually low precipitation, and many (about 70 %) also follow periods of unusually high potential evapotranspiration (Fig. 3a). Thus, most low flows arise from the combined effects of precipitation and Ep anomalies. Severe low flows, such as in the years 2003, 2011, 2015 and 2018, almost exclusively occurred after anomalies in both precipitation and Ep (Fig. 3a). During these especially dry years, low flows occurred simultaneously across large parts of Europe, but their timing was highly variable across Switzerland (Fig. 1). Longer periods of below-threshold precipitation and above-threshold Ep generally led to lower low flows (Fig. 4). Anomalies preceding low flows typically acted over timescales of up to 60 d, while precipitation and Ep anomalies in unusually dry years (2003, 2011, 2015 and 2018) grew for much longer and, thus, became much larger (Fig. 5). Long periods of above-average Ep appear to be especially important drivers of the most severe low flows (Fig. 5). Typical low flows were mainly driven by precipitation anomalies; however, the low flows in the driest years (2003, 2011, 2015 and 2018) were more related to Ep anomalies (Figs. 6 and 7). Total winter precipitation (and SWE) affected the magnitude and timing of warm-season low flows (Fig. 8) but was less important than the climate anomalies in the month prior to the low-flow period (Fig. 1c and d). Our results describe how the timing, magnitude and duration of precipitation and Ep anomalies drive warm-season low flows across Switzerland. In combination with seasonal weather forecasts, these results could help to predict and manage low flows.
The data that support the findings of this study are available in the ETH Zurich library open access repository. Discharge time series can be obtained from the Swiss Federal Office of the Environment (FOEN) and Swiss Cantonal Authorities; meteorological data can be obtained from the Swiss Federal Office of Meteorology (MeteoSwiss) and geodata from the Swiss Federal Office of Topography (Swisstopo). Contact information for these agencies is provided in the Supplement.
The supplement related to this article is available online at: https://doi.org/10.5194/hess-24-5423-2020-supplement.
MF, WB and PM designed the study. MF performed the analyses and wrote the first draft. All authors discussed the results and edited the paper.
The authors declare that they have no conflict of interest.
The project was funded by the Swiss Federal Office of the Environment (FOEN). We thank FOEN and the cantons of Aargau, Basel-Landschaft, Bern, Geneva, Graubünden, Lucerne, Neuchâtel, Schaffhausen, Solothurn, St. Gallen, Thurgau, Ticino, Vaud and Zurich for providing discharge data, the Swiss Federal Office of Meteorology (MeteoSwiss) for providing gridded climate data and the Swiss Federal Office of Topography (Swisstopo) for providing geodata. We thank Anna Costa for additional analyses during the revision process and the editor, Kerstin Stahl, the four anonymous reviewers and Ryan Teuling and his students for their comments that greatly improved the original paper.
This research has been supported by the Swiss Federal Office of the Environment (FOEN; grant no. 06.0072.PZ/Q391-2885).
This paper was edited by Kerstin Stahl and reviewed by four anonymous referees.
Bradford, M. J. and Heinonen, J. S.: Low Flows, Instream Flow Needs and Fish Ecology in Small Streams, Can. Water Resour. J., 33, 165–180, https://doi.org/10.4296/cwrj3302165, 2008.
CH2018: CH2018 – Climate Scenarios for Switzerland, Technical Report, National Centre for Climate Services, Zurich, available at: https://www.nccs.admin.ch/nccs/en/home/klimawandel-und-auswirkungen/schweizer-klimaszenarien/technical-report.html (last access: 12 February 2020), 2018.
CLC: CLC 2018 — Copernicus Land Monitoring Service, available at: https://land.copernicus.eu/pan-european/corine-land-cover/clc2018 (last access: 12 February 2020), 2018.
Cooper, M. G., Schaperow, J. R., Cooley, S. W., Alam, S., Smith, L. C., and Lettenmaier, D. P.: Climate Elasticity of Low Flows in the Maritime Western U.S. Mountains, Water Resour. Res., 54, 5602–5619, https://doi.org/10.1029/2018WR022816, 2018.
Demirel, M. C., Booij, M. J., and Hoekstra, A. Y.: Impacts of climate change on the seasonality of low flows in 134 catchments in the River Rhine basin using an ensemble of bias-corrected regional climate simulations, Hydrol. Earth Syst. Sci., 17, 4241–4257, https://doi.org/10.5194/hess-17-4241-2013, 2013.
Déry, S. J., Stahl, K., Moore, R. D., Whitfield, P. H., Menounos, B., and Burford, J. E.: Detection of runoff timing changes in pluvial, nival, and glacial rivers of western Canada, Water Resour. Res., 45, W04426, https://doi.org/10.1029/2008WR006975, 2009.
De Stefano, L., Duncan, J., Dinar, S., Stahl, K., Strzepek, K. M., and Wolf, A. T.: Climate change and the institutional resilience of international river basins, J. Peace Res., 49, 193–209, https://doi.org/10.1177/0022343311427416, 2012.
Dettinger, M. D. and Diaz, H. F.: Global Characteristics of Stream Flow Seasonality and Variability, J. Hydrometeorol., 1, 289–310, https://doi.org/10.1175/1525-7541(2000)001<0289:GCOSFS>2.0.CO;2, 2000.
Dierauer, J. R., Whitfield, P. H., and Allen, D. M.: Climate Controls on Runoff and Low Flows in Mountain Catchments of Western North America, Water Resour. Res., 54, 7495–7510, https://doi.org/10.1029/2018WR023087, 2018.
Diffenbaugh, N. S., Swain, D. L., and Touma, D.: Anthropogenic warming has increased drought risk in California, P. Natl. Acad. Sci. USA, 112, 3931–3936, https://doi.org/10.1073/pnas.1422385112, 2015.
Eisner, S., Flörke, M., Chamorro, A., Daggupati, P., Donnelly, C., Huang, J., Hundecha, Y., Koch, H., Kalugin, A., Krylenko, I., Mishra, V., Piniewski, M., Samaniego, L., Seidou, O., Wallner, M., and Krysanova, V.: An ensemble analysis of climate change impacts on streamflow seasonality across 11 large river basins, Climatic Change, 141, 401–417, https://doi.org/10.1007/s10584-016-1844-5, 2017.
Fangmann, A. and Haberlandt, U.: Statistical approaches for identification of low-flow drivers: temporal aspects, Hydrol. Earth Syst. Sci., 23, 447–463, https://doi.org/10.5194/hess-23-447-2019, 2019.
Ferrazzi, M., Vivian, R., and Botter, G.: Sensitivity of Regulated Streamflow Regimes to Interannual Climate Variability, Earths Future, 7, 1206–1219, https://doi.org/10.1029/2019EF001250, 2019.
Fiala, T., Ouarda, T. B. M. J., and Hladný, J.: Evolution of low flows in the Czech Republic, J. Hydrol., 393, 206–218, https://doi.org/10.1016/j.jhydrol.2010.08.018, 2010.
Fleig, A. K., Tallaksen, L. M., Hisdal, H., and Demuth, S.: A global evaluation of streamflow drought characteristics, Hydrol. Earth Syst. Sci., 10, 535–552, https://doi.org/10.5194/hess-10-535-2006, 2006.
Godsey, S. E., Kirchner, J. W., and Tague, C. L.: Effects of changes in winter snowpacks on summer low flows: case studies in the Sierra Nevada, California, USA, Hydrol. Process., 28, 5048–5064, https://doi.org/10.1002/hyp.9943, 2014.
Granger, R. J.: A complementary relationship approach for evaporation from nonsaturated surfaces, J. Hydrol., 111, 31–38, https://doi.org/10.1016/0022-1694(89)90250-3, 1989.
Griessinger, N., Seibert, J., Magnusson, J. and Jonas, T.: Assessing the benefit of snow data assimilation for runoff modeling in Alpine catchments, Hydrol. Earth Syst. Sci., 20, 3895–3905, https://doi.org/10.5194/hess-20-3895-2016, 2016.
Grill, G., Lehner, B., Thieme, M., Geenen, B., Tickner, D., Antonelli, F., Babu, S., Borrelli, P., Cheng, L., Crochetiere, H., Macedo, H. E., Filgueiras, R., Goichot, M., Higgins, J., Hogan, Z., Lip, B., McClain, M. E., Meng, J., Mulligan, M., Nilsson, C., Olden, J. D., Opperman, J. J., Petry, P., Liermann, C. R., Sáenz, L., Salinas-Rodríguez, S., Schelle, P., Schmitt, R. J. P., Snider, J., Tan, F., Tockner, K., Valdujo, P. H., van Soesbergen, A., and Zarfl, C.: Mapping the world's free-flowing rivers, Nature, 569, 215–221, https://doi.org/10.1038/s41586-019-1111-9, 2019.
Hannaford, J.: Climate-driven changes in UK river flows: A review of the evidence, Prog. Phys. Geogr. Earth Environ., 39, 29–48, https://doi.org/10.1177/0309133314536755, 2015.
Hargreaves, G. H. and Samani, Z. A.: Reference Crop Evapotranspiration from Temperature, Appl. Eng. Agric., 1, 96, https://doi.org/10.13031/2013.26773, 1985.
Harpold, A. A., Kaplan, M. L., Klos, P. Z., Link, T., McNamara, J. P., Rajagopal, S., Schumer, R. and Steele, C. M.: Rain or snow: hydrologic processes, observations, prediction, and research needs, Hydrol. Earth Syst. Sci., 21, 1–22, https://doi.org/10.5194/hess-21-1-2017, 2017.
Haslinger, K., Koffler, D., Schöner, W., and Laaha, G.: Exploring the link between meteorological drought and streamflow: Effects of climate-catchment interaction, Water Resour. Res., 50, 2468–2487, https://doi.org/10.1002/2013WR015051, 2014.
Jaeger, E. B. and Seneviratne, S. I.: Impact of soil moisture–atmosphere coupling on European climate extremes and trends in a regional climate model, Clim. Dynam., 36, 1919–1939, https://doi.org/10.1007/s00382-010-0780-8, 2011.
Jenicek, M., Seibert, J., Zappa, M., Staudinger, M., and Jonas, T.: Importance of maximum snow accumulation for summer low flows in humid catchments, Hydrol. Earth Syst. Sci., 20, 859–874, https://doi.org/10.5194/hess-20-859-2016, 2016.
Laaha, G. and Blöschl, G.: Seasonality indices for regionalizing low flows, Hydrol. Process., 20, 3851–3878, https://doi.org/10.1002/hyp.6161, 2006.
Laaha, G., Gauster, T., Tallaksen, L. M., Vidal, J.-P., Stahl, K., Prudhomme, C., Heudorfer, B., Vlnas, R., Ionita, M., Van Lanen, H. A. J., Adler, M.-J., Caillouet, L., Delus, C., Fendekova, M., Gailliez, S., Hannaford, J., Kingston, D., Van Loon, A. F., Mediero, L., Osuch, M., Romanowicz, R., Sauquet, E., Stagge, J. H., and Wong, W. K.: The European 2015 drought from a hydrological perspective, Hydrol. Earth Syst. Sci., 21, 3001–3024, https://doi.org/10.5194/hess-21-3001-2017, 2017.
Legates, D. R. and McCabe, G. J.: Evaluating the use of “goodness-of-fit” Measures in hydrologic and hydroclimatic model validation, Water Resour. Res., 35, 233–241, https://doi.org/10.1029/1998WR900018, 1999.
Lehner, B., Liermann, C. R., Revenga, C., Vörösmarty, C., Fekete, B., Crouzet, P., Döll, P., Endejan, M., Frenken, K., Magome, J., Nilsson, C., Robertson, J. C., Rödel, R., Sindorf, N., and Wisser, D.: High-resolution mapping of the world's reservoirs and dams for sustainable river-flow management, Front. Ecol. Environ., 9, 494–502, https://doi.org/10.1890/100125, 2011.
Lüthi, S., Ban, N., Kotlarski, S., Steger, C. R., Jonas, T., and Schär, C.: Projections of Alpine Snow-Cover in a High-Resolution Climate Simulation, Atmosphere, 10, 463, https://doi.org/10.3390/atmos10080463, 2019.
Magnusson, J., Gustafsson, D., Hüsler, F., and Jonas, T.: Assimilation of point SWE data into a distributed snow cover model comparing two contrasting methods, Water Resour. Res., 50, 7816–7835, https://doi.org/10.1002/2014WR015302, 2014.
Mastrotheodoros, T., Pappas, C., Molnar, P., Burlando, P., Manoli, G., Parajka, J., Rigon, R., Szeles, B., Bottazzi, M., Hadjidoukas, P., and Fatichi, S.: More green and less blue water in the Alps during warmer summers, Nat. Clim. Change, 10, 155–161, https://doi.org/10.1038/s41558-019-0676-5, 2020.
Mote, P. W., Li, S., Lettenmaier, D. P., Xiao, M., and Engel, R.: Dramatic declines in snowpack in the western US, Npj Clim. Atmos. Sci., 1, 6, https://doi.org/10.1038/s41612-018-0012-1, 2018.
Munich Re: NatCatSERVICE – Natural catastrophe statistics online, München, Germany, available at: https://natcatservice.munichre.com, last access: 29 August 2019.
Musselman, K. N., Clark, M. P., Liu, C., Ikeda, K., and Rasmussen, R.: Slower snowmelt in a warmer world, Nat. Clim. Change, 7, 214–219, https://doi.org/10.1038/nclimate3225, 2017.
Peters, E., Bier, G., van Lanen, H. A. J., and Torfs, P. J. J. F.: Propagation and spatial distribution of drought in a groundwater catchment, J. Hydrol., 321, 257–275, https://doi.org/10.1016/j.jhydrol.2005.08.004, 2006.
Poff, N. L., Allan, J. D., Bain, M. B., Karr, J. R., Prestegaard, K. L., Richter, B. D., Sparks, R. E., and Stromberg, J. C.: The Natural Flow Regime, BioScience, 47, 769–784, https://doi.org/10.2307/1313099, 1997.
Price, K., Jackson, C. R., Parker, A. J., Reitan, T., Dowd, J., and Cyterski, M.: Effects of watershed land use and geomorphology on stream low flows during severe drought conditions in the southern Blue Ridge Mountains, Georgia and North Carolina, United States, Water Resour. Res., 47, W02516, https://doi.org/10.1029/2010WR009340, 2011.
Roderick, M. L., Sun, F., Lim, W. H., and Farquhar, G. D.: A general framework for understanding the response of the water cycle to global warming over land and ocean, Hydrol. Earth Syst. Sci., 18, 1575–1589, https://doi.org/10.5194/hess-18-1575-2014, 2014.
Rolls, R. J., Leigh, C., and Sheldon, F.: Mechanistic effects of low-flow hydrology on riverine ecosystems: ecological principles and consequences of alteration, Freshwater Sci., 31, 1163–1186, https://doi.org/10.1899/12-002.1, 2012.
Sadri, S., Kam, J., and Sheffield, J.: Nonstationarity of low flows and their timing in the eastern United States, Hydrol. Earth Syst. Sci., 20, 633–649, https://doi.org/10.5194/hess-20-633-2016, 2016.
Seneviratne, S. I., Nicholls, N., Easterling, D., Goodess, C., Kanae, S., Kossin, J., Luo, Y., Marengo, J., McInnes, K., Rahimi, M., Reichstein, M., Sorteberg, A., Vera, C., and Zhang, X.: Changes in climate extremes and their impacts on the natural physical environment, in: Managing the Risks of Extreme Events and Disasters to Advance Climate Change Adaptation, A Special Report of Working Groups I and II of the Intergovernmental Panel on Climate Change (IPCC), edited by: Field, C. B., Barros, V., Stocker, T. F., Qin, D., Dokken, D. J., Ebi, K. L., Mastrandrea, M. D., Mach, K. J., Plattner, G.-K., Allen, S. K., Tignor, M., and Midgley, P. M., Cambridge University Press, Cambridge, UK, and New York, NY, USA, 109–230, 2012a.
Seneviratne, S. I., Lehner, I., Gurtz, J., Teuling, A. J., Lang, H., Moser, U., Grebner, D., Menzel, L., Schroff, K., Vitvar, T., and Zappa, M.: Swiss prealpine Rietholzbach research catchment and lysimeter: 32 year time series and 2003 drought event, Water Resour. Res., 48, W06526, https://doi.org/10.1029/2011WR011749, 2012b.
Smakhtin, V. U.: Low flow hydrology: a review, J. Hydrol., 240, 147–186, https://doi.org/10.1016/S0022-1694(00)00340-1, 2001.
Stahl, K., Hisdal, H., Hannaford, J., Tallaksen, L. M., van Lanen, H. A. J., Sauquet, E., Demuth, S., Fendekova, M., and Jódar, J.: Streamflow trends in Europe: evidence from a dataset of near-natural catchments, Hydrol. Earth Syst. Sci., 14, 2367–2382, https://doi.org/10.5194/hess-14-2367-2010, 2010.
Stahl, K., Kohn, I., Blauhut, V., Urquijo, J., De Stefano, L., Acácio, V., Dias, S., Stagge, J. H., Tallaksen, L. M., Kampragou, E., Van Loon, A. F., Barker, L. J., Melsen, L. A., Bifulco, C., Musolino, D., de Carli, A., Massarutto, A., Assimacopoulos, D., and Van Lanen, H. A. J.: Impacts of European drought events: insights from an international database of text-based reports, Nat. Hazards Earth Syst. Sci., 16, 801–819, https://doi.org/10.5194/nhess-16-801-2016, 2016.
Staudinger, M., Stoelzle, M., Seeger, S., Seibert, J., Weiler, M., and Stahl, K.: Catchment water storage variation with elevation, Hydrol. Process., 31, 2000–2015, https://doi.org/10.1002/hyp.11158, 2017.
Stoelzle, M., Stahl, K., Morhard, A., and Weiler, M.: Streamflow sensitivity to drought scenarios in catchments with different geology, Geophys. Res. Lett., 41, 6174–6183, https://doi.org/10.1002/2014GL061344, 2014.
Tallaksen, L. M. and Van Lanen, H. A. J.: Hydrological Drought – Processes and Estimation Methods for Streamflow and Groundwater, Eur. Drought Cent., available at: http://europeandroughtcentre.com/resources/hydrological-drought-1st-edition/ (last access: 22 April 2019), 2004.
Teuling, A. J., Van Loon, A. F., Seneviratne, S. I., Lehner, I., Aubinet, M., Heinesch, B., Bernhofer, C., Grünwald, T., Prasse, H., and Spank, U.: Evapotranspiration amplifies European summer drought, Geophys. Res. Lett., 40, 2071–2075, https://doi.org/10.1002/grl.50495, 2013.
Tongal, H., Demirel, M. C., and Booij, M. J.: Seasonality of low flows and dominant processes in the Rhine River, Stoch. Environ. Res. Risk A., 27, 489–503, https://doi.org/10.1007/s00477-012-0594-9, 2013.
Van Lanen, H. A. J., Wanders, N., Tallaksen, L. M., and Van Loon, A. F.: Hydrological drought across the world: impact of climate and physical catchment structure, Hydrol. Earth Syst. Sci., 17, 1715–1732, https://doi.org/10.5194/hess-17-1715-2013, 2013.
Van Lanen, H. A. J., Laaha, G., Kingston, D. G., Gauster, T., Ionita, M., Vidal, J.-P., Vlnas, R., Tallaksen, L. M., Stahl, K., Hannaford, J., Delus, C., Fendekova, M., Mediero, L., Prudhomme, C., Rets, E., Romanowicz, R. J., Gailliez, S., Wong, W. K., Adler, M.-J., Blauhut, V., Caillouet, L., Chelcea, S., Frolova, N., Gudmundsson, L., Hanel, M., Haslinger, K., Kireeva, M., Osuch, M., Sauquet, E., Stagge, J. H., and Van Loon, A. F.: Hydrology needed to manage droughts: the 2015 European case, Hydrol. Process., 30, 3097–3104, https://doi.org/10.1002/hyp.10838, 2016.
Van Loon, A. F.: Hydrological drought explained, Wiley Interdisciplin. Rev. Water, 2, 359–392, https://doi.org/10.1002/wat2.1085, 2015.
Van Loon, A. F. and Laaha, G.: Hydrological drought severity explained by climate and catchment characteristics, J. Hydrol., 526, 3–14, https://doi.org/10.1016/j.jhydrol.2014.10.059, 2015.
Van Loon, A. F., Ploum, S. W., Parajka, J., Fleig, A. K., Garnier, E., Laaha, G., and Van Lanen, H. A. J.: Hydrological drought types in cold climates: quantitative analysis of causing factors and qualitative survey of impacts, Hydrol. Earth Syst. Sci., 19, 1993–2016, https://doi.org/10.5194/hess-19-1993-2015, 2015.
van Vliet, M. T. H., Yearsley, J. R., Ludwig, F., Vögele, S., Lettenmaier, D. P., and Kabat, P.: Vulnerability of US and European electricity supply to climate change, Nat. Clim. Change, 2, 676–681, https://doi.org/10.1038/nclimate1546, 2012.
Vidal, J.-P., Martin, E., Franchistéguy, L., Habets, F., Soubeyroux, J.-M., Blanchard, M., and Baillon, M.: Multilevel and multiscale drought reanalysis over France with the Safran-Isba-Modcou hydrometeorological suite, Hydrol. Earth Syst. Sci., 14, 459–478, https://doi.org/10.5194/hess-14-459-2010, 2010.
Wada, Y., van Beek, L. P. H., Wanders, N., and Bierkens, M. F. P.: Human water consumption intensifies hydrological drought worldwide, Environ. Res. Lett., 8, 034036, https://doi.org/10.1088/1748-9326/8/3/034036, 2013.
Wang, S.: Freezing Temperature Controls Winter Water Discharge for Cold Region Watershed, Water Resour. Res., 55, 10479–10493, https://doi.org/10.1029/2019WR026030, 2019.
Wehren, B., Weingartner, R., Schädler, B., and Viviroli, D.: General characteristics of Alpine waters, in: Alpine waters, edited by: Bundi, U., Springer, Berlin, 17–58, 2010.
Weingartner, R. and Aschwanden, H.: Abflussregimes als Grundlage zur Abschätzung von Mittelwerten des Abflusses, Geographisches Institut der Universität Bern, Bern, 1992.
Winstral, A., Magnusson, J., Schirmer, M., and Jonas, T.: The Bias-Detecting Ensemble: A New and Efficient Technique for Dynamically Incorporating Observations Into Physics-Based, Multilayer Snow Models, Water Resour. Res., 55, 613–631, https://doi.org/10.1029/2018WR024521, 2019.
WMO: Manual on Low-flow Estimation and Prediction, WMO, ISBN 978-92-63-11029-9, 2008.
Woodhouse, C. A., Pederson, G. T., Morino, K., McAfee, S. A., and McCabe, G. J.: Increasing influence of air temperature on upper Colorado River streamflow, Geophys. Res. Lett., 43, 2174–2181, https://doi.org/10.1002/2015GL067613, 2016.
Zscheischler, J., Westra, S., van den Hurk, B. J. J. M., Seneviratne, S. I., Ward, P. J., Pitman, A., AghaKouchak, A., Bresch, D. N., Leonard, M., Wahl, T., and Zhang, X.: Future climate risk from compound events, Nat. Clim. Change, 8, 469–477, https://doi.org/10.1038/s41558-018-0156-3, 2018.