the Creative Commons Attribution 4.0 License.
the Creative Commons Attribution 4.0 License.
 | 16 Nov 2020
Suitability of 17 gridded rainfall and temperature datasets for large-scale hydrological modelling in West Africa
Bettina Schaefli
Nick van de Giesen
Grégoire Mariéthoz
This study evaluates the ability of different gridded rainfall datasets to plausibly represent the spatio-temporal patterns of multiple hydrological processes (i.e. streamflow, actual evaporation, soil moisture and terrestrial water storage) for large-scale hydrological modelling in the predominantly semi-arid Volta River basin (VRB) in West Africa. Seventeen precipitation products based essentially on gauge-corrected satellite data (TAMSAT, CHIRPS, ARC, RFE, MSWEP, GSMaP, PERSIANN-CDR, CMORPH-CRT, TRMM 3B42 and TRMM 3B42RT) and on reanalysis (ERA5, PGF, EWEMBI, WFDEI-GPCC, WFDEI-CRU, MERRA-2 and JRA-55) are compared as input for the fully distributed mesoscale Hydrologic Model (mHM). To assess the model sensitivity to meteorological forcing during rainfall partitioning into evaporation and runoff, six different temperature reanalysis datasets are used in combination with the precipitation datasets, which results in evaluating 102 combinations of rainfall–temperature input data. The model is recalibrated for each of the 102 input combinations, and the model responses are evaluated by using in situ streamflow data and satellite remote-sensing datasets from GLEAM evaporation, ESA CCI soil moisture and GRACE terrestrial water storage. A bias-insensitive metric is used to assess the impact of meteorological forcing on the simulation of the spatial patterns of hydrological processes. The results of the process-based evaluation show that the rainfall datasets have contrasting performances across the four climatic zones present in the VRB. The top three best-performing rainfall datasets are TAMSAT, CHIRPS and PERSIANN-CDR for streamflow; ARC, RFE and CMORPH-CRT for terrestrial water storage; MERRA-2, EWEMBI/WFDEI-GPCC and PGF for the temporal dynamics of soil moisture; MSWEP, TAMSAT and ARC for the spatial patterns of soil moisture; ARC, RFE and GSMaP-std for the temporal dynamics of actual evaporation; and MSWEP, TAMSAT and MERRA-2 for the spatial patterns of actual evaporation. No single rainfall or temperature dataset consistently ranks first in reproducing the spatio-temporal variability of all hydrological processes. A dataset that is best in reproducing the temporal dynamics is not necessarily the best for the spatial patterns. In addition, the results suggest that there is more uncertainty in representing the spatial patterns of hydrological processes than their temporal dynamics. Finally, some region-tailored datasets outperform the global datasets, thereby stressing the necessity and importance of regional evaluation studies for satellite and reanalysis meteorological datasets, which are increasingly becoming an alternative to in situ measurements in data-scarce regions.
- Article
(5939 KB) - Full-text XML
-
Supplement
(30523 KB) - BibTeX
- EndNote


Our understanding of environmental systems is underpinned by observational data, whose unavailability and uncertainties hinder research and operational applications. Among other factors, atmospheric data quality is of prime importance for the reliability of hydro-meteorological and climatological studies (Ledesma and Futter, 2017; Zandler et al., 2019). Precipitation is one of the major components of the water cycle, which has led to numerous initiatives on understanding its generation, and estimating its amount and variability on Earth (Maidment et al., 2015; Cui et al., 2019). In hydrological modelling (Singh, 2018; Beven, 2019), precipitation is the most important driver variable that determines the spatio-temporal variability of other hydrological fluxes and state variables (Thiemig et al., 2013; Bárdossy and Das, 2008).
With the development of distributed hydrological models that facilitate large-scale predictions (Clark et al., 2017; Fatichi et al., 2016; Ocio et al., 2019), there is a growing need to inform and evaluate those models with distributed observational datasets to improve spatio-temporal process representation (Baroni et al., 2019; Paniconi and Putti, 2015; Hrachowitz and Clark, 2017). A key challenge is the spatio-temporal intermittency of precipitation, which is a major challenge for its measurement and its spatial interpolation (Tauro et al., 2018; Acharya et al., 2019; Bárdossy and Pegram, 2013; P. D. Wagner et al., 2012), especially in regions with particular features such as complex topography, convection-driven precipitation or snowfall occurrence. A comprehensive description of precipitation measurement techniques can be found in previous studies (e.g. Tapiador et al., 2012; Stephens and Kummerow, 2007; Kidd and Huffman, 2011; Levizzani et al., 2020). The drawbacks of in situ measurements of precipitation include limited and uneven areal coverage, deficiencies in instruments and costly maintenance (Kidd et al., 2017; Awange et al., 2019; Harrison et al., 2019), and they have led to the advent of precipitation estimation from space (Barrett and Martin, 1981). Precipitation estimates from space are spatially homogeneous and cover inaccessible regions with uninterrupted records over time (Beck et al., 2019b; Funk et al., 2015).
The advent of satellite-based rainfall products (SRPs) has opened up new avenues for water resources monitoring and prediction, especially in data-scarce regions (Serrat-Capdevila et al., 2014; Sheffield et al., 2018; Hrachowitz et al., 2013). Although the use of SRPs in hydrology is increasing (Xu et al., 2014; Chen and Wang, 2018), they have not been fully adopted for operational purposes yet (Ciabatta et al., 2016; Kidd and Levizzani, 2011). The limited uptake of SRPs in hydrology is due to measurement bias, inadequate spatio-temporal resolutions (e.g. for extreme-event simulation) and shortness of the records for some applications (e.g. climate change impact assessments), and the scepticism of some potential users with regard to the data quality (Marra et al., 2019). In the past decades, a large number of SRPs have been developed with different objectives, spatial and temporal resolutions, input sources, algorithms and acquisition methods (Ciabatta et al., 2018; Ashouri et al., 2015; Brocca et al., 2019). Several studies provide a review of SRPs (e.g. Maidment et al., 2014; Sun et al., 2018; Maggioni et al., 2016; Le Coz and van de Giesen, 2019).
In addition to SRPs, there are also atmospheric retrospective analysis (or reanalysis) datasets of precipitation. A reanalysis system is composed of a forecast model and a data assimilation scheme that integrates spatio-temporal observations of meteorological variables (i.e. temperature, humidity, wind and pressure) to generate gridded atmospheric data (Lorenz and Kunstmann, 2012; Schröder et al., 2018). Precipitation is one of the reanalysis model-generated fields that generally has more uncertainties than the meteorological state fields (Roca et al., 2019). Reanalysis datasets are often used in hydrological modelling (Tang et al., 2019; Duan et al., 2019; Gründemann et al., 2018), and sometimes they are preferred over SRPs because of their usually long-term records suitable for climate change studies and because of their higher performance in predictable large-scale stratiform systems (Seyyedi et al., 2015; Potter et al., 2018).
Despite the progress in satellite instruments, which has led to substantial advances in improving precipitation estimates (Sorooshian et al., 2011; Tang et al., 2019), there are known inconsistencies among the available SRPs (Sun et al., 2018; Tapiador et al., 2017). SRPs are subject to inherent errors originating mainly from precipitation retrieval instruments and algorithms, sampling frequency, and inadequate representation of cloud physics in some regions (Laiti et al., 2018; Alazzy et al., 2017; Romilly and Gebremichael, 2011). While on the one hand SRPs are subject to systematic biases, reanalysis products on the other hand have uncertainties resulting from their model forcing parameters, low spatial resolution with poor representation of sub-grid processes and the model physics (Bosilovich et al., 2008; Laiti et al., 2018). Uncertainty quantification both in SRPs and reanalysis data is subject to intense research (e.g. Maggioni et al., 2016; Gebremichael, 2010; Awange et al., 2016; Westerberg and Birkel, 2015). The error quantification of SRPs and reanalysis products is usually done by comparing them with in situ measurements (e.g. Dembélé and Zwart, 2016; Thiemig et al., 2012; Beck et al., 2019a; Caroletti et al., 2019; Satgé et al., 2020), or by assessing their reliability as forcing for hydrological models (e.g. Duethmann et al., 2013; Pan et al., 2010; Nkiaka et al., 2017). Other evaluation approaches include triple collocation, which is a technique that estimates the variance of unknown errors of three independent variables without a reference or observed variable (e.g. Massari et al., 2017; Alemohammad et al., 2015; McColl et al., 2014; Roebeling et al., 2012). Compared to the ground-truthing approach, the hydrological evaluation approach has received limited attention (Camici et al., 2018; Poméon et al., 2017).
In rainfall–runoff modelling (Peel and McMahon, 2020), the non-linearity of hydrological processes (Blöschl and Zehe, 2005; Clark et al., 2009) can reduce or amplify the errors in the input rainfall data used and result in a satisfactory or poor representation of the hydrological responses (Maggioni and Massari, 2018; Nijssen, 2004). Consequently, the hydrological model can give a good representation of a hydrological state or flux variable for the wrong reasons (cf. Kirchner, 2006), thereby potentially leading to unfortunate consequences for water resources management (Zambrano-Bigiarini et al., 2017). When testing models as hypotheses (Beven, 2018; Pfister and Kirchner, 2017), type I errors (i.e. false positive model acceptability; Beven, 2010) should be avoided to ensure a high predictive skill of the model and its correctness for good decision-making. This sheds light on the importance of assessing the reliability of hydrological predictions generated with the use of SRPs and reanalysis products (Behrangi et al., 2011; Kuczera et al., 2010). In this context, knowing the adequacy and coherence of meteorological data in reproducing hydrological processes is a prerequisite to data selection for water resources management (Casse et al., 2015; Laiti et al., 2018).
In the context of hydrological evaluation of precipitation datasets, some limitations can be identified in previous studies. Some studies only evaluate a small number of precipitation datasets or do not consider reanalysis products (e.g. Bitew and Gebremichael, 2011; Ma et al., 2018; Liu et al., 2017; Bhattacharya et al., 2019). Usually, the influence of temperature datasets in combination with rainfall datasets is not tested (e.g. Satgé et al., 2019; Camici et al., 2018; Casse et al., 2015; Qi et al., 2016; Zhang et al., 2019), with the exception of a few studies (e.g. Laiti et al., 2018; Lauri et al., 2014), despite the importance of this interaction for evaporation simulation. Most studies evaluate a single hydrological state or flux variable, generally streamflow (e.g. Poméon et al., 2017; Seyyedi et al., 2015; Shayeghi et al., 2020; X.-H. Li et al., 2012) or soil moisture (e.g. Brocca et al., 2013). Some studies use lumped or semi-distributed models, therefore averaging the rainfall amount over large areas (e.g. Duan et al., 2019; Tang et al., 2019; Tobin and Bennett, 2014; Gosset et al., 2013; Shawul and Chakma, 2020), which reduces the bias effect that could occur at the pixel level with a fully distributed model. Often, the model is not recalibrated for each precipitation dataset (e.g. Voisin et al., 2008; Su et al., 2008; L. Li et al., 2012; Tramblay et al., 2016), which is, however, a prerequisite for reliable input field assessment (Stisen et al., 2012). Moreover, some studies perform a global-scale analysis and ignore regionally tailored products (e.g. Beck et al., 2017b; Mazzoleni et al., 2019; Fekete et al., 2004), which can outperform global products (e.g. Thiemig et al., 2013). Finally, to the best of our knowledge, no study has evaluated the simultaneous impact of various precipitation and temperature datasets on the spatial patterns of several hydrological processes (i.e. soil moisture and evaporation).
In light of the above, we propose to study the adequacy of different combinations of 17 precipitation datasets (10 SRPs and 7 reanalysis products) and 6 temperature datasets from reanalysis, when used as forcing data for a fully distributed hydrological model, in reproducing the spatio-temporal variability of multiple hydrological processes (i.e. streamflow, actual evaporation, soil moisture and terrestrial water storage). In total, 102 rainfall–temperature input data combinations are tested with the mesoscale Hydrologic Model (mHM) by recalibrating the model for each of the input data combinations. The experiment is carried out in the poorly gauged and predominantly semi-arid Volta River basin (VRB), located in West Africa, over the period 2003–2012. It is noteworthy that the goal of this study is not to estimate the intrinsic quality of the meteorological forcing (i.e. precipitation and temperature) but rather to understand the impact of the propagation of associated uncertainties on the simulation of hydrological processes (Bhuiyan et al., 2019; Falck et al., 2015; Marthews et al., 2020).
The VRB case study is particularly interesting from both scientific and societal perspectives. On the one hand, precipitation modelling in tropical monsoon climates is a challenging task due to strong seasonality and diurnal variations of rainfall (Turner et al., 2011; Pfeifroth et al., 2016; Cook and Vizy, 2019), and due to isolated convection systems in semi-arid regions (Taylor et al., 2017; Mathon et al., 2002; Parker and Diop-Kane, 2017). On the other hand, open-access and good-quality datasets are needed for water resources management in West Africa (Roudier et al., 2014; Serdeczny et al., 2017; Di Baldassarre et al., 2010; Dinku, 2019). The following research questions are addressed:
-
What is the impact of different gridded rainfall and temperature datasets on the simulation of hydrological fluxes and state variables?
-
How important is the choice of meteorological datasets for the representation of spatial patterns versus temporal dynamics?
Overall, the objective of this work aligns with the efforts to solve the current scientific challenges in hydrology (i.e. uncertainty in large-scale measurements and data, spatial heterogeneity and modelling methods; Blöschl et al., 2019; Wilby, 2019). Moreover, a growing interest in using satellite remote-sensing data in hydrological modelling is expected (McCabe et al., 2017; Peters-Lidard et al., 2017; Wilkinson et al., 2016). Therefore, knowing the suitability of the input data for hydrological modelling is a prerequisite for reliable spatio-temporal predictions, as the goal is to increase model performance with minimum uncertainty (Beven, 2016; McMillan et al., 2018; Savenije, 2009).
2.1 Overview of the modelling experiment
The adequacy of the rainfall and temperature datasets to plausibly reproduce various hydrological processes is tested with all the 102 possible combinations of 17 rainfall and 6 temperature datasets used as meteorological forcing (see Sect. 2.2). Different temperature datasets are used to allow flexibility in rainfall partitioning into evaporation and runoff because temperature is a key variable for the calculation of potential evaporation (Kirchner and Allen, 2020; Zheng et al., 2019; Van Stan et al., 2020). The hydrological model is recalibrated for each of the 102 combinations of rainfall–temperature datasets (Fig. 1).
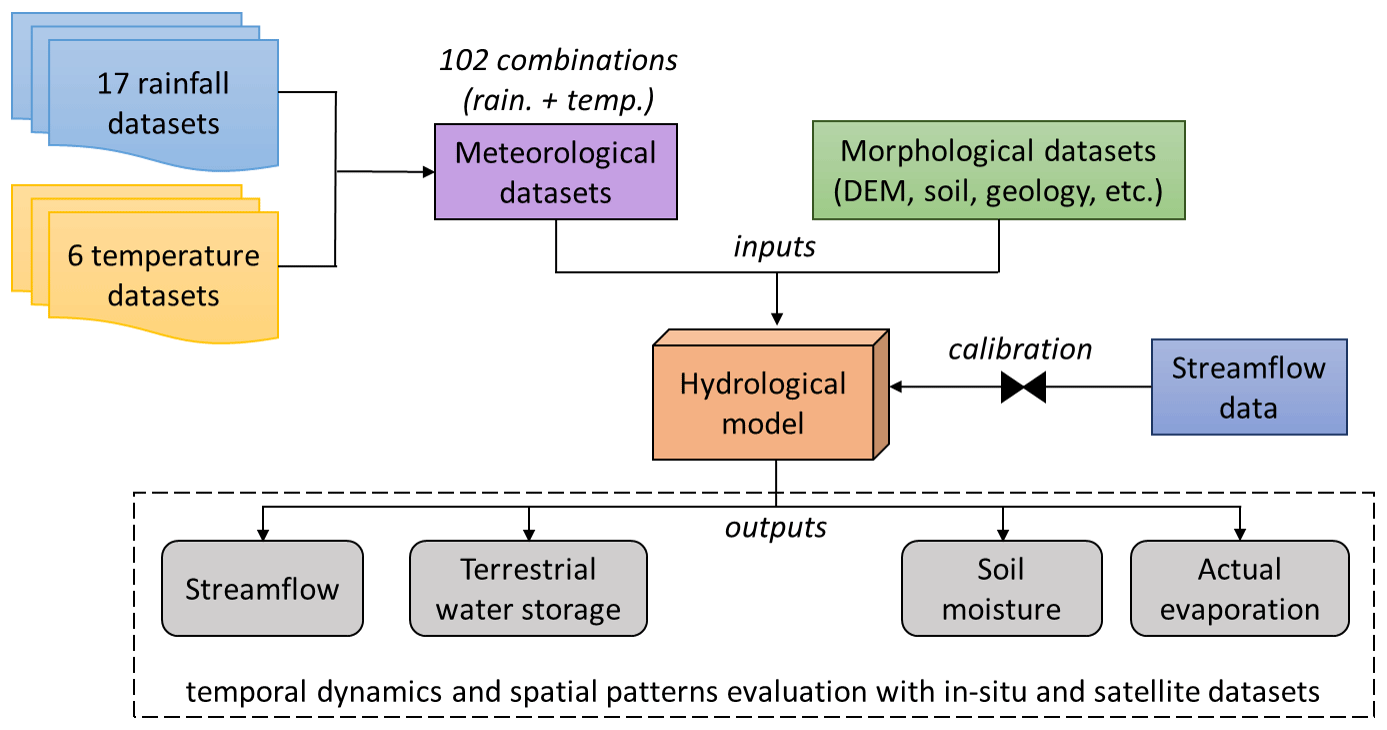
Figure 1Flowchart of the methodology used to evaluate the suitability of meteorological datasets in reproducing plausible hydrological processes.
The differences in the performance of model outputs are assumed to result from the propagation of the input data uncertainty through the model simulations (Nikolopoulos et al., 2010; Fallah et al., 2020). In the case of uncertainties resulting from the hydrological model structure, these uncertainties can be assumed to remain consistent for all the input datasets, and therefore it should not hinder the interpretation of the results, because only the parameters change during model calibration, not the model structure (Raimonet et al., 2017).
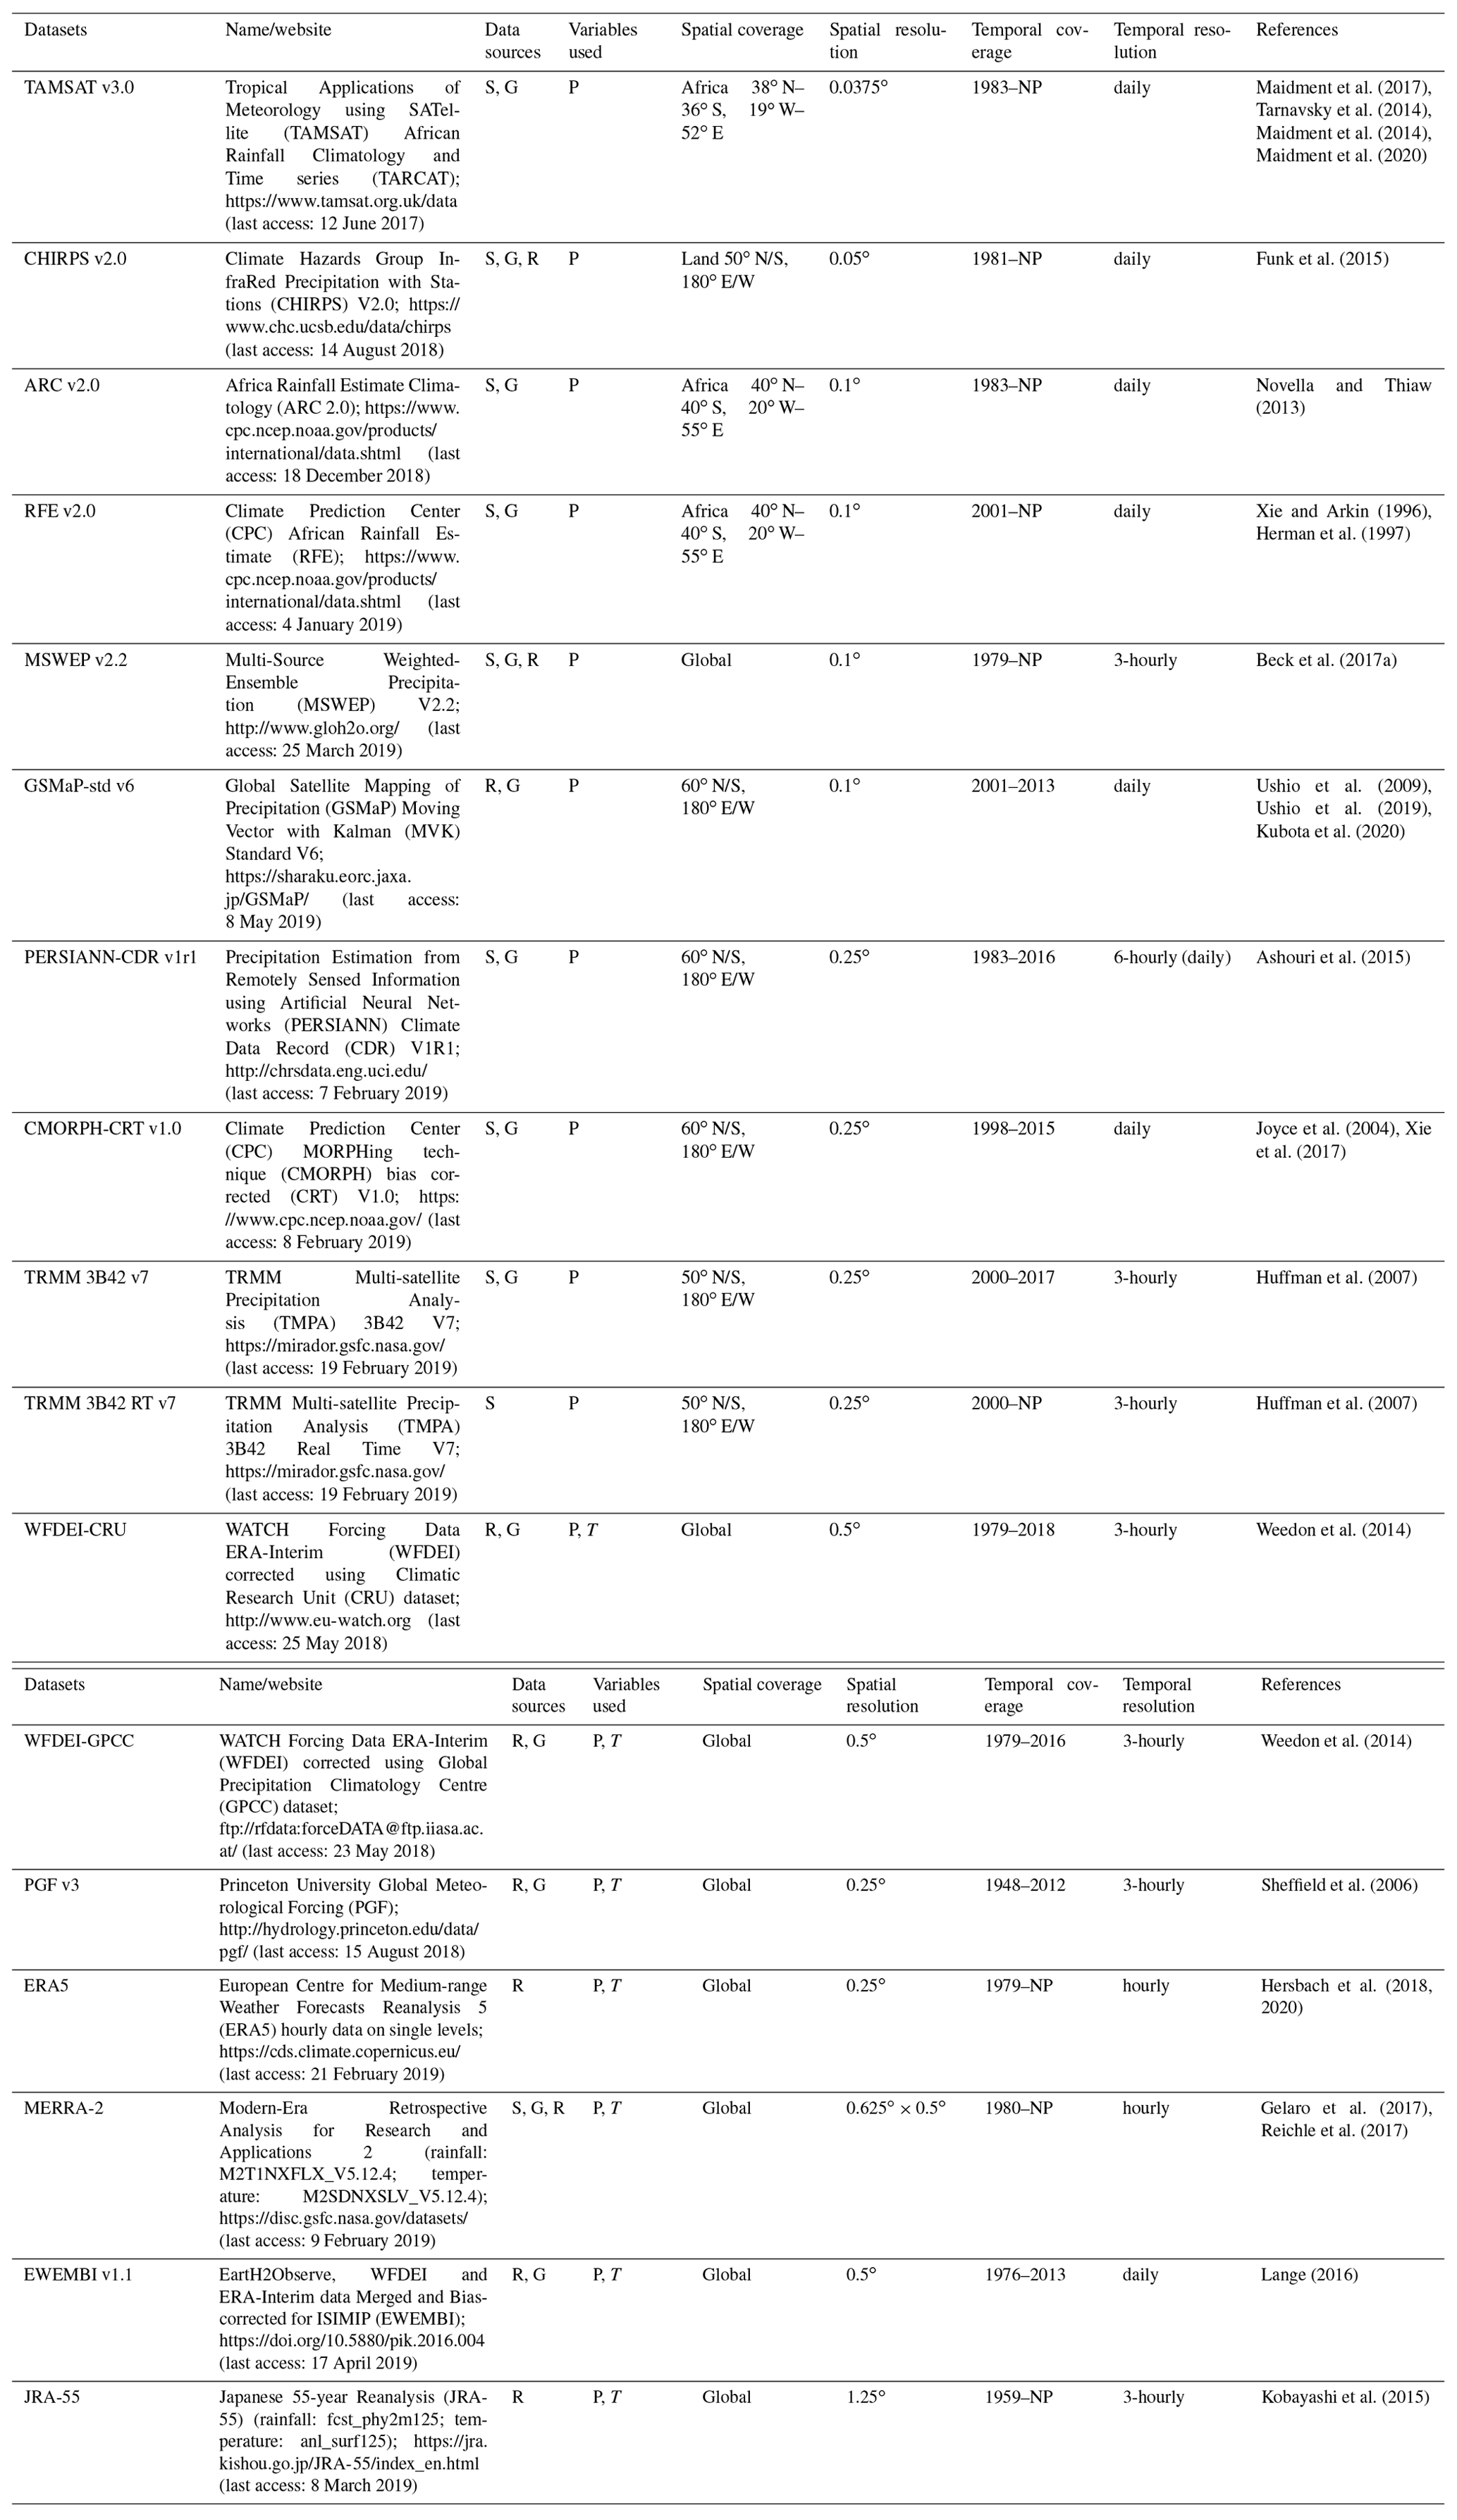
2.2 Meteorological datasets
This study evaluates 17 rainfall products composed of 10 satellite-based products (TAMSAT, CHIRPS, ARC, RFE, MSWEP, GSMaP, PERSIANN-CDR, CMORPH-CRT, TRMM 3B42 and TRMM 3B42RT) and 7 reanalysis products (JRA-55, EWEMBI, WFDEI-GPCC, WFDEI-CRU, MERRA-2, PGF and ERA5) (Table 1). Widely used global and Africa-tailored datasets were selected based on their availability in the period for which streamflow data are available for the hydrological modelling (2000–2012). For SRPs that have multiple versions, the gauge-corrected version was selected to avoid the known systematic biases found in the SRPs as compared to ground measurements (Jiang and Wang, 2019; Pellarin et al., 2020). The selected rainfall datasets include single and multi-sensor, with various merged and gauge-corrected products obtained from rain gauges, microwave sensors in low Earth orbits and infrared sensors on geostationary satellites (Maggioni and Massari, 2018; Thiemig et al., 2013; Golian et al., 2019). Moreover, six different datasets of air temperature (at 2 m above ground) are used for the calculation of potential evaporation, and they are obtained from the following reanalysis products: JRA-55, EWEMBI, WFDEI, MERRA-2, PGF and ERA5.
Table 1Meteorological datasets with spatial resolution used; the table presents the characteristics of the datasets used in this study, although different spatial and temporal resolutions can be available from the data providers. G: gauge; S: satellite; R: reanalysis; P: precipitation; T: temperature; NP: near present.
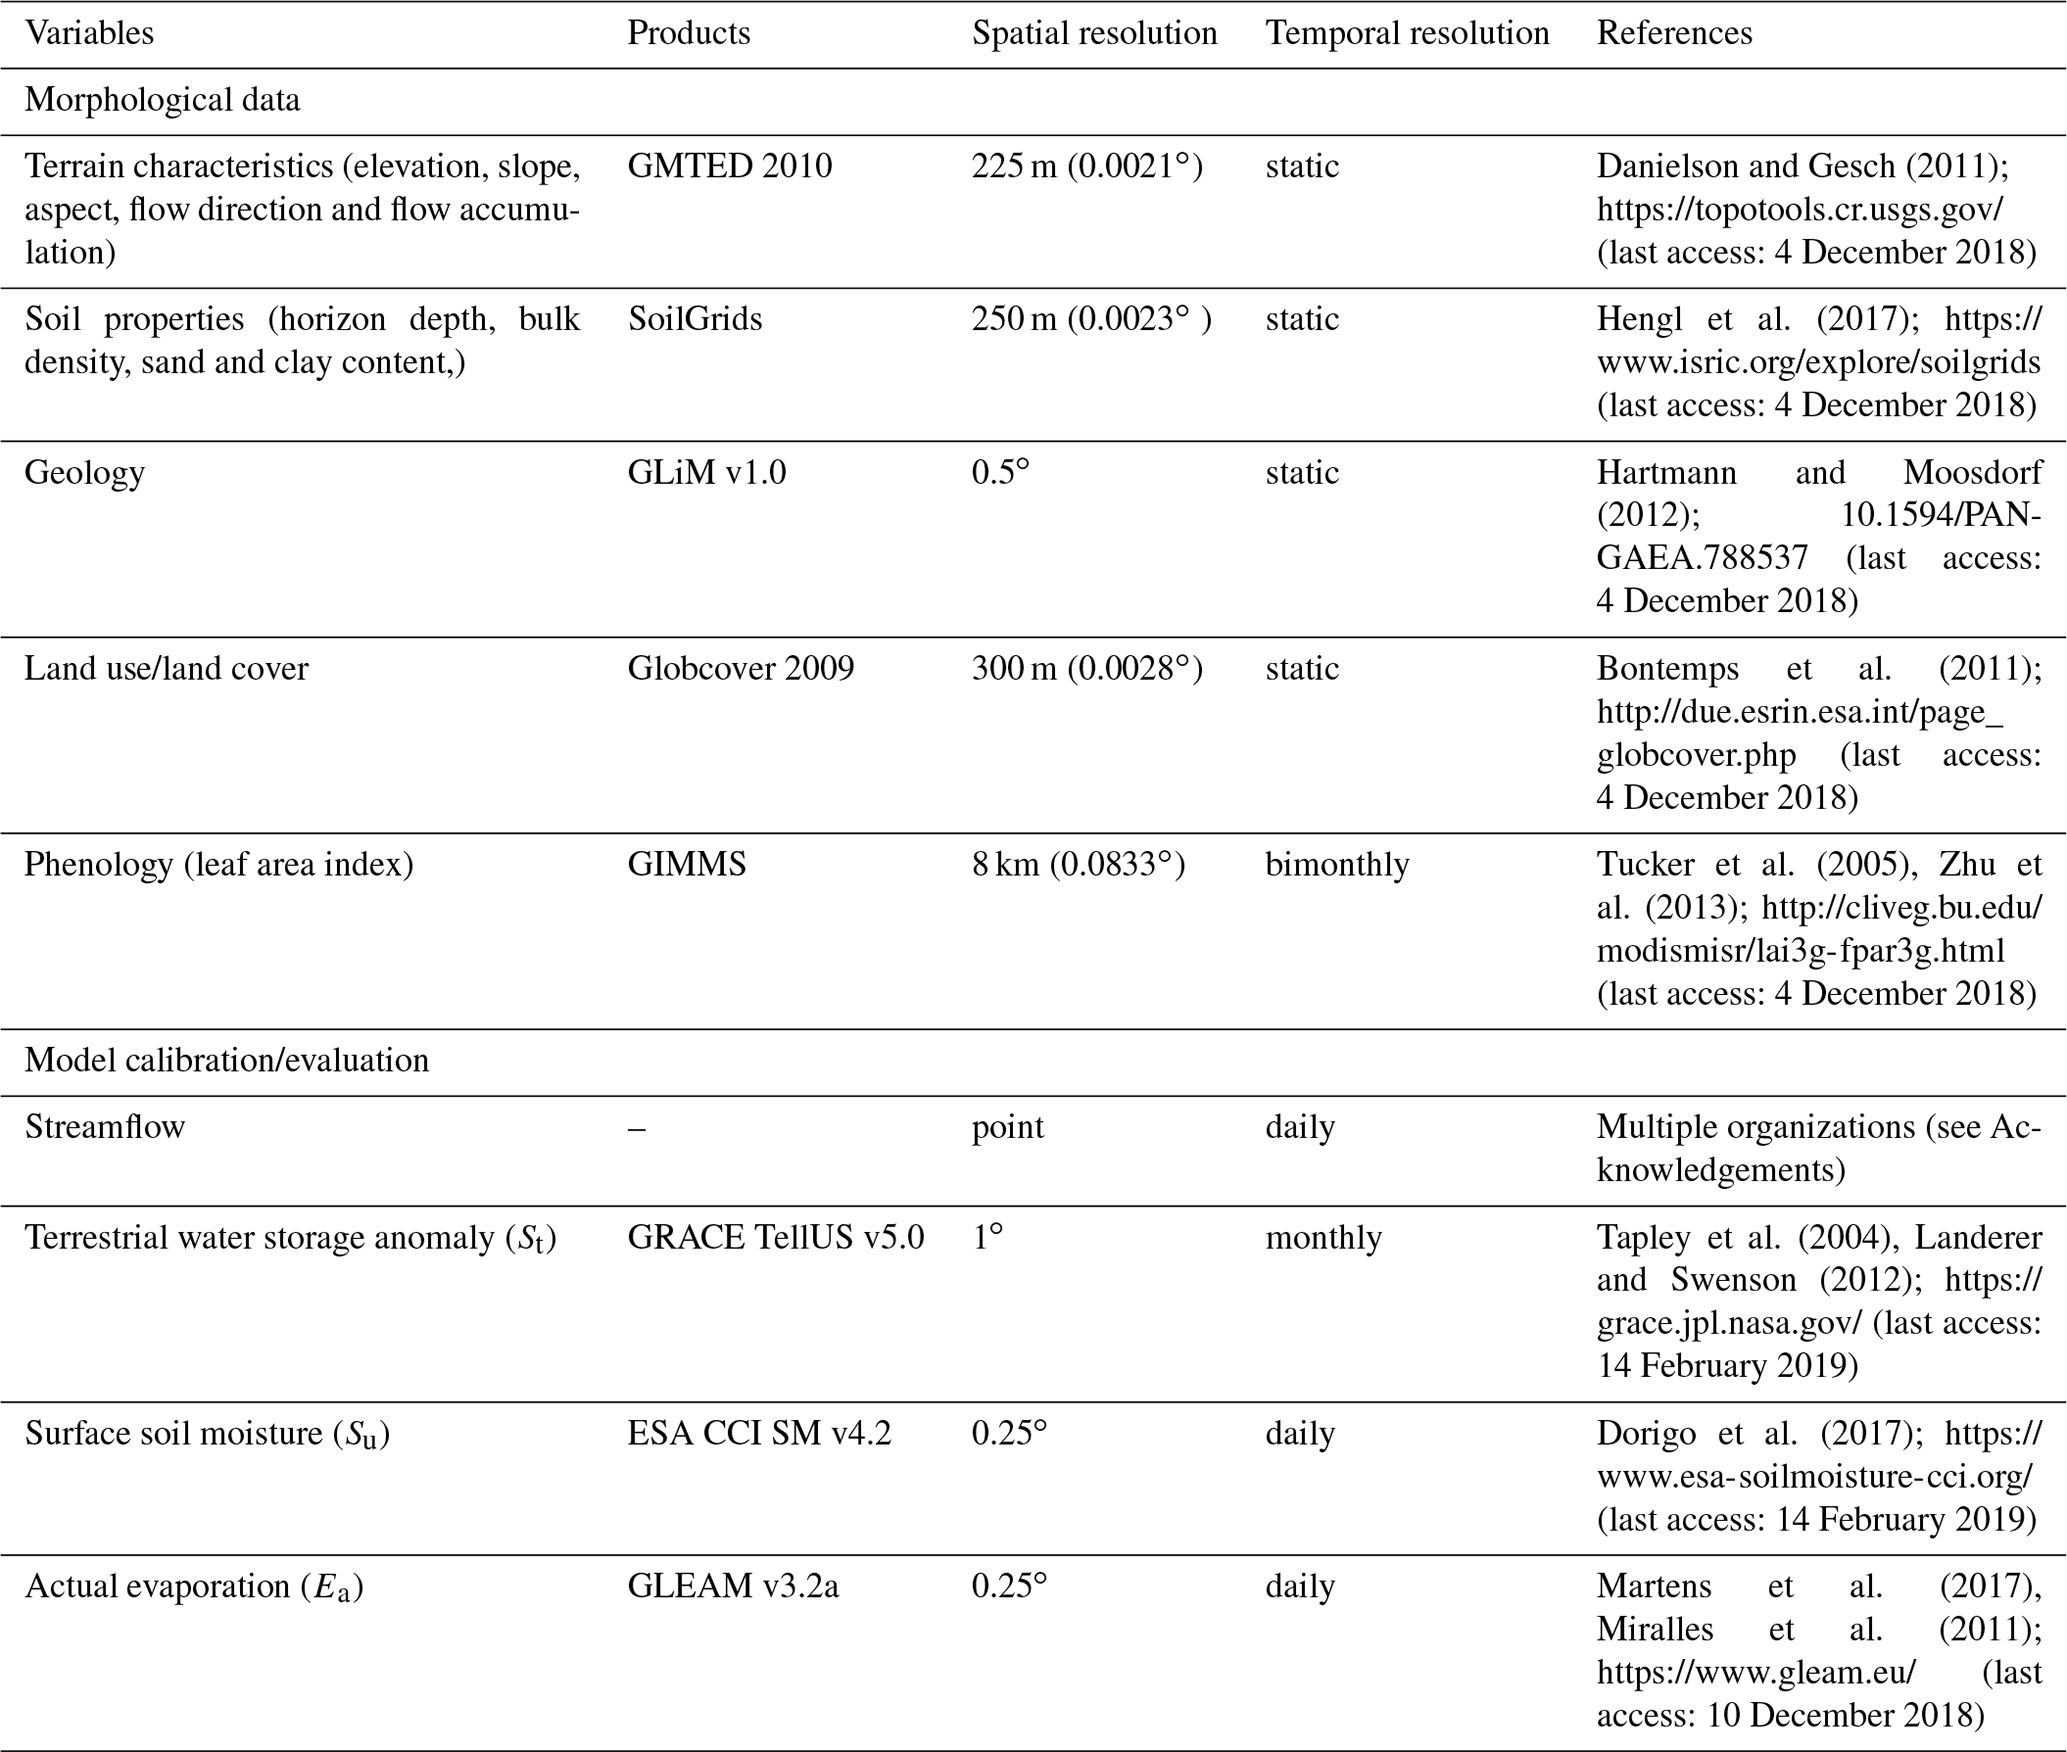
2.3 Modelling datasets
In addition to the meteorological datasets (Table 1), an ensemble of datasets is required for the set-up and the calibration and evaluation of the hydrological model (Table 2). The streamflow datasets obtained from different organizations (see Acknowledgements) were pre-processed (i.e. gap-filling and quality control) in the work of Dembélé et al. (2019).
Multiple satellite datasets are used to evaluate the modelled hydrological fluxes and state variables. For the evaluation of the modelled water storages, the GRACE-derived terrestrial water storage (St) anomaly data release RL05 (Landerer and Swenson, 2012; Swenson, 2012) is used. The ensemble mean of different products from three processing centres (i.e. Jet Propulsion Laboratory, Center for Space Research at the University of Texas and Geoforschungszentrum Potsdam) is preferred because it is more effective in reducing noise in the Earth's gravity signal as compared to the individual products (Sakumura et al., 2014). The surface soil moisture (Su) data representing the first soil layer (i.e. 2–5 cm depth) are obtained from ESA CCI (Dorigo et al., 2017) using the combination of both active and passive microwave products (Gruber et al., 2017; W. Wagner et al., 2012). Actual evaporation (Ea) data are obtained from the GLEAM land surface model that aggregates components of terrestrial evaporation based on the fraction of land cover types per grid cell (Martens et al., 2017). A full description of the datasets is accessible through the references and web links provided in Tables 1 and 2.
Table 2Modelling datasets. ESA CCI SM: European Space Agency Climate Change Initiative Soil Moisture; GIMMS: Global Inventory Modeling and Mapping Studies; GLEAM: Global Land Evaporation Amsterdam Model; GLiM: Global Lithological Map; GMTED: Global Multi-resolution Terrain Elevation Data; GRACE: Gravity Recovery and Climate Experiment; WFDEI: WATCH Forcing Data methodology applied to ERA-Interim data.
2.4 Study area
The transboundary Volta River basin (VRB) covers approximately 415 600 km2 (Fig. 2) shared among six countries of West Africa (i.e. Burkina Faso, Ghana, Togo, Mali, Benin and Côte d'Ivoire). The relief is predominantly flat with 95 % of the basin below 400 m a.s.l (De Condappa and Lemoalle, 2009). The Volta River flows over 1850 km with a drainage system composed of four sub-basins known as Black Volta (152 800 km2), White Volta (113 400 km2), Oti (74 500 km2) and Lower Volta (74 900 km2). Before reaching the Atlantic Ocean at the Gulf of Guinea, the Volta River transits through Lake Volta (area: 8502 km2; volume: 148 km3), formed by the Akosombo Dam (7.94×10⁶ m3) (Williams et al., 2016; Dembélé et al., 2020b). The dominant land cover is savannah composed of grassland interspersed with shrubs and trees over 75 % of the basin area, followed by cropland (13 %), forest (9 %), waterbodies (2 %) and bare land and settlements (1 %). Climate in West Africa is unique and complex (Berthou et al., 2019; Bichet and Diedhiou, 2018; Nicholson et al., 2018a). The seasonal and latitudinal oscillation of the Intertropical Convergence Zone (ITCZ) is the predominant rainfall generation mechanism in West Africa (Biasutti, 2019), thereby depicting a south–north gradient of increasing aridity in the VRB. The ITCZ is a narrow belt of clouds associated with intense convective activity resulting from the near-surface convergence of warm and moist trade winds (Schneider et al., 2014; Dezfuli, 2017). The warm northeasterly Harmattan winds emanate from the Sahara, and the moist southwest monsoon winds originate in the Atlantic Ocean (Nicholson, 2013; Vizy and Cook, 2018). Rainfall in West Africa is characterized by its interannual and multidecadal variability (Biasutti et al., 2018; Thorncroft et al., 2011; Nicholson et al., 2018b). Four eco-climatic zones (i.e. Sahelian, Sudano-Sahelian, Sudanian and Guinean; Fig. 2a) are commonly identified based on the average annual precipitation and agricultural features (FAO/GIEWS, 1998; Mul et al., 2015). The maps of spatial patterns of rainfall and temperature in the VRB for different datasets are shown in Appendix Figs. A1 and A2. The climatology of rainfall and temperature per climatic zones are provided in the Supplement (Figs. S11–S14).
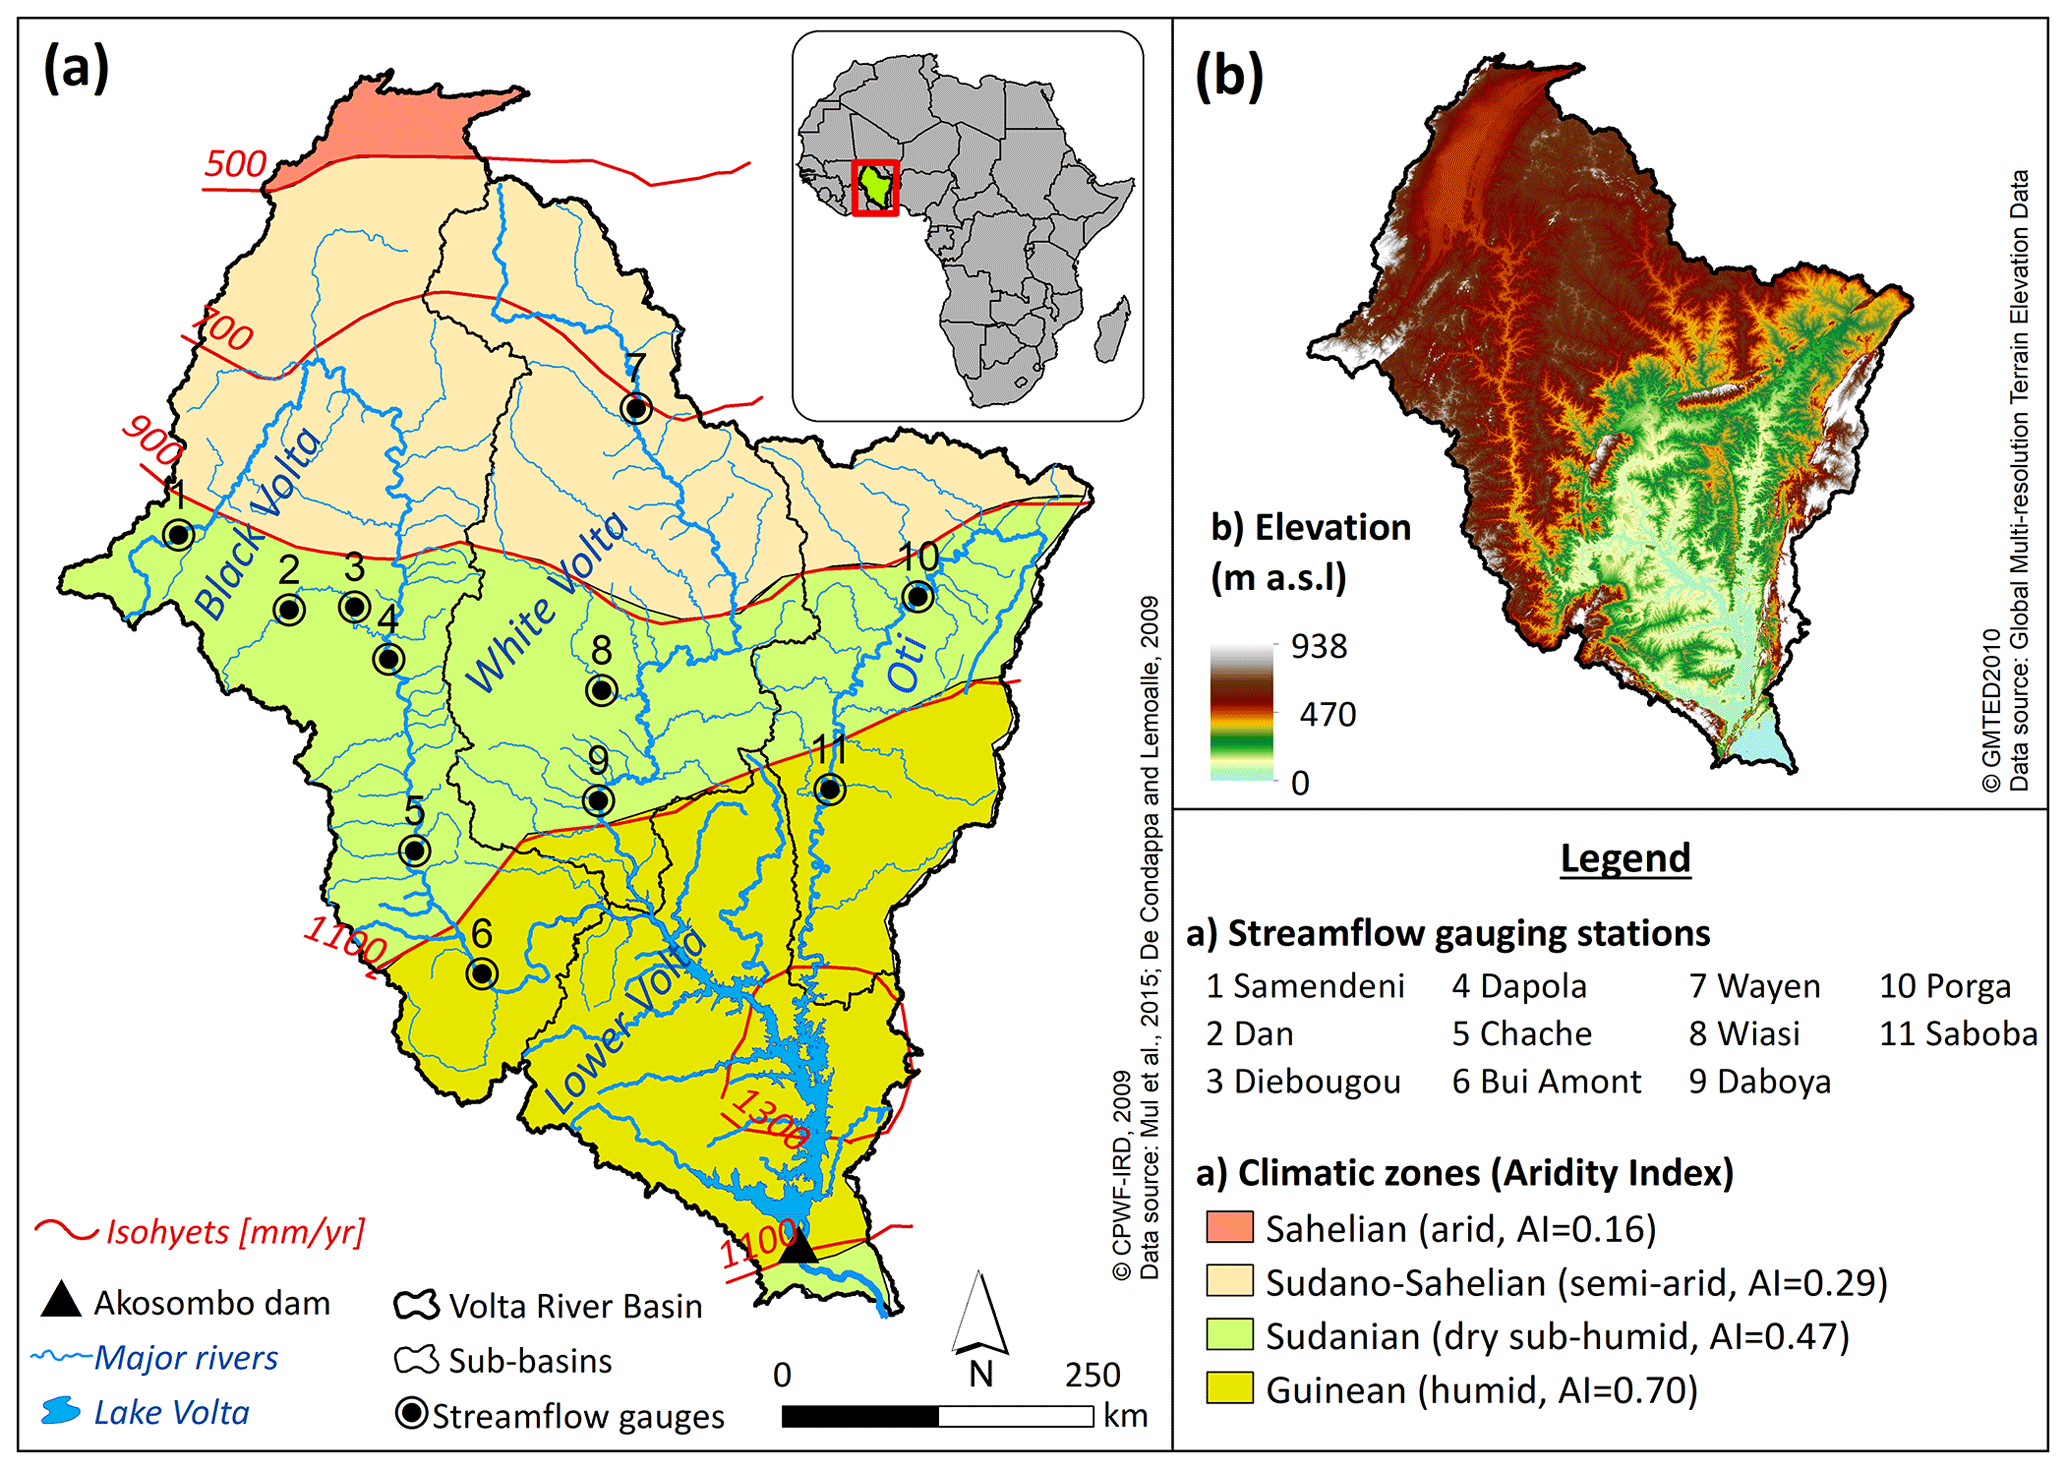
Figure 2Physical and hydroclimatic characteristics of the Volta River basin. (a) shows the hydrographic network and the climatic zones, and (b) shows the digital elevation model. The mean aridity index (AI) of each eco-climatic zone is derived from the global aridity index database (Trabucco and Zomer, 2018).
The VRB is a data-scarce region, not like places in Europe and USA where a large amount of ground measurements are widely and freely accessible. The few datasets collected by local organizations in the VRB are not easily accessible due to the transboundary nature of the basin, which is shared among six countries. Moreover, the VRB region has a low density of meteorological stations (cf. Fig. 1 of Dembélé and Zwart, 2016, and Fig. 1 of Satgé et al., 2020). A thorough evaluation of satellite and reanalysis datasets with ground measurements in the VRB cannot be limited to a few stations because of the large size of the basin and the strong spatial variability of rainfall. Moreover, a robust ground evaluation would require independent in situ measurements that are not used in the development of the SRPs and reanalysis datasets (Beck et al., 2019a), as they are a luxury in West Africa. These limitations in in situ data availability further motivate the hydrological evaluation of SRPs and reanalysis datasets.
2.5 Hydrological model set-up
The fully distributed mesoscale Hydrologic Model (mHM, version 5.9; Samaniego et al., 2010; Kumar et al., 2013) is used in this study. It is a conceptual model that simulates dominant hydrological processes (e.g. evaporation, soil moisture, subsurface storage and discharge) per grid cell in the modelling domain. The Muskingum–Cunge method (Cunge, 1969) is used for routing the total grid-generated runoff using a multiscale routing model (Thober et al., 2019). A multiscale parameter regionalization technique (MPR; Samaniego et al., 2017) is used to account for sub-grid variability of the basin physical characteristics (e.g. soil texture, topography and land cover). For this study, 36 global parameters are determined through model calibration (Table S24).
In this study, the Hargreaves and Samani method (Hargreaves and Samani, 1985), solely based on air temperature data, is used to calculate the reference evaporation (Eref). Potential evaporation (Ep) is calculated by adjusting Eref to vegetation cover (Allen et al., 1998; Birhanu et al., 2019). A dynamical scaling function (FDS) (cf. Demirel et al., 2018) is used to account for vegetation–climate interactions (Bai et al., 2018; Jiao et al., 2017). Ep is formulated as follows:
where ILA represents the leaf area index, a is the intercept term, b represents the vegetation-dependent component and c describes the degree of non-linearity in the ILA dependency. The coefficients a, b and c are determined during model calibration.
Actual evaporation (i.e. all evaporative fluxes including transpiration, Ea) depends on plant water availability, i.e. on root distribution in the subsurface and soil moisture availability (Feddes et al., 1976); this is emulated in mHM by computing Ea as a fraction of Ep at different soil layers. A multi-layer infiltration capacity approach is used to calculate soil moisture based on a three-layer soil scheme (5, 30 and 100 cm depths). As no snow occurs in the VRB, terrestrial water storage is calculated per grid cell by summing up the surface water storage on impervious areas and all subsurface water storage (i.e. reservoirs generating soil moisture, baseflow and interflow). The model is run at a daily time step with a spatial discretization of 0.25∘ (∼28 km at the Equator).
The modelling experiment covers the period 2000–2012 with a 3-year model warm-up period (2000–2002), 6 years for model calibration (2003–2008) and 4 years for model evaluation (2009–2012). The model is calibrated and evaluated with the available daily in situ streamflow datasets from 11 locations (Fig. 2a), while the evaluation with satellite datasets of evaporation, soil moisture and terrestrial water storage is done at a monthly time step to avoid the impact of mismatches in the daily data retrieval periods among the satellite data sources. An illustration of natural variability of streamflow (Fig. S16), precipitation (Figs. S1 and S5) and temperature (Figs. S3–S4 and S6–S8) is provided in the Supplement.
2.6 Multisite model calibration on streamflow data
A multisite calibration strategy is adopted by simultaneously constraining the model with the 11 streamflow (Q) gauging stations (Fig. 2) to infer a unique parameter set for the whole basin. The objective function ΦQ combines the Nash–Sutcliffe efficiency (Nash and Sutcliffe, 1970) of streamflow (ENS) and the Nash–Sutcliffe efficiency of the logarithm of streamflow (ENSlog), and it is formulated such that it has to be minimized:
where Qmod and Qobs are the modelled and the observed streamflow, t is the number of time steps of the calibration period, and g is the number of streamflow gauging stations present within the modelling domain. ΦQ is calculated with all the streamflow gauging stations, and it ranges from its ideal value of 0 to positive infinity.
The model is calibrated solely with Q data because it is the only available in situ measurement, and to avoid potential trade-offs of a multivariate calibration that would result in difficulties in identifying the source of variation in the model performance (i.e. input data vs. model parametrization) (Dembélé et al., 2020b). The parameter estimation is done with the dynamically dimensioned search algorithm (Tolson and Shoemaker, 2007) using 4000 iterations for each of the 102 rainfall–temperature dataset combinations.
2.7 Multivariable model evaluation with streamflow and satellite data
In addition to ENS and ENSlog, the Kling–Gupta efficiency (EKG) (Kling et al., 2012) is used to evaluate the model performance for streamflow:
where rKG is the Pearson correlation coefficient, βKG is the bias term (i.e. the ratio of the means), and γKG is the variability term (i.e. the ratio of the coefficients of variation) between Qobs and Qmod. The EKG ranges from negative infinity to its optimal value of unity. As a reference, EKG > −0.41 indicates that the model is better than the mean observed flow (Knoben et al., 2019).
In addition to Q, several non-commensurable and satellite-based variables are used for model evaluation (Table 2). The bias-insensitive Pearson's correlation coefficient (r) is used to assess the temporal dynamics of St, Su and Ea because the model is not calibrated on these variables, and their evaluation datasets are satellite-derived products that encompass uncertainties and can be biased.
The spatial pattern representation of hydrological processes is assessed by using a bias-insensitive and multi-component metric developed by Dembélé et al. (2020b). The proposed spatial pattern efficiency (ESP) metric is formulated similarly to the EKG (Eq. 4), but it focuses only on the spatial pattern of variables rather than on their absolute values (like the SPAEF; Koch et al., 2018). ESP simultaneously assesses the dynamics, the spatial variability, and the locational matching of grid cells between the observed (Xobs) and modelled (Xmod) variables. Considering two variables Xobs and Xmod composed of n cells, ESP is defined as follows:
where rs is the Spearman rank-order correlation coefficient, with di being the difference between the ranks of the ith cell of Xmod and Xobs. γ is the variability ratio (i.e. the ratio of the coefficients of variation) that assesses the similarity in the dispersion of the probability distributions of Xmod and Xobs, with μ and σ representing the mean and the standard deviation, and α the spatial location matching term calculated as the root-mean-squared error (ERMS) of the standardized values (z scores, ZX) of Xmod and Xobs (Dembélé et al., 2020b). ESP ranges from negative infinity to 1, which is its optimal value. ESP does not have an inherent benchmark, also like EKG (Knoben et al., 2019). For ESP=0, the ranks of the observed and modelled variables are moderately related (i.e. rs=0.55), while no association among the ranks (i.e. rs=0) results in (cf. Supplement of Dembélé et al., 2020b). However, the main point of using ESP here is not to strictly conclude how well the modelled spatial patterns reproduce the observed patterns – otherwise a benchmark should be used (Schaefli and Gupta, 2007; Seibert et al., 2018) – but rather to determine if a modelled spatial pattern is better than another. The spatial pattern evaluation is completed for Su and Ea, while only the temporal dynamics of St are assessed due to the coarse spatial resolution of the GRACE data.
The relative variation in model performance is assessed with the second-order coefficient of variation (V2) (Kvålseth, 2017). V2 is an alternative to the classic Pearson's coefficient of variation (CV), which has significant limitations that are comprehensively discussed by Kvålseth (2017). The limitations of the CV include its difficult and non-intuitive interpretation because of the lack of an upper bound, its high sensitivity to outliers, its dependence on the sample mean and problems with negative values. For all sample data x= (x1, …, xn) ∈Rn, with R= (-∞, ∞), V2 is defined as follows:
where s is the standard deviation and is the mean of x. V2 varies from 0 to 1 or 0 % to 100 % and represents the distance between x and relative to the distance between x and the origin zero.
The results are presented and discussed for the entire simulation period (2003–2012, i.e. combined calibration and evaluation periods) because reliable meteorological datasets are expected to produce a plausible representation of hydrological processes independently of the modelling period (Bisselink et al., 2016). Separated results are provided for the calibration and evaluation periods in the Supplement.
3.1 Model performance for streamflow
Similar model performance patterns are obtained with EKG,ENS and ENSlog of daily streamflow (Q) (Fig. 3). Therefore, only EKG is retained for the description of the results. All input dataset combinations show a median EKG >0.5, except those having JRA-55 as rainfall input (Fig. 3), which can be justified by the coarse spatial resolution of that product. The ranking of the rainfall and temperature datasets based on the model performance for Q is provided in Appendix Table A1. The analysis of model performance for Q is done for the entire VRB and not per climatic zone due to the limited number of stations. As expected, the discrepancies in median EKG are more pronounced across rainfall datasets than across temperature datasets, as visible in the colour-coded ranking of the products in Fig. 3. For a given rainfall product, the ranking among all rainfall products hardly varies with different temperature products. The ranking of all the datasets for the model performance for Q is also summarized in Table A1. The overall stronger impact of the choice of the rainfall dataset on EKG of Q also becomes clear from the V2 of the median EKG (Table S3). For rainfall datasets, the V2 across temperature datasets varies between 0.5 % for GSMaP-std and 4 % for JRA-55, with an average V2 of 2 %. For temperature datasets, the V2 of median EKG of Q across rainfall datasets varies between 10 % for MERRA-2 and 12 % for ERA5, with an average V2 of 11 %. This result suggests that the choice of rainfall dataset has a stronger impact on the EKG of Q than the choice of a temperature dataset.
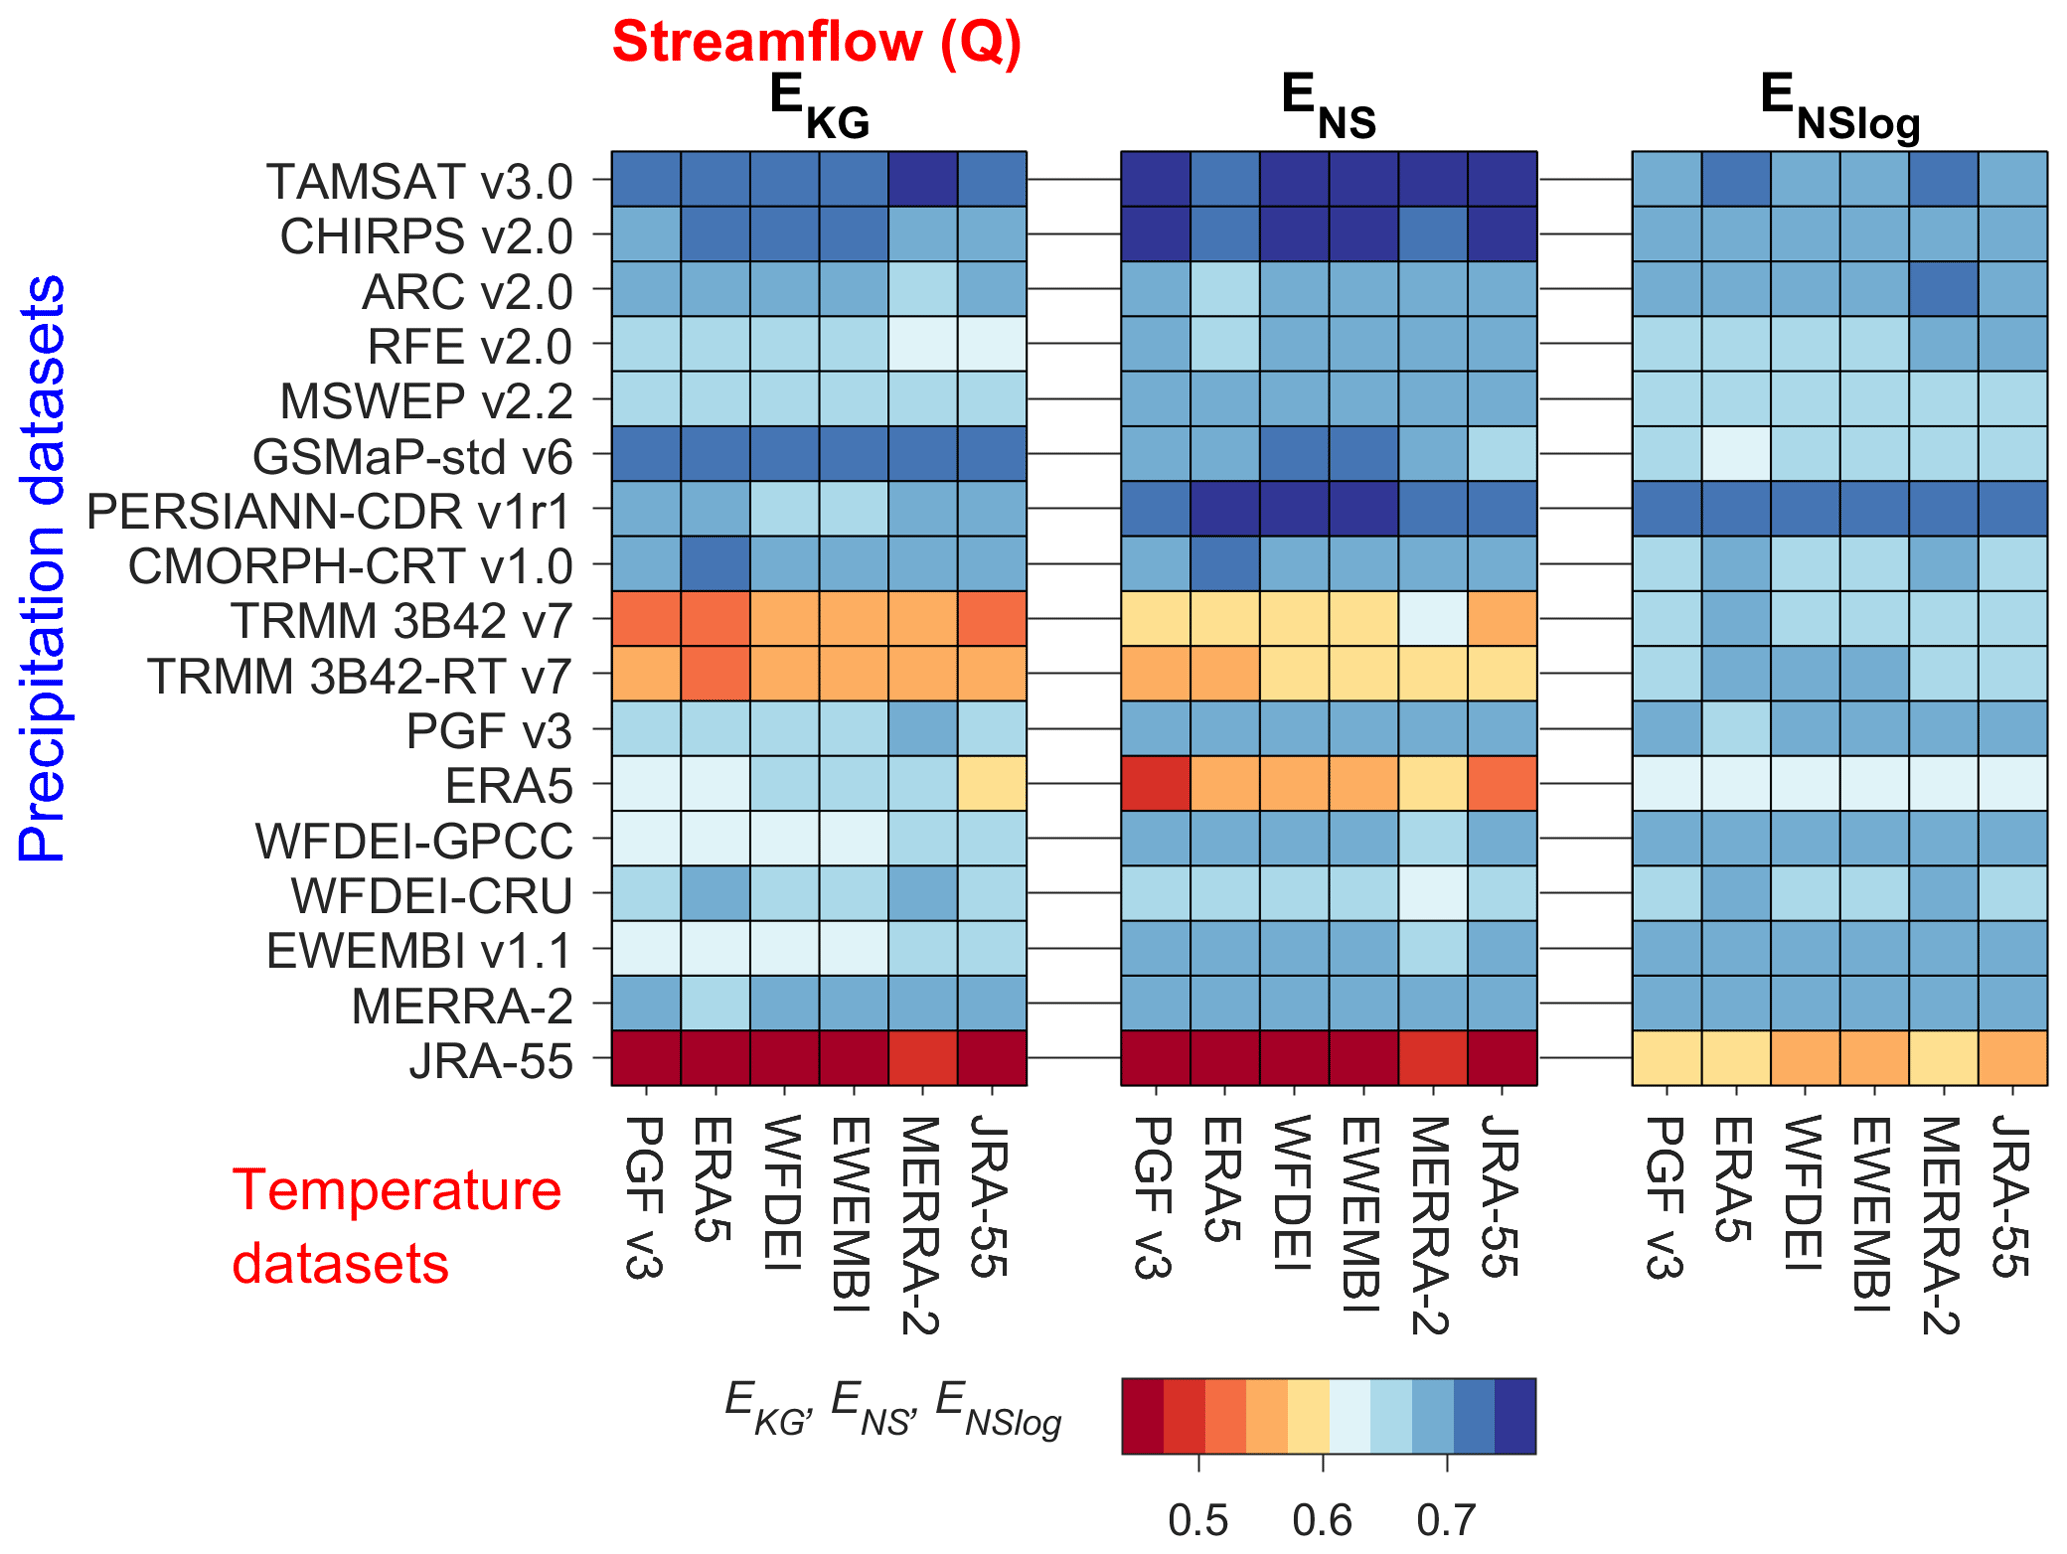
Figure 3Kling–Gupta efficiency (EKG), Nash–Sutcliffe efficiency (ENS) and Nash–Sutcliffe efficiency of the logarithm (ENSlog) of daily streamflow (Q) over the simulation period (2003–2012) for 102 combinations of 17 rainfall datasets (y axis) and 6 temperature datasets (x axis) used as forcing for the hydrological model.
The analysis of the components of EKG (i.e. the Pearson correlation rKG, the bias βKG and the variation γKG) reveals that, when choosing a rainfall dataset, there is more uncertainty in the bias of Q (V2=14 %) than in its variability (V2=6 %) and in its dynamics (V2=3 %), which is in agreement with the work of Thiemig et al. (2013). Detailed results on the performance for Q (i.e. ENS, ENSlog, EKG, rKG, βKG and γKG) and the ranking of the datasets with separate results for the calibration and evaluation periods are provided in the Supplement (Tables S1–S18, Figs. S17–S26).
3.2 Model performance for terrestrial water storage
The model performance for the temporal dynamics of monthly terrestrial water storage (St) compared to the GRACE product is shown in Fig. 4 (see the Supplement for monthly time series, Figs. S38–S42). The average Pearson correlation coefficient (r) of St for all datasets in the entire VRB is 0.80, with discrepancies across climatic zones. The driest and wettest climatic zones show the lowest performances, i.e. Sahelian (r=0.67) and Guinean (r=0.60) zones, compared to the intermediate climatic zones, i.e. Sudano-Sahelian (r=0.72) and Sudanian (r=0.79) zones. Table A1 provides the ranking of all the meteorological datasets for the model performance for St.
The rainfall datasets show different performances across climatic zones, with ARC showing the highest score for all the climatic zones except the Guinean zone, where CMORPH-CRT ranks first. The choice of the rainfall dataset leads to an average V2 of 15 % for the r of St, while the average V2 is 5 % for the choice of the temperature dataset. Detailed results are provided in the Supplement (Tables S19, Figs. S27–S37).
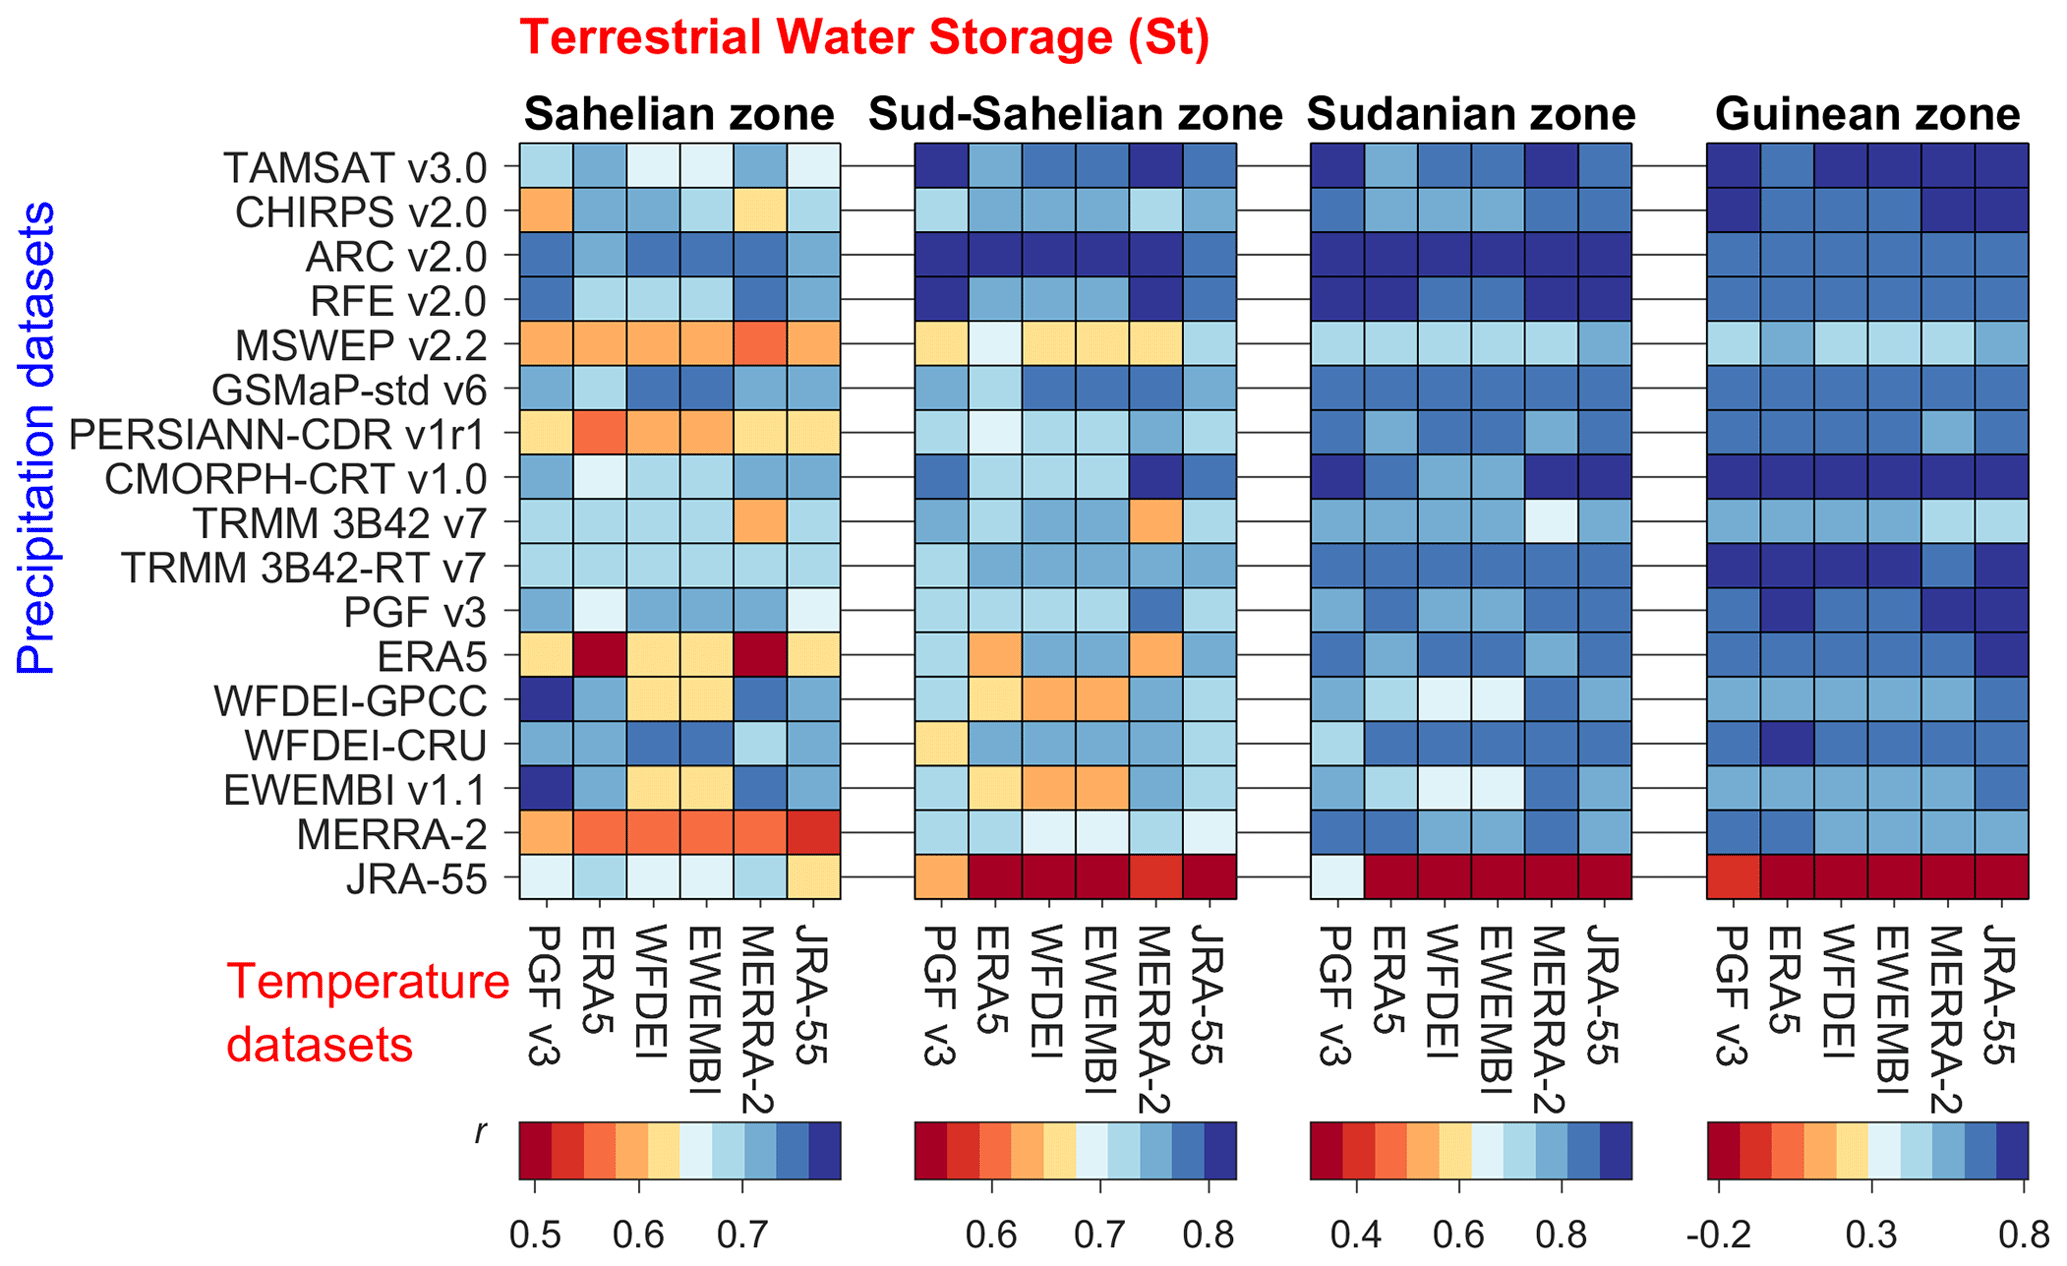
Figure 4Pearson correlation coefficient (r) of modelled terrestrial water storage compared to GRACE data in four climatic zones in the Volta River basin over the simulation period (2003–2012) considering 102 combinations of rainfall (y axis) and temperature datasets (subplots on the x axis) used as forcing for the hydrological model.
3.3 Model performance for soil moisture
Figure 5 shows the model performance for the temporal dynamics of monthly soil moisture (Su) compared to the ESA CCI product (see the Supplement for monthly time series, Figs. S54–S58). The average r of Su for the entire VRB over all datasets is 0.93. The r of Su decreases from the drier to the wetter climatic zones: Sahelian (r=0.94), Sudano-Sahelian (r=0.94), Sudanian (r=0.92) and Guinean (r=0.86). The ranking of the meteorological datasets based on the model performance for Su is provided in Table A1. EWEMBI and WFDEI-GPCC show the highest performance in the Sahelian and Sudano-Sahelian zones respectively, while MERRA-2 shows the highest performance in the Sudanian and Guinean zones. The choice of the rainfall dataset leads to an average V2 of 4 % for the temporal dynamics of Su, while the average V2 is 2 % for the choice of the temperature dataset.
The spatial patterns of Su show considerable differences when using different combinations of rainfall and temperature input datasets, as illustrated in Fig. 6 (see similar maps for all the meteorological datasets in the Supplement, Figs. S59–S60). The south–north gradient of increasing aridity is not similarly spread among the rainfall–temperature dataset combinations. More interestingly, west–east differences in the spatial patterns of Su can be observed. These differences in spatial pattern reproduction can also be seen in the spatial pattern efficiency metric (ESP) of Su for the 102 rainfall–temperature dataset combinations (Fig. 7). The average ESP of Su in the VRB over all datasets is −0.11.
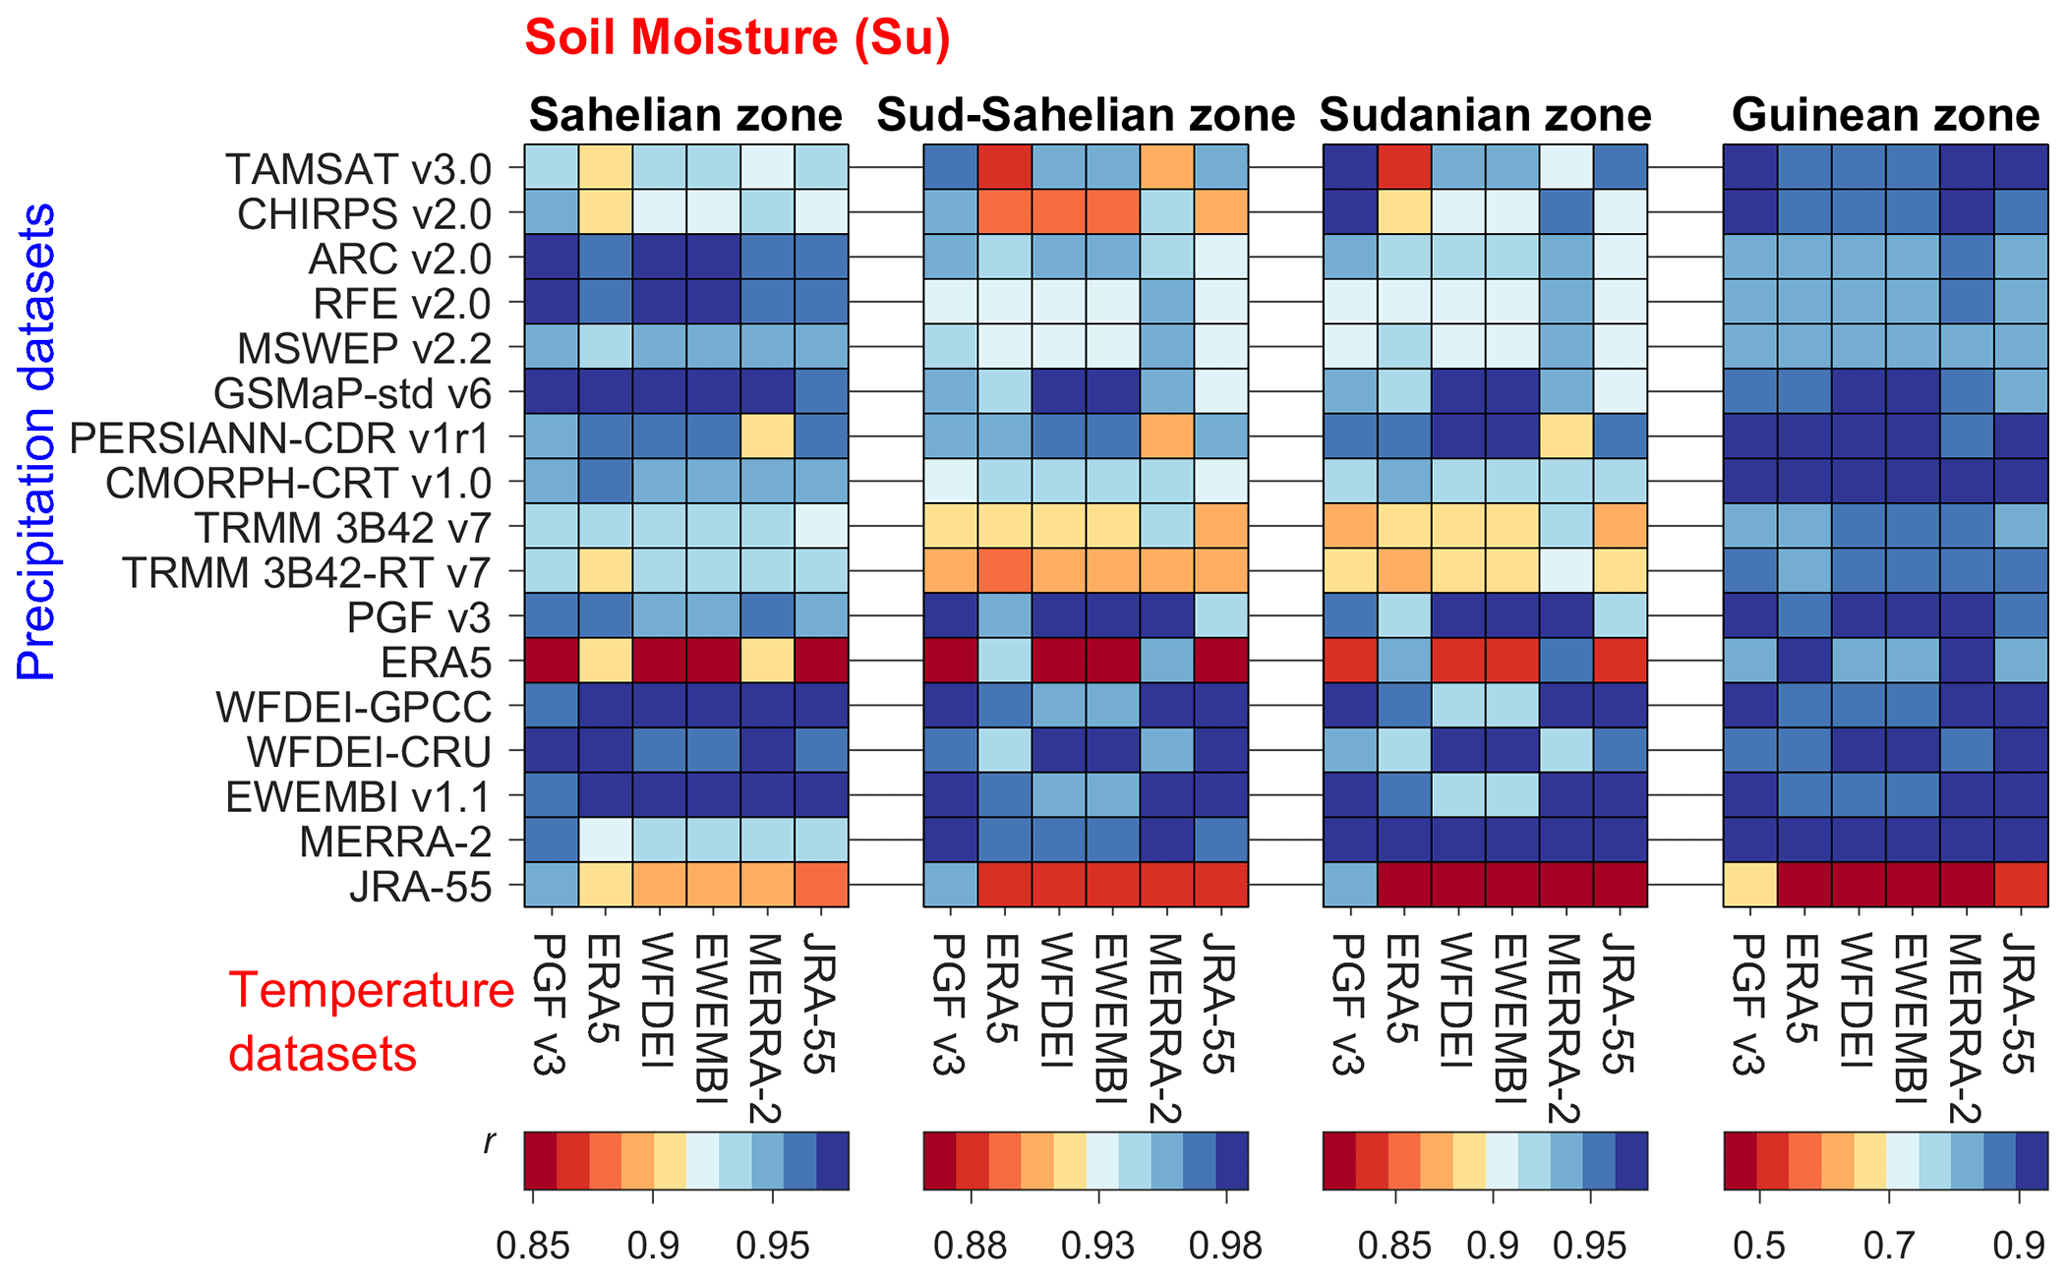
Figure 5Pearson correlation coefficient (r) of modelled soil moisture (Su) compared to ESA CCI data over the simulation period (2003–2012) considering 102 combinations of rainfall (y axis) and temperature datasets (subplots on the x axis) used as forcing for the hydrological model.
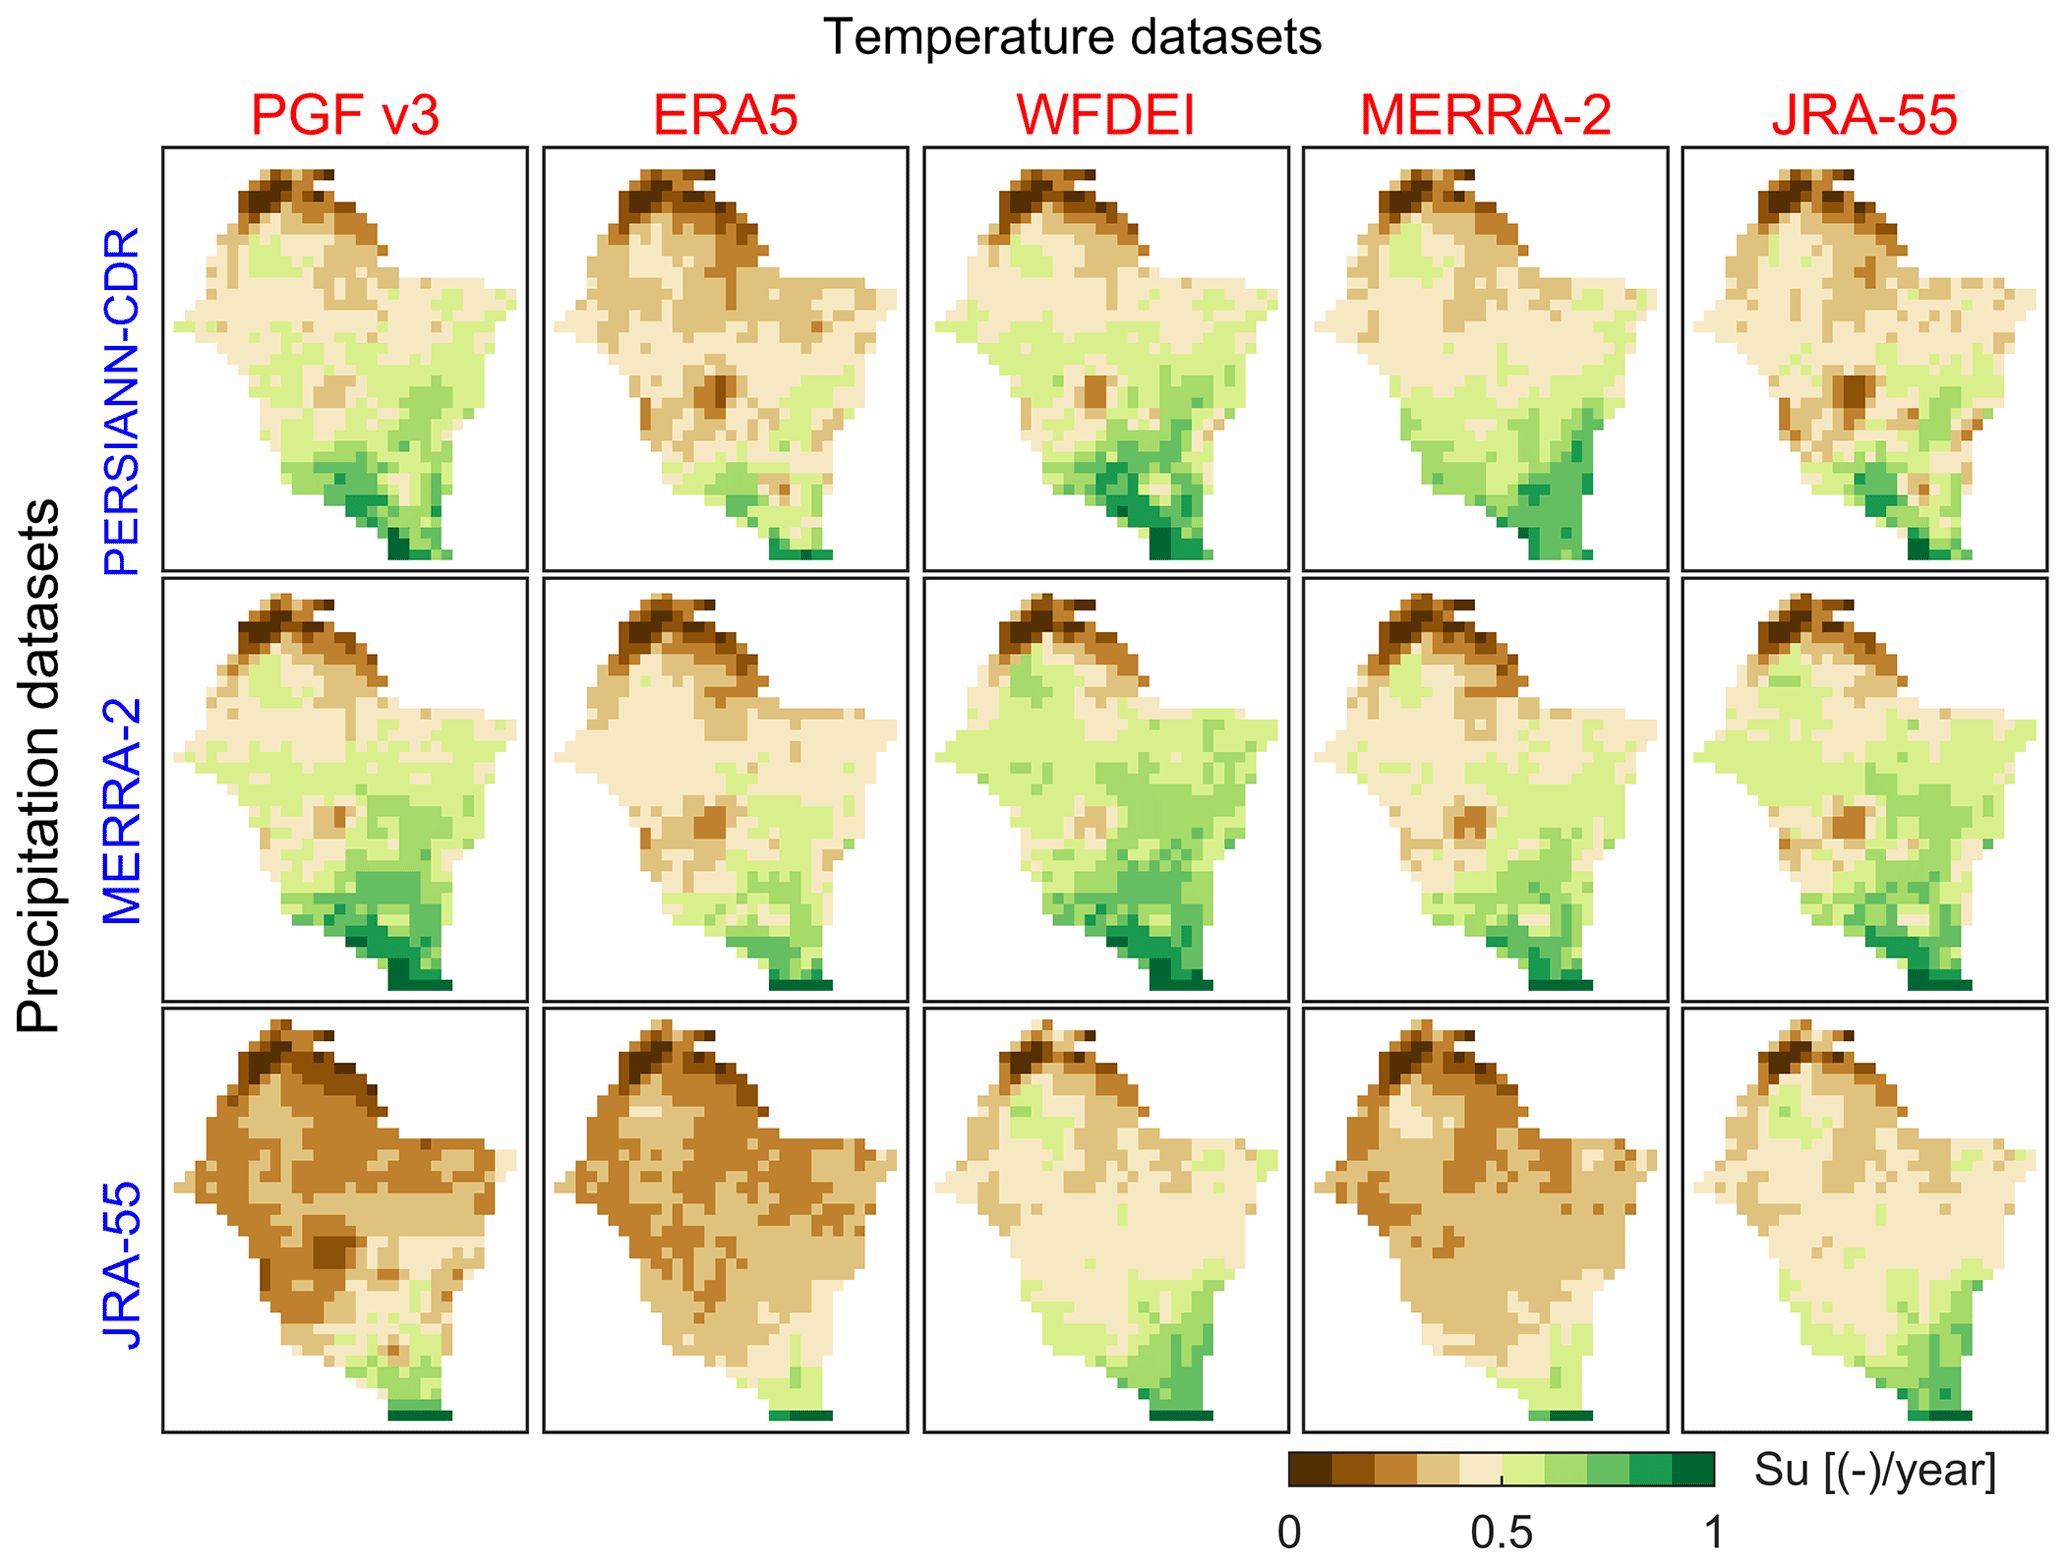
Figure 6Maps of long-term (2003–2012) average of annual soil moisture (Su) obtained with different forcing of rainfall (y axis, blue font) and temperature (x axis, red font) datasets. The values are normalized between 0 and 1 to emphasize spatial patterns and to use a unique colour scale.
For the entire VRB, the choice of the rainfall dataset leads to an average variation of 61 % for the ESP of Su, while the choice of the temperature dataset involves a variation of 45 %. Lower impacts of data choices are observed in the climatic zones where the climate is homogeneous as compared to the entire VRB. The choice of rainfall dataset is more critical for the ESP of Su in the driest and wettest climatic zones, i.e. Sahelian (, V2=25 %) and Guinean (, V2=26 %) zones, than the intermediate zones, i.e. Sudano-Sahelian (, V2=11 %) and Sudanian (, V2=17 %) zones. A smaller impact on the ESP of Su is observed for the choice of the temperature dataset: Sahelian (V2=8 %), Guinean (V2=19 %), Sudano-Sahelian (V2=5 %) and Sudanian (V2=9 %) zones. Detailed results on the model performance for Su and the ranking of the datasets for the calibration and evaluation periods are provided in the Supplement (Tables S20–S21, Figs. S43–S53).

Figure 7Spatial pattern efficiency (ESP) of soil moisture (Su) over the entire simulation period (2003–2012) for the Volta River basin (VRB) using different combinations of precipitation and temperature datasets as input for hydrological modelling. Each boxplot has 120 values, corresponding to the number of months. The boxplots are coloured from the best (blue) to the worst performance (red) based on the median value.
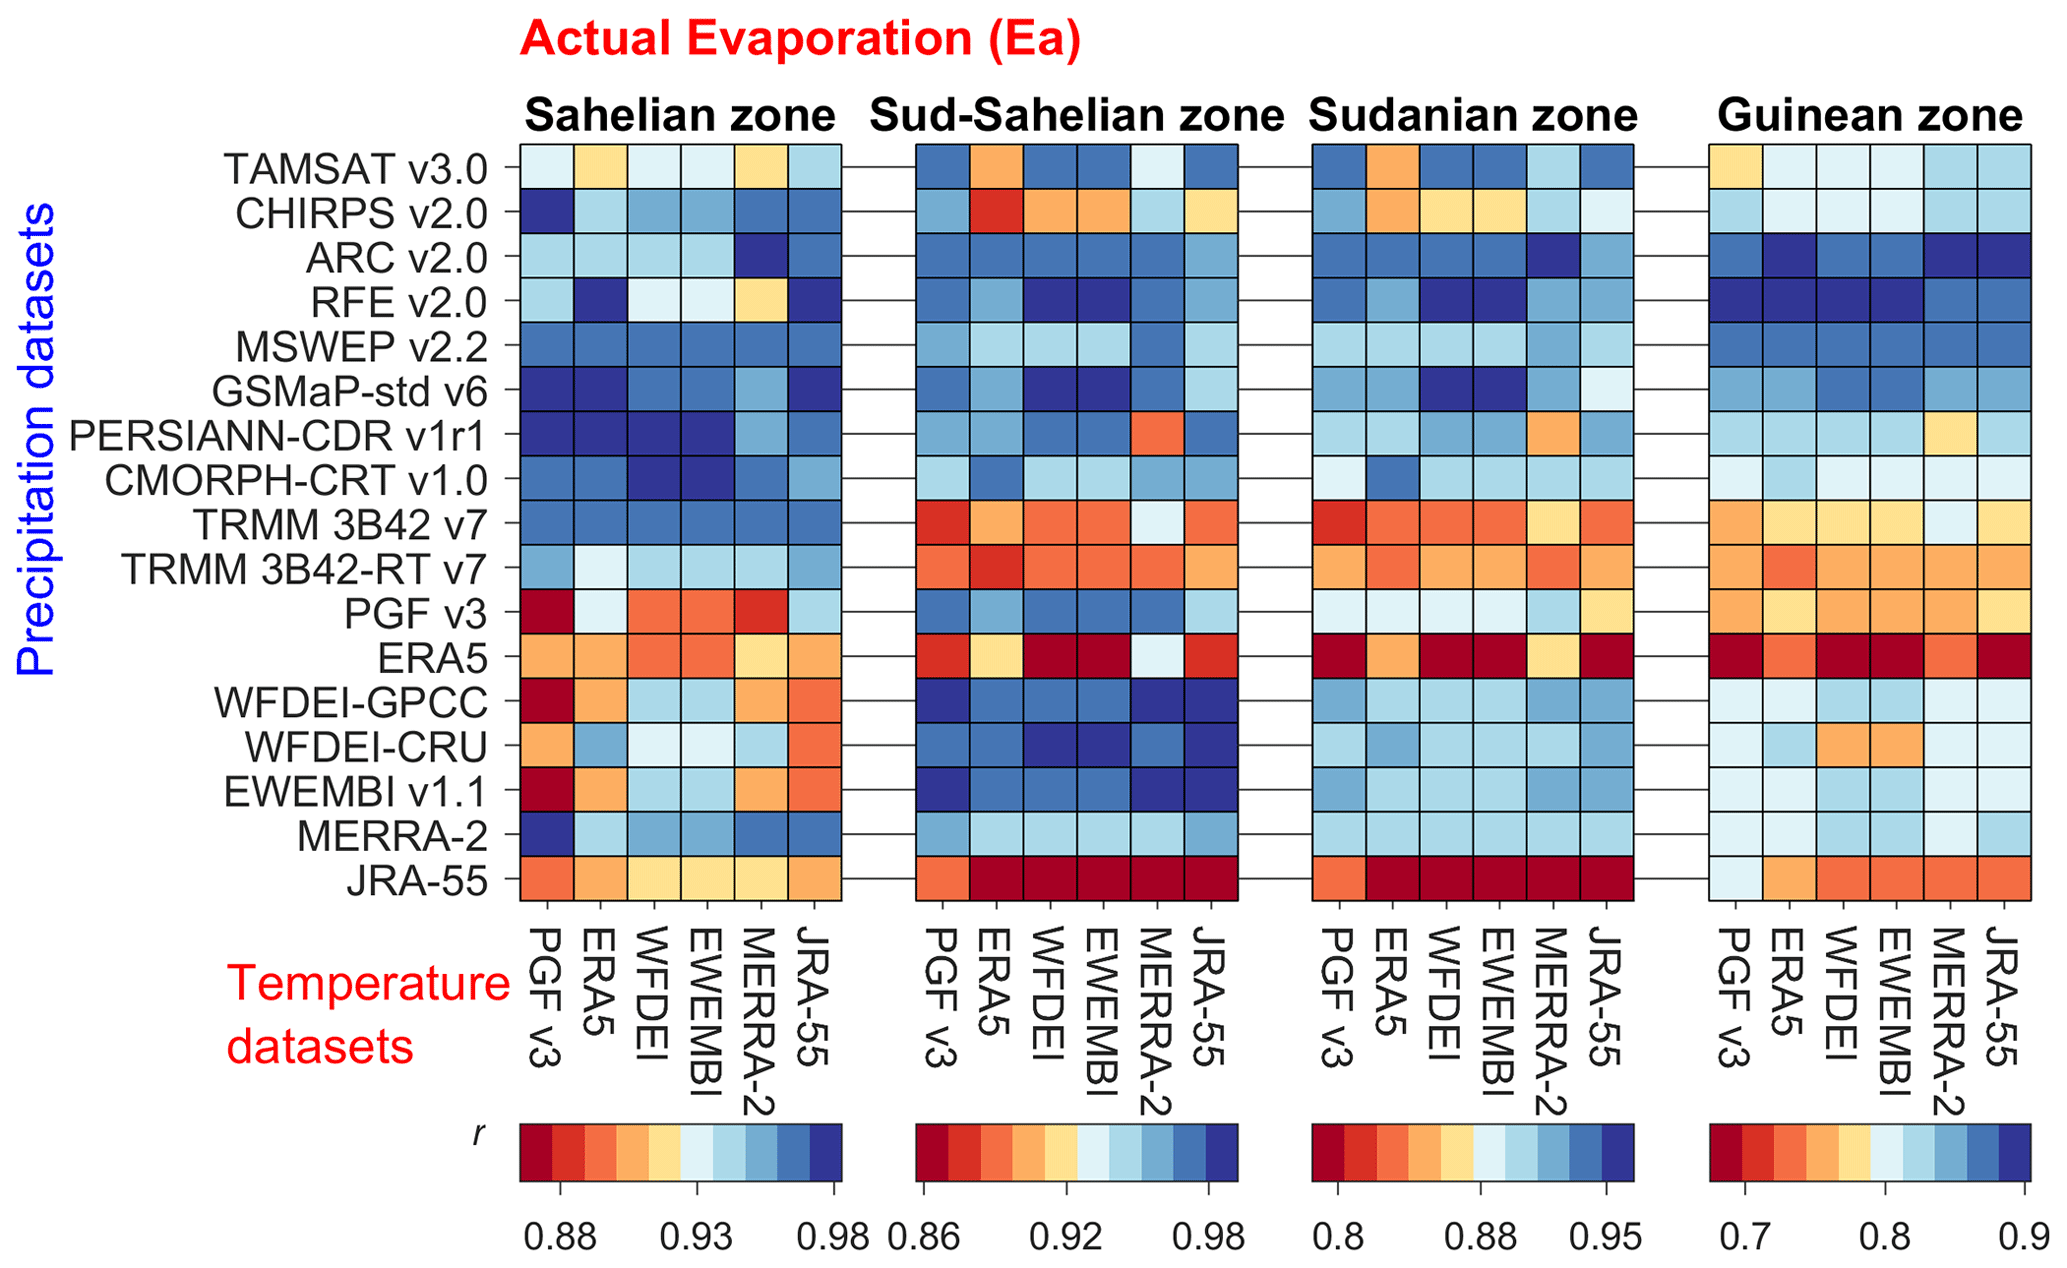
Figure 8Pearson correlation coefficient (r) of modelled actual evaporation (Ea) compared to GLEAM data over the simulation period (2003–2012) considering 102 combinations of rainfall (y axis) and temperature datasets (subplots on the x axis) used as forcing for the hydrological model.
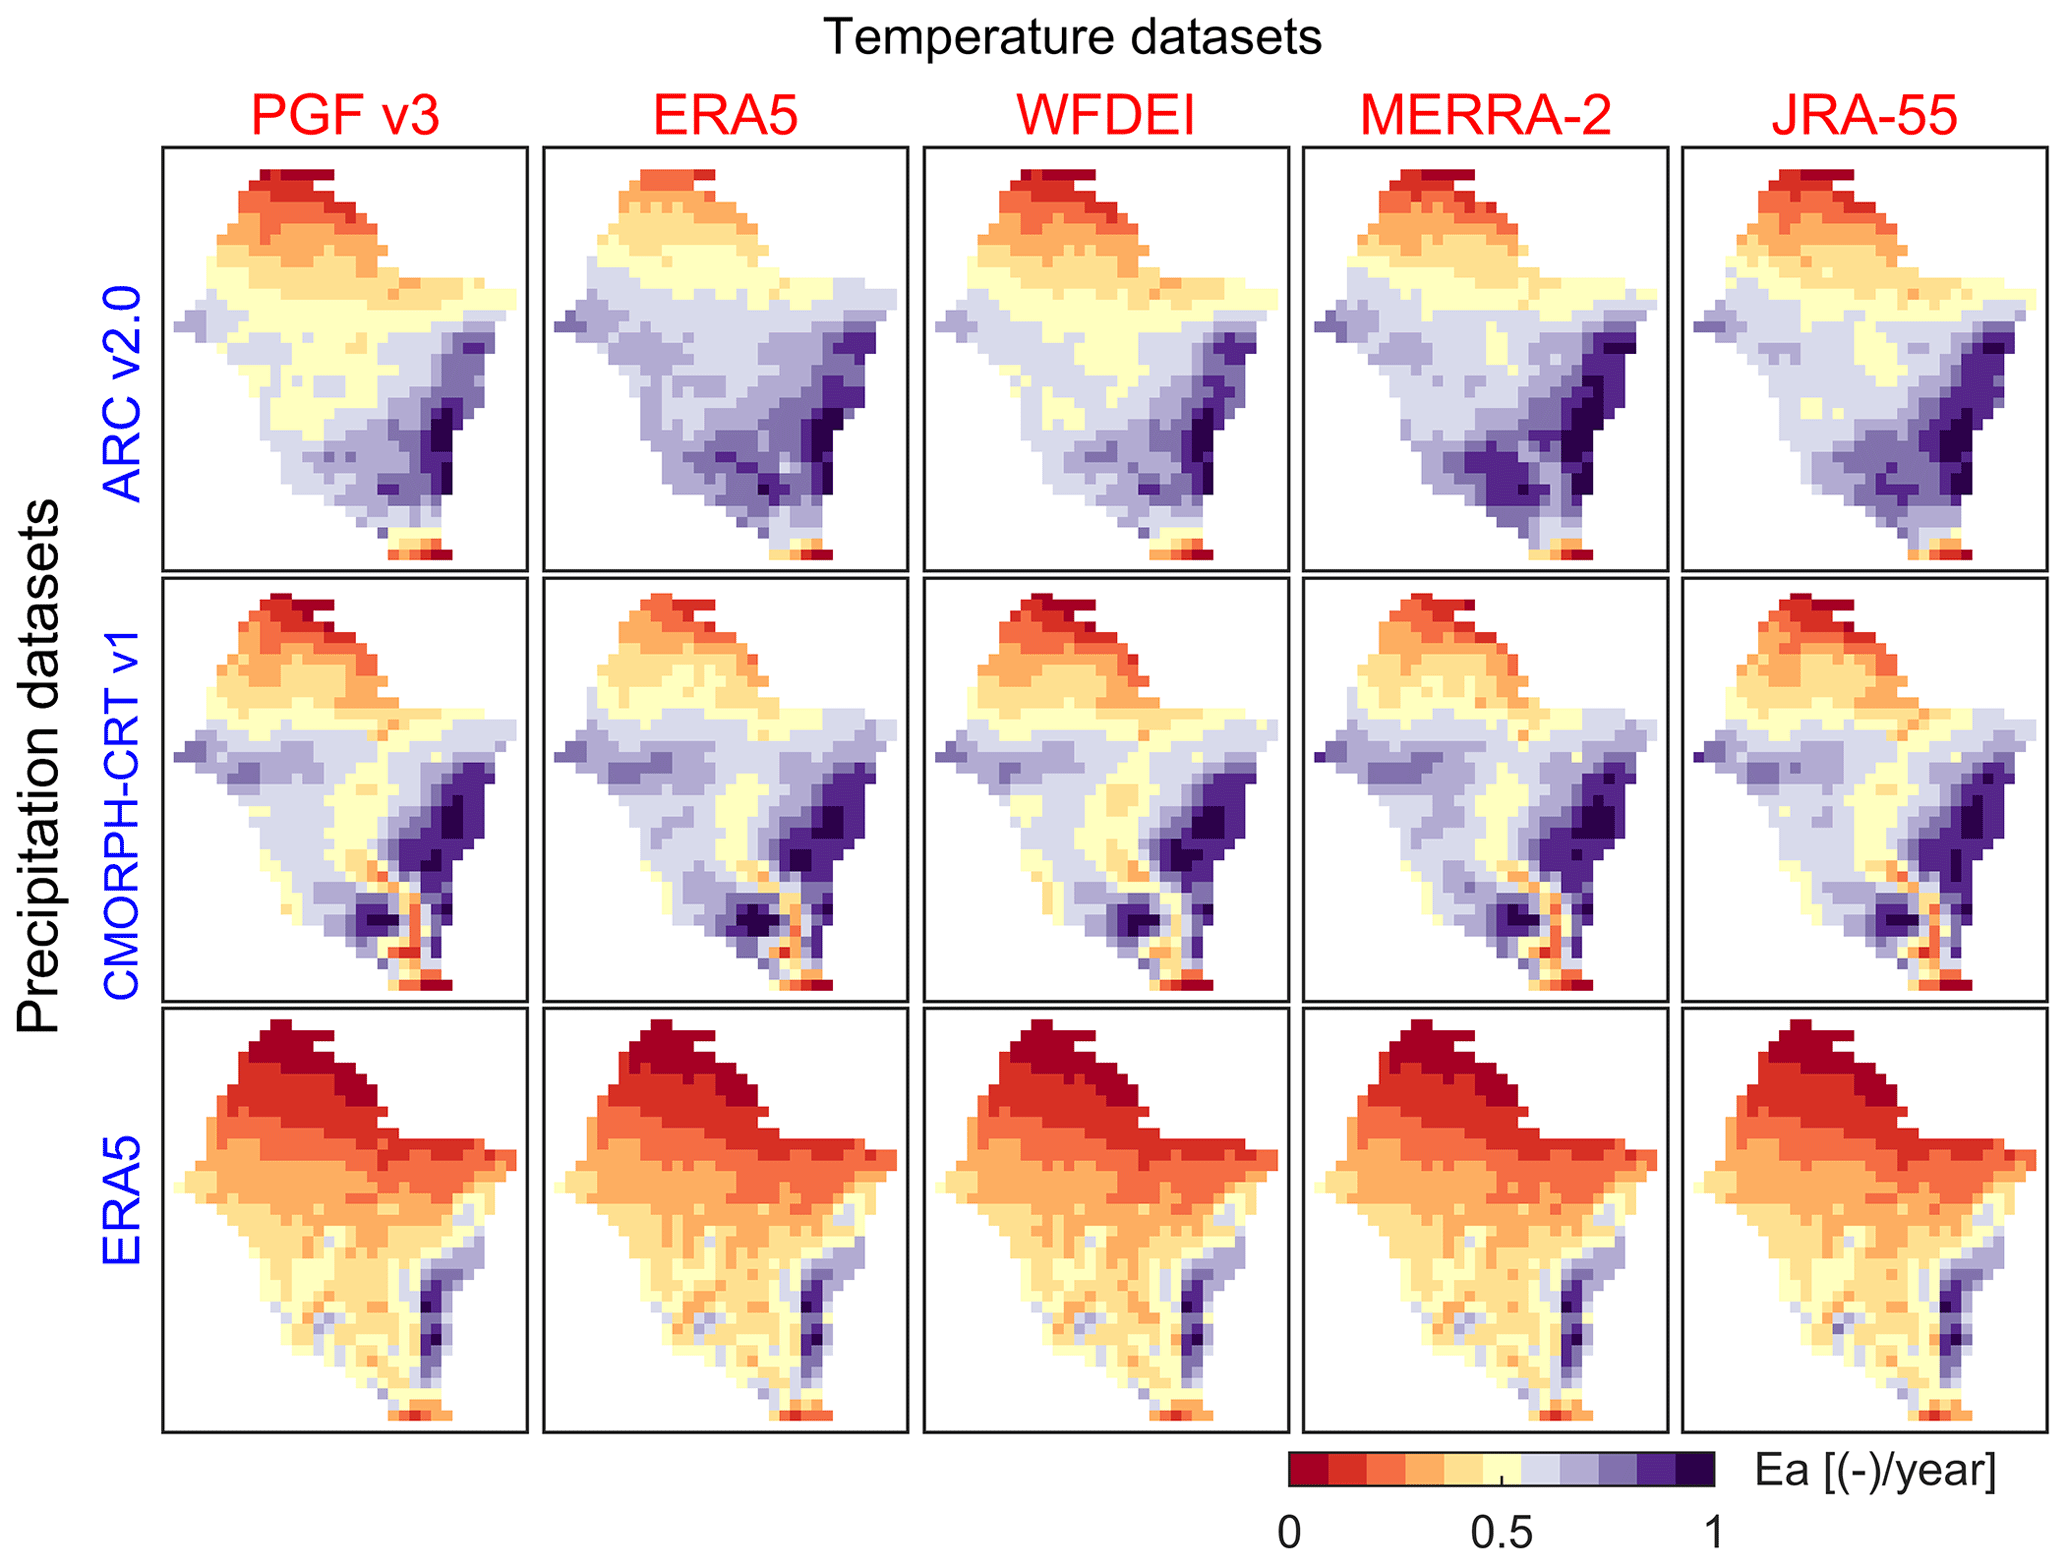
Figure 9Maps of long-term (2003–2012) average of annual actual evaporation (Ea) obtained with different forcing of rainfall (y axis, blue font) and temperature (x axis, red font) datasets. The values are normalized between 0 and 1 to emphasize spatial patterns and to use a unique colour scale.
3.4 Model performance for actual evaporation
The model performance for the temporal dynamics of monthly actual evaporation (Ea) compared to the GLEAM product is shown in Fig. 8 (see the Supplement for monthly time series, Figs. S72–S76). The average r of Ea for the entire VRB over all datasets is 0.93. Similarly to Su, the r of Ea is higher in the driest climatic zones: Sahelian (r=0.94), Sudano-Sahelian (r=0.94), Sudanian (r=0.89) and Guinean (r=0.81). However, the predictive skill of the model for the temporal dynamics of Ea is higher than its predictive skill for Ea in the wetter climatic zones. Table A1 shows the ranking of all the meteorological datasets for the model performance for Ea. The rainfall datasets show different performances across climatic zones, with the following best datasets: PERSIANN-CDR in the Sahelian zone, EWEMBI and WFDEI-GPCC in the Sudano-Sahelian zone, and ARC in the Sudanian and Guinean zones. The choice of the rainfall dataset leads to an average V2 of 4 % for the temporal dynamics of Ea, while the average V2 is 1.5 % for the choice of the temperature dataset, which aligns with the findings of Jung et al. (2019).
As for Su, the choice of input datasets has a considerable impact on the reproduction of the spatial patterns of Ea (Fig. 9). Similar maps for all the meteorological datasets are provided in the Supplement (Figs. S77–S78). It can be observed that different rainfall–temperature combinations used to force the model result in large discrepancies in the spatial pattern of Ea, especially in the southern region. The south–north gradient of increasing aridity with west–east differences is represented differently among the rainfall–temperature dataset combinations (see e.g. the difference between the first two columns of the first row in Fig. 9)
The ESP of Ea for the 102 rainfall–temperature dataset combinations in the VRB is given in Fig. 10. The average ESP of Ea in the VRB over all datasets is 0.07, which is higher than for ). The choice of the rainfall dataset for the VRB affects the ESP of Ea on average by 93 %, while the choice of the temperature dataset involves a variation 33 %. However, lower impacts of data choices are observed in the climatic zones. The choice of rainfall dataset is more critical for the ESP of Ea in the driest and wettest climatic zones, i.e. Sahelian (, V2=49 %) and Guinean (, V2=37 %) zones, than the intermediate zones, i.e. Sudano-Sahelian (, V2=36 %) and Sudanian (, V2=49 %) zones. A smaller impact on the ESP of Ea is observed for the choice of the temperature dataset: Sahelian (V2=21 %), Guinean (V2=10 %), Sudano-Sahelian (V2=17 %) and Sudanian (V2=21%) zones. Detailed results on the model performance for Ea and the ranking of the datasets for the calibration and evaluation periods are provided in the Supplement (Tables S22–S23, Figs. S61–S71).
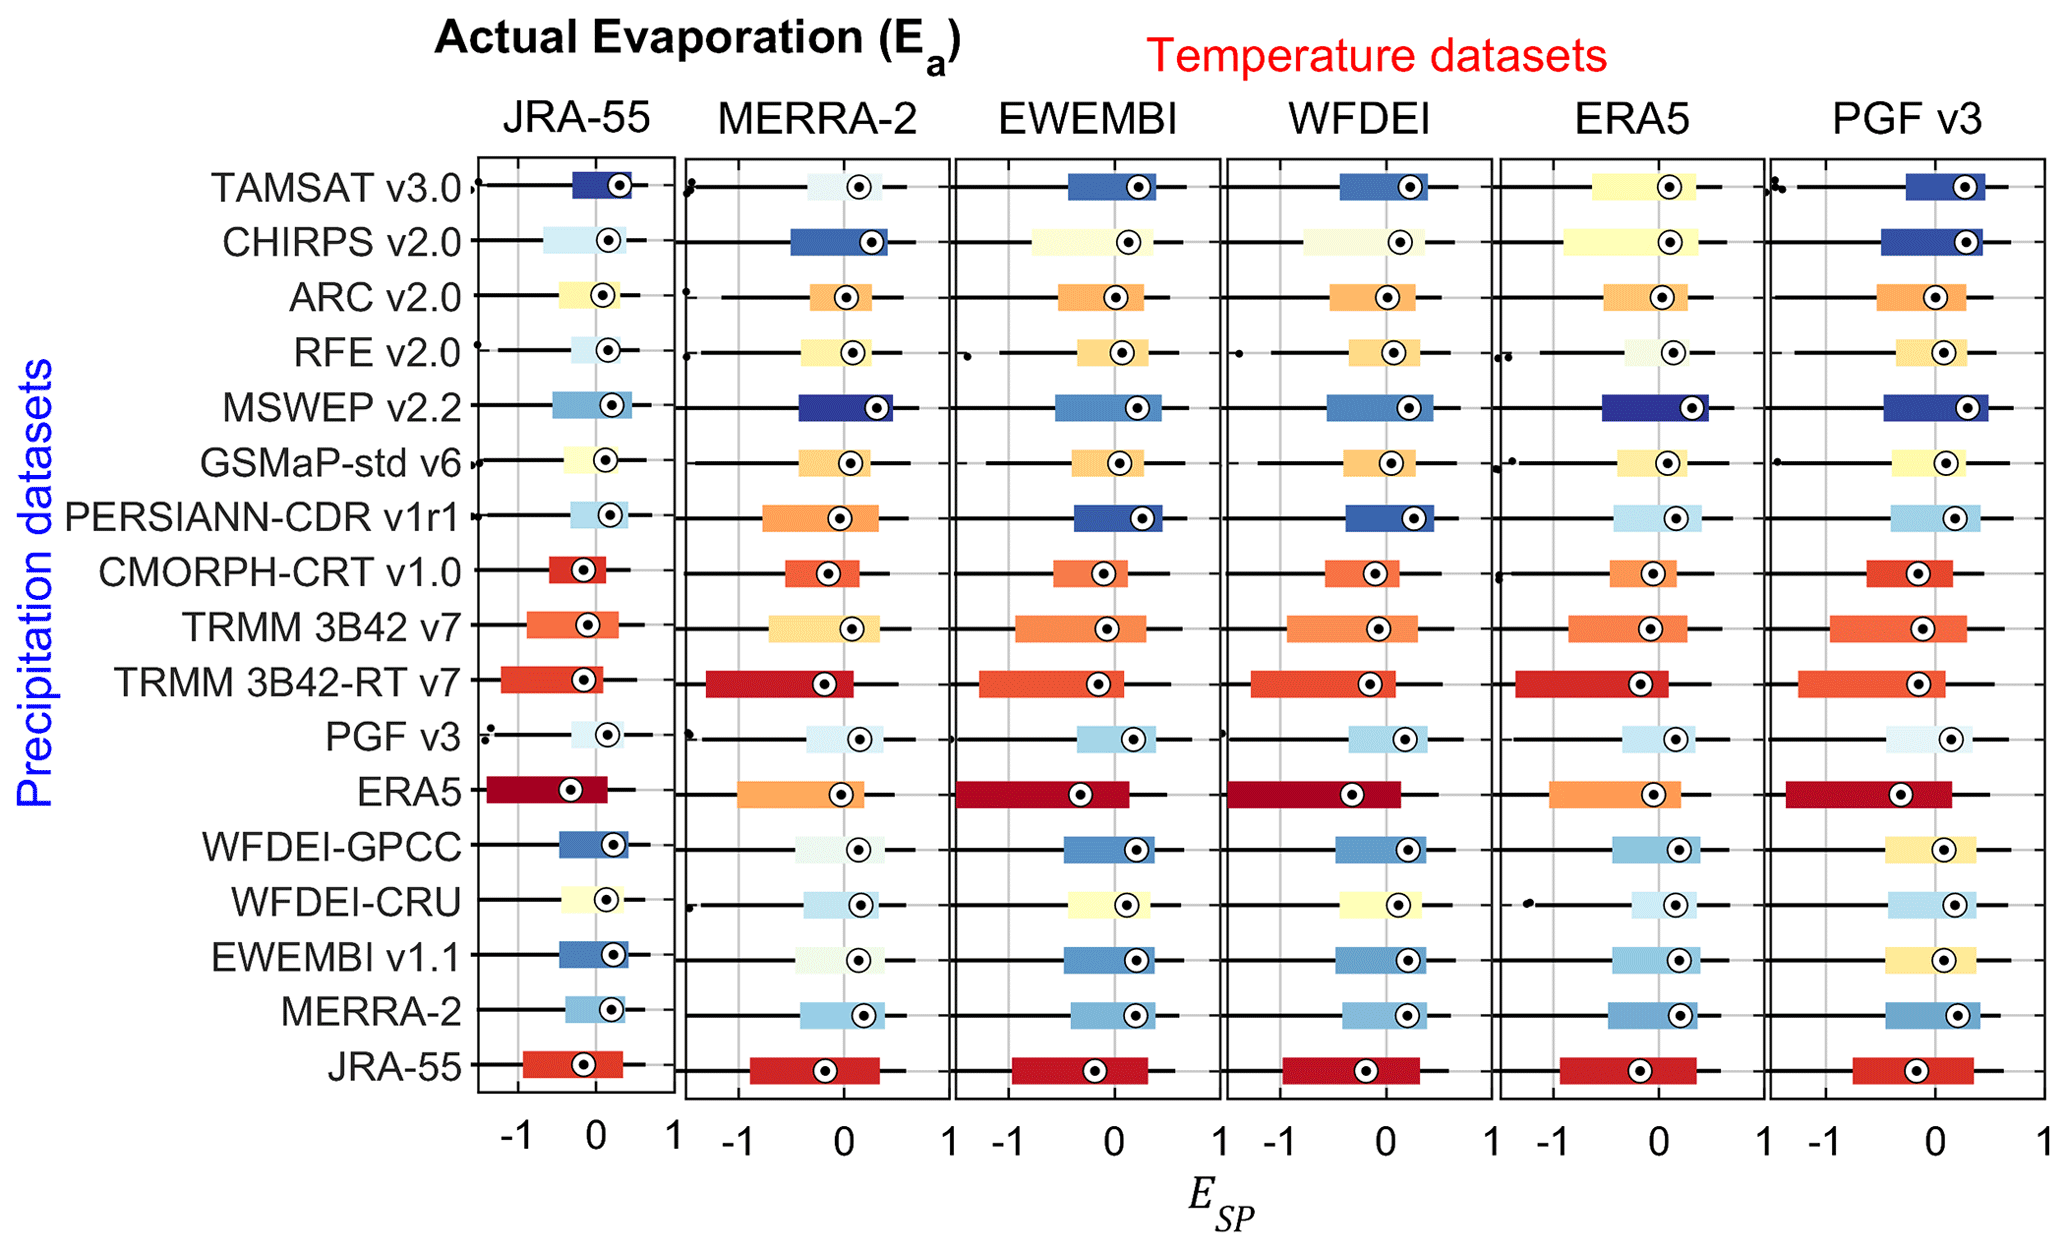
Figure 10Spatial pattern efficiency (ESP) of actual evaporation (Ea) over the entire simulation period (2003–2012) for the Volta River basin (VRB) using different combinations of precipitation and temperature datasets as input for hydrological modelling. Each boxplot has 120 values, corresponding to the number of months. The boxplots are coloured from the best (blue) to the worst performance (red) based on the median value.
This study builds upon and expands existing research studies on the evaluation of meteorological datasets in several ways:
- i.
the evaluation of the spatial patterns of multiple hydrological processes (i.e. streamflow, actual evaporation, soil moisture and terrestrial water storage) in addition to the more classically evaluated temporal dynamic,
- ii.
the evaluation of a high number of both satellite-based and reanalysis rainfall datasets considered in combination with different temperature datasets,
- iii.
the assessment of the model performance across four considerably different climatic zones from semi-arid to sub-humid.
The overall outcome of this analysis is the ranking of all the meteorological datasets based on their ability to simulate various hydrological processes across different climatic zones in the VRB (Table A1). It is worth noting that the overall ranking shows which product is best or worst at simulating a given hydrological flux or state variable. However, the ranking does not systematically tell whether a dataset is good or bad. Only the skill scores can be used to make a judgement on the adequacy of a given dataset to produce plausible model outputs.
The results show that there is no single rainfall dataset outperforming the others in reproducing all hydrological processes across different climatic zones. These findings align with previous studies in the sense that there is no rainfall dataset that is the best everywhere (Beck et al., 2017b; Sylla et al., 2013). For datasets providing both rainfall and temperature data, the combination of the two variables as model input is not necessarily the best option for obtaining the highest performance in modelling a given hydrological state or flux variable. The best rainfall–temperature combinations for the spatio-temporal representation of each hydrological flux and state variable are provided in the Supplement (Fig. S15).
The results are primarily valid for the study region in West Africa, while a wider generalization of the findings should be made with caution and after repeating similar evaluation studies at other places. Nevertheless, the key message is that there is no rainfall dataset of all hydrological processes and that the best rainfall dataset for temporal dynamics might not be the best for spatial patterns. Therefore, different rainfall datasets should be evaluated before choosing the most suitable one for hydrological modelling in large catchments.
Moreover, when comparing the results of this study to the findings of Satgé et al. (2020) based on a point-to-pixel evaluation of gridded rainfall datasets in West Africa, it is noticeable that the ground evaluation might lead to different results as compared to the hydrological evaluation adopted in the current study. The skill of a rainfall product in reproducing ground measurements well under a point-to-pixel evaluation does not necessarily correlate with its performance for hydrological modelling, particularly in large and complex hydroclimatic environments such as the VRB.
Despite the efforts to produce a comprehensive evaluation of the meteorological datasets, the results obtained might be subject to uncertainties related to the potential model structural deficiencies as well as errors in the observational datasets used for the model evaluation (McMillan et al., 2010; Renard et al., 2010; Gupta and Govindaraju, 2019). The distribution of the final model parameters (Figs. S79–S80) highlights the possibility of obtaining equally good model performances for different parameter sets (i.e. equifinality), which can be a justification for model recalibration. Moreover, it can be noticed that most of the model parameters are sensitive to the change in meteorological input datasets (Fig. S79). A detailed analysis of parameter variability as a function of input data is beyond the scope of the current study but could build the basis of future research, namely to identify data errors by analysing parameter patterns (e.g. rooting depth) and resolve potential structural deficiencies of the mHM model. However, the mHM is chosen because of its adequacy for the experiment of this study (for model selection, see Addor and Melsen, 2019). The structure of mHM allows the representation of seamless spatial patterns of hydrological processes through the MPR scheme (Samaniego et al., 2017). In addition, mHM facilitates parameter regionalization and is therefore convenient for large-scale modelling, and it harnesses the full potential of the forcing datasets as it is a fully distributed model that has performed well in previous studies including those in the VRB (e.g. Poméon et al., 2018; Dembélé et al., 2020b). Regarding the model evaluation, the comparison between the observed and modelled hydrological processes is made only with regard to their temporal dynamics and spatial patterns using bias-insensitive metrics, except for streamflow, which limits the potential impact of satellite data uncertainty.
The model is calibrated only on Q data despite the known limitations of the Q-only calibration (Demirel et al., 2018). However, calibrating the model on additional variables would result in additional model performance improvement that would not be separable from the contribution of the input datasets to the model performance. Therefore, regarding the goal of this study, the Q-only calibration was the best option to obtain the impact of various meteorological forcing datasets on the plausibility of hydrological processes. As no rainfall dataset ranks first in simulating all the hydrological processes, this study confirms that model calibration on multiple variables is a way forward in improving the overall representation of the hydrological system and increasing the predictive skill of hydrological models (Dembélé et al., 2020b; Dembélé et al., 2020a). The domain-wide calibration strategy adopted in this study generates a unique parameter set for the simulation of multiple hydrological processes across several catchments with different hydroclimatic features, which has the consequence of having local differences in model performance. However, domain-wide calibration has proved to perform similarly to domain-split calibration in previous studies (Mizukami et al., 2017), and it was ideal for this study because of the interest in simulating seamless spatial patterns, which might have not been possible with separately simulated portions of the basin. Moreover, the main goal of this study is to assess the adequacy of the meteorological datasets for large-scale hydrological modelling, knowing that these datasets usually have a coarse spatial resolution with pixels often averaged over regions with strong sub-grid variability.
Finally, the importance of regional evaluation is emphasized by this study because some region-tailored datasets (e.g. TAMSAT and ARC) which are not included in global-scale studies (e.g. Beck et al., 2017b; Mazzoleni et al., 2019; Essou et al., 2016) outperform global datasets. The decision to use a given dataset is motivated not only by the availability or the accuracy of the data but also by data accessibility (e.g. storage platforms, openness, format and pre-processing requirement). The findings of this study provide further awareness for the data users and improvement avenues for data producers in their quest of the most accurate products (e.g. Massari et al., 2020; Contractor et al., 2020; Berg et al., 2018; Brocca et al., 2014; Cucchi et al., 2020; Beck et al., 2017a).
This modelling study evaluates the ability of multiple combinations of rainfall–temperature datasets to reproduce plausible hydrological processes and patterns. The experiment is done in the Volta River basin with the fully distributed mesoscale Hydrologic Model (mHM) over a 10-year period (2003–2012), using 17 rainfall and 6 temperature datasets from satellite and reanalysis sources. The spatial and temporal representation of streamflow, terrestrial water storage, soil moisture and actual evaporation are evaluated using in situ and satellite remote-sensing observational datasets. The key findings are as follows:
-
No rainfall dataset consistently outperforms all the others in reproducing the highest model performance for all hydrological processes, and the best dataset for the temporal dynamics is not necessarily the best for the spatial patterns.
-
Rainfall datasets have a higher impact on the spatio-temporal representation of hydrological processes than temperature datasets, but the latter have a greater influence on the spatial patterns of soil moisture.
-
The large-scale performance for the meteorological datasets is not always valid for sub-regions in the same basin.
The findings of this study give a critical insight on the performance for several meteorological datasets in the challenging hydroclimatic environment of West Africa. They are expected to foster further research initiatives on improving the gridded meteorological datasets and further draw users' attention to the contrasting performances of these datasets in modelling hydrological fluxes and state variables. Efforts should be devoted to reporting on the impact of data uncertainties on process representation in hydrological modelling, especially when model outputs are used for decision-making.
Future studies can test the transferability of the model's global parameters across different input datasets, i.e. how reliable a parameter set obtained with a given input dataset is for running the same model with a different input dataset. The answer to this research question will shed light on the necessity of model recalibration when using different meteorological forcing. Furthermore, the predictive skill of the model can be improved with a parameter sensitivity analysis to determine parameters that affect the spatio-temporal representation of each hydrological flux and state variable.
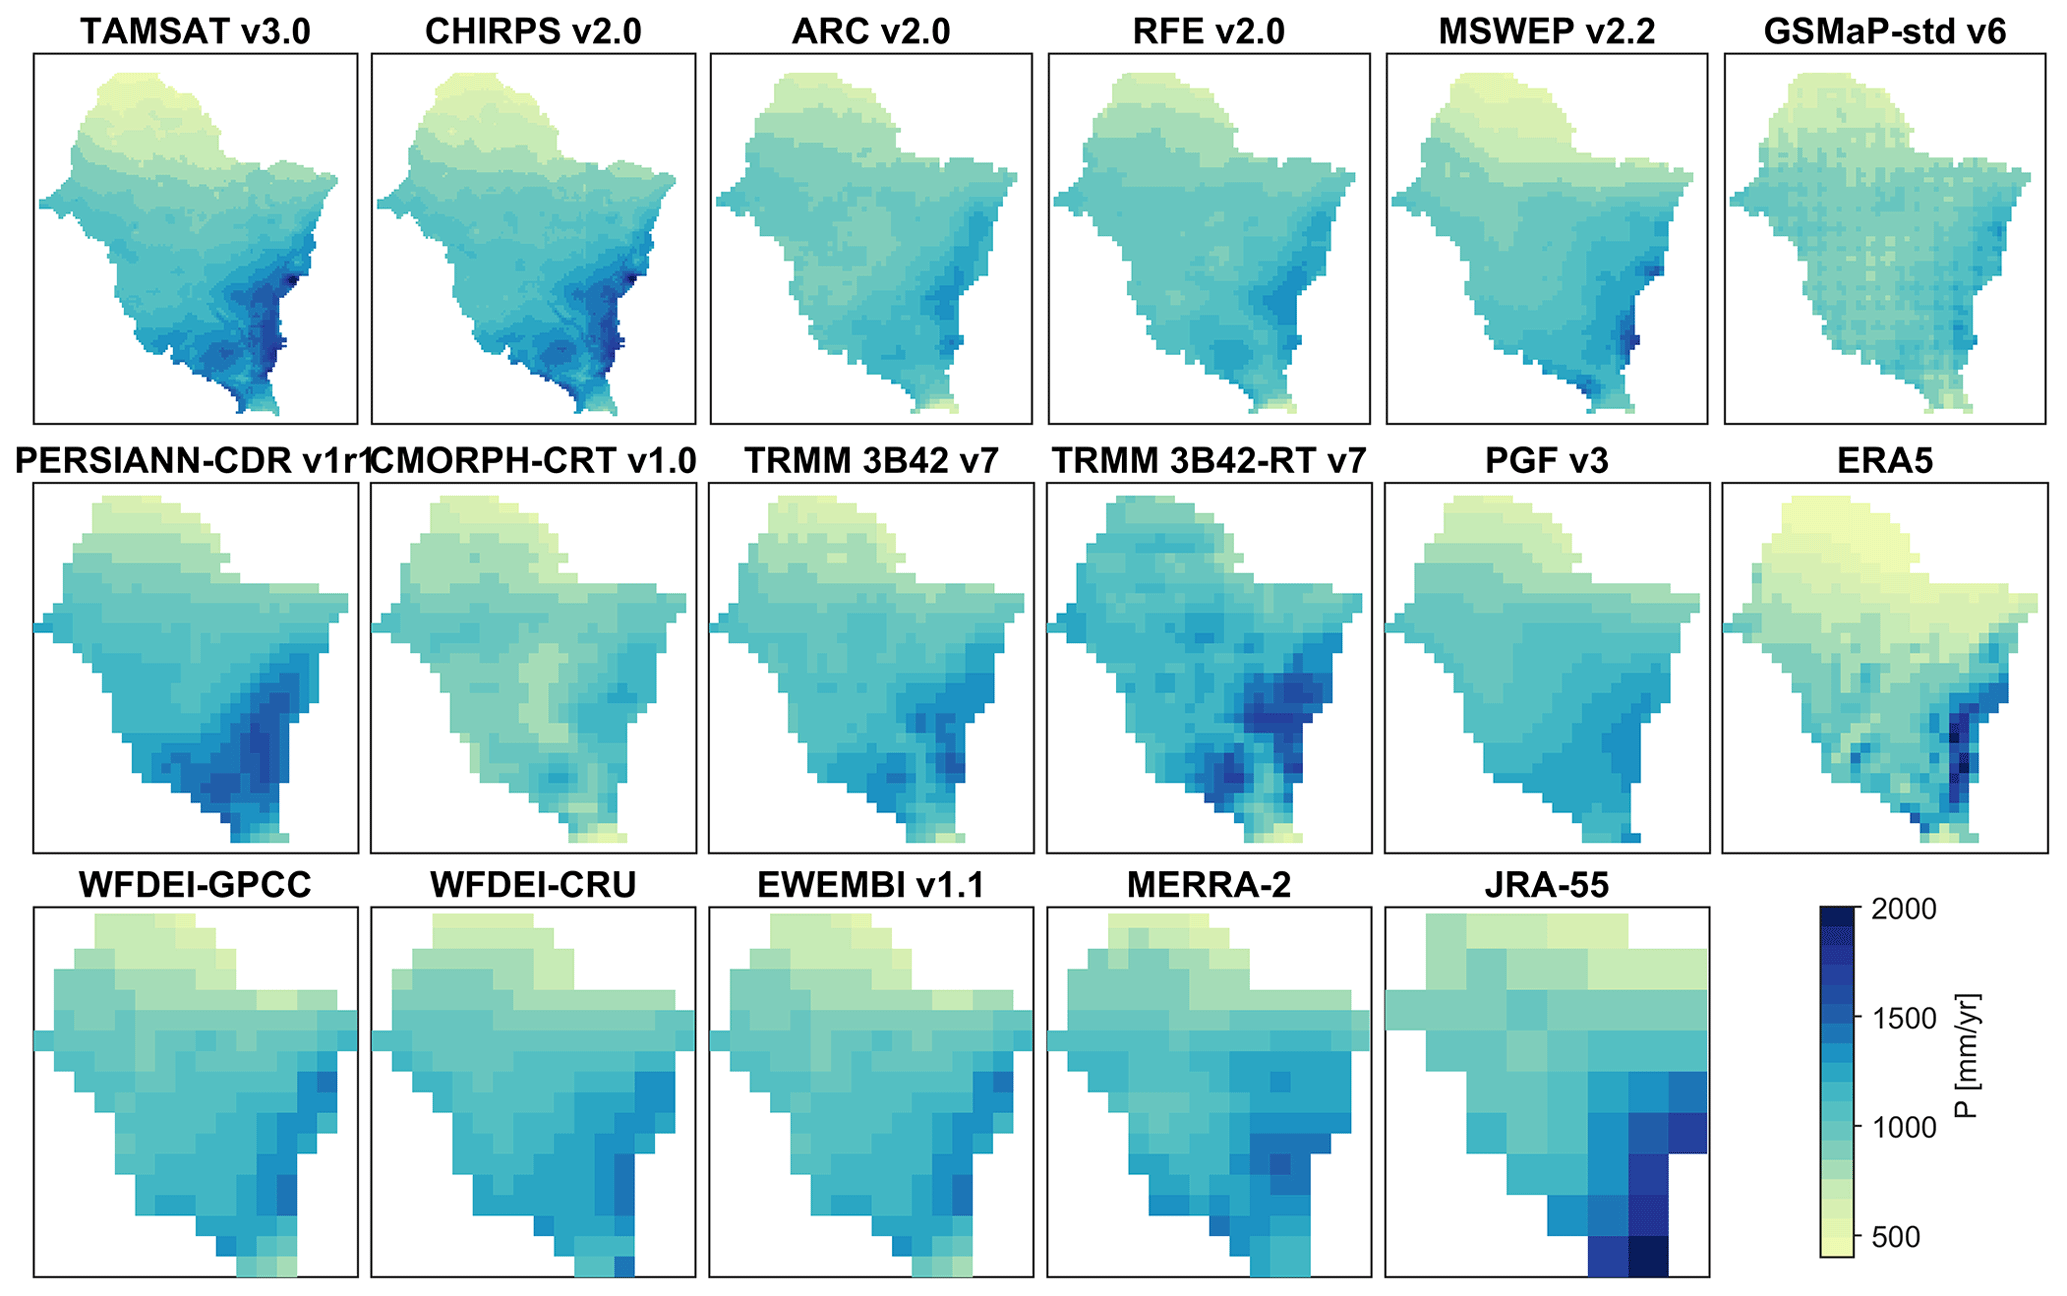
Figure A1Mean annual rainfall totals over the period 2003–2012 for 17 rainfall datasets in the Volta River basin.
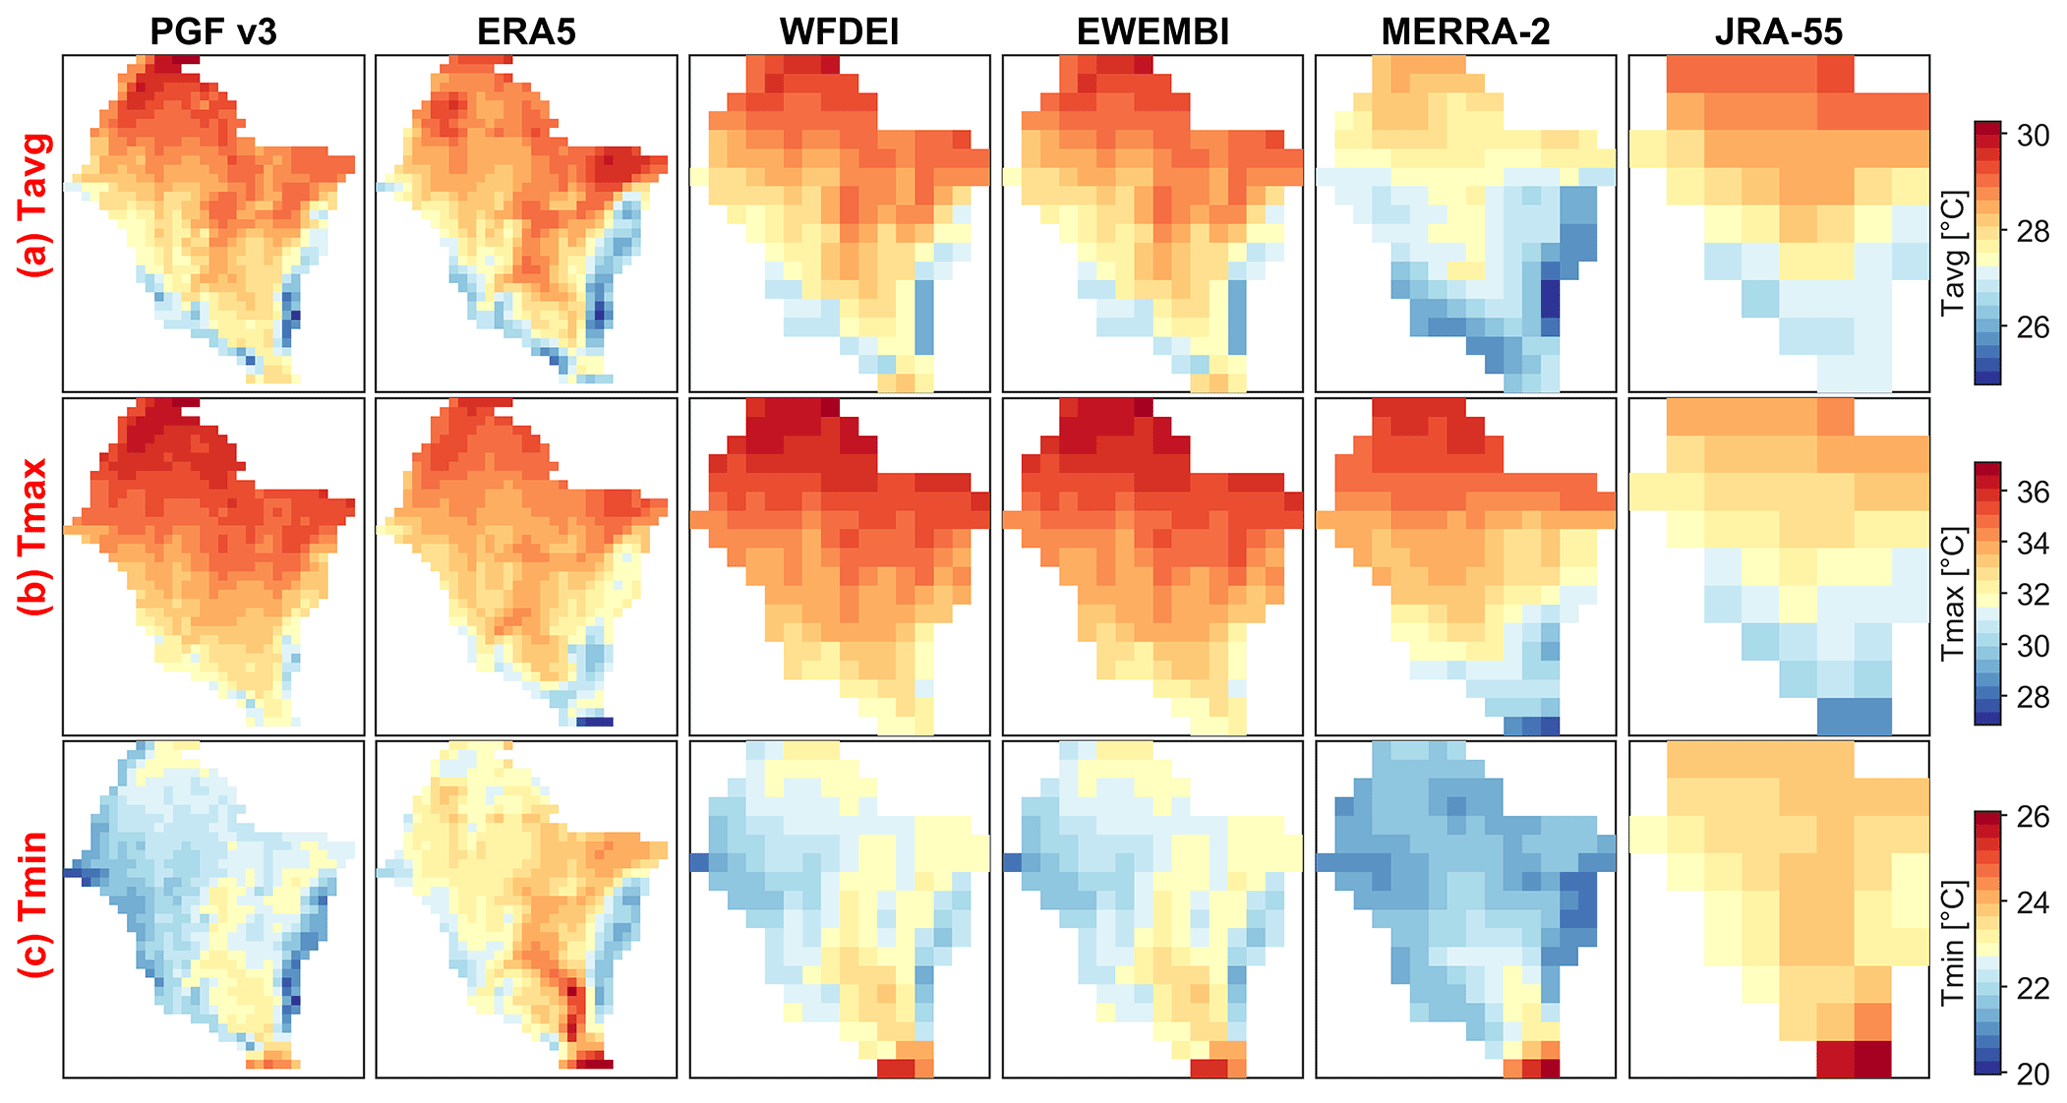
Figure A2Mean annual air temperature (average a, maximum b and minimum c) over the period 2003–2012 for six temperature datasets in the Volta River basin.
Table A1Model performance for streamflow (Q), terrestrial water storage (St), soil moisture (Su) and actual evaporation (Ea) using various rainfall–temperature dataset combinations as model inputs. Each score for a given rainfall product represents the average over individual combinations with 6 temperature datasets, while the score is the average over combinations with 17 rainfall datasets for each temperature dataset. The skill scores of the temporal dynamics are obtained with the Kling–Gupta efficiency (EKG), the Nash–Sutcliffe efficiency (ENS) and the Nash–Sutcliffe efficiency of the logarithm (ENSlog) for Q, and the Pearson's correlation coefficient (r) for St, Su and Ea. The spatial pattern efficiency (ESP) is used to assess the spatial representation of Su and Ea. The skill scores are ranked from the best (blue) to the worst (red). The results are shown for the four climatic zones in the Volta River basin (VRB) over the simulation period (2003–2012).

The meteorological and modelling datasets used in this study are freely available via the web links provided in Table 1 and Table 2. More information on satellite-based precipitation datasets can be found at http://ipwg.isac.cnr.it/ (last access: 10 December 2019) (IPWG, 2019). The modelling database is available at https://doi.org/10.5281/zenodo.3662308 (Dembélé, 2020).
The supplement related to this article is available online at: https://doi.org/10.5194/hess-24-5379-2020-supplement.
MD performed the analyses and drafted the manuscript. All authors contributed to the writing, review and editing process that led to the final manuscript.
The authors declare that they have no conflict of interest.
We thank the providers of the datasets used in this study (see Tables 1 and 2). We are grateful to the developers of mHM at the Department of Computational Hydrosystems at the Helmholtz Centre for Environmental Research (CHS/UFZ, Germany) for their open-source model. We thank the providers of the streamflow data obtained from the Volta Basin Authority (VBA), the Direction Générale des Ressources en Eau (DGRE) of Burkina Faso, the Hydrological Services Department (HSD) of Ghana and the Direction Générale de l'Eau et de l'Assainissement (DGEA) of Togo. We thank the reviewers for their useful comments.
This research has been supported by the Swiss Confederation (grant no. 2016.0533/Burkina Faso/OP) and the Swiss National Science Foundation (grant nos. SNF, P1LAP2_178071 and SNF, PP00P2_157611). Moctar Dembélé was supported by the Swiss Government Excellence Scholarship (2016.0533/Burkina Faso/OP) and the Doc.Mobility fellowship (SNF, P1LAP2_178071) of the Swiss National Science Foundation. Bettina Schaefli was supported by a research grant of the Swiss National Science Foundation (SNF, PP00P2_157611).
This paper was edited by Albrecht Weerts and reviewed by Nadav Peleg and one anonymous referee.
Acharya, S. C., Nathan, R., Wang, Q. J., Su, C.-H., and Eizenberg, N.: An evaluation of daily precipitation from a regional atmospheric reanalysis over Australia, Hydrol. Earth Syst. Sci., 23, 3387–3403, https://doi.org/10.5194/hess-23-3387-2019, 2019.
Addor, N., and Melsen, L.: Legacy, rather than adequacy, drives the selection of hydrological models, Water Resour. Res., 55, 378–390, https://doi.org/10.1029/2018WR022958, 2019.
Alazzy, A. A., Lü, H., Chen, R., Ali, A. B., Zhu, Y., and Su, J.: Evaluation of satellite precipitation products and their potential influence on hydrological modeling over the Ganzi River Basin of the Tibetan Plateau, Adv. Meteorol., 2017, 3695285, https://doi.org/10.1155/2017/3695285, 2017.
Alemohammad, S. H., McColl, K. A., Konings, A. G., Entekhabi, D., and Stoffelen, A.: Characterization of precipitation product errors across the United States using multiplicative triple collocation, Hydrol. Earth Syst. Sci., 19, 3489–3503, https://doi.org/10.5194/hess-19-3489-2015, 2015.
Allen, R. G., Pereira, L. S., Raes, D., and Smith, M.: Crop evapotranspiration-Guidelines for computing crop water requirements-FAO Irrigation and drainage paper 56, 326, available at: http://www.fao.org/docrep/X0490E/X0490E00.htm (last access: 14 November 2020), 1998.
Ashouri, H., Hsu, K.-L., Sorooshian, S., Braithwaite, D. K., Knapp, K. R., Cecil, L. D., Nelson, B. R., and Prat, O. P.: PERSIANN-CDR: Daily precipitation climate data record from multisatellite observations for hydrological and climate studies, B. Am. Meteorol. Soc., 96, 69–83, https://doi.org/10.1175/BAMS-D-13-00068.1, 2015.
Awange, J., Ferreira, V., Forootan, E., Andam-Akorful, S., Agutu, N., and He, X.: Uncertainties in remotely sensed precipitation data over Africa, Int. J. Climatol., 36, 303–323, https://doi.org/10.1002/joc.4346, 2016.
Awange, J., Hu, K., and Khaki, M.: The newly merged satellite remotely sensed, gauge and reanalysis-based Multi-Source Weighted-Ensemble Precipitation: Evaluation over Australia and Africa (1981–2016), Sci. Total Environ., 670, 448-465, https://doi.org/10.1016/j.scitotenv.2019.03.148, 2019.
Bai, P., Liu, X., Zhang, Y., and Liu, C.: Incorporating vegetation dynamics noticeably improved performance of hydrological model under vegetation greening, Sci. Total Environ., 643, 610–622, https://doi.org/10.1016/j.scitotenv.2018.06.233, 2018.
Bárdossy, A. and Das, T.: Influence of rainfall observation network on model calibration and application, Hydrol. Earth Syst. Sci., 12, 77–89, https://doi.org/10.5194/hess-12-77-2008, 2008.
Bárdossy, A. and Pegram, G.: Interpolation of precipitation under topographic influence at different time scales, Water Resour. Res., 49, 4545–4565, https://doi.org/10.1002/wrcr.20307, 2013.
Baroni, G., Schalge, B., Rakovec, O., Kumar, R., Schüler, L., Samaniego, L., Simmer, C., and Attinger, S.: A Comprehensive Distributed Hydrological Modeling Intercomparison to Support Process Representation and Data Collection Strategies, Water Resour. Res., 55, 990–1010, https://doi.org/10.1029/2018wr023941, 2019.
Barrett, E. C. and Martin, D. W.: Use of satellite data in rainfall monitoring, Academic Press, London, 1981.
Beck, H. E., van Dijk, A. I. J. M., Levizzani, V., Schellekens, J., Miralles, D. G., Martens, B., and de Roo, A.: MSWEP: 3-hourly 0.25° global gridded precipitation (1979–2015) by merging gauge, satellite, and reanalysis data, Hydrol. Earth Syst. Sci., 21, 589–615, https://doi.org/10.5194/hess-21-589-2017, 2017a.
Beck, H. E., Vergopolan, N., Pan, M., Levizzani, V., van Dijk, A. I. J. M., Weedon, G. P., Brocca, L., Pappenberger, F., Huffman, G. J., and Wood, E. F.: Global-scale evaluation of 22 precipitation datasets using gauge observations and hydrological modeling, Hydrol. Earth Syst. Sci., 21, 6201–6217, https://doi.org/10.5194/hess-21-6201-2017, 2017b.
Beck, H. E., Pan, M., Roy, T., Weedon, G. P., Pappenberger, F., van Dijk, A. I. J. M., Huffman, G. J., Adler, R. F., and Wood, E. F.: Daily evaluation of 26 precipitation datasets using Stage-IV gauge-radar data for the CONUS, Hydrol. Earth Syst. Sci., 23, 207–224, https://doi.org/10.5194/hess-23-207-2019, 2019a.
Beck, H. E., Wood, E. F., Pan, M., Fisher, C. K., Miralles, D. G., Van Dijk, A. I., McVicar, T. R., and Adler, R. F.: MSWEP V2 global 3-hourly 0.1∘ precipitation: methodology and quantitative assessment, B. Am. Meteorol. Soc., 100, 473–500, https://doi.org/10.1175/BAMS-D-17-0138.1, 2019b.
Behrangi, A., Khakbaz, B., Jaw, T. C., AghaKouchak, A., Hsu, K., and Sorooshian, S.: Hydrologic evaluation of satellite precipitation products over a mid-size basin, J. Hydrol., 397, 225–237, https://doi.org/10.1016/j.jhydrol.2010.11.043, 2011.
Berg, P., Donnelly, C., and Gustafsson, D.: Near-real-time adjusted reanalysis forcing data for hydrology, Hydrol. Earth Syst. Sci., 22, 989–1000, https://doi.org/10.5194/hess-22-989-2018, 2018.
Berthou, S., Rowell, D. P., Kendon, E. J., Roberts, M. J., Stratton, R. A., Crook, J. A., and Wilcox, C.: Improved climatological precipitation characteristics over West Africa at convection-permitting scales, Clim. Dynam., 53, 1–21, https://doi.org/10.1007/s00382-019-04759-4, 2019.
Beven, K.: Preferential flows and travel time distributions: defining adequate hypothesis tests for hydrological process models, Hydrol. Process., 24, 1537–1547, https://doi.org/10.1002/hyp.7718, 2010.
Beven, K.: Facets of uncertainty: epistemic uncertainty, non-stationarity, likelihood, hypothesis testing, and communication, Hydrolog. Sci. J., 61, 1652–1665, https://doi.org/10.1080/02626667.2015.1031761, 2016.
Beven, K.: On hypothesis testing in hydrology: Why falsification of models is still a really good idea, Wiley Interdisciplinary Reviews: Water, 5, e1278, https://doi.org/10.1002/wat2.1278, 2018.
Beven, K.: How to make advances in hydrological modelling, Hydrol. Res., 50, 1481–1494, https://doi.org/10.2166/nh.2019.134, 2019.
Bhattacharya, T., Khare, D., and Arora, M.: A case study for the assessment of the suitability of gridded reanalysis weather data for hydrological simulation in Beas river basin of North Western Himalaya, Appl. Water Sci., 9, 110, https://doi.org/10.1007/s13201-019-0993-x, 2019.
Bhuiyan, E., Abul, M., Nikolopoulos, E. I., Anagnostou, E. N., Polcher, J., Albergel, C., Dutra, E., Fink, G., Martínez-de la Torre, A., and Munier, S.: Assessment of precipitation error propagation in multi-model global water resource reanalysis, Hydrol. Earth Syst. Sci., 23, 1973–1994, https://doi.org/10.5194/hess-23-1973-2019, 2019.
Biasutti, M.: Rainfall trends in the African Sahel: Characteristics, processes, and causes, Wiley Interdiscip Rev Clim Change, 10, e591, https://doi.org/10.1002/wcc.591, 2019.
Biasutti, M., Voigt, A., Boos, W. R., Braconnot, P., Hargreaves, J. C., Harrison, S. P., Kang, S. M., Mapes, B. E., Scheff, J., and Schumacher, C.: Global energetics and local physics as drivers of past, present and future monsoons, Nat. Geosci., 11, 392, https://doi.org/10.1038/s41561-018-0137-1, 2018.
Bichet, A. and Diedhiou, A.: West African Sahel has become wetter during the last 30 years, but dry spells are shorter and more frequent, Clim. Res., 75, 155–162, https://doi.org/10.3354/cr01515, 2018.
Birhanu, D., Kim, H., and Jang, C.: Effectiveness of introducing crop coefficient and leaf area index to enhance evapotranspiration simulations in hydrologic models, Hydrol. Process., 33, 2206–2226, https://doi.org/10.1002/hyp.13464, 2019.
Bisselink, B., Zambrano-Bigiarini, M., Burek, P., and De Roo, A.: Assessing the role of uncertain precipitation estimates on the robustness of hydrological model parameters under highly variable climate conditions, J. Hydrol., 8, 112–129, https://doi.org/10.1016/j.ejrh.2016.09.003, 2016.
Bitew, M. M. and Gebremichael, M.: Evaluation of satellite rainfall products through hydrologic simulation in a fully distributed hydrologic model, Water Resour. Res., 47, W06526, https://doi.org/10.1029/2010wr009917, 2011.
Blöschl, G. and Zehe, E.: On hydrological predictability, Hydrol. Process., 19, 3923–3929, https://doi.org/10.1002/hyp.6075, 2005.
Blöschl, G., Bierkens, M. F. P., Chambel, A., Cudennec, C., Destouni, G., Fiori, A., Kirchner, J. W., McDonnell, J. J., Savenije, H. H. G., Sivapalan, M., Stumpp, C., Toth, E., Volpi, E., Carr, G., Lupton, C., Salinas, J., Széles, B., Viglione, A., Aksoy, H., Allen, S. T., Amin, A., Andréassian, V., Arheimer, B., Aryal, S. K., Baker, V., Bardsley, E., Barendrecht, M. H., Bartosova, A., Batelaan, O., Berghuijs, W. R., Beven, K., Blume, T., Bogaard, T., Borges de Amorim, P., Böttcher, M. E., Boulet, G., Breinl, K., Brilly, M., Brocca, L., Buytaert, W., Castellarin, A., Castelletti, A., Chen, X., Chen, Y., Chen, Y., Chifflard, P., Claps, P., Clark, M. P., Collins, A. L., Croke, B., Dathe, A., David, P. C., de Barros, F. P. J., de Rooij, G., Di Baldassarre, G., Driscoll, J. M., Duethmann, D., Dwivedi, R., Eris, E., Farmer, W. H., Feiccabrino, J., Ferguson, G., Ferrari, E., Ferraris, S., Fersch, B., Finger, D., Foglia, L., Fowler, K., Gartsman, B., Gascoin, S., Gaume, E., Gelfan, A., Geris, J., Gharari, S., Gleeson, T., Glendell, M., Gonzalez Bevacqua, A., González-Dugo, M. P., Grimaldi, S., Gupta, A. B., Guse, B., Han, D., Hannah, D., Harpold, A., Haun, S., Heal, K., Helfricht, K., Herrnegger, M., Hipsey, M., Hlaváčiková, H., Hohmann, C., Holko, L., Hopkinson, C., Hrachowitz, M., Illangasekare, T. H., Inam, A., Innocente, C., Istanbulluoglu, E., Jarihani, B., Kalantari, Z., Kalvans, A., Khanal, S., Khatami, S., Kiesel, J., Kirkby, M., Knoben, W., Kochanek, K., Kohnová, S., Kolechkina, A., Krause, S., Kreamer, D., Kreibich, H., Kunstmann, H., Lange, H., Liberato, M. L. R., Lindquist, E., Link, T., Liu, J., Loucks, D. P., Luce, C., Mahé, G., Makarieva, O., Malard, J., Mashtayeva, S., Maskey, S., Mas-Pla, J., Mavrova-Guirguinova, M., Mazzoleni, M., Mernild, S., Misstear, B. D., Montanari, A., Müller-Thomy, H., Nabizadeh, A., Nardi, F., Neale, C., Nesterova, N., Nurtaev, B., Odongo, V. O., Panda, S., Pande, S., Pang, Z., Papacharalampous, G., Perrin, C., Pfister, L., Pimentel, R., Polo, M. J., Post, D., Prieto Sierra, C., Ramos, M.-H., Renner, M., Reynolds, J. E., Ridolfi, E., Rigon, R., Riva, M., Robertson, D. E., Rosso, R., Roy, T., Sá, J. H. M., Salvadori, G., Sandells, M., Schaefli, B., Schumann, A., Scolobig, A., Seibert, J., Servat, E., Shafiei, M., Sharma, A., Sidibe, M., Sidle, R. C., Skaugen, T., Smith, H., Spiessl, S. M., Stein, L., Steinsland, I., Strasser, U., Su, B., Szolgay, J., Tarboton, D., Tauro, F., Thirel, G., Tian, F., Tong, R., Tussupova, K., Tyralis, H., Uijlenhoet, R., van Beek, R., van der Ent, R. J., van der Ploeg, M., Van Loon, A. F., van Meerveld, I., van Nooijen, R., van Oel, P. R., Vidal, J.-P., von Freyberg, J., Vorogushyn, S., Wachniew, P., Wade, A. J., Ward, P., Westerberg, I. K., White, C., Wood, E. F., Woods, R., Xu, Z., Yilmaz, K. K., and Zhang, Y.: Twenty-three unsolved problems in hydrology (UPH) – a community perspective, Hydrolog. Sci. J., 64, 1141–1158, https://doi.org/10.1080/02626667.2019.1620507, 2019.
Bontemps, S., Defourny, P., Bogaert, E. V., Arino, O., Kalogirou, V., and Perez, J. R.: GLOBCOVER 2009-Products description and validation report, 53, available at: http://due.esrin.esa.int/files/GLOBCOVER2009_V (last access: 24 November 2020) 2011.
Bosilovich, M. G., Chen, J., Robertson, F. R., and Adler, R. F.: Evaluation of global precipitation in reanalyses, J. Appl, Meteorol. Climatol., 47, 2279–2299, https://doi.org/10.1175/2008jamc1921.1, 2008.
Brocca, L., Moramarco, T., Melone, F., and Wagner, W.: A new method for rainfall estimation through soil moisture observations, Geophys. Res. Lett., 40, 853–858, https://doi.org/10.1002/grl.50173, 2013.
Brocca, L., Ciabatta, L., Massari, C., Moramarco, T., Hahn, S., Hasenauer, S., Kidd, R., Dorigo, W., Wagner, W., and Levizzani, V.: Soil as a natural rain gauge: Estimating global rainfall from satellite soil moisture data, J. Geophys. Res.-Atmos., 119, 5128–5141, https://doi.org/10.1002/2014JD021489, 2014.
Brocca, L., Filippucci, P., Hahn, S., Ciabatta, L., Massari, C., Camici, S., Schüller, L., Bojkov, B., and Wagner, W.: SM2RAIN–ASCAT (2007–2018): global daily satellite rainfall data from ASCAT soil moisture observations, Earth Syst. Sci. Data, 11, 1583–1601, https://doi.org/10.5194/essd-11-1583-2019, 2019.
Camici, S., Ciabatta, L., Massari, C., and Brocca, L.: How reliable are satellite precipitation estimates for driving hydrological models: A verification study over the Mediterranean area, J. Hydrol., 563, 950–961, https://doi.org/10.1016/j.jhydrol.2018.06.067, 2018.
Caroletti, G. N., Coscarelli, R., and Caloiero, T.: Validation of Satellite, Reanalysis and RCM Data of Monthly Rainfall in Calabria (Southern Italy), Remote Sensing, 11, 1625, https://doi.org/10.3390/rs11131625, 2019.
Casse, C., Gosset, M., Peugeot, C., Pedinotti, V., Boone, A., Tanimoun, B., and Decharme, B.: Potential of satellite rainfall products to predict Niger River flood events in Niamey, Atmos. Res., 163, 162–176, https://doi.org/10.1016/j.atmosres.2015.01.010, 2015.
Chen, L. and Wang, L.: Recent advance in earth observation big data for hydrology, Big Earth Data, 2, 86–107, https://doi.org/10.1080/20964471.2018.1435072, 2018.
Ciabatta, L., Brocca, L., Massari, C., Moramarco, T., Gabellani, S., Puca, S., and Wagner, W.: Rainfall-runoff modelling by using SM2RAIN-derived and state-of-the-art satellite rainfall products over Italy, Int. J. Appl. Earth Obs., 48, 163–173, https://doi.org/10.1016/j.jag.2015.10.004, 2016.
Ciabatta, L., Massari, C., Brocca, L., Gruber, A., Reimer, C., Hahn, S., Paulik, C., Dorigo, W., Kidd, R., and Wagner, W.: SM2RAIN-CCI: a new global long-term rainfall data set derived from ESA CCI soil moisture, Earth Syst. Sci. Data, 10, 267–280, https://doi.org/10.5194/essd-10-267-2018, 2018.
Clark, M. P., Rupp, D. E., Woods, R. A., Tromp-van Meerveld, H., Peters, N., and Freer, J.: Consistency between hydrological models and field observations: linking processes at the hillslope scale to hydrological responses at the watershed scale, Hydrol. Process., 23, 311–319, https://doi.org/10.1002/hyp.7154, 2009.
Clark, M. P., Bierkens, M. F. P., Samaniego, L., Woods, R. A., Uijlenhoet, R., Bennett, K. E., Pauwels, V. R. N., Cai, X., Wood, A. W., and Peters-Lidard, C. D.: The evolution of process-based hydrologic models: historical challenges and the collective quest for physical realism, Hydrol. Earth Syst. Sci., 21, 3427–3440, https://doi.org/10.5194/hess-21-3427-2017, 2017.
Contractor, S., Donat, M. G., Alexander, L. V., Ziese, M., Meyer-Christoffer, A., Schneider, U., Rustemeier, E., Becker, A., Durre, I., and Vose, R. S.: Rainfall Estimates on a Gridded Network (REGEN) – a global land-based gridded dataset of daily precipitation from 1950 to 2016, Hydrol. Earth Syst. Sci., 24, 919–943, https://doi.org/10.5194/hess-24-919-2020, 2020.
Cook, K. H. and Vizy, E. K.: Contemporary climate change of the African monsoon systems, Current Climate Change Reports, 5, 145–159, https://doi.org/10.1007/s40641-019-00130-1, 2019.
Cucchi, M., Weedon, G. P., Amici, A., Bellouin, N., Lange, S., Müller Schmied, H., Hersbach, H., and Buontempo, C.: WFDE5: bias-adjusted ERA5 reanalysis data for impact studies, Earth Syst. Sci. Data, 12, 2097–2120, https://doi.org/10.5194/essd-12-2097-2020, 2020.
Cui, X., Guo, X., Wang, Y., Wang, X., Zhu, W., Shi, J., Lin, C., and Gao, X.: Application of remote sensing to water environmental processes under a changing climate, J. Hydrol., 574, 892–902, https://doi.org/10.1016/j.jhydrol.2019.04.078, 2019.
Cunge, J. A.: On The Subject Of A Flood Propagation Computation Method (Musklngum Method), J. Hydraul. Res., 7, 205–230, https://doi.org/10.1080/00221686909500264, 1969.
Danielson, J. J. and Gesch, D. B.: Global multi-resolution terrain elevation data 2010 (GMTED2010), US Geological Survey 2331-1258, 34, https://doi.org/10.3133/ofr20111073, 2011.
De Condappa, D. and Lemoalle, J.: Water atlas of the Volta Basin-Atlas de l'eau dans le basin de la Volta, 93, available at: https://hal.ird.fr/ird-00505116/document (last access: 14 November 2020), 2009.
Dembélé, M.: Database (1∕5) for manuscript “Suitability of 17 rainfall and temperature gridded datasets for large-scale hydrological modelling in West Africa” [Data set], Zenodo, https://doi.org/10.5281/zenodo.3662308, 2020.
Dembélé, M. and Zwart, S. J.: Evaluation and comparison of satellite-based rainfall products in Burkina Faso, West Africa, Int. J. Remote Sens., 37, 3995–4014, https://doi.org/10.1080/01431161.2016.1207258, 2016.
Dembélé, M., Oriani, F., Tumbulto, J., Mariéthoz, G., and Schaefli, B.: Gap-filling of daily streamflow time series using Direct Sampling in various hydroclimatic settings, J. Hydrol., 569, 573–586, https://doi.org/10.1016/j.jhydrol.2018.11.076, 2019.
Dembélé, M., Ceperley, N., Zwart, S. J., Mariéthoz, G., and Schaefli, B.: Potential of Satellite and Reanalysis Evaporation Datasets for Hydrological Modelling under Various Model Calibration Strategies, Adv. Water Resour., 143, 103667, https://doi.org/10.1016/j.advwatres.2020.103667, 2020a.
Dembélé, M., Hrachowitz, M., Savenije, H. H., Mariéthoz, G., and Schaefli, B.: Improving the predictive skill of a distributed hydrological model by calibration on spatial patterns with multiple satellite datasets, Water Resour. Res., 56, e2019WR026085, https://doi.org/10.1029/2019WR026085, 2020b.
Demirel, M. C., Mai, J., Mendiguren, G., Koch, J., Samaniego, L., and Stisen, S.: Combining satellite data and appropriate objective functions for improved spatial pattern performance of a distributed hydrologic model, Hydrol. Earth Syst. Sci., 22, 1299–1315, https://doi.org/10.5194/hess-22-1299-2018, 2018.
Dezfuli, A.: Climate of western and central equatorial Africa, in: Oxford Research Encyclopedia of Climate Science, https://doi.org/10.1093/acrefore/9780190228620.013.511 2017.
Di Baldassarre, G., Montanari, A., Lins, H., Koutsoyiannis, D., Brandimarte, L., and Blöschl, G.: Flood fatalities in Africa: from diagnosis to mitigation, Geophys. Res. Lett., 37, L22402, https://doi.org/10.1029/2010GL045467, 2010.
Dinku, T.: Challenges with availability and quality of climate data in Africa, in: Extreme Hydrology and Climate Variability, Elsevier, 71–80, https://doi.org/10.1016/B978-0-12-815998-9.00007-5, 2019.
Dorigo, W., Wagner, W., Albergel, C., Albrecht, F., Balsamo, G., Brocca, L., Chung, D., Ertl, M., Forkel, M., Gruber, A., Haas, E., Hamer, P. D., Hirschi, M., Ikonen, J., de Jeu, R., Kidd, R., Lahoz, W., Liu, Y. Y., Miralles, D., Mistelbauer, T., Nicolai-Shaw, N., Parinussa, R., Pratola, C., Reimer, C., van der Schalie, R., Seneviratne, S. I., Smolander, T., and Lecomte, P.: ESA CCI Soil Moisture for improved Earth system understanding: State-of-the art and future directions, Remote Sens. Environ., 203, 185–215, https://doi.org/10.1016/j.rse.2017.07.001, 2017.
Duan, Z., Tuo, Y., Liu, J., Gao, H., Song, X., Zhang, Z., Yang, L., and Mekonnen, D. F.: Hydrological evaluation of open-access precipitation and air temperature datasets using SWAT in a poorly gauged basin in Ethiopia, J. Hydrol., 569, 612–626, https://doi.org/10.1016/j.jhydrol.2018.12.026, 2019.
Duethmann, D., Zimmer, J., Gafurov, A., Güntner, A., Kriegel, D., Merz, B., and Vorogushyn, S.: Evaluation of areal precipitation estimates based on downscaled reanalysis and station data by hydrological modelling, Hydrol. Earth Syst. Sci., 17, 2415–2434, https://doi.org/10.5194/hess-17-2415-2013, 2013.
Essou, G. R., Sabarly, F., Lucas-Picher, P., Brissette, F., and Poulin, A.: Can precipitation and temperature from meteorological reanalyses be used for hydrological modeling?, J. Hydrometeorol., 17, 1929–1950, https://doi.org/10.1175/JHM-D-15-0138.1, 2016.
Falck, A. S., Maggioni, V., Tomasella, J., Vila, D. A., and Diniz, F. L.: Propagation of satellite precipitation uncertainties through a distributed hydrologic model: A case study in the Tocantins–Araguaia basin in Brazil, J. Hydrol., 527, 943–957, https://doi.org/10.1016/j.jhydrol.2015.05.042, 2015.
Fallah, A., O, S., and Orth, R.: Climate-dependent propagation of precipitation uncertainty into the water cycle, Hydrol. Earth Syst. Sci., 24, 3725–3735, https://doi.org/10.5194/hess-24-3725-2020, 2020.
FAO/GIEWS – Food and Agriculture Organization/Global Information and Early Warning System: Sahel weather and crop situation 1998, 8 pp., available at: http://www.fao.org/docrep/004/x0059e/x0059 (last access: 14 November 2020), 1998.
Fatichi, S., Vivoni, E. R., Ogden, F. L., Ivanov, V. Y., Mirus, B., Gochis, D., Downer, C. W., Camporese, M., Davison, J. H., Ebel, B., Jones, N., Kim, J., Mascaro, G., Niswonger, R., Restrepo, P., Rigon, R., Shen, C., Sulis, M., and Tarboton, D.: An overview of current applications, challenges, and future trends in distributed process-based models in hydrology, J. Hydrol., 537, 45–60, https://doi.org/10.1016/j.jhydrol.2016.03.026, 2016.
Feddes, R. A., Kowalik, P., Kolinskamalinka, K., and Zaradny, H.: Simulation of Field Water-Uptake by Plants Using a Soil-Water Dependent Root Extraction Function, J. Hydrol., 31, 13–26, https://doi.org/10.1016/0022-1694(76)90017-2, 1976.
Fekete, B. M., Vörösmarty, C. J., Roads, J. O., and Willmott, C. J.: Uncertainties in precipitation and their impacts on runoff estimates, J. Climate, 17, 294–304, https://doi.org/10.1175/1520-0442(2004)017<0294:Uipati>2.0.Co;2, 2004.
Funk, C., Peterson, P., Landsfeld, M., Pedreros, D., Verdin, J., Shukla, S., Husak, G., Rowland, J., Harrison, L., and Hoell, A.: The climate hazards infrared precipitation with stations – a new environmental record for monitoring extremes, Scientific Data, 2, 150066, https://doi.org/10.1038/sdata.2015.66, 2015.
Gebremichael, M.: Framework for satellite rainfall product evaluation, Geophys. Monogr. Ser, 191, 265–275, https://doi.org/10.1029/2010gm000974, 2010.
Gelaro, R., McCarty, W., Suárez, M. J., Todling, R., Molod, A., Takacs, L., Randles, C. A., Darmenov, A., Bosilovich, M. G., and Reichle, R.: The modern-era retrospective analysis for research and applications, version 2 (MERRA-2), J. Climate, 30, 5419–5454, https://doi.org/10.1175/JCLI-D-16-0758.1, 2017.
Golian, S., Javadian, M., and Behrangi, A.: On the use of satellite, gauge, and reanalysis precipitation products for drought studies, Environ. Res. Lett., 14, 075005, https://doi.org/10.1088/1748-9326/ab2203, 2019.
Gosset, M., Viarre, J., Quantin, G., and Alcoba, M.: Evaluation of several rainfall products used for hydrological applications over West Africa using two high-resolution gauge networks, Q. J. Roy. Meteor. Soc., 139, 923–940, https://doi.org/10.1002/qj.2130, 2013.
Gruber, A., Dorigo, W. A., Crow, W., and Wagner, W.: Triple Collocation-Based Merging of Satellite Soil Moisture Retrievals, IEEE T. Geosci. Remote, 55, 6780–6792, https://doi.org/10.1109/Tgrs.2017.2734070, 2017.
Gründemann, G. J., Werner, M., and Veldkamp, T. I. E.: The potential of global reanalysis datasets in identifying flood events in Southern Africa, Hydrol. Earth Syst. Sci., 22, 4667–4683, https://doi.org/10.5194/hess-22-4667-2018, 2018.
Gupta, A. and Govindaraju, R.: Propagation of structural uncertainty in watershed hydrologic models, J. Hydrol., 575, 66–81, https://doi.org/10.1016/j.jhydrol.2019.05.026, 2019.
Hargreaves, G. H. and Samani, Z. A.: Reference crop evapotranspiration from temperature, Appl. Eng. Agric., 1, 96–99, https://doi.org/10.13031/2013.26773, 1985.
Harrison, L., Funk, C., and Peterson, P.: Identifying changing precipitation extremes in Sub-Saharan Africa with gauge and satellite products, Environ. Res. Lett., 14, 085007, https://doi.org/10.1088/1748-9326/ab2cae, 2019.
Hartmann, J., and Moosdorf, N.: The new global lithological map database GLiM: A representation of rock properties at the Earth surface, Geochem. Geophy. Geosy., 13, Q12004, https://doi.org/10.1029/2012gc004370, 2012.
Hengl, T., Mendes de Jesus, J., Heuvelink, G. B., Ruiperez Gonzalez, M., Kilibarda, M., Blagotic, A., Shangguan, W., Wright, M. N., Geng, X., Bauer-Marschallinger, B., Guevara, M. A., Vargas, R., MacMillan, R. A., Batjes, N. H., Leenaars, J. G., Ribeiro, E., Wheeler, I., Mantel, S., and Kempen, B.: SoilGrids250m: Global gridded soil information based on machine learning, PLoS One, 12, e0169748, https://doi.org/10.1371/journal.pone.0169748, 2017.
Herman, A., Kumar, V. B., Arkin, P. A., and Kousky, J. V.: Objectively determined 10-day African rainfall estimates created for famine early warning systems, In.t J. Remote Sens., 18, 2147–2159, https://doi.org/10.1080/014311697217800, 1997.
Hersbach, H., de Rosnay, P., Bell, B., Schepers, D., Simmons, A., Soci, C., Abdalla, S., Alonso-Balmaseda, M., Balsamo, G., Bechtold, P., Berrisford, P., Bidlot, J.-R., de Boisséson, E., Bonavita, M., Browne, P., Buizza, R., Dahlgren, P., Dee, D., Dragani, R., Diamantakis, M., Flemming, J., Forbes, R., Geer, A. J., Haiden, T., Hólm, E., Haimberger, L., Hogan, R., Horányi, A., Janiskova, M., Laloyaux, P., Lopez, P., Muñoz-Sabater, J., Peubey, C., Radu, R., Richardson, D., Thépaut, J.-N., Vitart, F., Yang, X., Zsótér, E., and Zuo, H.: Operational global reanalysis: progress, future directions and synergies with NWP, ERA Report Series 27, ECMWF, Reading, UK, European Centre for Medium Range Weather Forecasts, https://doi.org/10.21957/tkic6g3wm, 2018.
Hersbach, H., Bell, B., Berrisford, P., Hirahara, S., Horányi, A., Muñoz-Sabater, J., Nicolas, J., Peubey, C., Radu, R., and Schepers, D.: The ERA5 global reanalysis, Q. J. Roy. Meteor. Soc., 146, 1999–2049, https://doi.org/10.1002/qj.3803, 2020.
Hrachowitz, M., Savenije, H. H. G., Blöschl, G., McDonnell, J. J., Sivapalan, M., Pomeroy, J. W., Arheimer, B., Blume, T., Clark, M. P., Ehret, U., Fenicia, F., Freer, J. E., Gelfan, A., Gupta, H. V., Hughes, D. A., Hut, R. W., Montanari, A., Pande, S., Tetzlaff, D., Troch, P. A., Uhlenbrook, S., Wagener, T., Winsemius, H. C., Woods, R. A., Zehe, E., and Cudennec, C.: A decade of Predictions in Ungauged Basins (PUB) – a review, Hydrolog. Sci. J., 58, 1198–1255, https://doi.org/10.1080/02626667.2013.803183, 2013.
Hrachowitz, M. and Clark, M. P.: HESS Opinions: The complementary merits of competing modelling philosophies in hydrology, Hydrol. Earth Syst. Sci., 21, 3953–3973, https://doi.org/10.5194/hess-21-3953-2017, 2017.
Huffman, G. J., Bolvin, D. T., Nelkin, E. J., Wolff, D. B., Adler, R. F., Gu, G., Hong, Y., Bowman, K. P., and Stocker, E. F.: The TRMM multisatellite precipitation analysis (TMPA): Quasi-global, multiyear, combined-sensor precipitation estimates at fine scales, J. Hydrometeorol., 8, 38–55, https://doi.org/10.1175/JHM560.1, 2007.
IPWG – International Precipitation Working Group: Home page, available at: http://ipwg.isac.cnr.it/, last access: 10 December 2019.
Jiang, D. and Wang, K.: The Role of Satellite-Based Remote Sensing in Improving Simulated Streamflow: A Review, Water, 11, 1615, https://doi.org/10.3390/w11081615, 2019.
Jiao, Y., Lei, H. M., Yang, D. W., Huang, M. Y., Liu, D. F., and Yuan, X.: Impact of vegetation dynamics on hydrological processes in a semi-arid basin by using a land surface-hydrology coupled model, J. Hydrol., 551, 116–131, https://doi.org/10.1016/j.jhydrol.2017.05.060, 2017.
Joyce, R. J., Janowiak, J. E., Arkin, P. A., and Xie, P.: CMORPH: A method that produces global precipitation estimates from passive microwave and infrared data at high spatial and temporal resolution, J. Hydrometeorol., 5, 487–503, https://doi.org/10.1175/1525-7541(2004)005<0487:CAMTPG>2.0.CO;2, 2004.
Jung, H. C., Getirana, A., Arsenault, K. R., Holmes, T. R., and McNally, A.: Uncertainties in Evapotranspiration Estimates over West Africa, Remote Sensing, 11, 892, https://doi.org/10.3390/rs11080892, 2019.
Kidd, C. and Huffman, G.: Global precipitation measurement, Meteorol. Appl., 18, 334–353, https://doi.org/10.1002/met.284, 2011.
Kidd, C. and Levizzani, V.: Status of satellite precipitation retrievals, Hydrol. Earth Syst. Sci., 15, 1109–1116, https://doi.org/10.5194/hess-15-1109-2011, 2011.
Kidd, C., Becker, A., Huffman, G. J., Muller, C. L., Joe, P., Skofronick-Jackson, G., and Kirschbaum, D. B.: So, how much of the Earth's surface is covered by rain gauges?, B. Am. Meteorol. Soc., 98, 69–78, https://doi.org/10.1175/BAMS-D-14-00283.1, 2017.
Kirchner, J. W.: Getting the right answers for the right reasons: Linking measurements, analyses, and models to advance the science of hydrology, Water Resour. Res., 42, W03S04, https://doi.org/10.1029/2005wr004362, 2006.
Kirchner, J. W. and Allen, S. T.: Seasonal partitioning of precipitation between streamflow and evapotranspiration, inferred from end-member splitting analysis, Hydrol. Earth Syst. Sci., 24, 17–39, https://doi.org/10.5194/hess-24-17-2020, 2020.
Kling, H., Fuchs, M., and Paulin, M.: Runoff conditions in the upper Danube basin under an ensemble of climate change scenarios, J. Hydrol., 424, 264–277, https://doi.org/10.1016/j.jhydrol.2012.01.011, 2012.
Knoben, W. J. M., Freer, J. E., and Woods, R. A.: Technical note: Inherent benchmark or not? Comparing Nash–Sutcliffe and Kling–Gupta efficiency scores, Hydrol. Earth Syst. Sci., 23, 4323–4331, https://doi.org/10.5194/hess-23-4323-2019, 2019.
Kobayashi, S., Ota, Y., Harada, Y., Ebita, A., Moriya, M., Onoda, H., Onogi, K., Kamahori, H., Kobayashi, C., and Endo, H.: The JRA-55 reanalysis: General specifications and basic characteristics, J. Meteorol. Soc. Jpn., 93, 5–48, https://doi.org/10.2151/jmsj.2015-001, 2015.
Koch, J., Demirel, M. C., and Stisen, S.: The SPAtial EFficiency metric (SPAEF): multiple-component evaluation of spatial patterns for optimization of hydrological models, Geosci. Model Dev., 11, 1873–1886, https://doi.org/10.5194/gmd-11-1873-2018, 2018.
Kubota, T., Aonashi, K., Ushio, T., Shige, S., Takayabu, Y. N., Kachi, M., Arai, Y., Tashima, T., Masaki, T., and Kawamoto, N.: Global Satellite Mapping of Precipitation (GSMaP) products in the GPM era, in: Satellite precipitation measurement, Springer, 355–373, https://doi.org/10.1007/978-3-030-24568-9_20, 2020.
Kuczera, G., Renard, B., Thyer, M., and Kavetski, D.: There are no hydrological monsters, just models and observations with large uncertainties!, Hydrolog. Sci. J., 55, 980–991, https://doi.org/10.1080/02626667.2010.504677, 2010.
Kumar, R., Samaniego, L., and Attinger, S.: Implications of distributed hydrologic model parameterization on water fluxes at multiple scales and locations, Water Resour. Res., 49, 360–379, https://doi.org/10.1029/2012wr012195, 2013.
Kvålseth, T. O.: Coefficient of variation: the second-order alternative, J. Appl. Stat., 44, 402–415, https://doi.org/10.1080/02664763.2016.1174195, 2017.
Laiti, L., Mallucci, S., Piccolroaz, S., Bellin, A., Zardi, D., Fiori, A., Nikulin, G., and Majone, B.: Testing the Hydrological Coherence of High-Resolution Gridded Precipitation and Temperature Data Sets, Water Resour. Res., 54, 1999–2016, https://doi.org/10.1002/2017WR021633, 2018.
Landerer, F. W. and Swenson, S. C.: Accuracy of scaled GRACE terrestrial water storage estimates, Water Resour. Res., 48, W04531, https://doi.org/10.1029/2011wr011453, 2012.
Lange, S.: EartH2Observe, WFDEI and ERA-Interim data Merged and Bias-corrected for ISIMIP (EWEMBI), edited by: Services, G. D., 2016.
Lauri, H., Räsänen, T., and Kummu, M.: Using reanalysis and remotely sensed temperature and precipitation data for hydrological modeling in monsoon climate: Mekong River case study, J. Hydrometeorol., 15, 1532–1545, https://doi.org/10.1175/Jhm-D-13-084.1, 2014.
Le Coz, C. and van de Giesen, N.: Comparison of rainfall products over sub-Sahara Africa, J. Hydrometeorol., https://doi.org/10.1175/JHM-D-18-0256.1, 2019.
Ledesma, J. L. and Futter, M. N.: Gridded climate data products are an alternative to instrumental measurements as inputs to rainfall–runoff models, Hydrol. Process., 31, 3283–3293, https://doi.org/10.1002/hyp.11269, 2017.
Levizzani, V., Kidd, C., Kirschbaum, D. B., Kummerow, C. D., Nakamura, K., and Turk, F. J.: Satellite Precipitation Measurement, Springer, https://doi.org/10.1007/978-3-030-24568-9, 2020.
Li, L., Ngongondo, C. S., Xu, C.-Y., and Gong, L.: Comparison of the global TRMM and WFD precipitation datasets in driving a large-scale hydrological model in southern Africa, Hydrol. Res., 44, 770–788, https://doi.org/10.2166/nh.2012.175, 2012.
Li, X.-H., Zhang, Q., and Xu, C.-Y.: Suitability of the TRMM satellite rainfalls in driving a distributed hydrological model for water balance computations in Xinjiang catchment, Poyang lake basin, J. Hydrol., 426, 28–38, https://doi.org/10.1016/j.jhydrol.2012.01.013, 2012.
Liu, X., Yang, T., Hsu, K., Liu, C., and Sorooshian, S.: Evaluating the streamflow simulation capability of PERSIANN-CDR daily rainfall products in two river basins on the Tibetan Plateau, Hydrol. Earth Syst. Sci., 21, 169–181, https://doi.org/10.5194/hess-21-169-2017, 2017.
Lorenz, C. and Kunstmann, H.: The hydrological cycle in three state-of-the-art reanalyses: Intercomparison and performance analysis, J. Hydrometeorol., 13, 1397–1420, https://doi.org/10.1175/Jhm-D-11-088.1, 2012.
Ma, Q., Xiong, L., Liu, D., Xu, C.-Y., and Guo, S.: Evaluating the Temporal Dynamics of Uncertainty Contribution from Satellite Precipitation Input in Rainfall-Runoff Modeling Using the Variance Decomposition Method, Remote Sensing, 10, 1876, https://doi.org/10.3390/rs10121876, 2018.
Maggioni, V. and Massari, C.: On the performance of satellite precipitation products in riverine flood modeling: A review, J. Hydrol., 558, 214–224, https://doi.org/10.1016/j.jhydrol.2018.01.039, 2018.
Maggioni, V., Meyers, P. C., and Robinson, M. D.: A review of merged high-resolution satellite precipitation product accuracy during the Tropical Rainfall Measuring Mission (TRMM) era, J. Hydrometeorol., 17, 1101–1117, https://doi.org/10.1175/Jhm-D-15-0190.1, 2016.
Maidment, R., Black, E., Greatrex, H., and Young, M.: TAMSAT, in: Satellite Precipitation Measurement, Springer, 393–407, https://doi.org/10.1007/978-3-030-24568-9_22, 2020.
Maidment, R. I., Grimes, D., Allan, R. P., Tarnavsky, E., Stringer, M., Hewison, T., Roebeling, R., and Black, E.: The 30 year TAMSAT African rainfall climatology and time series (TARCAT) data set, J. Geophys. Res.-Atmos., 119, 10619–610644, https://doi.org/10.1002/2014jd021927, 2014.
Maidment, R. I., Allan, R. P., and Black, E.: Recent observed and simulated changes in precipitation over Africa, Geophys. Res. Lett., 42, 8155–8164, https://doi.org/10.1002/2015gl065765, 2015.
Maidment, R. I., Grimes, D., Black, E., Tarnavsky, E., Young, M., Greatrex, H., Allan, R. P., Stein, T., Nkonde, E., and Senkunda, S.: A new, long-term daily satellite-based rainfall dataset for operational monitoring in Africa, Scientific Data, 4, 170063, https://doi.org/10.1038/sdata.2017.63, 2017.
Marra, F., Nikolopoulos, E. I., Anagnostou, E. N., Bardossy, A., and Morin, E.: Precipitation Frequency Analysis from Remotely Sensed Datasets: A Focused Review, J. Hydrol., 574, 699–705, https://doi.org/10.1016/j.jhydrol.2019.04.081, 2019.
Martens, B., Miralles, D. G., Lievens, H., van der Schalie, R., de Jeu, R. A. M., Fernández-Prieto, D., Beck, H. E., Dorigo, W. A., and Verhoest, N. E. C.: GLEAM v3: satellite-based land evaporation and root-zone soil moisture, Geosci. Model Dev., 10, 1903–1925, https://doi.org/10.5194/gmd-10-1903-2017, 2017.
Marthews, T. R., Blyth, E. M., Martínez-de la Torre, A., and Veldkamp, T. I. E.: A global-scale evaluation of extreme event uncertainty in the eartH2Observe project, Hydrol. Earth Syst. Sci., 24, 75–92, https://doi.org/10.5194/hess-24-75-2020, 2020.
Massari, C., Crow, W., and Brocca, L.: An assessment of the performance of global rainfall estimates without ground-based observations, Hydrol. Earth Syst. Sci., 21, 4347–4361, https://doi.org/10.5194/hess-21-4347-2017, 2017.
Massari, C., Brocca, L., Pellarin, T., Abramowitz, G., Filippucci, P., Ciabatta, L., Maggioni, V., Kerr, Y., and Fernandez Prieto, D.: A daily 25 km short-latency rainfall product for data-scarce regions based on the integration of the Global Precipitation Measurement mission rainfall and multiple-satellite soil moisture products, Hydrol. Earth Syst. Sci., 24, 2687–2710, https://doi.org/10.5194/hess-24-2687-2020, 2020.
Mathon, V., Laurent, H., and Lebel, T.: Mesoscale convective system rainfall in the Sahel, J. Appl. Meteorol., 41, 1081–1092, https://doi.org/10.1175/1520-0450(2002)041<1081:Mcsrit>2.0.Co; 2, 2002.
Mazzoleni, M., Brandimarte, L., and Amaranto, A.: Evaluating precipitation datasets for large-scale distributed hydrological modelling, J. Hydrol., 578, 124076, https://doi.org/10.1016/j.jhydrol.2019.124076, 2019.
McCabe, M. F., Rodell, M., Alsdorf, D. E., Miralles, D. G., Uijlenhoet, R., Wagner, W., Lucieer, A., Houborg, R., Verhoest, N. E. C., Franz, T. E., Shi, J., Gao, H., and Wood, E. F.: The future of Earth observation in hydrology, Hydrol. Earth Syst. Sci., 21, 3879–3914, https://doi.org/10.5194/hess-21-3879-2017, 2017.
McColl, K. A., Vogelzang, J., Konings, A. G., Entekhabi, D., Piles, M., and Stoffelen, A.: Extended triple collocation: Estimating errors and correlation coefficients with respect to an unknown target, Geophys. Res. Lett., 41, 6229–6236, https://doi.org/10.1002/2014GL061322, 2014.
McMillan, H., Freer, J., Pappenberger, F., Krueger, T., and Clark, M.: Impacts of uncertain river flow data on rainfall-runoff model calibration and discharge predictions, Hydrol. Processs., 24, 1270–1284, https://doi.org/10.1002/hyp.7587, 2010.
McMillan, H. K., Westerberg, I. K., and Krueger, T.: Hydrological data uncertainty and its implications, Wiley Interdisciplinary Reviews: Water, 5, e1319, https://doi.org/10.1002/wat2.1319, 2018.
Miralles, D. G., Holmes, T. R. H., De Jeu, R. A. M., Gash, J. H., Meesters, A. G. C. A., and Dolman, A. J.: Global land-surface evaporation estimated from satellite-based observations, Hydrol. Earth Syst. Sci., 15, 453–469, https://doi.org/10.5194/hess-15-453-2011, 2011.
Mizukami, N., Clark, M. P., Newman, A. J., Wood, A. W., Gutmann, E. D., Nijssen, B., Rakovec, O., and Samaniego, L.: Towards seamless large-domain parameter estimation for hydrologic models, Water Resour. Res., 53, 8020–8040, https://doi.org/10.1002/2017wr020401, 2017.
Mul, M., Obuobie, E., Appoh, R., Kankam-Yeboah, K., Bekoe-Obeng, E., Amisigo, B., Logah, F. Y., Ghansah, B., and McCartney, M.: Water resources assessment of the Volta River Basin, International Water Management Institute (IWMI)9290908297, 82, https://doi.org/10.5337/2015.220, 2015.
Nash, J. E. and Sutcliffe, J. V.: River flow forecasting through conceptual models part I – A discussion of principles, Jo. Hydrol., 10, 282–290, https://doi.org/10.1016/0022-1694(70)90255-6, 1970.
Nicholson, S. E.: The West African Sahel: A review of recent studies on the rainfall regime and its interannual variability, ISRN Meteorology, 2013, 453521, https://doi.org/10.1155/2013/453521, 2013.
Nicholson, S. E., Fink, A. H., and Funk, C.: Assessing recovery and change in West Africa's rainfall regime from a 161-year record, International J. Climatol., 38, 3770–3786, https://doi.org/10.1002/joc.5530, 2018a.
Nicholson, S. E., Funk, C., and Fink, A. H.: Rainfall over the African continent from the 19th through the 21st century, Global Planet. Change, 165, 114–127, https://doi.org/10.1016/j.gloplacha.2017.12.014, 2018b.
Nijssen, B.: Effect of precipitation sampling error on simulated hydrological fluxes and states: Anticipating the Global Precipitation Measurement satellites, J. Geophys. Res., 109, D02103, https://doi.org/10.1029/2003jd003497, 2004.
Nikolopoulos, E. I., Anagnostou, E. N., Hossain, F., Gebremichael, M., and Borga, M.: Understanding the scale relationships of uncertainty propagation of satellite rainfall through a distributed hydrologic model, J. Hydrometeorol., 11, 520–532, https://doi.org/10.1175/2009JHM1169.1, 2010.
Nkiaka, E., Nawaz, N., and Lovett, J. C.: Evaluating global reanalysis datasets as input for hydrological modelling in the Sudano-Sahel region, Hydrology, 4, 13, https://doi.org/10.3390/hydrology4010013, 2017.
Novella, N. S. and Thiaw, W. M.: African rainfall climatology version 2 for famine early warning systems, J. Appl. Meteorol. Clim., 52, 588–606, https://doi.org/10.1175/JAMC-D-11-0238.1, 2013.
Ocio, D., Beskeen, T., and Smart, K.: Fully distributed hydrological modelling for catchment-wide hydrological data verification, Hydrol. Res., 50, 1520–1534, https://doi.org/10.2166/nh.2019.006, 2019.
Pan, M., Li, H., and Wood, E.: Assessing the skill of satellite-based precipitation estimates in hydrologic applications, Water Resour. Res., 46, W09535, https://doi.org/10.1029/2009WR008290, 2010.
Paniconi, C. and Putti, M.: Physically based modeling in catchment hydrology at 50: Survey and outlook, Water Resour. Res., 51, 7090–7129, https://doi.org/10.1002/2015wr017780, 2015.
Parker, D. J. and Diop-Kane, M.: Meteorology of tropical West Africa: The forecasters' handbook, John Wiley & Sons, 468 pp., https://doi.org/10.1002/9781118391297, 2017.
Peel, M. C. and McMahon, T. A.: Historical development of rainfall-runoff modeling, Wiley Interdisciplinary Reviews: Water, e1471, https://doi.org/10.1002/wat2.1471, 2020.
Pellarin, T., Román-Cascón, C., Baron, C., Bindlish, R., Brocca, L., Camberlin, P., Fernández-Prieto, D., Kerr, Y. H., Massari, C., Panthou, G., Perrimond, B., Philippon, N., and Quantin, G.: The Precipitation Inferred from Soil Moisture (PrISM) near Real-Time Rainfall Product: Evaluation and Comparison, Remote Sensing, 12, 481, https://doi.org/10.3390/rs12030481, 2020.
Peters-Lidard, C. D., Clark, M., Samaniego, L., Verhoest, N. E. C., van Emmerik, T., Uijlenhoet, R., Achieng, K., Franz, T. E., and Woods, R.: Scaling, similarity, and the fourth paradigm for hydrology, Hydrol. Earth Syst. Sci., 21, 3701–3713, https://doi.org/10.5194/hess-21-3701-2017, 2017.
Pfeifroth, U., Trentmann, J., Fink, A. H., and Ahrens, B.: Evaluating satellite-based diurnal cycles of precipitation in the African tropics, J. Appl. Meteorol. Climatol., 55, 23–39, https://doi.org/10.1175/Jamc-D-15-0065.1, 2016.
Pfister, L. and Kirchner, J. W.: Debates—Hypothesis testing in hydrology: Theory and practice, Water Resour. Res., 53, 1792–1798, https://doi.org/10.1002/2016WR020116, 2017.
Poméon, T., Jackisch, D., and Diekkrüger, B.: Evaluating the performance of remotely sensed and reanalysed precipitation data over West Africa using HBV light, J. Hydrol., 547, 222–235, https://doi.org/10.1016/j.jhydrol.2017.01.055, 2017.
Poméon, T., Diekkrüger, B., and Kumar, R.: Computationally Efficient Multivariate Calibration and Validation of a Grid-Based Hydrologic Model in Sparsely Gauged West African River Basins, Water, 10, 1418, https://doi.org/10.3390/w10101418, 2018.
Potter, G. L., Carriere, L., Hertz, J., Bosilovich, M., Duffy, D., Lee, T., and Williams, D. N.: Enabling reanalysis research using the collaborative reanalysis technical environment (CREATE), B. Am. Meteorol. Soc., 99, 677–687, https://doi.org/10.1175/Bams-D-17-0174.1, 2018.
Qi, W., Zhang, C., Fu, G., Sweetapple, C., and Zhou, H.: Evaluation of global fine-resolution precipitation products and their uncertainty quantification in ensemble discharge simulations, Hydrol. Earth Syst. Sci., 20, 903–920, https://doi.org/10.5194/hess-20-903-2016, 2016.
Raimonet, M., Oudin, L., Thieu, V., Silvestre, M., Vautard, R., Rabouille, C., and Le Moigne, P.: Evaluation of gridded meteorological datasets for hydrological modeling, J. Hydrometeorol., 18, 3027–3041, https://doi.org/10.1175/JHM-D-17-0018.1, 2017.
Reichle, R. H., Liu, Q., Koster, R. D., Draper, C. S., Mahanama, S. P., and Partyka, G. S.: Land surface precipitation in MERRA-2, J. Climate, 30, 1643–1664, https://doi.org/10.1175/JCLI-D-16-0570.1, 2017.
Renard, B., Kavetski, D., Kuczera, G., Thyer, M., and Franks, S. W.: Understanding predictive uncertainty in hydrologic modeling: The challenge of identifying input and structural errors, Water Resour. Res., 46, W05521, https://doi.org/10.1029/2009WR008328, 2010.
Roca, R., Alexander, L. V., Potter, G., Bador, M., Jucá, R., Contractor, S., Bosilovich, M. G., and Cloché, S.: FROGS: a daily gridded precipitation database of rain gauge, satellite and reanalysis products, Earth Syst. Sci. Data, 11, 1017–1035, https://doi.org/10.5194/essd-11-1017-2019, 2019.
Roebeling, R., Wolters, E., Meirink, J., and Leijnse, H.: Triple collocation of summer precipitation retrievals from SEVIRI over Europe with gridded rain gauge and weather radar data, J. Hydrometeorol., 13, 1552–1566, https://doi.org/10.1175/JHM-D-11-089.1, 2012.
Romilly, T. G. and Gebremichael, M.: Evaluation of satellite rainfall estimates over Ethiopian river basins, Hydrol. Earth Syst. Sci., 15, 1505–1514, https://doi.org/10.5194/hess-15-1505-2011, 2011.
Roudier, P., Ducharne, A., and Feyen, L.: Climate change impacts on runoff in West Africa: a review, Hydrol. Earth Syst. Sci., 18, 2789–2801, https://doi.org/10.5194/hess-18-2789-2014, 2014.
Sakumura, C., Bettadpur, S., and Bruinsma, S.: Ensemble prediction and intercomparison analysis of GRACE time-variable gravity field models, Geophys. Res. Lett., 41, 1389–1397, https://doi.org/10.1002/2013GL058632, 2014.
Samaniego, L., Kumar, R., and Attinger, S.: Multiscale parameter regionalization of a grid-based hydrologic model at the mesoscale, Water Resour. Res., 46, W05523, https://doi.org/10.1029/2008wr007327, 2010.
Samaniego, L., Kumar, R., Thober, S., Rakovec, O., Zink, M., Wanders, N., Eisner, S., Müller Schmied, H., Sutanudjaja, E. H., Warrach-Sagi, K., and Attinger, S.: Toward seamless hydrologic predictions across spatial scales, Hydrol. Earth Syst. Sci., 21, 4323–4346, https://doi.org/10.5194/hess-21-4323-2017, 2017.
Satgé, F., Ruelland, D., Bonnet, M.-P., Molina, J., and Pillco, R.: Consistency of satellite-based precipitation products in space and over time compared with gauge observations and snow- hydrological modelling in the Lake Titicaca region, Hydrol. Earth Syst. Sci., 23, 595–619, https://doi.org/10.5194/hess-23-595-2019, 2019.
Satgé, F., Defrance, D., Sultan, B., Bonnet, M.-P., Seyler, F., Rouché, N., Pierron, F., and Paturel, J.-E.: Evaluation of 23 gridded precipitation datasets across West Africa, J. Hydrol., 581, 124412, https://doi.org/10.1016/j.jhydrol.2019.124412, 2020.
Savenije, H. H. G.: HESS Opinions “The art of hydrology”*, Hydrol. Earth Syst. Sci., 13, 157–161, https://doi.org/10.5194/hess-13-157-2009, 2009.
Schaefli, B. and Gupta, H. V.: Do Nash values have value?, Hydrol. Process., 21, 2075–2080, https://doi.org/10.1002/hyp.6825, 2007.
Schneider, T., Bischoff, T., and Haug, G. H.: Migrations and dynamics of the intertropical convergence zone, Nature, 513, 45–53, https://doi.org/10.1038/nature13636, 2014.
Schröder, M., Lockhoff, M., Fell, F., Forsythe, J., Trent, T., Bennartz, R., Borbas, E., Bosilovich, M. G., Castelli, E., Hersbach, H., Kachi, M., Kobayashi, S., Kursinski, E. R., Loyola, D., Mears, C., Preusker, R., Rossow, W. B., and Saha, S.: The GEWEX Water Vapor Assessment archive of water vapour products from satellite observations and reanalyses, Earth Syst. Sci. Data, 10, 1093–1117, https://doi.org/10.5194/essd-10-1093-2018, 2018.
Seibert, J., Vis, M. J., Lewis, E., and Meerveld, H. V.: Upper and lower benchmarks in hydrological modelling, Hydrol. Process., 32, 1120–1125, https://doi.org/10.1002/hyp.11476, 2018.
Serdeczny, O., Adams, S., Baarsch, F., Coumou, D., Robinson, A., Hare, W., Schaeffer, M., Perrette, M., and Reinhardt, J.: Climate change impacts in Sub-Saharan Africa: from physical changes to their social repercussions, Reg. Environ. Change, 17, 1585–1600, https://doi.org/10.1007/s10113-015-0910-2, 2017.
Serrat-Capdevila, A., Valdes, J. B., and Stakhiv, E. Z.: Water management applications for satellite precipitation products: Synthesis and recommendations, J. Am. Water Resour. As., 50, 509–525, https://doi.org/10.1111/jawr.12140, 2014.
Seyyedi, H., Anagnostou, E. N., Beighley, E., and McCollum, J.: Hydrologic evaluation of satellite and reanalysis precipitation datasets over a mid-latitude basin, Atmos. Res., 164, 37–48, https://doi.org/10.1016/j.atmosres.2015.03.019, 2015.
Shawul, A. A. and Chakma, S.: Suitability of global precipitation estimates for hydrologic prediction in the main watersheds of Upper Awash basin, Environ. Earth Sci., 79, 53–71, https://doi.org/10.1007/s12665-019-8801-3, 2020.
Shayeghi, A., Azizian, A., and Brocca, L.: Reliability of reanalysis and remotely sensed precipitation products for hydrological simulation over the Sefidrood River Basin, Iran, Hydrolog. Sci. J., 65, 296–310, https://doi.org/10.1080/02626667.2019.1691217, 2020.
Sheffield, J., Goteti, G., and Wood, E. F.: Development of a 50-year high-resolution global dataset of meteorological forcings for land surface modeling, J. Climate, 19, 3088–3111, https://doi.org/10.1175/JCLI3790.1, 2006.
Sheffield, J., Wood, E. F., Pan, M., Beck, H., Coccia, G., Serrat-Capdevila, A., and Verbist, K.: Satellite Remote Sensing for Water Resources Management: Potential for Supporting Sustainable Development in Data-Poor Regions, Water Resour. Res., 54, 9724–9758, https://doi.org/10.1029/2017wr022437, 2018.
Singh, V. P.: Hydrologic modeling: progress and future directions, Geosci. Lett., 5, 15, https://doi.org/10.1186/s40562-018-0113-z, 2018.
Sorooshian, S., AghaKouchak, A., Arkin, P., Eylander, J., Foufoula-Georgiou, E., Harmon, R., Hendrickx, J. M., Imam, B., Kuligowski, R., and Skahill, B.: Advanced concepts on remote sensing of precipitation at multiple scales, B. Am. Meteorol. Soc., 92, 1353–1357, https://doi.org/10.1175/2011bams3158.1, 2011.
Stephens, G. L. and Kummerow, C. D.: The remote sensing of clouds and precipitation from space: A review, J. Atmos. Sci., 64, 3742–3765, https://doi.org/10.1175/2006jas2375.1, 2007.
Stisen, S., Højberg, A. L., Troldborg, L., Refsgaard, J. C., Christensen, B. S. B., Olsen, M., and Henriksen, H. J.: On the importance of appropriate precipitation gauge catch correction for hydrological modelling at mid to high latitudes, Hydrol. Earth Syst. Sci., 16, 4157–4176, https://doi.org/10.5194/hess-16-4157-2012, 2012.
Su, F., Hong, Y., and Lettenmaier, D. P.: Evaluation of TRMM Multisatellite Precipitation Analysis (TMPA) and its utility in hydrologic prediction in the La Plata Basin, J. Hydrometeorol., 9, 622–640, https://doi.org/10.1175/2007jhm944.1, 2008.
Sun, Q., Miao, C., Duan, Q., Ashouri, H., Sorooshian, S., and Hsu, K. L.: A review of global precipitation data sets: Data sources, estimation, and intercomparisons, Rev. Geophys., 56, 79–107, https://doi.org/10.1002/2017rg000574, 2018.
Swenson, S. C.: GRACE monthly land water mass grids NETCDF release 5.0. Ver. 5.0. PO.DAAC, CA, USA, https://doi.org/10.5067/TELND-NC005, 2012.
Sylla, M., Giorgi, F., Coppola, E., and Mariotti, L.: Uncertainties in daily rainfall over Africa: assessment of gridded observation products and evaluation of a regional climate model simulation, Int. J. Climatol., 33, 1805–1817, https://doi.org/10.1002/joc.3551, 2013.
Tang, X., Zhang, J., Gao, C., Ruben, G. B., and Wang, G.: Assessing the Uncertainties of Four Precipitation Products for Swat Modeling in Mekong River Basin, Remote Sensing, 11, 304, https://doi.org/10.3390/rs11030304, 2019.
Tapiador, F., Turk, F. J., Petersen, W., Hou, A. Y., García-Ortega, E., Machado, L. A., Angelis, C. F., Salio, P., Kidd, C., and Huffman, G. J.: Global precipitation measurement: Methods, datasets and applications, Atmos. Res., 104, 70–97, https://doi.org/10.1016/j.atmosres.2011.10.021, 2012.
Tapiador, F., Navarro, A., Levizzani, V., García-Ortega, E., Huffman, G., Kidd, C., Kucera, P., Kummerow, C., Masunaga, H., and Petersen, W.: Global precipitation measurements for validating climate models, Atmos. Res., 197, 1–20, https://doi.org/10.1016/j.atmosres.2017.06.021, 2017.
Tapley, B. D., Bettadpur, S., Watkins, M., and Reigber, C.: The gravity recovery and climate experiment: Mission overview and early results, Geophys. Res. Lett., 31, L09607, https://doi.org/10.1029/2004gl019920, 2004.
Tarnavsky, E., Grimes, D., Maidment, R., Black, E., Allan, R. P., Stringer, M., Chadwick, R., and Kayitakire, F.: Extension of the TAMSAT satellite-based rainfall monitoring over Africa and from 1983 to present, J. Appl. Meteorol. Clim., 53, 2805–2822, https://doi.org/10.1175/JAMC-D-14-0016.1, 2014.
Tauro, F., Selker, J., Van De Giesen, N., Abrate, T., Uijlenhoet, R., Porfiri, M., Manfreda, S., Caylor, K., Moramarco, T., and Benveniste, J.: Measurements and Observations in the XXI century (MOXXI): innovation and multi-disciplinarity to sense the hydrological cycle, Hydrolog. Sci. J., 63, 169–196, https://doi.org/10.1080/02626667.2017.1420191, 2018.
Taylor, C. M., Belušić, D., Guichard, F., Parker, D. J., Vischel, T., Bock, O., Harris, P. P., Janicot, S., Klein, C., and Panthou, G.: Frequency of extreme Sahelian storms tripled since 1982 in satellite observations, Nature, 544, 475–478, https://doi.org/10.1038/nature22069, 2017.
Thiemig, V., Rojas, R., Zambrano-Bigiarini, M., Levizzani, V., and De Roo, A.: Validation of satellite-based precipitation products over sparsely gauged African river basins, J. Hydrometeorol., 13, 1760–1783, https://doi.org/10.1175/Jhm-D-12-032.1, 2012.
Thiemig, V., Rojas, R., Zambrano-Bigiarini, M., and De Roo, A.: Hydrological evaluation of satellite-based rainfall estimates over the Volta and Baro-Akobo Basin, J. Hydrol., 499, 324–338, https://doi.org/10.1016/j.jhydrol.2013.07.012, 2013.
Thober, S., Cuntz, M., Kelbling, M., Kumar, R., Mai, J., and Samaniego, L.: The multiscale routing model mRM v1.0: simple river routing at resolutions from 1 to 50 km, Geosci. Model Dev., 12, 2501–2521, https://doi.org/10.5194/gmd-12-2501-2019, 2019.
Thorncroft, C. D., Nguyen, H., Zhang, C., and Peyrillé, P.: Annual cycle of the West African monsoon: regional circulations and associated water vapour transport, Q. J. Roy. Meteorol. Soc., 137, 129–147, https://doi.org/10.1002/qj.728, 2011.
Tobin, K. J. and Bennett, M. E.: Satellite precipitation products and hydrologic applications, Water Int., 39, 360–380, https://doi.org/10.1080/02508060.2013.870423, 2014.
Tolson, B. A. and Shoemaker, C. A.: Dynamically dimensioned search algorithm for computationally efficient watershed model calibration, Water Resour. Res., 43, W01413, https://doi.org/10.1029/2005wr004723, 2007.
Trabucco, A. and Zomer, R.: Global Aridity Index and Potential Evapo-Transpiration (ET0) Climate Database v2. CGIAR Consortium for Spatial Information (CGIAR-CSI), CGIAR-CSI GeoPortal, available at: https://cgiarcsi.community (last access: 11 July 2019), 2018.
Tramblay, Y., Thiemig, V., Dezetter, A., and Hanich, L.: Evaluation of satellite-based rainfall products for hydrological modelling in Morocco, Hydrolog. Sci. J., 61, 2509–2519, https://doi.org/10.1080/02626667.2016.1154149, 2016.
Tucker, C. J., Pinzon, J. E., Brown, M. E., Slayback, D. A., Pak, E. W., Mahoney, R., Vermote, E. F., and El Saleous, N.: An extended AVHRR 8-km NDVI dataset compatible with MODIS and SPOT vegetation NDVI data, Int. J. Remote. Sens., 26, 4485–4498, https://doi.org/10.1080/01431160500168686, 2005.
Turner, A., Sperber, K. R., Slingo, J., Meehl, G., Mechoso, C. R., Kimoto, M., and Giannini, A.: Modelling monsoons: Understanding and predicting current and future behaviour, in: The Global Monsoon System: Research and Forecast, World Scientific, Singapore, 421–454, https://doi.org/10.1142/9789814343411_0025, 2011.
Ushio, T., Sasashige, K., Kubota, T., Shige, S., Okamoto, K. i., Aonashi, K., Inoue, T., Takahashi, N., Iguchi, T., and Kachi, M.: A Kalman filter approach to the Global Satellite Mapping of Precipitation (GSMaP) from combined passive microwave and infrared radiometric data, J. Meteorol. Soc. Jpn., 87, 137–151, https://doi.org/10.2151/jmsj.87A.137, 2009.
Ushio, T., Mega, T., and Kubota, T.: Multi-satellite Global Satellite Mapping of Precipitation (GSMaP)-Design and Products, in: 2019 URSI Asia-Pacific Radio Science Conference (AP-RASC), New Delhi, India, 1, https://doi.org/10.23919/URSIAP-RASC.2019.8738594, 2019.
Van Stan, J. T., Gutmann, E., and Friesen, J.: Precipitation Partitioning by Vegetation: A Global Synthesis, Springer Nature, Switzerland, 295 pp., https://doi.org/10.1007/978-3-030-29702-2, 2020.
Vizy, E. K. and Cook, K. H.: Mesoscale convective systems and nocturnal rainfall over the West African Sahel: role of the Inter-tropical front, Clim. Dynam., 50, 587–614, https://doi.org/10.1007/s00382-017-3628-7, 2018.
Voisin, N., Wood, A. W., and Lettenmaier, D. P.: Evaluation of precipitation products for global hydrological prediction, J. Hydrometeorol., 9, 388–407, https://doi.org/10.1175/2007jhm938.1, 2008.
Wagner, P. D., Fiener, P., Wilken, F., Kumar, S., and Schneider, K.: Comparison and evaluation of spatial interpolation schemes for daily rainfall in data scarce regions, J. Hydrol., 464, 388–400, https://doi.org/10.1016/j.jhydrol.2012.07.026, 2012.
Wagner, W., Dorigo, W., de Jeu, R., Fernandez, D., Benveniste, J., Haas, E., and Ertl, M.: Fusion of active and passive microwave observations to create an essential climate variable data record on soil moisture, ISPRS Annals of the Photogrammetry, Remote Sensing and Spatial Information Sciences (ISPRS Annals), 1–7, 315–321, 2012.
Weedon, G. P., Balsamo, G., Bellouin, N., Gomes, S., Best, M. J., and Viterbo, P.: The WFDEI meteorological forcing data set: WATCH Forcing Data methodology applied to ERA-Interim reanalysis data, Water Resour. Res., 50, 7505–7514, https://doi.org/10.1002/2014WR015638, 2014.
Westerberg, I. K., and Birkel, C.: Observational uncertainties in hypothesis testing: investigating the hydrological functioning of a tropical catchment, Hydrol. Process., 29, 4863–4879, https://doi.org/10.1002/hyp.10533, 2015.
Wilby, R. L.: A global hydrology research agenda fit for the 2030s, Hydrol. Res., 50, 1464–1480, https://doi.org/10.2166/nh.2019.100, 2019.
Wilkinson, M. D., Dumontier, M., Aalbersberg, I. J., Appleton, G., Axton, M., Baak, A., Blomberg, N., Boiten, J. W., da Silva Santos, L. B., Bourne, P. E., Bouwman, J., Brookes, A. J., Clark, T., Crosas, M., Dillo, I., Dumon, O., Edmunds, S., Evelo, C. T., Finkers, R., Gonzalez-Beltran, A., Gray, A. J., Groth, P., Goble, C., Grethe, J. S., Heringa, J., t Hoen, P. A., Hooft, R., Kuhn, T., Kok, R., Kok, J., Lusher, S. J., Martone, M. E., Mons, A., Packer, A. L., Persson, B., Rocca-Serra, P., Roos, M., van Schaik, R., Sansone, S. A., Schultes, E., Sengstag, T., Slater, T., Strawn, G., Swertz, M. A., Thompson, M., van der Lei, J., van Mulligen, E., Velterop, J., Waagmeester, A., Wittenburg, P., Wolstencroft, K., Zhao, J., and Mons, B.: The FAIR Guiding Principles for scientific data management and stewardship, Sci. Data, 3, 160018, https://doi.org/10.1038/sdata.2016.18, 2016.
Williams, T. O., Mul, M. L., Biney, C. A., and Smakhtin, V.: The Volta River Basin: Water for food, economic growth and environment, Routledge, London, UK, 302 pp., https://doi.org/10.4324/9781315707334, 2016.
Xie, P. and Arkin, P. A.: Analyses of global monthly precipitation using gauge observations, satellite estimates, and numerical model predictions, J. Climate, 9, 840–858, https://doi.org/10.1175/1520-0442(1996)009<0840:AOGMPU>2.0.CO;2, 1996.
Xie, P., Joyce, R., Wu, S., Yoo, S.-H., Yarosh, Y., Sun, F., and Lin, R.: Reprocessed, bias-corrected CMORPH global high-resolution precipitation estimates from 1998, J. Hydrometeorol., 18, 1617–1641, https://doi.org/10.1175/JHM-D-16-0168.1, 2017.
Xu, X., Li, J., and Tolson, B. A.: Progress in integrating remote sensing data and hydrologic modeling, Prog. Phys. Geogr., 38, 464–498, https://doi.org/10.1177/0309133314536583, 2014.
Zambrano-Bigiarini, M., Nauditt, A., Birkel, C., Verbist, K., and Ribbe, L.: Temporal and spatial evaluation of satellite-based rainfall estimates across the complex topographical and climatic gradients of Chile, Hydrol. Earth Syst. Sci., 21, 1295–1320, https://doi.org/10.5194/hess-21-1295-2017, 2017.
Zandler, H., Haag, I., and Samimi, C.: Evaluation needs and temporal performance differences of gridded precipitation products in peripheral mountain regions, Sci. Rep.-UK, 9, 1–15, https://doi.org/10.1038/s41598-019-51666-z, 2019.
Zhang, D., Liu, X., Bai, P., and Li, X.-H.: Suitability of satellite-based precipitation products for water balance simulations using multiple observations in a humid catchment, Remote Sensing, 11, 151, https://doi.org/10.3390/rs11020151, 2019.
Zheng, H., Yang, Z. L., Lin, P., Wei, J., Wu, W. Y., Li, L., Zhao, L., and Wang, S.: On the sensitivity of the precipitation partitioning into evapotranspiration and runoff in land surface parameterizations, Water Resour. Res., 55, 95–111, https://doi.org/10.1029/2017WR022236, 2019.
Zhu, Z. C., Bi, J., Pan, Y. Z., Ganguly, S., Anav, A., Xu, L., Samanta, A., Piao, S. L., Nemani, R. R., and Myneni, R. B.: Global Data Sets of Vegetation Leaf Area Index (LAI)3g and Fraction of Photosynthetically Active Radiation (FPAR)3g Derived from Global Inventory Modeling and Mapping Studies (GIMMS) Normalized Difference Vegetation Index (NDVI3g) for the Period 1981 to 2011, Remote Sensing, 5, 927–948, https://doi.org/10.3390/rs5020927, 2013.